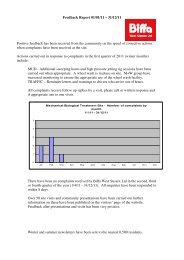
CHARTSQuarry Discharge Lagoon Discharge Averages 2005/06pHQuarry dischargepH Quarry DischargepHLagoon dischargepH Lagoon DischargeChlorideAverages for 2005/06Chloride Averages for 04.05 - 04.06NickelAverages for 2005/06Nikel Averages 04.05 - 04.06pH1614121086420Jun-05Jul-05Aug-05Sep-05Oct-05Nov-05DateDec-05Jan-06Feb-06Mar-06Apr-06May-06Upper PermittedTrigger LimitLower PermittedTrigger LimitpHpH1614121086420Jun-05Jul-05Aug-05Sep-05Oct-05Nov-05DateDec-05Jan-06Feb-06Mar-06Apr-06May-06Upper PermittedTrigger LimitLower PermittedTrigger LimitpHChloride Concentrations mg/l800.00700.00600.00500.00400.00300.00200.00100.000.00H90/1 DeepH90/3 DeepH90/1 ShallowH90/2 DeepH90/4 DeepH90/3 ShallowH90/4 ShallowH90/2 ShallowH96/5BH90/6 DeepH90/7H90/8H98/GWB/23H98/GWA/60H98/GWB/20H98/GWC/85H98/GWC/30AverageChloride mg/lTriggerLimit mg/lNikel Concentrations mg/l0.160.140.120.100.080.060.040.020.00H90/1 DeepH90/3 DeepH90/1 ShallowH90/2 DeepH90/4 DeepH90/3 ShallowH90/4 ShallowH90/2 ShallowH96/5BH90/6 DeepH90/7H90/8H98/GWB/23H98/GWA/60H98/GWB/20H98/GWC/85H98/GWC/30AverageNikel mg/lTriggerLimit mg/lBoreholeBoreholeSuspended SolidsQuarry dischargeSuspended Solids mg/l302520151050Suspended Solids Quarry DischargeJun-05Jul-05Aug-05Sep-05Oct-05Nov-05Dec-05Jan-06Feb-06ChlorideQuarry dischargeDateChloride Quarry DischargeMar-06Apr-06May-06PermittedTrigger LimitSuspendedSolids mg/lSuspended SolidsLagoon dischargeSuspended Solids mg/l100806040200Jun-05Jul-05Aug-05Suspended Solids Lagoon DischargeSep-05Oct-05Nov-05DateDec-05Jan-06ChlorideChloride Lagoon DischargeLagoon dischargeFeb-06Mar-06Apr-06May-06Trigger LimitSuspendedSolidsAmmoniacal NitrogenConcentrations mg/lAmmoniacal NitrogenAverages for 2005/064.504.003.503.002.502.001.501.000.500.00H90/1 DeepH90/3 DeepH90/1 ShallowH90/2 DeepAmmoniacal Nitrogen Average 04.05 - 04.06H90/4 DeepH90/3 ShallowH90/4 ShallowH90/2 ShallowH96/5BH90/6 DeepBoreholeH90/7H90/8H98/GWB/23H98/GWA/60H98/GWB/20H98/GWC/85H98/GWC/30AverageAmmoniacalNitrogen mg/lTriggerLimit mg/lCadmium Concentrations mg/lCadmiumAverages for 2005/060.035000.030000.025000.020000.015000.010000.005000.00000H90/1 DeepH90/3 DeepH90/1 ShallowH90/2 DeepH90/4 DeepCadmium Averages 04.05 - 04.06H90/3 ShallowH90/4 ShallowH90/2 ShallowH96/5BH90/6 DeepBoreholeH90/7H90/8H98/GWB/23H98/GWA/60H98/GWB/20H98/GWC/85H98/GWC/30AverageCadmiumLevels mg/lTriggerLimitChloride Concentrationsmg/l160140120100806040200Jun-05Jul-05Aug-05Sep-05Oct-05Oil and GreaseQuarry dischargeNov-05DateDec-05Jan-06Oil and Grease Quarry DischargeFeb-06Mar-06Apr-06May-06PermittedTrigger LimitChlorideConcentrationsmg/lChloride Concentrationsmg/l160140120100806040200Jun-05Jul-05Aug-05Sep-05Oct-05Oil and GreaseLagoon dischargeNov-05DateDec-05Jan-06Oil and Grease Lagoon DischargeFeb-06Mar-06Apr-06May-06Trigger LimitChloridePotassium Concentrations mg/lPotassiumAverages for 2005/0618.0016.0014.0012.0010.008.006.004.002.000.00Potassium Average 04.05 - 04.06H90/1 DeepH90/3 DeepH90/1 ShallowH90/2 DeepH90/4 DeepH90/3 ShallowH90/4 ShallowH90/2 ShallowH96/5BH90/6 DeepH90/7H90/8H98/GWB/23H98/GWA/60H98/GWB/20H98/GWC/85H98/GWC/30AveragePotassium Levels mg/lTriggerLimit mg/l2525BoreholeOil and Grease mg/l20151050Suspended Solids Quarry DischargeUpper PermittedTrigger LimitOil andGrease mg/lOil and Grease mg/l20151050Suspended Solids Quarry DischargeUpper PermittedTrigger LimitOil andGrease mg/lJun-05Jul-05Aug-05Sep-05Oct-05Nov-05Dec-05DateJan-06Feb-06Mar-06Apr-06May-06Jun-05Jul-05Aug-05Sep-05Oct-05Nov-05Dec-05DateJan-06Feb-06Mar-06Apr-06May-06Note: The data shown above is plotted against the hydrological risk assesment for the site.2627
METHANE UTILISATIONThe programme of extending the landfill gas collectionsystem has continued throughout the year. The system hasbeen installed to prevent potential landfill gas migrationfrom the site and also enables methane to be utilised forthe production of renewable electricity or burned byflaring. The ratio of methane utilised, flared or vented hasbeen calculated by utilising the Gas Sim Model (thepreferred Environment Agency tool).In June 2004 the percentage for overall gas capture ratefor the site had reached 71.6% of the total gasproduction from the location. The latest figures publishedin March <strong>2006</strong> show increases in gas capture of 17.3%bringing the overall gas capture for the site to 88.9%.The production of landfill gas is dependent on a numberof factors:• Area of landfill site that is active, restored and tonnageof waste deposited in each area;• Calorific value of waste deposited (i.e. its potential toproduce methane);• Tonnage of waste deposited each year.Methane production within the landfill peaks atapproximately 10 years and some areas of the siteproduce less methane than others, possibly due to alower calorific value of waste in that area, or as a resultof high inputs of non-biodegradable waste such as soils.The important point to note is that gas capture hasincreased overall and the amount of gas vented intoatmosphere has decreased significantly. Methane (CH 4 )and carbon dioxide (CO 2) are the two most significantgreenhouse gases and if left to vent to atmospherecontribute to global warming, but if captured, the landfillgas can be burned to produce valuable renewableenergy. The reduction in methane utilised in 2004/05compared to the previous year is either due to reliabilityof the gas engines, i.e. service down time, or depletingproduction in the gas field.The amount of gas flared has risen dramatically incomparison to previous years, this is a result of aproactive approach to gas control and the introduction ofcomprehensive extraction measures, in conjunction withour specialist Environmental Technology team who workclosely with site management. The table below alsohighlights the potential for additional gas generationengines operating on site. The value of producingrenewable energy from gas and reducing the UK’sreliance on electricity produced from fossil fuel is welldocumented and therefore a priority for the company.Our ability to generate and export further renewableelectricity has been boosted by a successful planningapplication to install a further three gas engines andthese are expected to come online during late <strong>2006</strong>/early 2007. Once operational the total available outputfrom the site will rise to six megawatts doubling ourcurrent export capacity.The three new engines will be dedicated to capturing gasfrom <strong>Redhill</strong> 2 and will be sited in a new gas compoundarea. This will enable a full redesign of our current flaringsystem to enable us to meet best practice. The new flareunits are able to burn gas at 1,200 degrees Celsius andhave combustion duration of 0.3 seconds, thus minimisingpotential pollutants to atmosphere.In the past we have explored alternative methods ofexporting power from site.We envisaged that this could be brought into effect byexporting power to other receptors, or indeed, by theexport of landfill gas, either by road tanker or pipeddirect to other power generation plants. We have lookedat many options in an effort to upgrade the presentsituation and with this in mind our colleagues in theEnvironmental Technology department are progressingwith the concept of creating a new connection into thenational grid, but to a receptor at the opposite end ofthe site, some 3-4 kilometres distant from the powerplant. There are many advantages to generating powerfrom landfill gas, as broadly speaking every 1,000 KWhof energy generated by landfill gas offsets 1,015 KWh ofenergy generated from fossil fuel power stations.At <strong>Redhill</strong> the site has been rewired to maximise the useof on-site generated power, within the confines andconstraints of the two Non Fossil Fuel Obligation (NFFO)contracts. By using site generated power and maximisinggenerator availability, the most efficient use of electricityoccurs, with distribution losses voided, which areestimated at 5.0%.Table OneTable TwoElectricity (MWh) 2005/06 - <strong>Redhill</strong> 1Electricity (MWh) 2005/06 - <strong>Redhill</strong> 2Exported 14941Exported 7275Imported 21Imported 53Supplied to site 0Supplied to site 7482829