Flow Charting and Block Diagramming Techniques - All about the ...
Flow Charting and Block Diagramming Techniques - All about the ...
Flow Charting and Block Diagramming Techniques - All about the ...

You also want an ePaper? Increase the reach of your titles
YUMPU automatically turns print PDFs into web optimized ePapers that Google loves.
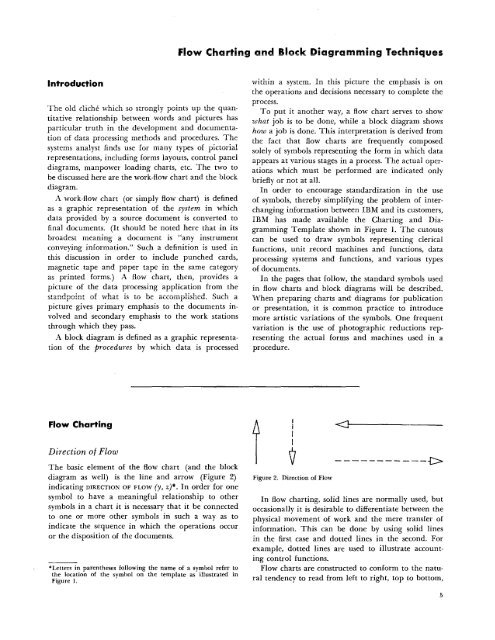
<strong>Flow</strong> <strong>Charting</strong> <strong>and</strong> <strong>Block</strong> Diagra mmin g <strong>Techniques</strong>IntroductionThe old cliche which so strongly points up <strong>the</strong> quantitativerelationship between words <strong>and</strong> pictures hasparticular truth in <strong>the</strong> development <strong>and</strong> documentationof data processing methods <strong>and</strong> procedures. Thesystems analyst finds use for many types of pictorialrepresentations, including forms layouts, control paneldiagrams, manpower loading charts, etc. The two tobe discussed here are <strong>the</strong> work-flow chart <strong>and</strong> <strong>the</strong> blockdiagram.A work-flow chart (or simply flow chart) is definedas a graphic representation of <strong>the</strong> system in whichdata provided by a source document is converted tofinal documents. (It should be noted here that in itsbroadest meaning a document is "any instrumentconveying information," Such a definition is used inthis discussion in order to include punched cards,magnetic tape <strong>and</strong> paper tape in <strong>the</strong> same categoryas printed forms.) A flow chart, <strong>the</strong>n, provides apicture of <strong>the</strong> data processing application from <strong>the</strong>st<strong>and</strong>point of what is to be accomplished. Such apicture gives primary emphasis to <strong>the</strong> documents involved<strong>and</strong> secondary emphasis to <strong>the</strong> work stationsthrough which <strong>the</strong>y pass.A block diagram is defined as a graphic representationof <strong>the</strong> procedures by which data is processedwithin a system. In this picture <strong>the</strong> emphasis is on<strong>the</strong> operations <strong>and</strong> decisions necessary to complete <strong>the</strong>process.To put it ano<strong>the</strong>r way, a flow chart serves to showwhat job is to be done, while a block diagram showshow a job is done. This interpretation is derived from<strong>the</strong> fact that flow charts are frequently composedsolely of symbols representing <strong>the</strong> form in which dataappears at various stages in a process. The actual operationswhich must be performed are indicated onlybriefly or not at all.In order to encourage st<strong>and</strong>ardization in <strong>the</strong> useof symbols, <strong>the</strong>reby simplifying <strong>the</strong> problem of interchanginginformation between IBM <strong>and</strong> its customers,IBM has made available <strong>the</strong> <strong>Charting</strong> <strong>and</strong> <strong>Diagramming</strong>Template shown in Figure 1. The cutoutscan be used to draw symbols representing clericalfunctions, unit record machines <strong>and</strong> functions, dataprocessing systems <strong>and</strong> functions, <strong>and</strong> various typesof documents.In <strong>the</strong> pages that follow, <strong>the</strong> st<strong>and</strong>ard symbols usedin flow charts <strong>and</strong> block diagrams will be described.When preparing charts <strong>and</strong> diagrams for publicationor presentation, it is common practice to introducemore artistic variations of <strong>the</strong> symbols. One frequentvariation is <strong>the</strong> use of photographic reductions representing<strong>the</strong> actual forms <strong>and</strong> machines used in aprocedure.<strong>Flow</strong> <strong>Charting</strong>Direction of <strong>Flow</strong>The basic element of <strong>the</strong> flow chart (<strong>and</strong> <strong>the</strong> blockdiagram as well) is <strong>the</strong> line <strong>and</strong> arrow (Figure 2)indicating DIRECTION OF FLOW (y, z)*. In order for onesymbol to have a meaningful relationship to o<strong>the</strong>rsymbols in a chart it is necessary that it be connectedto one or more o<strong>the</strong>r symbols in such a way as toindicate <strong>the</strong> sequence in which <strong>the</strong> operations occuror <strong>the</strong> disposition of <strong>the</strong> documents.*Letters in paren<strong>the</strong>ses following <strong>the</strong> name of a symbol refer to<strong>the</strong> location of <strong>the</strong> symbol on <strong>the</strong> template as illustrated inFigure 1.A11Figure 2. Direction of <strong>Flow</strong>In flow charting, solid lines are normally used, butoccasionally it is desirable to differentiate between <strong>the</strong>physical movement of work <strong>and</strong> <strong>the</strong> mere transfer ofinformation. This can be done by using solid linesin <strong>the</strong> first case <strong>and</strong> dotted lines in <strong>the</strong> second. Forexample, dotted lines are used to illustrate accountingcontrol functions.<strong>Flow</strong> charts are constructed to conform to <strong>the</strong> naturaltendency to read from left to right, top to bottom,5