Pace plc Annual Report and Accounts 2012 - Financial Statements
Pace plc Annual Report and Accounts 2012 - Financial Statements
Pace plc Annual Report and Accounts 2012 - Financial Statements

Create successful ePaper yourself
Turn your PDF publications into a flip-book with our unique Google optimized e-Paper software.
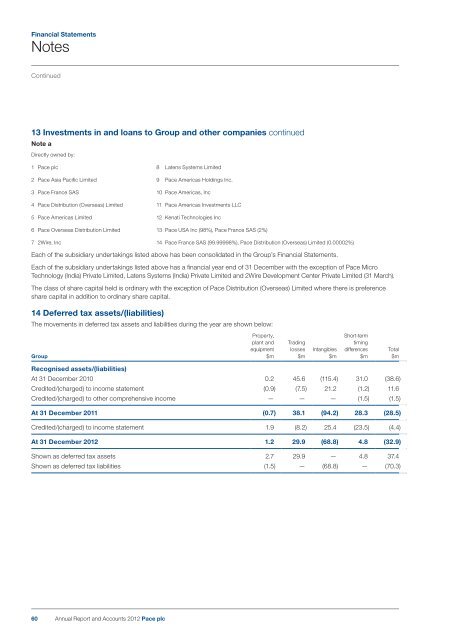
<strong>Financial</strong> <strong>Statements</strong>NotesContinued13 Investments in <strong>and</strong> loans to Group <strong>and</strong> other companies continuedNote aDirectly owned by:1 <strong>Pace</strong> <strong>plc</strong> 8 Latens Systems Limited2 <strong>Pace</strong> Asia Pacific Limited 9 <strong>Pace</strong> Americas Holdings Inc.3 <strong>Pace</strong> France SAS 10 <strong>Pace</strong> Americas, Inc4 <strong>Pace</strong> Distribution (Overseas) Limited 11 <strong>Pace</strong> Americas Investments LLC5 <strong>Pace</strong> Americas Limited 12 Kenati Technologies Inc6 <strong>Pace</strong> Overseas Distribution Limited 13 <strong>Pace</strong> USA Inc (98%), <strong>Pace</strong> France SAS (2%)7 2Wire, Inc 14 <strong>Pace</strong> France SAS (99.99998%), <strong>Pace</strong> Distribution (Overseas) Limited (0.00002%)Each of the subsidiary undertakings listed above has been consolidated in the Group’s <strong>Financial</strong> <strong>Statements</strong>.Each of the subsidiary undertakings listed above has a financial year end of 31 December with the exception of <strong>Pace</strong> MicroTechnology (India) Private Limited, Latens Systems (India) Private Limited <strong>and</strong> 2Wire Development Center Private Limited (31 March).The class of share capital held is ordinary with the exception of <strong>Pace</strong> Distribution (Overseas) Limited where there is preferenceshare capital in addition to ordinary share capital.14 Deferred tax assets/(liabilities)The movements in deferred tax assets <strong>and</strong> liabilities during the year are shown below:Property,Short-termplant <strong>and</strong> Trading timingequipment losses Intangibles differences TotalGroup $m $m $m $m $mRecognised assets/(liabilities)At 31 December 2010 0.2 45.6 (115.4) 31.0 (38.6)Credited/(charged) to income statement (0.9) (7.5) 21.2 (1.2) 11.6Credited/(charged) to other comprehensive income — — — (1.5) (1.5)At 31 December 2011 (0.7) 38.1 (94.2) 28.3 (28.5)Credited/(charged) to income statement 1.9 (8.2) 25.4 (23.5) (4.4)At 31 December <strong>2012</strong> 1.2 29.9 (68.8) 4.8 (32.9)Shown as deferred tax assets 2.7 29.9 — 4.8 37.4Shown as deferred tax liabilities (1.5) — (68.8) — (70.3)60<strong>Annual</strong> <strong>Report</strong> <strong>and</strong> <strong>Accounts</strong> <strong>2012</strong> <strong>Pace</strong> <strong>plc</strong>