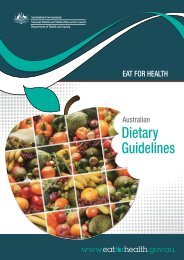
Draft Australian Dietary Guidelines (PDF, 3MB) - Eat For Health
Draft Australian Dietary Guidelines (PDF, 3MB) - Eat For Health
Draft Australian Dietary Guidelines (PDF, 3MB) - Eat For Health

You also want an ePaper? Increase the reach of your titles
YUMPU automatically turns print PDFs into web optimized ePapers that Google loves.
<strong>Australian</strong> <strong>Dietary</strong> <strong>Guidelines</strong><strong>Australian</strong> <strong>Dietary</strong> <strong>Guidelines</strong>Guideline 1 <strong>Eat</strong> a wide variety of nutritious foods from these five groups every day:• plenty of vegetables, including different types and colours, andlegumes/beans• fruit• grain (cereal) foods, mostly wholegrain, such as breads, cereals, rice, pasta,noodles, polenta, couscous, oats, quinoa and barley• lean meat and poultry, fish, eggs, nuts and seeds, and legumes/beans• milk, yoghurt, cheese and/or their alternatives, mostly reduced fat (reducedfat milks are not suitable for children under the age of 2 years).And drink water.Guideline 2 Limit intake of foods and drinks containing saturated and trans fats, added salt,added sugars and alcohol.a. Limit intake of foods and drinks containing saturated and trans fats• Include small amounts of foods that contain unsaturated fats• Low-fat diets are not suitable for infants.b. Limit intake of foods and drinks containing added salt• Read labels to choose lower sodium options among similar foods.• Do not add salt to foods.c. Limit intake of foods and drinks containing added sugars. In particular, limitsugar-sweetened drinks.d. If you choose to drink alcohol, limit intake.Guideline 3 To achieve and maintain a healthy weight you should be physically active andchoose amounts of nutritious food and drinks to meet your energy needs.• Children and adolescents should eat sufficient nutritious foods to grow anddevelop normally. They should be physically active every day and theirgrowth should be checked regularly.• Older people should eat nutritious foods and keep physically active to helpmaintain muscle strength and a healthy weight.Guideline 4 Encourage and support breastfeeding.Guideline 5 Care for your food; prepare and store it safely.DRAFT <strong>Australian</strong> <strong>Dietary</strong> <strong>Guidelines</strong>- December 2011 3
Contents1. Introduction ...................................................................................................................................... 71.1 Why the <strong>Guidelines</strong> matter .......................................................................................................................71.2 Social determinants of food choices and health..................................................................................81.3 Scope and target audience .......................................................................................................................91.4 How the <strong>Guidelines</strong> were developed ................................................................................................... 131.5 Adherence to dietary advice in Australia .......................................................................................... 181.6 <strong>Dietary</strong> choices and the environment ................................................................................................ 201.7 How to use the <strong>Guidelines</strong> ..................................................................................................................... 211.8 The <strong>Australian</strong> Guide to <strong>Health</strong>y <strong>Eat</strong>ing ................................................................................................. 222. <strong>Eat</strong> a wide variety of nutritious foods ...................................................................................... 242.1 <strong>Eat</strong> a wide variety of nutritious foods ................................................................................................ 262.1.1 Setting the scene ........................................................................................................ 262.1.2 The evidence for ‘eat a wide variety of nutritious foods’ ....................................... 272.1.3 How eating a wide variety of foods may improve health outcomes .................. 282.1.4 Practical considerations: <strong>Eat</strong> a wide variety of nutritious foods ........................... 282.2 Plenty of vegetables, including different types and colours, and legumes/beans, and eat fruit322.2.1 Setting the scene ........................................................................................................ 322.2.2 The evidence for ‘plenty of vegetables’ ................................................................... 322.2.3 The evidence for ‘plenty of legumes/beans’ ............................................................ 362.2.4 The evidence for ‘eat fruit’ ........................................................................................ 372.2.5 How plenty of vegetables, including different types and colours, and legumes/beans, and eating fruitmay improve health outcomes .......................................................................................... 392.2.6 Practical considerations: <strong>Eat</strong> plenty of vegetables, including different types and colours,legumes/beans, and fruit ........................................................................................................ 422.3 Grain (cereal) foods (mostly wholegrain) ......................................................................................... 452.3.1 Setting the scene ........................................................................................................ 452.3.2 The evidence for ‘grain (cereal) foods’ .................................................................... 462.3.3 How eating cereal (mostly wholegrain) foods may improve health outcomes . 472.3.4 Practical considerations: <strong>Eat</strong> grain (cereal) foods, mostly wholegrain ................. 482.4 Lean meat and poultry, fish, eggs, nuts and seeds, and legumes/beans ...................................... 512.4.1 Setting the scene ........................................................................................................ 512.4.2 The evidence for ‘lean meat and poultry, fish, eggs, nuts and seeds, and legumes/beans’ 522.4.3 How eating lean meat and poultry, fish, eggs, nuts and seeds, and legumes/beans may improvehealth outcomes ................................................................................................................... 56DRAFT <strong>Australian</strong> <strong>Dietary</strong> <strong>Guidelines</strong>- December 2011 4
2.4.4 Practical considerations: Lean meat and poultry, fish, eggs, legumes/beans and nuts/seeds 572.5 Milk, yoghurt, cheese and/or alternatives (mostly reduced fat) ................................................... 612.5.1 Setting the scene ........................................................................................................ 612.5.2 The evidence for ‘milk, yoghurt, cheese and/or alternatives’ ................................ 622.5.3 How drinking milk and eating yoghurt, cheese and/or alternatives may improve health outcomes.................................................................................................................................................. 652.5.4 Practical considerations: Milk, yoghurt, cheese and/or alternatives .................... 652.6 Water ......................................................................................................................................................... 682.6.1 Setting the scene ........................................................................................................ 682.6.2 The evidence for ‘drink water’ .................................................................................. 682.6.3 How drinking water may improve health outcomes ........................................... 712.6.4 Practical considerations: Drink water ..................................................................... 723. Limit intake of foods and drinks containing saturated and trans fats, added salt, added sugars andalcohol ...................................................................................................................................... 743.1 Limiting intake of foods and drinks containing saturated and trans fat ...................................... 763.1.1 Setting the scene ........................................................................................................ 763.1.2 The evidence for ‘limiting intake of foods and drinks containing saturated and trans fat’ 773.1.3 How limiting intake of foods and drinks containing saturated and trans fat may improve healthoutcomes ................................................................................................................................ 793.1.4 Practical considerations: Limiting intake of foods and drinks containing saturated and trans fat 803.2 Limit intake of foods and drinks containing added salt .................................................................. 823.2.1 Setting the scene ........................................................................................................ 823.2.2 The evidence for ‘limiting intake of foods and drinks containing added salt’ ..... 833.2.3 How limiting intake of foods and drinks containing added salt may improve health outcomes 853.2.4 Practical considerations: Limiting intake of foods and drinks containing added salt853.3 Limit intake of foods and drinks containing added sugars ............................................................. 873.3.1 Setting the scene ........................................................................................................ 873.3.2 The evidence for ‘limiting intake of foods and drinks containing added sugars’ 883.3.3 How limiting intake of foods and drinks containing added sugars may improve health outcomes.................................................................................................................................................. 903.3.4 Practical considerations: Limiting intake of foods and drinks containing added sugars 913.4 Alcoholic drinks ....................................................................................................................................... 923.4.1 Setting the scene ........................................................................................................ 923.4.2 The evidence for ‘limiting alcohol’ ............................................................................ 943.4.3 How limiting alcohol may improve health outcomes ........................................... 973.4.4 Practical considerations: Limiting alcohol ............................................................... 98DRAFT <strong>Australian</strong> <strong>Dietary</strong> <strong>Guidelines</strong>- December 2011 5
4. Achieve and maintain a healthy weight ................................................................................ 10275.1 Setting the scene ................................................................................................................................... 1094.2 The evidence for ‘achieving and maintaining a healthy weight’ ...................................................... 1134.3 How dietary patterns can affect energy intake and balance and weight outcomes ................. 1194.4 Practical considerations: Achieving and maintaining a healthy weight ........................................... 1205. Encourage and support breastfeeding ................................................................................... 1315.1 Setting the scene ................................................................................................................................... 1335.2 The evidence for ‘Encouraging and supporting breastfeeding’ ........................................................ 1345.3 Practical considerations: Encourage and support breastfeeding..................................................... 1406. Food safety ................................................................................................................................... 1446.1 Setting the scene ................................................................................................................................... 1466.2 The evidence for ‘caring for your food; prepare and store it safely’ ........................................ 1466.3 Why it is important to prepare and store food safely ................................................................. 1476.4 Practical considerations: Food safety ............................................................................................... 148Appendix 1. History and timeline of <strong>Australian</strong> nutrition documents ............................... 150Appendix 2. Process report ......................................................................................................... 156Appendix 3. Assessing growth and healthy weight in infants, children and adolescents, and healthy weightin adults .................................................................................................................................. 163Appendix 4. Physical activity guidelines ..................................................................................... 169Appendix 5. Studies examining the health effects of intake of fruit and vegetables together 173Appendix 6. Alcohol and energy intake ..................................................................................... 176Appendix 7. Equity and the social determinants of health and nutrition status ............... 178Appendix 8: Glossary ..................................................................................................................... 191References ........................................................................................................................................ 209DRAFT <strong>Australian</strong> <strong>Dietary</strong> <strong>Guidelines</strong>- December 2011 6
1. Introduction1.1 Why the <strong>Guidelines</strong> matterThere are many ways for <strong>Australian</strong>s to achieve dietary patterns that promote health andwellbeing and reduce the risk of chronic disease. Diet is arguably the single most importantbehavioural risk factor that can be improved to have a significant impact on health [1, 2]. As thequality and quantity of foods and drinks consumed has a significant impact on the health andwellbeing of individuals, society and the environment, better nutrition has a huge potential toimprove individual and public health and decrease healthcare costs. Optimum nutrition is essentialfor the normal growth and physical and cognitive development of infants and children. In all<strong>Australian</strong>s, nutrition contributes significantly to healthy weight, quality of life and wellbeing,resistance to infection, and protection against chronic disease and premature death.Sub-optimal nutrition can be associated with ill-health. Many diet-related chronic diseases such ascardiovascular disease, type 2 diabetes and some forms of cancer are the major cause of death anddisability among <strong>Australian</strong>s [3]. More than one-third of all premature deaths in Australia are theresult of chronic diseases that could have been prevented [3]. Many of these are mediated byoverweight and obesity.Poor nutrition is responsible for around 16% of the total burden of disease [1, 4] and is implicatedin more than 56% of all deaths in Australia [5]. The most recent available estimates for the totalcost of poor nutrition were more than $5 billion per year, based on 1990 costings [5]. Given thatthe cost of obesity alone was estimated to be $8.283 billion per year in 2008 [6], the current costof poor nutrition in Australia is now likely to greatly exceed the 1990 estimates.Most of the burden of disease due to poor nutrition in Australia is associated with excessiveintake of energy-dense and relatively nutrient-poor foods high in energy (kilojoules), saturated fat,added or refined sugars or salt, and/or inadequate intake of nutrient-dense foods, includingvegetables, fruit and wholegrain cereals [2, 7]. Deficiency in some nutrients such as iodine, folate[8], iron and vitamin D is also of concern for some <strong>Australian</strong>s [9, 10].Overconsumption of some foods and drinks, leading to excess energy intake and consequentoverweight and obesity, is now a key public health problem for Australia [7, 11]. The prevalence ofoverweight and obesity has increased dramatically in Australia over the past 30 years and is now62% in adults [12] and around 25% in children and adolescents [12, 13].These <strong>Guidelines</strong> summarise the evidence underlying food, diet and health relationships thatimprove public health outcomes.DRAFT <strong>Australian</strong> <strong>Dietary</strong> <strong>Guidelines</strong>- December 2011 7
<strong>Dietary</strong> patterns consistent with the <strong>Guidelines</strong> improve healthRecent reviews of the evidence on food and health confirm that dietary patterns consistent withthe <strong>Guidelines</strong> are positively associated with indicators of health and wellbeing.Two systematic reviews found that higher dietary quality was consistently associated with a 10–20% reduction in morbidity. <strong>For</strong> example, there is evidence of a probable association betweenconsumption of a Mediterranean dietary pattern and reduced mortality (Grade B, Section 20.1 inEvidence Report [14]) [15-17]. Previous studies have also indicated inverse associations betweenplant-based diets and all-cause and cardiovascular mortality, particularly among older adults [18-20]. The effects of dietary quality tended to be greater for men than women, with commondeterminants being age, education and socioeconomic status [21, 22].There is likely to be great variation in the interpretation and implementation of dietary guidelines.Nevertheless, when a wide range of eating patterns was assessed for compliance with differentguidelines using a variety of qualitative tools, the assessment suggested an association betweenadherence to national dietary guidelines and recommendations, and reduced morbidity andmortality (Grade C, Section 20.3 in Evidence Report [14]) [21, 22].More recent evidence from Western societies confirms that dietary patterns consistent withcurrent guidelines recommending relatively high amounts of vegetables, fruit, whole grains, poultry,fish, and reduced fat milk, yoghurt and cheese products may be associated with superiornutritional status, quality of life and survival in older adults [23, 24]. Robust modelling of dietarypatterns in accordance with dietary guidelines has demonstrated achievable reductions inpredicted cardiovascular and cancer disease mortality in the population, particularly with increasedconsumption of fruit and vegetables [25].In relation to obesity, actual dietary recommendations and measures of compliance and weightoutcomes vary greatly in published studies. Overall energy intake is the key dietary factor affectingweight status (see Chapter 4).1.2 Social determinants of food choices andhealthLife expectancy and health status are relatively high overall in Australia [12, 26]. Nonetheless,there are differences in the health and wellbeing between <strong>Australian</strong>s, including in rates of deathand disease, life expectancy, self-perceived health, health behaviours, health risk factors, and use ofhealth services [27-29].The causes of health inequities are largely outside the health system and relate to the inequitabledistribution of social, economic and cultural resources and opportunities [27-29]. Employment,DRAFT <strong>Australian</strong> <strong>Dietary</strong> <strong>Guidelines</strong>- December 2011 8
income, education, cultural influences and lifestyle, language, sex and other genetic differences,isolation (geographic, social or cultural), age and disability, the security and standard ofaccommodation, and the availability of facilities and services all interact with diet, health andnutritional status[27, 28]. Conversely, a person’s poor health status can contribute to socialisolation and limit their ability to gain employment or education and earn an income, which can inturn impact negatively on health determinants such as quality and stability of housing.<strong>Australian</strong>s who are at greater risk of diet-mediated poor health include the very young, the veryold, Aboriginal and Torres Strait Islander peoples and those in lower socioeconomic groups [27-32]. The <strong>Guidelines</strong> address some of the issues these population groups face under ‘Practicalconsiderations for health professionals’ in each guideline. Further discussion of the socialdeterminants of health and food choices is provided in Appendix 7.1.3 Scope and target audienceThe <strong>Guidelines</strong>, together with the underlying evidence base, provide guidance on foods, foodgroups and dietary patterns that protect against chronic disease and provide the nutrientsrequired for optimal health and wellbeing. They are important tools which support broaderstrategies to improve nutrition outcomes in Australia, as highlighted in <strong>Eat</strong> Well Australia: an agendafor action in public health nutrition, 2000-2010 [2]. They are consistent with the most recent<strong>Australian</strong> Food and Nutrition Policy 1992 [33] in considering health and wellbeing, equity and theenvironment.The <strong>Guidelines</strong> apply to all healthy <strong>Australian</strong>sThe <strong>Guidelines</strong> aim to promote the benefits of healthy eating, not only to reduce the risk of dietrelateddisease but also to improve community health and wellbeing. The <strong>Guidelines</strong> are intendedfor people of all ages and backgrounds in the general healthy population, including people withcommon diet-related risk factors such as being overweight.They do not apply to people with medical conditions requiring specialised dietary advice, nor tothe frail elderly who are at risk of malnutrition.The <strong>Guidelines</strong> are based on whole foods<strong>Dietary</strong> recommendations are often couched in terms of individual nutrients (such as vitamins andminerals). People chose to eat whole foods not single nutrients, so such recommendations can bedifficult to put into practice. <strong>For</strong> this reason, these <strong>Guidelines</strong> make recommendations based onlyon whole foods, such as vegetables and meats, rather than recommendations related to specificfood components and individual nutrients.DRAFT <strong>Australian</strong> <strong>Dietary</strong> <strong>Guidelines</strong>- December 2011 9
The Evidence Report(A review of the evidence to address targeted questions to inform the revision of the<strong>Australian</strong> dietary guidelines)This is a systematic literature review relevant to targeted questions published in the peerreviewednutrition literature from 2003-2009. This document is described further in Section 1.4.As an example, if you would like to look at the evidence for a particular Evidence Statement, youwould refer to the Evidence Report.The <strong>Australian</strong> Guide to <strong>Health</strong>y <strong>Eat</strong>ingThis package of resources includes:• the ‘plate’ graphic divided into portions of fruit, vegetables, grains, milk, yoghurt and cheeseproducts and lean meat and alternatives, representing the number of serves of each type of foodrequired per day• the recommended number of serves of each of the food groups, and discretionary foods,for different sub-population groups• examples of what a serve size is for each food groupAs an example, if you are would like to know how many serves of vegetables men aged between19 and 50 should eat each day you would refer to the <strong>Australian</strong> Guide to <strong>Health</strong>y <strong>Eat</strong>ing. Thisinformation is also included in the <strong>Guidelines</strong> under ‘Practical considerations for healthprofessionals’ for each food group.Related brochures and posters for health professionals and consumersAll these documents are available on the web at www.eatforhealth.gov.au.DRAFT <strong>Australian</strong> <strong>Dietary</strong> <strong>Guidelines</strong>- December 2011 11
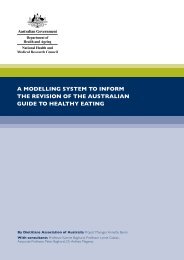
The Food Modelling Report – translating nutrient requirements intodietary patternsThe report A modelling system to inform the revision of the <strong>Australian</strong> Guide to <strong>Health</strong>y <strong>Eat</strong>ing (theFood Modelling Report) was commissioned by the NHMRC between 2008 and 2010. Itdetermined a range of combinations of amounts and types of foods that could be consumed tomeet nutritional needs with the least amount of energy for the smallest and least active peoplewithin an age and sex group. This report applies the Nutrient reference values for Australia and NewZealand including recommended dietary intakes [9] and provides information on the serve sizes andminimum number of daily serves required for each population group to achieve the requiredintake of vitamins, minerals and macronutrients.There were several inputs in the development of this report including consultation processesarranged by NHMRC and a public consultation of the draft report in April/May 2010 after whichthe models were finalised.The Food Modelling Report informed the revision of the <strong>Australian</strong> Guide to <strong>Health</strong>y <strong>Eat</strong>ing (seeSection 1.7) and was considered together with other sources of evidence to determine therecommendations in the <strong>Guidelines</strong>.Capturing new evidenceNutrition is a continuously evolving area and research studies are published on a regular basis.Relevant results from high quality studies (primarily systematic reviews) assessing food, diet andhealth relationships published after the literature review for the Evidence Report (after 2009)were also considered in the development of the <strong>Guidelines</strong>. While results from these studies werenot graded, and did not influence the Evidence Statements, they were included in the <strong>Guidelines</strong>and were deemed warranted to ensure currency.As the Evidence Report only included studies investigating food, diet and health relationships, theresults of other high quality studies published since 2002 were used to update the sections in the<strong>Guidelines</strong> which provided other information (‘Setting the scene’, ‘How eating a particular food mayimprove health outcomes’, and ‘Practical considerations for health professionals’ sections) if theymet the following criteria:• the study was a high quality randomised controlled trial, intervention, cohort, orobservational study, but not an editorial or opinion piece (meta-analyses wereconsidered)• the outcome of the study related to some aspect of health or chronic diseaseDRAFT <strong>Australian</strong> <strong>Dietary</strong> <strong>Guidelines</strong>- December 2011 16
• the study results were generalisable to the <strong>Australian</strong> population• the study was related to foods or the total diet rather than nutrients.While they did not influence the Evidence Statements or grading’s, these sources were used toassist in refining translation of the evidence.1.4.2 How the evidence was usedGetting the guideline wording rightThe final wording of each recommendation was developed by a Working Committee consensusapproach, based on the information gained from the five key sources listed Section 1.4.1.<strong>For</strong> example, to translate all available evidence regarding consumption of vegetables and healthoutcomes to develop dietary guideline recommendations the following evidence was considered: the graded Evidence Statements (from Grade A through to C) about the relationshipbetween consumption of vegetables and various health outcomes [14] the importance of vegetables as a source of key nutrients in the <strong>Australian</strong> diet from theFood Modelling document [10] and the NRV document [9] the relatively low energy content of vegetables [9, 10] findings of international authoritative reports including the World Cancer Research Fundreport [42] information provided in the 2003 <strong>Dietary</strong> <strong>Guidelines</strong> [37].Assessment of all available sources of evidence confirmed the importance of consumption ofvegetables for promoting health and wellbeing. The Working Committee translated this evidenceinto the recommendation to ‘eat plenty of vegetables’.Using Evidence StatementsThe manner in which Evidence Statements were developed is described in Section 1.4.1. In thesections titled ‘Evidence’, all the graded evidence statements are underpinned by evidence fromthe Evidence Report, and referred to clearly in the text in these sections. This section alsoincludes relevant ungraded referenced evidence from the other four key sources (see Section1.4.1) to ensure comprehensiveness and currency. These Evidence sections provide the basis ofthe scientific information that was translated to form each guideline recommendation at thebeginning of each chapter.To ensure the <strong>Guidelines</strong> are realistic, practical and achievable, the scientific and social context foreach Guideline was considered. This information is included for each Guideline under the heading‘Setting the Scene’.DRAFT <strong>Australian</strong> <strong>Dietary</strong> <strong>Guidelines</strong>- December 2011 17
Potential mechanisms through which particular dietary patterns may influence health wereconsidered to help assess the plausibility of the associations described in the Evidence sections.This information is included for each Guideline under the heading ‘How a particular food/dietarypattern may improve health outcomes’.This information has originated predominantly from previous dietary guidelines series, updated bynarrative reviews of additional literature sourced from authoritative reports, from the FoodModelling Report, from the NRV document [9] and from high quality studies published since thelast <strong>Dietary</strong> <strong>Guidelines</strong> in 2003.1.5 Adherence to dietary advice in AustraliaAdherence to dietary recommendations in Australia is poor [43]. Most children’s intake ofvegetables, fruit, grain (cereal) foods and milk, yoghurt and cheese products and alternatives isbelow recommended levels, while their intake of saturated fat and sugar exceed recommendations[13]. Analysis of Australia’s 1995 National Nutrition Survey [44] found that energy-dense, nutrientpoor‘extra foods’ [45] contributed 41% of the total daily energy intake of 2–18 year olds [46].The most recent dietary data available for <strong>Australian</strong> adults (collected in the 1995 NationalNutrition Survey) also showed a poor dietary pattern with inadequate intakes of vegetables, fruit,wholegrain cereals and milk, yoghurt and cheese products and alternatives, with higher thanrecommended proportions of fat intake derived from saturated fat [44, 47]. More than 35% ofdaily energy intake was derived from energy-dense nutrient-poor ‘extra foods’ [46].There have been changes in the intakes of macro-nutrients over the past three decades, generallyin the direction encouraged by previous dietary guidelines (see Table 1.1) [48].DRAFT <strong>Australian</strong> <strong>Dietary</strong> <strong>Guidelines</strong>- December 2011 18
Table 1.1: Changes in macronutrient intake in Australia for adults and children/adolescentsbetween 1983 and 1995Adults (25–64 years) 1983 to1995Adolescents (10–15 years) 1985to 1995Nutrient /indicatorDirection (a)Extent ofchangeDirection (a)Extent ofchangeEnergy Increased Men 3%Women 4%Increased Boys 15%Girls 11%Protein Unchanged - Increased Boys 14%Girls 13%Carbohydrate Increased Men 17%Women 16%Fat Decreased Men 6%Women 4%<strong>Dietary</strong> fibre Increased Men 13%Women 10%Note: (a) Where there is a trend in mean intake it is significant at 1% level.Source: Cook et al. 2001 [48]Barriers to complianceIncreased Boys 22%Girls 18%UnchangedIncreased Boys 13%Girls 8%Influences on dietary choices throughout life are complex, ranging from individual, physical andsocial factors through to societal and environmental factors [49-87].Possible barriers to compliance with recommendations may include poor communication ofadvice, low levels of understanding of the information, low levels of food literacy and high levels offood insecurity (this may include the inability to access adequate amounts of nutritious, culturallyacceptable foods), conflicting messages (including advertising and promotion of energy-densenutrient-poor foods and drinks), and particular dietary preferences [88, 89].There appear to be complex relationships between dietary patterns established in childhood anddietary quality over time. Studies suggest that frequency of takeaway food consumption increasesduring childhood, adolescence and young adulthood [90] and, together with consumption of lowqualitysnacks, is associated with higher intakes of energy, total fat, saturated fat and sodium [75-77, 90]. The frequency of eating breakfast decreases with age and is associated with reducedintake of calcium and dietary fibre [91]. There is some evidence that family meal patterns duringDRAFT <strong>Australian</strong> <strong>Dietary</strong> <strong>Guidelines</strong>- December 2011 19
adolescence predict diet quality and meal patterns during early young adulthood [92]. Childhoodsmoking is also associated with poor dietary habits [78, 83] as is stressful family life [86, 87].Challenges for adoption of the <strong>Guidelines</strong>An improved understanding of what <strong>Australian</strong>s are eating will assist the implementation anduptake of the <strong>Guidelines</strong> which provide the evidence for what <strong>Australian</strong>s should be eating. Much ofour current knowledge of adult <strong>Australian</strong> dietary patterns comes from the National NutritionSurvey 1995, however the <strong>Australian</strong> <strong>Health</strong> Survey 2011 – 2013 [93] will provide a betterunderstanding of the current diet and nutrition of <strong>Australian</strong>s, or what <strong>Australian</strong>s are eating.Although the key messages of the <strong>Guidelines</strong> may not have changed significantly since 2003, theevidence base supporting them has strengthened considerably. The challenge now is to ensure thatthese <strong>Guidelines</strong> – particularly with renewed emphasis on achieving and maintaining a healthyweight – are strongly promoted in a context that encourages and supports more nutritious foodchoices, dietary patterns and healthy lifestyles within the community.1.6 <strong>Dietary</strong> choices and the environmentIncreasingly, <strong>Australian</strong>s are seeking advice from health and medical practitioners about foodchoices and their possible impact on the environment. These concerns, coupled with a growingpopulation, means rethinking matters of food security, what is available to eat, and moreimportantly what people are recommended to eat [94-97].<strong>Dietary</strong> guidelines evolve as knowledge grows. Preliminary work indicates that dietary patternsconsistent with the <strong>Dietary</strong> <strong>Guidelines</strong> are likely to have a lower environmental impact than otherdietary patterns. Available <strong>Australian</strong> and international evidence is insufficient to be able to provideadvice on the environmental impact of specific food items or brands, however there may be somepractical steps that people can take. <strong>For</strong> example:• Buy and consume foods and drinks that are consistent with the <strong>Dietary</strong> <strong>Guidelines</strong>• Avoid overconsumption• Minimise food wastage• Consider your food buying, storage, preparation and disposal practices, and• Minimise and recycle the packaging of foodNHMRC aims to work with other agencies to provide guidance for health professionals as theywork with clients and patients. Many complex interactions exist as food is grown, transported,sold and consumed. As a health agency, NHMRC will need partners to achieve this aim ofproviding useful, practical and well informed advice to both health professionals and the generalDRAFT <strong>Australian</strong> <strong>Dietary</strong> <strong>Guidelines</strong>- December 2011 20
• Practical considerations for health professionals, which identifies practical issues and healthimpacts for subgroups within the population including at different life stages.<strong>Dietary</strong> guidelines can be effective in directing attention to the types of food people shouldconsume, but there remains a need to focus on the amount of food consumed. Overconsumption,even of nutritious foods, can lead to excessive energy intake compared to need and thereby anincrease in body weight.1.8 The <strong>Australian</strong> Guide to <strong>Health</strong>y <strong>Eat</strong>ingWhile the <strong>Australian</strong> <strong>Dietary</strong> <strong>Guidelines</strong> provide broad dietary advice, with the underpinningevidence, the <strong>Australian</strong> Guide to <strong>Health</strong>y <strong>Eat</strong>ing is a practical, pictorial guide to recommended typesand serves of foods to consume every day[10, 14]. It also includes information on standard servesizes for different food types.The recommended foods and number of daily serves for different population groups have beenincluded in each of the Guideline chapters under ‘Practical Considerations’, and are also available atwww.eatforhealth.gov.au.DRAFT <strong>Australian</strong> <strong>Dietary</strong> <strong>Guidelines</strong>- December 2011 22
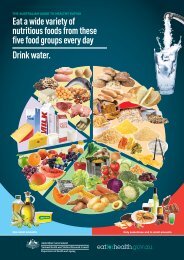
Figure 1.2: <strong>Australian</strong> Guide to <strong>Health</strong>y <strong>Eat</strong>ingDRAFT <strong>Australian</strong> <strong>Dietary</strong> <strong>Guidelines</strong>- December 2011 23
2. <strong>Eat</strong> a wide variety of nutritious foodsGuideline 1<strong>Eat</strong> a wide variety of nutritious foods from these five groups every day:• plenty of vegetables, including different types and colours, andlegumes/beans• fruit• grain (cereal) foods, mostly wholegrain, such as bread, cereals, rice, pasta,noodles, polenta, couscous, oats, quinoa and barley• lean meat and poultry, fish, eggs, nuts and seeds, and legumes/beans• milk, yoghurt, cheese and/or their alternatives, mostly reduced fat (reducedfat milks are not suitable for children under 2 years).And drink water.DRAFT <strong>Australian</strong> <strong>Dietary</strong> <strong>Guidelines</strong>- December 2011 24
Executive Summary<strong>Dietary</strong> patterns which include a wide variety of nutritious foods are more likelyto meet nutrient requirements, promote health and wellbeing and confer healthbenefits than restricted diets.A variety of foods should be consumed from each of the five food groups:vegetables and legumes/beans; fruit; grain (cereal) foods mostly wholegrain; leanmeat and poultry, fish, eggs, nuts and seeds, and/or legumes/beans; and milk,yoghurt, cheese and/or alternatives. Mostly reduced-fat milk, yoghurt and cheeseproducts are recommended for adults, but reduced fat milks are not suitable asthe main milk drink for children under the age of two years.There are many different ways to combine these nutrient-dense foods to producenutritious dietary patterns that suit cultural, economic, social and culinarypreferences, as well as delivering health benefits.There is increasing evidence that current consumption patterns are associated withreduced risk of chronic disease including cardiovascular disease, type 2 diabetes,and several cancers.Together with adherence to Guideline 2 (on limiting intake of specific foods high insaturated fat, sugar and/or salt) and Guideline 3 (on achieving and maintaining ahealthy weight), consumption of a wide variety of nutritious foods and choosingwater as a drink will substantially reduce the risk of diet-related chronic diseaseand promote health and wellbeing in Australia.This chapter provides information on why the consumption of a wide variety ofnutritious foods is beneficial to health, the evidence for the recommendedapproach, and includes practical advice for the general population and specificsubpopulation groups.DRAFT <strong>Australian</strong> <strong>Dietary</strong> <strong>Guidelines</strong>- December 2011 25
2.1 <strong>Eat</strong> a wide variety of nutritious foods2.1.1 Setting the sceneNo single food - with the exception of breastmilk for about the first six months of life - canprovide all the nutrients in the amounts needed for good health. <strong>Dietary</strong> patterns which include awide variety of nutritious foods and water are more likely than restricted diets to meet nutrientrequirements [9] and confer health benefits. A dietary pattern needs to include a variety of choicesfrom each of the five food groups – vegetables, fruit, grain (cereal) foods, lean meat and poultry,fish, eggs, nuts and seed and legumes/beans, and milk, yoghurt, cheese and/or alternatives.Most <strong>Australian</strong>s today eat a wide variety of foods from different cuisines. The available foodsupply generally meets the nutritional needs of the population, but appropriate choices must bemade to ensure that all nutrient requirements are met, so that diet-related chronic disease can beprevented or delayed, and so that optimum health and wellbeing can be achieved [10]. Australia isalso fortunate in having a safe food supply with low levels of contaminants and pollutants[98].The most recent dietary survey data available for <strong>Australian</strong> adults – the National Nutrition Survey1995 – showed an increasing number of foods being consumed by adults in that year comparedwith 1983 [44]. It is expected that the variety of foods consumed has continued to increase since1995. This is largely as a result of cultural diversity in the population arising from waves ofimmigration from European countries after World War II and Asian and African countries sincethe 1970s [99, 100]. Initially, new varieties of fresh fruit and vegetables, grain (cereal) foods anddifferent types of meat and legume/beans became available. Increasing demand for convenienceand/or fast foods - also as a result of changes in social and economic conditions - has led to theavailability of approximately 30,000 different types of foods and drinks [101]. However, many ofthese - particularly snack and fast foods and drinks - are energy-dense and nutrient-poor, so careis required to choose diets consistent with the <strong>Guidelines</strong> [102].Despite the variety of foods available in Australia, comparison of actual intakes with recommendednutrient intakes [9] shows that some people are still at risk for deficiencies of particular nutrients.<strong>For</strong> example, intakes of iron and calcium continue to be low in relation to recommendations forsome girls and women of reproductive age [10] and iodine intake is inadequate in some pregnantand breastfeeding women [103].Consuming a dietary pattern consistent with the evidence presented in this chapter will help topromote health, protect against disease and reduce the prevalence of nutrient deficiencies.Together with adherence to Guideline 2 and Guideline 3, adherence to this guideline will help toreduce the risk of diet-related chronic disease such as cardiovascular disease, type 2 diabetes andsome cancers [9, 10, 14], and promote health and wellbeing.DRAFT <strong>Australian</strong> <strong>Dietary</strong> <strong>Guidelines</strong>- December 2011 26
Consuming a wide variety of foods may also help to ensure that an adequate variety of foodsremains available into the future. Food choices to reduce the impact on the environment areconsistent with those to improve health.2.1.2 The evidence for ‘<strong>Eat</strong> a wide variety of nutritiousfoods’Evidence of the health benefits of a dietary pattern consisting of a variety of nutritious foods inappropriate amounts has strengthened over the past decade. The evidence suggests that high dietquality is associated with a reduced risk of chronic disease and improved health outcomes (GradeC, Section 20.3 in Evidence Report [14]) [22, 104-107]. Reviews of studies of a range of eatingpatterns suggest that:• higher quality diet is associated with reduced morbidity• the health effects tend to be greater in those with lower quality diets, such as men, youngpeople and people with lower educational and socioeconomic status• consuming a dietary intake pattern consistent with national dietary guidelines or otherscientifically informed recommendations is associated with reduced morbidity and mortality(Grade C, Section 20.3 in Evidence Report [14]) [21, 22].Recent evidence also confirms that a dietary pattern consistent with current guidelines toconsume a wide variety of foods including vegetables, fruit, wholegrains, lean meat, poultry, fishand reduced-fat milk, yoghurt and cheese products may be associated with superior nutritionalstatus, quality of life and survival in older adults [23, 24].The evidence statements and gradings (A- convincing association, B- probable association, C-suggestive association) related to ‘eat a wide variety’ from the Evidence Report (literature fromyears 2002 – 2009) are presented in the table below. This does not include evidence from othersources, such as the 2003 <strong>Dietary</strong> <strong>Guidelines</strong> (where evidence was classified as level I, II or III inwhich individual studies were classified according to their design but overall grades forrelationships were not derived), although these sources have been used to inform the <strong>Guidelines</strong>.Evidence StatementThe evidence suggests that high quality diet is associated with a reduced risk ofchronic disease and improved health outcomes.The evidence suggests the consumption of a dietary intake pattern aligned withnational dietary guidelines or recommendations is associated with reduced morbidityand mortality.GradeCCDRAFT <strong>Australian</strong> <strong>Dietary</strong> <strong>Guidelines</strong>- December 2011 27
2.1.3 How eating a wide variety of nutritious foods mayimprove health outcomesNutritional science has traditionally characterised foods according to their macro- and micronutrientvalues, but there is increasing evidence of the role that whole foods play in promotinghealth and wellbeing, and of the role of food components other than nutrients in protectingagainst some communicable and non-communicable chronic diseases when consumed as part of avaried nutritious diet [108, 109]. These non-nutrient components include phytochemicals, whichare obtained from plants and are biologically active but not directly associated with deficiencysyndromes. They include carotenoids, flavonoids, isoflavonoids, polyphenols, isothiocyanates,indoles, sulphoraphanes, monoterpenes, xanthins and non-digestible oligosaccharides. It is notalways known which food constituents are responsible for the protective effects of specific foodsagainst specific chronic diseases, and it is likely that many other active constituents will bediscovered in the future. Interactions between these compounds are likely to be complex, eithercausing or masking effects, or acting synergistically with other compounds [10].<strong>Dietary</strong> variety has the benefit of diluting potential toxicants found naturally in foods [110].Enjoying diversity in food intake can reduce an individual’s exposure to any one group of toxicants.Other ways of minimising this risk include appropriate and careful processing, cooking and storageof food (see Chapter 7).Another potential benefit of food variety comes from maximising the bioavailability of nutrients[111]. The many complex relationships between foods, nutrients and food components (such asphytates) can influence the absorption, metabolism and retention of nutrients. When dietarypatterns are varied and nutrients are in adequate supply, these interactions pose fewer problemsthan in restricted, monotonous dietary patterns.Clinical problems associated with excessive intake of nutrients are nearly always associated withintakes of supplements [9]. It is also possible to develop symptoms of toxicity when dietarypatterns concentrate on particular foods, or if the same nutrient is consumed in different chemicalforms [9, 112]. Examples include excessive consumption of carrot juice or regularly eating verylarge quantities of liver, which may cause vitamin A toxicity [113].2.1.4 Practical considerations: <strong>Eat</strong> a wide variety ofnutritious foodsIt is important to consider this guideline together with other guidelines, particularly Guideline 2 onlimiting intakes of specific foods high in saturated fats, added sugars and/or added salt andGuideline 3 on healthy weight. The word ‘plenty’ is used judiciously to encourage increasedconsumption of vegetables (particularly non-starchy varieties). <strong>For</strong> the other food groups, theguidelines do not advocate plenty, but rather focus on an adequate amount of the preferredDRAFT <strong>Australian</strong> <strong>Dietary</strong> <strong>Guidelines</strong>- December 2011 28
varieties within each food group, for example wholegrain, or lean, or lower fat and plain water,preferably from the tap. This serves to distinguish between eating a variety and over-consumption asthere is some evidence that there may be a link between eating a variety of energy-dense food anddrinks and excessive food intakes (see Chapter 4). Variety refers to nutritious food, notdiscretionary foods.Different quantities of different types of foods from the five food groups are recommended fordifferent ages, sexes, and those with different energy (kilojoule) intake requirements. These arebased on dietary modelling to inform the revised <strong>Australian</strong> Guide to <strong>Health</strong>y <strong>Eat</strong>ing [10]. <strong>For</strong>example, men aged 19-50 need to eat around 19.5 – 22.5 serves of food from the five food groupseach day while 19-50 year old women need to eat 18 – 20.5 serves from these five food groups.Detailed information on the number and types of serves of food for different population groups isin the <strong>Australian</strong> Guide to <strong>Health</strong>y <strong>Eat</strong>ing [114].2.1.4.1 Pregnant and breastfeeding womenConsuming a variety of nutritious foods is particularly important during pregnancy and whilebreastfeeding. Quality nutritious dietary patterns during pregnancy may reduce the risk of babiesbeing small for their gestational age or exhibiting restricted intrauterine foetal growth [115-117],being large for their gestational age [118], and may also help reduce the risk of pregnant womendeveloping pre-eclampsia [119, 120]. Quality nutritious dietary patterns before and duringpregnancy may help reduce the risk of women developing gestational diabetes mellitus [120-123].Maternal diet during pregnancy and while breastfeeding does not appear to affect the risk ofasthma, eczema or other allergy symptoms in infants [124-128]. Some health outcomes (such asallergies) in children will be affected more by their diet through infancy and childhood than theirmother’s diet during pregnancy, with in-utero influences likely to be minimal. However, a cohortstudy found that mothers who adopt high quality dietary patterns are more likely to have childrenwho also consume nutritious diets [129].Foods that should be avoided during pregnancy include those associated with increased risk ofListeria bacteria, such as soft cheeses, cold seafood, sandwich meats, bean sprouts and packaged orpre-prepared salads [130]. Intake of certain species of fish should be limited, due to the potentialrisk of excessive mercury intake. Pregnant women are advised to consume no more than oneserve per fortnight of shark, marlin or broadbill/swordfish, and no other fish that fortnight, or oneserve per week of orange roughy (deep sea perch) and no other fish that week [130, 131].Constipation is a common symptom during pregnancy [132]. Clinical treatment of constipationgenerally includes advice to consume a high fibre diet, including wholegrain cereals, fruit, andvegetables, and to drink water, which is consistent with these <strong>Guidelines</strong>.DRAFT <strong>Australian</strong> <strong>Dietary</strong> <strong>Guidelines</strong>- December 2011 29
2.1.4.2 InfantsExclusive breastfeeding is recommended for around the first six months of age, after which solid(pureed or spoon) foods of suitable texture can be introduced. There is no particular order orrate for the introduction of new foods, other than the first foods should be rich in iron.Breastfeeding should continue until 12 months and beyond for as long as the mother and childdesire (for more information, see the Infant Feeding <strong>Guidelines</strong> for <strong>Health</strong> Workers [133]), Foodchoices should be varied to ensure adequate energy (kilojoule) and nutrient supply.When introducing solids (spoon foods) to infants, parents and carers should ensure that a widevariety of nutritious foods of different colours, suitable textures and types is offered. This willprovide the additional nutrients required as infants grow and the variety will help to increaseacceptance of different nutritious foods. It is also more likely to improve the acceptance of avaried diet during childhood. Hard foods, such as nuts, should not be offered to children until theyare over three years of age and they are sufficiently mature to reduce the risk of choking.2.1.4.3 AdultsMales living alone are at particular risk of not eating a wide variety of nutritious foods. Analysis ofthe 1995 National Nutrition Survey [37] showed that in nearly all age groups adult males consumedsignificantly fewer types of foods than other groups.2.1.4.4 Older peopleThe diet of older people is generally more varied than that of younger groups [44]. However thefrail elderly are at increased risk of consuming monotonous, limited diets due to factors such asreduced mobility, poor dentition and poverty which may reduce access to a range of fresh foods.2.1.4.5 Aboriginal and Torres Strait IslandersLimited data on Aboriginal and Torres Strait Islander dietary intake are available. Very restricteddietary patterns - in which over 50% of energy (kilojoule) intake was derived by meat, flour andsugar - have been described in remote Aboriginal communities [134] with relatively little changeobserved recently [135]. However the majority of Aboriginal and Torres Strait Islander people livein urban areas and their most significant dietary issues tend to be also experienced by all people inlower socioeconomic groups.DRAFT <strong>Australian</strong> <strong>Dietary</strong> <strong>Guidelines</strong>- December 2011 30
2.1.4.6 People in lower socioeconomic groupsIn some urban centres, people in lower socioeconomic groups have less access to supermarketsand greater access to fast food outlets than more advantaged groups [136, 137]. Supermarketsgenerally offer a wider variety of food products, as well as fresh raw food.In Australia, the cost of a nutritious diet has been estimated to account for about 40% of thedisposable income of welfare-dependent families, compared to only 20% of an average families’disposable income. <strong>Health</strong> professionals should be aware of the budget challenges which healthyfood habits may pose for people who are welfare dependent and should note that substitutinggeneric brands for market brands can reduce the weekly food cost by about 13% [138]. Furtherdetails regarding the association of equity issues and consumption of varied and nutritious dietsare included in Appendix 7.2.1.4.7 People living in remote areasThe decreased availability of nutritious foods (such as fresh fruit and vegetables, wholegrain breadand low-fat milk products) in remote and regional areas in Australia has been described frequently.The cost of nutritious foods in these areas is also over 30% higher than in major cities and mayimpact on food security [30, 139-141].2.1.4.8 VegetariansAbout 4% of respondents in the National Nutrition Survey 1995 described themselves as vegetarianor vegan [44]. The food frequency questionnaire data recorded only 2% as consuming no animalproducts, and a further 2% as restricting consumption of animal foods to fish or white meat [44].Many more people eat vegetarian meals regularly or occasionally. Those following a strictvegetarian or vegan diet need to choose a variety of protein sources throughout the day to get anadequate mix of amino acids. <strong>Health</strong> professionals should encourage vegetarians to choose foodscarefully to ensure adequate intake of iron, zinc and vitamin B12 and to optimise the absorptionand bioavailability of iron, zinc and calcium [142].DRAFT <strong>Australian</strong> <strong>Dietary</strong> <strong>Guidelines</strong>- December 2011 31
2.2 Plenty of vegetables, including differenttypes and colours, and legumes/beans, and eatfruit2.2.1 Setting the sceneThere are many nutritional, societal, culinary and environmental reasons to ensure that vegetables,including legumes/beans, and fruit are a major component of <strong>Australian</strong> dietary patterns. As agroup, these foods are nutrient dense, relatively low in energy (kilojoules) and are good sources ofminerals and vitamins (such as magnesium, vitamin C and folate), dietary fibre and a range ofphytochemicals including carotenoids. Many of the sub-components of foods and theirrelationships have not been studied in detail, and it is expected that other sub-components, andtheir biological effects, are still to be discovered.The inclusion of a variety of vegetables, including legumes/beans, and fruit provides a diversity ofcolours, textures and flavours, adding to the enjoyment of eating. Vegetables, includinglegumes/beans, and fruit should be eaten in their whole food forms to maximise the impact on arange of health benefits. Fruit should mostly be eaten fresh and raw because of the low fibrecontent of fruit juice and the high energy density and ‘stickiness’ (which may have implications fordental caries) of dried fruit [10]. Some vegetables are suitable to eat raw, while it is best to cookothers to make them more palatable and digestible. Legumes should always be cooked. Someprocessed fruits and vegetables are nutritious alternatives as long as they are produced withoutadded salt, sugar (including concentrated fruit juice) or fat.Different fruits and vegetables are rich in different nutrients. <strong>For</strong> example, green leafy and Brassica(or cruciferous) vegetables are generally high in folate, and starchy vegetables are a good source ofcomplex carbohydrates. Legumes/beans provide a valuable and cost efficient source of protein,iron, some essential fatty acids, soluble and insoluble dietary fibre and micronutrients for all<strong>Australian</strong>s, but particularly for those consuming vegetarian meals [10].The health benefits of consuming diets high in vegetables, including legumes/beans, and fruit havebeen reported for decades and are consistently recognised in international dietary guidelines [36,37, 143, 144].2.2.2 The evidence for ‘plenty of vegetables’The scientific evidence of the health benefits of consuming vegetables (including legumes/beans)has been strong for several decades and has generally continued to strengthen over recent years,particularly the evidence for a protective effect against cardiovascular disease. Recent research onDRAFT <strong>Australian</strong> <strong>Dietary</strong> <strong>Guidelines</strong>- December 2011 32
vegetable intake and cancer has focused more on investigating the health effects of consumingdifferent subgroups of vegetables on site-specific cancers than the effect of total vegetable intake.There is strengthened evidence of the beneficial effects of intake of various non-starchy vegetablesin reducing risk of some site-specific cancers. High dietary intakes of starchy vegetables may helpexplain the weaker association between total vegetable intake and many site-specific cancers.There is also greater clarity on the quantity of vegetables to produce beneficial health effects, plusincreasing evidence of a protective effect against a number of chronic diseases for consumption ofvegetables and fruit when considered together (see Appendix 5).The evidence statements and gradings (A- convincing association, B- probable association, C-suggestive association) from the Evidence Report (literature from years 2002 – 2009) arepresented in the table below. This does not include evidence from other sources, such as the 2003<strong>Dietary</strong> <strong>Guidelines</strong> (where evidence was classified as level I, II or III in which individual studieswere classified according to their design but overall grades for relationships were not derived),although these sources have been used to inform the <strong>Guidelines</strong>.Evidence StatementConsumption of each additional daily serve of vegetables is associated with a reducedrisk of coronary heart disease.Consumption of vegetables is associated with reduced risk of stroke.Consumption of vegetables is associated with reduced risk of weight gainConsumption of vegetables is associated with a reduced risk of oral and nasopharyngealcancers.Consumption of preserved vegetables is associated with increased risk of oral andnasopharyngeal cancer.Consumption of 1-2 serves per day of tomato is associated with a reduced risk ofprostate cancer.Consumption of more than 1 serving per week of spinach is associated with reducedrisk of colorectal cancer.Consumption of cruciferous vegetables is associated with reduced risk of lung cancer.GradeBBCCCCCCAlthough serving sizes of vegetables differed between studies considered in the Evidence Report[14], Evidence Statements presented below are based on the <strong>Australian</strong> standard serve size of 75g.DRAFT <strong>Australian</strong> <strong>Dietary</strong> <strong>Guidelines</strong>- December 2011 33
2.2.2.1 Cardiovascular disease, type 2 diabetes and excess weightCardiovascular disease: It is probable that each additional daily serve of vegetables is associatedwith a reduced risk of coronary heart disease (Grade B, Section 2.1 in Evidence Report [14]) [145-150].It is probable that consumption of vegetables is associated with a reduced risk of stroke (Grade B,Section 2.4 in Evidence Report [14]) [151, 152]. The protective effect is stronger at higher intakes.Type 2 diabetes: Recent evidence suggests that consumption of vegetables does not appear to bedirectly associated with the risk of type 2 diabetes (Grade C, Section 2.3 in Evidence Report [14])[153-155]. This supports the inconsistent findings described in other studies for fruit andvegetables considered together and for fruit alone [154, 155]. However, as there is a strongrelationship between type 2 diabetes and body weight (see Chapter 4), the association betweenconsumption of vegetables and reduced risk of excessive weight gain (see below) suggests longertermstudies may be required to further investigate potential effects.Excess weight: Recent evidence suggests that consuming vegetables is associated with a reducedrisk of weight gain (Grade C, Section 2.2 in Evidence Report [14]) [156-160].2.2.2.2 CancerOral, nasopharyngeal and oesophageal: Evidence suggests that consuming vegetables isassociated with a reduced risk of oral and nasopharyngeal cancers (Grade C, Section 2.10 inEvidence Report [14]) [161-165]. This is consistent with the findings described by the WCRFreport [42]. However the evidence also suggests that consumption of preserved vegetables(salted, dried, fermented or pickled) is associated with increased risk of these cancers (Grade C,Section 2.10 in Evidence Report [14]) [161-165].It is unclear from recent studies whether there is an association between total vegetableconsumption and risk of other alimentary cancers, however relationships found previously [36, 37]still tend to be present when a longer time frame and different types of vegetables are considered(Section 2 in Evidence Report). Although recent evidence suggests that total consumption ofvegetables is not associated with reduced risk of oesophageal cancer (Grade C, Section 2.9 inEvidence Report [14]) [166-169], evidence from the WCRF report suggests that consumption ofnon-starchy vegetables probably reduces risk of cancer of the oesophagus [42].Prostate cancer: The evidence suggests that consumption of 1–2 serves of tomatoes a day isassociated with reduced risk of prostate cancer (Grade C, Section 2.13 in Evidence Report [14])[170, 171]. This is consistent with the probable relationship between intake of lycopene-containingfoods and reduced risk of prostate cancer described by the WCRF report [42].DRAFT <strong>Australian</strong> <strong>Dietary</strong> <strong>Guidelines</strong>- December 2011 34
Endometrial, Ovarian and pancreatic cancer: Previous dietary guidelines reported a possiblereduction in risk of endometrial and pancreatic cancer with vegetable consumption [37]. However,in more recent studies there is no evidence to suggest an association between total vegetableconsumption and ovarian (Grade C, Section 2.11 in Evidence Report [14]) [172, 173] orendometrial cancer (Grade C, Section 2.12 in Evidence Report [14]) [174-176]. However findingsfrom the WCRF report suggest decreased risk of both ovarian and endometrial cancer withconsumption of non-starchy vegetables specifically [42].Colorectal cancer: The evidence suggests no association between consumption of green leafy,cruciferous vegetables, or carrots, potatoes, beans or lentils and risk of colorectal cancer (GradeC, Section 2.15 in Evidence Report [14]) [177]. More specific studies suggest that consumption ofmore than one serving per week of spinach is associated with reduced risk of colorectal cancer(Grade C, Section 2.15 in Evidence Report [14]) [177] and evidence of a suggestive protectiveeffect of intake of non-starchy vegetables on colorectal cancer has been described by the WCRFreport [42].Lung cancer: Recent evidence [178] suggests consuming cruciferous vegetables is associated withreduced risk of lung cancer (Grade C, Section 2.14 in Evidence Report [14]). The World CancerResearch Fund report found evidence of a probable association with the reduced risk of lungcancer with consumption of vegetables containing carotenoids and also found evidence suggestingthat non-starchy vegetables were protective of lung cancer [42]. This supports the notion thatdifferent types of vegetables may have different effects which may help to explain conflicting resultsseen when all vegetables are grouped together in varying proportions in different studies.Other cancers: Recent evidence is limited and/or inconclusive for the association regardingvegetable consumption and gastric, breast, lung and colorectal cancers (Section 2.5, 2.6, 2.7 & 2.8in Evidence Report [14]).2.2.2.3 Other conditionsThe previous dietary guidelines included evidence of associations between the consumption ofvegetables and some aspects of eye health, including cataracts and macular degeneration of the eye[37]. Further evidence was not available from more recent studies [179].DRAFT <strong>Australian</strong> <strong>Dietary</strong> <strong>Guidelines</strong>- December 2011 35
2.2.3 The evidence for ‘plenty of legumes/beans’While evidence of the health benefits of consumption of legumes/beans appears to havestrengthened since the 2003 <strong>Dietary</strong> <strong>Guidelines</strong>, the recent research is dominated by studies intothe health benefits of soy foods and products rather than investigations into legumes per se 2 .The evidence statements and gradings (A- convincing association, B- probable association, C-suggestive association) from the Evidence Report (literature from years 2002 – 2009) arepresented in the table below. This does not include evidence from other sources, such as the 2003<strong>Dietary</strong> <strong>Guidelines</strong> (where evidence was classified as level I, II or III in which individual studieswere classified according to their design but overall grades for relationships were not derived),although these sources have been used to inform the <strong>Guidelines</strong>.Evidence StatementConsumption of soy foods is associated with reduced total cholesterol and LDLcholesterol.Consumption of legume foods is associated with reduced risk of colorectal cancer.GradeCCRecent evidence confirms a protective effect for consumption of legumes, and particularly soyfoods, against several risk factors and diseases. However more research is needed to determinethe quantities of legume/beans required to produce health benefits, long-term efficacy, and therelative effect of legume foods, including of soy-based foods themselves, as opposed to foodcomponents such as isoflavones.2.2.3.1 Cardiovascular disease, type 2 diabetes and excess weightCardiovascular disease: Recent evidence suggests that consumption of soy foods is associatedwith reduced total cholesterol and LDL cholesterol levels, as markers for coronary heart diseaserisk (Grade C, Section 7.4 in Evidence Report [14]) [180].Type 2 diabetes: No recent studies of the relationship between legumes/beans and type 2diabetes were identified [14].Excess weight: No recent studies of the relationship between legumes/beans and weight losswere identified [181-183].2The evidence presented here was reviewed with a focus on whole foods, and for this reason studies of soy isolatesare not reported.DRAFT <strong>Australian</strong> <strong>Dietary</strong> <strong>Guidelines</strong>- December 2011 36
2.2.3.2 CancerColorectal cancer: Evidence suggests that consuming legumes is associated with reduced risk ofcolorectal cancer (Grade C, Section 7.3 in Evidence Report [14]) [184-188]. However, in onestudy the effect was only significant for women [187], as also seen in the recent analysis of theEuropean Prospective Investigation into Cancer and Nutrition (EPIC) database [189]. However noevidence of an association between consumption of legumes and colorectal cancer was describedin the WCRF report [42].Other cancers: Recent evidence is limited and/or inconclusive for an association regardinglegume/bean consumption and breast or prostate cancer (Section 7.1 & 7.2 in Evidence Report[14]). An insufficient number of studies were available to form an evidence statement onlegume/bean consumption and gastric cancer. However the WCRF report found limited evidenceof a relationship between the consumption of legumes and a decreased risk of gastric cancer [42].2.2.3.3 Other conditionsRecent evidence is limited and/or inconclusive regarding an association between consumption ofsoy foods and bone fracture in post-menopausal women, cerebral and myocardial infarct, andmortality due to cardiovascular disease and high blood pressure.2.2.4 The evidence for ‘eat fruit’Evidence for the health advantages of including fruit in the diet has been strong for decades, buthas strengthened considerably recently, particularly for cardiovascular disease. There is alsoincreasing evidence of a protective effect against a number of chronic diseases for consumption ofvegetables and fruit when considered together (see Appendix 5). Protective effects are increasinglydescribed in quantitative terms, although different serve sizes have been used in different studies,which make comparison difficult, while findings about dose response are not always consistentacross studies.The evidence statements and gradings (A- convincing association, B- probable association, C-suggestive association) from the Evidence Report (literature from years 2002 – 2009) arepresented in the table below. This does not include evidence from other sources, such as the 2003<strong>Dietary</strong> <strong>Guidelines</strong> (where evidence was classified as level I, II or III in which individual studieswere classified according to their design but overall grades for relationships were not derived),although these sources have been used to inform the <strong>Guidelines</strong>.DRAFT <strong>Australian</strong> <strong>Dietary</strong> <strong>Guidelines</strong>- December 2011 37
Evidence StatementConsumption of each additional daily serve of fruit is associated with a reducedrisk of coronary heart disease.Consumption of at least 1.5 serves of fruit a day, ideally 2.5 or more is associatedwith reduced risk of stroke.Consumption of fruit is associated with a reduced risk of obesity and weight gain.Consumption of fruit is associated with a reduced risk of oral and nasopharyngealcancerGradeBBCCThe following studies relate primarily to whole fruit, although some included dried fruit and/orfruit juice in their definitions of fruit intake. The evidence regarding fruit juice and excess weight isincluded under drinks in Section 3.3.2.1. Although serving sizes differed between studies, theevidence statements presented below are based on standard serve sizes of 150g.2.2.4.1 Cardiovascular disease, type 2 diabetes and excess weightCardiovascular disease: It is probable that consumption of each additional daily serve of fruit isassociated with a reduced risk of coronary heart disease (Grade B, Section 1.1 in Evidence Report[14]) [145-147]. Increased protection of at least 7% was gained from each additional serve of fruitconsumed per day.It is probable that consuming at least one and a half serves of fruit a day, ideally two and a half ormore, is associated with a reduced risk of stroke (Grade B, Section 1.2 in Evidence Report [14])[151, 152].Type 2 diabetes: The recent evidence suggests that consumption of fruit is not associated withrisk of type 2 diabetes (Grade C, Section 1.4 in Evidence Report [14]). However, as there is astrong relationship between type 2 diabetes and body weight (see Chapter 4), the associationbetween consumption of fruit and reduced risk of excessive weight gain (see below) suggestslonger-term studies may be required to investigate potential effects.Excess weight: The recent body of evidence suggests that consumption of fruit is associated witha reduced risk of obesity and weight gain (Grade C, Section 1.3 in Evidence Report [14]) [156-160,190-193].DRAFT <strong>Australian</strong> <strong>Dietary</strong> <strong>Guidelines</strong>- December 2011 38
2.2.4.2 CancerAlimentary tract cancer: There is emerging evidence that fruit consumption is associated withreduced risk of several types of cancer along the alimentary tract. The recent body of evidencesuggests that consumption of fruit is associated with a reduced risk of oral and nasopharyngealcancer (Grade C, Section 1.10 in Evidence Report [14]) [161, 162, 164, 165, 194], consistent withfindings of a convincing effect on reduced risk of cancers of the mouth, pharynx and larynx and asuggestive effect on nasopharyngeal cancers described in the WCRF report [42].Breast cancer, ovarian cancer and endometrial cancer: Expanding on previous reports [37],recent evidence now suggests that consumption of fruit is not associated with risk of breastcancer (Grade C, Section 1.6 in Evidence Report [14]) [166, 195-199], ovarian cancer (Grade C,Section 1.11 in Evidence Report [14]) [172, 173] or endometrial cancer (Grade C, Section 1.12 inEvidence Report [14]) [174-176, 200].Colorectal cancer: Recent evidence suggests that consumption of fruit is not associated with riskof colorectal cancer (Grade C, Section 1.8 in Evidence Report [14]) [166, 177, 194, 199, 201-203].Further, there is limited evidence to suggest an association between the consumption of mostfruits by specific type and colorectal cancer (Section 1.14 in Evidence Report [14]) [177, 203],which expands on earlier studies by the WCRF [42].Other cancers: Recent evidence is limited and/or inconclusive for an association regarding fruitconsumption and gastric, lung, oespohageal and pancreatic cancers (Section 1.5, 1.7, 1.9 & 1.13 inEvidence Report [14]).2.2.5 How plenty of vegetables, including different typesand colours, and legumes/beans, and eating fruit mayimprove health outcomesVarious mechanisms may explain the different health benefits of diets high in vegetables,legumes/beans and fruit. These include potential synergies between the foods as well as the actionof specific components found at high levels in these foods, including vitamins and minerals, variousphytochemicals including carotenoids and bioflavonoids (such as anthocyanins and flavonols), aswell as dietary fibre and other specific characteristics of these foods such as low energy(kilojoules) density.DRAFT <strong>Australian</strong> <strong>Dietary</strong> <strong>Guidelines</strong>- December 2011 39
2.2.5.1 Cardiovascular disease, type 2 diabetes and excess weightmechanismsFood components with anti-oxidant activity including vitamins (vitamin C and E) andphytochemicals in these foods may reduce the risk of inflammation and haemostasis, and ofcholesterol becoming oxidised and deposited in blood vessels to form the atherogenous plaquesthat underlie many cardiovascular conditions [180, 204-206]. Several studies have shown thatconsumption of vitamin C is associated with reduced risk of cardiovascular disease and stroke,however, other studies have shown no protective effect [207] [9]. Vegetables and fruit are low insodium and saturated fat [10]. Plant foods including vegetables and fruit provide potassium andmagnesium, both of which have been linked to lower blood pressure [9]. Importantly, reviews ofthe effect of beta-carotene on coronary heart disease suggest that benefits may be related to thecomponents of the foods, various antioxidants and micronutrients in these foods or otherconfounding factors, rather than to the beta-carotene alone [208].Most fruit, vegetables and legumes have a low energy (kilojoule) density and high dietary fibre andwater content, providing a plausible mechanism for the association of consumption of these foodswith reduced risk of weight gain. Any effect is likely to be mediated through potentially increasingsatiety, and also through taking longer to chew, which leads to reducing total energy (kilojoule)intake [9, 10]. High dietary fibre intakes have been linked to lower rates of obesity, type 2 diabetesand cardiovascular disease, mainly through an effect on plasma cholesterol [9]. The majority ofvegetables are nutrient-dense and low in kilojoules - in particular, green, Brassica and other ‘salad’vegetables are relatively low in energy (kilojoules) [10]. However, starchy vegetables are lessnutrient-dense and are higher in kilojoules, but provide a rich source of complex carbohydrates[10].Diets high in fibre and specific complex carbohydrates such as non-starch polysaccharides havebeen used with modest success by people with type 2 diabetes attempting to lose weight. Thesmall effects seen in these experimental situations might relate to a satiating effect due to theprolongation of food absorption and a smoothing of the blood glucose response after meals [9].In the prevention and dietary control of type 2 diabetes, some vegetables are likely to be ofparticular value because of their low energy density and relatively high content of dietary fibre,although longer term studies may be required to demonstrate effects.Legumes are also believed to confer cardiovascular health benefits because they provide a valuablelow saturated fat source of protein as an alternative to meats, and because of their glycaemicproperties and phytoestrogen and isoflavone content [209, 210]. These reviews suggest theisoflavone in soy foods may have a role in cholesterol reduction, improved vascular health,preservation of bone-mineral density [209] and anti-oestrogenic, anti-proliferative, pro-apoptotic,anti-oxidative and anti-inflammatory processes [210]. However more research is needed todetermine the relative effect of legumes/beans and soy foods themselves as opposed to isoflavonesspecifically.DRAFT <strong>Australian</strong> <strong>Dietary</strong> <strong>Guidelines</strong>- December 2011 40
2.2.5.2 Cancer mechanismsThere is no dominant mechanism to explain the protective effect of vegetables, legumes/beans andfruit for some cancers, and this is complicated by the range of site-specific cancer mechanisms.Some risk factors for cancer, such as oxidising radiation, can operate primarily from childhood orearly adult life and antioxidants or other protective constituents of vegetables, includinglegumes/beans, and fruit may need to be consumed regularly from early life to be effective [211].Phytochemicals and several vitamins and minerals found in vegetables and fruit are thought toprotect against some cancers by a range of mechanisms. Vegtables in the green leafy and Brassicasubgroup are particularly high in folate [10] and inadequate amounts of folate are thought toincrease the risk of cancer by leading to a rise in homocysteine and megaloblastic changes in bonemarrow and other rapidly dividing tissues [9]. Poor folate status is thought to affect the inductionof DNA hypomethylation, increasing chromosomal fragility or diminishing DNA repair, as well asincreasing secondary choline deficiency, reducing killer cell surveillance, and increasing risk offaulty DNA synthesis and metabolism of cancer-causing viruses [9]. Some studies have suggestedthat folate, primarily from fruit and vegetables, may be more effective in reducing cancer riskamong those with habitual high alcohol intake [212, 213].Several studies have indicated that vitamin C (found in most fruit and vegetables but particularly incitrus fruit, capsicum and tomatoes) is protective against cancer, whereas others have not foundconvincing evidence of this [9]. Lycopenes found in tomatoes are thought to be protective ofprostate cancer, particularly when tomatoes are cooked in olive oil [42]. Carotenes foundpredominantly in orange, red and yellow fruit and vegetables are also thought to be associatedwith maintenance of immune function [9]. Dithiolthiones and isothiocyanates (found in Brassica orcruciferous vegetables) and allyl sulphides (found in Allium vegetables) have been shown tostimulate detoxification processes [37]. The anti-inflammatory action of other phytochemicals,such as flavonoids, is also thought to be important in reducing cancer risk [214]. Potatoes are notas rich in phytochemicals as other types of vegetables, and this may help explain the weakerassociation with decreased cancer risk and consumption of starchy vegetables compared withother vegetables [42]. There is increasing evidence that whole foods are more effective in reducingrisk of cancer than specific vitamin and mineral supplements, and that some supplements mayactually increase risk of cancer [215, 216].Localised contact with phytochemicals may be an important factor in the aetiology of epithelialcancers of the alimentary system (oral, oesophagus, stomach and bowel). Proposed protectivemechanisms include:• the reduced formation of cancer-promoting substances in the gastrointestinal tract due toantioxidant activity• the part played by phytochemicals and micronutrients in the detoxification of carcinogenicsubstances• functions relating to the containment and destruction of existing cancer cells by means of avariety of physiological processes and improved immunological activity against cancer cells[9, 217].DRAFT <strong>Australian</strong> <strong>Dietary</strong> <strong>Guidelines</strong>- December 2011 41
Vegetables and fruit also provide dietary fibre, the intake of which is thought to reduce the risk ofsome cancers [9]. However, although a probable decreased risk of colorectal cancer with intake offoods containing dietary fibre has been described in the WCRF report [42], only one [218] of thehuman trials has shown any benefits of high fibre intakes per se on colon cancer or on markers ofthe risk of colon cancer. It may be that the dietary fibre component of these foods is not solelyresponsible for any apparent protective effect [9].2.2.6 Practical considerations: <strong>Eat</strong> plenty of vegetables,including different types and colours, legumes/beans,and fruitConsuming at least five serves of vegetables per day (75g per serve) is recommended for<strong>Australian</strong> adults, while amounts recommended for children and adolescents depend on their ageand sex. The most recent dietary surveys [13, 44] show that consumption of vegetable andlegumes/beans in Australia is generally less than half that recommended for adults and children,and the mix of vegetables consumed also needs to be addressed. To meet the recommended foodgroup intakes, most adults should increase their total consumption of vegetables by more than30% [10]. A 30% increase in intake of green and Brassica vegetables, 140% in red- and orangecolouredvegetables and 90% in other vegetables would be optimal, while consumption of starchyvegetables needs to decrease by 40% [10]. Replacing potatoes with other vegetables wouldincrease the variety of vegetables consumed and provide additional health benefits.Consuming at least two serves of fruit per day (150g per serve) is recommended for adults, whileamounts recommended for children and adolescents depend on age and sex (see Table 2.1 and2.2). The most recent dietary surveys [13, 44] show that fruit consumption should approximatelydouble to meet recommended intakes [10].The <strong>Australian</strong> Guide to <strong>Health</strong>y <strong>Eat</strong>ing provides detailed information on the number of serves andserve sizes of vegetables, legumes/beans and fruit required for different population groups (seetables 2.1 & 2.2).DRAFT <strong>Australian</strong> <strong>Dietary</strong> <strong>Guidelines</strong>- December 2011 42
Table 2.1: Recommended number of serves of vegetables, legumes/beans and fruit per day ** Additional portions of the five food groups or discretionary choices are needed only by people who are taller or more active to meet additional energy requirements.Source; <strong>Australian</strong> Guide to <strong>Health</strong>y <strong>Eat</strong>ing [114]Table 2.2: Standard serve size equivalents for vegetables, legumes/beans and fruit* No added sugar^ Only to be used occasionally as a substitute for other foods in the groupSource; <strong>Australian</strong> Guide to <strong>Health</strong>y <strong>Eat</strong>ing [114]Vegetables and fruit should be stored and prepared properly to maintain nutrient status. Avoidovercooking and wash vegetables to remove microbes and surface debris. Peel or scrub rootvegetables (see Chapter 7). Tinned and/or frozen varieties, preferably without added sugar, salt orfat, are nutritious alternatives to raw produce.DRAFT <strong>Australian</strong> <strong>Dietary</strong> <strong>Guidelines</strong>- December 2011 43
2.2.6.1 Pregnant and breastfeeding womenFruit and vegetable consumption before and during pregnancy makes an important contribution tohealth outcomes for women and their children. Many women may need to increase their currentconsumption of these valuable foods as a prospective cohort study found that only about half ofpregnant women may be consuming the recommended amounts of fruits and vegetables [219].Pre-prepared or pre-packaged cut fruit and vegetables should be avoided due to risk of listeriosis[130, 220].2.2.6.2 InfantsPureed and mashed vegetables, including legumes/beans, and fruit are important in the diets ofinfants from around six months of age. Choices should be varied to ensure adequate energy(kilojoule) and nutrient intake.By 12 months of age, infants should be consuming a wide variety of foods consumed by the rest ofthe family, having progressed from pureed or mashed foods to foods that are chopped into smallpieces. Care should be taken early on to choose foods of a suitable texture. Hard pieces of foods,such as some raw vegetables and nuts, should be avoided as they can cause choking. A variety oftastes and textures may be more appealing. As with all foods, some vegetables may need to beintroduced more than 10 times before being accepted [221]. Whole fruit is preferable to fruitjuice due to its higher fibre content. Fruit juice is not suitable for infants under six months and likeany acidic drink, consumption requires care to avoid dental erosion [133, 222].2.2.6.3 Children and adolescentsThe recommended quantities of vegetables and fruit intakes for children and adolescents varydepending on their age and sex [10]. To meet the dietary recommendations, children andadolescents need to approximately double their overall vegetable consumption [10] and decreaseby one third their intake of potatoes. Current fruit intakes by 2-3 year olds are close to therecommended levels but need to increase proportionately with age.A wide variety of different coloured, textured and tasting vegetables and fruit, both fresh andcooked, should be offered frequently to toddlers and pre-schoolers. Parents and carers canprovide model behaviour by consuming a wide range of vegetables and fruit.Children and adolescents should be encouraged to select a wide variety of vegetables and fruit, atmeal times and between meals. In recent years, most <strong>Australian</strong> states have improved thenutritional quality of food supplied at schools through strategies incorporating a colour-codedsystem in which vegetables, including legumes/beans, and fruit are classified ‘green’ with therecommendation that children eat plenty [223-230]. Fruit can be ‘fast food’ to help satisfyDRAFT <strong>Australian</strong> <strong>Dietary</strong> <strong>Guidelines</strong>- December 2011 44
increasing appetites. Unless prescribed by a dietitian, special diets which restrict intake of any fruitor vegetables should be avoided for children and adolescents. The intake of energy (kilojoule)-dense hot fried potato chips as a snack or with meals should be limited.2.2.6.4 Older peopleAlthough most of the emphasis is on the value of dietary patterns rich in vegetables and fruitthroughout life, there is still benefit in adopting such habits later in life. In general, older adultstend to consumer higher intakes of fruit and vegetables than younger adults. Due to poordentition, softer textured or cooked vegetables and fruit may be preferable for some olderpeople. Tinned and/or frozen varieties, preferably without added sugar, salt or fat, are nutritiousalternatives to raw produce.2.2.6.5 Aboriginal and Torres Strait IslandersVery low intakes of vegetables and fruit have been described among Aboriginal and Torres StraitIslander groups in urban and rural communities [32, 135, 231, 232]. Availability of quality freshproduce can be a particular problem in many remote areas [10, 30]. Frozen and canned vegetablesand fruit, plus available traditional plant foods, can be useful in these areas.2.2.6.6 VegetariansAdvice regarding vegetables and legumes/beans applies to everyone, including vegetarians. Legumes(and also nuts and seeds) provide valuable sources of iron and other nutrients, including protein.In all vegetarian and plant-based diets and meals, legumes/beans play an important role. Somemore restrictive vegetarian diets can be adequate for adults, but may not be suitable for children.2.3 Grain (cereal) foods (mostly wholegrain)2.3.1 Setting the sceneFoods originating from grains (cereals) include those from wheat, oats, rice, barley, millet andcorn. They range from highly nutrient-dense wholegrain breads and grain (cereal) foods such asoats, to lower-nutrient dense white rice, white bread, pasta and noodles. Excluded are refinedgrain (cereal) food products with high levels of added sugar, fat and/or salt/sodium, such as cakes.Key nutrients in wholegrain foods include carbohydrate (starch), protein, dietary fibre, B groupvitamins, vitamin E, iron, zinc, magnesium and phosphorus. Other protective components areDRAFT <strong>Australian</strong> <strong>Dietary</strong> <strong>Guidelines</strong>- December 2011 45
fermentable carbohydrates, oligosaccharides, flavonoids, phenolics, phytoestrogens, lignans,protease inhibitors, saponins and selenium [36, 37]. In Australia it is mandatory for wheat flourused in bread making to be fortified with folic acid and thiamin, and for the salt used to be iodised[233].2.3.2 The evidence for ‘grain (cereal) foods’The evidence for the association of grain (cereal) foods (mostly wholegrain) with reduced risk ofcardiovascular disease, type 2 diabetes and excess weight gain has strengthened since the previousdietary guidelines.The literature is difficult to interpret because studies use varied definitions of ‘wholegrain’. FSANZapplies the term to products which uses every part of the grain including the outer layers, branand germ even if these parts are separated during processing and regardless of whether the grainis in one piece or milled into smaller pieces [234]. In this review, the most commonly useddefinition was found to be that of Jacobs et al. (1998) [235] who defined wholegrain foods as thosecontaining 25% or more of wholegrains, whereas some studies included bran cereals as part of thedefinition of wholegrain and others only examined certain types of grain (cereal) food such as oats.The evidence statements and gradings (A- convincing association, B- probable association, C-suggestive association) from the Evidence Report (literature from years 2002 – 2009) arepresented in the table below. This does not include evidence from other sources, such as the 2003<strong>Dietary</strong> <strong>Guidelines</strong> (where evidence was classified as level I, II or III in which individual studieswere classified according to their design but overall grades for relationships were not derived),although these sources have been used to inform the <strong>Guidelines</strong>.Evidence StatementConsumption of cereal foods (especially wholegrains and those with fibre from oatsor barley) is associated with a reduced risk of cardiovascular disease in adults.Consumption of 1-3 serves per day of wholegrain cereals is associated with areduced risk of cardiovascular diseaseConsumption of cereal foods (especially 3 serves a day of wholegrains) is associatedwith reduced risk of type 2 diabetesConsumption of 3-5 serves per day of cereal foods (mainly wholegrain) isassociated with a reduced risk of weight gainConsumption of 1-3 serves per day of cereals high in fibre is associated withreduced risk of colorectal cancer in adults.GradeBBBBCDRAFT <strong>Australian</strong> <strong>Dietary</strong> <strong>Guidelines</strong>- December 2011 46
2.3.2.1 Cardiovascular disease, type 2 diabetes and excess weightCardiovascular disease: There is evidence of a probable association between the consumption ofgrain (cereal) foods (especially wholegrains and those with fibre from oats or barley) and areduced risk of cardiovascular disease in adults (Grade B, Section 6.3 in Evidence Report [14])[236-252]. Almost all the high level trials were conducted with oats, with the evidence of beneficiallowering of levels of LDL and total cholesterol levels. The protective effect was noted withbetween 1–3 serves per day of wholegrain foods (predominantly oats).Type 2 diabetes: There is evidence of a probable association between the consumption of grain(cereal) foods (especially wholegrains) and reduced risk of type 2 diabetes (Grade B, Section 6.7 inEvidence Report [14]) [238, 251, 253-260]. The evidence supports three serves per day ofwholegrain foods conferring between 21-42% reduction in risk of type 2 diabetes.Excess weight: There is evidence of a probable association between consumption of 3–5 servesper day of grain (cereal) foods (mainly wholegrain) and reduced risk of weight gain (Grade B,Section 6.6 in Evidence Report [14]) [249, 261-270].2.3.2.2 CancerColorectal cancer: There is recent evidence suggesting that consumption of 1-3 serves of cerealshigh in dietary fibre per day is associated with reduced risk of colorectal cancer in adults (GradeC, Section 6.2 in Evidence Report [14]) [185, 271-275]. Although previously the WCRF reportnoted that the evidence was too limited to draw conclusions, it recently reviewed the evidenceand found it convincing that fibre-rich foods offer protection against colorectal cancer [42].Other cancers: Recent evidence is inconclusive for an association regarding the consumption ofgrain (cereal) foods and risk of other cancers in adults (Section 6.1 in Evidence Report [14]).2.3.3 How eating cereal (mostly wholegrain) foods mayimprove health outcomesMuch depends on which wholegrain is being considered [276]. <strong>For</strong> example, oat β-glucan bindswith bile acids, so the liver breaks down more cholesterol to maintain a supply of bile acids.Wheat does not contain these soluble fibres. Also, the slow rate of glucose delivery of oatsreduces the requirement for insulin [277]. The slower rate of absorption created by the presenceof dietary fibre from some grain (cereal) foods can also influence appetite. <strong>For</strong> example, oat β-glucan has been shown to have effects on postprandial cholecystokinin levels, decreased insulinresponse and extended subjective satiety in overweight adults [278]. Other sources of dietaryfibre, such as psyllium may act in a similar fashion. Grain (cereal) foods also contain starch that maybe resistant to digestion in the small intestine (resistant starch) and may help to provide a moreDRAFT <strong>Australian</strong> <strong>Dietary</strong> <strong>Guidelines</strong>- December 2011 47
protective environment in the colon, particularly in the context of meals [279]. Note that as somedegree of processing is applied to most grains (cereals) to aid digestion, the effects can besignificantly influenced by the technology applied in processing and cooking [280].Because wholegrains contain more nutrients and phytochemicals, concentrated in the bran andgerm [281], they are likely to have greater effects than refined grains (cereals). Wholegrainscontain phenolic compounds with strong anti-oxidant capacity which may be protective againstprocesses involved in the pathology of diabetes, cardiovascular disease and cancer [282]. Choosingwholegrain options may also assist with satiety and help in not over consuming food beyondenergy (kilojoule) requirements.The previous dietary guidelines discussed the glycaemic index (GI) of a food as a physiologicallybased classification of carbohydrate-containing foods according to their potential to raise bloodglucose. Various factors may affect the GI value of a food, among them the particle size of milledgrains, the ratio of amylose to amylopectin, the degree of starch gelatinisation and the presence ofother food components such as viscous soluble fibres, fat, protein and organic acids which maylimit practical application. Lower GI diets may assist in the management of diabetes [37]. Furtherresearch on GI and health outcomes may be required to investigate other potential associations.The previous guidelines also noted that consumption of dietary fibre assists in maintaining thehealth and function of the digestive system, for example in preventing constipation [36, 37].2.3.4 Practical considerations: <strong>Eat</strong> grain (cereal) foods,mostly wholegrainConsuming at least 4–6 serves of grain (cereal) foods per day is recommended for <strong>Australian</strong>adults, while the amount recommended for children and adolescents depends on their age and sex(see table 2.3 below), ranging from four serves a day for 2–8 year olds to seven a day for olderadolescents. The amount of different grain (cereal) foods which comprise a serve is outlined in the<strong>Australian</strong> Guide to <strong>Health</strong>y <strong>Eat</strong>ing. One slice of bread, or half a medium roll or flat bread (about40g), is equivalent to 1/2 cup of cooked rice, pasta, noodles, 2/3 cup of breakfast cereal flakes(30g) or one quarter of a cup of muesli (30g).The <strong>Australian</strong> Guide to <strong>Health</strong>y <strong>Eat</strong>ing provides detailed information on the number of serves andserve sizes of grain (cereal) mostly wholegrain foods required for different population groups (seetables 2.3 and 2.4).DRAFT <strong>Australian</strong> <strong>Dietary</strong> <strong>Guidelines</strong>- December 2011 48
Table 2.3: Recommended number of serves of grain (cereal) mostly wholegrain foods per day ** Additional portions of the five food groups or discretionary choices are needed only by people who are taller or more active to meet additional energy requirements.Source; <strong>Australian</strong> Guide to <strong>Health</strong>y <strong>Eat</strong>ing [114]Table 2.4: Standard serve size equivalents for grain (cereal) mostly wholegrain foodsSource; <strong>Australian</strong> Guide to <strong>Health</strong>y <strong>Eat</strong>ing [114]To meet recommended food group intakes [10] adults would require a 30% increase in grain(cereal) foods, comprising a 160% increase in current wholegrain consumption and a 30% decreasein refined grain (cereal) food consumption. <strong>For</strong> children over the age of 4 years, 20–60% morewholegrain foods and 10–30% less refined cereal foods would be required to meet recommendedintakes [10]. Refined grain (cereal) food products with high levels of added sugar, fat and/or salt,such as cakes and biscuits, are classified as discretionary foods and are not included in the grainrecommendation. While these can be included in small amounts in Total Diets with higher energy(kilojoules) allowances, for the <strong>Australian</strong> population as a whole their intake would need to bereduced substantially.The suite of models which informed the update of the <strong>Australian</strong> Guide to <strong>Health</strong>y <strong>Eat</strong>ing [10] allowsfor variation in choice and amount of grain (cereal) foods to accommodate a range of cuisines. ADRAFT <strong>Australian</strong> <strong>Dietary</strong> <strong>Guidelines</strong>- December 2011 49
variety of grain (cereal) food choices allow for different forms of dietary fibre and complexcarbohydrates. Reading the labels on processed grain (cereal) foods such as rice and pasta isimportant to check that added sodium, sugar and/or fat (in particular saturated fat) are kept to aminimum.2.3.4.1 Pregnant and breastfeeding womenAs periconceptional folic acid intake helps protect against neural tube defects in the developingfoetus [283], the mandatory fortification of flour used for breadmaking in Australia with folic acid[284] provides an additional reason for women of reproductive age to consume bread. However,for women planning a pregnancy and during the first three months of pregnancy, a daily folic acidsupplement (0.4 mg) is recommended in addition to eating foods which are naturally rich in folateor are fortified with folic acid [285, 286].Pregnant and breastfeeding women have increased iodine requirements. As most leavened breadin Australia is made with iodised salt, this contributes to total iodine intake. However, this doesnot replace the need for iodine supplements (150 mcg/day) for women planning a pregnancy,throughout pregnancy and while breastfeeding [103].2.3.4.2 InfantsCereal should be one of the first foods offered to infants at around six months of age. Ironenrichedinfant cereals are recommended at this stage.2.3.4.3 Older peopleA high intake of wholegrain forms of grain (cereal) foods may not be well tolerated if there is aproblem with dentition. Softer varieties such as finely milled wholemeal bread and/or other fibreenrichedfoods may be suitable.2.3.4.4 VegetariansWholegrain foods are particularly important in vegetarian diets as a source of iron and zinc.DRAFT <strong>Australian</strong> <strong>Dietary</strong> <strong>Guidelines</strong>- December 2011 50
2.4 Lean meat and poultry, fish, eggs, nuts andseeds, and legumes/beans2.4.1 Setting the sceneLean meats and poultry, fish, eggs and plant-based alternatives such as legumes/beans, nuts andseeds are an important component of <strong>Australian</strong> cuisine, culture and lifestyle. The ‘lean meat andalternatives’ food group is diverse, both nutritionally and biologically. The foods in this group havetraditionally been seen as ‘protein-rich’, but they also provide a wide variety of other nutrientswhich may be more important in the typical high-protein <strong>Australian</strong> diet. Important nutrientsinclude iodine, iron, zinc, vitamins, especially B12, and essential fatty acids including long chainomega-3 fatty acids. All seafood contains long chain omega-3s. Grass-fed meats, poultry and someeggs are also sources of these essential fatty acids. Evidence of the health benefits of lean meatsand alternatives is consistently recognised in international dietary guidelines [36, 37, 143, 144].Processed and cured meats can be high in added salt and saturated fat and are not recommendedas substitutes for unprocessed meat. Moderate amounts of lean poultry and eggs can be includedin the diet within the overall recommended quantities for this whole food group. Eggs are analternative to meat, a relatively inexpensive source of protein and are versatile foods. Note thatalthough pork is not considered red meat for marketing purposes in Australia, it is classified as redmeat in the international literature, and so has been considered as red meat for the purpose of the<strong>Guidelines</strong> [10].Fish and other seafood are central foods in the cuisines of many traditional cultural and religiousgroups, and are popular foods in <strong>Australian</strong> society. Fish is nutritious, providing energy (kilojoules),protein, selenium, zinc, iodine, vitamins A and D (some species only), and long-chain omega-3 fattyacids. Evidence of the health benefits of fish consumption is consistently recognised in internationaldietary guidelines [36, 37, 143, 144].Nuts and seeds are rich in energy (kilojoules) and nutrients, reflective of their biological role innourishing plant embryos to develop into plants. In addition to protein and dietary fibre, theycontain significant levels of unsaturated fat, although this varies within the category. Nuts are alsorich in polyphenols and micronutrients, including folate, several valuable forms of vitamin E,selenium, magnesium and other minerals. They are useful alternatives to meat, fish and eggs, andare particularly important in plant-based, vegetarian and vegan meals and diets.Legumes/beans, including lentils, tofu and tempe, provide a valuable and cost efficient source ofprotein, iron, some essential fatty acids, soluble and insoluble dietary fibre and micronutrients.They are valuable inclusions in the diet, and are especially useful for people who consume plantbasedor vegetarian diets or meals [10].DRAFT <strong>Australian</strong> <strong>Dietary</strong> <strong>Guidelines</strong>- December 2011 51
2.4.2 The evidence for ‘lean meat and poultry, fish, eggs,nuts and seeds, and legumes/beans’In the following studies, serve sizes of the different foods are as included in the <strong>Australian</strong> Guide to<strong>Health</strong>y <strong>Eat</strong>ing (see also Section 2.4.4, table 2.5).The evidence statements and gradings (A- convincing association, B- probable association, C-suggestive association) from the Evidence Report (literature from years 2002 – 2009) arepresented in the table below. This does not include evidence from other sources, such as the 2003<strong>Dietary</strong> <strong>Guidelines</strong> (where evidence was classified as level I, II or III in which individual studieswere classified according to their design but overall grades for relationships were not derived),although these sources have been used to inform the <strong>Guidelines</strong>.Evidence StatementConsumption of greater than100-120g/d red meat is associated with an increasedrisk of colorectal cancer.Consumption of fish more than once per week is associated with a reduced risk ofdeveloping dementia in older adults.Consumption of red meat is associated with risk of renal cancer.Consumption of at least 2 serves a week of fish is associated with reduced risk ofmortality from cardiovascular disease, and with reduced incidence of cardiovasculardisease.Consumption of fish at least twice a week is associated with a reduced risk ofstroke.Consumption of fish 2 or more times per week is associated with reduced risk ofage-related macular degeneration.Consumption of nuts (65-110 g per day) reduces cholesterol levels.GradeBBCCCCC2.4.2.1 Lean meatPast literature reporting on the health benefits and/or risks of consuming meat has beenpredominantly based on studies investigating the nutrient effects related to (for example) iron,protein or zinc in isolation [37] or the ability of the body to absorb nutrients rather than lookingat the whole food. Since 2003, the evidence linking meat consumption and increased risk ofdisease has strengthened in some areas and remains unclear in others. The evidence is difficult toDRAFT <strong>Australian</strong> <strong>Dietary</strong> <strong>Guidelines</strong>- December 2011 52
interpret because of widely varying definitions of ‘meat’. Some studies include only unprocessedred meat. Others may include some or all of a variety of processed meats, including smoked,salted and chemically preserved foods, with meat within dishes such as pizza, lasagna or casserolesvariously included or excluded. The poor definitions partly explain the often inconsistent findingsin relation to health effects, with several large cohort studies and some Asian studies failing toadequately disaggregate possibly different effects of unprocessed red meat and processed meats. Inparticular, the definition of red meat varies greatly between studies.2.4.2.1.1 Lean meat: Cardiovascular disease, type 2 diabetes and excess weightAn insufficient number of recent studies investigating the relationships between consumption ofmeat and cardiovascular disease, type 2 diabetes and excess weight were identified in theliterature review to develop evidence statements [14]. A large cohort trial that found modestincreases in total mortality, cardiovascular mortality and cancer mortality with red and processedmeat intakes [287] was not included due to lack of clarity over the inclusion of processed meats,liver and sausages with unprocessed red meat.2.4.2.1.2 Lean meat: CancerColorectal cancer: There is evidence of a probable association between consumption of red meatand increased risk of colorectal cancer (Grade B, Section 4.7 in Evidence Report [14]) [42, 288-296]. The WCRF reported a convincing relationship between red and processed meat andincreased risk of colorectal cancer [42]. Several studies from Asian countries showed no increasedrisk of colorectal cancer associated with low intakes of red meat such as 27g per day [294] and42g per day [292].Renal cancer: The evidence suggests that consumption of red meat is associated with an increasedrisk of renal cancer (Grade C, Section 4.6 in Evidence Report [14]).Bladder and prostate cancer: The evidence suggests that consumption of red meat one to sixtimes per week is not associated with risk of bladder cancer (Grade C, Section 4.1 in EvidenceReport [14]) [42, 297, 298]. The evidence suggests that consumption of red meat is not associatedwith risk of prostate cancer (Grade C, Section 4.3 in Evidence Report [14]) [42, 299, 300].Pancreatic cancer: A review of the current evidence suggests that consumption of 30-200 gramsof red meat per day is not associated with risk of pancreatic cancer (Grade C, Section 4.2 inEvidence Report [14]) [42, 301].Other cancers: Recent evidence is inconclusive for an association regarding the consumption ofred meat and breast and lung cancer (Section 4.4, & 4.5 in Evidence Report [14]).DRAFT <strong>Australian</strong> <strong>Dietary</strong> <strong>Guidelines</strong>- December 2011 53
Given these risks, advice is provided on how much meat can be eaten to maximize the healthbenefits of consuming meat, while minimizing the health risks- see Section 2.4.4.2.4.2.2 Lean poultry2.4.2.2.1 Lean poultry: Cardiovascular disease, type 2 diabetes and excess weightAn insufficient number of recent studies investigating the relationships between consumption ofpoultry and cardiovascular disease, type 2 diabetes and excess weight were identified in theliterature review to develop evidence statements [14].2.4.2.2.2 Lean poultry: CancerRecent evidence examining an association between poultry consumption and breast or colorectalcancer is inconclusive (Section 10.1 & 10.2 in Evidence Report [14]).2.4.2.3 FishThe evidence regarding the health benefits of fish has strengthened since 2002. People whoregularly consume diets high in fish tend to have lower risks of a range of conditions, includingcardiovascular disease, stroke, and macular degeneration, and dementia in older adults.Early literature focused on evidence indicating that fish oils (and in particular long chain omega-3fatty acids) provided specific health benefits for brain development and function and cardiovascularhealth, and extrapolated this to fish as the predominant food containing these fatty acids [37].Recent research continues to be dominated by pharmacological studies of the effects of nutrientsderived from fish, particularly delivered in fish oils. The evidence obtained from the literatureconsiders relationships with the consumption of fish per se, so studies of fish oil or omega-3supplements are not reported in the evidence statements below. However, the overall chapterexamines evidence relating to omega-3 fats, bearing in mind that these fats can also be delivered infoods other than fish.The evidence provided below for health benefits relates consistently to fish in the form of finfishfrom marine or freshwater sources, either farmed or wild. Few studies have investigated theeffects of other types of seafood. As for red meat, the distinction between different preparationmethods and different fish types is not always well addressed in the literature and may contributeto a lack of consistency in some instances.DRAFT <strong>Australian</strong> <strong>Dietary</strong> <strong>Guidelines</strong>- December 2011 54
2.4.2.3.1 Fish: Cardiovascular disease, type 2 diabetes and excess weightCardiovascular disease: Evidence suggests that consuming at least two serves of fish per week isassociated with reduced incidence of cardiovascular disease (particularly myocardial infarction)(Grade C, Section 9.1 in Evidence Report [14]) [302-305] and with reduced risk of mortality fromcardiovascular disease (Grade C, Section 9.1 in Evidence Report [14]) [302, 304, 306-313].The evidence suggests that consumption of fish at least twice a week is associated with a reducedrisk of stroke (Grade C, Section 9.5 in Evidence Report [14]) [305, 314-316].Only a small number of case-control and cohort studies are available, with inconsistent results, toexamine the relationship between fish consumption and the incidence of cardiac arrest, heartfailure, atrial fibrillation and high blood lipids.2.4.2.3.2 Fish: CancerEvidence of an association between fish consumption and breast, colorectal, prostate and renalcancer was examined however no conclusive associations could be drawn (Section 9.6, 9.7, 9.8 &9.9 in Evidence Report).2.4.2.3.3 Fish: Other conditionsDementia: The recent body of evidence demonstrates that it is probable that the consumption offish more than once per week is associated with a reduced risk of developing dementia in olderadults (Grade B, Section 9.2 in Evidence Report [14]) [303, 317-324].Depression: The recent evidence suggests that consumption of at least one serve of fish per weekis not associated with reduced risk of depression (Grade C, Section 9.3 in Evidence Report [14])[325-329].Macular degeneration: The recent evidence suggests that eating fish two or more times a week isassociated with reduced risk of age-related macular degeneration (Grade C, Section 9.4 inEvidence Report [14]) [330].2.4.2.4 EggsSince 2003 the evidence associating egg consumption with health outcomes has not changedgreatly (Section 11 in Evidence Report [14]). There do not appear to be any increased health risksassociated with consumption of eggs [331-333]. There is recent evidence which suggests thatconsumption of eggs every day is not associated with increased risk of coronary heart disease(Grade C, Section 11.1 in Evidence Report [14]) [248, 334-351].DRAFT <strong>Australian</strong> <strong>Dietary</strong> <strong>Guidelines</strong>- December 2011 55
2.4.2.5 Nuts and seedsConsumption of nuts and seeds may help reduce the risk of heart disease and is not associatedwith weight gain if total energy (kilojoule) intake is controlled. Since the previous dietaryguidelines, the evidence for the benefits of consumption of nuts and seeds on heart disease hasbeen shown to be related to favourable effects on serum cholesterol. The evidence on lack ofassociation with weight gain is a new development.2.4.2.5.1 Nuts and Seeds: Cardiovascular disease, type 2 diabetes and excessweightCardiovascular disease: Evidence suggests that consumption of nuts (65–110g per day) isassociated with a reduction in serum cholesterol, a surrogate marker for cardiovascular disease(Grade C, Section 8.2 in Evidence Report [14]) [352-356].Excess weight: Evidence suggests that the consumption of nuts (65–110g per day) does not leadto weight gain, at least in the short term (Grade C, Section 8.1 in Evidence Report [14]) [353-358].2.4.2.5.2 Nuts and Seeds: CancerNo recent studies investigating the association of consumption of nuts and seeds were identified[14].2.4.2.6 Legumes/beansFew studies on legumes/bean foods, other than soy foods, were identified in the literature reviewto inform the review of these dietary guidelines. <strong>For</strong> the evidence regarding legumes/beans, seeSection 7 in the Evidence Report [14].2.4.3 How eating lean meat and poultry, fish, eggs, nutsand seeds, and legumes/beans may improve healthoutcomesThis is such a broad and diverse group of foods that a variety of possible mechanisms mayinfluence the effects of their consumption.DRAFT <strong>Australian</strong> <strong>Dietary</strong> <strong>Guidelines</strong>- December 2011 56
Smoked, salted and chemically preserved foods have properties that may be responsible forincreased health risks. Endogenous formation of nitrous compounds has been suggested as apossible link between red meat and colorectal cancer [359], but this remains a hypothesis. As withother areas of diet and disease risk, an individual’s dietary pattern may be more relevant than adirect effect from a single component [360, 361].It has been suggested that haem iron or other components of meat such as saturated fats, orother dietary and lifestyle factors associated with meat intake, may be relevant factors for furtherstudy [362]. Previous evidence related to saturated fat in red meat and increased risk ofcardiovascular disease may not be relevant for lean <strong>Australian</strong> meats.The protective effect of fish consumption on cardiovascular disease is thought to be mediatedthrough the influence of specific nutrients such as long-chain n-3 fatty acids. These essential fattyacids exert their physiological effect by altering cell membrane composition, fluidity, receptors andmembrane-bound enzymes, gene expression and eicosanoid production (see Chapter 3).Nut consumption provides benefits by enhancing anti-inflammatory processes [363] and loweringserum cholesterol possibly due to the presence of phytosterols, which reduce cholesterol reabsorption[364], and/or the effects of shifting dietary fat quality, notably replacing saturated withunsaturated fat. Nut consumption is also associated with increased levels of adiponectin which hasanti-inflammatory and anti-atherogenic properties [365]. Early work suggests that the delivery ofcomponents such as tocopherols and phenolic acids may help to reduce lipid peroxidation andoxidative DNA damage, and there is some indication that walnuts with a relatively high content ofthe amino acid L-arginine may have an effect on vasodilation through nitrous oxide pathways[363]. Proposed mechanisms for effects on weight control include increased satiety, increasedfaecal fat excretion, increased thermogenesis [366] and increased fat oxidation [367].2.4.4 Practical considerations: Lean meat and poultry,fish, eggs, legumes/beans and nuts/seedsThe most recent dietary survey data for adults in Australia showed that daily mean consumptionof meat, poultry and game was 200g for men and 120g for women [44]. Adult men and womendaily consume 99g and 54g of red meat respectively [44].The recommended consumption of lean meat and poultry, fish, eggs and/or alternatives for bothchildren and adults is 1–3 serves a day depending on age. During pregnancy, 3–4 serves a day arerecommended to provide additional iron and zinc.To enhance dietary variety and reduce some of the health risks associated with consuming meat,up to a maximum of 455g per week (1 serve or 65g per day) of lean meat is recommended for<strong>Australian</strong> adults.DRAFT <strong>Australian</strong> <strong>Dietary</strong> <strong>Guidelines</strong>- December 2011 57
The <strong>Australian</strong> Guide to <strong>Health</strong>y <strong>Eat</strong>ing provides detailed information on the number of serves andserve sizes of lean meat, poultry, fish, eggs, legumes/beans and nuts/seeds required for differentpopulation groups (see tables 4.5 & 4.6).Table 2.5: Recommended number of serves of lean meat, poultry, fish, eggs, legumes/beansand nuts/seeds per day ** Additional portions of the five food groups or discretionary choices are needed only by people who are taller or more active to meet additional energy requirements.Source; <strong>Australian</strong> Guide to <strong>Health</strong>y <strong>Eat</strong>ing [114]Table 2.6: Standard serve size equivalents for lean meat, poultry, fish, eggs, legumes/beansand nuts/seeds^ Only to be used occasionally as a substitute for other foods in the groupSource; <strong>Australian</strong> Guide to <strong>Health</strong>y <strong>Eat</strong>ing [114]To meet recommended intakes, omnivorous adults in Australia would need to consume 40% more‘poultry, fish, seafood and eggs or legumes/beans, nuts or seeds’ but omnivorous men would needto consume around 20% less red meat than currently [10]. <strong>For</strong> children 2–16 years of age, around30–85% more ‘poultry, fish, seafood and eggs or legumes/beans, nuts or seeds’ and around 25–70%more red meat would be required above current intakes to meet recommendations. Exactquantities depend on age and sex [10].DRAFT <strong>Australian</strong> <strong>Dietary</strong> <strong>Guidelines</strong>- December 2011 58
Depending on age and sex, health benefits may be seen with consumption of 1.4–2.8 serves of fishper week (140–280g per week) for adults, with proportionately less for adolescents and children.The most recent dietary survey data available for adults showed that mean weekly consumption offish and seafood was 168g for men and 119g per week for women (ABS 1999 [44] cited inNHMRC 2011 [10]). To meet recommended food group intakes, fish consumption will need toincrease by more than 40%, particularly for men [10]. The extent to which <strong>Australian</strong> fishpopulations are sufficient to meet the guideline advice needs consideration. The previous dietaryguidelines note that inclusion of around 2-3 serves of fish per week may not be attainable orsustainable depending on population levels [37]. Information from the Department of Agriculture,Fisheries and <strong>For</strong>estry shows that Australia has become a net importer of fish products over thepast decade, and several industry initiatives have now been developed to address the sustainabilityof fish stocks in Australia [368].Previous reported intakes of nuts and seeds in Australia have been very low (only around 4g perday for adults) [44]. Consumption may have risen since. The dietary models developed for theseguidelines include modest amounts of nuts and seeds. However, because intakes have been low,this would require tripling the intake for children over 8 years of age and increasing adult intakessubstantially, even in omnivore Foundation Diet models [10].Nuts and seeds can be included in the diet in a variety of ways, including as snacks, in dishes (forexample, added to salads, vegetables, various main course dishes and breakfast cereals) and in foodproducts such as breads and spreads.2.4.4.1 Pregnant and breastfeeding womenLean red meat is a good source of protein, iron and zinc for pregnant and breastfeeding women,although raw or undercooked meat, chilled pre-cooked meats, and pate and meat spreads are bestavoided due to risk of listeriosis (see Chapter 7) [130, 220]. While meat is a good source of iron,iron deficiency in pregnancy is common in Australia and iron supplements may be needed.Pregnant women should check with their doctor.Maternal consumption of fish during pregnancy is likely to have a number of health benefits forwomen and their children. However the fish should be low in mercury. FSANZ provides guidancefor pregnant women on suggested amounts and frequency of consumption of particular fishspecies [131, 284]. Pregnant women are advised to consume no more than one serve (150g) perfortnight of shark, marlin or broadbill/swordfish, and no other fish that fortnight, or one serve(150g) per week of orange roughy (deep sea perch) and no other fish that week [130, 131].Pregnant women should avoid eating foods containing raw eggs, because of risk of salmonella[220].DRAFT <strong>Australian</strong> <strong>Dietary</strong> <strong>Guidelines</strong>- December 2011 59
Pregnant and breastfeeding women do not need to avoid consuming nuts for fear of causing anallergic reaction in their babies. Only women who are allergic to these foods themselves need toavoid them [362, 369-372].2.4.4.2 InfantsFoods from the meats and alternatives group are important in the diets of infants over the age ofaround six months. In particular, this group of foods helps meet infants’ increased needs for iron,zinc and protein. The food should be initially pureed before serving. <strong>For</strong> all infants, special care isrequired to adequately de-bone fish.Previously nuts were often restricted for infants and children because of the risk of inducingallergy. However this has not been proven in nutrition studies. The texture should be suitable (forexample, peanut butter/paste). Only children over three years should be offered whole nuts dueto the risk of choking.2.4.4.3 Children and adolescentsThe demands of growth increase the need for iron, protein and many nutrients found in this foodgroup.2.4.4.4 Women of child-bearing ageMenstrual loss doubles the iron requirements of young women compared to young men [37],although that increased requirement is lessened for women taking the oral contraceptive pill. Leanmeat and some types of seafood are excellent sources of iron [10].2.4.4.5 Older peopleLean meat and poultry, fish, eggs, legumes/beans and nuts and seeds are nourishing foods for olderadults and should be included in the diet as a ready source of protein to help maintain musclemass [10]. People with poor dentition should be advised to choose forms of food that are easierto eat, such as softer foods, soups and casseroles.Whole nuts may not be well tolerated where there is a problem with dentition. In these cases, theinclusion of ground nuts, nut pastes or nut meal in dishes may be more appropriate.DRAFT <strong>Australian</strong> <strong>Dietary</strong> <strong>Guidelines</strong>- December 2011 60
2.4.4.6 Vegetarians<strong>For</strong> several nutrients, including iron, calcium and vitamin B12, animal foods are highly bioavailablesources and care needs to be taken if these foods are excluded. Eggs and milk, yoghurt and cheeseproducts can supply calcium and vitamin B 12 in lacto-ovo vegetarian diets.<strong>For</strong> lacto-ovo vegetarian diets, the Modelling System used a ratio of a 5:1:1 ‘legume: egg:nuts/seeds’ mixed food group. As comparable data was not available for Australia, this was basedon the United States Department of Agriculture (USDA) recommendations for proportions ofthese foods that would provide an adequate amino acid balance [10]. As no <strong>Australian</strong> nationaldata were available about choices within food categories for lacto-ovo vegetarians, the sameproportions within food groups (for example, for vegetables, fruit, cereals) were used as for theequivalent omnivore group. <strong>For</strong> children consuming vegetarian diets, it should be noted that ironwas limiting in the diets as modelled [10].Nuts and seeds (and legumes/beans) are important foods in vegetarian dietary patterns and mealswithout meat as they can help provide an alternative source of nutrients. <strong>For</strong> lacto-ovo vegetariandiets, refer to the Food Modelling document [10].2.4.4.7 Food safetyFish that have been exposed to heavy metals, dioxins and dioxin-like polychlorinated biphenyls(PCBs) from industrial pollution of marine and freshwater environments can present atoxicological food safety risk to human biological systems if consumed in sufficiently large amounts.Although fish caught in specific locations could lead to high human exposure - for example, west ofthe Sydney Harbour Bridge [373] - exposure in Australia generally is low [374]. The FAO andWHO held an expert consultation on this issue and concluded in general that the disadvantages offoregone health benefits from fish consumption outweigh the risks of increased exposure to heavymetals, dioxins and PCBs, although it was acknowledged that close monitoring and evaluation ofthe fish supply and dietary exposure is needed [375].2.5 Milk, yoghurt, cheese and/or alternatives(mostly reduced fat)2.5.1 Setting the sceneIn past dietary guidelines these foods have been referred to as dairy foods, but greater specificity isrequired to reflect definitions in the relevant literature (for example butter, cream and ice-creamare not included). Milks, cheeses and yoghurts are most frequently produced from cow’s milk inDRAFT <strong>Australian</strong> <strong>Dietary</strong> <strong>Guidelines</strong>- December 2011 61
Australia, but other sources include milk and products from goats, sheep and soy and variouscereals. Milk substitutes that are not fortified with calcium and other nutrients are not included inthis food group.Milk, cheese and yoghurt are a good source of many nutrients, including calcium, protein, iodine,vitamin A, vitamin D, riboflavin, vitamin B12 and zinc. These foods provide calcium in a readilyabsorbable and convenient form. The proportion of total fat and saturated fat content in somemilk, cheese and yoghurts has led to the recommendation that reduced fat varieties should bechosen on most occasions [10]. However reduced fat varieties of milks are not suitable as a milkdrink for children under the age of two due to energy requirements for growth.Alternatives to milk, cheese and yoghurt include calcium-enriched legume/bean milk products suchas calcium enriched soy drinks. Information about legumes/beans is included with vegetables andmeat and alternative groups above.2.5.2 The evidence for ‘milk, yoghurt, cheese and/oralternatives’The evidence for the health benefits of consumption of these dairy foods (mainly reduced fatvarieties) has strengthened since the previous <strong>Dietary</strong> <strong>Guidelines</strong> [37], however the evidence baseprimarily comprises small, short term studies with varied definitions of dairy foods. The evidencefor the relationship between foods containing calcium and increased bone density in postmenopausalwomen was not re-examined because it was regarded as an accepted relationship[37].The evidence statements and gradings (A- convincing association, B- probable association, C-suggestive association) from the Evidence Report (literature from years 2002 – 2009) arepresented in the table below. This does not include evidence from other sources, such as the 2003<strong>Dietary</strong> <strong>Guidelines</strong> (where evidence was classified as level I, II or III in which individual studieswere classified according to their design but overall grades for relationships were not derived),although these sources have been used to inform the <strong>Guidelines</strong>.Evidence StatementConsumption of at least 2 servings per day dairy foods (milk, yoghurt, and cheese) isassociated with reduced risk of ischemic heart disease and myocardial infarction.Consumption of 2 or more servings of dairy foods per day is associated withreduced risk of stroke.Consumption of 3 servings of low fat dairy foods is associated with reduced risk ofhypertensionGradeBBBDRAFT <strong>Australian</strong> <strong>Dietary</strong> <strong>Guidelines</strong>- December 2011 62
Evidence StatementConsumption of more than 1 serving of dairy per day, especially milk, is associatedwith a reduced risk of colorectal cancer.Consumption of 3 or more servings of milk per day is not associated with risk ofrenal cell cancer.Consumption of 3 servings of any milk, cheese or yoghurt products a day isassociated with reduced risk of hypertensionConsumption of 2-4 serves of dairy foods per day is associated with reduced risk ofmetabolic syndromeConsumption of at least 1.5 servings of dairy foods (milk, yoghurt, cheese) per day isassociated with reduced risk of type 2 diabetes.Consumption of more than 1 serving of milk per day is associated with reduced riskof rectal cancer.Consumption of dairy products (particularly milk) is associated with improved bonemineral densityGradeBBCCCCC2.5.2.1 Cardiovascular disease, type 2 diabetes and excess weightCardiovascular disease: It is probable that the consumption of at least two servings per day ofdairy foods (milk, cheese and yoghurt) is associated with reduced risk of ischemic heart diseaseand myocardial infarction (Grade B, Section 5.3 in Evidence Report [14]) [376].It is probable that the consumption of two or more servings of dairy foods per day (milk, cheeseand yoghurt) is associated with reduced risk of stroke (Grade B, Section 5.4 in Evidence Report[14]) [376, 377] particularly reduced fat varieties.It is also probable that consumption of three servings of low-fat dairy foods (milk, cheese andyoghurt) is associated with reduced risk of hypertension (Grade B, Section 5.5 in Evidence Report[14]). The evidence also suggests that consumption of three servings of any milk, cheese oryoghurt products per day is associated with reduced risk of hypertension (Grade C, Section 5.5 inEvidence Report [14]) [378-382].Type 2 diabetes: The evidence suggests that consumption of 2-4 serves of dairy foods (milk,cheese, yoghurt) per day is associated with reduced risk of metabolic syndrome (Grade C, Section5.7 in Evidence Report [14]) [376, 383] and that consumption of at least 1.5 serves of milk, cheeseand yoghurt per day is associated with reduced risk of type 2 diabetes (Grade C, Section 5.6 inEvidence Report [14]) [376, 382, 384].DRAFT <strong>Australian</strong> <strong>Dietary</strong> <strong>Guidelines</strong>- December 2011 63
Excess weight: The evidence suggests that consumption of milk is not associated with weightchange or risk of obesity in adults (Grade C, Section 5.8 in Evidence Report [14]) [382, 385-389]or with BMI or change in BMI in childhood (Grade C, Section 5.9 in Evidence Report [14]) [265,390-394].2.5.2.2 CancerRectal and colorectal cancer: Recent evidence suggests it is probable that consumption of morethan one serving of dairy foods per day (especially milk) is associated with reduced risk ofcolorectal cancer (Grade B, Section 5.11 in Evidence Report [14]) [292, 395, 396]. The evidencesuggests that consumption of more than one serving of milk per day is associated with reducedrisk of rectal cancer (Grade C, Section 5.12 in Evidence Report [14]) [395-397].Renal cell, breast and endometrial cancer: It is probable that consumption of three or moreservings of milk per day is not associated with risk of renal cell cancer (Grade B, Section 5.13 inEvidence Report [14]) [398]. There is evidence to suggest that mean consumption of one servingof dairy food (milk cheese, yoghurt) per day is not associated with the risk of breast cancer(Grade C, Section 5.15 in Evidence Report [14]) (from assessment of studies in Alvarez-Leon et al.2006 [399]; Missmer et al. 2002 [400]) and that consumption of dairy food (milk, cheese, yoghurt)is not associated with risk of endometrial cancer (Grade C, Section 5.16 in Evidence Report [14])[401].Prostate cancer: Recent evidence suggesting an association regarding milk and prostate cancer isinconclusive (Section 5.14 in Evidence Report [14]).2.5.2.3 Other conditionsThe traditional nutritional rationale for the inclusion of dairy foods such as milk, cheese andyoghurt is their high calcium content and the positive relationship between calcium and bone mass[9].Bone mineral density: Recent evidence suggests that consumption of dairy foods (particularlymilk) is associated with improved bone mineral density (Grade C, Section 5.1in Evidence Report [14]) [399, 402-407] but this is contradicted by evidence suggesting that lessthan one serving of milk per day during adult life is not associated with risk of osteoporotic or hipfracture (Grade C, Section 5.2 in Evidence Report [14]) [408, 409].DRAFT <strong>Australian</strong> <strong>Dietary</strong> <strong>Guidelines</strong>- December 2011 64
2.5.3 How drinking milk and eating yoghurt, cheeseand/or alternatives may improve health outcomesTwo proposed mechanisms link the consumption of milk, yoghurt and cheese products with areduction in cardiovascular risk. Firstly, the consumption of milk, yoghurt and cheese products hasbeen linked to an increase in the levels of high density lipoprotein (HDL) cholesterol [410, 411].Secondly, there is evidence of an inverse relationship between milk, yoghurt and cheeseconsumption (especially milk) and blood pressure [412] which might be mediated by calciummodulation of endothelial function [413]. Calcium from foods may be preferable to calcium fromsome supplements. A recent meta-analysis of the effect of calcium supplementation on myocardialinfarction and cardiovascular events [414] suggested that calcium supplements, without coadministeredvitamin D, were associated with an increased risk of myocardial infarction. The samegroup have more recently reported a similar effect from calcium supplements with vitamin D[415]. However, the effect of an equivalent dose of calcium from milk, yoghurt and cheeseproducts has a much smaller effect than calcium supplements on the proposed risk factor, namelyraised serum calcium levels [416].There may be a negative association between calcium and blood pressure although this is variable,depending on other dietary factors, and it has been suggested that calcium supplementation maylower blood pressure only in people with a relatively high salt intake [417].Several reasons have been suggested for the lack of an association between a low consumption ofmilk and increased risk of osteoporotic fracture of the hip. <strong>For</strong> example it has been suggested thatwomen who consumed higher quantities of milk chose to do so because they were known to beat an elevated risk of osteoporosis or that milk intake during childhood was more important [418].A randomized control trial of overweight children found that 200mL of milk per day combinedwith nutrition education reduced consumption of sugar-sweetened drinks and increased lean bodymass [419].2.5.4 Practical considerations: Milk, yoghurt, cheeseand/or alternativesConsuming at least two and a half serves of milk, cheese, yoghurt and/or alternatives (mostlyreduced fat) is recommended for <strong>Australian</strong> adults, while the recommended food group intakesfor children and adolescents depend on age and sex [10]. Varieties of cheese which are lower insalt are also preferable (see Section 4.4).The <strong>Australian</strong> Guide to <strong>Health</strong>y <strong>Eat</strong>ing provides detailed information on number of serves and servesizes of milk, yoghurt, cheese and/or alternatives required for different population groups (seetables 2.7 and 2.8 below).DRAFT <strong>Australian</strong> <strong>Dietary</strong> <strong>Guidelines</strong>- December 2011 65
Table 2.7: Recommended number of serves of number of serves of milk, yoghurt, cheeseand/or alternatives (mostly reduced fat) per day ** Additional portions of the five food groups or discretionary choices are needed only by people who are taller or more active to meet additional energy requirements.Source; <strong>Australian</strong> Guide to <strong>Health</strong>y <strong>Eat</strong>ing [114]Table 2.8: Standard serve size equivalents for milk, yoghurt, cheese and/or alternatives (mostlyreduced fat)Source; <strong>Australian</strong> Guide to <strong>Health</strong>y <strong>Eat</strong>ing [114]Analysis of the 1995 National Nutrition Survey [44] included a category called ‘milk products anddishes’ which included items such as milks, yoghurts, cheese, cream, ice-cream and milk-basedcustards, as well as milk substitutes such as soy drinks and soy cheeses. On the day of the survey,93% of subjects consumed foods from this category, the average intake being 322g for adult malesand 258g for adult women. Older men consumed less of these foods than younger men, butconsumption remained relatively stable in women across age groups.To meet recommended food group intakes for adults [10] consumption of milk, yoghurt andcheese products would need to approximately double overall, with a halving of higher fat varietiesand a four-fold increase in reduced fat varieties of milk, cheese and yoghurt. Alternatives, such ascalcium-enriched soy drinks could be substituted for these dairy foods.DRAFT <strong>Australian</strong> <strong>Dietary</strong> <strong>Guidelines</strong>- December 2011 66
2.5.4.1 Pregnant and breastfeeding womenMilk, yoghurt and cheese product intake during pregnancy has clear benefits for both women andtheir babies. Reduced-fat milk, yoghurt and cheese products are recommended during pregnancyand while breastfeeding [220, 362].Pregnant women are advised to avoid consuming unpasteurised dairy products and soft, semi-softand surface-ripened cheeses (for example, brie, camembert, ricotta, fetta and blue cheeses) due torisk of listeriosis [130, 420].2.5.4.2 InfantsCow’s milk should not be given as a drink to infants under 12 months of age. However cow’s milkmay be served in small quantities as custards and desserts. All milk given to infants over 12 monthsshould be pasteurised. Any milk given to infants under 12 months should be specially preparedinfant formula.Children under two years are growing rapidly and have relatively high energy (kilojoule) needs.Reduced fat milks are not recommended as a main milk food for this age, but can be used aftertwo years.2.5.4.3 Children and adolescentsMilk is an important source of calcium and protein for growing children and adolescents. Thedecreased intake of milk and milk products among adolescent girls is of concern, and can lead tolow calcium intake in this group. Diets restricting intake of milk and milk products are notgenerally suitable for growing children and adolescents. Suspected lactose intolerance in childrenand adolescents should be confirmed by a medical practitioner.2.5.4.4 Older people<strong>For</strong> older <strong>Australian</strong>s, milk is a good source of protein, calcium and energy (kilojoules). All milks,including full cream milk, are good choices for older people whose appetite is reduced or whohave lost weight, unless medically advised otherwise.2.5.4.5 People with lactose intoleranceThe rate of lactose intolerance is relatively high in many Asian communities compared withCaucasians. High rates of lactose intolerance have been described among Aboriginal and TorresStrait Islander groups [421, 422]. Lactose-intolerant adults and children often avoid milk and milkproducts, however up to 250mL of milk may be well tolerated [423]. Cheese contains little lactoseDRAFT <strong>Australian</strong> <strong>Dietary</strong> <strong>Guidelines</strong>- December 2011 67
and the lactose in yoghurt is partially broken down by bacteria that thicken the yoghurt. Lactosefreedairy products, such as specialised milks, are also available.2.5.4.6 VegetariansThe previous dietary guidelines addressed vegetarian diets and their influence on calcium needsbecause of the relatively high oxalate and phytate content. On balance, lacto-ovo-vegetariansappear to have calcium intakes similar to those of omnivores. Vegetarians who avoid milk andcalcium-fortified soy products should seek advice about whether they need to take calciumsupplements [37].2.6 Water2.6.1 Setting the sceneWater is essential for life. It is required for digestion, absorption and transportation, as a solventfor nutrients, for elimination of waste products and to regulate body temperature. All biochemicalreactions occur in water.Water is lost from the body in sweating (from 100mL to several 1000mL/day), insensible lossesfrom the lungs and skin (approximately 800mL/day), faecal losses (200mL/day) and urine. Aminimal urine volume to excrete solute load is estimated at 500mL/day but may need to be muchgreater in older people due to declining kidney function [424]. Excluding obvious sweating, thenormal turnover of water has been estimated at approximately 4% of total body weight in adults.In a 70kg adult, this is equivalent to 2,500-3,000mL/day. Some of this turnover will come from thewater contained in foods. Ambient temperature, physical activity and body size all influencerequirements, creating wide variations in daily needs for water. Losses from the lungs and skinincrease at high temperatures, high altitude and low humidity. During summer, when heat stressmay be high, water depletion can lead to heat exhaustion, loss of consciousness and heat stroke[425, 426].The body can compensate in the short term for over- or under-hydration [9], there are no dataon specified hazards from usual consumption. Excess water intake can cause hyponatraemia, butthis is rare in the general population. In general, self-regulation of excess water consumptionoccurs in healthy people in temperate climates.2.6.2 The evidence for ‘drink water’Consumption of adequate water is essential for human life. Given this, no recent studiesinvestigating the relationship between water consumption and health outcomes were identified inDRAFT <strong>Australian</strong> <strong>Dietary</strong> <strong>Guidelines</strong>- December 2011 68
the recent review [14]. Many commonly consumed fluids provide water, however they may alsobe acidic e.g. tea and coffee or contain added sugar, alcohol or caffeine. Recent studies whichinvestigated intake of these fluids and health outcomes are reviewed below.The evidence statements and gradings (A- convincing association, B- probable association, C-suggestive association) from the Evidence Report (literature from years 2002 – 2009) arepresented in the table below. This does not include evidence from other sources, such as the 2003<strong>Dietary</strong> <strong>Guidelines</strong> (where evidence was classified as level I, II or III in which individual studieswere classified according to their design but overall grades for relationships were not derived),although these sources have been used to inform the <strong>Guidelines</strong>.Evidence StatementConsumption of sugar sweetened beverages is associated with increased risk ofweight gain in adults and children.Consumption of coffee of 4 or more cups per day is associated with reduced risk oftype 2 diabetes.Consumption of green and black tea is associated with reduced risk of stroke.Consumption of coffee is associated with increased risk of bladder cancer.Consumption of coffee is associated with increased risk of lung cancer.Consumption of coffee is associated with reduced risk of endometrial cancer.Consumption of coffee is associated with reduced risk of hepatocellular cancerConsumption of soft drink is associated with increased risk of dental caries inchildren.Consumption of soft drinks is associated with increased risk of reduced bonestrength.GradeBBCCCCCCC2.6.2.1 Cardiovascular disease, type 2 diabetes and excess weightCardiovascular disease: The evidence suggests that consumption of black tea is not associatedwith risk of cardiovascular disease (Grade C, Section 15.21 in Evidence Report [14]) [427-431].The evidence suggests that consumption of green and black tea is associated with reduced risk ofstroke (Grade C, Section 15.20 in Evidence Report [14]) [429, 432-435].DRAFT <strong>Australian</strong> <strong>Dietary</strong> <strong>Guidelines</strong>- December 2011 69
The evidence suggests that consumption of coffee is not associated with risk of coronary heartdisease (Grade C, Section 15.13 in Evidence Report [14]) [436-439], although this was not thecase for cigarette smokers.Type 2 diabetes: There is evidence of a probable association between consumption of more thanfour cups of coffee a day and a reduced risk of type 2 diabetes (Grade B, Section 15.15 in EvidenceReport [14]) [440-447]Excess weight: It is probable that consumption of sugar-sweetened beverages is associated withweight gain in children and adults (Grade B, Section 15.1 in Evidence Report [14]) [448-459] (seeChapters 2 and 4).2.6.2.2 Cancer2.6.2.2.1 Cancer: CoffeeBladder and lung cancer: The evidence suggests that consumption of coffee is associated withincreased risk of bladder cancer (Grade C, Section 15.10 in Evidence Report [14]) [460-462] andlung cancer (Grade C, Section 15.12 in Evidence Report [14]) [463].Breast, colorectal and ovarian cancer: The evidence suggests that consumption of coffee is notassociated with risk of breast cancer [464], colorectal cancer [294, 465-467] or ovarian cancer[468-470] (Grade C, Section 15.7, 15.9, 15.11 in Evidence Report [14]).Endometrial and hepatocellular cancer: The evidence suggests that consumption of coffee isassociated with decreased risk of hepatocellular cancer [471] and endometrial cancer [472, 473](Grade C, Section 15.6, 15.8 in Evidence Report [14]).Gastric cancers: The evidence is inconclusive regarding an association between coffeeconsumption and risk of gastric cancer (Section 15.5 in Evidence Report [14]).2.6.2.2.2 Cancer: TeaOvarian and colorectal cancer: The evidence suggests that consumption of green or black tea isnot associated with ovarian cancer (Grade C, Section 15.18 in Evidence Report [14]) [468-470] orcolorectal cancer (Grade C, Section 15.19 in Evidence Report [14]) [465-467, 474, 475].Other cancers: Recent evidence is inconclusive regarding an association between consumption ofgreen and black tea and breast, gastric or lung cancer (Section 15.16, 15.17 and 15.22 in EvidenceReport [14]).DRAFT <strong>Australian</strong> <strong>Dietary</strong> <strong>Guidelines</strong>- December 2011 70
2.6.2.3 Other conditionsDental caries and bone strength: The evidence suggests that consumption of soft drinks isassociated with increased risk of dental caries in children (Grade C, Section 15.14 in EvidenceReport [14]) and increased risk of reduced bone strength (Grade C, Section 15.3 in EvidenceReport [14]) [458, 476-479] (see Chapter 4).Oral health is also affected by fluids. Fluoride added to tap water provides protection againstdental caries [480]. The mildly alkaline nature of saliva is the key protective element againstcorrosion of teeth by acids. If dehydration occurs after exercise or from particular medications, anadequate intake of water is essential for maximising the protective effect of saliva on oral health[481]. Dehydration also causes loss of salivary protection against attrition, erosion and abrasion.The <strong>Australian</strong> Dental Association reports that 68% of <strong>Australian</strong> school students have at leastone tooth eroded [482]. Erosion is related to the acidity of drinks, whether sweetened with sugaror artificial sweeteners, as well as the bacterial fermentation that can occur with consumption ofsugar (see Section 4.3). The relationship between the acidity of sweetened drinks and dentalerosion is also supported by the American Academy of Pediatrics Committee on School <strong>Health</strong>[483].Blood pressure: Recent evidence is inconclusive in regards to an association between coffeeconsumption and systolic blood pressure (Section 15.14 in Evidence Report [14]).2.6.3 How drinking water may improve health outcomes<strong>For</strong> oral health, water has an advantage over many commercially available drinks, including sugarsweetenedor low-kilojoule soft drinks, ‘sports’ and ‘energy’ drinks. As well as the potentiallyadverse direct effects of sugar (see Section 3.3) the carbonation process creates an acidicenvironment that contributes to the erosion of tooth enamel [481].The mechanism by which coffee consumption may protect against type 2 diabetes is not clear. Ithas been reported that insulin resistance is increased in peripheral tissues after exposure tocaffeine [484] and conversely, the effect of caffeine on thermoregulation has been suggested as amechanism by which glucose homeostasis is improved [485]. Other components of coffee,possibly magnesium, may also assist by benefiting insulin sensitivity and reducing risk of type 2diabetes [486]. Tea contains polyphenols known as catechins which have been reported to reducehypertension, atherosclerosis and thrombogenesis [487]. Polyphenols also play a part in nitricoxide production from the vascular endothelium, enhancing endothelial health and reducing therisk of cardiovascular diseases and stroke [487].DRAFT <strong>Australian</strong> <strong>Dietary</strong> <strong>Guidelines</strong>- December 2011 71
2.6.4 Practical considerations: Drink waterThe National <strong>Health</strong> and Medical Research Council has developed comprehensive guidelines ontap water standards for drinking. <strong>Australian</strong> tap water is an ideal option because it is inexpensiveand meets high palatability and hygiene standards. Most tapwater in Australia is fluoridated, whichhas been shown to be a safe and effective public health measure. Fluoridation of tapwater providesan additional benefit for development of strong teeth and bones, making it a very good choice toensure adequate hydration. Tank water and bottled waters are a useful alternative when access totapwater is limited. Not all bottled waters contain fluoride.However, access to and availability of clean and safe water may not be available among somepopulation groups, particularly in remote regions of Australia.2.6.4.1 Pregnant and breastfeeding womenAs stated in the previous dietary guidelines, pregnant and breastfeeding women have a slightlyincreased water requirement because of expanding extracellular fluid space and the needs of thefoetus and the amniotic fluid. The fluid need is therefore 750–1000mL a day above basic needs[37].Many authoritative bodies advise pregnant and breastfeeding women to limit their caffeine intake –for example the New Zealand Ministry of <strong>Health</strong> advises that intake be restricted to a maximumof 300mg of caffeine per day (about three cups of coffee or six cups of tea) [220].2.6.4.2 InfantsWater turnover is higher in infants and young children than in adults. Adequate levels of hydrationare important, especially during times of potential heat stress (for example, due to hot weather orfever). Breastmilk supplies adequate water up to around 6 months of age, but cooled boiled watermay need to be provided for formula fed infant [133].2.6.4.3 Older peopleOlder people can experience dehydration due to inadequate intake of water or other drinks. Thenormal decline in kidney function with age, plus hormonal changes, decreased thirst perception,medication, cognitive changes, limited mobility and increased use of diuretics and laxatives maycreate concern for older people [35]. These changes may be normal adaptations of the ageingprocess but the outcomes of dehydration in the elderly are serious and include cognitiveimpairment, functional decline, falls or stroke.DRAFT <strong>Australian</strong> <strong>Dietary</strong> <strong>Guidelines</strong>- December 2011 72
Where to nextBoth the quality and quantity of foods and drinks consumed can significantly impacton health and wellbeing. Overconsumption of some foods and drinks containingsome fats, added sugar and salt, and alcohol and relatively poor in nutrients, isassociated with increased risk of some health conditions, and are discussed in thefollowing chapter.DRAFT <strong>Australian</strong> <strong>Dietary</strong> <strong>Guidelines</strong>- December 2011 73
3. Limit intake of foods and drinkscontaining saturated and trans fats,added salt, added sugars and alcoholGuideline 2Limit intake of foods and drinks containing saturated and trans fats, added salt,added sugars and alcohol.a. Limit intake of foods and drinks containing saturated and trans fats• Include small amounts of foods that contain unsaturated fats.• Low-fat diets are not suitable for infants.b. Limit intake of foods and drinks containing added salt• Read labels to choose lower sodium options among similar foods.• Do not add salt to foods.c. Limit intake of foods and drinks containing added sugars• In particular, limit sugar-sweetened drinks.d. If you choose to drink alcohol, limit intakeDRAFT <strong>Australian</strong> <strong>Dietary</strong> <strong>Guidelines</strong>- December 2011 74
Executive summaryThis Guideline emphasises the importance of limiting intake of foods and drinkshigh in saturated and trans fats, added salt, added sugars and alcohol, due toevidence that these foods are associated with increased risk of obesity and/orchronic disease, including cardiovascular disease, type 2 diabetes and/or somecancers.The link between dietary saturated fat, cholesterol and cardiovascular disease iswell established. Replacing dietary saturated fat or trans fat with monounsaturatedand polyunsaturated fats is associated with improved blood lipid profiles andreduced risk of cardiovascular disease.Fat-rich foods are energy-dense, and it is prudent to choose low-fat and lowenergy-density foods in a total dietary pattern that seeks to control overall energyintake. Low-fat diets are not suitable for children under two years of age. Reducedfatmilk may be used from the age of two.Reducing intake of sodium decreases blood pressure in both normotensive andhypertensive adults, while the evidence has strengthened that reducing sodiumintake might decrease risk of mortality, stroke and heart disease in people withhypertension. Processed foods are the major source of sodium in western diets.Frequent consumption of foods and drinks high in added sugars is a major riskfactor in dental caries. There is strengthened evidence of association betweenintake of sugar-sweetened drinks and risk of excess weight gain.The health, social and economic costs associated with excessive alcoholconsumption are well-documented. Limiting alcohol intake is also an importantstrategy for achieving appropriate energy intake.This chapter provides information on why consumption of these food types shouldbe limited. It includes practical considerations for meeting the guideline, forexample, by choosing a variety of nutritious foods (Guideline 1), using only smallamounts of unsaturated spreads and oils, and avoiding or limiting discretionaryfoods and drinks.DRAFT <strong>Australian</strong> <strong>Dietary</strong> <strong>Guidelines</strong>- December 2011 75
3.1 Limiting intake of foods and drinkscontaining saturated and trans fat3.1.1 Setting the sceneLike protein and carbohydrate, fat is a macronutrient which contributes to dietary energy intake.‘Fat’ is a broad term which can apply to foods such as butter, margarine and oils, and to fatty acidswhich are food components. Fats add palatability and texture to the diet, can be a vehicle foressential nutrients, and have high energy value (fat delivers about 37 kJ/g, compared to around 17kJ/g for protein and carbohydrate). The proportion of fat in a diet influences its energy density,which is important for weight management (see Chapter 4). Different fats have different healtheffects, so both the amounts and types of fat need to be carefully considered in a diet.Most fats in foods are in the form of triglycerides, which are made up of a unit of glycerolcombined with three fatty acids which may be the same or different. The differences between onetriglyceride and another are largely due to the fatty acids attached to the glycerol unit. Otherdietary fats include phospholipids, phytosterols and cholesterol [9].Fatty acids can be saturated (SFA), monounsaturated (MUFA) or polyunsaturated (PUFA). Thetype of fatty acid depends on the chemical bonding within the fatty acid molecule, specifically thenumber of double bonds between the carbon atoms. This gives them different chemical propertiesthat cause different biological effects. MUFA and PUFA with one or more double bonds in thetrans configuration are known as trans-fatty acids (TFA) [488]. Omega fatty acids (omega-3 andomega-6 PUFAs) are sub-classes of PUFA. The most common omega-9 is the MUFA called oleicacid. Staple foods with a relatively higher fat content, such as nuts, seeds, some grains (forexample, oats), dairy foods and meats have various combinations of fatty acids. Fish is thepredominant source of omega-3 fatty acids, eicosapentaenoic (EPA) (20:5) and docosahexaenoic(DHA) (22:6). Grass-fed meat, kangaroo and offal also contain these fatty acids as well as theomega-3 fat docosapentaenoic acid (DPA) (22:5). EPA, DHA and DPA (and some other minorfatty acids) are referred to as long chain polyunsaturated fatty acids, omega-3 LCPUFA.The Nutrient Reference Values for Australia and New Zealand recommend total fat should account forno more than 20–35% of energy (kilojoule) intake. Total SFA and trans-fats should comprise nomore than 10% of energy intake [9]. As humans do not make essential fatty acids, 4–10% of energyshould come from linoleic acid(omega-6 PUFA) and 0.4–1% from α-linolenic acid (omega-3 PUFA)[9]. Given that total energy intake reflects the sum of the energy value of all foods consumed,these fatty acid targets can only be met through careful dietary selection, so food choices andculinary practices can have a substantial impact on the ability to meet these targets [10].DRAFT <strong>Australian</strong> <strong>Dietary</strong> <strong>Guidelines</strong>- December 2011 76
3.1.2 The evidence for ‘limiting intake of foods anddrinks containing saturated and trans fat’The evidence for associations between dietary fat and the development of type 2 diabetes,hypertension, cancer and poor mental health was reviewed. The link between dietary saturatedfat, cholesterol levels, atherosclerosis and other components of cardiovascular disease has beenwell established in previous guidelines, and was not reviewed here.The <strong>Guidelines</strong> recommend caution in choosing foods high in fat because of the implications forweight gain and cardiovascular disease risk. Fat-rich foods are energy (kilojoule) dense, heighteningthe risk of excess energy intake [489]. The evidence base for the effects of dietary fat has grownsubstantially and increased in specificity with respect to different fatty acids.Scientific evidence on the effect of dietary fat on health can come from studies that address dietaryvariables in a number of ways. These include whole-of-diet studies examining the proportion of fatin the diet (relative to protein and carbohydrate), the type of fat in the diet (relative to othertypes of fat), the effects of specific fatty acids in the diet, and the effects of individual foods inwhich fat is a significant component. <strong>For</strong> example, studies could examine the effects of:• a low-fat diet• a diet with a modified dietary fat ratio, for example, a high polyunsaturated:saturated fatratio (P:S or PUFA:SFA)• a diet enriched with specific fatty acids (for example, omega-3 fatty acids)• oils and fats (for example, olive oil, spreads) in a defined dietary pattern.Examining the evidence for the effects of fats and oils on health found a full range of these types ofstudies.Methodological issues arise when considering the effects of fats and of dietary fat in the total diet.The difficulty in designing studies that address the question of the effect of dietary fat on diseaserisk is reflected in several recent reviews on the topic. It is important to note that inconsistency inresults affects the strength of the evidence statements below.There is ample evidence of the relationships between dietary patterns and disease risk at thepopulation level [490]. Fat content is an important component of diet quality and it may be thatthe evidence for limiting fat in the diet is best considered from the food and whole-of-dietperspective with additional reference to overall nutritional quality.The evidence statements and gradings (A- convincing association, B- probable association, C-suggestive association) related to ‘limit fat’ from the Evidence Report (literature from years 2002 –2009) are presented in the table below. This does not include evidence from other sources, suchas the 2003 <strong>Dietary</strong> <strong>Guidelines</strong> (where evidence was classified as level I, II or III in which individualDRAFT <strong>Australian</strong> <strong>Dietary</strong> <strong>Guidelines</strong>- December 2011 77
studies were classified according to their design but overall grades for relationships were notderived), although these sources have been used to inform the <strong>Guidelines</strong>.Evidence StatementConsumption of higher LCPUFA fat (intakes amount not specified) is associatedwith a reduced risk of dementiaGradeC3.1.2.1. Cardiovascular disease, type 2 diabetes and excess weightCardiovascular disease: Of the systematic reviews addressing the risk of cardiovascular diseaseand consumption of fats and oils [410, 491-499], only one review [410] focused on theproportions of dietary fatty acids in the overall diet rather than the effects of omega-3 fatty acidson markers of cardiovascular health. This review confirmed that replacing SFA with unsaturatedfatty acids may reduce the risk of coronary heart disease, and that replacing trans fats withunsaturated fats improves blood cholesterol levels. From a whole-of-diet perspective, this reviewfound that reducing the risk of cardiovascular disease by replacing SFA with carbohydrate (as is thecase in some low-fat diets) depends on effects on body weight [410].The FAO Expert consultation on fats and fatty acids in human nutrition 2010 [500] reportsconvincing evidence that replacing SFA with PUFA decreases the risk of coronary heart disease.The <strong>Dietary</strong> <strong>Guidelines</strong> for Americans, 2010 [143] have come to similar conclusions. Theyacknowledge strong evidence that dietary SFA is positively associated with increased serumcholesterol and LDL cholesterol, with increased risk of cardiovascular disease, while replacingdietary SFA or trans fats with PUFA is associated with improved blood lipid profile and reductionsin levels of numerous markers of inflammation. The review of the <strong>Dietary</strong> <strong>Guidelines</strong> for Americans,2010 also noted strong evidence that replacing dietary SFA with MUFA and/or PUFA is associatedwith improved blood lipids related to cardiovascular disease, and moderate evidence that 250mgof LCPUFA delivered with 2 servings of seafood per week is associated with reduced cardiacmortality from coronary heart disease and reduced risk of sudden death from cardiovasculardisease [143].Hypertension: The evidence suggests that consumption of fat, irrespective of amount or type, isnot associated with hypertension in the short term (Grade C, Section 12.4 in Evidence Report[14]) [501-509].Type 2 diabetes: While overweight and obesity increase the risk of type 2 diabetes [88], recentshort-term interventions are inconclusive and may not adequately reflect the nature of the effectof dietary fat on type 2 diabetes. The evidence suggests that consumption of LCPUFA (from 0.4 to6g/day) and diets of varying fat content are not associated with fasting plasma glucose or insulinconcentrations (Grade C, Section 12.3 in Evidence Report [14]) [492, 499, 509-519].DRAFT <strong>Australian</strong> <strong>Dietary</strong> <strong>Guidelines</strong>- December 2011 78
In the longer term, the review conducted for the <strong>Dietary</strong> <strong>Guidelines</strong> for Americans 2010 foundstrong evidence that dietary SFA was positively associated with increased markers of insulinresistance and increased risk of type 2 diabetes. In addition, it found decreasing dietary SFA andreplacing it with PUFA or MUFA decreases the risk of type 2 diabetes in healthy adults andimproves insulin responsiveness in insulin resistant and type 2 diabetes subjects. PUFA intake wasassociated with a significant decrease in the risk of type 2 diabetes [143].Excess weight: <strong>Dietary</strong> fat provides a substantial amount of energy (kilojoules) per gram but totaldietary energy is the variable that affects weight. Reducing the amount of dietary fat will notnecessarily reduce dietary energy, but it is prudent to choose low-fat and low energy-densityfoods in a total dietary pattern that seeks to control overall energy intake. Because of this totalenergy effect, there are difficulties in appraising research on the effect of dietary fat alone onweight gain [489] (see Chapter 4).3.1.2.2. CancerThe evidence suggests there is no association between consumption of LCPUFA with total allcausecancer incidence or mortality (Grade C, Section 12.5 in Evidence Report [14]) [495, 520].Other cancers: Evidence of an association between total fat consumption across a range of intakesand breast or endometrial cancer is inconclusive (Section 12.6 & 12.7, Evidence Report [14])3.1.2.3. Other conditionsDementia: The evidence suggests that consumption of higher LCPUFA is associated with areduced risk of dementia (Grade C, Section 12.8 in Evidence Report [14]) [317, 329, 521-524].3.1.3 How limiting intake of foods and drinks containingsaturated and trans fat may improve health outcomesFat is an energy-dense macronutrient, so consumption of excess fat may lead to excess energy(kilojoule) intake and weight gain [489], but an individual’s genetic makeup, physical activity andother dietary factors also play a part [525]. Fat cells secrete compounds that influence appetite,inflammation and possibly also cancer development [526-528]. Insulin resistance, reflected in highinsulin and glucose levels, is linked to obesity, and leads to type 2 diabetes. Other cardiovasculardisease risk factors such as high cholesterol levels and hypertension tend to co-exist with insulinresistance, a phenomenon often referred to as the metabolic syndrome [529].Fatty acids do not only contribute to body fat. Different fatty acids influence disease risk factors.<strong>Dietary</strong> SFA and dietary TFA have been associated with raised plasma LDL-cholesterol, andDRAFT <strong>Australian</strong> <strong>Dietary</strong> <strong>Guidelines</strong>- December 2011 79
dietary TFA has been associated with a reduced plasma HDL-cholesterol [88]. These changes inplasma cholesterol fractions are established risk factors for coronary heart disease that can beinfluenced by diet. Raised LDL-cholesterol has been found to be a significant risk factor in at least50 prospective cohort studies involving more than 600,000 subjects in 18 countries [530]. Severallarge cohort studies have also demonstrated that reduced HDL-cholesterol is a significant riskfactor for coronary heart disease [531, 532].PUFA intake appears to reduce coronary heart disease risk [490], but the balance betweenomega-6 and omega-3 PUFA may be important [533]. In addition to effects on lipid metabolism,PUFA may exert a positive influence on insulin action, appetite regulation, inflammatory responses,and muscle function [534]. Among the LCPUFA fatty acids, EPA is the precursor of the 3 series ofprostaglandins and the 5 series of leukotrienes [535]. This suggests anti-inflammatory and anticoagulanteffects which may explain the protective influences on cardiovascular disease. DHA isfound in high concentrations in the photoreceptors of the retina and the membranes of the brain,with implications for cognitive development and mental health [536].3.1.4 Practical considerations: Limiting intake of foodsand drinks containing saturated and trans fatThe most recent dietary data available in Australia show adults consume 73–101g/day of fat, withhigher intakes among men and younger age groups [44]. Children consume 51–87g/day of fat, withintake being higher in older age groups [13]. The total fat intake of the population has notdecreased in recent years, but now constitutes a lower proportion of overall energy intake due toa relative increase in the consumption of carbohydrates, especially refined carbohydrates [48].Intakes of total fat, in particular saturated fat, are higher than recommended [114]. However, themean total population trans-fat intake for Australia is estimated to be 0.5-0.6% of total dietaryenergy, which is well below the WHO population goal of less than 1% of total dietary energy fromTFA [234].<strong>Dietary</strong> fat included in the <strong>Australian</strong> Guide to <strong>Health</strong>y <strong>Eat</strong>ing’s Foundation Diets mainly comes fromfish, lean meat, poultry and milk, yoghurt and cheese products. Where more energy is required inmoving from Foundation to Total Diets, additional serves of these and/or other foods containing fatscan be included as additional nuts and seeds, unsaturated spreads and oils, and/or discretionaryfoods.Limiting the amount and type of fat in the diet can be achieved by choosing vegetables, fruit, leanmeats and low-fat milk, yoghurt and cheese products, and using only small amounts of unsaturatedspreads and oils. Limiting intake of fried foods (including chips) and baked cereal products(including snack foods, biscuits and cakes) helps to reduce ‘invisible fat’ in the diet. LCPUFA intakecan be increased by eating according to the Foundation Diets and Total Diets, which includes fisharound twice a week. When eating meals outside the home, lower-fat menu choices arepreferable.DRAFT <strong>Australian</strong> <strong>Dietary</strong> <strong>Guidelines</strong>- December 2011 80
The P:M:S ratio is a useful tool in assessing the type and amount of fat consumed and its relativeimpact on chronic disease risk. The foods included in the <strong>Australian</strong> Guide to <strong>Health</strong>y <strong>Eat</strong>inggenerally contain low levels of saturated fat and include PUFA and MUFA in proportions thatappear to be protective against heart disease risk and support the maintenance of cognitivefunction [9].<strong>For</strong> quantitative population recommendations see the Nutrient Reference Values for Australia andNew Zealand [9].3.1.4.1 Infants<strong>For</strong> infants under the age of around six months, breastmilk provides an ideal amount and type offat. The <strong>Guidelines</strong> on fat intake for the adult population are not applicable to young children,particularly those under two years. The amount and type of fats required for infants are related tophysiological and health outcomes [9]. Even a small energy deficit during this period of rapiddevelopment may affect growth [9]. Neurological development is particularly rapid in the first twoyears of life and restriction of the fat intake during that time may interfere with optimal energyintake and reduce the supply of essential fatty acids, particularly long chain omega-3 PUFA neededby developing nervous tissue, adversely affecting growth and development.3.1.4.2 Children and adolescentsReduced fat milk may be used from the age of two years, when milk plays a less dominant role inthe diet (see Chapter 2). A high-fat diet is likely to be energy-dense, contributing to excess energyintake and the development of obesity (see Chapter 4). Even at a young age, a diet high insaturated fats may predispose children and adolescents to the development of cardiovasculardisease later in life and the evidence supports this advice on fat intake for children from two yearsof age [537]. Introducing healthy eating patterns in early childhood influences dietary patterns inlater childhood [538, 539].3.1.4.3 Older peopleLow-fat diets are not suitable for convalescent older people and frail aged people (to whom theseguidelines do not apply) because of the possible adverse effects of energy restriction in thesegroups. However, for those aged 65–75 who are well, the type and amount of fat in the dietdeserves consideration. Although the increased relative risk of raised plasma cholesterol forcoronary heart disease tends to be lower in older people than in younger adults, lowering of lipidlevels can reduce risk of ischemic heart disease regardless of age [540].DRAFT <strong>Australian</strong> <strong>Dietary</strong> <strong>Guidelines</strong>- December 2011 81
3.1.4.4 Aboriginal and Torres Strait IslandersLimiting intake of excess energy from any source, including total fat, is particularly important giventhe higher prevalence of obesity in Aboriginal and Torres Strait Islander groups compared to non-Indigenous <strong>Australian</strong>s [30, 32]. Limiting saturated and trans fat are important given the highprevalence of coronary heart disease, and decreased saturated fat intake may also improve insulinsensitivity.3.1.4.5 Culturally and linguistically diverse groupsThe profile of dietary fat will vary depending on traditional culinary use. Food product labels mayassist people in learning about the amounts and types of fats in unfamiliar or newly introducedmanufactured foods.3.2 Limit intake of foods and drinks containingadded salt3.2.1 Setting the scene<strong>Dietary</strong> guidelines have recognised the role of sodium in elevating blood pressure since the draftUnited States Surgeon General’s report released in 1979 [541]. Initial advice to the public wasframed to reduce consumption of discretionary salt, such as salt added at the table or duringcooking. More recently it has been recognised that processed foods are the major source ofsodium in Western diets, so advice needs to include processed food. Sodium occurs naturally infood, and a range of sodium-containing additives are also added to manufactured and processedfoods. In these <strong>Guidelines</strong>, salt always refers to sodium chloride and is never used as a synonym forthe total amount of sodium in foods.Since the previous edition of the <strong>Dietary</strong> <strong>Guidelines</strong> in 2003, the evidence for a relationshipbetween reducing sodium intake and reducing blood pressure has strengthened, particularly inthose classified as normotensive. In addition there is now some evidence indicating that reducingsodium may result in a reduction in outcomes such as mortality, stroke and heart disease forthose with hypertension, but not, as yet, for those with normal blood pressure.DRAFT <strong>Australian</strong> <strong>Dietary</strong> <strong>Guidelines</strong>- December 2011 82
3.2.2 The evidence for ‘limiting intake of foods anddrinks containing added salt’The evidence for the <strong>Guidelines</strong> focuses on dietary sodium intake, rather than salt intake, becausemost studies forming the body of evidence statements measured total sodium intake or urinarysodium excretion (which is a marker of sodium intake from all sources including salt, otheradditives containing sodium, and naturally occurring sodium).The evidence statements and gradings (A- convincing association, B- probable association, C-suggestive association) related to ‘limit added salt’ from the Evidence Report (literature from years2002 – 2009) are presented in the table below. This does not include evidence from othersources, such as the 2003 <strong>Dietary</strong> <strong>Guidelines</strong> (where evidence was classified as level I, II or III inwhich individual studies were classified according to their design but overall grades forrelationships were not derived), although these sources have been used to inform the <strong>Guidelines</strong>.Evidence StatementDecreasing consumption of sodium decreases blood pressure (BP) innormotensive adults; a reduction of 1,800mg reduces systolic BP by about2mmHg and diastolic BP by about 1mmHgDecreasing consumption of sodium decrease blood pressure (BP) in hypertensiveadults; a reduction of 1800mg reduces systolic BP by about 5mmHg and diastolicby about 3mmHgConsuming a diet low in sodium reduces blood pressure in children up to 18years of ageReducing sodium intake by about 1000mg/day is associated with reduced risk ofcardiovascular eventsGradeAABC3.2.2.1 Cardiovascular disease, type 2 diabetes and excess weightBlood pressure: The evidence is convincing that decreasing consumption of sodium decreasesblood pressure in normotensive adults; a reduction of 1,800mg per day reduces systolic BP byabout 2 mmHg and diastolic blood pressure by about 1mmHg (Grade A, Section 13.1 in EvidenceReport [14]). The evidence is also convincing that decreasing consumption of sodium decreasesblood pressure in hypertensive adults - a reduction of 1,800mg per day reduces systolic BP byabout 5mmHg and diastolic blood pressure by about 3mmHg (Grade A, Section 13.1 in EvidenceReport [14]) [542-557]. Reducing sodium intake reduces both systolic and diastolic bloodDRAFT <strong>Australian</strong> <strong>Dietary</strong> <strong>Guidelines</strong>- December 2011 83
pressure, and the effect is greater in those with hypertension than in those with normal bloodpressure [551-554].There is evidence of a probable association between a diet low in sodium and a reduction in bloodpressure in children up to 18 years of age (Grade B, Section 13.2 in Evidence Report [14]) [553,557, 558].The <strong>Dietary</strong> <strong>Guidelines</strong> for Americans, 2010 draw similar conclusions regarding the relationshipbetween sodium and blood pressure. They state ‘a strong body of evidence has documented thatin adults, as sodium intake decreases, so does blood pressure. A moderate body of evidence hasdocumented that as sodium intake decreases, so does blood pressure in children, from birth to 18years of age’ [143]. They also note that people with hypertension, diabetes and chronic kidneydisease are more sensitive to sodium than healthier younger people, and that sensitivity to sodiumincreases with age.Cardiovascular disease: Despite extensive research on the relationship between sodium andblood pressure, few long term studies have examined changes in sodium intake and changes incardiovascular morbidity and mortality. Past studies have mainly included subjects withhypertension. The evidence suggests that reducing sodium intake by about 1,000mg/day isassociated with reduced risk of cardiovascular events (Grade C, Section 13.4 in Evidence Report[14]) [552, 559-564]. The results are consistent with results from drug trials that have shown thatreductions in high blood pressure also lead to reductions in adverse cardiovascular outcomes[565, 566].3.2.2.2 CancerEvidence of a probable association between consumption of salt and salt-preserved foods withgastric cancer was found in the systematic review prepared as the background paper for the JointWHO/FAO Expert Consultation on diet, nutrition and prevention of chronic diseases [567]. Thisassociation was described as convincing by the WCRF [42]. The WCRF also reported convincingevidence of an association between processed meats (meat preserved by smoking, curing, saltingor addition of chemical preservatives such as nitrites) and increased risk of colorectal cancer [42]but it is unclear whether the responsible factor in the food is the salt, other components such asnitrites, or a combination of these factors.3.2.2.3 Other conditionsBone health: Evidence suggesting an association between a low sodium diet and markers of bonehealth in postmenopausal women is inconclusive (Section 13.3, Evidence Report [14]).DRAFT <strong>Australian</strong> <strong>Dietary</strong> <strong>Guidelines</strong>- December 2011 84
3.2.3 How limiting intake of foods and drinks containingadded salt may improve health outcomesSodium and other electrolytes are needed to maintain extracellular volume and serum osmolality.There are various systems and hormones that influence sodium balance including the reninangiotensin-aldosteronehormone system, the sympathetic nervous system, atrial natriureticpeptide, the kallikrein-kinin system, various intrarenal mechanisms, and other factors that regulaterenal and medullary blood flow [9].Future data may lead to some refinement in understanding the underlying mechanisms. <strong>For</strong>example, the ratio of sodium to potassium may influence blood pressure more strongly than theamount of sodium alone [560-562] and reducing sodium intakes may be particularly important foroverweight people with certain conditions [563]. The <strong>Dietary</strong> <strong>Guidelines</strong> for Americans, 2010comment that the effects of higher sodium intake can be countered if potassium intake is alsohigher and note that potassium intakes in the US are lower than desirable [143].3.2.4 Practical considerations: Limiting intake of foodsand drinks containing added saltThere has been a shift in the language on this issue. The first edition of the <strong>Dietary</strong> <strong>Guidelines</strong>included the guideline ‘<strong>Eat</strong> less salt’ [568]. The second edition revised this to ‘Choose low saltfoods and use salt sparingly’ [569]. The third edition advised <strong>Australian</strong>s to ‘Choose foods low insalt’ [37]. In these <strong>Guidelines</strong>, it is recognised that any reduction in dietary sodium would reduceblood pressure in both hypertensive and normotensive people.The Nutrient Reference Values for Australia and New Zealand recommend an intake of sodium in therange 460–920mg/day for adults to cover the essential requirement. Current advice in Australia isfor dietary sodium intake to be preferably less than 1,600mg/day for adults or no higher than theset Upper Level (UL) of 2,300mg/day (approximately equal to 6g of table salt) ([9]). Among thosewith high sodium intakes, reduction in sodium intake would reduce blood pressure even if specifictargets are not achieved.Diets that are consistent with the <strong>Guidelines</strong> will help to limit sodium intake. Fresh, unprocessed orminimally processed foods such as fresh vegetables, including legumes/beans, and fruit, frozen ortinned vegetables, including legumes/beans, and fruit with no added salt, meats, fish and milk aregenerally lower in sodium. Some breads and cereal products and cheese are high in salt and makea significant contribution to sodium intake, although there is considerable variation betweenproducts and brands. However, these foods provide other important health benefits outlined inthe relevant sections of the <strong>Guidelines</strong>. The public should not avoid these foods, but should beencouraged to check food labels and select lower-sodium products in these categories. Somefoods are labelled ‘low sodium/salt’ because they contain less than 120mg of sodium per 100g. NotDRAFT <strong>Australian</strong> <strong>Dietary</strong> <strong>Guidelines</strong>- December 2011 85
all foods which meet this criterion carry a ‘low sodium’ claim, and some higher sodium foods suchas bread and cheese also contain important nutrients.Because salt is 40% sodium, avoiding discretionary salt in cooking or at the dinner table will alsoreduce sodium intake. In the 1995 National Nutrition Survey, 62% of the population aged two yearsand older reported always or usually adding salt at the table or during cooking [570]. Since 1995,Asian-style cooking is increasingly popular in Australia and many Asian-style sauces such as soy,oyster and fish sauces are high in sodium. Lower sodium options of these foods should be chosen,recognising that they may still have high sodium content. Salt substitutes or ‘lite’ salts whichreplace some sodium chloride with potassium chloride can provide a salt taste with lower levels ofsodium. Herbs, spices, garlic, lemon juice and vinegar can also be used to season foods withoutadding salt.Iodine deficiency previously existed in Australia and has re-emerged in recent years. Iodised salt isone way to increase iodine intake. Since 2009, it has been mandatory for any salt used incommercial bread baking to be iodised (organic bread is exempt from this requirement) [570].Consequently it would unnecessary for most individuals to use discretionary iodised salt for thepurpose of obtaining iodine. Milk and dairy foods are an important source of iodine in Australia.3.2.4.1 Pregnant and breastfeeding womenAdvice to limit the intake of sodium for the general population is also applicable to pregnant andbreastfeeding women [571].3.2.4.2 InfantsThe Australia New Zealand Food Standard Code sets maximum limits for the sodium content ofcommercially prepared infant foods such as rusks, biscuits and other ready-to-eat foods, andprohibits the addition of salt to fruit-based foods, fruit drinks and vegetable juices [234]. Theserestrictions are needed because infants have a lower renal capacity than older children and adults.Parents and carers who are introducing infants to solid foods should be advised to minimisesodium intake. This means preparing home-made infant foods without salt or ingredients that arehigh in salt or sodium, and minimising infants’ intake of other processed foods that are high insodium.3.2.4.3 Children<strong>For</strong> children with average energy needs, the dietary patterns in the Modelling System [10]contained up to 50% less sodium than the average sodium intakes reported in the 2007 <strong>Australian</strong>National Children’s Nutrition and Physical Activity Survey [13].DRAFT <strong>Australian</strong> <strong>Dietary</strong> <strong>Guidelines</strong>- December 2011 86
3.2.4.4 Older peopleTaste perception decreases with age and can be a factor in decreased food intake andmalnutrition. <strong>For</strong> a chronically ill older person who has high blood pressure, clinicians need toweigh up the benefit of the addition of salt to food to improve flavour (with improved intake andquality of life, and reduced risk of malnutrition) against the risks of hypertension and itsmanagement. <strong>For</strong> chronically ill older people who do not have high blood pressure, there is noreason to reduce salt as there are no additional health benefits to be gained and maintaining foodintake is a priority.3.3 Limit intake of foods and drinks containingadded sugars3.3.1 Setting the sceneSugars are carbohydrates, for example fructose, glucose, lactose or sucrose. When sugars occurnaturally in foods such as fruit, vegetables and dairy products they are referred to as intrinsicsugars. However, the major source of sugar in the <strong>Australian</strong> diet is sucrose from sugar canewhich is added to foods and is termed an extrinsic sugar. Sucrose is widely used in processedfoods and drinks as a sweetener and also plays a role as a flavour enhancer and preservative.Sugars provide a readily absorbed source of energy, but added sugars can increase the energycontent of the diet while diluting its nutrient density. Sugars are a major factor in dental caries anddiets high in added sugars are also associated with some adverse health outcomes. Sugarsweeteneddrinks (fruit juice drinks, soft drinks, flavoured mineral waters and sports drinks) arethe largest source of sugars in the <strong>Australian</strong> diet, with consumption highest in adolescents andchildren [44]. New evidence emphasises the relevance of sugar-sweetened drinks to thedevelopment of excess weight (see below).Dental caries remains a significant public health problem in Australia. In 2007–8, $6.1 billion wasspent on dental services in Australia, representing 6.2% of all health expenditure [572]. In severecases, dental caries can cause loss of teeth and pain that may reduce dietary intake andcompromise nutritional status.There are particular concerns about the recent increase in consumption of added sugars fromsweetened drinks (see Chapter 4).DRAFT <strong>Australian</strong> <strong>Dietary</strong> <strong>Guidelines</strong>- December 2011 87
3.3.2 The evidence for ‘limiting intake of foods anddrinks containing added sugars’All previous <strong>Australian</strong> dietary guidelines have recommended restricting added sugars. There hasbeen little change in the evidence linking added sugars with dental caries, but the targetedliterature review found strengthened evidence for a relationship between sugar-sweetened drinksand excess weight gain.The evidence statements and gradings (A- convincing association, B- probable association, C-suggestive association) from the Evidence Report (literature from years 2002 – 2009) arepresented in the table below. This does not include evidence from other sources, such as the 2003<strong>Dietary</strong> <strong>Guidelines</strong> (where evidence was classified as level I, II or III in which individual studieswere classified according to their design but overall grades for relationships were not derived),although these sources have been used to inform the <strong>Guidelines</strong>.Evidence StatementConsumption of sugar-sweetened beverages is associated with increased risk ofweight gain in adults and childrenHigh or frequent consumption of added sugars, particularly for infants and youngchildren, is associated with increased risk of dental cariesConsumption of soft drink is associated with increased risk of dental caries inchildrenConsumption of soft drinks is associated with increased risk of reduced bonestrength.GradeBCCC3.3.2.1 Cardiovascular disease, type 2 diabetes and excess weightExcess weight: Recent studies show evidence of a probable association between sugar-sweeteneddrinks and weight gain in adults and children (Grade B, Section 15.1 in Evidence Report [14]) [448-459]. A more recent longitudinal study also strengthens the evidence associating sugar-sweeteneddrinks with weight gain [573].There is insufficient consistent evidence available to form an evidence statement about fruit juicesand weight gain. Some studies found no association in children [392-394, 456] while two studies inchildren [449, 574] and one in adults [575] did find an association. Children drinking less fruit juice[192] and those who consume more fruit [457] had lower BMI Z-scores, and children at risk ofbecoming overweight had a higher risk of gaining fat if they consumed fruit juice [449].DRAFT <strong>Australian</strong> <strong>Dietary</strong> <strong>Guidelines</strong>- December 2011 88
No large studies have measured the long-term development of overweight and obesity specificallyrelated to consumption of sugars, although one retrospective cohort study reported that adultswho consumed less sugar-sweetened foods had less increase in skinfold fat and waistcircumference over a five-year period (Section 14.3, Evidence Report [14]; [192].Type 2 diabetes: Insufficient studies were identified to develop an evidence statement for intake ofsugars and type 2 diabetes [576, 577]. However, more recent studies indicate that sugarsweeteneddrinks may increase the risk of developing type 2 diabetes [578]. A recent metaanalysisalso supports an increased risk for type 2 diabetes and the metabolic syndrome fromconsumption of sugar-sweetened drinks [579].Cardiovascular disease: There is no new evidence that sugars play a causal role in thedevelopment or moderation of the risk factors for cardiovascular disease. Early studies suggestedthat a reduction in dietary sucrose could lower elevated triglyceride levels, but it is likely that theeffects seen were the result of a reduction in energy intake and body weight [580].3.3.2.2 CancerThere is evidence suggesting that consumption of sucrose is not associated with the risk of cancer(Grade C, Section 14.1 in Evidence Report [14]) [581-585]. The World Cancer Research Fundfound no convincing or probable evidence of increased risk of all cancers with the intake of sugars,but some limited evidence of an association between a high intake of sugars and increased risk ofcolorectal cancer [586]. The most recent WCRF statements urge caution with energy-dense foodsand sugar-sweetened drinks because of their association with obesity and its link with somecancers [42].3.3.2.3 Other conditionsDental caries: The relationship between sucrose and dental caries was first documented morethan a century ago [587] and has been confirmed in numerous studies since [588]. Historically, theprevalence of dental caries has increased when dietary patterns have changed to include moreadded sugars and foods containing refined starches. New evidence supports past findings andsuggests that high or frequent consumption of added sugars, particularly for infants and youngchildren, is associated with increased risk of dental caries (Grade C, Section 14.2 in EvidenceReport [14]) [589-593]. The evidence also suggests that dental caries are related to sugarsweeteneddrinks (Grade C, Section 15.4 in Evidence Report [14]) [589, 591].Caries are associated with national per capita yearly sucrose consumption, with very little caries inchildren at 10 kg/year (about 30 g/day) or less. A steep increase may occur from 15 kg/yearupwards [88].DRAFT <strong>Australian</strong> <strong>Dietary</strong> <strong>Guidelines</strong>- December 2011 89
The sugars contained in the cellular structure of foods, such as the intrinsic sugars of fresh fruitand vegetables, have been found to have little cariogenic potential, whereas foods high in extrinsicsugars are most damaging to teeth [594].Bone strength: Evidence suggests an association between consumption of soft drinks andincreased risk of reduced bone strength (Grade C, Section 15.3 in Evidence Report [14]) [476-479]. Cola drinks (sugar-sweetened and diet varieties), but not other carbonated drinks, areassociated with significantly lower bone mineral density in women, but not in men [479]. In youngmen, significant adverse changes in indices of bone remodelling and bone resorption markersoccurred when cola drinks were added to a low-calcium diet compared with adding milk [476]. Asystematic review reported an inverse relationship between soft drink consumption and milkintake [458].It appears that soft drink consumption is associated with some problems related to bone health,but, with the exception of some limited evidence related to cola drinks, it remains unclearwhether soft drinks exert a direct effect or reflect their inverse relationship with milkconsumption.ADHD: There is no evidence that added sugars are involved in the aetiology of attentiondeficit/hyperactivity disorder (ADHD) [595].3.3.3 How limiting intake of foods and drinks containingadded sugars may improve health outcomesDental caries: Important factors for development of caries include the bacterium Streptococcusmutans, dietary sugars and a susceptible tooth surface. Fermentable carbohydrates (both sugarsand starches) are a substrate for bacteria such as S. mutans and S. sobrinus, which increase the acidproducingpotential of dental plaque [596]. <strong>Dietary</strong> sugars other than sucrose - for example,glucose and lactose - can also induce caries, although these sugars are less cariogenic than sucrosebecause, in addition to being converted to acid metabolites, sucrose is uniquely used forextracellular polysaccharide synthesis.Oral hygiene, dental care, fluoridated water supplies, the type of food and salivary function arealso important. The more frequently foods containing added sugars are consumed, the greater therisk of caries since frequent consumption does not allow remineralisation of the teeth [597]. Theduration of exposure depends on how long sugary foods stay in the mouth and the number ofeating occasions. On the basis of the scientific evidence, advice on sugar intake for the preventionof dental caries should include frequency of intake as well as the amount. The acidity of sweeteneddrinks is also relevant to dental erosion, a major factor in dental decay [483]. This applies equallyto sugar-sweetened or diet soft drinks, since their acidity is comparable.DRAFT <strong>Australian</strong> <strong>Dietary</strong> <strong>Guidelines</strong>- December 2011 90
Excess weight: Many foods containing added sugars, including soft drinks, confectionery, cakesand biscuits, are energy-dense but nutrient-poor. The association between sugar-sweetened drinksand weight gain appears to be related to the reduced effect on satiety with sugars in a liquidmedium. Past studies found that compensation for energy from sugar-sweetened drinks is lesscomplete than that for energy in solid form [598]. Newer evidence backs this failure tocompensate by reducing energy intake from other foods or drinks [578]. Sugar-sweetened drinkstherefore add to total energy intake [599].Nutrient density may also be compromised by a high intake of added sugars. At any given level ofenergy intake, as the proportion of added sugars in the diet increases, the nutrient density will fall[600]. This was quantified in a recent analysis of NHANES data (2003–2006) which noted thatintake of essential nutrients was less with each 5% increase in added sugars above 5–10% of energy[601].3.3.4 Practical considerations: Limiting intake of foodsand drinks containing added sugarsIn light of the current prevalence of overweight and obesity (see Chapter 4), the dietary guidelinesof many countries recommend significant reductions in foods that contribute to energy whileproviding few, if any, nutrients [143]. Many foods and drinks containing some fats, added sugarsand some starches, and alcohol fit into this category. Sugars provide approximately a quarter ofchildren’s energy intake, with 4.6–7.6% of energy coming from sugar-sweetened drinks other thanmilk [13].There is insufficient evidence to recommend an exact intake of added sugars suitable for thewhole population. From a nutritional perspective, good health can be achieved without theaddition of sugars in any form to the diet. <strong>For</strong> those who are not overweight and are alreadyconsuming an adequate diet (a minority of the population), added sugars relate mainly to theproblem of dental caries. <strong>For</strong> the majority of the population, however, overweight and obesity aremajor problems and require a reduction in energy intake. Limiting added sugars, particularly fromsugar-sweetened drinks, is one strategy for adults and children. The World <strong>Health</strong> Organizationrecommends that no more than 10% of energy should come from added sugars [88]. Recent datafrom the US suggests a level of 5–10% of energy from added sugars may be appropriate [601]. Thisis much less than current <strong>Australian</strong> consumption, reinforcing the continued need for thisGuideline.3.3.4.1 InfantsBaby-bottle caries is a recognised problem in infants who are pacified by sucking on a bottle forlong periods. Babies who fall asleep while continuing to feed from a bottle containing infantformula, fruit juice or other sugar-containing liquid can develop a severe form of tooth decay[602]. Infants do not need added sugars and the Australia New Zealand Food Standards CodeDRAFT <strong>Australian</strong> <strong>Dietary</strong> <strong>Guidelines</strong>- December 2011 91
stipulates that ready-prepared infant foods with more than 4g of added sugars per 100g must belabelled as ‘sweetened’ [234].3.3.4.2 ChildrenMilk and water are the recommended drinks for children. Children and adolescents should limitintake of sugar-sweetened drinks. Common sugar-sweetened drinks include soft drink, ‘sportsdrinks’, ‘vitamin waters’, cordials and energy drinks. Energy drinks may also be high in caffeine (seeChapter 2) and are not suitable for children. Sweetened flavoured milk provides nutrients but canbe high in energy-density; plain milk is preferable.3.3.4.3 Older peopleIncluding a moderate amount of added sugars as a flavour enhancer can increase variety andpalatability for older people and will not compromise nutrient intake if added to nutritious foods.Sugars are also a readily-absorbed source of energy for the frail aged.3.3.4.4 Aboriginal and Torres Strait IslandersIn remote Aboriginal communities, apparent consumption of sugars is much higher than the<strong>Australian</strong> average while consumption of fruit and vegetables is well below the <strong>Australian</strong> average[134]. In remote communities where apparent consumption was measured, refined sugarscontributed approximately 30% of total energy intake, with 60% of the sugars in the form of whitesugar added to foods and drinks. No data are available for urban Indigenous communities.Historically, Aboriginal <strong>Australian</strong>s had substantially fewer dental caries than non-Indigenouspeople, but this trend has been reversed with the oral health of non-Indigenous children improvingand that of Aboriginal children deteriorating [603]. Aboriginal children and other <strong>Australian</strong>children from the lowest socioeconomic groups have not had the improvement in dental healthseen in other children.3.4 Alcoholic drinks3.4.1 Setting the scene<strong>For</strong> many people, an alcoholic drink is a regular and enjoyable part of meals. In terms of nutrition,alcohol is uniquely the only substance that is both a food providing energy and a drug affectingbrain function. <strong>For</strong> these reasons advice on alcohol is included in these <strong>Guidelines</strong>.Drinking alcohol has health, social and economic costs and benefits for both individuals andpopulations. It was previously believed that people who drink small quantities of alcohol may haveDRAFT <strong>Australian</strong> <strong>Dietary</strong> <strong>Guidelines</strong>- December 2011 92
etter health outcomes than those who do not drink, but this finding is being increasinglychallenged [604]. Most studies have found that abstainers have better health outcomes than heavydrinkers.In the <strong>Australian</strong> population, alcohol is responsible for 3.3% of the total disease burden while itprevents 1% of the total disease burden. This equates to a net effect of 2.3%, equivalent to 61,091DALYS (Disability Adjusted Life Years) and 0.8% (1,084) of all deaths [11]. In Indigenous<strong>Australian</strong>s, alcohol is responsible for a net 5.4% of the total disease burden and 6.7% of all deaths[605]. Alcohol is second only to tobacco as a preventable cause of drug-related death andhospitalization [606].The total social costs of alcohol were $15.3 billion in 2004/05, the majority (71%) being fortangible costs such as reduction of the workforce, absenteeism, health care, law enforcement,alcohol education campaigns and research [607, 608].This chapter utilises the recent NHRMC publication <strong>Australian</strong> <strong>Guidelines</strong> to Reduce <strong>Health</strong> Risksfrom Drinking Alcohol [609] with additional evidence sourced from the Evidence Report to informthe revision of the <strong>Guidelines</strong> [14].The alcohol guidelines are as follows.1. <strong>For</strong> healthy men and women, drinking no more than two standard drinks on any one dayreduces the lifetime risk of harm from alcohol-related disease or injury.2. <strong>For</strong> healthy men and women, drinking no more than four standard drinks on a singleoccasion reduces the risk of alcohol-related injury arising from that occasion.3. a. Parents and carers should be advised that children under 15 years of age are at thegreatest risk of harm from drinking and that for this age group, not drinking alcohol isespecially important.b. <strong>For</strong> young people aged 15-17 years, the safest option is to delay the initiation of drinkingfor as long as possible.4. a. <strong>For</strong> women who are pregnant or planning a pregnancy, not drinking is the safest option.b. <strong>For</strong> women who are breastfeeding, not drinking is the safest option.Most recommendations on alcohol consumption are made on the basis of ‘standard’ drinksconsumed. A standard drink in Australia contains 10g of alcohol (equivalent to 12.5mL of alcohol)[609]. The alcohol concentration of drinks is printed on the label in terms of percentage byDRAFT <strong>Australian</strong> <strong>Dietary</strong> <strong>Guidelines</strong>- December 2011 93
volume. However in social situations serving sizes are greater than standard drinks – for example atypical glass of wine in Australia is 170mL [610] which contains close to two ‘standard’ drinks.<strong>For</strong> some groups, the contribution of alcohol to energy intake is significant. Median percentages ofcontribution of alcohol to energy intake for age and sex groups and the energy content ofcommon alcoholic drinks is included at Appendix 6. <strong>For</strong> example, if a man with average energyintake consumed four standard drinks of beer, this would account for 13–15% of his energy intake.The proportion of energy obtained from alcohol for those who consume it peaks at age 19–24 forwomen and 25–44 for men, and declines thereafter.If the consumption of other foods or drinks is reduced to adjust for the extra energy intake fromalcohol, over time this could lead to a deficiency of key nutrients. In view of the increasingprevalence of overweight and obesity, limiting alcohol intake is an important strategy for achievingenergy balance.3.4.2 The evidence for ‘limiting alcohol’The evidence statements and gradings (A- convincing association, B- probable association, C-suggestive association) from the Evidence Report (literature from years 2002 – 2009) arepresented in the table below. This does not include evidence from other sources, such as the 2003<strong>Dietary</strong> <strong>Guidelines</strong> (where evidence was classified as level I, II or III in which individual studieswere classified according to their design but overall grades for relationships were not derived),although these sources have been used to inform the <strong>Guidelines</strong>.Evidence StatementConsumption of alcohol regularly at an intake of 1 standard drink per day forwomen and 1.5-2 per day for men is associated with a reduced risk of CVDmorbidity and mortality.Consumption of alcohol regularly at an intake of 1 standard drink per day forwomen and 1.5-2 per day for men increases HDL cholesterol.Consumption of alcohol, even at low levels (10-15 g/d), is associated withincreased risk of breast cancer.Consumption of alcohol is associated with increased risk of cancer of theoesophagus.Consumption of alcohol, even at low levels (10g/day) of consumption, isassociated with an increased risk of colon cancer and rectal cancer.GradeBBBBCDRAFT <strong>Australian</strong> <strong>Dietary</strong> <strong>Guidelines</strong>- December 2011 94
Evidence StatementConsumption of alcohol, even at low levels (10 g/d) is associated with increasedrisk of liver cancer in some populations.Consumption of alcohol is associated with an increased risk of cancer of the oralcavity, pharynx and larynx.Consumption of alcohol at the level of 1 standard drink per day for women and1.5-2 per day for men, with a maximum intake of 4 standard drinks per day, isassociated with reduced risk of dementia in older adults.GradeCCC3.4.2.1 Cardiovascular disease, type 2 diabetes and excess weightCardiovascular disease: There is evidence of a probable association between consumption of onestandard drink per day for women and 1.5–2 per day for men with a reduced risk ofcardiovascular disease morbidity and mortality (Grade B, Section 16.1 in Evidence Report [14])[611-613]. A meta-analysis evaluating the relationship between alcohol intake and cardiovascularmortality in patients with a history of cardiovascular disease showed a J-shaped dose effect curve,with an alcohol intake of approximately 26g/day having maximal protection. The authorsconcluded that light to moderate alcohol consumption, defined as 5–25g/day, is significantlyassociated with a lower incidence of cardiovascular and total mortality [614]. However theevidence is not yet conclusive, particularly for Asian populations [615];[604];[616];[617].There is evidence of a probable association between consumption of one standard drink per dayfor women and 1.5–2 per day for men with an increase in HDL cholesterol (Grade B, Section 16.1in Evidence Report [14]) [618-625]. Recent reviews of population-based studies [614, 626, 627]support these statements.Although an insufficient number of studies were identified to formulate an evidence statement,excess alcohol consumption has been found to increase the risk of high blood pressure [628, 629].A more recent review supports these findings, suggesting a synergistic effect between alcohol,hypertension and cerebrovascular events [630].The Canadian and <strong>Australian</strong> guidelines on the management of hypertension include themoderation of alcohol intake as an important intervention [631]. High blood pressure is a majorrisk factor for both ischaemic and haemorrhagic stroke [632].Type 2 diabetes: Evidence regarding an association between alcohol intake and risk of type 2diabetes is inconclusive (Section 16.2, Evidence Report [14]).DRAFT <strong>Australian</strong> <strong>Dietary</strong> <strong>Guidelines</strong>- December 2011 95
3.4.2.2 CancerThere is increasing evidence of an association between alcohol consumption and heightened riskof specific cancers. In general, the evidence suggests that different types of alcoholic drink havesimilar effects [42]. The WCRF concludes that the number of cancers for which alcohol is aknown risk factor is increasing. It appears unlikely that there is a threshold of alcohol intake belowwhich there is no effect on cancer risk.Breast cancer: There is evidence of a probable association between consumption of alcohol, evenat low levels (10 g/day), and an increased risk of breast cancer (Grade B, Section 16.4 in EvidenceReport [14]) [633-639].Oesophageal cancer: There is evidence of a probable association between consumption of alcoholand an increased risk of cancer of the oesophagus (Grade B, Section 16.6 in Evidence Report [14])[42, 633].Colon and rectal cancer: The evidence suggests that consumption of alcohol, even at low levels(10 g/day), is associated with an increased risk of colon cancer and rectal cancer (Grade C, Section16.5 in Evidence Report [14]) [42, 633, 640, 641].Liver cancer: The evidence suggests that consumption of alcohol, even at low levels (10 g/day), isassociated with increased risk of liver cancer in some populations (Grade C, Section 16.9 inEvidence Report [14]) [42, 633].Oral cavity, pharynx and larynx: The evidence suggests that consumption of alcohol is associatedwith an increased risk of cancer of the oral cavity, pharynx and larynx (Grade C, Section 16.7 inEvidence Report [14]) [42, 633, 642].Non-Hodgkins lymphoma: Evidence that the consumption of alcohol is associated with Non-Hodgkins lymphoma is inconclusive (Section 16.11, Evidence Report [14]).Other cancers: The evidence that consumption of alcohol is associated with renal, pancreatic andovarian cancer is inconclusive (Section 16.8, 16.10, 16.12 Evidence Report [14]).3.4.2.3 Other conditionsAlcohol-related liver disease: As discussed in the previous dietary guidelines, there is continuingevidence that excess alcohol consumption is associated with an increased risk of alcohol-relatedliver disease (fatty liver, cirrhosis of the liver, alcohol hepatitis) [643]. The same level of averageconsumption is related to a higher risk of liver cirrhosis in women than in men [644].DRAFT <strong>Australian</strong> <strong>Dietary</strong> <strong>Guidelines</strong>- December 2011 96
Dementia: The evidence suggests an association between the consumption of one standard drinkper day for women and 1.5-2 per day for men, with a maximum intake of four standard drinks perday, and a reduced risk of dementia in older adults (Grade C, Section 16.3 in Evidence Report[14]) [645-651].Alcohol use is associated with an increased risk of a number of mental health and social problemsin young adults [652]. The existence of psychiatric comorbidities in young people who drinkheavily is common, especially for conditions such as depression, anxiety, bipolar disorder, conductdisorder and attention-deficit/hyperactivity disorder [652-656].Nutrition-related conditions: Alcohol consumption is linked to malnutrition, Wernicke-Korsakoffsyndrome, folate deficiency, Vitamin A depletion and pellagra [657]. Excessive consumption ofalcohol (severe alcoholism) leads to malnutrition if normal diet is neglected. The financialresources of the patient can be diverted away from purchase of food to acquiring and consumingalcohol. In Australia the fortification of bread with thiamin has contributed to a 40% reduction inthe incidence of Wernicke-Korsakoff syndrome [658, 659].Other conditions associated with harmful levels of alcohol consumption include:• dependence and addiction• endocrine conditions, for example, hypercortisonism and sexual dysfunction• alcoholic related brain damage including alcoholic dementia• gastritis and gastric ulcers• aspiration pneumonia• cardiomyopathy• interactions with pharmaceuticals and illegal recreational drugs [609].3.4.3 How limiting alcohol may improve healthoutcomesAlcohol begins to affect the brain within five minutes of consumption, with blood alcoholconcentration peaking after 30–45 minutes. It takes approximately one hour for the liver to clearthe alcohol from one standard drink from the body, although this time varies depending upon liversize, lean body mass, individual alcohol tolerance and genes controlling the expression of alcoholmetabolisingenzymes in the liver [660-662]. Because the rate of metabolism is fixed, rapidconsumption of multiple drinks results in a higher blood alcohol concentration.Young adults who drink heavily tend to have smaller prefrontal cortices and white matter,structural abnormalities of white matter and reduced hippocampal volumes [663, 664]. Thesestructural changes lead to a diminished ability to retrieve verbal and non-verbal material andpoorer performance in attention-based tests [652].DRAFT <strong>Australian</strong> <strong>Dietary</strong> <strong>Guidelines</strong>- December 2011 97
The loss of brain tissue that occurs in people with chronic alcoholism seems to occurindependently of Wernicke’s encephalopathy and may be related to ethanol toxicity and poornutrition.Cardiovascular effects: The effect of alcohol on the cardiovascular system is complex. Alcohol canraise blood pressure and increase the risk of arrhythmias, shortness of breath, some types ofcardiac failure, haemorrhagic stroke and other circulatory problems. However, low levels ofalcohol raise high-density lipoprotein cholesterol and reduce plaque accumulations in arteries[626, 665]. Alcohol can also have a mild anticoagulant effect.Diabetes: Alcohol affects the management of diabetes through its effects on diet and control ofblood glucose levels. Alcohol interferes with the action of insulin, insulin secretagogues andglucagon, thereby increasing the risk of hypoglycaemia in people with Type I or 2 diabetes whotake these medications [666, 667].Dementia: If alcohol has a protective effect against dementia, this may relate to the effect ofalcohol on blood lipids as one of the causal factors of dementia is microvascular changes within thebrain [668, 669].3.4.4 Practical considerations: Limiting alcoholOf <strong>Australian</strong>s aged over 14 years, 83% reported having consumed alcohol at least once in the 12months preceding the 2007 National Drug Strategy Household Survey, with 8% drinking alcoholon a daily basis and about 47% consuming alcohol at least weekly [670]. The majority of<strong>Australian</strong>s who reported consuming alcohol also reported moderating their intake, primarily toreduce the risk to their health. Methods included counting and limiting the number of drinks,eating food while consuming alcohol, alternating between alcoholic and non-alcoholic drinks anddrinking low-alcohol drinks [670].Nearly all alcohol is consumed as drinks, principally beers and wines. Alcoholic drinks contain fewother nutrients except for the bioactive flavonoids found in wine, mainly in red wine. Alcoholicdrinks are usually consumed with foods, either as part of a meal or accompanied by snack foods,increasing the associated energy intake.The apparent average consumption of alcohol is estimated at 10.08L per person over 15 years oldper year [671], and declines with age [672]. Consumption is 45% higher in the Northern Territorythan in the rest of Australia. The average consumption equates to an additional 650 kJ/day forevery person over 15 years of age from alcohol. Alcoholic drinks that contain added sugar haveadditional energy. Clearly if alcohol is consumed in addition to the normal diet, leading to excessenergy intake compared to requirements, weight will increase.A full stomach will reduce the rate of absorption of alcohol into the bloodstream. Drinking alcoholin combination with eating therefore reduces the rate at which blood alcohol content increases.DRAFT <strong>Australian</strong> <strong>Dietary</strong> <strong>Guidelines</strong>- December 2011 98
Drinking coffee, having a cold shower, vomiting or exercise do not reduce blood alcohol content[609].3.4.4.1 Pregnant and breastfeeding womenAlcohol consumption by pregnant women may harm the unborn baby. Heavy daily drinking orheavy episodes of drinking have the most risk, and the risk from low-level drinking (one or twodrinks per week) is likely to be small. However there is no lower limit that can be guaranteed tobe completely safe, so avoiding alcohol while pregnant or breastfeeding is the safest option [609].There is limited research on the effects of maternal alcohol consumption during lactation andinfant development. Mothers who consume alcohol are more likely to stop breastfeeding beforesix months than mothers who do not drink [673, 674]. Animal and observational studies suggestthat the consumption of two standard drinks or more per day during lactation is associated withdeficits in infant psychomotor development and disrupted infant sleep-wake behavioural patterns[673]. A baby’s intake of alcohol from breastmilk is not harmless. Alcohol levels in breastmilkparallel blood alcohol levels and therefore the longer the time between drinking alcohol andbreastfeeding, the safer for the baby. The safest option for women who are breastfeeding is toabstain from alcohol (see Section 3.4) [609]. <strong>For</strong> those who drink, expressing milk beforeconsuming alcohol is the next best option [609].3.4.4.2 Children and adolescentsAlcohol use by younger people is associated with harmful effects on brain development. TheNHMRC recommends that parents and carers should be advised that children under 15 years ofage are at the greatest risk of harm from drinking. <strong>For</strong> this age group, not drinking alcohol isespecially important. <strong>For</strong> people aged 15−17 years, the safest option is to delay drinking for as longas possible [609].3.4.4.3 Older peopleOlder people are more susceptible than others to the toxic effects of alcohol due to changes intheir body composition, decreased metabolic capacity, the presence of co-morbid conditions andmedications that regulate these conditions [675].Many older people take medications that may interact with alcohol. A combination of alcohol andmedication increases the risk of falls and injury [676-678].The NHMRC Alcohol <strong>Guidelines</strong> state that ‘cumulative alcohol-related harm is more evidentamong older people. <strong>For</strong> some older adults, drinking alcohol increases the risk of falls and injuries,DRAFT <strong>Australian</strong> <strong>Dietary</strong> <strong>Guidelines</strong>- December 2011 99
as well as some chronic conditions. Older people are advised to consult their health professionalsabout the most appropriate level of drinking for their health’ [609].3.4.4.4 Aboriginal and Torres Strait IslandersAboriginal or Torres Strait Islander peoples are more likely than other <strong>Australian</strong>s to abstain fromdrinking alcohol (23% compared to about 15%). However, those who do consume alcohol aremore likely to do so at risky or high-risk levels for short-term harm [670]. In response to severeproblems related to excess alcohol consumption in many Indigenous communities, initiatives havebeen introduced to encourage non-harmful alcohol use, limit access to alcohol, and establish ‘dry’areas and communities. As with the general population, Aboriginal and Torres Strait Islanderpeople should follow the alcohol guidelines described above [609].3.4.4.5 Culturally and linguistically diverse groupsPeople from culturally diverse groups are more likely than the general adult population in Australiato abstain from alcohol (43% compared to 15%) [670]. The possible protective health effect ofmoderate drinking has not been demonstrated in Asian groups. Alcohol drinking customs vary indifferent cultures and typically immigrant groups bring their drinking patterns from their countryof origin.3.4.4.6 People with diabetesAs alcohol and hypoglycaemia have independent but additive effects on cognitive function andbehaviour, it is recommended that people with diabetes abstain from alcohol if they plan to drive[679]. Alcohol worsens medical conditions associated with diabetes, such as liver disease,hypertension and advanced neuropathy [666, 680]. People with diabetes may need to take specialprecautions when drinking and should discuss alcohol use with a health professional.3.4.4.7 Interaction of alcohol and energy drinksA new category of alcoholic drinks is now being marketed in Australia with added caffeine andsometimes other stimulants. The effects of alcohol and other components in these energy drinksappear to be synergistic, resulting in increased intoxication. In comparison to alcohol alone, thecombination of alcohol and energy drink significantly reduces the intensity of subjectiveperceptions of headache, dry mouth, weakness and impairment of motor coordination [681]. Theconcern is that consuming caffeine, a central nervous system stimulant, and alcohol, a depressant,at the same time will reduce subjective perceptions of alcohol-induced impairment in comparisonto alcohol alone [682, 683]. Reduced ability in recognising alcohol impairment may enhance risktakingbehaviour and possibly lead to greater alcohol intake [684].DRAFT <strong>Australian</strong> <strong>Dietary</strong> <strong>Guidelines</strong>- December 2011 100
In the absence of any research to quantify safe levels of concurrent consumption of energy drinksand alcohol, this combination should be avoided.Where to nextThe next chapter provides information on the importance of quantity, as well asquality and overall energy balance, when choosing foods to promote healthyweight, to promote health and wellbeing and to prevent chronic disease.DRAFT <strong>Australian</strong> <strong>Dietary</strong> <strong>Guidelines</strong>- December 2011 101
4. Achieve and maintain a healthyweightGuideline 3To achieve and maintain a healthy weight you should be physically active andchoose amounts of nutritious foods and drinks to meet your energy needs.• Children and adolescents should eat sufficient nutritious foods to grow anddevelop normally. They should be physically active every day and theirgrowth should be checked regularly.• Older people should eat nutritious foods and keep physically active to helpmaintain muscle strength and a healthy weight.DRAFT <strong>Australian</strong> <strong>Dietary</strong> <strong>Guidelines</strong>- December 2011 102
Executive summary<strong>Health</strong>y weight is associated with reduced risk of chronic disease, includingcardiovascular disease, type 2 diabetes and some cancers. Unhealthy weight refersto being underweight, overweight or obese.An optimum dietary pattern for adults to achieve and maintain healthy weight isone in which nutrient requirements are met and total energy intake does not oftenexceed total energy expenditure.Physical activity is an important part of a healthy, active life.The high and increasing prevalence of overweight and obesity in Australia highlightsthe need to provide guidance for achieving and maintaining a healthy weight. Small,persistent excess energy intake will cause excess weight gain in people of any age.Recent evidence highlights the importance of achieving an appropriate energyintake, rather than targeting specific macronutrients (protein, fat orcarbohydrates). In general the quantities of foods outlined in the <strong>Australian</strong> Guide to<strong>Health</strong>y <strong>Eat</strong>ing should not be exceeded and consumption of energy-dense, nutrientpoordiscretionary foods and drinks should be limited.Weight should be measured regularly in adults and the amount and/or quality offood, drinks and physical activity adjusted accordingly. Children and adolescentsneed sufficient nutritious foods to grow and develop normally and their growthshould be checked regularly to ensure appropriate development is occurring.As most <strong>Australian</strong> adults are now of unhealthy weight, this chapter offerspopulation level advice on managing weight gain and reduction while discouraginginappropriate food restriction, particularly among high risk groups.This chapter provides information on the importance of quantity, as well as quality,when choosing foods to achieve healthy weight, to promote health and wellbeingand prevent chronic disease.DRAFT <strong>Australian</strong> <strong>Dietary</strong> <strong>Guidelines</strong>- December 2011 103
4.1 Setting the sceneA healthy weight is a body weight associated with normal growth and development in children,and a reduced risk of short- and long-term morbidity and mortality among people of all ages [685-689]. While it is unhealthy to be underweight, overweight or obese [88, 685], ideal weight variesfrom one person to another and at different stages of life. A small or large persistent excessenergy intake can cause unwanted weight gain in people of any age.There is widespread recognition of a global epidemic of overweight and obesity which requiresurgent attention [89, 685, 690, 691]. Overweight and obesity contributed 7.5% of the burden ofpremature death and disability in Australia in 2003[11]. In Western Australia and Queensland,where more recent data are available, at 8.3–8.6% it has now overtaken cigarette smoking as thesingle greatest contributor of the biomedical risk factors assessed [692, 693].A focus on healthy weight is a more positive way to address weight issues than focusing on obesityand overweight. It encourages those who are a healthy weight to maintain that weight. It also helpsreduce the risk of any unintended negative consequences, such as disordered eating. Promotion ofhealthy weight incorporates prevention and management of underweight, overweight and obesityin children and adults and promotes healthy growth in children.4.1.1 Weight status and trends in Australia4.1.1.1 AdultsMeasured height and weight data in 2007-08 showed that 2% of <strong>Australian</strong> adults wereunderweight, 37% were of healthy weight, 37% were overweight and 25% were obese [694].Overweight and obesity was more common in men than women (68% v 55%) and in people aged65–74 years (75%) than in other age groups.The prevalence of overweight and obesity has increased significantly in Australia and mostdeveloped countries since the 1970s [685, 691, 695], although there is some evidence of areduction in the rate of increase in children and adolescents in Australia over the past decade[696].4.1.1.2 Children and adolescentsA number of national and state-based surveys of children and adolescents using measured heightand weight data have found that between 21–25% of children and adolescents are overweightand/or obese. Between 5–8% are obese and 2–5% are underweight [12, 13, 697-700]. TheDRAFT <strong>Australian</strong> <strong>Dietary</strong> <strong>Guidelines</strong>- December 2011 104
prevalence of obesity alone is higher for boys than girls (10% compared with 6%) [12], althoughthe prevalence of combined overweight and obesity is similar (26% for boys and 24% for girls)[12]. The prevalence of overweight and obesity has increased significantly over the past twodecades. Although the rate of increase appears to be slowing in children [701], the high prevalenceremains of concern [702].Childhood obesity has been identified as one of the most serious public health challenges of the21st century [703]. In the United States it has been predicted that - due to premature mortalityassociated with obesity developing at a younger age - the current generation of children will be thefirst in that country’s history to have a life expectancy lower than their parents[704]. As obesity isan important determinant of a range of health disorders, unless the increasing prevalence ofoverweight and obesity is arrested the burden of chronic disease in future generations will bepandemic [6, 695], causing a crisis in health and economic systems across the world [88, 685, 688].4.1.1.3 Predicted trendsIf current trends continue in Australia, it is estimated that by 2025, 83% of men and 75% ofwomen aged 20 years or more will be overweight or obese [705].The predicted increases would significantly affect disease burden and health care costs, mostly dueto an increased incidence of type 2 diabetes. <strong>For</strong> example, without intervention, type 2 diabeteswill account for around 9% of the total disease burden in Australia in 2023, up from around 5% in2003 [11].DRAFT <strong>Australian</strong> <strong>Dietary</strong> <strong>Guidelines</strong>- December 2011 105
How is healthy weight assessed?The most common approach is the use of the body mass index (BMI) calculated as weight (inkilograms)/height (in metres) 2 (kg/m 2 ).BMI is a measure of body size that is widely used as an index of relative risk of mortality andmorbidity at the population level [687, 691]. The association of mortality with BMI is a U-shapedcurve with the lowest risk within the healthy weight range [687, 706].An adult with a BMI < 18.5 kg/m 2 is categorized as underweight. An adult with a BMI from 18.5 to25.0 is a healthy weight, while an adult with a BMI ≥ 25.0 kg/m 2 is overweight and an adult with aBMI ≥ 30.0 kg/m 2 is obese [691, 707].However, this classification may not be suitable for all ethnic groups. Some groups may haveequivalent levels of risk at lower BMI (e.g. people of Asian origin) or higher BMI (e.g. people ofPolynesian origin) [708]. A BMI range of 23–28kg/m 2 may be desirable for people aged over 70[709]. BMI ranges have not been developed for Aboriginal and Torres Strait Islander people.Waist circumference is also used as a proxy for health risk in adults. A waist circumference above80 centimetres in women or above 94 centimetres in men signifies being overweight. A waistcircumference above 88 centimetres in women or above 102 centimetres in men signifies beingobese [13, 710].Growth during childhood means it is not possible to have a single set of numerical values for BMIcut-offs that apply to all ages and both sexes. Therefore, among children and adolescents, weightappropriateness is commonly categorised using Z-scores (or SD Scores) [711] or age-related cutoffvalues [712, 713]. <strong>For</strong> more information, see Appendix 3.4.1.2 <strong>Health</strong> effects associated with weight status4.1.2.1 AdultsOverweight and obesity are associated with increased risk of type 2 diabetes, cardiovasculardisease, some cancers, hypertension, musculoskeletal conditions, respiratory conditions, socialisolation, depression and other psychological disorders, sleep apnoea, cholecystitis, insulinresistance and metabolic syndrome, hernia, reproductive disorders, urinary incontinence and skinconditions [88, 89, 685]. About 70% of people who are obese have at least one established comorbidity,resulting in medical costs about 30% greater than their healthy-weight peers [714].DRAFT <strong>Australian</strong> <strong>Dietary</strong> <strong>Guidelines</strong>- December 2011 106
Compared to having a BMI between 18.5 and 25, at a BMI of 30–35kg/m 2 , median survival isreduced by 2–4 years, at BMI 40–45kg/m 2 it is reduced by 8–10 years [706]. The relative increasein mortality rate attributable to obesity tends to decline with age [715]. Mortality and morbidityare also associated with the amount of weight gained in adult life [89, 685, 688].Many obesity-related conditions are preventable, and several are at least partially reversiblethrough weight loss achieved by adopting a nutritious dietary pattern and active lifestyle [89, 685,688].While the greatest risk to health on a population basis is associated with being overweight, beingunderweight can also have adverse health consequences including decreased immunity (leading toincreased susceptibility to some infectious diseases), osteoporosis, decreased muscle strength, andhypothermia[37]. Among older people, being underweight may be more deleterious to health thanbeing overweight [716].4.1.2.2 Children and adolescentsThe most immediate consequences of overweight/obesity in childhood is social discriminationassociated with poor self-esteem and depression, increased risk of development of negative bodyimage issues, and eating disorders [688]. Overweight children and adolescents are more likely todevelop sleep apnoea, heat intolerance, breathlessness on exertion and reduced exercisetolerance, tiredness, some orthopaedic and gastrointestinal problems, steatohepatitis and earlysigns of metabolic and clinical consequences, such as hypertension, hyperinsulinaemia,hypertriglyceridaemia and type 2 diabetes [688, 717].A major long-term consequence is that overweight children are more likely to become overweightadults with an increased risk of chronic diseases and early mortality [688, 717-719]. The risk ofchronic disease is increased with rapid weight gain in infancy and early childhood [88, 89].In infancy and early childhood, underweight and failure to thrive can be more prevalent thanoverweight and obesity in some communities. Failure to thrive is most commonly a result ofsocioeconomic factors, including poor living conditions [720] but can also occur among affluentsections of the community due to inappropriate dietary restrictions, for example based on fearsabout ‘unhealthy’ dietary habits leading to the development of atherosclerosis [721]. Specialistadvice should be sought on underweight and failure to thrive in infants and children.Inappropriate dietary restriction and eating disorders occur in some adolescents [722].DRAFT <strong>Australian</strong> <strong>Dietary</strong> <strong>Guidelines</strong>- December 2011 107
4.1.3 Causes of overweight and obesity in the population<strong>Health</strong>y body weight results from an appropriate balance between energy intake and expenditure(of which physical activity is a component) [89, 688, 723]. At the population level, there isincreasing evidence that excess energy intake is a major contributor to current energy imbalances[88, 723-728].4.1.3.1 The obesogenic environmentObesity is a complex condition mediated by an individual’s metabolism and behaviour as well associetal and environmental factors.Although some genetic factors may increase an individual’s susceptibility to being overweight orobese, the dramatic increases in prevalence of overweight and obesity over the past three to fourdecades without any major change in the gene pool suggests that socio-environmental factors areprimarily responsible for the current epidemic [88, 89, 685, 688, 726, 727, 729]. Significant socioenvironmentalchanges during this period include, but are not limited to:• changes in the food supply, particularly increased availability and decreased relative cost offoods which tend to be higher in energy density and relatively nutrient-poor [730]• increased availability and marketing of energy-dense, nutrient-poor foods and drinks• urban design which reduces energy expenditure during daily activities and increasedreliance on car and labour-saving devices [726, 731]• reduced perceptions of safety leading to fewer opportunities for physical activity [732, 733]• economic and consumer changes, such as a greater number of females in the paidworkforce, decreased food literacy and cooking skills, and greater reliance on convenienceand takeaway foods [728, 729, 734].These changes all promote excess weight gain by fostering consumption of energy-dense andrelatively nutrient-poor foods and/or reduced physical activity [726, 735-738].Against such social and physical environments, overweight and obese individuals need support,rather than criticism and discrimination. <strong>Health</strong>y weight initiatives must achieve a balance betweenindividual and societal responsibility and be culturally appropriate, widely available and accessible,particularly to disadvantaged and vulnerable groups [89, 739].DRAFT <strong>Australian</strong> <strong>Dietary</strong> <strong>Guidelines</strong>- December 2011 108
Kilojoules4.1.3.2 Energy intake and trend dataEnergy intake increased in the decade or so to 1995 by 3–4% in adults (see Figure 4.1) [740-743],This increase equates to an additional 900kJ to1400kJ per day across all groups. Withoutcompensatory increases in energy expenditure, these changes are enough to result in thesignificant observed increase in mean body weight [48].More recent data will be available soon as dietary intakes of people aged two years and over arebeing collected in the <strong>Australian</strong> <strong>Health</strong> Survey in 2011-2012 [93].Figure 4.1 Mean energy intakes of adults: 1983 and 1995*140001200010000Mean energy intakes of adults: 1983 and 19958000600019831995400020000MalesFemales* Figure adapted from Cook et al (2001)[48]Energy intake in the decade or so from 1983 to 1995 increased by 11% for 10–15 year-olds girlsand by 15% for 10–15 year-olds boys [48]. Accounting for seasonal differences in the datacollections, the results of the 2007 <strong>Australian</strong> National Children’s Nutrition and Physical Activity Surveyshow that mean energy intakes have since decreased in boys aged 10-15 years and slightlyincreased in girls aged 10-15 years from 1995 to 2007 (see Figure 4.2).DRAFT <strong>Australian</strong> <strong>Dietary</strong> <strong>Guidelines</strong>- December 2011 109
KilojoulesFigure 4.2 Mean energy intakes of children aged 10-15 years: 1995 and 2007**Mean energy intakes of children aged 10-15 years: 1995 and 200712000100008000600040002000199520070BoysGirls** Unpublished FSANZ analysis; 1995 data restricted to February to August to match the time frame of the 2007survey; 2007 survey analysis used the first day of food data only.4.1.3.3 Energy from macronutrientsMacronutrients (proteins, fats and carbohydrates) all contribute to dietary energy intake [9].Alcohol also contributes to dietary energy, and it is recommended that alcohol intakes shouldcontribute less than 5% of dietary energy because of the negative association between intake ofalcohol and health outcomes (see Chapter 3).There is a growing body of evidence that the relative proportions of macronutrients consumedcan affect the risk of chronic disease and may also affect micronutrient intake [9]. Optimalproportions of the type of fat (for example, saturated, polyunsaturated or monounsaturated orspecific fatty acids within one or more of these categories) and carbohydrate (for example,complex or simple, starches or sugars) may also be important to reduce chronic disease risk [9].The estimated Acceptable Macronutrient Distribution Ranges related to reduced risk of chronicdisease, are:• 20-35% of total energy intake from fat• 45-65% from carbohydrate• 15–25% from protein [9].The risk of chronic disease, overweight and obesity, and inadequate micronutrient intake mayincrease outside these ranges, but there are insufficient data available at extremes of populationintake [9].DRAFT <strong>Australian</strong> <strong>Dietary</strong> <strong>Guidelines</strong>- December 2011 110
4.1.3.4 Energy intake from specific food groupsThe increased energy consumption in the decade or so to 1995 was largely driven by an increasein the consumption of cereal-based foods (including cakes, biscuits, pies, pizza and some desserts),confectionery and sugar-sweetened drinks [48]. In 1995, <strong>Australian</strong>s consumed two to four timesthe recommended limits of energy-dense and nutrient-poor foods, classified as extra foods,contributing almost 36% and 41% of total energy intake and 41% and 47% of total fat intake inadults and children, respectively [46, 744].As an example, changes in food group consumption for boys are illustrated in Figure 4.3. Amongthese was a significant decrease in intake of fats and oils from oils and spreads, but an increase inintake of fats from other sources, such as cereal-based foods and confectionery [48], most ofwhich were extra foods in the <strong>Australian</strong> Guide to <strong>Health</strong>y <strong>Eat</strong>ing [45]. No subsequent reliable,comparable national data are available.Figure 4.3 Mean consumption of selected food groups by boys aged 10–15 years: 1985 and1995** Figure adapted from Cook et al (2001)[48]4.1.3.5 Energy expenditureTotal daily energy expenditure includes resting energy expenditure (basal metabolic rate plusnecessary tissue repair and the thermic effect of food), and energy expended in physical activity[9]. Resting energy expenditure makes up 60-80% of total energy expenditure, and is mainlyrelated to lean body mass [9]. Active energy expenditure, which accounts for up 20-40% of totalDRAFT <strong>Australian</strong> <strong>Dietary</strong> <strong>Guidelines</strong>- December 2011 111
energy expenditure, depends on both the amount of physical activity and the body mass to bemoved during the process. Active energy expenditure is the only aspect of energy expenditurewhich is under conscious control through physical activity [9, 745].Resting energy expenditure, active energy expenditure and total energy expenditure are allsubstantially increased in obesity, [746] which contradicts the view that obesity is due to ‘lowmetabolism’ and is maintained despite a low level of food intake [723]. However energyexpenditure per kilogram of body mass does decline with increasing BMI, even at the samephysical activity level [745].4.1.4 Physical activityPhysical activity includes both structured activities such as sport or organised recreation andunstructured activities such as incidental daily activities at work or home such as gardening orwalking/cycling for leisure or transport [747].<strong>For</strong> the current <strong>Australian</strong> recommendations for physical activity, see Appendix 4.4.1.4.1 Physical activity levels of specific groupsThe proportion of <strong>Australian</strong> adults reporting recommended levels of physical activity declinedfrom 62% in 1997 to 57% in 2000 [748], with no subsequent reliable national data available forcomparison. The 2007–08 National <strong>Health</strong> Survey results cannot directly assess compliance withphysical activity recommendations due to different methodology. However, state-based surveyresults suggest small increases in physical activity participation at levels providing health benefitssince around 2004 [4, 749, 750]The National Children’s and Adolescent’s Nutrition and Physical Activity Survey found that 69% of<strong>Australian</strong> children were likely to meet the physical activity guidelines on any given day [13].Adolescent girls were less active than boys, particularly in the older age groups. Underweight andobese children tended to have lower physical activity levels than children of a healthy weight [13].Available state data were generally consistent with these findings [697, 751, 752].In 2007, <strong>Australian</strong> children aged 9–16 years spent more than 3.5 hours/day on average insedentary behaviour such as watching television, playing video/computer games and/or usingcomputers more generally [13]. On any given day, 67% of children spend more than therecommended maximum of 120 minutes of recreational screen time.DRAFT <strong>Australian</strong> <strong>Dietary</strong> <strong>Guidelines</strong>- December 2011 112
4.1.4.2 Benefits of physical activityPhysical inactivity accounted for 6.6% of the burden of disease in Australia in 2003. Substantialpopulation health gains are possible if the community adopts more regular moderate physicalactivity [11]. Being physically active:• reduces the risk of all-cause mortality [753, 754]• is an important factor in the prevention and management of a range of chronic diseases,including heart disease, stroke, high blood pressure, type 2 diabetes and some cancers[755, 756]• is associated with reduced risk of injury [755, 756]• offers other health benefits, including building and maintaining healthy bones, muscles andjoints [755, 756]• improves self-esteem, self-image and quality of life [755-758].The greatest health benefit is found in moving from no activity to low levels of activity, but even athigher levels of activity, benefits accrue from additional activity [753, 754]. Benefits have beendescribed for all age groups and physically active children are more likely to remain physicallyactive throughout adolescence and into adulthood [759, 760].4.2 The evidence for ‘achieving andmaintaining a healthy weight’The evidence statements and gradings (A- convincing association, B- probable association, C-suggestive association) related to ‘healthy weight’ from the Evidence Report (literature from years2002 – 2009) are presented in the table below. This does not include evidence from othersources, such as the 2003 <strong>Dietary</strong> <strong>Guidelines</strong> (where evidence was classified as level I, II or III inwhich individual studies were classified according to their design but overall grades forrelationships were not derived), although these sources have been used to inform the <strong>Guidelines</strong>.Evidence StatementCompared to infants who are formula fed, being breastfed is associatedwith reduced risk of becoming obese in childhood, adolescence, and earlyadulthood.Increased birth weight, especially above 4,000g, is associated withincreased risk of overweight or obesity in childhood, adolescence, andlater in life.Excessive weight gain relative to height during childhood is associated withGradeAAADRAFT <strong>Australian</strong> <strong>Dietary</strong> <strong>Guidelines</strong>- December 2011 113
an increased risk of overweight later in life.Parental overweight or obesity is associated with increased risk of childoverweight or obesity. The risk is greater when both rather than oneparent is overweight or obese.Behavioural interventions including diet and exercise reduce the risk ofoverweight or obesity in overweight children. These interventions aremore effective when they are family-based.Lifestyle interventions combining diet and physical activity interventionsare associated with reduced risk of developing type 2 diabetes in adults.Consumption of sugar-sweetened beverages is associated with increasedrisk of weight gain in adults and childrenConsumption of 3-5 serves per day of cereal foods (mainly wholegrain) isassociated with a reduced risk of weight gainBabies born to mothers who smoke during pregnancy are at an increasedrisk of development of overweight or obesity in adolescence andadulthood.Combined diet and physical activity interventions is associated withreduced risk of overweight and obesity in childrenCombined diet and physical activity interventions is associated withreduced risk of overweight and obesity in adults.Consumption of vegetables is associated with reduced risk of weight gainConsumption of fruit is associated with a reduced risk of obesity andweight gain.Hours spent watching television by children is associated with increasedrisk of development of overweight or obesity.In developed countries, a low family income or socioeconomic status isassociated with increased risk of overweight or obesity during childhood,adolescence, and young adulthood.Low socio-economic status is associated with an increased risk ofoverweight or obesity.Interventions delivered in the school environment that are focused oneating and physical activity improve weight outcomes in children.AABBBBCCCCCCCCDRAFT <strong>Australian</strong> <strong>Dietary</strong> <strong>Guidelines</strong>- December 2011 114
4.2.1 Primary preventionDiet and physical activity: The evidence from recent reviews of combined diet and physicalactivity interventions for children suggests that these can prevent overweight and obesity (GradeC, Section 22.1 in Evidence Report [14]) [761-765].The evidence from primary prevention diet and physical activity interventions in adults alsosuggests that these can prevent overweight and obesity (Grade C, Section 22.2 in Evidence Report[14]) [766]. Lifestyle interventions combining diet and physical activity interventions are probablyassociated with reduced risk of developing type 2 diabetes in adults (Grade B, Section 22.3 inEvidence Report [14]) [761-765].Favourable outcomes were consistently observed in interventions focusing on both reducedenergy intake and increased physical activity, supporting the previous evidence statements thatcombined interventions assist weight loss and weight control in both children and adults [767].4.2.1.1 <strong>Dietary</strong> patterns and specific foods and drinksFat: The previous dietary guidelines and many international public health organisations, includingthe World <strong>Health</strong> Organization [685], emphasised the major role of fat consumption in thedevelopment of obesity and of reducing fat intake in the dietary management of obesity oroverweight. More recently, WHO has shifted its emphasis, saying there is convincing evidence thatenergy balance is critical to maintaining healthy weight and ensuring optimal nutrient intakes,regardless of macronutrient distribution and percentage of total fat [768].Sugar: No large long-term studies have measured the long-term development of overweight orobesity specifically related to sugar consumption (Section 14.3, Evidence Report [14]). However,recent evidence shows it is probable that consumption of sugar-sweetened drinks (soft-drinks) isassociated with increased risk of weight gain in adults and children (Grade B, Section 15.1 inEvidence Report [14]) [448-459]. A later longitudinal study adds confirmation [769].The literature review to inform the revision of the <strong>Dietary</strong> <strong>Guidelines</strong> for Americans, 2010 foundstrong evidence that greater intake of sugar-sweetened drinks is associated with increasedadiposity in children and moderate evidence that consumption of sugar-sweetened drinks isassociated with increased body weight in adults [143]. Most of the relevant research (see Chapter3) was conducted in the United States where, unlike Australia, fructose/high fructose corn syrup iscommonly used to sweeten soft drinks. Although these sweeteners differ only slightly from thoseused commonly in Australia, this was taken into consideration in the grading of the EvidenceStatement for this guideline.The review for the US guidelines also found strong and consistent evidence that glycaemic indexand/or glycaemic load are not associated with body weight and do not lead to greater weight lossDRAFT <strong>Australian</strong> <strong>Dietary</strong> <strong>Guidelines</strong>- December 2011 115
or better weight management [143]. These factors were not included in the literature review toinform the revision of these <strong>Guidelines</strong>. There is also considerable variability in these indicesdepending on inter-and intra-individual factors and the form of food (including the degree ofprocessing, stage of ripeness, cooking and cooling times), which may limit practical application[770].Specific foods and drinks: There is increasing evidence that consumption of specific foods andfood groups is associated with risk of excess weight gain. There is evidence suggesting thatconsumption of vegetables is associated with a reduced risk of weight gain (Grade C, Section 2.2in Evidence Report [14]) [156, 158-160]. The evidence also suggests that consumption of fruit isassociated with a reduced risk of obesity and weight gain (Grade C, Section 1.3 in Evidence Report[14]) [156-160, 190-193]. The literature review to inform the revision of the <strong>Dietary</strong> <strong>Guidelines</strong> forAmericans, 2010 found that the evidence for an association between increased fruit and vegetableintake and lower body weight is modest, but may be important in the long term [143].The US literature review also found strong evidence of a positive relationship between portionsize and body weight [143].Recent evidence suggests that consumption of dairy foods is not associated with weight change orrisk of obesity (Grade C, Section 5.8 in Evidence Report [14]) [382, 385-389] and thatconsumption of milk is not associated with BMI or BMI change in childhood (Grade C, Section 5.9in Evidence Report [14]) [265, 385, 391, 393, 394, 771]. These findings are consistent with thoseof the literature review to inform the revision of the <strong>Dietary</strong> <strong>Guidelines</strong> for Americans, 2010 whichfound strong evidence that intake of milk and milk products provide no unique role in weightcontrol [143].There is evidence of a probable association between consumption of 3–5 serves per day of grain(cereal) foods (mainly wholegrain) and a reduced risk of weight gain (Grade B, Section 6.5 inEvidence Report [14]) [249, 261-270].There is evidence to suggest that consumption of nuts (between 65–110gm per day) is not relatedto risk of weight gain in the short term (Grade C, Section 8.1 in Evidence Report [14]) [353-358].The literature review to inform the revision of the <strong>Dietary</strong> <strong>Guidelines</strong> for Americans, 2010 also foundthat, for most children, there was limited evidence that intake of 100% fruit juice is associated withincreased adiposity when consumed in amounts that are appropriate for the age and energy needsof the child. However, increased intake of 100% fruit juice was found to be associated withincreased adiposity in children who were already overweight or obese [143].In seeking to achieve and maintain a healthy weight it is prudent to choose nutrient-dense foods oflower energy density (that is, those low in total fat, particularly saturated fat, and added sugars(see Chapter 3) in a total dietary pattern that seeks to control overall energy intake [772]. Theliterature review to inform the revision of the <strong>Dietary</strong> <strong>Guidelines</strong> for Americans, 2010 found strongDRAFT <strong>Australian</strong> <strong>Dietary</strong> <strong>Guidelines</strong>- December 2011 116
and consistent evidence that dietary patterns that are relatively low in energy density improveweight loss and weight maintenance in young adults [143].4.2.1.2 Factors associated with risk of overweight and obesityBreastfeeding: There is convincing evidence that breastfeeding infants, compared with formulafeeding, is associated with a reduced risk of becoming obese in childhood, adolescence and earlyadulthood (Grade A, Section 17.2 in Evidence Report ([14])[773].Birthweight: Increased birthweight, especially above 4,000g, is associated with increased risk ofoverweight or obesity in childhood, adolescence, and later in life (Grade A, Section 17.1 inEvidence Report [14]) [54, 58, 61, 62, 79, 774, 775]. There is a J- or U-shaped relationshipbetween birthweight and increased risk of child or adult obesity, with both low birthweight andhigh birthweight babies being at increased risk [776].Childhood weight gain: There is convincing evidence that excessive weight gain relative to heightduring childhood is associated with increased risk of being overweight later in life (Grade A,Section 17.4 in Evidence Report [14]) [58, 777, 778].There is convincing evidence that parental overweight or obesity is associated with increased riskof child overweight or obesity. The risk is greater when both rather than one parent is overweightor obese (Grade A, Section 17.7 in Evidence Report [14]) [49-62].Maternal smoking: There is evidence that babies born to mothers who smoke during pregnancy,as an independent risk factor, probably have a higher risk of becoming overweight or obese inadolescence and adulthood (Grade B, Section 17.5 in Evidence Report [14]) [52, 54, 59-61, 779].Television: Recent evidence suggests that hours spent watching television by children is associatedwith increased risk of overweight or obesity (Grade C, Section 17.3 in Evidence Report [14]) [49,60, 64-71, 780-782]. Media use, including television viewing, may displace time children spend inphysical activities [782, 783] and eating meals and snacks in front of television may also beassociated with increased energy intake [784].Socioeconomic status: There is evidence from developed countries to suggest that a low familyincome or socioeconomic status is associated with increased risk of overweight or obesity duringchildhood, adolescence and young adulthood (Grade C, Section 17.9 in Evidence Report [14]) [49,52, 55, 64, 65, 68, 72-74]. Similarly the evidence suggests that low socio-economic status isassociated with an increased risk of overweight or obesity (Grade C, Section 17.10 in EvidenceReport [14]) [59, 62, 775, 785-788].DRAFT <strong>Australian</strong> <strong>Dietary</strong> <strong>Guidelines</strong>- December 2011 117
Other factors: Although there were insufficient studies to make an evidence statement, otherfactors associated with increased risk of overweight and obesity throughout life included:• being overweight in adolescence [78]• consumption of any take away food and low quality snacks [75-77]• childhood smoking [78, 83]• increased price of fruit and vegetables [68, 79]• low self esteem and/or depression [80-82]• low locus of control score [84, 85]• stressful family life [86, 87]• food insecurity [65, 81, 789]• self-reported dieting [76, 82, 790], particularly in girls [791]• inadequate sleep [60, 780, 792, 793]• low rates of breakfast consumption [794].The literature review to inform the revision of the <strong>Dietary</strong> <strong>Guidelines</strong> for Americans, 2010 foundstrong and consistent evidence indicating that children and adults who eat fast food, particularlythose eating at least one fast food meal per week, are at increased risk of weight gain, overweightand obesity. There was not enough evidence at this time to similarly evaluate eating at other typesof restaurants and risk of weight gain, overweight and obesity [143]. The US literature review alsofound moderate evidence suggesting that children who do not eat breakfast are at increased riskof overweight and obesity, with the evidence being stronger for adolescents [143].There appear to be complex relationships between dietary patterns as a child and dietary qualityover time. Studies in the US suggest that frequency of consuming take away food increases withage and is associated with higher intakes of energy, total fat, saturated fat and sodium [90], whilefrequency of breakfast consumption decreases with age and skipping breakfast is associated withreduced intake of calcium and dietary fibre [91]. There is some evidence that family meal patternsduring adolescence predict diet quality and meal patterns during early young adulthood [92].The literature review to inform the revision of the <strong>Dietary</strong> <strong>Guidelines</strong> for Americans, 2010 also founda limited body of evidence showing conflicting results about whether liquid and solid foods differ intheir effects on energy intake and body weight, except that soup at a meal may lead to decreasedenergy intake and body weight [143].Finally, an emerging body of evidence documents the impact of the food environment on bodyweight in children and adults. Moderately strong evidence now indicates that the foodenvironment is associated with dietary intake, especially lower consumption of vegetables andfruits and intakes resulting in higher body weight [143]. This is discussed further in Appendix 7.DRAFT <strong>Australian</strong> <strong>Dietary</strong> <strong>Guidelines</strong>- December 2011 118
4.2.2 Secondary preventionBehavioural interventions: There is convincing evidence that behavioural interventions includingdiet and physical activity reduce the risk of obesity in overweight children. These interventions aremore effective when they are family-based (Grade A, Section 17.12 in Evidence Report [14]) [795-798].Recent evidence suggests that interventions delivered in the school environment that are focusedon healthy eating and physical activity improve weight outcomes in children (Grade C, Section17.11 in Evidence Report [14]) [799, 800].4.3 How dietary patterns can affect energyintake and balance and weight outcomesFrom a population perspective, the dramatic increase in the prevalence of obesity in Australia andother developed countries over the past 30 years cannot be explained by genetic factors.Environmental and lifestyle factors resulting in a decrease in physical activity and overconsumptionof energy in the diet provide the most reasonable explanation. Only a small, persistent energyimbalance is required to cause excessive weight gain in both children and adults, which over timeprogressively increases BMI [723, 727]. Available data from developed countries, includingAustralia, confirm an increase in energy intake concurrent with the dramatic increase in theprevalence of overweight and obesity in children and adults since 1980 [727].There has been much debate about the role of energy, carbohydrate and fat intake in the obesityepidemic [772, 801, 802]. While reducing fat intake has been recognised as an important strategyto reduce energy intake in successful weight loss interventions [801], there is little evidence thatpopulation fat intake is associated with the obesity epidemic independently of total energy intake[802].Foods with a higher energy density encourage energy intake above requirements [143, 803].However, foods that are high in energy density tend to be more palatable, and high palatability isassociated with increased food intake in single-meal studies [730, 804]. Fat and sugar are positivelyassociated with energy density while water and dietary fibre are negatively associated. Fat plays arole because of its high energy density compared to protein and carbohydrates. Water and dietaryfibre play a role through a dilution effect, although this is less for dietary fibre because of the muchsmaller range of fibre concentration in food compared with both water and fat.It is plausible that the proportions of macronutrients (fat, carbohydrate, protein and alcohol) andtypes of macronutrients comprising total energy intake may affect an individual’s propensity tohabitually overconsume. In this regard, dietary patterns which tend to be relatively low in total fatDRAFT <strong>Australian</strong> <strong>Dietary</strong> <strong>Guidelines</strong>- December 2011 119
and moderate (not high) in carbohydrate are consistent with reduced risk of excessive weight gain.Energy from drinks, in particular, may add to total energy intake without displacing energyconsumed in the form of solid food, and it is plausible that energy-dense drinks may contribute toexcessive energy intake through lack of impact on satiety [771]. The satiety value of foods mayalso be important in managing appetite and hunger. Evidence suggests that protein-rich foods anddietary patterns have a greater effect on satiety than foods and dietary patterns high in fat andcarbohydrate [805].Energy-dense dietary patterns are associated with higher consumption of grain-based foods, fatsand sweets and lower consumption of vegetables and fruit [806]. International data suggest thatthe major foods contributing to increased energy intake include sweetened drinks, snack foodsand fast food [803, 807, 808] and that increasing portion size is also an important contributor[143, 809, 810]. The low cost of energy-dense nutrient-poor food relative to nutrient-dense foodis also a major contributor to the obesity epidemic [803, 806].Positive outcomes have been described, at least in the short term, in clinical weight loss regimesthat include both dietary and physical activity interventions [811, 812].4.4 Practical considerations: Achieving andmaintaining a healthy weightAs is the case internationally [714], overweight, obesity and associated health problems place asignificant economic burden on the <strong>Australian</strong> health care system. The total direct, indirect andsocial cost has been estimated at $37.7–$58.6 billion [6, 813] with direct costs estimated at $8–$21 billion [6, 814]. It is predicted that by 2023, the projected health expenditure for diabetes willhave risen $1.4 billion to $7 billion per year, due mostly to increasing weight gain [11].Intentional weight loss in overweight and obese individuals reduces the risk factors for mortalityand morbidity, and alleviates the symptoms of many chronic conditions [811, 812]. It is notnecessary to lose large amounts of weight to achieve substantial health gains. <strong>For</strong> example, aweight loss of 5kg in all people who are overweight or obese is estimated to reduce the nationalprevalence of type 2 diabetes by 15% [815]. Improving nutrition and/or increasing physical activityalso benefits health in a number of areas beyond weight control, such as bone strength, mentalhealth and immune function [2, 816].There is a need to provide guidance for the population on promotion of healthy weight, primaryprevention of overweight and obesity, weight maintenance, weight loss, and management ofweight-related conditions, disorders and diseases. A stepped approach to obesity prevention andmanagement is recommended (see Table 4.4) [710].DRAFT <strong>Australian</strong> <strong>Dietary</strong> <strong>Guidelines</strong>- December 2011 120
Table 4.4 A stepped model for the management of overweight and obesityTarget populationGeneral populationOverweight/obeseOverweight/obese withdisordered eating or cognitionOverweight/obese with riskfactors (BMI > 30 or BMI > 27 +risk factors)InterventionPopulation education, awareness raising andenvironmental interventionsAbove + healthy lifestyle educationand skills trainingAbove + behaviourmodificationAbove +medical/surgicalintervention(drugs, very lowenergy diets,surgery)Given the scope of the <strong>Guidelines</strong>, the guidance here focuses on promotion of healthy weightthrough primary prevention of overweight and obesity, weight maintenance and achieving healthyweight (through weight loss) in overweight groups without serious co-morbidities. Clinicalguidance for treatment and management of obesity and its complications for individuals is beingreviewed under a separate process and will lead to the production of NHMRC’s Clinical Practice<strong>Guidelines</strong> for the Management of Overweight and Obesity [710].Prevention of overweight and obesity is important because:• weight loss is difficult to achieve and even more difficult to maintain• for most people who are classified as obese, and for many who are overweight, a return toa healthy-range BMI may not be a realistic target• the health consequences of obesity tend to be cumulative and may not be fully reversibleonce classified as overweight• it is more efficient and cost effective to prevent weight gain rather than treat overweightand obesity [88, 685, 688].All available evidence suggests that the current epidemic of obesity is a normal response to anabnormal ‘obesogenic’ environment. The community as a whole has a social responsibility toaddress the problem. It is especially important that supportive social, economic and physicalenvironments are created to make it easier for individuals, families, groups and communities tochoose healthy dietary and physical activity patterns to achieve and maintain a healthy weight.DRAFT <strong>Australian</strong> <strong>Dietary</strong> <strong>Guidelines</strong>- December 2011 121
All initiatives and approaches which promote physical activity, healthy eating, access to nutritiousfood, and the healthy growth of children contribute to promoting healthy weight at the populationlevel.4.4.1 Achieving and maintaining a healthy weight4.4.1.1 Physical activity (see Appendix 4)Previously it was thought that if energy intake was controlled, 30 minutes of moderate-intensitydaily physical activity would be sufficient to prevent weight gain in adults, providing sitting time wasless than 4.5 hours/day [817-819]. However, in the current environment of abundant availability,promotion and consumption of energy-dense food, there is now international consensus that 45–60 minutes of moderate-intensity daily physical activity is the minimum required for the generalpopulation to prevent the transition to overweight and obesity without reduction in currentenergy intake [88, 820-823]. At least 60–90 minutes of moderate-intensity activity or lesseramounts of vigorous activity may be required to prevent weight regain in formerly obese people[820].The current physical activity guidelines for <strong>Australian</strong> infants, children and adolescents may beadequate to support optimum growth and development and – together with consuming anutritious diet and appropriate energy intake - weight control [36, 710]. This is supported byrecent evidence from Europe [824].4.4.1.2 <strong>Dietary</strong> patternsFoundation Diets developed by the Modelling System [10] represent the basis of optimum diets toachieve and maintain a healthy weight as they provide nutrient requirements within minimumenergy intake.Compared to the most recent available adult intakes, Foundation Diets include higher quantities ofvegetables, fruit, wholegrain cereals, poultry, fish, eggs and low-fat milk, yoghurt and cheeseproducts, and lower quantities of starchy vegetables, refined cereals, higher and medium fat milk,yoghurt and cheese products and red meats (latter for men only) [10]. Decreased consumption ofdiscretionary foods would be needed to achieve the dietary patterns within energy constraints.Changes from higher fat to lower fat milk, yoghurt and cheese products and from refined towholegrain cereals would also be necessary [10].To prevent excessive or inappropriate weight gain and therefore prevent development ofoverweight and obesity, the smallest, least active adults in each age and sex group should adoptdietary patterns consistent with the Foundation Diets. Additional foods and drinks can only beincluded without leading to weight gain if physical activity levels are increased [10].DRAFT <strong>Australian</strong> <strong>Dietary</strong> <strong>Guidelines</strong>- December 2011 122
Taller or larger and more active adults in each age and sex group can choose additional serves offoods from the food groups and/or occasionally some discretionary foods to increase energyintake to meet energy requirements (that is, to comprise Total Diets) [10], but they need to ensureenergy intake does not exceed expenditure. If energy requirements are exceeded by energy intakeon a regular basis, weight gain will occur.There is wide variation in individual energy needs, so to prevent weight gain (or inappropriateweight loss) at an individual level, weight (and waist circumference) should be measured regularly(for example, every two or three months) and the amount and/or quality of dietary intake andphysical activity levels adjusted accordingly [10].As a basic principle when adjusting dietary patterns, the first steps are to choose nutritious foodsfrom the five food groups in amounts consistent with Foundation Diets and to limit discretionary(energy-dense, nutrient-poor) choices. If further restrictions are required, rather than eliminatingone category of food from the five food groups, smaller serves should be chosen [114].Recommended quantities of specific food groups to suit those preferring an omnivorous, lacto-ovovegetarian diet or a dietary pattern that favours pasta or rice are included in the Foundation Dietsfor adults set out in the Food Modelling System [10].4.4.2 Weight loss in adults who are already overweightThese <strong>Guidelines</strong> do not encourage inappropriate food restriction. However, they do discourageconsumption of energy-dense, nutrient-poor discretionary foods and drinks.In dietary patterns to achieve a healthy weight and assist weight loss, the recommendations oftypes and quantities of foods outlined in the Foundation Diets in the <strong>Australian</strong> Guide to <strong>Health</strong>y<strong>Eat</strong>ing should not be exceeded. Adhering to Foundation Diets only, without discretionary foods,could represent a daily reduction in energy intake of up to 2,000 kJ for the average size person ineach age and sex group. This could result in a satisfactory rate of weight loss, even if physicalactivity levels are not increased.A combination of increased physical activity and energy restriction is more effective than energyrestriction alone for weight loss and maintenance of weight loss. Physical activity can affect bodycomposition favourably during weight loss by preserving or increasing lean mass while promotingfat loss. Physical activity affects the rate of weight loss in a dose-response manner based on itsfrequency, intensity and duration.Weight loss will not be achieved unless energy intake is less than total energy expenditure.Lifestyle improvements, through cognitive and behaviour change, to increase physical activity andimprove dietary intake is fundamental to weight management. Such education, training and supportmay be provided to individuals or groups [710]. Weight loss is most likely to be maintained whereDRAFT <strong>Australian</strong> <strong>Dietary</strong> <strong>Guidelines</strong>- December 2011 123
dietary and physical activity habits are acceptable and sustainable. In this regard, regular weight lossof initially around 1.0 to 4.0kg per month, reaching 10% loss of initial weight in the medium termand 10–20% loss of initial weight over 1–5 years is likely to be most effective and sustained [710,825].Individuals who are overweight or obese and have associated cardiovascular disease or diabetesrisk factors should seek clinical advice about the range of available treatment options [826].4.4.3 Pregnant and breastfeeding womenObesity in pregnancy is one of the most common, and potentially modifiable, risk factors foradverse pregnancy outcomes [827] and longer term adverse outcomes for mothers [828] andchildren [829]. Since about one-third of pregnant women in Australia are overweight or obese[830], preventing excessive gestational weight gain is an urgent health priority.Appropriate maternal weight gain during pregnancy (see table 4.5) is important for the health ofthe infant. Evidence supports recommendations to manage pregnancy to reduce the risk ofexcessive weight gain and gestational diabetes [831, 832]. Too little weight gain during pregnancyincreases the risk of a low birthweight infant. Excessive weight gain during pregnancy increases therisk of macrosomia and gestational diabetes. Excessive gestational weight gain is also associatedwith increased risk of obesity and metabolic syndrome in infants later in life [833, 834].Appropriate steady weight gain during pregnancy is important to optimise the health outcomes(short term and long term) for the infant and the mother [831, 832]. Weight gain should be steadythroughout pregnancy to avoid adverse effects on specific foetal organ systems during criticalperiods (for example, neural tube 6-8 weeks, kidney development 28–30 weeks). Weight loss dietsare not recommended at any time during pregnancy [832].Mothers who gain excessive amounts of weight during pregnancy are unlikely to lose it later [835],although dietary patterns which comprise regular meals, plenty of fruit and vegetables, high-fibrebread and restricted sugar [836] may help mothers reach a healthy weight after giving birth.Evidence of a probable association between babies born to mothers who smoke during pregnancyand a higher risk of overweight or obesity in adolescence and adulthood supportsrecommendations that pregnant women should not smoke cigarettes (Grade B, Section 17.5 inEvidence Report [14]) [52, 54, 59-61, 779].DRAFT <strong>Australian</strong> <strong>Dietary</strong> <strong>Guidelines</strong>- December 2011 124
Table 4.5 2010 Institute of Medicine recommendations for total and rate of weight gain duringpregnancy, by pre-pregnancy BMI [832]Pre-pregnancy BMITotal weightgain in kgRates of weight gain*2nd and 3rdtrimester inkg/weekUnderweight (< 18.5 kg/m 2 ) 12.5 – 18.0 0.51 (0.44 – 0.58)Normal weight (18.5 – 24.9kg/m 2 )Overweight (25.0 – 29.9kg/m 2 )11.5 – 16.0 0.42 (0.35 – 0.50)7.0 – 11.5 0.28 (0.23 – 0.33)Obese (≥ 30.0 kg/m 2 ) 5.0 – 9.0 0.22 (0.17 – 0.27)* Calculations assume a 0.5-2kg weight gain in the first trimester [832]Table 4.6 Weight gain during pregnancy: recommendations for Asian women, by prepregnancyBMI *Pre-pregnancy BMITotal weight gain inkg (duringpregnancy)Weight gain perweek in kg(after 12 weeks)27.5 ≤ 7.0OthersTwin pregnancy 15.9 – 20.4 0.7Triplet pregnancy 22.7* Adapted from IOM guidelines and matched with Asian BMI cut-offs4.4.4 Infants, children and adolescentsInfants, children and adolescents need sufficient nutritious food to grow and develop normally. Thefocus should be on maintaining a rate of growth consistent with the norms for age, sex and stageof physiological maturity. Physical growth is best assessed by the conventional measures of weight,length or height, and head circumference (see Appendix 3). Maintenance of a positive energybalance and adequate nutrient intake is critical in achieving and sustaining normal growth andDRAFT <strong>Australian</strong> <strong>Dietary</strong> <strong>Guidelines</strong>- December 2011 125
development. During periods of rapid growth, intentional restriction of weight gain - throughdieting, for example - is usually inappropriate.In recent years there has been increasing awareness of the importance of perinatal nutrition interms of the development of disease in adulthood, known as foetal origins of disease or Barkerhypothesis [837]. There is also increasing evidence of the importance of growth and optimumnutrition in relation to cognitive development [838] and future bone mass [839].4.4.4.1 GrowthRelative to their body weight, children’s nutrient and energy requirements are greater than thoseof adults [9]. Children are nutritionally vulnerable up to around five years of age, after which theirgrowth rate slows and their nutritional needs reduce relative to their body size. As a child’s rateof growth is a fundamental indicator of nutritional status and health and wellbeing, parents andcarers and health professionals must be responsive to the developmental and nutritional needs ofchildren.Between birth and 18 years of age, body weight increases about twenty-fold. During infancy andadolescence the rate of growth can change rapidly, while from 12 months of age the rate ofincrease in weight and length is essentially linear. Growth decelerates rapidly during the first yearof life. During adolescence it accelerates over one to three years and then decelerates rapidly untilgrowth in height ceases at about 16 years in girls and 18 years in boys.Childhood is a period of education about eating and good nutrition, so appropriate use of food isimportant in establishing lifetime nutrition practices. Food intake may drop off during the secondyear of life, when parents’ skills of encouragement and example will be needed. After startingschool, children are subject to an increasing array of influences from outside the home, particularlypeer pressure which peaks in adolescence.4.4.4.2 <strong>Dietary</strong> patterns for achieving and maintaining a healthy weight in infants,children and adolescentsFoundation Diets represent the basis of optimum diets for infants, children and adolescents.However sufficient nutritious foods must be provided to support optimum growth anddevelopment in all children.<strong>For</strong> the youngest, shortest or least active in each age and sex group, dietary modelling suggeststhat there is no opportunity for additional energy intake beyond Foundation Diets unless increasedphysical activity increases energy expenditure and requirement. <strong>For</strong> these children Foundation Dietsare equivalent to Total Diets.DRAFT <strong>Australian</strong> <strong>Dietary</strong> <strong>Guidelines</strong>- December 2011 126
<strong>For</strong> older, taller or more active children in each age and sex group, additional serves of foods fromthe five food groups (preferably) and/or discretionary food choices may be made to increaseenergy intake until energy requirements are met [10]. Growth and weight of children should bechecked regularly (as outlined in Appendix 3) and the amount and/or quality of diet and physicalactivity levels adjusted accordingly [10].Compared to current intakes, Foundation Diets for infants, children and adolescents include higherquantities of vegetables, fruit, wholegrain cereals, poultry, fish, eggs and low-fat milk, yoghurt andcheese products, and include lower quantities of starchy vegetables, refined cereals, higher andmedium fat milk, yoghurt and cheese products. <strong>For</strong> children, as for adults, decreased consumptionof discretionary food choices is needed to achieve the dietary patterns in the <strong>Australian</strong> Guide to<strong>Health</strong>y <strong>Eat</strong>ing, together with a change from refined grain (cereal) foods to wholegrain cereals andfrom higher fat to lower fat milk, yoghurt and cheese products for children over 2 years of age.Recommended quantities of specific food groups to suit those preferring an omnivorous, lacto-ovovegetarian diet or a dietary pattern that favours rice or pasta are included in the Foundation Dietsfor infants, children and adolescents set out in the Food Modelling document [10].4.4.4.3 <strong>Dietary</strong> patterns for weight loss in children and adolescents who arealready overweight and obeseManagement of overweight and obesity in childhood is recommended to reduce risk of beingoverweight in later life (see evidence above). Individual assessment and clinical supervision isrecommended to ensure appropriate growth and development, for weight management of alloverweight and obese infants, children and adolescents.Parental overweight or obesity is associated with increased risk of overweight or obesity inchildren, with even greater risk when both parents are overweight or obese. A family-focusedapproach to weight management has been found to be beneficial [795-798].<strong>Dietary</strong> restriction beyond prudent adherence to the Foundation Diets and limited intake ofdiscretionary foods and drinks is not recommended for infants, children or adolescents, as thismay result in nutrient deficiencies and sub-optimal growth and development. Adherence toFoundation Diets should assist maintenance of body weight during growth for overweight children -with the aim to maintain weight while the child grows in height thus ‘normalising’ BMI for age.To help achieve a healthy weight, most <strong>Australian</strong> infants, children and adolescents should alsofollow the recommendations of the <strong>Australian</strong> physical activity guidelines (see Appendix 4).DRAFT <strong>Australian</strong> <strong>Dietary</strong> <strong>Guidelines</strong>- December 2011 127
4.4.5 Older peopleOlder people should eat nutritious foods and keep physically active to help maintain musclestrength and a healthy weight.Daily energy expenditure declines throughout adult life, as does physical activity [44]. Energyexpenditure is dependent on fat-free mass, which decreases by about 15% between the third andeighth decades of life, contributing to lowered metabolic rate in older people [840]. The decreasein energy expenditure is generally accompanied by decreased appetite and diminished food intake,so may account for the undernutrition seen in some older people [841]. While overweight andobesity are still prevalent in older adults [842], consideration of overall morbidity and mortalitysuggests that for obese older people a substantial reduction of the BMI may not provide thehealthiest long-term option [843]. Although weight loss achieved by following a nutrient-dense dietand increasing physical activity may confer benefits, this is still to be tested in good quality trials[842]. Lowering blood pressure and normalising blood lipids rather than reducing weight may bemore appropriate for elderly overweight people [844].Older people commonly have a decrease in skeletal muscle mass and strength, which is the resultof a decline in the production of muscle tissue [844]. Height may also decrease with age as a resultof changing spinal shape and intervertebral thickness, making it difficult to determine height andtherefore BMI.While most of the elderly population live independently, it has been estimated that 25–40% ofthose over 80 years of age could be considered frail [845]. Malnutrition in the elderly is oftenassociated with one or more illnesses such as chronic obstructive lung disease and heart failure,dementia, dysphagia, poor dentition, depression, social isolation, use of drugs, alcohol and othersubstance abuse, poverty, and despair [845, 846]. In Australia 5–11% of people eligible for Homeand Community Care services are malnourished [847]. In acute care, 20–30% of people areadmitted with malnutrition, the prevalence increasing with age and the number of health problems[847, 848]. Older people can develop sarcopenia, a form of muscle wasting, and some olderpeople also experience sarcopenic obesity, where there is a combination of reduced muscle massand/or strength and excessive body fat [842].Recent studies suggest that, for an older person, being underweight may be more deleterious forhealth than being overweight [716]. A BMI range of 23–28 is considered desirable for people over70 years of age [709].The decline in energy expenditure with ageing must be balanced by adjusting energy intake tomaintain body weight within the healthy range and to prevent an increase in body fat [9]. <strong>Dietary</strong>patterns and quantities consistent with the Foundation and Total Diets are for older people who aregenerally fit and well [10]. However low-fat diets are not appropriate for the frail elderly or thosewith complex health conditions [35, 844].DRAFT <strong>Australian</strong> <strong>Dietary</strong> <strong>Guidelines</strong>- December 2011 128
Most older people will benefit from increased physical activity [725, 849] including reducedsedentary behaviour, increased moderate-intensity aerobic activity [850]and particularly activitiespromoting bone and muscle strength, flexibility and balance [851]. In addition to assisting withweight management, these can help reduce the risk of falls [851, 852] and may increaseopportunities for social engagement [853].4.4.6 Aboriginal and Torres Strait IslandersThe last national survey measuring height and weight in Aboriginal and Torres Strait Islanders wasconducted in 1994 [854]. Although recent measured data are lacking, prevalence of overweightand obesity calculated from self-reported height and weight data (at around 60%) is higher amongAboriginal and Torres Strait Islander people than self-reported data from non-Indigenous<strong>Australian</strong>s [855-857]. Among Aboriginal and Torres Strait Islander groups living in rural andremote areas, disparities in the cost of nutritious foods are potential barriers to the adoption ofnutrient-dense, low energy-dense diets [138, 140, 686, 728, 806, 858, 859].4.4.7 <strong>Australian</strong>s of Asian originThere is little evidence that <strong>Australian</strong>s of Asian origin are at increased risk of overweight,although special consideration might need to be given to this group in assessing body fatness. TheWHO levels of BMI that correspond to increasing degrees of risk of chronic morbidity and ofmortality were primarily derived for populations of European origin [708] so may not apply to<strong>Australian</strong>s of Asian origin.<strong>Australian</strong>s of Asian origin have a higher proportion of body fat for the same BMI than Caucasians.This suggests that the application of the current WHO BMI cut-off points may underestimate bodyfatness and comorbidity risk in this population [708].4.4.8 People with eating disordersWhen promoting healthy weight, optimum nutrition and physical activity, it is essential to avoidinadvertently encouraging disturbed body image and disordered eating or exercise behaviour[722]. Characteristics of disordered eating, such as restrained eating, binge eating, fear of fatness,purging and distorted body image, are commonly reported in adolescents, particularly in earlyadolescence and late teens, but eating disorders may occur at any age [722]. Estimates of lifetimeprevalence of anorexia nervosa, bulimia nervosa, and binge eating among women range frombetween 0.3-1.5%, 0.9-2.1% and 2.5-4.5% respectively, with estimated rates among menconsiderably lower[722]. People with suspected eating disorders need to be referred for specialistassistance from a health professional.DRAFT <strong>Australian</strong> <strong>Dietary</strong> <strong>Guidelines</strong>- December 2011 129
Effective interventions to reduce the risk of eating disorders include:• promotion of nutritious dietary patterns rather than negative focus on specific foods• avoiding stigmatisation of those of various body shapes and weight• promotion of media literacy, such as critical evaluation of presented body idealsand promotion of good mental health [722].Where to nextThe next chapter provides information on why breastfeeding is beneficial to thehealth of the infant and the mother, and practical considerations for encouragingand supporting breastfeeding.DRAFT <strong>Australian</strong> <strong>Dietary</strong> <strong>Guidelines</strong>- December 2011 130
5. Encourage and support breastfeedingGuideline 4Encourage and support breastfeeding.DRAFT <strong>Australian</strong> <strong>Dietary</strong> <strong>Guidelines</strong>- December 2011 131
Executive summaryThe World <strong>Health</strong> Organization states that “breastfeeding is an unequalled way ofproviding ideal food for the healthy growth and development of infants”.Breastmilk contains many unique compounds, including live cells, which provide all thenutritional requirements to support growth and development of infants to around sixmonths of age.Breastfeeding provides health benefits to infants including reduced risk of infection,asthma and atopic disease and Sudden Infant Death Syndrome. It contributes toimproved cognitive development while protecting against obesity, hypertension andsome chronic diseases in later life.Benefits to mothers from breastfeeding include improved bonding with their infant,accelerated recovery from childbirth and progress to a healthy body weight.Breastfeeding is also associated with reduced risk of some cancers and of postmenopausalhip fracture in mothers.As many infants as possible should be exclusively breastfed until around six months ofage when solid foods are introduced. Breastfeeding should be continued until 12months of age and beyond, for as long as the mother and child desire.Breastfeeding prevalence, including initiation rates and duration, are improved wherethe mother has support and encouragement from the infant’s father, other familymembers, the health system and the community.This chapter provides information on why breastfeeding is beneficial to the health ofthe infant and the mother, plus practical considerations for encouraging andsupporting breastfeeding.DRAFT <strong>Australian</strong> <strong>Dietary</strong> <strong>Guidelines</strong>- December 2011 132
5.1 Setting the sceneThe World <strong>Health</strong> Organization states that “breastfeeding is an unequalled way of providing idealfood for the healthy growth and development of infants”. Breastmilk is a living tissue that includesmany unique compounds. Breastfeeding has short-term and long-term health and other benefitsfor infants and mothers. Maximising the benefits of breastfeeding to the infant and mother requiresthe support of the other family members and a supportive community environment.Australia has a long history of promoting and supporting breastfeeding in its public health policy. In1981 Australia became a signatory to WHO’s International Code of Marketing of Breast-milkSubstitutes [860], the stated aim of which was to protect and promote breastfeeding. Theimportance of breastfeeding led to its inclusion in the <strong>Australian</strong> <strong>Dietary</strong> <strong>Guidelines</strong> endorsed by theNHMRC in 1983 [568].In Australia, part of the WHO code is implemented by the Marketing in Australia of Infant <strong>For</strong>mulas(MAIF) Agreement, a voluntary agreement by infant formula manufacturers and importers. TheInfant Feeding <strong>Guidelines</strong> for <strong>Health</strong> Workers [133] provide more information on the WHO code,the MAIF Agreement and the obligations of all health workers. They also providerecommendations on the appropriate foods for infants from birth to about two years of age,including detailed information on the benefits of breastfeeding for the infant and mother.Breastmilk contains many unique compounds, including antibodies and immune cells. In the firstfew days after giving birth a mother’s breasts produce colostrum which provides all the nutrientsand water required by their newborn infant. Colostrum contains higher levels of protein, vitaminA and vitamin B 12 and less fat than breastmilk. It also contains lactoferrin, immunoglobulin A,enzymes, maternal antibodies, living cells (leukocytes, neutrophils and macrophages) andprebiotics, which limit the growth of pathogenic bacteria and viruses, stimulate the growth of anappropriate human microbiome and protect against illness [483, 861, 862]. Colostrum feeding isimportant for the infant and also stimulates the mother’s breastmilk production. The compositionof colostrum gradually changes as lactation is established and milk production begins 48–72 hoursafter birth.The nutrient composition of mature human milk varies between individuals and across the stagesof lactation. The energy content varies between 270 and 315 kJ per 100 mL, largely due tovariation in the fat content [863, 864]. Fat content typically increases through each breastfeed. Itprovides much of the energy and omega-3 and omega-6 long-chain polyunsaturated fatty acids, plusthe fat-soluble vitamins A, D, E and K, as well as prostaglandins. The fat in breastmilk is typicallybetter absorbed by an infant’s gastrointestinal tract than the fat in cow’s milk. Mature milkcontinues to provide immune factors and enzymes to the infant [36, 865].Breastmilk provides all the vitamins, major minerals and trace elements known to be essential forhealthy full-term infants for around the first six months [731, 866]. These are more bioavailableDRAFT <strong>Australian</strong> <strong>Dietary</strong> <strong>Guidelines</strong>- December 2011 133
than nutrients found in infant formula. Because the composition of breastmilk constantly changesthroughout lactation and during a single breastfeed, no infant formula can exactly mimic thecomposition of breastmilk. Breastmilk is a convenient, hygienic and inexpensive food source posingno environmental costs [867].Breastmilk continues to be an important source of vitamins, minerals and trace elements whenother foods are introduced at around six months (complementary feeding).Consuming a variety of nutritious foods is particularly important for breastfeeding women.5.2 The evidence for ‘Encouraging andsupporting breastfeeding’The evidence statements and gradings (A- convincing association, B- probable association, C-suggestive association) from the Evidence Report (literature from 2002 – 2009) are presented inthe table below. This does not include evidence from other sources, such as the 2003 <strong>Dietary</strong><strong>Guidelines</strong> (where evidence was classified as level I, II or III), although these sources have beenused to inform the <strong>Guidelines</strong>.Evidence StatementCompared to infants who are formula fed, being breastfed is associated withreduced risk of becoming obese in childhood, adolescence, and early adulthood.Pre-natal and perinatal support for breastfeeding can increase the proportion ofwomen breastfeeding (both exclusive and non-exclusive) up to age six months.Being breastfed in infancy is associated with lower systolic and diastolic bloodpressure up to adolescence.Infants who are exclusively breastfed for six months experience less morbidity fromgastrointestinal infection than those who are mixed breastfed as of three or fourmonths.Infants, from either developing or developed countries, who are exclusivelybreastfed for six months or longer do not have deficits in growth compared tothose who are not exclusively breastfed.There are no apparent risks in a general recommendation for exclusivebreastfeeding for the first six months of life, in both developing and developedcountries.However, infants should still be managed individually in order to achievesufficient growth and minimise adverse outcomes.GradeAABBBBDRAFT <strong>Australian</strong> <strong>Dietary</strong> <strong>Guidelines</strong>- December 2011 134
Evidence StatementExclusive breastfeeding for 6 months or more prolongs lactational amenorrhea formothers.Breastfeeding support (any type) increases duration of both exclusive and nonexclusivebreastfeeding both in the immediate post-natal period and at six months ofage.Being breastfed initially, particularly exclusively breastfed is associated with lowertotal and LDL concentrations in adult life.Breastfeeding is associated with a reduced risk of asthma and atopic disease.Breastfeeding is associated with a reduced risk of atopic disease.Not breastfeeding is associated with an increased risk of Sudden Infant DeathSyndrome.Maternal perceived insufficient milk (PIM) supply is associated with increased risk ofearly cessation of lactation.GradeBBCCCCC5.2.1 Breastfeeding incidence and durationExclusive breastfeeding: Systematic reviews from developed and developing countries provideevidence of a probable association that exclusive breastfeeding for around six months of life 3 is thebest method of feeding for full-term infants (Grade B, Section 23.2 in Evidence Report [14]).Breastfeeding can then continue while appropriate solid (spoon) foods are introduced.WHO andalmost all national and international paediatric and public health organisations make similarrecommendations. NHMRC’s Infant Feeding <strong>Guidelines</strong> for <strong>Health</strong> Workers (public consultationdraft 2011) recommend that exclusive breastfeeding be encouraged, supported and promoted toaround six months of age. —see Infant Feeding <strong>Guidelines</strong> for <strong>Health</strong> Workers – Literature Review fora full list [868-871].Adding other foods: The introduction of complementary feeding (adding solid foods and liquidsother than breastmilk or infant formula) at around six months is consistent with introduction ofsolid foods during the probable ‘window of tolerance’ between 4–7 months [872]. The majority of<strong>Australian</strong> infants have solids introduced during this period [873].3In Australia, ‘around six months’ for exclusive breastfeeding is used to acknowledge that different infants develop atdifferent rates. 22 – 26 weeks is considered to be “around six months”.DRAFT <strong>Australian</strong> <strong>Dietary</strong> <strong>Guidelines</strong>- December 2011 135
No apparent risks have been reported in recommending, as a general policy, exclusivebreastfeeding for around the first six months of life, in both developing and developed countries(Grade B, Section 23.2 in Evidence Report [14]). It is important, however, that health professionalsmanage infants individually so that faltering growth or other adverse outcomes do not gounnoticed.Early cessation of lactation: Recent evidence suggests an association between maternal perceivedinsufficient milk (PIM) supply and an increased risk of early cessation of lactation (Grade C, Section25.3 in Evidence Report [14]).Supportive environments: There is convincing evidence that pre-natal and perinatal support forbreastfeeding can increase the proportion of women breastfeeding (both exclusive and nonexclusive)up to age 6 months (Grade A, Section 25.3 in Evidence Report [14]).Recent evidence also suggests a probable association between breastfeeding support (any type)and an increased duration of both exclusive and non-exclusive breastfeeding, both in theImmediate post-natal period and at 6 months of age (Grade B, Section 25.3 in Evidence Report[14]).DRAFT <strong>Australian</strong> <strong>Dietary</strong> <strong>Guidelines</strong>- December 2011 136
Table 5.1 Factors associated with duration of exclusive breastfeedingAssociation with longer duration of exclusive breastfeedingConsistently positive Consistently negative Effect varies indifferent culturesHigher level of maternaleducationSupport of midwives andcommunity health professionalsFather’s preference forbreastfeedingDoctors’ support ofbreastfeedingPleasant birth experienceGreater breastfeeding knowledgeRural environmentTime decision to breastfeed ismade (preferably beforepregnancy or early in pregnancy)Lower socioeconomicbackgrounds<strong>For</strong>mula supplementation in thematernity wardMother's intention to usesupplementationPrevious breastfeedingexperience short-term (
5.2.2 Infant growth<strong>For</strong> ethical reasons, randomised control trials (RCTs) of breastfeeding are not possible. The bestresearch alternative is the use of RCTs of health promotion interventions to increasebreastfeeding rates. <strong>For</strong> this reason, most evidence is based on prospective cohort studies and onelarge health promotion RCT, the Promotion of Breastfeeding Intervention Trial (PROBIT) study[883].Breastfed infants grow more slowly than formula-fed infants [861]. A systematic review of 19observational studies in developed countries concluded that the cumulative difference in bodyweight at 12 months of age was 600–650g less in infants breastfed for 12 months than formula-fedinfants [884]. Differences in feeding behavior and mother–child interaction between breastfed andformula-fed infants may account for some of the differences reported. <strong>For</strong> instance, breastfedinfants showed a different suckling pattern, and appeared to have greater degree of control onmeal sizes and feeding intervals than infants who were formula-fed [885].5.2.3 Cardiovascular disease, type 2 diabetes and excessweightExcess weight: There is convincing evidence that breastfeeding , compared with formulafeeding, is associated with reduced risk of infants becoming obese in childhood, adolescence andearly adulthood (Grade A, Section 17.2 in Evidence Report [14]). The protection offered bybreastfeeding appears to increase with duration of breastfeeding until it plateaus at nine months[886, 887].Evidence of an association between the age of introduction of solid foods and excess weight inchildren is inconclusive (Section 19.1 in Evidence Report [14]).Blood pressure: There is probable evidence that infants who are breastfed exclusively in the firstfew months of life have a lower adult systolic and diastolic blood pressure (approximately 1.5/0.5mmHg) compared with those who are formula-fed (Grade B, Section 23.1 in Evidence Report[14]).Total and LDL cholesterol: Recent evidence suggests being breastfed initially, and particularlyexclusively breastfed, is associated with lower total and LDL concentrations in adult life whencompared with those who were formula-fed (Grade C, Section 23.1 in Evidence Report [14]).DRAFT <strong>Australian</strong> <strong>Dietary</strong> <strong>Guidelines</strong>- December 2011 138
5.2.4 Other benefitsSudden Infant Death Syndrome (SIDS): There is evidence to suggest that breastfeeding reducesthe risk of SIDS (Grade C, Section 23.4 in Evidence Report [14]).Gastrointestinal infection: There is probable evidence that children who are exclusively breastfedfor six months have lower morbidity from gastrointestinal infection than those who are given bothbreastmilk and formula at the age of 3-4 months (Grade B, Section 23.2 in Evidence Report [14]).Factors in breastmilk such as secretory IgA, oligosaccharides and lactoferrin may protect the infantfrom various infections through passive immunity [483].Asthma: Recent evidence suggests an association between breastfeeding and lower incidences ofasthma (Grade C, Section 23.3 in Evidence Report [14]). Data from the Longitudinal Study of<strong>Australian</strong> Children suggest a strong and significant protective effect of breastfeeding on wheezingand asthma in infancy, which increases with increasing breastfeeding duration (seehttp://www.asthmamonitoring.org).Atopic dermatitis: Recent evidence also suggests an association between breastfeeding andprotection against atopic dermatitis in children with a family history of this condition, but not inthose without a family history (Grade C, Section 23.3 in Evidence Report [14]).Lactational amenorrhea: Exclusive breastfeeding for six months or more prolongs lactationalamenorrhea for mothers and delays the return of fertility (Grade B, Section 23.2 in EvidenceReport [14]), which may be a benefit for some women as the lactational amenorrhoea method is acommonly used form of contraception [888-890].Allergy: The evidence for an association between a delay in the introduction of solid foods untilafter the age of 6 months and risk of developing allergic syndromes is inconclusive (Section 19.2 inEvidence Report [14]).Other factors: Additional benefits for infants who are exclusively breastfed compared with thosewho are formula fed in both developed and developing countries [861, 891] may include:• protection against respiratory infection and reduced prevalence of asthma [892]• reduced occurrence and recurrence of otitis media [891]• protection against neonatal necrotising enterocolitits, bacteraemia, meningitis, botulism andurinary tract infection [861, 893]• reduced risk of autoimmune disease, such as type 1 diabetes [891]• lower rates of coeliac disease, Crohn’s disease and ulcerative colitis [894]• improved visual acuity and psychomotor development [867]• higher IQ scores, which may be the result of factors present in the milk or of greaterstimulation [867, 895]• reduced malocclusion as a result of better jaw shape and development [896]DRAFT <strong>Australian</strong> <strong>Dietary</strong> <strong>Guidelines</strong>- December 2011 139
• improved mother and infant bonding and attachment [897].Additional health benefits to women who breastfeed may include:• promotion of maternal recovery from childbirth through accelerated uterine involution andreduced risk of haemorrhage [898]• accelerated weight loss and return to pre-pregnancy body weight [866, 882]• reduced risk of pre-menopausal breast cancer [891]• reduced risk of ovarian cancer [891]• improved bone mineralisation and thereby decreased risk of post-menopausal hip fracture[899, 900].5.3 Practical considerations: Encourage andsupport breastfeedingFurther information is included in the Infant Feeding <strong>Guidelines</strong> for <strong>Health</strong> Workers [133].5.3.1 Breastfeeding initiation and durationIt is estimated that in Australia 90–92% of mothers initiate breastfeeding and approximately 50%are still breastfeeding at six months. Few infants are exclusively breastfed until six months inAustralia [901]. However reliable national data on breastfeeding rates is difficult to obtain forseveral reasons, including inconsistent use of definitions of breastfeeding [902] [864].5.3.1.1 Early interactionMothers should have contact with their babies as soon after birth and for as long as they wish[874]. Interventions aimed at either delaying or speeding up the length of the first feed should beavoided. Hospitals can encourage ‘rooming-in’ to facilitate frequent mother and child contact[903].5.3.1.2 Adolescent mothersBreastfeeding initiation and duration rates are below recommended levels among adolescentmothers [14]. Specific breastfeeding education programs in USA, UK and Australia targeted atpregnant adolescents have been somewhat effective in increasing breastfeeding initiation inadolescent mothers [904, 905]. Adolescent mothers identify emotional and network support aswell as self-esteem as being crucial to breastfeeding success [904].DRAFT <strong>Australian</strong> <strong>Dietary</strong> <strong>Guidelines</strong>- December 2011 140
5.3.1.3 Mothers in the workplaceEvidence is emerging that a mother’s employment status and number of hours worked outside thehome influences the initiation and duration of breastfeeding. Women who are not employed fulltime[906], are self-employed or have flexible working hours are more likely to breastfeed for sixmonths. Using only parental childcare has a positive association with continuation of breastfeeding[907].5.3.1.4 Low socioeconomic status mothersWomen from the lowest socioeconomic quintile in Australia have lower breastfeeding rates thanthose from the most affluent quintile [908-910].5.3.1.5 Culturally and linguistically diverse mothersLimited available data suggest that, in general, the rates of breastfeeding among CALD women inAustralia reflect trends in their countries of origin [911-915].5.3.1.6 Aboriginal and Torres Strait Islander mothersIndigenous mothers tend to breastfeed for longer than non-Indigenous mothers, especially in ruralareas [30]. In the Perth Aboriginal Breastfeeding Study, Aboriginal <strong>Australian</strong>s had higherbreastfeeding rates than non-Aboriginal women [916].5.3.1.7 Mothers who use illicit drugsWHO recommends that mothers who use illicit drugs while breastfeeding should be evaluated onan individual basis. Breastfeeding may need to be discontinued [917], but each case needs detailedmedical assessment [906].5.3.2 Support for breastfeeding5.3.2.1 Promoting breastfeeding in prospective parentsOverall, reviews of interventions to support breastfeeding have found that education before birthand continuing support after birth for breastfeeding mothers were effective in breastfeedingcontinuation.The US Preventive Services Task <strong>For</strong>ce found that any intervention to promote breastfeedingsignificantly increased rates of exclusive breastfeeding in the short term [875].DRAFT <strong>Australian</strong> <strong>Dietary</strong> <strong>Guidelines</strong>- December 2011 141
Effective education programs include information about the benefits of breastfeeding, principles oflactation, myths, common problems and solutions, and skills training [918]. Peer support wasparticularly useful for socioeconomically disadvantaged women, and peer counsellors were mosteffective if they were of similar cultural and social status to the women they were counselling. Theoptimal mix of interventions to improve breastfeeding practices includes education of mothers,peer support, hospital practices such as ‘rooming-in’ and ‘early skin-to-skin contact’, staff training,development and implementation of hospital policy, media campaigns, and paid maternity leave[876].A more recent Cochrane review agrees that there is a protective effect of provision of support onincreasing duration of breastfeeding [874].5.3.2.2 Promoting breastfeeding in hospitalsThe Baby Friendly Hospital Initiative (UNICEF and WHO) has been shown to increasebreastfeeding rates in accredited hospitals [919]. The steps include:• Have a written breastfeeding policy that is routinely communicated to all health care staff• Train all health care staff in skills necessary to implement this policy• Inform all pregnant women about the benefits and management of breastfeeding• Place babies in skin-to-skin contact with their mothers immediately following birth for atleast an hour and encourage mothers to recognise when their babies are ready tobreastfeed, offering help if needed.• Show mothers how to breastfeed and how to maintain lactation even if they should beseparated from their infants• Give newborn infants no food or drink other than breastmilk, unless medically indicated• Practice rooming-in, allow mothers and infants to remain together-24 hours a day• Encourage breastfeeding on demand• Give no artificial teats or dummies to breastfeeding infants• Foster the establishment of breastfeeding support and refer mothers on discharge from thefacility.Early contact improves breastfeeding outcomes [14]. Interventions aimed at either delaying orspeeding up the length of the first feed should be avoided. Hospital practices at the time of birthcan be the first line of support for a new mother. Difficulties encountered can be quickly resolvedby staff with appropriate experience, and hospitals can encourage ‘rooming-in’ to facilitatefrequent mother and child contact [903]. The use of prelacteal feeds or other liquids while inhospital interferes with the establishment of lactation and is contrary to the BFHI principles.Mothers should have contact with their babies as soon after birth and for as long as they wish asthis improves breastfeeding outcomes [874].DRAFT <strong>Australian</strong> <strong>Dietary</strong> <strong>Guidelines</strong>- December 2011 142
5.3.1.3 Community supportThe successful management of breastfeeding problems in the first weeks after birth has a majorimpact on breastfeeding duration [920]. Sources of support for mothers in the first few weeksinclude family members, community health nurses, voluntary organisations and generalpractitioners. Preparation and education before birth are very important in achieving successfulbreastfeeding. Efforts to improve community acceptance of breastfeeding are also critical.5.3.3 Safe storage of breastmilkMany mothers find it convenient to express breastmilk so that others can feed their baby ifrequired. Appropriate hygiene is essential for the expression and storage of breastmilk.When expressing breastmilk, mothers should:• wash hands thoroughly with soap and water• if using a breastpump, sterilise it according to the manufacturer’s instructions and ensurethe storage bottle is sterile• refrigerate or freeze milk immediately after expressing• discard any breastmilk that has been thawed but not used• freeze milk that will not be used within two days. NHMRC draft Infant Feeding <strong>Guidelines</strong> for<strong>Health</strong> Workers(2011) refer to a maximum refrigerated storage time of 96 hours.• date containers at the time of collection and use the oldest milk first.The use of a breast pump to express and measure breastmilk production is not recommended as away to assess the adequacy of breastfeeding because expression from the breast may not be aseffective as an infant suckling. Serial measurements of growth are the best way of assessingnutritional adequacy.5.3.4 Alcohol and breastfeedingSee Section 3.4.Where to nextEveryone should prepare and store food safely; however particular care should betaken when handling food intended for consumption by those who have increasedrisk of foodborne illness, such as pregnant women, infants, older people and peoplewith certain medical conditions. The next chapter discusses how incorrect handlingof food or storing of food can contribute to food poisoning and poor healthoutcomes.DRAFT <strong>Australian</strong> <strong>Dietary</strong> <strong>Guidelines</strong>- December 2011 143
6. Food safetyGuideline 5Care for your food; prepare and store it safely.DRAFT <strong>Australian</strong> <strong>Dietary</strong> <strong>Guidelines</strong>- December 2011 144
Executive summaryMore than five million cases of foodborne illness are estimated to occur every year inAustralia.Bacterial and viral food poisoning is a result of pathogenic organisms reaching harmfullevels or the production of pathogenic toxins.Incorrect handling of food and storing food at inappropriate temperatures are majorcauses of food poisoning. Particular care should be taken when handling food to beconsumed by people who have an increased risk of foodborne illness, such aspregnant women, infants, older people and people with certain medical conditions.This chapter provides information on the prevention of foodborne illness and why itis important to store and prepare food safely.DRAFT <strong>Australian</strong> <strong>Dietary</strong> <strong>Guidelines</strong>- December 2011 145
6.1 Setting the sceneFoodborne illnesses are caused by contaminated foods. Contaminants include pathogens,environmental contaminants and adulterants [921]. These guidelines focus on bacterial and viralcontaminants.Bacterial and viral food poisoning generally occurs when pathogenic organisms multiply to harmfullevels as a result of incorrect handling of food, particularly when temperature control isinadequate. Some foodborne pathogens can cause illness even when present in low numbers (forexample, hepatitis A virus, Norovirus, some strains of E. coli, Campylobacter jejuni and shigella spp.).Other pathogens produce toxins when allowed to multiply to high levels in food (for example,Clostridium botulinum, Staphylococcus aureus, Bacillus cereus and shigella spp) [922].Prevention of contamination is the key to avoiding foodborne illness. Once pathogens contaminatefood they can multiply and/or produce toxins if not handled correctly [923]. As heat can kill manybacteria and viruses it is the basis for many strategies for making food safe. However, evenreheating food to high temperatures will not destroy all toxins.The increasing age of human populations, migration, mass production of food due to populationgrowth, and changed food habits pose threats to food safety [924]. Lack of access to quality food,lack of refrigeration and suitable storage pose threats to vulnerable groups. Isolated and poorercommunities can be at higher risk as a result of inadequate storage facilities or limited access toregular food supplies.Foodborne illnesses appear to be increasing in incidence in Australia and worldwide, posing asignificant public health problem [925, 926]. The most recent estimates are that there are 5.4million cases per year of foodborne illness in Australia, leading to 1.2 million visits to medicalpractitioners and 2.1 million days of work lost each year [927]. Multiple episodes increase the riskof long-term consequences such as reactive arthritis, irritable bowel syndrome and, rarely,Guillain-Barre Syndrome.6.2 The evidence for ‘caring for your food;prepare and store it safely’The true incidence of foodborne illnesses is consistently underestimated because cases areunderreported, most cases are sporadic, and full diagnostic testing is usually done only in moresevere cases or when there are extensive common-source outbreaks [928-930]. The majority ofreported episodes are caused by foods prepared outside the home, regardless of where they areconsumed. Foods prepared in the home account for 20–40% of foodborne illnesses in AustraliaDRAFT <strong>Australian</strong> <strong>Dietary</strong> <strong>Guidelines</strong>- December 2011 146
[929]. Fresh fruit and vegetables can also be contaminated, depending on soils and farmingpractices. The main causes of foodborne illness in Australia are:• inadequate cooking [928, 931]• improper holding temperatures [928, 931]• contaminated equipment (such as knives, cutting boards and dishcloths) [931]• contaminated food storage and preparation areas• unsafe raw food [931]• allowing raw foods to make direct contact with ready-to-eat foods [928]• poor personal hygiene of food handlers (such as not washing hands adequately,particularly after handling raw food and immediately after using the toilet) [931]6.2.1 Foods which may cause problems if not handledcorrectlyThe following are examples of foods that are normally considered potentially hazardous if notstored and prepared safely:• raw and cooked meat or foods containing raw or cooked meat• dairy products and foods containing dairy products• seafood and foods containing seafood• cooked rice and pasta• processed fruit and vegetables such as salads• processed foods containing eggs or other protein-rich food• foods that contain any of the foods above, for example, sandwiches [932].The foods most commonly implicated in foodborne illness in Australia are meat and seafood [928].Some foodborne pathogens, such as viruses and enterohaemorrhagic strains of E. coli, do not needto grow in foods to produce illness. Contamination of any ready-to-eat food with such a pathogencan result in foodborne illness.6.3 Why it is important to prepare and storefood safelyThe ability of micro-organisms to grow in a food depends on external factors (such astemperature) as well as characteristics of the food itself, such as protein content [933, 934], watercontent and pH. <strong>For</strong> example, bacteria are least active in very acidic foods (pH less than 4.5).Most bacteria can multiply at temperatures between 5°C and 60°C but a few pathogenic bacteriamultiply at temperatures at or below 5ºC [932]. Exposure to high temperatures destroys theDRAFT <strong>Australian</strong> <strong>Dietary</strong> <strong>Guidelines</strong>- December 2011 147
vegetative cells of most bacteria, although some have heat-resistant spores or produce histaminesand toxins that survive the cooking process [923].Some bacteria multiply within 2 hours and can reach an infective dose in 4–6 hours [933-935].Refrigeration at or below 5°C slows the growth of bacteria [923].6.4 Practical considerations: Food safety6.4.1 Pregnant and breastfeeding womenAs the immune system in pregnancy is suppressed, pregnant women are more susceptible tofoodborne illnesses. Pregnant women have a higher risk of listeriosis, caused by the bacteriumListeria monocytogenes. Listeriosis can be transmitted to the unborn child and possibly cause amiscarriage, premature birth or stillbirth [936]. As a precaution, pregnant women are advised toavoid specific foods which are more likely to contain Listeria. Pregnant women are also advised tobe careful with foods more likely to contain mercury [131].6.4.2 InfantsThe immune system of infants is not fully developed and so they are more susceptible tofoodborne illnesses. Particular care should therefore be taken when preparing infant formula (ifthis is being used), including the sterilisation of bottles and dummies and other equipment used toprepare formula [931]. Prepared foods should be handled with care and not reused or reheated,as outlined in the Infant Feeding <strong>Guidelines</strong> for <strong>Health</strong> Workers [133].6.4.3 Adults with illnessAdults with illnesses that reduce immune function such as HIV/AIDS, cancer, diabetes, kidney orliver disease, haemochromatosis, stomach problems (including previous stomach surgery) and lowstomach acid (for example, from antacid use) are more susceptible to foodborne illness. Also atrisk are people taking immunosuppressants, undergoing bone marrow or stem cell transplantation,or who have a history of long-term steroid use. Prepared foods should be handled with care.6.4.4 Older peopleOlder adults are at higher risk of foodborne illness than other adult groups due to their weakenedimmune systems, decreased intestinal motility, decreased acid in the stomach, loss of sense ofsmell and taste, and dementia and malnutrition especially in frail older people [937, 938]. High-riskfoods should be cooked, dairy products should be pasteurised, and specific foods at risk of listeriaDRAFT <strong>Australian</strong> <strong>Dietary</strong> <strong>Guidelines</strong>- December 2011 148
contamination (see above) avoided. Seehttp://www.foodstandards.gov.au/consumerinformation/listeria/.People of any age, but especially older people receiving pre-prepared meals, need to ensure thatthey are safely stored if not consumed immediately.DRAFT <strong>Australian</strong> <strong>Dietary</strong> <strong>Guidelines</strong>- December 2011 149
Appendix 1. History and timeline of<strong>Australian</strong> nutrition documentsThe Commonwealth Advisory Council on Nutrition was formed in 1936 and became theNutrition Committee of the NHMRC in 1939, at the same time as a Nutrition Unit wasestablished in the then Commonwealth Department of <strong>Health</strong>. Soon after, state and territoryhealth departments set up similar nutrition committees and have since had a role in providingnutrition information and education programs in Australia.From the 1940s through to the 1970s the Commonwealth and the states and territories publishedpamphlets and booklets to guide food selection and provide education tools, including the FiveFood Group plan, which listed the food groups ‘bread and other cereals’, ‘vegetables and fruit’,‘meat and meat alternatives’, ‘milk and milk products’, and ‘butter/table margarine’.1938 Tables of composition of <strong>Australian</strong> foodsFirst set of tables of composition of <strong>Australian</strong> foods, including data from both local and overseassources for over 1100 foods. It was revised and reprinted many times over the next decades.1979-83 <strong>Dietary</strong> <strong>Guidelines</strong> for <strong>Australian</strong>sIn response to an increase in nutritional problems related to overconsumption of food, in 1979the Department of <strong>Health</strong> developed eight <strong>Dietary</strong> Goals for <strong>Australian</strong>s. These were modified toprovide direct advice to members of the community as <strong>Dietary</strong> <strong>Guidelines</strong> for <strong>Australian</strong>s, whichwere endorsed by the NHMRC in 1983. It was noted that these guidelines should be reviewed asfurther data became available on the nutritional status of <strong>Australian</strong> and the relationships betweendiet and disease [939].1989 Nutrient Data Table (NUTTAB)The first electronic food composition data release (on diskette), as the first edition of the NutrientData Table for use in Australia (NUTTAB), containing a combination of <strong>Australian</strong> and British data[940].DRAFT <strong>Australian</strong> <strong>Dietary</strong> <strong>Guidelines</strong>- December 2011 150
1989 - 1995 Composition of Foods, Australia (COFA)The Composition of Foods, Australia (COFA) series was released in seven volumes, containing thefirst compilation of new <strong>Australian</strong>-sourced data for <strong>Australian</strong> foods from the analytical work ofGreenfield and colleagues.1991 Recommended <strong>Dietary</strong> Intakes for use in AustraliaThe development of the Recommended <strong>Dietary</strong> Intakes (RDIs) began in 1980 and the report waspublished in 1991 [941]. The RDIs are derived from estimates of requirements for each age/sexcategory and incorporate generous factors to accommodate variations in absorption andmetabolism. They therefore apply to group needs. RDIs exceed the actual nutrient requirementsof practically all healthy persons and are not synonymous with requirements.1992 Food and Nutrition PolicyThe <strong>Australian</strong> Food and Nutrition Policy, endorsed in 1992 [33], aims to improve the health of<strong>Australian</strong>s and reduce the burden of preventable diet-related death, illness and disability. Thepolicy strategies were developed in alignment with dietary guidelines and based on principles ofgood nutrition, ecological sustainability and equity.1992 <strong>Dietary</strong> <strong>Guidelines</strong> for <strong>Australian</strong>sAn expert panel was set up in 1989 by the Public <strong>Health</strong> Committee to review the existing dietaryguidelines. In 1992, the <strong>Dietary</strong> <strong>Guidelines</strong> for <strong>Australian</strong>s were published by the NHMRC for use byhealthy adults. They represented the best consensus of scientific knowledge and public healthadvice available. A guideline to encourage and support breastfeeding was included, as were specificguidelines on calcium and iron.1995 The Core Food GroupsThe Core Food Groups [942] was the modeling document that underpinned the development of thefood guide- the <strong>Australian</strong> Guide to <strong>Health</strong>y <strong>Eat</strong>ing (see below). The purpose of The Core Food Groups[942] was to discuss the basis for a core food group system that reflects advances in nutritionknowledge and to complement existing nutrition references at the time (for example, <strong>Dietary</strong><strong>Guidelines</strong> for <strong>Australian</strong>s, 1992). The need for a core food group system arose because existingfood selection guides in Australia at the time differed in the advice offered. The Core Food Groupsdocument was developed to provide an approach that was objective, scientifically rigorous andupdateable as new evidence on nutrition became available. It provided advice on core foodDRAFT <strong>Australian</strong> <strong>Dietary</strong> <strong>Guidelines</strong>- December 2011 151
quantities consistent with national nutrition recommendations and targets, creating a platform forthe interpretation of food and nutrition research into recommendations regarding food choices.1998 The <strong>Australian</strong> Guide to <strong>Health</strong>y <strong>Eat</strong>ingThe <strong>Australian</strong> Guide to <strong>Health</strong>y <strong>Eat</strong>ing [45] is a food guide for Australia that reflects themulticultural nature of the population. Based on the modeling of the Core Food Groups, it isdesigned for all sectors of the food system to use as a nutrition education and information tool.1999 <strong>Dietary</strong> <strong>Guidelines</strong> for Older <strong>Australian</strong>sThe <strong>Dietary</strong> <strong>Guidelines</strong> for Older <strong>Australian</strong>s [35] were based on the <strong>Dietary</strong> <strong>Guidelines</strong> for <strong>Australian</strong>s,1992 [569] and were designed to take account of the changes in nutritional needs that occur withageing. The <strong>Guidelines</strong> are aimed at healthy, independent <strong>Australian</strong>s aged 65 and over, butadditional advice was provided on how the <strong>Guidelines</strong> apply to older <strong>Australian</strong>s who receiveassistance with meals or live in residential aged care facilities. The <strong>Guidelines</strong> were also useful forhealth professionals who wished to develop suitable diets for older people in a range of healthcircumstances.1999 <strong>Australian</strong> Food and Nutrient Database (AUSNUT)The first in the AUSNUT (<strong>Australian</strong> Food and Nutrient Database) series was first released, anelectronic file of nutrient data based on the technical support file for the 1995 National NutritionSurvey. The AUSNUT series of databases are derived from the NUTTAB series for the purpose ofcoding the food intake data collected in national nutrition surveys [943]. A second edition, usedto code the 2007 <strong>Australian</strong> Children’s Nutrition and Physical Activity Survey (insert ref), wasreleased in 2008 (available at http://www.foodstandards.gov.au/consumerinformation/ausnut2007/)[944]. The third edition, developed to code the 2011 <strong>Australian</strong> <strong>Health</strong> Survey data, is planned forrelease in 2013.2000 Nutrition in Aboriginal and Torres Strait Islander Peoples:An Information PaperThis information paper, endorsed by NHMRC, presented information about nutrition andnutrition-related disease in Aboriginal and Torres Strait Islander peoples. This information wasspecifically targeted to practitioners working to improve the nutritional health of Aboriginal andTorres Strait Islander peoples, and provided a reference material for practice and teaching.DRAFT <strong>Australian</strong> <strong>Dietary</strong> <strong>Guidelines</strong>- December 2011 152
2001 <strong>Eat</strong> Well Australia: An Agenda for Action in Public <strong>Health</strong>Nutrition and the National Aboriginal and Torres Strait IslanderNutrition Strategy and Action Plan<strong>Eat</strong> Well Australia: An agenda for action in public health [2] was designed to provide government andother sectors with a strategic framework and an agenda for action on public health nutrition forthe first decade of the 21st century. This document provides the detailed <strong>Eat</strong> Well Australia Agendafor Action, as outlined in the summary <strong>Eat</strong> Well Australia Strategic Framework document. <strong>Eat</strong> WellAustralia is a coherent national approach to the underlying causes of the preventable burden ofdiet-related disease and early death, providing a set of interlinked initiatives for the prevention andmanagement of these diseases.The National Aboriginal and Torres Strait Islander Nutrition Strategy and Action Plan (NATSINSAP) [945]set out a framework for action to improve Aboriginal and Torres Strait Islander nutritional healthunder seven priority areas:• food supply in rural and remote communities• food security and socioeconomic status• family-focused nutrition promotion• nutrition issues in urban areas• the environment and household infrastructure• the Aboriginal and Torres Strait Islander nutrition workforce, and• national food and nutrition information systems.An evaluation of the NATSINSAP was completed in 2010, and is expected to contribute toinforming future national policy development aimed at improving nutrition in Aboriginal andTorres Strait Islander peoples.DRAFT <strong>Australian</strong> <strong>Dietary</strong> <strong>Guidelines</strong>- December 2011 153
2003 <strong>Dietary</strong> <strong>Guidelines</strong> for Adults<strong>Dietary</strong> <strong>Guidelines</strong> for Children and Adolescentsincorporating the Infant Feeding <strong>Guidelines</strong> for <strong>Health</strong>WorkersThe <strong>Dietary</strong> <strong>Guidelines</strong> for <strong>Australian</strong> Adults [37] and <strong>Dietary</strong> <strong>Guidelines</strong> for Children and Adolescents inAustralia [36], incorporating the Infant Feeding <strong>Guidelines</strong> for <strong>Health</strong> Workers, were based on thebest available scientific evidence and provided information for health professionals and the generalpopulation about healthy food choices. The use of the <strong>Guidelines</strong> was intended to encouragehealthy lifestyles to minimise the risk of developing diet-related diseases in the <strong>Australian</strong>population.The <strong>Guidelines</strong> highlighted the groups of foods and lifestyle patterns that promote good nutritionand health. As with all previous dietary guidelines, recommendations were presented as an integralwhole and no specific guideline was considered more important than any another.2006 Nutrient Reference Values for Australia and New ZealandIncluding Recommended <strong>Dietary</strong> IntakesIn 2002, the NHMRC was commissioned by the <strong>Australian</strong> Department of <strong>Health</strong> and Ageing(DoHA) in collaboration with the New Zealand Ministry of <strong>Health</strong> to manage the revision processfor the Recommended <strong>Dietary</strong> Intakes document. This resulted in the publication of the NutrientReference Values for Australia and New Zealand Including Recommended <strong>Dietary</strong> Intakes (NRVs) in2006 [9]. The NRVs identified a number of reference values that address nutrient needs andexcess intake for various age/sex groups.2006 NUTTAB OnlineThe first online release of nutrient data, with the 6 th edition of NUTTAB released by FSANZ. The7 th edition of NUTTAB was released in 2011 and is available athttp://www.foodstandards.gov.au/consumerinformation/nuttab2010/ [946]. Most of NUTTAB’sdata is now <strong>Australian</strong> analytical data and covers more than 2500 foods available in Australia andup to 245 nutrients per food.DRAFT <strong>Australian</strong> <strong>Dietary</strong> <strong>Guidelines</strong>- December 2011 154
2011 A Review of the Evidence to Address Targeted Questions toInform the Revision of the <strong>Australian</strong> <strong>Dietary</strong> <strong>Guidelines</strong>The primary aim of the ‘Evidence Report’ [14] was to undertake a series of targeted systematicreviews of the literature published since 2002 on the interrelationship between food, diet, healthand disease for different population subgroups.2011 A Modelling System to Inform the Revision of the <strong>Australian</strong>Guide to <strong>Health</strong>y <strong>Eat</strong>ingIn 2009 and 2010, the nutrient recommendations from the NRV 2006 document were translated(informed by A Review of the Evidence to Address Targeted Questions to Inform the Revision of the<strong>Australian</strong> <strong>Dietary</strong> <strong>Guidelines</strong>) into recommended amounts and types of foods which constitute ahealthy diet that prevents nutrient deficiency, reduces risk of chronic disease, and is culturallyacceptable, socially equitable and environmentally sustainable. This document updates the CoreFood Groups 1995.The Modelling document [10] also informs the development of these guidelines, which is an updateof the previously separate reports: the <strong>Dietary</strong> <strong>Guidelines</strong> for Adults (2003), <strong>Dietary</strong> <strong>Guidelines</strong> forOlder <strong>Australian</strong>s (1999) and <strong>Dietary</strong> <strong>Guidelines</strong> for Children and Adolescents (2003).DRAFT <strong>Australian</strong> <strong>Dietary</strong> <strong>Guidelines</strong>- December 2011 155
Appendix 2. Process reportIn 2003, NHMRC issued the <strong>Dietary</strong> <strong>Guidelines</strong> for <strong>Australian</strong> Adults and <strong>Dietary</strong> <strong>Guidelines</strong> for Childrenand Adolescents in Australia, having already issued <strong>Dietary</strong> <strong>Guidelines</strong> for Older <strong>Australian</strong>s in 1999.With a policy of reviewing guidelines every five years, NHMRC in collaboration with the <strong>Health</strong>yLiving Branch of the Department of <strong>Health</strong> and Ageing (DoHA) commenced a review of the suiteof <strong>Dietary</strong> <strong>Guidelines</strong> in 2008. The above three reports have now been combined into one set of<strong>Australian</strong> <strong>Dietary</strong> <strong>Guidelines</strong>.The <strong>Australian</strong> <strong>Dietary</strong> <strong>Guidelines</strong> provide a resource that promotes the benefits of healthy eating toimprove community health and wellbeing and to reduce the risk of diet-related disease. The<strong>Guidelines</strong> are intended for healthy members of the general population of any age, including peoplewith common diet-related risk factors such as being overweight. They are not intended for peoplewith medical conditions who require specialised dietary advice, or for the frail elderly who are atrisk of malnutrition. The target audience of the <strong>Guidelines</strong> includes health professionals (includingdietitians, nutritionists, general practitioners and nurses/lactation consultants), educators,government policy makers (for example, the government departments of health), the foodindustry and other interested parties. Other resources are being developed from the <strong>Guidelines</strong> forother target audiences.RaggAhmed was commissioned in October 2010 by NHMRC through a Request for Quoteprocess through the NHMRC technical writing panel to edit the draft chapters and collate theminto one succinct report.A2.1 ContributorsAn expert working committee (the Working Committee), chaired byDr Amanda Lee and deputy-chaired by Professor Colin Binns, was appointed in April 2008 toguide, advise and author the redevelopment of the <strong>Australian</strong> <strong>Dietary</strong> <strong>Guidelines</strong>. Representativesfrom DoHA attended working committee meetings as observers.A2.1.1 Members of the Working Committee• Dr Amanda Lee (Chair)• Professor Colin Binns (Deputy Chair)• Dr Geoffrey Annison (from August 2010)• Professor Sandra Capra, AM• Professor Peter Davies• A/Professor Sharon Friel• Ms Clare Hughes• A/Professor Mark LawrenceDRAFT <strong>Australian</strong> <strong>Dietary</strong> <strong>Guidelines</strong>- December 2011 156
• Professor Dorothy Mackerras• Dr David Roberts (until May 2010)• Dr Rosemary Stanton, OAM• Professor Linda TapsellA2.1.2 NHMRC project team• Ms Cathy Connor• Ms Bronwyn Battisson• Ms Marisa Bialowas• Mrs Marion Carey• Ms Cheryl Cooke• Ms Vesna Cvjeticanin• Ms Emma Milde• Ms Tess WinsladeA2.1.3 Department of <strong>Health</strong> and Ageing project team• Ms Erica Nixon• Ms Caroline Arthur• Ms Marina Dron• Ms Erica Kneipp• Ms Jacinta McDonald• Ms Bronia Rowe• Ms Leticia WhiteA2.1.4 Contractors• Sky Newton, Adelaide <strong>Health</strong> Technology• Philippa Middleton, methodologist, University of Adelaide• Dr Katrine Baghurst (<strong>Australian</strong> Guide to <strong>Health</strong>y <strong>Eat</strong>ing)• RaggAhmed, technical writers• Simon Grose, editor• Dr Rachel Nowak, consultant in science policy, analysis and communication• Quantum Market Research, health professional and consumer focus group testingA2.2 Literature reviewIn the past, the <strong>Dietary</strong> <strong>Guidelines</strong> have provided recommendations based on evidence including thatof nutrients and associations with health outcomes. However, as people eat foods rather thanisolated nutrients, the Working Committee determined that the literature review should primarilyDRAFT <strong>Australian</strong> <strong>Dietary</strong> <strong>Guidelines</strong>- December 2011 157
seek evidence on the relationship between foods, dietary patterns and health outcomes. TheWorking Committee determined that the revised guidelines would be an evolution from theprevious versions and build upon their evidence and science base.In 2009, the Dietitians Association of Australia was commissioned through an open Request forTender process to systematically review the literature.The Working Committee, with the assistance of a NHMRC Guideline Assessment Register PanelConsultant, Ms Skye Newton of Adelaide <strong>Health</strong> Technology Assessment, developed 27 complexsearch questions for the literature review in areas emerging in the literature and areas included inthe 2003 <strong>Dietary</strong> <strong>Guidelines</strong> where the evidence base may have changed. A number of establishedfood, diet and health relationships covered in the 2003 <strong>Dietary</strong> <strong>Guidelines</strong>, where the evidencebase was unlikely to have changed substantially, were identified as not needing specific searchquestions to be asked. <strong>For</strong> example, the relationship between diets high in saturated fat andincreased risk of high cholesterol.The 27 search questions for the literature review were prioritised to 12 complex questions inconsideration of time and financial constraints. These formed the basis of questions for three typesof review: systematic literature review (the systematic review of the primary literature); umbrellareview (the systematic review of systematic reviews); and narrative reviews (the comprehensivereview of the literature to answer more qualitative questions, for example, such as that concerningnature and scope of international food guides and practices promoting food safety).The final questions for systematic and umbrella reviews were transcribed into PICO format.Detailed definitions and search terms were developed for each component of the final complexsearch questions and a number of specific search questions for each variable arising from variouspermutations were formulated for each complex question.Standardised processes were used to review the literature [34, 39-41]. Databases searchedincluded CINAHL, MEDLINE, DARE, Cochrane, ScienceDirect, PsychLit and ERIC. <strong>For</strong> eachspecific search question, the identified articles were retrieved and reviewed for relevance by ateam of reviewers. Papers published before 2002 were excluded. Duplicates, papers not within thescope of the search questions and papers that were already included in meta-analyses, describedcross-sectional studies or were not research studies (for example, letters and editorials) were alsoexcluded.The evidence was assessed according to NHMRC levels and grades for recommendations fordevelopers of guidelines [41] which allowed each article to be critically appraised and assigned a levelof evidence based on a hierarchy according to the type of research question. As this reviewlooked at causality and intervention research questions the following hierarchy was used:• Level I - A systematic review of level II studies• Level II - A randomised controlled trial• Level III-1 - A pseudorandomised controlled trialDRAFT <strong>Australian</strong> <strong>Dietary</strong> <strong>Guidelines</strong>- December 2011 158
• Level III-2 - A comparative study with concurrent controls:Non-randomised experimental trialCohort studyCase-control studyInterrupted time series with a control group• Level III-3 - A comparative study without concurrent controls:Historical control studyTwo or more single arm studyInterrupted time series without a parallel control group• Level IV - Case series with either post-test or pre-test/post-test outcomes• Data was extracted from included studies and assessed for strength of evidence, size ofeffect and relevance of evidence according to standardised NHMRC processes [34, 39-41]. Thecomponents of the body of evidence - evidence base (quantity, level and quality of evidence);consistency of the study results; clinical impact; generalisability; and applicability to the <strong>Australian</strong>context) - were rated as excellent, good, satisfactory or poor according to standard NHMRCprotocols [41]. The reviewers then translated the evidence into a draft body of evidencestatement. The draft Evidence Statements were graded A to D according to standard NHMRCprotocols [41] where:• Grade A indicates that the body of evidence can be trusted to guide practice• Grade B indicates that the body of evidence can be trusted to guide practice in mostsituations• Grade C indicates that the body of evidence provides some support for therecommendations but care should be taken in its application• Grade D indicates that the body of evidence is weak and any recommendation must beapplied with caution.In order to reduce potential risks associated with advice being based on findings of single or only afew studies, the Working Committee and DAA Contractors advised that a minimum of five qualitystudies were required before a graded draft evidence statement could be made. The individualstudies in included meta-analysis studies were considered as separate studies.Once the Evidence Statements and Grades had been drafted the NHMRC commissioned amethodologist through the NHMRC methodologist panel, Ms Phillippa Middleton from theUniversity of Adelaide, to assist the Working Committee to ensure that the review activities hadbeen undertaken in a transparent, accurate and unbiased manner. The methodologist and theWorking Committee scrutinised each step of the review process by accessing the original papersand reviewing the rating of evidence components, and the wording and grading of each draftEvidence Statement. As a result, some Evidence Statements and Grades were amended using aWorking Committee consensus approach, and the final Evidence Statements and Grades wereagreed.DRAFT <strong>Australian</strong> <strong>Dietary</strong> <strong>Guidelines</strong>- December 2011 159
As nutrition is a continuously evolving area and research studies are published on a regular basis,the Working Committee also considered results from high quality studies (primarily systematicreviews) published after the literature review, and where deemed warranted, included the findingsand references in the relevant evidence sections in each Chapter. However, only the EvidenceStatements from systematic review of the literature until 2009 were graded.The results of this literature review, including the questions that were asked, are included in thereport of the commissioned literature review: A Review of the Evidence to Address Targeted Questionsto Inform the Revision of the <strong>Australian</strong> <strong>Dietary</strong> <strong>Guidelines</strong> (referred to as ‘the Evidence Report’) [14].The original literature search did not locate a sufficient number of food-based studies - rather thannutrient-based studies - to be able to draft evidence statements regarding food intake and dietarypatterns for pregnant and breastfeeding women and health outcomes of infants and/or mothers.Therefore, a team from the University of Adelaide and the Women’s and Children’s <strong>Health</strong>Research Institute was commissioned through a Request for Quote process from the NHMRCmulti-use panel to conduct a more extensive search of the literature to locate and summarisestudies meeting specified eligibility criteria. This team, led by Philippa Middleton and comprisingProfessor Maria Makrides, Dr Carmel Collins, Dr Alice Rumbold, Dr Jo Zhou, Professor CarolineCrowther and Associate Professory Vicki Flenady reviewed the literature for health outcomes forinfants and mothers from food-based studies on pregnant and breastfeeding women.Parts of this review were used to inform the ‘practical considerations’ for pregnant andbreastfeeding women that have been included in these guidelines.The Working Committee also determined that there was an evolving and increasing body ofliterature on the environmental impacts of the production and consumption of food and viceversa.Therefore, in addition to the original narrative review, a review of the relevant literature,particularly that pertaining to Australia, was conducted by A/Professor Friel and a team at the<strong>Australian</strong> National University. Following this work, it became clear that the inter-relationshipbetween diet and the environment is a cross-sectoral matter and should be considered as such.NHMRC will work further with other relevant <strong>Australian</strong> government agencies to develop thiswork.A2.3 Modelling systemIn 2008 to 2010, NHMRC undertook an extensive review of the Core Food Groups (1994) andreleased A modelling system to inform the revision of the <strong>Australian</strong> Guide to <strong>Health</strong>y <strong>Eat</strong>ing (theModelling System) in 2011 [10, 942]. The modelling system determined a range of combinations ofthe amounts and types of foods that could be consumed to meet the nutritional needs within theleast amount of energy for the smallest and least active people within an age and sex group. Theseare called Foundation Diets. <strong>For</strong> those that are more physically active or taller (and older, in thecase of infants, children and adolescents) within each age/sex group, the models provide additionalDRAFT <strong>Australian</strong> <strong>Dietary</strong> <strong>Guidelines</strong>- December 2011 160
food options to meet additional energy needs. These are called Total Diets. (Note that the TotalDiet for the smallest, least active people in each age/sex groups is equivalent to the FoundationDiet.)The number of serves and serve sizes modelled in the Modelling System were considered togetherwith other sources of evidence to determine the recommendations in these guidelines (seeSection A2.3 below).The Modelling System is located at www.eatforhealth.gov.au.A2.3 Development of the <strong>Australian</strong> <strong>Dietary</strong>Guideline recommendationsIn translating the evidence to formulate the <strong>Dietary</strong> Guideline recommendations the WorkingCommittee considered the following sources of evidence.• The commissioned literature review: A Review of the Evidence to Address Targeted Questionsto Inform the Revision of the <strong>Australian</strong> <strong>Dietary</strong> <strong>Guidelines</strong> (referred to as ‘the EvidenceReport’) [14].• The commissioned report: A Modelling System for Australia to Inform the Revision of the<strong>Australian</strong> Guide to <strong>Health</strong>y <strong>Eat</strong>ing (referred to as ‘the Food Modelling’ document) [10].• NHMRC and NZ Ministry of <strong>Health</strong> 2006 Nutrient Reference Values for Australia and NewZealand Including Recommended <strong>Dietary</strong> Intakes (referred to as ‘the NRV document’) [9].• Key authoritative government reports and documents provided by the WorkingCommittee and the NHMRC, including evidence in material provided by stakeholdersduring consultation processes and findings of relevant large, quality, peer-reviewed studiespublished after 2009.• The previous <strong>Dietary</strong> <strong>Guidelines</strong> for <strong>Australian</strong>s series and their supporting documentation[35-37].The information in the previous guidelines was used as the basis. New evidence was assessed todetermine whether associations between food, dietary patterns and health outcomes hadstrengthened, weakened, or stayed the same since the last review of the evidence.The final wording of the <strong>Dietary</strong> Guideline recommendations was developed by a WorkingCommittee consensus approach and focus tested.DRAFT <strong>Australian</strong> <strong>Dietary</strong> <strong>Guidelines</strong>- December 2011 161
A2.3.1 Public consultationThe Council of NMHRC considered the draft guidelines on 1 April 2011, on 16 June 2001, andagain on 2 November 2011. On 2 November 2011the Council agreed to recommend the ChiefExecutive Officer (CEO) of NHMRC release the <strong>Guidelines</strong> for public consultation.Public consultation on the draft guidelines was undertaken from xxxxx to xxxx. The publicconsultation was advertised in the major <strong>Australian</strong> newspapers and on the NHMRC website.Invitations were also sent to a large number of key stakeholders and those with a known interestin nutrition. XXX submissions were received from a variety of stakeholders including …..The Working Committee met on xxx to consider the submissions. Specific concerns included:A2.3.2 Peer reviewText to come …A2.3.3 Independent reviewText to come …A2.3.4 EndorsementThe <strong>Guidelines</strong> were considered by the Council on xxx for recommendation to the CEO forissuing. The CEO was pleased to accept the Council’s advice and agreed to issue to guidelinesunder Section 7(1a) of the National <strong>Health</strong> and Medical Research Council Act 1992.A2.3.5 Dissemination and implementationText to come …A2.3.6 ReviewIn line with NHMRC policy, the <strong>Guidelines</strong> will be reviewed within five years of publication.DRAFT <strong>Australian</strong> <strong>Dietary</strong> <strong>Guidelines</strong>- December 2011 162
Appendix 3. Assessing growth andhealthy weight in infants, children andadolescents, and healthy weight inadultsA3.1 Assessing growth and healthy weight ininfants, children and adolescentsMeasuring height and weight regularly is important. The most practical measures of growth statusin childhood are comparisons with reference growth charts that show the normal ranges of heightfor age, weight for age and BMI, by sex. As growth is a dynamic process, several measurements arepreferable when assessing children. When only a single measurement of weight and/or height isavailable, care is need in interpretation. <strong>For</strong> adults an assessment of obesity is usually made on thebasis of one measurement.There are several widely accepted and practical tools available for assessment. The options are:• BMI using international reference standards (The International Obesity Task <strong>For</strong>ce[IOTF] criteria) [712]• CDC BMI curves (also recommended by WHO before 2006) [947]• The new WHO growth reference (2006) BMI charts [948-950]The IOTF table uses cutoff points based on WHO adult BMI but extrapolated for use in childrenbased on six international data sets. The differences between these options have been reviewed byMonasata [951]. It is important to note that the use of different methods of assessing overweightor obesity will give different results. The results cannot be directly compared. <strong>For</strong> that reason it isessential to state the criteria used when stating the overweight or obesity level of an individual orpopulation.Measurement and recording of weight and height at regular intervals remains the best method tomonitor growth. Generally, irrespective of the reference standard used, if a child is growingnormally, the lines connecting the plotted values will proceed along - or parallel to - one of thepercentile lines on the charts. However at adolescence the growth trajectory may increase ordecrease dependent upon timing of the adolescent growth spurt. Care should always be takenwhen both measuring and plotting growth patterns to minimize error associated with poormeasurement technique or error in plotting.DRAFT <strong>Australian</strong> <strong>Dietary</strong> <strong>Guidelines</strong>- December 2011 163
A3.1.1 Growth monitoring in the first few years of lifeMeasurement and recording of the growth of infants and young children has been standardpractice in Australia for decades. Growth monitoring remains the best method of assessingnutritional status and overall health at the community and primary care level. Commonly ‘Weightfor Age’ and ‘Length/Height for Age’ growth reference charts are used. The most common growthreference in use in Australia was derived from US data (CDC 2000 [952]). The rate of growth isthe most important factor, although if growth is above the 95th percentile or below the 5th, orcrosses these percentiles, further assessment is required. In the first months of life monitoring aninfant’s weight and using growth reference charts is one of the ways in which the adequacy ofbreastfeeding is assessed.The new WHO growth reference (2006) [950] is heavier than the older growth referencecurrently in use in Australia in the first six months of life. Care should be taken to adjust for thisdifference when assessing the growth of infants. The 2nd percentile of the new WHO chartequivalent to the 5th percentile on the old chart. It is important when using growth charts toremember that they are a tool, not a diagnostic instrument. The pattern of the infant’s growth,and in particular whether babies are crossing the centile channels as well as the position on thegrowth chart, are used in conjunction with clinical assessment in determining if there is a problem.A3.1.2 BMI using international reference standardsAn international reference (International Obesity Task <strong>For</strong>ce) for defining overweight and obesityin children and adolescents were developed with data from six countries, and provide age and sexspecificBMI cut-off points for children and adolescents aged 2–18 years that correspond to adultBMI values of 25 kg/m 2 for overweight and 30 kg/m2 for obesity [712]. This method wasrecommended for use in the 2003 NHMRC <strong>Dietary</strong> <strong>Guidelines</strong> for Children and Adolescents. BMI hasbecome increasingly accepted as a useful tool for identifying and monitoring obesity in children[947, 953-955].DRAFT <strong>Australian</strong> <strong>Dietary</strong> <strong>Guidelines</strong>- December 2011 164
Table A3.1 International BMI cut-off points for overweight and obesity: males andfemales aged 2-18 yearsA3.1.3 CDC BMI curvesThe Centers for Disease Control (CDC) age and sex-specific BMI curves [947] are commonlyused. In Australia, NHMRC and DoHA had recommended use of the US CDC growth charts[952] for children and adolescents aged 2–18 years [36, 956]. This reference was also used byWHO before 2006. NHMRC defined overweight as above the 85th percentile for BMI-for-age andobese as above the 95th percentile for BMI-for-age.DRAFT <strong>Australian</strong> <strong>Dietary</strong> <strong>Guidelines</strong>- December 2011 165
However, use of the CDC Charts has been criticised as they are based on US data only, from fivenational surveys undertaken between 1963 and 1994, the most recent being NHANES 111. Theage and sex-specific CDC growth charts were last updated in 2000, and do not include weight data(and thus BMI data) from NHANES 111 from children over six years of age.A3.1.4 WHO growth chartsThe World <strong>Health</strong> Organization (WHO) has developed and uses two sets of growth referencecharts, one for children from birth to age five years [949], and one for children and adolescentsfrom age 5 to 19 years [948]. <strong>For</strong> children younger than five years, tables and charts showingpercentiles and Z-scores for BMI-for-age, weight-for-age, and weight-for-length were published in2006. Overweight is defined as two standard deviations above normal on the weight-for-heightchart and underweight is defined as weight-for-age two standard deviations below normal [949].<strong>For</strong> children and adolescents aged five to 19 years, tables and charts showing percentiles and Z-scores for BMI-for-age, height-for-age, and weight-for-age were published in 2007. The BMI Z-score-for-age chart defines overweight as greater than one standard deviation above normal,obesity as greater than two standard deviations above normal, thinness as less than two standarddeviations below normal, and severe thinness as less than three standard deviations below normal[948]. Recently the US has adopted the WHO growth charts [952] for children below 2 years ofage. However, these WHO growth charts are not commonly used in Australia at present.A3.1.5 OthersWaist circumference and waist/height ratio are becoming more common measures of child andadolescent central adiposity, but there is little consensus regarding standard cut-off values todefine overweight and obesity [717, 957-962]. Waist circumference is widely used in adultsbecause of its relationship to morbidity and mortality.Skinfold measurement – an index of subcutaneous adipose tissue – is another method of definingof under- or over-nutrition [963]. Reliable and accurate measurements depend to a large extenton the use of trained operators and properly calibrated instruments.Other methods of body composition assessment, for example DEXA (dual energy X-rayabsorptiometry), can provide accurate measurements, but cost limits their application toexperimental use and to clinical settings where more accurate diagnosis is required formanagement [964]. The most accurate measure of body composition is provided by using doublylabelled water, but cost limits its use to research.DRAFT <strong>Australian</strong> <strong>Dietary</strong> <strong>Guidelines</strong>- December 2011 166
A3.1.6 Z-scores and percentiles: Converting betweenmeasuresWhile percentiles are most commonly used in Australia, in some situations, particularly forresearch, it is more appropriate to use the Z-scores (standard deviations above or below themean). The conversion of percentiles to Z-scores requires a table of normal distributions. The50th percentile is a Z score of 0, the 90th percentile is +1.28, and 10th percentile is –1.28.Growth reference charts are available in both formats and a calculator is available on the internet(http://www.cdc.gov/growthcharts/ [952]). BMI can be converted into a BMI Z-score using a BMIfor-agegrowth chart and the formula: Z-score = ((BMI/M)L-1)/(LS), where M, L, and S are valuesselected from reference tables corresponding to the age of the child in months [36].A3.1.7 Differences between IOTF criteria and the newWHO growth referenceThere are major differences in the percentage of children classified as obese or overwightaccording to the reference used, ranging from 5% to 25% in a study of 3 year old children [951].These authors concluded that ‘the IOTF reference and cut-offs could be preferable for theidentification of overweight and obesity both at individual and population levels because they are atleast based on a crude association with ill health later in life, namely the definition of overweightand obesity at age 18 years’ [951].A3.2 How is healthy weight measured inadults?<strong>For</strong> adults the standard WHO BMI cutoff points are most commonly used for assessment ofobesity, and separate cutoffs are available for Asian populations.Body mass index (BMI) is a measure of body size that is widely used as an index of relative risk ofmortality and morbidity at the population level [687, 691]. The association of mortality with BMI isa J-shaped curve with the lowest risk – normal healthy weight – within the range 18.5 to 25 [687,691]. The cutoff point is 28 for older <strong>Australian</strong>s.BMI = weight (in kilograms)/height (in metres) 2 can be used to define weight status in adults(except older adults) as follows:Underweight
Obesity ≥30.0 [112, 126].People of Asian origin have the equivalent risk at a lower BMI and people of Polynesian origin havethe equivalent risk at a higher BMI [708].It is important to measure weight and height accurately to assess overweight and obesity, as selfreporteddata is usually inaccurate.Waist circumference is increasingly being used as an alternative measure of body size for riskassessment in adults, and provides a better estimate of risk in adults than BMI [965, 966]. Above80 centimetres in women or 94 centimetres in men is regarded as being overweight and over 88centimetres in women or above 102 centimetres in men is classified as obese [710, 759].DRAFT <strong>Australian</strong> <strong>Dietary</strong> <strong>Guidelines</strong>- December 2011 168
Appendix 4. Physical activity guidelinesAustralia’s physical activity guidelines outline the minimum levels of physical activity required togain a health benefit and identify ways to incorporate physical activity into everyday life. Below areexcerpts from physical activity guidelines developed and published by Australia’s CommonwealthDepartment of <strong>Health</strong> and Ageing:http://www.health.gov.au/internet/main/publishing.nsf/content/health-pubhlth-strateg-phys-actguidelines.A4.1 Physical activity recommendations for children 0–5 yearsThe Physical Activity Recommendations for Children 0–5 year state that being physicallyactive every day is important for the healthy growth and development of infants, toddlersand preschoolers [850].<strong>For</strong> infants (birth to 1 year) physical activity—particularly supervised floor-based play in safeenvironments should be encouraged from birth.Before infants begin to crawl, encourage them to be physically active by reaching andgrasping, pulling and pushing, moving their head, body and limbs during dailyroutines and supervised floor play, including tummy time. Once infants are mobile,encourage them to be as active as possible in a safe, supervised and nurturing playenvironment.Toddlers (1 to 3 years) and preschoolers (3 to 5 years) should be physically active every dayfor at least three hours, spread throughout the day.Young children don’t need to do their three hours of physical activity all at once. Itcan be accumulated throughout the day and can include light activity like standing up,moving around and playing as well as more vigorous activity like running andjumping. Active play is the best way for young children to be physically active.Children younger than 2 years of age should not spend any time watching television orusing other electronic media (DVDs, computer and other electronic games). <strong>For</strong> children 2to 5 years of age, these activities should be limited to less than one hour per day.Television, DVDs and playing computer games usually involve sitting for longperiods—time which could be spent playing active games or interacting with others.DRAFT <strong>Australian</strong> <strong>Dietary</strong> <strong>Guidelines</strong>- December 2011 169
Infants, toddlers and preschoolers should not be sedentary, restrained, or kept inactive, formore than one hour at a time, with the exception of sleeping.All children need some ‘down time’ but they are not naturally inactive for longperiods of time. Sitting in strollers, highchairs and car seats (restrained) for longperiods isn’t good for children’s health and development. Try to take regular breakson long car trips and walk or pedal for short trips when you can.While meeting these recommendations may seem like a challenge at times, a brochure thatincludes tips and ideas to help you include more activity in your child’s day and furtherinformation on the recommendations can be found at National Physical ActivityRecommendations for Children 0–5 years.A4.2 Physical activity recommendations for 5–12 year oldsThe Physical Activity Recommendations for Children 5–12 years [850] recommend thatchildren need at least 60 minutes (and up to several hours) of moderate to vigorousphysical activity every day.Examples of moderate activities are a brisk walk, a bike ride or any sort of active play.More vigorous activities to make kids ‘huff and puff’ include organised sports such asfootball and netball, as well as ballet, running and swimming laps. Children typicallyaccumulate activity in intermittent bursts ranging from a few seconds to several minutes, soany sort of active play will usually include some vigorous activity. Most importantly, kidsneed the opportunity to participate in a variety of fun activities that suit their interests, skillsand abilities. Variety will also offer your child a range of health benefits, experiences andchallenges.Children shouldn't spend more than two hours a day using electronic media forentertainment (for example, computer games, TV, internet), particularly during daylighthours.A4.3 Physical activity recommendations for 12–18 year oldsThe Physical Activity Recommendations for Children 12–18 years [850] state that:• at least 60 minutes of physical activity every day is recommended. This can build upthroughout the day with a variety of activities• physical activity should be done at moderate to vigorous intensity• for additional health benefits, try to include 20 minutes or more of vigorous activitythat causes young people to ‘huff and puff at least three to four days a week• children shouldn't spend more than two hours a day using electronic media forentertainment (computer games, TV, internet), particularly during daylight hours.DRAFT <strong>Australian</strong> <strong>Dietary</strong> <strong>Guidelines</strong>- December 2011 170
Suggested activities include:• moderate activities like brisk walking, bike riding with friends skateboarding anddancing, walking the dog, replacing short car trips with a walk or bike ride• vigorous activities such as football, netball, soccer, running, swimming laps ortraining for sport• trying to be active in as many ways as possible – variety is important in providing arange of fun experiences and challenges and provides an opportunity to learn newskills.A4.4 Physical activity guidelines for <strong>Australian</strong> adultsThe Physical Activity <strong>Guidelines</strong> for <strong>Australian</strong> Adults [850] make the followingrecommendations.• Think of movement as an opportunity, not an inconvenience.• Be active every day in as many ways as possible.• Put together at least 30 minutes of moderate-intensity physical activity on most,preferably all, days.• If possible, also enjoy some regular vigorous exercise for extra health and fitness.Moderate-intensity activity will cause a slight, but noticeable, increase in your breathing andheart rate. A good example of moderate-intensity activity is brisk walking, that is at a pacewhere you are able to comfortably talk but not sing. Other examples include mowing thelawn, digging in the garden, or medium paced swimming or cycling. The guidelines notethat accumulated short bouts of moderate-intensity activity of around 10–15 minuteswithout stopping is just as effective as continuous activity of at least 30 minutes per day onmost days of the week, which is the minimum level of activity required for preventing orimproving specific health indicators such as hypertension, heart disease and diabetes inadults [967]. However, this level of activity appears to be insufficient for preventing weightgain or weight loss or weight regain in most people [820, 968].A4.5 Physical activity recommendations for older <strong>Australian</strong>sThe Physical Activity Recommendations for Older <strong>Australian</strong>s [850] indicate that it is nevertoo late to become physically active and to feel the associated benefits. Most physicalactivities can be adjusted to accommodate older people with a range of abilities and healthproblems, including those living in residential care facilities.There are five physical activity recommendations for older <strong>Australian</strong>s.• Older people should do some form of physical activity, no matter what their age,weight, health problems or abilities.• Older people should be active every day in as many ways as possible, doing a rangeof physical activities that incorporate fitness, strength, balance and flexibility.DRAFT <strong>Australian</strong> <strong>Dietary</strong> <strong>Guidelines</strong>- December 2011 171
• Older people should accumulate at least 30 minutes of moderate-intensity physicalactivity on most - preferably all - days.• Older people who have stopped physical activity, or who are starting a new physicalactivity, should start at a level that is easily manageable and gradually build up therecommended amount, type and frequency of activity.• Older people who have enjoyed a lifetime of vigorous physical activity should carryon doing so in a manner suited to their capability into later life, providedrecommended safety procedures and guidelines are adhered to.DRAFT <strong>Australian</strong> <strong>Dietary</strong> <strong>Guidelines</strong>- December 2011 172
Appendix 5. Studies examining thehealth effects of intake of fruit andvegetables togetherThe literature includes studies which have investigated the effect of consumption of fruit andvegetables together. This evidence clearly confirms the positive health effects of consumingvegetables and fruits, particularly in reducing the risk of cardiovascular disease, but also in reducingrisk of obesity and some cancers. It is compiled as an Appendix to aid the conciseness of Chapter2.A5.1 Cardiovascular disease, type 2 diabetesand excess weightThere is evidence regarding a probable association between the consumption of each additionaldaily serve of fruit and vegetables and reduced risk of coronary heart disease (Grade B, Section 3.1in the Evidence Report [14]) [145-147, 150, 969].Similarly, recent evidence supports a probable association between consumption of each additionaldaily serve of fruit and vegetables and a reduced risk of stroke (Grade B, Section 3.2 in theEvidence Report [14]) [145, 146]. Consuming more than five serves of fruit and vegetables a daywas found to reduce the risk of stroke by 26% (fruit serve was 80g and vegetables 77g) [146], andconsuming each additional serve of fruit and vegetables (of average serve size 106g) reduced therisk of stroke by 5% [145]. These results are consistent with those presented in the literaturereviews to inform the recent review of the <strong>Dietary</strong> <strong>Guidelines</strong> for Americans, 2010 which found that‘consistent evidence suggests at least a moderate inverse relationship between vegetable and fruitconsumption with myocardial infarction and stroke, with significantly larger, positive effects notedabove five servings of vegetables and fruits per day’ [143].In the literature reviews to inform the revision of the <strong>Dietary</strong> <strong>Guidelines</strong> for Americans, 2010, theevidence for an association between increased fruit and vegetable intake and reduced risk ofexcess body weight was found to be modest, with a trend towards decreased weight gain over fiveor more years in middle adulthood associated with increased fruit and vegetable intake. Howeverno conclusions could be drawn from the evidence of efficacy of increased fruit and vegetableconsumption in weight loss diets [143]. However, in children and adolescents, the limited body ofevidence from longitudinal studies suggested that greater intakes of fruits and/or vegetables mayprotect against increased adiposity [143].DRAFT <strong>Australian</strong> <strong>Dietary</strong> <strong>Guidelines</strong>- December 2011 173
A5.2 CancerLung cancer: The recent body of evidence suggests that consumption of fruit and vegetables isassociated with reduced risk of lung cancer (Grade C, Section 3.5 in the Evidence Report [14])[970-972].Colorectal cancer: Recent evidence suggests that there is no association between consumption offruit and vegetables together and risk of colorectal cancer (Grade C, Section 3.4 in the EvidenceReport [14]) [177, 202]. In its 2008 report, the International Agency for Research on Cancer(IARC) also concluded that intakes of fruit and vegetables were either not associated or onlyslightly associated with risk of colorectal, breast and prostate cancer [973]. However, recentlypublished findings from the European Prospective Investigation into Cancer and Nutrition (EPIC)study suggest that a high consumption of fruit and vegetables is associated with reduced risk ofcolorectal cancer, especially of colon cancer, but that the effect may also depend on smokingstatus [974].Ovarian cancer: It is probable that there is no association between consumption of fruit andvegetables and risk of ovarian cancer (Grade B, Section 3.6 in Evidence Report [14]) [172, 173]. Amore recent meta-analysis has described evidence of a probable inverse relationship betweenconsumption of vegetables and fruit, and bladder cancer [975]. An insufficient number of studieswere found to produce an evidence statement for an association between the consumption of fruitand vegetables and renal cancer [976-978].Epithelial cancer: In general, comparison of the results of systematic reviews of the evidence ondiet and cancer sponsored by the World Cancer Research Fund in 1997 [586] and 2007 [42]suggests weaker evidence of a protective effect of high intakes of fruits and vegetables againstseveral common epithelial cancers, with a downgrading of the association from ‘convincing’ to‘probable.’ This is also consistent with the evidence presented in the International Agency forResearch on Cancer report [979].Overall cancer: Analyses of prospective studies have generally failed to demonstrate consistentevidence of a convincing association between the intake of fruits and vegetables and overall risk ofcancers [973]. However the more recent EPIC cohort study found a weak but statisticallysignificant inverse association between consumption of fruit and vegetables and risk of overallcancers —a 4% lower incidence of all cancers combined for an increment of 200g total fruit andvegetable intake per day [980].It should also be noted that a very weak association between the consumption of fruit andvegetables as a whole and overall cancer rates is not inconsistent with the evidence of the effectsof fruit and vegetable consumption on site-specific cancers, or the evidence that specific types offruit or vegetables may have an effect, particularly on the risk of site-specific cancers, and suggestsDRAFT <strong>Australian</strong> <strong>Dietary</strong> <strong>Guidelines</strong>- December 2011 174
that further specific studies are required, particularly those which attempt to account for potentialinteractions between tobacco [981] and alcohol [211].A5.3 Other conditionsAlthough not sufficient to develop evidence statements, individual studies found an associationbetween other health conditions and consumption of fruit and vegetables. These include:• decreased risk of high blood pressure [982]• decreased risk of dementia [317]• decreased risk of head and neck cancer [983]• decreased risk of various upper digestive tract cancers [44, 864, 984-986]• decreased risk of prostate cancer [229, 987]• obesity [988, 989].Although not sufficient to develop evidence statements, individual studies found no evidence anassociation between consumption of fruit and vegetables and pancreatic cancer [585, 990, 991].DRAFT <strong>Australian</strong> <strong>Dietary</strong> <strong>Guidelines</strong>- December 2011 175
Appendix 6. Alcohol and energy intakeTable A6.1 Median percentage of contribution of alcohol to energy intake per consumerAge groups16-18 y 19-24 y 25-44 y 45-64 y ≥65 y ≥19y andoverMale (%) 4.2 7.7 9.2 9.5 9.0 9.1Female (%) 4.9 9.0 8.4 7.5 7.4 8.1Source: National Nutrition Survey 1995 [47]DRAFT <strong>Australian</strong> <strong>Dietary</strong> <strong>Guidelines</strong>- December 2011 176
Table A6.2 Energy and alcohol content of common alcoholic drink servesDrink typeServe sizeEnergy(kJ/serve)Alcohol(g/serve)aStandarddrinkequivalentBeer, regular (4.5–4.9% alcohol)Beer, medium–light(3.7% alcohol)Beer, light (2.1%alcohol)1 can/stubby(375mL)1 can/stubby(375mL)1 can/stubby(375mL)568 15.4 1½546 14.0 1395 8.0 ½Wine (average of drywhite and red)1 glass (100mL b ) 340 – 395 9.5 1Spirits 1 nip (30mL) 255 8.8 1Pre-mixed spirits 1 can (375mL) 1182 13.9 1½a. Using 1995 National Nutrition Survey data [44]b. Note a glass of wine is usually more than 100mL, i.e. more than one standard drink.DRAFT <strong>Australian</strong> <strong>Dietary</strong> <strong>Guidelines</strong>- December 2011 177
Appendix 7. Equity and the socialdeterminants of health and nutritionstatusA7.1 IntroductionThe World Declaration on Nutrition (1992) states that ‘access to nutritionally adequate and safefood is a basic individual right’ [992]. Australia is fortunate to have an abundant and safe foodsupply. Life expectancy and health status are relatively high [12, 26, 44]. <strong>Australian</strong>s are generallyliterate and have good access to health and nutrition information and sufficient education to makeinformed food choices [993].However, there are differences in health and wellbeing between groups of <strong>Australian</strong>s. People inlower socioeconomic groups have shorter life spans and poorer health. They have higher rates ofdeath and disease, are more likely to be hospitalised and are less likely to use specialist andpreventative health services [994]. As in other countries, there is a socioeconomic gradientwhereby health status generally improves the higher a person is up the socioeconomic ladder [26].The determinants of health inequities are largely outside the health system and reflect thedistribution of social, economic and cultural resources and opportunities [27, 28, 992, 994].Employment, income, education, cultural influences, lifestyle, language, sex and other geneticdifferences, geographic, social or cultural isolation, age and disability, the security and standard ofaccommodation, and the availability of facilities and services, all influence diet, health andnutritional status [27, 28].The relationship between these factors and health status is complex and it is often difficult todetermine the nature and direction of causal relationships [27, 28]. <strong>For</strong> example, those on higherincomes tend to have greater opportunity to attain higher levels of education and afford housing inhigher socioeconomic areas with better access to goods and services (for example, healthservices, transport, shops including food outlets) that support healthy lifestyles. Lower levels ofeducation and/or an individual’s poor health status can limit opportunities for employment andtherefore income and access to other goods and services, including nutritious food [27, 28].While higher education can improve health literacy, just because a person can understand healthylifestyle and nutrition information does not mean they can or will act on it. <strong>For</strong> example, one<strong>Australian</strong> study of people 16 years and older found that, although 80% and 35% of people knewthe recommended daily intake of fruit and vegetables respectively, only 56% and under 10% metthese respective recommendations [26].DRAFT <strong>Australian</strong> <strong>Dietary</strong> <strong>Guidelines</strong>- December 2011 178
The economic, social and cultural factors that influence health inequities also influence the abilityof an individual to choose nutritious foods consistent with dietary guidelines [14]. The ability ofparents and carers to make nutritious food choices is likely to affect their family’s nutrition statustoo.Factors associated with complying with dietary guidelines include being female, older age, highersocioeconomic status, with higher education and having nutrition knowledge [43, 138, 858, 995-1011].Conversely, lower socioeconomic status and lower educational attainment are barriers tocomplying with dietary guidelines, and lower socioeconomic groups perceive cost as a barrier tohealthy food purchase [43, 138, 858, 995-1011].In a Melbourne study it was found that areas of greater socio-economic advantage had closeraccess to supermarkets, whereas areas of less socio-economic advantage had closer access to fastfood outlets [137].A greater understanding of the barriers to consuming a nutritious diet will help ensure thatappropriate messages, education and public health strategies are developed for groups whoexperience a greater burden of diet-related disease. It was essential that the social determinants ofhealth and nutrition status were considered in the <strong>Guidelines</strong> so as to reduce the risk of adding tohealth inequities, for example, by promoting consumption of expensive or hard to access foods.A7.2 Social distribution of diet-related healthoutcomesIn 2002–06 the death rate for people between 15 and 64 years was 70% higher in the lowest SESgroup than the highest SES group [26]. These rates reflect the higher prevalence of type 2 diabetesand cardiovascular disease among people living in the lowest SES group [12, 26].Gradients in risk factor prevalence are also apparent across quintiles of social disadvantage asdefined by socio-economic indexes for areas (SEIFA). The SEIFA assesses the relative socialdisadvantage of respondents by the economic resources, education and occupation patterns oftheir area of residence [26]. Overweight and obesity rates are also highest among the lower SESareas, although there was not a clear gradation across SEIFA quintiles [26]. Some of the factorsthat contribute to the development of overweight are also related to equity, particularly the social,cultural and economic barriers and enablers to healthy food choices (see Chapter 2). There is alsoa social gradient in physical activity levels; self-reported ‘sedentary’ behaviour rises from 25% ofpeople in the highest SES areas to 44% in the lowest SES areas [26].DRAFT <strong>Australian</strong> <strong>Dietary</strong> <strong>Guidelines</strong>- December 2011 179
A7.3 Social distribution of food intake andnutrition statusSocioeconomic factors have a large impact on food and nutrient intakes and food purchasingdecisions and patterns [858], and there is clear evidence of a social gradient for the distribution ofdiet-related chronic disease. Yet evidence for a social gradient related to specific foods - ratherthan overall dietary patterns - is less clear.Two recent systematic reviews assessed the impact of dietary interventions relative to socialdisadvantage [1012] and determinants of healthy eating for those with low income [1013]. Theyfound that economic and cultural influences impact on consumption of specific foods or foodgroups. While nutrition interventions can have greater impact in higher socioeconomic areas andnon-ethnic groups, they do not have a detrimental impact in low socioeconomic groups [1012,1013].Those with the least disposable income are at the greatest risk of poor nutrition as householdsvulnerable to poverty spend less per person on food but a greater proportion of their totalexpenditure on food [1014]. Analysis of <strong>Australian</strong> household food expenditure data suggests thata substantial proportion of the population is severely restricted in its capacity to make nutritiousfood choices and to achieve a healthy diet [1015].A7.3.1 Economics of food choiceThere is a growing body of research which indicates that food groups with more favourablenutrient profiles are more expensive. The ‘economics of food choice’ theory states that people’sdietary decisions, when made within the context of sustained budgetary constraints, are driven bymaximising energy value for money (dollars per megajoule [$/MJ]), resulting in energy-dense,nutrient-poor diets [730, 806]. <strong>For</strong> instance, meat, fruit and vegetables food groups have thehighest nutritional quality however are usually associated with highest costs, while sweets andsalted snacks have the lowest nutritional quality but are an inexpensive source of dietary energy[730, 806, 859, 1016]. Although high-quality nutrition is known to protect against chronic diseases,energy-dense, nutrient-poor foods costs considerably less than nutrient-rich foods [728].The costs of healthy (low energy-density, high nutrient density) foods are reported to beincreasing in Australia in comparison with higher energy density, lower nutrient density food. Oversix years from 2000 to 2006 the Consumer Price Index for food in Brisbane increased by 32.5%while the cost of a standard basket of healthy food increased approximately 50% acrossQueensland [140].DRAFT <strong>Australian</strong> <strong>Dietary</strong> <strong>Guidelines</strong>- December 2011 180
A diet consistent with the <strong>Guidelines</strong> is expensive for welfare-dependent families. An <strong>Australian</strong>study found it cost around 40% of their disposable income compared with 20% for families on theaverage income [138].A7.3.2 Food securityFood security refers to the ability to access nutritious, affordable foods and the capacity to obtainthem. At an individual or family level, food insecurity can be characterised by running out of foodand being unable to afford to buy more. About 5% of the <strong>Australian</strong> population suffer foodinsecurity in a year [1017-1019]. It is more common among:• the unemployed [1019]• Indigenous <strong>Australian</strong>s [1020]• those living in single parent households [1019]• those in the second lowest income quintile [1019]• those living in rental households [1019]• younger than older people [1019]• women than men (in some surveys but not others) [1017, 1018].Issues of food security in the face of rising food costs are of concern in Australia [140] (seeSection A7.3.1). <strong>For</strong> example, national Consumer Price Index data for the March 2011 quarterindicates that the cost of food had increased by 2.9% and that, primarily due to impacts of floodingin Queensland and Victoria and Cyclone Yasi in Queensland, the cost of fruit increased by 14.5%and the cost of vegetables increased by 16.2% [1021].There is an urgent need to nationally monitor and sustainably address the factors affecting theprice of nutritious foods, particularly for vulnerable groups who suffer a disproportionate burdenof poor health [140].A7.3.3 Social distribution of intake of foods and nutrientsA7.3.3.1 FoodsThe 1995 National Nutrition Survey [37] showed few systematic differences in food and nutrientintake across quintiles of social disadvantage, as defined by SEIFA based on the 1991 census. TableA7.1 shows the intake of various food groups across SEIFA quintiles from the NNS 1995.DRAFT <strong>Australian</strong> <strong>Dietary</strong> <strong>Guidelines</strong>- December 2011 181
Table A7.1 Mean daily intakes (g/day)from various food groups: people aged 19 yearsand over, by SEIFA quintile 2(grams per day)First quintileFifth quintile(most Second Third Fourth (leastFood group disadvantaged) quintile quintile quintile disadvantaged)Cereal & cereal products 196 222 203 217 232Cereal-based products & dishes 113 115 130 135 136Fruit products & dishes 126 147 141 143 156Vegetable products & dishes 264 258 260 262 251Legumes & pulses 9.8 7.9 10.8 9.5 10.7Milk products & dishes 281 284 285 292 301Meat, poultry, game 149 163 164 155 158Fish & seafood 22 24.5 26.3 25.8 28.8Egg products & dishes 16 15 16 13 19Snack foods 3.2 3.0 4.2 3.3 3.9Sugar products & dishes 20 21 20 18 17Confectionery 7.8 9.2 8.3 9.3 9.1Seeds & nuts 3.6 4.1 5.2 4.0 4.8Fats & oils 12 13 13 12 11Soup 53 62 55 48 57Savoury sauces & condiments 30 30 28 30 29Non-alcoholic beverages 2001 2005 1978 2007 1938Alcoholic beverages 239 254 273 270 234The key findings were as follows.• Consumption of fruit and fruit products was lower (10–20%) in the most disadvantagedgroup compared with the other four groups, but vegetable and legume consumptionshowed no consistent trend across the groups. This may be difficult to interpret as potatochips were included within this category.• Consumption of milk and milk products increased slightly with social advantage—about a10% increase across the groups.• Consumption of meat, poultry and game was slightly higher in the middle quintiles.• Fish and seafood consumption increased with social advantage – this was thought to be dueto better access to seafood in coastal areas where cities are located, and the higher priceof seafood products compared to other foods [37]).• Consumption of sugar products and dishes tended to decrease with social advantage.• Consumption of cereals and cereal-based foods (for example, rice, pasta and breads) waslower in the most disadvantaged group and the middle group compared with all othergroups. Consumption of cereal-based products and dishes (for example, cakes and biscuits)was about 20% lower in the two most disadvantaged groups compared with the otherthree [1022].DRAFT <strong>Australian</strong> <strong>Dietary</strong> <strong>Guidelines</strong>- December 2011 182
In other more recent studies, higher occupation level is associated with consumption of cheeseand skim milk and higher education level is associated with consumption of cheese. There is also asignificant positive relationship between skim milk consumption and occupation level based onfour individual studies [1023].A7.3.3.2 NutrientsAn assessment of energy and nutrient intakes across the SEIFA quintiles showed that energy intakeincreased with social advantage, as did intakes of most nutrients [1022]. However, whencorrecting for energy differences across groups, few differences were apparent in dietary quality,defined as nutrient intake per unit energy. Social advantage as indicated by SEIFA was positivelyassociated with higher nutrient densities for iron, zinc, magnesium and potassium and with intakeof intrinsic sugars but inversely associated with energy from fat [37].It is unclear from the published data whether other factors, such as the age profile, differedacross the quintiles of disadvantage and how much variation in factors such as age (which areknown to influence total food intake) might account for the differences that were apparent (forexample, in total energy intake). Physical activity may also vary across quintiles.Neither is it clear whether these relatively small differences in nutrient profiles could explain asignificant proportion of the variation in the health profiles across the groups. In interpretingthe data set, however, it should be borne in mind that a relatively crude, area-based measure ofsocial disadvantage was used. It is also possible that many of the most disadvantaged individualsin the community did not take part in the survey.DRAFT <strong>Australian</strong> <strong>Dietary</strong> <strong>Guidelines</strong>- December 2011 183
Table A7.2 Mean daily intakes of energy and nutrient densities: people aged 19 yearsand over, by SEIFA quintile 1First quintileFifth quintile(most Second Third Fourth (leastFood group disadvantaged) quintile quintile quintile disadvantaged)Energy (MJ) 8.82 9.18 9.37 9.31 9.45Nutrient density(per 10MJ energy)Protein (g) 98.2 98.4 98.5 98.6 99.4Fat (g) 89.8 90.7 91.1 88.9 88.8Saturated (g) 35.7 35.5 36.0 35.2 35.0Mono-unsaturated (g) 32.5 32.8 33.4 32.4 32.3Polyunsaturated (g) 13.5 13.5 13.9 13.4 13.4Cholesterol (mg) 332 331 332 319 305Total carbohydrate (g) 276 277 272 276 277Sugars (g) 128 125 123 124. 123Starch (g) 147 150 148 151 152Fibre (g) 24.4 24.4 24.9 25.2 25.6Alcohol (g) 13.4 13.3 14.3 14.6 13.8Vitamin A (g) 1280 1299 1236 1218 1329Thiamin (mg) 1.81 1.74 1.81 1.83 1.80Riboflavin (mg) 2.27 2.18 2.24 2.25 2.22Niacin (mg) 45.8 45.9 45.6 45.5 45.9Folate (g) 289 286 299 272 292Vitamin C (mg) 132 131 130 135 142Calcium (mg) 907 888 900 926 945Phosphorus (mg) 1626 1631 1630 1654 1673Magnesium (mg) 353 356 354 361 366Iron (mg) 15.1 15.0 15.3 15.4 15.6Zinc (mg) 12.9 13.07 12.8 13.0 13.3Potassium (mg) 3541 3495 3507 3528 3551Because inadequate nutritional status is part of the vicious cycle of malnutrition and infection,higher prevalence of under-nutrition in lower socio-economic groups further contributes to theincidence, severity and case fatality of childhood illnesses [871] and incidence of chronic disease inlater life.DRAFT <strong>Australian</strong> <strong>Dietary</strong> <strong>Guidelines</strong>- December 2011 184
A7.4 Aboriginal and Torres Strait IslanderpeoplesA7.4.1. Diet-related health outcomesAboriginal and Torres Strait Islander people in Australia suffer significant health inequitiescompared with the broader community. Aboriginal and Torres Strait Islander people typically dieat much younger ages and are more likely to experience ill health, disability and reduced quality oflife [1020]. Poor nutrition is a major risk factor for many of the diseases with higher prevalenceamong Aboriginal and Torres Strait Islander groups and it has been estimated that 19% of thenational Indigenous burden of disease is attributable to poor diet [1024].Socioeconomic disadvantage underlies many of these health statistics [1025]. Compared with non-Indigenous <strong>Australian</strong>s, Aboriginal and Torres Strait Islanders report lower incomes, higher ratesof unemployment, lower educational attainment, more overcrowded and inadequate housing[1026], higher rates of incarceration and limited access to transport [26]. Disrupted family andcommunity cohesion, social marginalisation, stress, lack of control over circumstances, anddiscrimination and racism are also apparent [30, 1025].Overweight and obesity are common [30, 855]. Measured anthropometric data for Aboriginal andTorres Strait Islanders are unavailable, however less reliable self-reported data indicated that morethan half of Aboriginal and Torres Strait Islander people aged 15 years and over were overweightor obese [1027].Under-nutrition among young children and relatively poor growth from around six months of agepersists in some parts of Australia [1028-1031].Vitamin and mineral status has been measured infrequently in Aboriginal and Torres Strait Islanderpopulations [30]. Multiple deficiencies have frequently been described in the same subject,suggesting the generally poor nutritional status of such individuals, rather than a specific micronutrientproblem. In particular, vitamin status (in relation to folate, ascorbic acid and betacarotene)consistent with low intakes of fruit and vegetables have often been described [8, 134].More recently iodine deficiency in an Aboriginal birth cohort in the Northern Territory [1032]and low vitamin D status in a South <strong>Australian</strong> Aboriginal population [1033] have been found.A7.4.2 Food intake, diet and nutritional statusAll the available evidence suggests that, traditionally, Aboriginal and Torres Strait Islanders were fitand healthy. The traditional diet appears to have been low in energy density but high in nutrientdensity—high in protein, low in sugars, high in complex carbohydrate, and high in micro-nutrients.Energy expenditure appears to have been high [30, 1034-1038].DRAFT <strong>Australian</strong> <strong>Dietary</strong> <strong>Guidelines</strong>- December 2011 185
With the transition from a traditional hunter-gather lifestyle to a settled Westernised existence,Aboriginal and Torres Strait Islander people’s diet has generally changed to an energy-dense dietthat is high in fat and added sugars [855, 1037, 1038]. The diet is also poor in fibre and certainnutrients including folate, retinol, vitamin E and other vitamins [134].In 2004-2005, 24% of Aboriginal and Torres Strait Islander people aged 15 years and overreported they ran out of food in the last 12 months, compared to 5% of non-Indigenous<strong>Australian</strong>s [1020]. While Aboriginal and Torres Strait Islander people living in remote areas weremore likely to report having run out of food in the last 12 months (36%), this figure was also highfor those in non-remote areas (20%) and ranged from 18% in NSW to 45% in the NorthernTerritory[1020]. Women are at extra risk, partly because there is a cultural predisposition forwomen to feed men and children before themselves [993]. Psychological suffering due to foodinsecurity can exacerbate feelings of exclusion, social disruption to family life and in some cases,anxiety about possible loss of custody of children [1039].There is very little recent dietary and nutrition data available for Aboriginal and Torres StraitIslander communities. Self-reported intakes of fruit and vegetables described in the 2004–05NATSIHS are much higher than would be expected from more reliable, objective data [8, 134,135, 232].A7.4.3.1 Aboriginal people living in remote communities<strong>Dietary</strong> intakes in remote Aboriginal communities have been consistently measured to be high inrefined carbohydrates and low in fresh fruit and vegetables [134, 135, 232]. Foods with highenergy density were associated with lower costs, contributing disproportionately to energyavailability and limiting the capacity of people living in these communities to attain a healthy diet[135, 1040]. Food supply is an ongoing issue [1040] with people in rural and remote areas payingat least 30% more for basic nutritious foods than people living in urban and metropolitan areas[140, 1041-1046]. Basic food items are less available in the more remote stores, as are freshvegetables and fruits and better nutritional choices [140]. The quality of dietary intake has beenshown to vary in close association with the income cycle in remote Aboriginal communities [1047,1048].In some communities purchased food intake is supplemented by procurement of traditional foods.In the 1994 National Aboriginal and Torres Strait Islander Survey - the last time these questionswere asked - 10% of respondents aged over 14 years reported spending more than one hour aweek hunting or foraging for traditional foods and, of these, more than half reported spendingmore than five hours a week doing so [1015]. Even though the actual intake of traditional foodsmay be low in some areas, traditional foods are still popular and culturally important for Aboriginaland Torres Strait Islander peoples [8, 1041, 1049-1051].DRAFT <strong>Australian</strong> <strong>Dietary</strong> <strong>Guidelines</strong>- December 2011 186
A7.4.3.2. Aboriginal people living in urban areasOnly limited dietary data are available for Aboriginal and Torres Strait Islander groups in urbanareas. High food costs, poor access to nutritious foods, convenience of take-away foods, budgetingissues, overcrowding, and poor knowledge and skills have been identified as barriers to healthyeating in these areas and can lead to food insecurity and overconsumption of energy-densenutrient-poor foods and drinks [1039, 1052-1054].A7.4.3.3 Recommendations specific to Aboriginal and Torres StraitIslander <strong>Australian</strong>sThe general <strong>Australian</strong> dietary guidelines are relevant to Aboriginal and Torres Strait Islanderpeoples [135, 232, 1055-1058]. In particular, increased consumption of vegetables and fruits couldbe expected to improve the health and nutritional status of Aboriginal and Torres Strait Islanderpeople.Lactose intolerance after the age of three to five years may, however, be problematic in someareas or for some individuals [421, 422]. Alternative calcium sources such as chewing meat andfish bones, and consumption of small, soft fish bones (for example, in tinned salmon), and lowlactosedairy foods (such as matured cheese and yoghurt) are recommended in these cases.Consumption of traditional bush foods should be supported wherever possible, although intake ofsome high saturated fat marine animal foods, such as dugong, should be limited, as was the casetraditionally[1059]. In addition, there may be a problem with high levels of heavy metals in theorgan meat of turtle and dugong [1060].As with other population groups, it is important to encourage and support breastfeeding, toensure that children and adolescents receive sufficient nutritious food to grow and developnormally, and to ensure that the growth of young children is checked regularly.Aboriginal and Torres Strait Islander people would benefit from:• eating traditional foods whenever possible• when choosing store foods, choosing those most like traditional bush foods, such as freshplant foods, wholegrain cereal foods, seafoods, and lean meat and poultry.A7.5 WomenWhere women are household heads in less advantaged urban and rural areas, there is increasedrisk of poverty, illiteracy and ill health [27, 28, 871].Women are particularly subject to anaemia between puberty and menopause because of folate oriron deficiency, and after menopause to osteoporosis and breast cancer. Pregnancy and lactationDRAFT <strong>Australian</strong> <strong>Dietary</strong> <strong>Guidelines</strong>- December 2011 187
have an associated nutrition risk due to increased nutrient requirements. Maternal nutritionalstatus is a major determinant of foetal and infant nutritional status.A7.6 Infants and childrenChildren, particularly those under five, are particularly susceptible to socioeconomic inequalitiesthat lead to marked differentials in health and nutrition. There is a clear association between thewealth of the environment the child grows up in, including socioeconomic indicators such asmaternal education, and family income [871]. According to the 2005–06 NSW Population <strong>Health</strong>Survey, exclusive breastfeeding of children at six months of age was significantly lower for infantswith mothers without tertiary qualifications (13%) compared with for those with tertiaryqualifications (25%); mothers living in the lowest socioeconomic status (SES) areas (11%)compared with those in the highest SES areas (26%); and mothers aged younger than 25 years(9%) compared with mothers aged 25 years and over (17%) [864]. Further information is alsoavailable in the revised Infant Feeding <strong>Guidelines</strong> for <strong>Health</strong> Workers [133].A7.7 Older peopleThe <strong>Dietary</strong> <strong>Guidelines</strong> are not for the frail elderly and reducing food components such as fat, saltand sugar which may make food more palatable are not always applicable to this population. Livingalone, as many older adults do, has been associated with a poorer, less varied diet. 4 Older peopleoften rely on pensions and have increasing difficulty with transport and communication, access tofacilities, and preparation of food. Ill health and poor dentition can also compromise nutritionalstatus. As the population continues to age, the demand for residential, respite and day-careservices for the elderly has increased.A7.8 People born overseasMany migrants enjoy health that is as good as, if not better than, that of the <strong>Australian</strong>-bornpopulation [26]. This could be partly because migrants are selected for their health status, orbecause, in some cases, they are less likely to be exposed to risk factors for non-communicabledisease before they arrive in Australia. However there is a small proportion of the migrantpopulation, such as refugees, who experience poorer health than other <strong>Australian</strong>s due tosocioeconomic and political factors [26].4Note that the <strong>Guidelines</strong> do not apply for the frail elderly or for residents of aged care institutions.DRAFT <strong>Australian</strong> <strong>Dietary</strong> <strong>Guidelines</strong>- December 2011 188
Mortality rates for people born overseas are generally lower than for people born in Australia, butthe causes of mortality differ depending on country of birth, with some migrants experiencinghigher mortality rates for particular conditions than <strong>Australian</strong>-born people. The prevalence ofdiet-related diseases also varies in different migrant groups. <strong>For</strong> example, diabetes is moreprevalent among those born in Germany, Greece, India, Italy, Lebanon and Poland, and coronaryheart disease is more prevalent among those born in Poland [26].The prevalence of health risk factors also varies depending on country of birth. People fromSouth-East Asia are less likely than <strong>Australian</strong>-born people to smoke, drink alcohol at risky orhigh-risk levels and be overweight or obese. In contrast, people from Oceania, United Kingdomand southern and eastern Europe are more likely to be overweight or obese than those born inAustralia [26].The health of migrants approaches the health of the local population over time, as migrants’ habitsand lifestyles move towards those of the wider <strong>Australian</strong> community. Food habits may change outof choice, because of the limited availability of traditional and familiar foods, or because of changein economic circumstances in Australia. Similarly, financial and language difficulties may affectaccess to education and employment opportunities which then affects income, health and nutritionliteracy, and access to nutritious foods. Some migrants experience disadvantages such as socialisolation and poor housing, which can affect access to safe food and safe preparation of food, andare generally in a relatively vulnerable position in their new environments, regardless of the type ofmigration [871].A7.9 Rural and remote <strong>Australian</strong>sMortality rates increase as remoteness increases [26]. People living outside major cities are morelikely to have high blood pressure, high cholesterol and report drinking at risky or high-risk levels.They were also more likely to be classified as overweight or obese. However rates of somecancers decrease slightly with remoteness [26].Underlying factors contributing to increased health risk include the lower levels of education,income and employment of many rural communities, occupation risks from farm or mining work,greater levels of smoking and alcohol abuse, less access to health services and staff, and thehazards of driving over long road distances. Among specific dietary factors, people living outsidemajor cities were less likely to eat too few vegetables but more likely to have insufficient fruitintake [26].In Australia, the cost of a basket of nutritious foods has been consistently found to be at least 30%higher in remote areas compared to capital cities [140, 1031, 1041, 1043-1046]. Among the mostremote communities, costs are highest in those areas greater than 2000km from capital cities,suggesting prices are influenced markedly by transport costs [140].DRAFT <strong>Australian</strong> <strong>Dietary</strong> <strong>Guidelines</strong>- December 2011 189
The availability of nutritious foods is limited in regional and remote areas in northern Australia[140, 1031, 1041, 1043-1046]. But even in south west Victoria, people living in more remotetowns without a major supermarket faced limited availability of healthy food basket items [1019].In NSW, the variety of fruit and vegetables available also decreases with remoteness and also withdecreasing socioeconomic status of the community [1061].DRAFT <strong>Australian</strong> <strong>Dietary</strong> <strong>Guidelines</strong>- December 2011 190
Appendix 8: GlossaryAdequate Intake (AI)The average daily nutrient intake level based on observed or experimentally-determinedapproximations or estimates of nutrient intake by a group (or groups) of apparently healthypeople that are assumed to be adequate. An AI is set when there is inadequate evidence tosupport setting an RDI.Adolescents<strong>For</strong> the purposes of these <strong>Guidelines</strong>, an adolescent is someone aged 12 to 18 years. A markedincrease in the rate of growth and development during adolescence increases the need for mostnutritents including energy, protein, vitamins and minerals.Allium vegetablesVegetables derived from a bulbous plant having an onion odour, including garlic, leeks, shallots,chives and onion.AnaemiaThere are several forms of anaemia. Microcytic anaemia (referring to small red blood cells) is adeficiency of red blood cells or their haemoglobin, often, but not always, related to iron deficiency.Macrocytic anaemia (referring to large red blood cells) is prevalent in some groups (such asAboriginal and Torres Strait Islander people) and may in some cases be associated withdeficiencies of other nutrients, especially folate and vitamin B12.Body massBody mass and body weight are often used interchangeably to describe the weight of a person’sbody.Body mass index (BMI)An index calculated by dividing the weight of an individual (in kilograms) by the square of theirheight (in metres), BMI is a simple estimate of the body fatness of a human being who does nothave abnormal physical characteristics. The World <strong>Health</strong> Organization and the US NationalDRAFT <strong>Australian</strong> <strong>Dietary</strong> <strong>Guidelines</strong>- December 2011 191
Institutes of <strong>Health</strong> have recommended that an operational definition of overweight be a BMI of atleast 25kg/m 2 and obesity as a BMI of at least 30kg/m 2 .A large number of anthropometric measurements and indices have been proposed for assessingand monitoring levels of obesity. Methods used in research studies to measure the percentage ofbody fat are not practical for regular clinical and community use.Table A8.1 Body mass index classification (WHO)Classification (WHO) BMI (kg/m 2 )Underweight < 18.5Normal range 18.5 – 24.9Pre-obese (overweight) 25.0 – 29.9Obese class I 30.0 – 34.9Obese class II 35.0 – 39.9Obese class III > 40.0Body weightSee body mass.Brassica vegetablesVegetables from the brassica or crucifer family, collectively known as cabbages or mustards andincluding broccoli, cabbage and brussel sprouts.BreadsRefers to leavened and unleavened wholemeal, white, mixed-grain, rye and fruit breads, as well asrolls, bagels, English muffins, crispbreads, crumpets and low-fat crackers.DRAFT <strong>Australian</strong> <strong>Dietary</strong> <strong>Guidelines</strong>- December 2011 192
CarbohydratesCarbohydrates are polyhydroxy aldehydes, ketones, alcohols, acids, their simple derivatives, andtheir polymers with linkages of the acetal type. They can be classified according to their degree ofpolymerisation and can be divided initially into three principal groups—sugars, oligosaccharidesand polysaccharides. Carbohydrates are the least concentrated form of energy providing 16kilojoules per gram.CerealsRefers to the entire class of cereal/grain foods, including whole or partially processed cereal grains(for example, rice, oats, corn and barley), breads, cereals, rice, pasta, noodles, polenta, couscous,oats, quinoa and barley. It excludes cereal or grain-based products with a significant amount ofadded fat and sugar, such as cakes, pastries, and biscuits.Children<strong>For</strong> the purposes of these <strong>Guidelines</strong>, children are defined as toddlers aged 1 to 2 years,preschoolers aged 3 to 5 years and primary school age 6 to 11 years.It is important for children to receive a nutritious diet which includes all the nutrients they needto grow and develop normally.CholesterolCholesterol, chemically a sterol, occurs in all the cell membranes of land animals. Brains and eggyolks are very rich in it, oils and fats from plants never contain it. <strong>Eat</strong>ing cholesterol does notnecessarily increase cholesterol in human blood plasma because when it is absorbed the livertends to reduce its own endogenous cholesterol synthesis. About half the body’s cholesterol ismade in the body from acetate.Complementary foodsAny food—manufactured or locally prepared—that is suitable as a complement to breastmilk orinfant formula when either becomes insufficient to satisfy an infant’s nutritional requirements.DRAFT <strong>Australian</strong> <strong>Dietary</strong> <strong>Guidelines</strong>- December 2011 193
Core food groupsThis was a concept of the previous modeling system and included foods that formed the basis of ahealthy diet, based on or developed with reference to Recommended Daily Intakes (RDIs) and the<strong>Guidelines</strong>.Cruciferous vegetablesSee brassica vegetables.Dairy FoodSee milks, yoghurts and cheeses.Discretionary foodsThis includes foods and drinks not necessary to provide the nutrients the body needs, but may addvariety. However, many of these are high in saturated fats, sugars, salt and/or alcohol, and aretherefore described as energy dense. They can be included sometimes in small amounts by thosewho are physically active, but are not a necessary part of the diet.Foods in this category include cakes, biscuits; confectionary, chocolate; pastries, pies; iceconfections, butter, cream, and spreads which contain predominantly saturated fats; potato chips,crisps and other fatty or salty snack foods; sugar-sweetened soft drinks and cordials, sports andenergy drinks and alcoholic drinks.Estimated Average Requirement (EAR)A daily nutrient level estimated to meet the requirements of half the healthy individuals in aparticular life stage and gender group.Energy ExpenditureTotal daily energy expenditure includes energy expended in physical activity and resting energyexpenditure (basal metabolic rate plus necessary tissue repair and the thermic effect of food) overa 24-hour period.DRAFT <strong>Australian</strong> <strong>Dietary</strong> <strong>Guidelines</strong>- December 2011 194
Exclusive breastfeedingMeans an infant is receiving only breastmilk, which includes expressed breastmilk and milk from awet nurse. The infant might also receive medications and vitamins or minerals as required.FatsMost of the fats in foods are triglycerides, made up of a unit of glycerol (glycerine) combined withthree fatty acids, which may be the same or different. Differences between fats are largely aconsequence of the fatty acids they contain, which together make up 90% of the weight of themolecule. Fats in the diet can be ‘visible’ or ‘invisible’. Among visible fats are butter, margarine,cooking oils, and the fat on meat. Invisible fats occur in foods such as cheese, sauces, mayonnaise,biscuits, cakes, pastries and nuts. In most diets, about half the fats are visible and half invisible.Fats are the most concentrated form of energy, providing 37 kilojoules per gram. They are thechemical form in which most of the energy reserve of animals and some seeds is stored.Cholesterol, a lipid, has important functions in the body as part of all cell membranes, part of themyelin in the brain and nervous system, and the starting material for synthesis in the body of bileacids and adrenocortical and sex hormones. Cholesterol can, however, accumulate in blood and inthe inner walls of arteries, leading to disease.Food varietyRefers to foods that are biologically diverse or nutritionally distinct from each other. <strong>Eat</strong>ing avariety of nutritious foods means consuming different food types in appropriate amounts to attainall the required nutrients without excess energy intake. Variety further refers to choosing a rangeof items from within each food group, particularly within the plant-based groups (vegetables, fruitsand cereals). Variety is an important nutritional principle which, in modern sedentary society,requires a reduction in serving sizes, particularly of more energy-dense foods with limited nutrientcontent.Foundation DietThe Foundation Diet was informed by current scientific evidence derived from the literature, themost current national intake data and the NHMRC’s 2006 Nutrient Reference Values. The dietswere modelled to provide as close to 100% of the RDIs of 10 key nutrients as was feasible and toprovide the estimated energy requirements of the smallest and very sedentary category (PAL 1.4)for each age and gender group. These Foundation Diets based on low energy requirements werethen tested using 100 7-day simulations with the aim that all of the simulations would meet theEARs of the 10 key nutrients.DRAFT <strong>Australian</strong> <strong>Dietary</strong> <strong>Guidelines</strong>- December 2011 195
FruitGenerally applies to the sweet, fleshy, edible portion of a plant that arises from the base of theflower and surrounds the seeds. Examples include pome fruit such as apples and pears, citrus fruitsuch as oranges and lemons, stone fruit such as apricots and plums, and berries.Fruit juice100% fruit juice, including pulp, is a good source of vitamins such as vitamin C and folate and alsoprovides fibre and carbohydrates, particularly natural sugars. Whole fruit is preferable to fruit juicehowever the occasional use of fruit juice may assist with nutrient intake when fresh, frozen ortinned fruit supply is sub-optimal. Fruit juice is energy-dense and if consumed in excess, it candisplace other nutritious foods from the diet and may lead to problems such as obesity.Frail elderly<strong>For</strong> the purposes of these <strong>Guidelines</strong>, the frail elderly are defined as older persons (usually overthe age of 75 years) with a physical or mental disability that may interfere with their ability toperform activities of daily living independently.Grain foodsSee cereals.Infant<strong>For</strong> the purposes of these <strong>Guidelines</strong>, infants are defined as children under the age of 12 months.Iron deficiencyRefers to a condition of low body iron, which may manifest itself as low serum iron, low serumferritin, high serum iron–binding capacity, a reduced transferrin saturation index and/or high–freeerythrocyte protoporphyrin. It can cause fatigue, listlessness and pallor and may progress toanaemia. It can also have widespread non-haematological effects on behaviour, cognition andmotor development, physical work performance, and body temperature regulation. In Australia,iron deficiency appears to be a condition predominantly seen in young women.DRAFT <strong>Australian</strong> <strong>Dietary</strong> <strong>Guidelines</strong>- December 2011 196
Legume/BeansRefers to all forms of edible beans and peas and preparations made from them—dried legumes,legume flour, bean curd, canned legumes, cooked legumes. Amongst the better known legumesinclude butter beans, haricot (navy) beans, red kidney beans, soybeans, mung beans, lentils, chickpeas, snow peas and various other types of fresh green peas and beans. Legumes are usuallycooked because this increases their nutritional value and improves their taste, but are occasionallyeaten raw (for example, snow peas). Legumes are technically a specialised form of fruit (the podsurrounds the seeds and arises from the base of the flower) but because the main food material inlegumes is generally the seeds rather than the flesh surrounding the seeds they are categorisedseparately.LimitLimit is used to emphasise the importance of limiting intake of foods and drinks high in saturatedand trans fats, added salt, added sugars and alcohol, due to evidence that these foods areassociated with increased risk of obesity and/or chronic disease, including cardiovascular disease,type 2 diabetes and/or some cancers.Low fat food<strong>For</strong> labelling purposes, foods which claim to be ‘low fat’ must meet criteria before a manufactureris allowed to print this on the food label. A ‘low fat’ or ‘low in fat’ product must contain no morethan 3g of fat per 100g of food. A liquid must contain no more than 1.5g of fat per 100g of liquid.Low salt food<strong>For</strong> labelling purposes, a low salt food as one with a sodium concentration of up to 120 milligramsper 100 grams (Australia New Zealand Food Standards Code, clause 17 of Standard 1.2.8). Thefollowing are the conversion factors for the units used to express the sodium content of food:• 1 mmol = 23 milligrams• 1 gram = 43 mmolOne gram of sodium chloride (NaCl) contains 17 mmol, or 391 milligrams, of sodium.MeatRefers to all or part of the carcass of any cattle, sheep, goat, buffalo, kangaroo, camel, deer, goat,pig or rabbit. <strong>For</strong> the purpose of the <strong>Guidelines</strong> refers to the muscle component only, excludingDRAFT <strong>Australian</strong> <strong>Dietary</strong> <strong>Guidelines</strong>- December 2011 197
offal such as liver and kidney.Meat alternativesRefers to other protein-rich foods, such as eggs, fish, shellfish, legumes, nuts and nut pastes, andcertain seeds, such as sunflower and sesame seeds.Milks, yoghurts and cheesesGenerally refers to cow’s milk and the yoghurt and cheese produced from it but can also includemilks, yoghurts and cheeses from goat and sheep milks.Milk, yoghurt and cheese alternativesInclusion in this ‘alternative’ category is based primarily on calcium content, although most of thealternatives also provide substantial amounts of protein. Calcium fortified grain-based beverages,fish whose bones are eaten (such as sardines), and some nuts (such as almonds), contain moderateto good amounts of calcium and protein and in this respect can be considered as alternatives.Monounsaturated fatty acidsIn chemical terms, monounsaturated fatty acids (MUFA) contain one unsaturated bond. MUFAoccurs in considerable amounts in olive oil, canola oil and many kinds of nuts.Nutrient Reference Values (NRVs)Amounts of nutrients required on an average daily basis for adequate physiological function andprevention of deficiency disease (EAR, AI or RDI) or chronic disease prevention (AcceptableMacronutrient Distribution Range (AMDR) or Suggested <strong>Dietary</strong> Target (SDT)). <strong>For</strong> each nutrient,an Upper Level of Intake (UL) was also set to specify the highest average daily nutrient intake likelyto pose no adverse health effects to almost all individuals in the general population.Nutritious foodsRefers to foods that make a substantial contribution towards providing a range of nutrients, havean appropriate nutrient density, and are compatible with the overall aims of the <strong>Guidelines</strong>.DRAFT <strong>Australian</strong> <strong>Dietary</strong> <strong>Guidelines</strong>- December 2011 198
Older adults<strong>For</strong> the purposes of these <strong>Guidelines</strong>, older adults are defined as healthy people aged 65 years andover, not including the frail elderly.OsteoporosisOsteoporosis, a condition of low bone mass, can lead to bone fragility and increased risk offractures. Most fractures in older adults are related to osteoporosis whereas trauma is theprimary cause of fractures in young adults. Clinically, individuals are considered osteoporotic iftheir bone mineral density is 2.5 SD or more below the young adult mean. This criterion identifiesabout 30% of all post-menopausal women as having osteoporosis. Of these, more than 50% willhave suffered a previous fracture. Osteoporosis is also of growing importance in men.Pasta and noodlesIncludes a wide range of Italian and Asian products based on sheets of dough made from flours—usually wheat or rice flour—and water, sometimes with egg added. Examples are plain spaghetti,lasagne, fettuccine, udon and Hokkien noodles, rice paper and wonton wrappers. The termexcludes some instant noodles and flavoured pasta mixes with significant amounts of added fat andsalt.Physical activityAny structured or incidental body movement (light, moderate or vigorous) which causes yourmuscles to work and uses more energy than you would use if you where resting (see Chapter 4).Physical inactivityPhysical inactivity (or sedentary behaviour) is defined as a state in which body movement isminimal, such as sitting time while watching television, reading, working at a computer, talking onthe telephone, driving a car, or meditating.PhytochemicalsSubstances found in plant materials which may confer some health benefits and which include anumber of chemical categories such as carotenoids, flavonoids and isoflavonoids, polyphenols,isothiocyanates, indoles, sulphoraphane, monoterpenes, xanthin, and non-digestibleoligosaccharides.DRAFT <strong>Australian</strong> <strong>Dietary</strong> <strong>Guidelines</strong>- December 2011 199
PlentyPlenty is used judiciously to encourage increased consumption of vegetables (particularly nonstarchyvarieties).Polyunsaturated fatty acidsPolyunsaturated fatty acids (PUFA) contain two or more (poly) double (unsaturated) bonds. Foodswith a high PUFA content are liquid at room temperature that is, they tend to be oils’. The mostcommon polyunsaturated fatty acid is linoleic acid (18:2) whose double bonds are in the n-6position. It occurs in seed oils including sunflower oil, safflower oil and corn oil. Smaller amountsof polyunsaturated fatty acids with double bonds in the n-3 position also occur in the diet. Thebest known are those in fatty fish, their names abbreviated to EPA (20:5 eicosapentaenoic) andDHA (22:6 docosahexaenoic). Another n-3 polyunsaturated fatty acid, ALA (18:3 alpha linolenic),occurs in considerable amounts in canola and flaxseed oils and in walnuts.PoultryRefers to chicken, duck, turkey and all other avian foods except eggs.QuinoaSee cereals or grain foods.Recommended <strong>Dietary</strong> Intake (RDI)The average daily dietary intake level that is sufficient to meet the nutrient requirements of nearlyall (97–98 per cent) healthy individuals in a particular life stage and gender group.Red meatThe muscle meat from cattle, sheep, pig, goat and kangaroo . Note that although pork is notconsidered red meat for marketing purposes in Australia, it is classified as red meat in theinternational literature, and has been treated as red meat for the purpose of the <strong>Guidelines</strong>.DRAFT <strong>Australian</strong> <strong>Dietary</strong> <strong>Guidelines</strong>- December 2011 200
Reduced fat products<strong>For</strong> a food to be labelled ‘reduced fat’, it must contain at least 25% less fat than is present in theequivalent full-fat product, and at least 3g less fat per 100g of food.Salt<strong>Dietary</strong> salt is an inorganic compound consisting of sodium and chloride ions. It is found naturallyin many foods, but it is also added to many foods because of its preservative and flavouringcharacteristics. Research has shown that both the sodium and the chloride can be detrimental tohealth when consumed in excess. About 90% of all the sodium added to food is sodium chloride,so dietary intake of sodium approximates intake of sodium chloride for practical purposes. Sodiumin the diet of <strong>Australian</strong> adults comes mostly from processed foods, although sodium added incooking, at the table, in medications and naturally present in foods can contribute to the totaldietary intake.<strong>Australian</strong> adults are recommended to limit their intake of sodium to less than 2300 mg per day.This is equivalent to about six grams of salt, or one and a half teaspoons.Saturated fatty acidsIn chemical terms, saturated fatty acids (SFA) contain no double bond - that is, they are fullysaturated with hydrogen. Foods which predominantly comprise SFA are usually solid at room (e.g.butter, fat on meat). SFA are the main type of fatty acid in milk, cream, butter and cheese, in somemeats (most of the land animal fats), and can also be found in considerable amounts in some oilssuch as in palm and coconut oil. When the saturated fatty acids palmitic (16:0), myristic (14:0) andlauric (12:0) predominate in the diet they tend to raise plasma cholesterol.SodiumSee salt.Standard drinkA standard drink contains 10 grams of alcohol—equivalent to 12.5 millilitres of alcohol.DRAFT <strong>Australian</strong> <strong>Dietary</strong> <strong>Guidelines</strong>- December 2011 201
SugarsConventionally used to describe monosaccharides and disaccharides such as sucrose, glucose andfructose which can be found naturally in foods or can be added to in processing. Sugars is the termused in the analysis of the 1995 National Nutrition Survey. Sugar, by contrast, is commonly used todescribe purified sucrose, as are the terms refined sugar and added sugar. Added sugars may alsoinclude other sugars such as glucose, fructose and corn syrup.Total DietProgression from Foundation Diets to Total Diets can occur when total energy needs are greaterthan the energy provided by a Foundation Diet for a particular age and sex group. Generalprinciples were determined to ensure that diets remained within acceptable limits for percentageof energy from fat and the various fat components, protein and carbohydrate (AMDRs), the UpperLevels (ULs) and Suggested <strong>Dietary</strong> Targets (SDTs) for chronic disease prevention. The principlesallow free addition of vegetables (including legumes), fruits, nuts and seeds, and cereal foods. Theprinciples also encourage a variety of choice of additional foods while defining the choices allowedin the modelling for the meat, milk, yoghurt and cheese products and unsaturated margarines andoils categories. ‘Discretionary choices’ can be included but it is important to note that they do notneed to be included in the diet, and Total Diets without inclusion of any ‘Discretionary choices’were also modelled for all age and sex groups.Trans-fatty acidsTrans-fatty acids are a form of unsaturated fatty acid that is straight at a double bond rather thanbent, as in the usual cis form. They are not common in nature but are formed during somemanufacturing processes, such as when edible oils are hydrogenated to make hard margarines.Small amounts of trans-fatty acids occur naturally in meats and dairy foods.Upper level of intake (UL)The highest average daily nutrient intake level likely to pose no adverse health effects to almost allindividuals in the general population. As intake increases above the ULUpper level of intake, thepotential risk of adverse effects increases.VegetablesApplies to leafy green vegetables (for example, spinach, lettuce, silverbeet and bok choi), membersof the crucifer or brassica family (for example, broccoli, cabbage, and brussels sprouts), starchyroot and tuber vegetables (for example, yams and potatoes), edible plant stems (for example,DRAFT <strong>Australian</strong> <strong>Dietary</strong> <strong>Guidelines</strong>- December 2011 202
celery and asparagus), gourd vegetables (for example, pumpkin and cucumber), allium vegetables(for example, onions, garlic and shallots), and sweet corn.WholegrainThis term applies to products which uses every part of the grain including the outer layers, branand germ even if these parts are separated during processing and regardless of whether the grainis in one piece or milled into smaller pieces.The term wholegrain may apply to whole and intact grains as found in some bread and crispbreads, puffed or flaked grains in some breakfast cereals, coarsely milled or kibbled wheat found inbreads such as pumpernickel and ground grains such whole wheat flour used to make wholemealbread.DRAFT <strong>Australian</strong> <strong>Dietary</strong> <strong>Guidelines</strong>- December 2011 203
Appendix 9: Summary of omittedevidence statementsA number of relationships between food consumption and disease outcomes have not beenconsidered or presented in the <strong>Australian</strong> <strong>Dietary</strong> <strong>Guidelines</strong>, even though these relationshipswere investigated as part of the systematic literature review process. However, these relationshipsand the reviewed evidence can still be found in the Evidence Report. A summary of therelationships that have been omitted, with reasoning, are provided below.A9.1 Grade C Evidence Statements: Foodconsumption with no association with a healthoutcomeTo avoid unnecessary confusion for the reader, Grade C evidence statements suggesting noassociation between a food and specific health outcome were not included in the evidencesummary tables at the beginning of each section within the document. These evidence statementshave been provided in Table A9.1.Please note that these evidence statements are discussed in further detail within the body of thedocument.Table A9.1: Grade C ‘no association’ relationships that informed the <strong>Australian</strong> <strong>Dietary</strong><strong>Guidelines</strong>Evidence StatementGradeVegetablesConsumption of vegetables is not associated with reduced risk of type 2 diabetes.Consumption of vegetables is not associated with reduced risk of oesophageal cancer.Consumption of vegetables is not associated with reduced risk of ovarian cancer.Consumption of vegetables is not associated with reduced risk of endometrial cancerConsumption of cruciferous vegetables, carrots, potatoes and beans and lentils is notassociated with risk of colorectal cancer.CCCCCDRAFT <strong>Australian</strong> <strong>Dietary</strong> <strong>Guidelines</strong>- December 2011 204
Evidence StatementGradeFruitConsumption of fruit is not associated with risk of type 2 diabetes.Consumption of fruit is not associated with risk of breast cancer.Consumption of fruit is not associated with risk of ovarian cancer.Consumption of fruit is not associated with risk of endometrial cancer.Consumption of fruit is not associated with risk of colorectal cancer.Consumption of fresh red meat 1 to 6 times per week (or an intake range of 14-70g/1000 Calories/d) is not associated with risk of bladder cancer.CCCCCCLean meat and poultry, fish, eggs, legumes/beans and nuts/seedsConsumption of fresh red meat, irrespective of frequency or serving size, is notassociated with risk of prostate cancerConsumption of 30-200grams of fresh red meat per day is not associated with risk ofpancreatic cancer.Consumption of at least 1 serve of fish a week is not associated with reduced risk ofdepression.Consumption of eggs daily is not associated with increased risk of coronary heartdisease.Consumption of nuts (65-110 g / day) does not lead to weight gain in the short-term.CCCCCMilk, yoghurt, cheese and/or alternativesConsuming dairy food is not associated with risk of endometrial cancerConsumption of dairy foods is not associated with weight change or risk of obesity.Consumption of milk is not associated with BMI or BMI change in childhood.Mean consumption of 1 serving of dairy food per day is not associated with the risk ofbreast cancer.Consumption of less than 1 serving of milk per day during adult life is not associatedwith risk of osteoporotic or hip fractureCCCCCDRAFT <strong>Australian</strong> <strong>Dietary</strong> <strong>Guidelines</strong>- December 2011 205
Evidence StatementGradeWaterConsumption of black tea is not associated with risk of cardiovascular disease.Consumption of coffee is not associated with risk of coronary heart disease.Consumption of coffee is not associated with risk of breast cancer.Consumption of coffee is not associated with risk of colorectal cancer.Consumption of coffee is not associated with risk of ovarian cancer.Consumption of green or black tea is not associated with risk of ovarian cancer.Consumption of green or black tea is not associated with risk of colorectal cancer.CCCCCCCA9.2 Grade D Evidence Statements that did notinform the <strong>Australian</strong> <strong>Dietary</strong> <strong>Guidelines</strong>In the systematic literature review (the Evidence Report), a number of food, diet, and healthrelationships were examined for which the evidence of an association was D-grade level. This wasbecause the evidence was limited, inconclusive or contradictory. These D-grade relationships werenot used to inform the development of the <strong>Australian</strong> <strong>Dietary</strong> <strong>Guidelines</strong>. Table A9.2 provides a listof the evidence statements for these relationships.Grade D evidence can inform health professionals about the strength of evidence from recentresearch, particularly in emerging areas, and help identify areas where further research on dietarypatterns and health outcomes may be required. D-grade evidence can also assist healthprofessionals correct diet related misconceptions among the general population. <strong>For</strong> example,members of the general population may be inclined to alter their dietary patterns when the resultsof a new study are widely publicised in the media.This evidence, while useful as mentioned above, was not used in the development of <strong>Guidelines</strong>tatements.DRAFT <strong>Australian</strong> <strong>Dietary</strong> <strong>Guidelines</strong>- December 2011 206
Table A9.2: Evidence statements (Grade D) that did not inform the <strong>Australian</strong> <strong>Dietary</strong><strong>Guidelines</strong>Evidence StatementGradeVegetablesThe effect of total vegetable consumption on gastric (stomach) cancer isinconclusive (Section 2.5 in Evidence Report)The effect of total vegetable consumption on the risk of breast cancer isinconclusive (Section 2.6 in Evidence Report)The effect of total vegetable consumption on the risk of colorectal cancer isinconclusive (Section 2.8 in Evidence Report)The effect of total vegetable consumption on the risk of lung cancer isinconclusive (Grade D, Section 2.7 in Evidence ReportDDDDFruitThe effect of fruit consumption on the risk of oesophageal cancer is inconclusive(Section 1.9 in Evidence Report)The effect of fruit consumption on the risk of gastric cancer is inconclusive(Section 1.5 in Evidence Report)There is limited evidence that fruit consumption reduces the risk of lung cancer(Section 1.7 in Evidence Report)The effect of citrus fruit consumption on the risk of pancreatic cancer isinconclusive (Section 1.13 in Evidence Report)DDDDGrain (cereal) foodsThe effect of grain (cereal) consumption on the risk of cancer is inconclusive(Section 6.1 in Evidence Report)DLean meat and poultry, fish, eggs, legumes/beans and nuts/seedsThe consumption of unprocessed red meat is associated with an increased riskof lung cancer (Section 4.5 in Evidence Report)There is limited evidence showing no association between the consumption ofred meat and the risk of breast cancer (Section 4.4 in Evidence Report)The effect of consuming poultry at least once a week on the risk of breastDDDDRAFT <strong>Australian</strong> <strong>Dietary</strong> <strong>Guidelines</strong>- December 2011 207
Evidence Statementcancer is inconclusive (Section 10.1 in Evidence Report)The effect of consuming poultry at least once a week on the risk of colorectalcancer is inconclusive (Section 10.2 in Evidence Report)The effect of fish consumption on the risk of breast cancer is inconclusive(Section 9.6 in Evidence Report)The effect of fish consumption on the risk of colorectal cancer is inconclusive(Section 9.7 in Evidence Report)The effect of fish consumption on the risk of prostate cancer is inconclusive(Section 9.8 in Evidence Report)The effect of fish consumption on the risk of renal cell cancer is inconclusive(Section 9.9 in Evidence Report)The effect of egg consumption on the risk of cancer is inconclusive (Section 11.2in Evidence Report)Consumption of legumes (especially soy foods) is associated with a reduced riskof breast cancer (Section 7.1 in Evidence Report)There unlikely to be a significant protective effect against prostate cancer fromconsuming soy foods (Section 7.2 in Evidence Report)GradeDDDDDDDDMilk, yoghurt, cheese and/or alternativesThe effect of milk consumption on the risk of prostate cancer is inconclusive(Section 5.14 in Evidence Report)DWaterThe effect of coffee consumption on the risk of increased systolic bloodpressure is inconclusive (Section 15.14 in Evidence Report)The effect of consuming four cups of coffee a day on the risk of gastric cancer isinconclusive (Section 15.5 in Evidence Report)Green and black tea consumption is not associated with an increased risk ofbreast cancer (Sections 15.16, 15.17, 15.22 in Evidence Report)DDDDRAFT <strong>Australian</strong> <strong>Dietary</strong> <strong>Guidelines</strong>- December 2011 208
References1. Rayner, M. and P. Scarborough, The burden of food related ill health in the UK. J EpidemiolCommunity <strong>Health</strong>, 2005. 59(12): p. 1054-7.2. National Public <strong>Health</strong> Partnership, <strong>Eat</strong> Well Australia: an agenda for action for public healthnutrition, 2000-2010, 2001, National Public <strong>Health</strong> Partnership: Canberra.3. <strong>Australian</strong> Institute of <strong>Health</strong> and Welfare, Premature mortality from chronic disease. AIHWBulletin no. 84. Cat. no. AUS 133, 2010, <strong>Australian</strong> Institute of <strong>Health</strong> and Welfare: Canberra.4. Queensland <strong>Health</strong>, The health of Queenslanders 2006. Report of the Chief <strong>Health</strong> Officer,Queensland, 2006, Queensland <strong>Health</strong>: Brisbane5. Crowley, S., et al., eds. The cost of diet-related disease in Australia: a discussion paper. 1992,<strong>Australian</strong> Institute of <strong>Health</strong> and Welfare: Canberra.6. Access Economics, The growing cost of obesity in 2008: three years on, 2008, DiabetesAustralia, Access Economics: Canberra.7. National Preventative <strong>Health</strong> Taskforce, Australia: the healthiest country by 2020 – NationalPreventative <strong>Health</strong> Strategy – the roadmap for action, 2009a, Commonwealth of Australia:Canberra.8. Lee, A.J., et al., Survival tucker: improved diet and health indicators in an aboriginal community.Aust J Public <strong>Health</strong>, 1994. 18(3): p. 277-85.9. National <strong>Health</strong> and Medical Research Council, <strong>Australian</strong> Government Department of<strong>Health</strong> and Ageing, and New Zealand Ministry of <strong>Health</strong>, Nutrient reference values forAustralia and New Zealand including recommended dietary intakes, 2006, Commonwealth ofAustralia: Canberra.10. National <strong>Health</strong> and Medical Research Council, A modelling system to inform the revision ofthe <strong>Australian</strong> Guide to <strong>Health</strong>y <strong>Eat</strong>ing, 2011a, Commonwealth of Australia: Canberra.11. Begg, S., et al., The burden of disease and injury in Australia 2003, 2007, <strong>Australian</strong> Institute of<strong>Health</strong> and Welfare: Canberra.12. <strong>Australian</strong> Bureau of Statistics, National <strong>Health</strong> Survey: Summary of Results, 2007-2008. Cat.no. 4364.0, 2009, <strong>Australian</strong> Bureau of Statistics: Canberra.13. Commonwealth Scientific and Industrial Research Organisation, Preventative <strong>Health</strong>National Research Flagship, and University of South Australia, 2007 <strong>Australian</strong> NationalDRAFT <strong>Australian</strong> <strong>Dietary</strong> <strong>Guidelines</strong>- December 2011 209
Children’s Nutrition and Physical Activity Survey - Main Findings, 2008, Commonwealth ofAustralia: Canberra.14. National <strong>Health</strong> and Medical Research Council, A review of the evidence to address targetedquestions to inform the revision of the <strong>Australian</strong> dietary guidelines, 2011b, Commonwealth ofAustralia: Canberra.15. Buckland, G., A. Bach, and L. Serra-Majem, Obesity and the Mediterranean diet: a systematicreview of observational and intervention studies. Obes Rev, 2008. 9(6): p. 582-93.16. Roman, B., et al., Effectiveness of the Mediterranean diet in the elderly. Clin Interv Aging, 2008.3(1): p. 97-109.17. Serra-Majem, L., B. Roman, and R. Estruch, Scientific evidence of interventions using theMediterranean diet: a systematic review. Nutr Rev, 2006. 64(2): p. S27.18. Bamia, C., et al., <strong>Dietary</strong> patterns and survival of older Europeans: the EPIC-Elderly Study(European Prospective Investigation into Cancer and Nutrition). Public <strong>Health</strong> Nutr, 2007. 10(6):p. 590-8.19. Diehr, P., et al., The effect of different public health interventions on longevity, morbidity, andyears of healthy life. BMC Public <strong>Health</strong>, 2007. 7: p. 52.20. Kant, A.K., B.I. Graubard, and A. Schatzkin, <strong>Dietary</strong> patterns predict mortality in a nationalcohort: the National <strong>Health</strong> Interview Surveys, 1987 and 1992. J Nutr, 2004. 134(7): p. 1793-9.21. Togo, P., et al., Food intake patterns and body mass index in observational studies. Int J ObesRelat Metab Disord, 2001. 25(12): p. 1741-51.22. Wirt, A. and C.E. Collins, Diet quality--what is it and does it matter? Public <strong>Health</strong> Nutr, 2009.12(12): p. 2473-92.23. Anderson, A.L., et al., <strong>Dietary</strong> patterns and survival of older adults. J Am Diet Assoc, 2011.111(1): p. 84-91.24. de Groot, C.P. and W.A. van Staveren, Nutritional concerns, health and survival in old age.Biogerontology, 2010. 11(5): p. 597-602.25. Scarborough, P., et al., Modelling the impact of a healthy diet on cardiovascular disease andcancer mortality. J Epidemiol Community <strong>Health</strong>, 2010.26. <strong>Australian</strong> Institute of <strong>Health</strong> and Welfare, Australia's health 2010. Australia’s health series no.12. Cat. no. AUS 122, 2010, <strong>Australian</strong> Institute of <strong>Health</strong> and Welfare: Canberra.DRAFT <strong>Australian</strong> <strong>Dietary</strong> <strong>Guidelines</strong>- December 2011 210
27. Wilkinson, R. and M. Marmot, Social determinants of health: the solid facts, 2003, World<strong>Health</strong> Organization: Copenhagen.28. Marmot, M.G., The status syndrome: how social standing affects our health and longevity 2004,New York: Henry Holt.29. Friel, S. and P.I. Baker, Equity, food security and health equity in the Asia Pacific region. Asia PacJ Clin Nutr, 2009. 18(4): p. 620-32.30. National <strong>Health</strong> and Medical Research Council, Nutrition in Aboriginal and Torres StraitIslander peoples: an information paper, 2000, Commonwealth of Australia: Canberra.31. <strong>Australian</strong> Bureau of Statistics and <strong>Australian</strong> Institute of <strong>Health</strong> and Welfare, The healthand welfare of Australia's Aboriginal and Torres Strait Islander peoples. ABS Cat. no. 4704.0.AIHW Cat. no. IHW14, 2005, Commonwealth of Australia: Canberra.32. <strong>Australian</strong> Bureau of Statistics, National Aboriginal and Torres Strait Islander <strong>Health</strong> Survey2004-2005, 2006, <strong>Australian</strong> Bureau of Statistics: Canberra.33. Commonwealth Department of <strong>Health</strong> and Family Services. Food and nutrition policy. 1992;Available from: http://www.health.gov.au/internet/main/publishing.nsf/content/phd-nutritionfnp-1992.34. National <strong>Health</strong> and Medical Research Council, How to review the evidence: systematicidentification and review of the scientific literature, 2000a, Commonwealth of Australia:Canberra.35. National <strong>Health</strong> and Medical Research Council, <strong>Dietary</strong> <strong>Guidelines</strong> for Older <strong>Australian</strong>s, 1999,Commonwealth of Australia: Canberra.36. National <strong>Health</strong> and Medical Research Council, <strong>Dietary</strong> <strong>Guidelines</strong> for Children andAdolescents in Australia, 2003, Commonwealth of Australia: Canberra.37. National <strong>Health</strong> and Medical Research Council, <strong>Dietary</strong> <strong>Guidelines</strong> for <strong>Australian</strong> Adults, 2003,Commonwealth of Australia: Canberra.38. National <strong>Health</strong> and Medical Research Council, NHMRC additional levels of evidence andgrades for recommendations for developers of guidelines, 2007, Commonwealth of Australia:Canberra.39. National <strong>Health</strong> and Medical Research Council, How to use the evidence: assessment andapplication of scientific evidence, 2000b, Commonwealth of Australia: Canberra.DRAFT <strong>Australian</strong> <strong>Dietary</strong> <strong>Guidelines</strong>- December 2011 211
40. National <strong>Health</strong> and Medical Research Council, NHMRC standards and procedures forexternally developed guidelines, 2007, Commonwealth of Australia: Canberra.41. National <strong>Health</strong> and Medical Research Council, NHMRC levels of evidence and grades forrecommendations for developers of guidelines, 2009, Commonwealth of Australia: Canberra.42. World Cancer Research Fund and American Institute for Cancer Research, Food, nutrition,physical activity, and the prevention of cancer: a global perspective., 2007: Washington DC.43. Ball, K., et al., How well do <strong>Australian</strong> women comply with dietary guidelines? Public <strong>Health</strong>Nutr, 2004. 7(3): p. 443-52.44. <strong>Australian</strong> Bureau of Statistics, National Nutrition Survey: Foods <strong>Eat</strong>en, Australia 1995., 1999,<strong>Australian</strong> Bureau of Statistics: Canberra.45. Commonwealth Department of <strong>Health</strong> and Family Services, The <strong>Australian</strong> Guide to <strong>Health</strong>y<strong>Eat</strong>ing, 1998, Commonwealth of Australia: Canberra.46. Rangan, A.M., et al., Consumption of 'extra' foods by <strong>Australian</strong> children: types, quantities andcontribution to energy and nutrient intakes. Eur J Clin Nutr, 2008. 62(3): p. 356-64.47. <strong>Australian</strong> Bureau of Statistics, National Nutrition Survey: Nutrient intakes and physicalmeasurements, Australia 1995, 1998, <strong>Australian</strong> Bureau of Statistics: Canberra.48. Cook, T., I. Rutishauser, and M. Seelig, Comparable data on food and nutrient intake andphysical measurements from the 1983, 1985 and 1995 national nutrition surveys, 2001,Commonwealth of Australia: Canberra.49. Burke, V., et al., Predictors of body mass index and associations with cardiovascular risk factors in<strong>Australian</strong> children: a prospective cohort study. Int J Obes (Lond), 2005. 29(1): p. 15-23.50. Classen, T. and C. Hokayem, Childhood influences on youth obesity. Econ Hum Biol, 2005.3(2): p. 165-87.51. Dubois, L., et al., Family food insufficiency is related to overweight among preschoolers. Soc SciMed, 2006. 63(6): p. 1503-16.52. Dubois, L. and M. Girard, Early determinants of overweight at 4.5 years in a population-basedlongitudinal study. Int J Obesity, 2006. 30(4): p. 610-7.53. Field, A.E., et al., Snack food intake does not predict weight change among children andadolescents. Int J Obes Relat Metab Disord, 2004. 28(10): p. 1210-6.DRAFT <strong>Australian</strong> <strong>Dietary</strong> <strong>Guidelines</strong>- December 2011 212
54. Hawkins, S.S., T.J. Cole, and C. Law, An ecological systems approach to examining risk factorsfor early childhood overweight: findings from the UK Millennium Cohort Study. J EpidemiolCommunity <strong>Health</strong>, 2009. 63(2): p. 147-55.55. Hesketh, K., et al., Predictors of body mass index change in <strong>Australian</strong> primary school children.Int J Pediatr Obes, 2009. 4(1): p. 45-53.56. Hesketh, K., et al., Stability of body mass index in <strong>Australian</strong> children: a prospective cohort studyacross the middle childhood years. Public <strong>Health</strong> Nutr, 2004. 7(2): p. 303-9.57. Li, L., et al., Intergenerational influences on childhood body mass index: the effect of parental bodymass index trajectories. Am J Clin Nutr, 2009. 89(2): p. 551-7.58. Mamun, A.A., et al., Family and early life factors associated with changes in overweight statusbetween ages 5 and 14 years: findings from the Mater University Study of Pregnancy and itsoutcomes. Int J Obes (Lond), 2005. 29(5): p. 475-82.59. Power, C., et al., Combination of low birth weight and high adult body mass index: at what age isit established and what are its determinants? J Epidemiol Community <strong>Health</strong>, 2003. 57(12): p.969-73.60. Reilly, J.J., et al., Early life risk factors for obesity in childhood: cohort study. Br Med J, 2005.330(7504): p. 1357.61. Salsberry, P.J. and P.B. Reagan, Taking the long view: the prenatal environment and earlyadolescent overweight. Res Nurs <strong>Health</strong>, 2007. 30(3): p. 297-307.62. Yang, S., et al., Emergence of socioeconomic inequalities in smoking and overweight and obesity inearly adulthood: the national longitudinal study of adolescent health. Am J Public <strong>Health</strong>, 2008.98(3): p. 468-77.63. Erik Landhuis, C., et al., Programming obesity and poor fitness: the long-term impact of childhoodtelevision. Obesity (Silver Spring), 2008. 16(6): p. 1457-9.64. Danner, F.W., A national longitudinal study of the association between hours of TV viewing andthe trajectory of BMI growth among US children. J Pediatr Psychol, 2008. 33(10): p. 1100-7.65. Bhargava, A., D. Jolliffe, and L.L. Howard, Socio-economic, behavioural and environmentalfactors predicted body weights and household food insecurity scores in the Early ChildhoodLongitudinal Study-Kindergarten. Br J Nutr, 2008. 100(2): p. 438-44.66. Henderson, V.R., Longitudinal associations between television viewing and body mass indexamong white and black girls. J Adolesc <strong>Health</strong>, 2007. 41(6): p. 544-50.DRAFT <strong>Australian</strong> <strong>Dietary</strong> <strong>Guidelines</strong>- December 2011 213
67. Viner, R.M. and T.J. Cole, Television viewing in early childhood predicts adult body mass index. JPediatr, 2005. 147(4): p. 429-35.68. Sturm, R. and A. Datar, Body mass index in elementary school children, metropolitan area foodprices and food outlet density. Public <strong>Health</strong>, 2005. 119(12): p. 1059-68.69. Baker, E., K.S. Balistreri, and J. Van Hook, Maternal employment and overweight amongHispanic children of immigrants and children of natives. J Immigr Minor <strong>Health</strong>, 2009. 11(3): p.158-67.70. Gorely, T., S.J. Marshall, and S.J. Biddle, Couch kids: correlates of television viewing amongyouth. Int J Behav Med, 2004. 11(3): p. 152-63.71. Epstein, L.H., et al., A randomized trial of the effects of reducing television viewing and computeruse on body mass index in young children. Arch Pediatr Adolesc Med, 2008. 162(3): p. 239-45.72. Matijasevich, A., et al., Socioeconomic position and overweight among adolescents: data frombirth cohort studies in Brazil and the UK. BMC Public <strong>Health</strong>, 2009. 9: p. 105.73. Oliver, L.N. and M.V. Hayes, Effects of neighbourhood income on reported body mass index: aneight year longitudinal study of Canadian children. BMC Public <strong>Health</strong>, 2008. 8: p. 16.74. Poulton, R., et al., Association between children's experience of socioeconomic disadvantage andadult health: a life-course study. Lancet, 2002. 360(9346): p. 1640-5.75. Taveras, E.M., et al., Association of consumption of fried food away from home with body massindex and diet quality in older children and adolescents. Pediatrics, 2005. 116(4): p. e518-24.76. Viner, R.M. and T.J. Cole, Who changes body mass between adolescence and adulthood? Factorspredicting change in BMI between 16 year and 30 years in the 1970 British Birth Cohort. Int JObesity, 2006. 30(9): p. 1368-74.77. Bisset, S., et al., Association of body mass index and dietary restraint with changes in eatingbehaviour throughout late childhood and early adolescence: a 5-year study. Public <strong>Health</strong> Nutr,2007. 10(8): p. 780-9.78. Laitinen, J., et al., Predictors of abdominal obesity among 31-y-old men and women born inNorthern Finland in 1966. Eur J Clin Nutr, 2004. 58(1): p. 180-90.79. Sturm, R. and A. Datar, Food prices and weight gain during elementary school: 5-year update.Public <strong>Health</strong>, 2008. 122(11): p. 1140-3.80. Goodman, E. and R.C. Whitaker, A prospective study of the role of depression in thedevelopment and persistence of adolescent obesity. Pediatrics, 2002. 110(3): p. 497-504.DRAFT <strong>Australian</strong> <strong>Dietary</strong> <strong>Guidelines</strong>- December 2011 214
81. Hesketh, K., M. Wake, and E. Waters, Body mass index and parent-reported self-esteem inelementary school children: evidence for a causal relationship. Int J Obes Relat Metab Disord,2004. 28(10): p. 1233-7.82. Klein, E.G., L.A. Lytle, and V. Chen, Social ecological predictors of the transition to overweight inyouth: results from the Teens <strong>Eat</strong>ing for Energy and Nutrition at Schools (TEENS) study. J AmDiet Assoc, 2008. 108(7): p. 1163-9.83. Fidler, J.A., et al., Does smoking in adolescence affect body mass index, waist or height? Findingsfrom a longitudinal study. Addiction, 2007. 102(9): p. 1493-501.84. Gale, C.R., G.D. Batty, and I.J. Deary, Locus of control at age 10 years and health outcomesand behaviors at age 30 years: the 1970 British Cohort Study. Psychosom Med, 2008. 70(4): p.397-403.85. Francis, L.A. and E.J. Susman, Self-regulation and rapid weight gain in children from age 3 to 12years. Arch Pediatr Adolesc Med, 2009. 163(4): p. 297-302.86. Koch, F.S., A. Sepa, and J. Ludvigsson, Psychological stress and obesity. J Pediatr, 2008. 153(6):p. 839-44.87. Thomas, C., E. Hypponen, and C. Power, Obesity and type 2 diabetes risk in midadult life: therole of childhood adversity. Pediatrics, 2008. 121(5): p. e1240-9.88. Joint WHO/FAO Expert Consultation on Diet Nutrition and the Prevention of ChronicDiseases, Diet, nutrition and the prevention of chronic diseases: report of a joint WHO/FAOexpert consultation, in World <strong>Health</strong> Organ Tech Rep Ser2003: Geneva. p. i-viii, 1-149,.89. National Preventative <strong>Health</strong> Taskforce, Australia: the healthiest country by 2020. Technicalreport no. 1 Obesity in Australia: a need for urgent action Including addendum for October 2008to June 2009 2009b, Commonwealth of Australia: Canberra.90. Schmidt, M., et al., Fast-food intake and diet quality in black and white girls: the National Heart,Lung, and Blood Institute Growth and <strong>Health</strong> Study. Arch Pediatr Adolesc Med, 2005. 159(7):p. 626-31.91. Affenito, S.G., et al., Breakfast consumption by African-American and white adolescent girlscorrelates positively with calcium and fiber intake and negatively with body mass index. J Am DietAssoc, 2005. 105(6): p. 938-45.92. Larson, N.I., et al., Family meals during adolescence are associated with higher diet quality andhealthful meal patterns during young adulthood. J Am Diet Assoc, 2007. 107(9): p. 1502-10.DRAFT <strong>Australian</strong> <strong>Dietary</strong> <strong>Guidelines</strong>- December 2011 215
93. <strong>Australian</strong> Bureau of Statistics. <strong>Australian</strong> <strong>Health</strong> Survey. 2011 [cited 31 May 2011]; Availablefrom:http://www.abs.gov.au/websitedbs/D3310114.nsf/Home/<strong>Australian</strong>+<strong>Health</strong>+Survey?OpenDocument94. Mozaffarian, D. and D.S. Ludwig, <strong>Dietary</strong> <strong>Guidelines</strong> in the 21st Century: a Time for Food.Journal of the American Medical Association, 2010. 304(6): p. 681-682.95. Yngve, A. and M. Tseng, <strong>Dietary</strong> guidelines and goal-setting. Public <strong>Health</strong> Nutrition, 2010.13(8): p. 1149-1150.96. Holdsworth, M., Sustainability should be integral to nutrition and dietetics. Human Nutritionand Dietetics, 2010. 23: p. 467-468.97. Kickbusch, I., The Food System: a prism of present and future challenges for health promotionand sustainable development, 2010, <strong>Health</strong> Promotion Switzerland: Geneva.98. Food Standards Australia New Zealand, The 22nd <strong>Australian</strong> Total Diet Study, 2008, FoodStandards Australia New Zealand: Canberra, Australia and Wellington, NZ.99. Commonwealth Department of <strong>For</strong>eign Affairs and Trade. Australia in brief: a diverse people.2010 [cited 2011 29 March]; Available from: http://www.dfat.gov.au/aib/society.html.100. Symons, M., One continuous picnic : a gastronomic history of Australia. 2nd ed2007, Carlton,Vic.: Melbourne University Press. xviii, 366 p.101. Stanton, R.A., Nutrition problems in an obesogenic environment. Med J Aust, 2006. 184(2): p.76-9.102. Walker, K.Z., et al., Product variety in <strong>Australian</strong> snacks and drinks: how can the consumer makea healthy choice? Public <strong>Health</strong> Nutr, 2008. 11(10): p. 1046-53.103. National <strong>Health</strong> and Medical Research Council, Iodine supplementation for pregnant andbreastfeeding women, 2010, Commonwealth of Australia: Canberra.104. Harriss, L.R., et al., <strong>Dietary</strong> patterns and cardiovascular mortality in the Melbourne CollaborativeCohort Study. Am J Clin Nutr, 2007. 86(1): p. 221-9.105. Jacques, P.F. and K.L. Tucker, Are dietary patterns useful for understanding the role of diet inchronic disease? Am J Clin Nutr, 2001. 73(1): p. 1-2.106. Kant, A.K., et al., A prospective study of diet quality and mortality in women. J Am Med Assoc,2000. 283(16): p. 2109-15.DRAFT <strong>Australian</strong> <strong>Dietary</strong> <strong>Guidelines</strong>- December 2011 216
107. McCullough, M.L., et al., Diet quality and major chronic disease risk in men and women: movingtoward improved dietary guidance. Am J Clin Nutr, 2002. 76(6): p. 1261-71.108. Wahlqvist, M.L., et al., Phytochemical deficiency disorders: inadequate intake of protective foods.Current therapeutics, 1998. 39(7): p. 53-60.109. Van Dokkum, W., et al., The health effects of bioactive plant components in food: results andopinions of the EU COST 926 action. Nutrition Bulletin, 2008. 33(2): p. 133-139.110. Dolan, L.C., R.A. Matulka, and G.A. Burdock, Naturally occurring food toxins. Toxins, 2010.2(9): p. 2289-2332.111. Gibson, R.S., The role of diet- and host-related factors in nutrient bioavailability and thus innutrient-based dietary requirement estimates. Food Nutr Bull, 2007. 28(1 Suppl International):p. S77-100.112. Lopez, M.A. and F.C. Martos, Iron availability: an updated review. Int J Food Sci Nutr, 2004.55(8): p. 597-606.113. Russell, R.M., The vitamin A spectrum: from deficiency to toxicity. Am J Clin Nutr, 2000. 71(4):p. 878-84.114. National <strong>Health</strong> and Medical Research Council, The <strong>Australian</strong> Guide to <strong>Health</strong>y <strong>Eat</strong>ing, 2011,National <strong>Health</strong> and Medical Research Council: Canberra.115. Knudsen, V.K., et al., Major dietary patterns in pregnancy and fetal growth. Eur J Clin Nutr,2008. 62(4): p. 463-70.116. Rodriguez-Bernal, C.L., et al., Diet quality in early pregnancy and its effects on fetal growthoutcomes: the Infancia y Medio Ambiente (Childhood and Environment) Mother and Child CohortStudy in Spain. Am J Clin Nutr, 2010. 91(6): p. 1659-66.117. Thompson, J.M., et al., Maternal dietary patterns in pregnancy and the association with small-forgestational-ageinfants. Br J Nutr, 2010. 103(11): p. 1665-73.118. Kinnunen, T.I., et al., Preventing excessive weight gain during pregnancy - a controlled trial inprimary health care. Eur J Clin Nutr, 2007. 61(7): p. 884-91.119. Brantsæter, A.L., et al., A dietary pattern characterized by high intake of vegetables, fruits, andvegetable oils is associated with reduced risk of preeclampsia in nulliparous pregnant Norwegianwomen. J Nutr, 2009. 139(6): p. 1162.120. Rifas-Shiman, S.L., et al., <strong>Dietary</strong> quality during pregnancy varies by maternal characteristics inProject Viva: a US cohort. J Am Diet Assoc, 2009. 109(6): p. 1004-1011.DRAFT <strong>Australian</strong> <strong>Dietary</strong> <strong>Guidelines</strong>- December 2011 217
121. Radesky, J.S., et al., Diet during early pregnancy and development of gestational diabetes.Paediatr Perinat Epidemiol, 2008. 22(1): p. 47-59.122. Tieu, J., C.A. Crowther, and P. Middleton, <strong>Dietary</strong> advice in pregnancy for preventinggestational diabetes mellitus. Cochrane Database Syst Rev, 2008(2): p. CD006674.123. Zhang, C., et al., <strong>Dietary</strong> fiber intake, dietary glycemic load, and the risk for gestational diabetesmellitus. Diabetes Care, 2006. 29(10): p. 2223-30.124. Chatzi, L., et al., Mediterranean diet in pregnancy is protective for wheeze and atopy inchildhood. Thorax, 2008. 63(6): p. 507.125. De Batlle, J., et al., Mediterranean diet is associated with reduced asthma and rhinitis in Mexicanchildren. Allergy, 2008. 63(10): p. 1310-1316.126. Hattevig, G., et al., Effect of maternal avoidance of eggs, cow's milk and fish during lactationupon allergic manifestations in infants. Clinical & Experimental Allergy, 1989. 19(1): p. 27-32.127. Lange, N.E., et al., Maternal dietary pattern during pregnancy is not associated with recurrentwheeze in children. J Allergy Clin Immunol, 2010. 126(2): p. 250-255.128. Shaheen, S.O., et al., <strong>Dietary</strong> patterns in pregnancy and respiratory and atopic outcomes inchildhood. Thorax, 2009. 64(5): p. 411-7.129. Robinson, S., et al., <strong>Dietary</strong> patterns in infancy: the importance of maternal and family influenceson feeding practice. Br J Nutr, 2007. 98(5): p. 1029-37.130. Food Standards Australia New Zealand. Listeria. 2011 [cited 2011 29 March]; Availablefrom: http://www.foodstandards.gov.au/consumerinformation/listeria/.131. Food Standards Australia New Zealand. Mercury in fish. 2011 [cited 2011 29 March];Available from:http://www.foodstandards.gov.au/consumerinformation/adviceforpregnantwomen/mercuryinfish.cfm.132. Cullen, G. and D. O'Donoghue, Constipation and pregnancy. Best practice & research.Clinical gastroenterology, 2007. 21(5): p. 807-18.133. National <strong>Health</strong> and Medical Research Council, * Title to be confirmed - Infant Feeding<strong>Guidelines</strong> for <strong>Health</strong> Workers 2011, Commonwealth of Australia: Canberra.134. Lee, A.J., K. O'Dea, and J.D. Mathews, Apparent dietary intake in remote Aboriginalcommunities. Aust J Public <strong>Health</strong>, 1994. 18(2): p. 190-7.DRAFT <strong>Australian</strong> <strong>Dietary</strong> <strong>Guidelines</strong>- December 2011 218
135. Brimblecombe, J.K. and K. O’Dea, The role of energy cost in food choices for an Aboriginalpopulation in northern Australia. Med J Aust, 2009. 190(10): p. 549-51.136. Ball, K., A. Timperio, and D. Crawford, Neighbourhood socioeconomic inequalities in foodaccess and affordability. <strong>Health</strong> & place, 2009. 15(2): p. 578-585.137. Burns, C. and A. Inglis, Measuring food access in Melbourne: access to healthy and fast foods bycar, bus and foot in an urban municipality in Melbourne. <strong>Health</strong> & place, 2007. 13(4): p. 877-885.138. Kettings, C., A.J. Sinclair, and M. Voevodin, A healthy diet consistent with <strong>Australian</strong> healthrecommendations is too expensive for welfare dependent families. Aust N Z J Public <strong>Health</strong>,2009. 33(6): p. 566-572.139. Landrigan, T. and C. Pollard, Food Access and Cost Survey (FACS), Western Australia, 2010, W.Department of <strong>Health</strong>, Editor 2011, Department of <strong>Health</strong>, WA: Perth, WA.140. Harrison, M., et al., The increasing cost of healthy food. Aust N Z J Public <strong>Health</strong>, 2010. 34(2):p. 179-186.141. NT Department of <strong>Health</strong> and Community Services, NT Market basket survey, 2006, 2007,NT Department of <strong>Health</strong> and Community Services.142. Marsh, K., et al., Meeting nutritional needs on a vegetarian diet. Aust Fam Physician, 2009.38(8): p. 600-2.143. U.S. Department of Agriculture and U.S. Department of <strong>Health</strong> and Human Services,<strong>Dietary</strong> <strong>Guidelines</strong> for Americans, 2010, 2010, U.S. Government Printing Office: Washington,DC.144. U.S. Department of <strong>Health</strong> and Human Services and U.S. Department of Agriculture,<strong>Dietary</strong> <strong>Guidelines</strong> for Americans 2005, 2005, U.S. Government Printing Office: WashingtonDC.145. Dauchet, L., et al., Fruit and vegetable consumption and risk of coronary heart disease: a metaanalysisof cohort studies. J Nutr, 2006. 136(10): p. 2588-93.146. He, F.J., et al., Increased consumption of fruit and vegetables is related to a reduced risk ofcoronary heart disease: meta-analysis of cohort studies. J Hum Hypertens, 2007. 21(9): p. 717-28.147. Joshipura, K.J., et al., Intakes of fruits, vegetables and carbohydrate and the risk of CVD. Public<strong>Health</strong> Nutr, 2009. 12(1): p. 115-21.DRAFT <strong>Australian</strong> <strong>Dietary</strong> <strong>Guidelines</strong>- December 2011 219
148. Rastogi, T., et al., Diet and risk of ischemic heart disease in India. Am J Clin Nutr, 2004. 79(4):p. 582-92.149. Rodríguez-Rodríguez, E., et al., Restricted-energy diets rich in vegetables or cereals improvecardiovascular risk factors in overweight/obese women. Nutr Res, 2007. 27(6): p. 313-320.150. Takachi, R., et al., Fruit and vegetable intake and risk of total cancer and cardiovascular disease:Japan Public <strong>Health</strong> Center-Based Prospective Study. Am J Epidemiol, 2008. 167(1): p. 59-70.151. Dauchet, L., P. Amouyel, and J. Dallongeville, Fruit and vegetable consumption and risk ofstroke: a meta-analysis of cohort studies. Neurology, 2005. 65(8): p. 1193-7.152. He, F.J., C.A. Nowson, and G.A. MacGregor, Fruit and vegetable consumption and stroke:meta-analysis of cohort studies. Lancet, 2006. 367(9507): p. 320-6.153. Villegas, R., et al., Vegetable but not fruit consumption reduces the risk of type 2 diabetes inChinese women. J Nutr, 2008. 138(3): p. 574-80.154. Harding, A.H., et al., Plasma vitamin C level, fruit and vegetable consumption, and the risk ofnew-onset type 2 diabetes mellitus: the European prospective investigation of cancer--Norfolkprospective study. Arch Intern Med, 2008. 168(14): p. 1493-9.155. Hamer, M. and Y. Chida, Intake of fruit, vegetables, and antioxidants and risk of type 2 diabetes:systematic review and meta-analysis. J Hypertens, 2007. 25(12): p. 2361-9.156. Field, A.E., et al., Association between fruit and vegetable intake and change in body mass indexamong a large sample of children and adolescents in the United States. Int J Obes Relat MetabDisord, 2003. 27(7): p. 821-6.157. He, K., et al., Changes in intake of fruits and vegetables in relation to risk of obesity and weightgain among middle-aged women. Int J Obes Relat Metab Disord, 2004. 28(12): p. 1569-74.158. Sartorelli, D.S., et al., High intake of fruits and vegetables predicts weight loss in Brazilianoverweight adults. Nutr Res, 2008. 28(4): p. 233-8.159. te Velde, S.J., et al., Tracking of fruit and vegetable consumption from adolescence into adulthoodand its longitudinal association with overweight Br J Nutr, 2007. 98(2): p. 431-8.160. Vioque, J., et al., Intake of fruits and vegetables in relation to 10-year weight gain among Spanishadults. Obesity (Silver Spring), 2008. 16(3): p. 664-670.161. Heck, J.E., et al., <strong>Dietary</strong> risk factors for hypopharyngeal cancer in India. Cancer CausesControl, 2008. 19(10): p. 1329-37.DRAFT <strong>Australian</strong> <strong>Dietary</strong> <strong>Guidelines</strong>- December 2011 220
162. Kreimer, A.R., et al., Diet and body mass, and oral and oropharyngeal squamous cell carcinomas:analysis from the IARC multinational case-control study. Int J Cancer, 2006. 118(9): p. 2293-7.163. Gallicchio, L., et al., Adulthood consumption of preserved and nonpreserved vegetables and therisk of nasopharyngeal carcinoma: a systematic review. Int J Cancer, 2006. 119(5): p. 1125-35.164. Guneri, P., et al., Primary oral cancer in a Turkish population sample: association withsociodemographic features, smoking, alcohol, diet and dentition. Oral Oncol, 2005. 41(10): p.1005-12.165. Escribano Uzcudun, A., et al., Pharyngeal cancer prevention: evidence from a case--control studyinvolving 232 consecutive patients. J Laryngol Otol, 2002. 116(7): p. 523-31.166. George, S.M., et al., Fruit and vegetable intake and risk of cancer: a prospective cohort study. AmJ Clin Nutr, 2009. 89(1): p. 347.167. Freedman, N.D., et al., Fruit and vegetable intake and esophageal cancer in a large prospectivecohort study. Int J Cancer, 2007. 121(12): p. 2753-60.168. Anderson, L.A., et al., Risk factors for Barrett's oesophagus and oesophageal adenocarcinoma:results from the FINBAR study. World J Gastroenterol, 2007. 13(10): p. 1585-94.169. González, C.A., et al., Fruit and vegetable intake and the risk of stomach and oesophagusadenocarcinoma in the European Prospective Investigation into Cancer and Nutrition (EPIC–EURGAST). Int J Cancer, 2006. 118(10): p. 2559-2566.170. Etminan, M., B. Takkouche, and F. Caamano-Isorna, The role of tomato products and lycopenein the prevention of prostate cancer: a meta-analysis of observational studies. Cancer EpidemiolBiomarkers Prev, 2004. 13(3): p. 340-5.171. Stram, D.O., et al., Prostate cancer incidence and intake of fruits, vegetables and relatedmicronutrients: the multiethnic cohort study (United States). Cancer Causes Control, 2006.17(9): p. 1193-207.172. Koushik, A., et al., Fruits and vegetables and ovarian cancer risk in a pooled analysis of 12 cohortstudies. Cancer Epidemiol Biomarkers Prev, 2005. 14(9): p. 2160-7.173. Schulz, M., et al., Fruit and vegetable consumption and risk of epithelial ovarian cancer: theEuropean Prospective Investigation into Cancer and Nutrition. Cancer Epidemiol BiomarkersPrev, 2005. 14(11): p. 2531.174. Bandera, E.V., et al., Fruits and vegetables and endometrial cancer risk: a systematic literaturereview and meta-analysis. Nutr Cancer, 2007. 58(1): p. 6-21.DRAFT <strong>Australian</strong> <strong>Dietary</strong> <strong>Guidelines</strong>- December 2011 221
175. Bravi, F., et al., Food groups and endometrial cancer risk: a case-control study from Italy. Am JObstet Gynecol, 2009. 200(3): p. 293 e1-7.176. Yeh, M., et al., Higher intakes of vegetables and vegetable-related nutrients are associated withlower endometrial cancer risks. J Nutr, 2009. 139(2): p. 317-22.177. Koushik, A., et al., Fruits, vegetables, and colon cancer risk in a pooled analysis of 14 cohortstudies. J Natl Cancer Inst, 2007. 99(19): p. 1471-83.178. Lam, T.K., et al., Cruciferous vegetable consumption and lung cancer risk: a systematic review.Cancer Epidemiol Biomarkers Prev, 2009. 18(1): p. 184-95.179. Cho, E., et al., Prospective study of intake of fruits, vegetables, vitamins, and carotenoids and riskof age-related maculopathy. Arch Ophthalmol, 2004. 122(6): p. 883-92.180. Harland, J.I. and T.A. Haffner, Systematic review, meta-analysis and regression of randomisedcontrolled trials reporting an association between an intake of circa 25g soya protein per day andblood cholesterol. Atherosclerosis, 2008. 200(1): p. 13-27.181. Deibert, P., et al., Weight loss without losing muscle mass in pre-obese and obese subjectsinduced by a high-soy-protein diet. International Journal of Obesity, 2004. 28(10): p. 1349-1352.182. Liao, F.H., et al., Effectiveness of a soy-based compared with a traditional low-calorie diet onweight loss and lipid levels in overweight adults. Nutrition, 2007. 23(7-8): p. 551-6.183. St-Onge, M.P., et al., Supplementation with soy-protein-rich foods does not enhance weight loss. JAm Diet Assoc, 2007. 107(3): p. 500-505.184. Akhter, M., et al., <strong>Dietary</strong> soy and isoflavone intake and risk of colorectal cancer in the Japanpublic health center-based prospective study. Cancer Epidemiol Biomarkers Prev, 2008. 17(8):p. 2128-35.185. Deneo-Pellegrini, H., et al., Plant foods and differences between colon and rectal cancers. Eur JCancer Prev, 2002. 11(4): p. 369.186. Michels, K.B., et al., Fruit and vegetable consumption and colorectal adenomas in the Nurses'<strong>Health</strong> Study. Cancer Res, 2006. 66(7): p. 3942-53.187. Oba, S., et al., Soy product consumption and the risk of colon cancer: a prospective study inTakayama, Japan. Nutr Cancer, 2007. 57(2): p. 151-7.188. Yang, G., et al., Prospective cohort study of soy food intake and colorectal cancer risk in women.Am J Clin Nutr, 2009. 89(2): p. 577-83.DRAFT <strong>Australian</strong> <strong>Dietary</strong> <strong>Guidelines</strong>- December 2011 222
189. Ward, H.A., et al., Breast, colorectal, and prostate cancer risk in the European ProspectiveInvestigation into Cancer and Nutrition–Norfolk in relation to phytoestrogen intake derived from animproved database. Am J Clin Nutr, 2010. 91(2): p. 440.190. Booth, A., et al., <strong>Dietary</strong> approaches for weight loss with increased intakes of fruit, vegetablesand dairy products. Nutr Diet, 2008. 65(2): p. 115-120.191. Conceição de Oliveira, M., R. Sichieri, and A. Sanchez Moura, Weight loss associated with adaily intake of three apples or three pears among overweight women. Nutrition, 2003. 19(3): p.253-256.192. Drapeau, V., et al., Modifications in food-group consumption are related to long-term body-weightchanges. Am J Clin Nutr, 2004. 80(1): p. 29-37.193. Rodriguez, M.C., et al., Effects of two energy-restricted diets containing different fruit amounts onbody weight loss and macronutrient oxidation. Plant Foods Hum Nutr, 2005. 60(4): p. 219-24.194. Riboli, E. and T. Norat, Epidemiologic evidence of the protective effect of fruit and vegetables oncancer risk. Am J Clin Nutr, 2003. 78(3 Suppl): p. 559S-569S.195. Gaudet, M.M., et al., Fruits, vegetables, and micronutrients in relation to breast cancer modifiedby menopause and hormone receptor status. Cancer Epidemiol Biomarkers Prev, 2004. 13(9):p. 1485-94.196. Hermann, S., J. Linseisen, and J. Chang-Claude, Nutrition and breast cancer risk by age 50: apopulation-based case-control study in Germany. Nutr Cancer, 2002. 44(1): p. 23-34.197. Kruk, J., Association of lifestyle and other risk factors with breast cancer according to menopausalstatus: a case-control study in the Region of Western Pomerania (Poland). Asian Pac J CancerPrev, 2007. 8(4): p. 513-24.198. Malin, A.S., et al., Intake of fruits, vegetables and selected micronutrients in relation to the risk ofbreast cancer. International journal of cancer. Journal international du cancer, 2003. 105(3):p. 413-8.199. van Gils, C.H., et al., Consumption of vegetables and fruits and risk of breast cancer. J Am MedAssoc, 2005. 293(2): p. 183-93.200. McCullough, M.L., et al., A prospective study of fruits, vegetables, and risk of endometrial cancer.Am J Epidemiol, 2007. 166(8): p. 902-11.201. Oh, S.-Y., et al., Relationship of nutrients and food to colorectal cancer risk in Koreans. Nutr Res,2005. 25(9): p. 805-813.DRAFT <strong>Australian</strong> <strong>Dietary</strong> <strong>Guidelines</strong>- December 2011 223
202. Sato, Y., et al., Fruit and vegetable consumption and risk of colorectal cancer in Japan: The MiyagiCohort Study. Public <strong>Health</strong> Nutr, 2005. 8(3): p. 309-14.203. Wu, H., et al., Fruit and vegetable intakes are associated with lower risk of colorectal adenomas. JNutr, 2009. 139(2): p. 340-4.204. Hamilton, C.A., Low-density lipoprotein and oxidised low-density lipoprotein: their role in thedevelopment of atherosclerosis. Pharmacol Ther, 1997. 74(1): p. 55-72.205. Thompson, H.J., et al., <strong>Dietary</strong> botanical diversity affects the reduction of oxidative biomarkers inwomen due to high vegetable and fruit intake. J Nutr, 2006. 136(8): p. 2207.206. Wannamethee, S.G., et al., Associations of vitamin C status, fruit and vegetable intakes, andmarkers of inflammation and hemostasis. Am J Clin Nutr, 2006. 83(3): p. 567-74; quiz 726-7.207. Jialal, I. and U. Singh, Is vitamin C an antiinflammatory agent? Am J Clin Nutr, 2006. 83(3): p.525.208. Tavani, A. and C. La Vecchia, [beta]-Carotene and risk of coronary heart disease. A review ofobservational and intervention studies. Biomedecine & Pharmacotherapy, 1999. 53(9): p. 409-416.209. Messina, M.J., Legumes and soybeans: overview of their nutritional profiles and health effects. AmJ Clin Nutr, 1999. 70(3): p. 439S.210. Nagata, C., Factors to consider in the association between soy isoflavone intake and breast cancerrisk. Journal of Epidemiology, 2010(0): p. 1002160133.211. Willett, W.C., Fruits, vegetables, and cancer prevention: turmoil in the produce section. J NatlCancer Inst, 2010. 102(8): p. 510-1.212. Giovannucci, E., Alcohol, one-carbon metabolism, and colorectal cancer: recent insights frommolecular studies. J Nutr, 2004. 134(9): p. 2475S-2481S.213. Zhang, S.M., et al., Plasma folate, vitamin B6, vitamin B12, homocysteine, and risk of breastcancer. J Natl Cancer Inst, 2003. 95(5): p. 373-80.214. García-Lafuente, A., et al., Flavonoids as anti-inflammatory agents: implications in cancer andcardiovascular disease. Inflammation Research, 2009. 58(9): p. 537-552.215. Lippman, S.M., et al., Effect of selenium and vitamin E on risk of prostate cancer and othercancers: the Selenium and Vitamin E Cancer Prevention Trial (SELECT). J Am Med Assoc, 2009.301(1): p. 39-51.DRAFT <strong>Australian</strong> <strong>Dietary</strong> <strong>Guidelines</strong>- December 2011 224
216. Paolini, M., et al., Beta-carotene: a cancer chemopreventive agent or a co-carcinogen? Mutat Res,2003. 543(3): p. 195-200.217. Khan, N., F. Afaq, and H. Mukhtar, Cancer chemoprevention through dietary antioxidants:progress and promise. Antioxidants & Redox Signaling, 2008. 10(3): p. 475-510.218. Bingham, S.A., et al., <strong>Dietary</strong> fibre in food and protection against colorectal cancer in theEuropean Prospective Investigation into Cancer and Nutrition (EPIC): an observational study.Lancet, 2003. 361(9368): p. 1496-1501.219. Inskip, H.M., et al., Women’s compliance with nutrition and lifestyle recommendations beforepregnancy: general population cohort study. Br Med J, 2009. 338.220. New Zealand Ministry of <strong>Health</strong>, Food and nutrition guidelines for healthy pregnant andbreastfeeding women: a background paper, 2006 (revised 2008), New Zealand Ministry of<strong>Health</strong>: Wellington.221. Birch L, Development of food preferences. Annual Review of Nutrition, 1999. 19: p. 41-62.222. Lussi A, M.B., Peter Shellis R, Wang X., Analysis of the erosive effect of different dietarysubstances and medications. Br J Nutr, 2011. 30: p. 1-11.223. Tasmanian School Canteen Association Inc. The Cool Canteen Accreditation Program. 2011[cited 2011 30 June]; Available from: http://www.tascanteenassn.org.au/coolcap.224. Office of Learning and Teaching, Go for your life school canteens and other school food servicespolicy, 2006, Department of Education: Melbourne.225. Northern Territory Government, Canteen, nutrition and health eating policy, D.o.E.a.Training, Editor 2009: Darwin.226. New South Wales Department of <strong>Health</strong> and New South Wales Department of Educationand Training, Fresh tastes @ school NSW healthy school canteen strategy, 2006, NSWDepartment of <strong>Health</strong> & NSW Department of Education and Training,: Sydney.227. Government of Western Australia, <strong>Health</strong>y food and drink, Department of Education, Editor2008.228. Government of South Australia, Right bite, healthy food and drink supply strategy for south<strong>Australian</strong> schools and preschools, Government of South Australia, Editor 2008: Adelaide229. Dick, M., et al., Smart choices – healthy food and drink supply strategy for queensland schools:evaluation report, Queensland health and department of education and training, Editor 2009:BrisbaneDRAFT <strong>Australian</strong> <strong>Dietary</strong> <strong>Guidelines</strong>- December 2011 225
230. Commonwealth Department of <strong>Health</strong> and Ageing, <strong>Guidelines</strong> for healthy foods and drinkssupplied in school canteens, 2010, Commonwealth of Australia: Canberra.231. AIHW, Australia's <strong>Health</strong> 2010, AIHW, Editor 2010, AIHW: Canberra.232. McDermott, R., et al., The health and nutrition of young indigenous women in northQueensland–intergenerational implications of poor food quality, obesity, diabetes, tobacco smokingand alcohol use. Public <strong>Health</strong> Nutr, 2009. 12(11): p. 2143-2149.233. Food Standards Australia New Zealand, Australia New Zealand Food Standards Code, 2011.234. Food Standards Australia and New Zealand, Standard 2.9.2 Foods for Infants, 2009.235. Jacobs et al, Whole-grain intake may reduce the risk of ischemic heart disease death inpostmenopausal women: the Iowa Women's <strong>Health</strong> Study. American Journal of ClinicalNutrition, 1998. 68(2): p. 248-57.236. Anderson, J.W., Whole grains protect against atherosclerotic cardiovascular disease. Proc NutrSoc, 2003. 62(1): p. 135-42.237. Berg, A., et al., Effect of an oat bran enriched diet on the atherogenic lipid profile in patients withan increased coronary heart disease risk. A controlled randomized lifestyle intervention study. AnnNutr Metab, 2003. 47(6): p. 306-11.238. De Moura, F., Whole grain intake and cardiovascular disease and whole grain intake anddiabetes: A review. Life Sciences Research Organization: Bethesda, MD, 2008.239. Djousse, L. and J.M. Gaziano, Breakfast cereals and risk of heart failure in the physicians' healthstudy I. Arch Intern Med, 2007. 167(19): p. 2080-5.240. Erkkila, A.T., et al., Cereal fiber and whole-grain intake are associated with reduced progressionof coronary-artery atherosclerosis in postmenopausal women with coronary artery disease. AmHeart J, 2005. 150(1): p. 94-101.241. Flight, I. and P. Clifton, Cereal grains and legumes in the prevention of coronary heart diseaseand stroke: a review of the literature. Eur J Clin Nutr, 2006. 60(10): p. 1145-59.242. Jacobs, D.R., Jr. and D.D. Gallaher, Whole grain intake and cardiovascular disease: a review.Curr Atheroscler Rep, 2004. 6(6): p. 415-23.243. Katcher, H.I., et al., The effects of a whole grain-enriched hypocaloric diet on cardiovasculardisease risk factors in men and women with metabolic syndrome. Am J Clin Nutr, 2008. 87(1):p. 79-90.DRAFT <strong>Australian</strong> <strong>Dietary</strong> <strong>Guidelines</strong>- December 2011 226
244. Kelly, S.A., et al., Wholegrain cereals for coronary heart disease. Cochrane Database Syst Rev,2007(2): p. CD005051.245. Liu, S., et al., A prospective study of dietary fiber intake and risk of cardiovascular disease amongwomen. J Am Coll Cardiol, 2002. 39(1): p. 49-56.246. Liu, S., et al., Is intake of breakfast cereals related to total and cause-specific mortality in men?Am J Clin Nutr, 2003. 77(3): p. 594.247. Negri, E., et al., Fiber intake and risk of nonfatal acute myocardial infarction. Eur J Clin Nutr,2003. 57(3): p. 464-70.248. Nettleton, J.A., et al., Incident heart failure is associated with lower whole-grain intake andgreater high-fat dairy and egg intake in the Atherosclerosis Risk in Communities (ARIC) study. J AmDiet Assoc, 2008. 108(11): p. 1881-1887.249. Ortega, R.M., et al., Responses to two weight-loss programs based on approximating the diet tothe ideal: differences associated with increased cereal or vegetable consumption. InternationalJournal for Vitamin & Nutrition Research, 2006. 76(6): p. 367-76.250. Pereira, M.A., et al., <strong>Dietary</strong> fiber and risk of coronary heart disease: a pooled analysis of cohortstudies. Arch Intern Med, 2004. 164(4): p. 370-6.251. Rave, K., et al., Improvement of insulin resistance after diet with a whole-grain based dietaryproduct: results of a randomized, controlled cross-over study in obese subjects with elevated fastingblood glucose. Br J Nutr, 2007. 98(5): p. 929-36.252. Truswell, A.S., Cereal grains and coronary heart disease. Eur J Clin Nutr, 2002. 56(1): p. 1-14.253. de Munter, J.S., et al., Whole grain, bran, and germ intake and risk of type 2 diabetes: aprospective cohort study and systematic review. PLoS Med, 2007. 4(8): p. e261.254. Henry, C.J.K., et al., Use of low-glycaemic index bread to reduce 24-h blood glucose: implicationsfor dietary advice to non-diabetic and diabetic subjects. International journal of food sciencesand nutrition, 2006. 57(3-4): p. 273-278.255. Hodge, A.M., et al., Glycemic index and dietary fiber and the risk of type 2 diabetes. DiabetesCare, 2004. 27(11): p. 2701-6.256. Krishnan, S., et al., Glycemic index, glycemic load, and cereal fiber intake and risk of type 2diabetes in US black women. Arch Intern Med, 2007. 167(21): p. 2304-9.257. Pereira, M.A., et al., Effect of whole grains on insulin sensitivity in overweight hyperinsulinemicadults. Am J Clin Nutr, 2002. 75(5): p. 848-55.DRAFT <strong>Australian</strong> <strong>Dietary</strong> <strong>Guidelines</strong>- December 2011 227
258. Priebe, M.G., et al., Whole grain foods for the prevention of type 2 diabetes mellitus. CochraneDatabase Syst Rev, 2008(1): p. CD006061.259. Venn, B.J. and J.I. Mann, Cereal grains, legumes and diabetes. Eur J Clin Nutr, 2004. 58(11): p.1443-61.260. Andersson, A., et al., Whole-grain foods do not affect insulin sensitivity or markers of lipidperoxidation and inflammation in healthy, moderately overweight subjects. J Nutr, 2007. 137(6):p. 1401-7.261. De La Hunty, A. and M. Ashwell, Are people who regularly eat breakfast cereals slimmer thanthose who don't? A systematic review of the evidence. Nutrition Bulletin, 2007. 32(2): p. 118-128.262. Gilhooly, C.H., et al., Use of cereal fiber to facilitate adherence to a human caloric restrictionprogram. Aging Clin Exp Res, 2008. 20(6): p. 513-20.263. Hallfrisch, J., D.J. Scholfield, and K.M. Behall, Blood pressure reduced by whole grain dietcontaining barley or whole wheat and brown rice in moderately hypercholesterolemic men. NutrRes, 2003. 23(12): p. 1631-1642.264. Hamedani, A., et al., Reduced energy intake at breakfast is not compensated for at lunch if ahigh-insoluble-fiber cereal replaces a low-fiber cereal. Am J Clin Nutr, 2009. 89(5): p. 1343-1349.265. Huus, K., et al., Relationship of food frequencies as reported by parents to overweight and obesityat 5 years. Acta Paediatr, 2009. 98(1): p. 139-43.266. Lightowler, H.J. and C.J.K. Henry, An investigation of the effectiveness of ready-to-eat breakfastcereals in weight loss: comparison between single and mixed varieties. Nutrition Bulletin, 2009.34(1): p. 48-53.267. Ortega, R.M., et al., Changes in thiamin intake and blood levels in young, overweight/obesewomen following hypocaloric diets based on the increased relative consumption of cereals orvegetables. Eur J Clin Nutr, 2007. 61(1): p. 77-82.268. Rodriguez-Rodriguez, E., et al., Changes in the sensation of hunger and well-being before andafter meals in overweight/obese women following two types of hypoenergetic diet. Public <strong>Health</strong>Nutr, 2009. 12(1): p. 44-50.269. Waller, S.M., et al., Evening ready-to-eat cereal consumption contributes to weight management. JAm Coll Nutr, 2004. 23(4): p. 316-21.DRAFT <strong>Australian</strong> <strong>Dietary</strong> <strong>Guidelines</strong>- December 2011 228
270. Williams, P.G., et al., Cereal grains, legumes, and weight management: a comprehensive reviewof the scientific evidence. Nutr Rev, 2008. 66(4): p. 171-82.271. Asano, T. and R.S. McLeod, <strong>Dietary</strong> fibre for the prevention of colorectal adenomas andcarcinomas. Cochrane Database Syst Rev, 2002(2): p. CD003430.272. Jacobs, E.T., et al., Fiber, sex, and colorectal adenoma: results of a pooled analysis. Am J ClinNutr, 2006. 83(2): p. 343-9.273. La Vecchia, C., et al., Session: whole cereal grains, fibre and human cancer wholegrain cerealsand cancer in Italy. Proc Nutr Soc, 2003. 62(1): p. 45-9.274. Peters, U., et al., <strong>Dietary</strong> fibre and colorectal adenoma in a colorectal cancer early detectionprogramme. Lancet, 2003. 361(9368): p. 1491-1495.275. Schatzkin, A., et al., <strong>Dietary</strong> fiber and whole-grain consumption in relation to colorectal cancer inthe NIH-AARP Diet and <strong>Health</strong> Study. Am J Clin Nutr, 2007. 85(5): p. 1353-60.276. Theuwissen, E. and R.P. Mensink, Water-soluble dietary fibers and cardiovascular disease.Physiol Behav, 2008. 94(2): p. 285-92.277. Kerckhoffs, D.A., et al., Effects on the human serum lipoprotein profile of beta-glucan, soyprotein and isoflavones, plant sterols and stanols, garlic and tocotrienols. J Nutr, 2002. 132(9): p.2494-505.278. Beck, E.J., et al., Oat beta-glucan increases postprandial cholecystokinin levels, decreases insulinresponse and extends subjective satiety in overweight subjects. Mol Nutr Food Res, 2009.53(10): p. 1343-51.279. Toden, S., et al., Effects of dietary beef and chicken with and without high amylose maize starchon blood malondialdehyde, interleukins, IGF-I, insulin, leptin, MMP-2, and TIMP-2 concentrations inrats. Nutr Cancer, 2010. 62(4): p. 454.280. Lazaridou, A. and C. Biliaderis, Molecular aspects of cereal [beta]-glucan functionality: physicalproperties, technological applications and physiological effects. Journal of Cereal Science, 2007.46(2): p. 101-118.281. Liu, R.H., Whole grain phytochemicals and health. Journal of Cereal Science, 2007. 46(3): p.207-219.282. Slavin, J., Why whole grains are protective: biological mechanisms. Proc Nutr Soc, 2003. 62(1):p. 129-34.DRAFT <strong>Australian</strong> <strong>Dietary</strong> <strong>Guidelines</strong>- December 2011 229
283. De-Regil, L.M., et al. Effects and safety of periconceptional folate supplementation for preventingbirth defects. 2010. DOI: 10.1002/14651858.CD007950.pub2.284. Food Standards Australia New Zealand, Thinking about having a baby?, 2010, Food StandardsAustralia New Zealand.285. Food Standards Australia and New Zealand. Folic acid / Folate. 2011 [cited 2011 12 May ];Available from:http://www.foodstandards.gov.au/consumerinformation/adviceforpregnantwomen/folicacidfolateandpr4598.cfm.286. National Institute for Clinical Studies, Encouraging periconceptional use of folic acidsupplements, in Evidence–practice gaps report, volume 2.2005, National Institute for ClinicalStudies: Melbourne.287. Sinha, R., et al., Meat intake and mortality: a prospective study of over half a million people. ArchIntern Med, 2009. 169(6): p. 562-71.288. Brink, M., et al., Meat consumption and K-ras mutations in sporadic colon and rectal cancer inThe Netherlands Cohort Study. Br J Cancer, 2005. 92(7): p. 1310-20.289. Chan, A.T., et al., Prospective study of N-acetyltransferase-2 genotypes, meat intake, smokingand risk of colorectal cancer. Int J Cancer, 2005. 115(4): p. 648-52.290. Kabat, G.C., et al., A cohort study of dietary iron and heme iron intake and risk of colorectalcancer in women. Br J Cancer, 2007. 97(1): p. 118-22.291. Larsson, S.C. and A. Wolk, Meat consumption and risk of colorectal cancer: a meta-analysis ofprospective studies. Int J Cancer, 2006. 119(11): p. 2657-64.292. Lee, S.A., et al., Animal origin foods and colorectal cancer risk: a report from the ShanghaiWomen's <strong>Health</strong> Study. Nutr Cancer, 2009. 61(2): p. 194-205.293. Norat, T., et al., Meat consumption and colorectal cancer risk: dose-response meta-analysis ofepidemiological studies. Int J Cancer, 2002. 98(2): p. 241-56.294. Oba, S., et al., The relationship between the consumption of meat, fat, and coffee and the risk ofcolon cancer: a prospective study in Japan. Cancer Lett, 2006. 244(2): p. 260-267.295. Sato, Y., et al., Meat consumption and risk of colorectal cancer in Japan: the Miyagi Cohort Study.Eur J Cancer Prev, 2006. 15(3): p. 211.296. Seow, A., et al., Food groups and the risk of colorectal carcinoma in an Asian population. Cancer,2002. 95(11): p. 2390-2396.DRAFT <strong>Australian</strong> <strong>Dietary</strong> <strong>Guidelines</strong>- December 2011 230
297. Garcia-Closas, R., et al., Food, nutrient and heterocyclic amine intake and the risk of bladdercancer. Eur J Cancer, 2007. 43(11): p. 1731-40.298. Larsson, S.C., et al., Meat intake and bladder cancer risk in a Swedish prospective cohort.Cancer Causes Control, 2009. 20(1): p. 35-40.299. Koutros, S., et al., Meat and meat mutagens and risk of prostate cancer in the Agricultural<strong>Health</strong> Study. Cancer Epidemiol Biomarkers Prev, 2008. 17(1): p. 80-7.300. Mori, M., et al., Traditional Japanese diet and prostate cancer. Mol Nutr Food Res, 2009.53(2): p. 191-200.301. Chan, J.M., F. Wang, and E.A. Holly, Pancreatic cancer, animal protein and dietary fat in apopulation-based study, San Francisco Bay Area, California. Cancer Causes Control, 2007.18(10): p. 1153-67.302. Iso, H., et al., Intake of fish and n3 fatty acids and risk of coronary heart disease amongJapanese: the Japan Public <strong>Health</strong> Center-Based (JPHC) Study Cohort I. Circulation, 2006.113(2): p. 195.303. Virtanen, J.K., et al., Fish consumption and risk of major chronic disease in men. Am J Clin Nutr,2008. 88(6): p. 1618-25.304. Whelton, S.P., et al., Meta-analysis of observational studies on fish intake and coronary heartdisease. Am J Cardiol, 2004. 93(9): p. 1119-23.305. Yamagishi, K., et al., Fish, omega-3 polyunsaturated fatty acids, and mortality from cardiovasculardiseases in a nationwide community-based cohort of Japanese men and women the JACC (JapanCollaborative Cohort Study for Evaluation of Cancer Risk) Study. J Am Coll Cardiol, 2008.52(12): p. 988-96.306. Folsom, A.R. and Z. Demissie, Fish intake, marine omega-3 fatty acids, and mortality in a cohortof postmenopausal women. Am J Epidemiol, 2004. 160(10): p. 1005-10.307. He, K., et al., Accumulated evidence on fish consumption and coronary heart disease mortality: ameta-analysis of cohort studies. Circulation, 2004. 109(22): p. 2705-11.308. Jarvinen, R., et al., Intake of fish and long-chain n-3 fatty acids and the risk of coronary heartmortality in men and women. Br J Nutr, 2006. 95(4): p. 824-9.309. Kaushik, S., et al., Frequency of fish consumption, retinal microvascular signs and vascularmortality. Microcirculation, 2008. 15(1): p. 27-36.DRAFT <strong>Australian</strong> <strong>Dietary</strong> <strong>Guidelines</strong>- December 2011 231
310. Konig, A., et al., A quantitative analysis of fish consumption and coronary heart disease mortality.Am J Prev Med, 2005. 29(4): p. 335-46.311. Nakamura, Y., et al., Association between fish consumption and all-cause and cause-specificmortality in Japan: NIPPON DATA80, 1980-99. Am J Med, 2005. 118(3): p. 239-245.312. Ness, A., et al., Diet in childhood and adult cardiovascular and all cause mortality: the Boyd Orrcohort. Heart, 2005. 91(7): p. 894.313. Streppel, M.T., et al., Long-term fish consumption and n-3 fatty acid intake in relation to (sudden)coronary heart disease death: the Zutphen study. Eur Heart J, 2008. 29(16): p. 2024-30.314. Bouzan, C., et al., A quantitative analysis of fish consumption and stroke risk. Am J Prev Med,2005. 29(4): p. 347-52.315. Ding, E.L. and D. Mozaffarian, Optimal dietary habits for the prevention of stroke. SeminNeurol, 2006. 26(1): p. 11-23.316. Gochfeld, M. and J. Burger, Good fish/bad fish: a composite benefit-risk by dose curve.Neurotoxicology, 2005. 26(4): p. 511-20.317. Barberger-Gateau, P., et al., <strong>Dietary</strong> patterns and risk of dementia: the three-city cohort study.Neurology, 2007. 69(20): p. 1921-30.318. Huang, T., et al., Benefits of fatty fish on dementia risk are stronger for those without APOE 4.Neurology, 2005. 65(9): p. 1409.319. Kalmijn, S., et al., <strong>Dietary</strong> intake of fatty acids and fish in relation to cognitive performance atmiddle age. Neurology, 2004. 62(2): p. 275.320. Morris, M.C., et al., Fish consumption and cognitive decline with age in a large community study.Arch Neurol, 2005. 62(12): p. 1849-53.321. van Gelder, B.M., et al., Fish consumption, n-3 fatty acids, and subsequent 5-y cognitive decline inelderly men: the Zutphen Elderly Study. Am J Clin Nutr, 2007. 85(4): p. 1142-7.322. Weih, M., J. Wiltfang, and J. Kornhuber, Non-pharmacologic prevention of Alzheimer's disease:nutritional and life-style risk factors. J Neural Transm, 2007. 114(9): p. 1187-97.323. Larrieu, S., et al., Nutritional factors and risk of incident dementia in the PAQUID longitudinalcohort. Journal of Nutrition, <strong>Health</strong> & Aging, 2004. 8(3): p. 150-154.DRAFT <strong>Australian</strong> <strong>Dietary</strong> <strong>Guidelines</strong>- December 2011 232
324. Maclean, C.H., et al., Effects of omega-3 fatty acids on cognitive function with aging, dementia,and neurological diseases. Evidence Report: Technology Assessment (Summary), 2005(114):p. 1-3.325. Schiepers, O.J., et al., Plasma phospholipid fatty acid status and depressive symptoms: associationonly present in the clinical range. J Affect Disord, 2009. 118(1-3): p. 209-14.326. Sontrop, J. and M.K. Campbell, Omega-3 polyunsaturated fatty acids and depression: a review ofthe evidence and a methodological critique. Prev Med, 2006. 42(1): p. 4-13.327. Sanchez-Villegas, A., et al., Long chain omega-3 fatty acids intake, fish consumption and mentaldisorders in the SUN cohort study. European journal of nutrition, 2007. 46(6): p. 337-46.328. Colangelo, L.A., et al., Higher dietary intake of long-chain omega-3 polyunsaturated fatty acids isinversely associated with depressive symptoms in women. Nutrition, 2009. 25(10): p. 1011-9.329. Kyrozis, A., et al., <strong>Dietary</strong> lipids and geriatric depression scale score among elders: The EPIC-Greece cohort. J Psychiatr Res, 2009. 43(8): p. 763-769.330. Chong, E.W., et al., <strong>Dietary</strong> omega-3 fatty acid and fish intake in the primary prevention of agerelatedmacular degeneration: a systematic review and meta-analysis. Arch Ophthalmol, 2008.126(6): p. 826-33.331. Djousse, L., et al., Egg consumption and risk of type 2 diabetes in men and women. DiabetesCare, 2009. 32(2): p. 295-300.332. Sauvaget, C., et al., Intake of animal products and stroke mortality in the Hiroshima/NagasakiLife Span Study. Int J Epidemiol, 2003. 32(4): p. 536-43.333. Kramer Michael, S. and R. Kakuma, Maternal dietary antigen avoidance during pregnancy orlactation, or both, for preventing or treating atopic disease in the child. Cochrane Database SystRev, 2006(3).334. Chakrabarty, G., et al., The effect of ingestion of egg on serum lipid profile in healthy young freelivingsubjects. Indian J Physiol Pharmacol, 2002. 46(4): p. 492-8.335. Chakrabarty, G., et al., The effect of ingestion of egg on the serum lipid profile of healthy youngIndians. Indian J Physiol Pharmacol, 2004. 48(3): p. 286-92.336. Djousse, L. and J.M. Gaziano, Egg consumption in relation to cardiovascular disease andmortality: the Physicians' <strong>Health</strong> Study. Am J Clin Nutr, 2008. 87(4): p. 964-9.DRAFT <strong>Australian</strong> <strong>Dietary</strong> <strong>Guidelines</strong>- December 2011 233
337. Gillingham, L.G., et al., The effects of consuming docosahexaenoic acid (DHA)-enriched eggs onserum lipids and fatty acid compositions in statin-treated hypercholesterolemic male patients. Foodresearch international, 2005. 38(10): p. 1117-1123.338. Goodrow, E.F., et al., Consumption of one egg per day increases serum lutein and zeaxanthinconcentrations in older adults without altering serum lipid and lipoprotein cholesterolconcentrations. J Nutr, 2006. 136(10): p. 2519.339. Harman, N.L., A.R. Leeds, and B.A. Griffin, Increased dietary cholesterol does not increaseplasma low density lipoprotein when accompanied by an energy-restricted diet and weight loss.European journal of nutrition, 2008. 47(6): p. 287-293.340. Katz, D.L., et al., Egg consumption and endothelial function: a randomized controlled crossovertrial. Int J Cardiol, 2005. 99(1): p. 65-70.341. Lee, J.Y., et al., Consumption of omega-3 fatty acid-enriched eggs and serum lipids in humans.Journal of nutraceuticals, functional & medical foods, 2003. 4(1): p. 3-13.342. Maki, K.C., et al., Lipid responses in mildly hypertriglyceridemic men and women to consumptionof docosahexaenoic acid-enriched eggs. Int J Vitam Nutr Res, 2003. 73(5): p. 357-68.343. Makrides, M., et al., Nutritional effect of including egg yolk in the weaning diet of breast-fed andformula-fed infants: a randomized controlled trial. Am J Clin Nutr, 2002. 75(6): p. 1084-92.344. Nakamura, Y., et al., Egg consumption, serum total cholesterol concentrations and coronary heartdisease incidence: Japan Public <strong>Health</strong> Center-based prospective study. Br J Nutr, 2006. 96(5): p.921-8.345. Nakamura, Y., et al., Egg consumption, serum cholesterol, and cause-specific and all-causemortality: the National Integrated Project for Prospective Observation of Non-communicableDisease and Its Trends in the Aged, 1980 (NIPPON DATA80). Am J Clin Nutr, 2004. 80(1): p.58.346. Ohman, M., et al., Biochemical effects of consumption of eggs containing omega-3polyunsaturated fatty acids. Ups J Med Sci, 2008. 113(3): p. 315-23.347. Rose, E.L. and B.J. Holub, Effects of a liquid egg product containing fish oil on selectedcardiovascular disease risk factors: A randomized crossover trial. Food research international,2006. 39(8): p. 910-916.348. Sindelar, C.A., et al., Serum lipids of physically active adults consuming omega-3 fatty acidenrichedeggs or conventional eggs. Nutr Res, 2004. 24(9): p. 731-739.DRAFT <strong>Australian</strong> <strong>Dietary</strong> <strong>Guidelines</strong>- December 2011 234
349. Vander Wal, J.S., et al., Egg breakfast enhances weight loss. Int J Obes (Lond), 2008. 32(10):p. 1545-51.350. Vislocky, L.M., et al., Habitual consumption of eggs does not alter the beneficial effects ofendurance training on plasma lipids and lipoprotein metabolism in untrained men and women.The Journal of Nutritional Biochemistry, 2009. 20(1): p. 26-34.351. Wenzel, A.J., et al., A 12-wk egg intervention increases serum zeaxanthin and macular pigmentoptical density in women. J Nutr, 2006. 136(10): p. 2568-73.352. Alper, C.M. and R.D. Mattes, Peanut consumption improves indices of cardiovascular disease riskin healthy adults. J Am Coll Nutr, 2003. 22(2): p. 133-41.353. Hyson, D.A., B.O. Schneeman, and P.A. Davis, Almonds and almond oil have similar effects onplasma lipids and LDL oxidation in healthy men and women. J Nutr, 2002. 132(4): p. 703.354. Kocyigit, A., A.A. Koylu, and H. Keles, Effects of pistachio nuts consumption on plasma lipidprofile and oxidative status in healthy volunteers. Nutr Metab Cardiovasc Dis, 2006. 16(3): p.202-209.355. Sabate, J., et al., Serum lipid response to the graduated enrichment of a Step I diet with almonds:a randomized feeding trial. Am J Clin Nutr, 2003. 77(6): p. 1379-84.356. Spaccarotella, K.J., et al., The effect of walnut intake on factors related to prostate and vascularhealth in older men. Nutr J, 2008. 7: p. 13.357. Fraser, G.E., et al., Effect on body weight of a free 76 kilojoule (320 calorie) daily supplement ofalmonds for six months. J Am Coll Nutr, 2002. 21(3): p. 275.358. Sabate, J., Nut consumption and change in weight: the weight of the evidence. Br J Nutr, 2007.98(3): p. 456-7.359. Kuhnle, G.G.C., et al., Diet-induced endogenous formation of nitroso compounds in the GI tract.Free Radical Biology and Medicine, 2007. 43(7): p. 1040-1047.360. Ma, R.W. and K. Chapman, A systematic review of the effect of diet in prostate cancerprevention and treatment. J Hum Nutr Diet, 2009. 22(3): p. 187-99; quiz 200-2.361. Sofi, F., et al., Adherence to Mediterranean diet and health status: meta-analysis. Br Med J, 2008.337: p. a1344.362. UK Royal College of Obstericians and Gynaecologists, Nutrition in pregnancy (SAC opinionpaper 18), 2010.DRAFT <strong>Australian</strong> <strong>Dietary</strong> <strong>Guidelines</strong>- December 2011 235
363. Ros, E., L.C. Tapsell, and J. Sabaté, Nuts and berries for heart health. Curr Atheroscler Rep,2010: p. 1-10.364. Segura, R., et al., Other relevant components of nuts: phytosterols, folate and minerals. Br J Nutr,2006. 96(Suppl 2): p. S36-44.365. Ziemke, F. and C.S. Mantzoros, Adiponectin in insulin resistance: lessons from translationalresearch. Am J Clin Nutr, 2010. 91(1): p. 258S-261S.366. Mattes, R.D. and M.L. Dreher, Nuts and healthy body weight maintenance mechanisms. AsiaPac J Clin Nutr, 2010. 19(1): p. 137-41.367. Tapsell, L., et al., The effect of a calorie controlled diet containing walnuts on substrate oxidationduring 8-hours in a room calorimeter. J Am Coll Nutr, 2009. 28(5): p. 611.368. Commonwealth Department of Agriculture Fisheries and <strong>For</strong>estry, Australia’s agriculture,fisheries and forestry at a glance 2010, 2010, Commonwealth Department of Agriculture,Fisheries and <strong>For</strong>estry: Canberra.369. Greer, F.R., S.H. Sicherer, and A. Burks, Effects of early nutritional interventions on thedevelopment of atopic disease in infants and children: the role of maternal dietary restriction,breastfeeding, timing of introduction of complementary foods, and hydrolyzed formulas. Pediatrics,2008. 121(1): p. 183.370. Host, A., et al., <strong>Dietary</strong> prevention of allergic diseases in infants and small children. PediatrAllergy Immunol, 2008. 19(1): p. 1-4.371. Sicherer, S.H. and A.W. Burks, Maternal and infant diets for prevention of allergic diseases:understanding menu changes in 2008. J Allergy Clin Immunol, 2008. 122(1): p. 29-33.372. Prescott, S.L. and M.L. Tang, The Australasian Society of Clinical Immunology and Allergy positionstatement: Summary of allergy prevention in children. Med J Aust, 2005. 182(9): p. 464-7.373. Food Authority NSW. Sydney Harbour seafood and dioxins. 2010 [cited 2011 29 March];Available from: http://www.foodauthority.nsw.gov.au/consumers/keeping-food-safe/specialcare-foods/sydney-harbour-seafood/.374. Food Standards Australia New Zealand, Dioxins in food: dietary exposure assessment and riskcharacterisation, in Technical Report Series No. 272004: Canberra.375. Food and Agriculture Organization of the United Nations and the World <strong>Health</strong>Organization, Joint FAO/WHO Expert Consultation on the risks and benefits of fish consumption,2010, Food and Agriculture Organization of the United Nations and the World <strong>Health</strong>Organization: Rome.DRAFT <strong>Australian</strong> <strong>Dietary</strong> <strong>Guidelines</strong>- December 2011 236
376. Elwood, P.C., et al., The survival advantage of milk and dairy consumption: an overview ofevidence from cohort studies of vascular diseases, diabetes and cancer. J Am Coll Nutr, 2008.27(6): p. 723S-34S.377. He, K., et al., <strong>Dietary</strong> fat intake and risk of stroke in male US healthcare professionals: 14 yearprospective cohort study. Br Med J, 2003. 327(7418): p. 777-82.378. Alonso, A., et al., Low-fat dairy consumption and reduced risk of hypertension: the SeguimientoUniversidad de Navarra (SUN) cohort. Am J Clin Nutr, 2005. 82(5): p. 972-9.379. Engberink, M.F., et al., Dairy intake, blood pressure, and incident hypertension in a general Dutchpopulation. J Nutr, 2009. 139(3): p. 582-7.380. Toledo, E., et al., Low-fat dairy products and blood pressure: follow-up of 2290 older persons athigh cardiovascular risk participating in the PREDIMED study. Br J Nutr, 2009. 101(01): p. 59-67.381. Wang, L., et al., <strong>Dietary</strong> intake of dairy products, calcium, and vitamin D and the risk ofhypertension in middle-aged and older women. Hypertension, 2008. 51(4): p. 1073.382. Pereira, M.A., et al., Dairy consumption, obesity, and the insulin resistance syndrome in youngadults: the CARDIA Study. J Am Med Assoc, 2002. 287(16): p. 2081-9.383. Lutsey, P.L., L.M. Steffen, and J. Stevens, <strong>Dietary</strong> intake and the development of the metabolicsyndrome: the Atherosclerosis Risk in Communities study. Circulation, 2008. 117(6): p. 754-61.384. Pittas, A.G., et al., The role of vitamin D and calcium in type 2 diabetes. A systematic review andmeta-analysis. J Clin Endocrinol Metab, 2007. 92(6): p. 2017-29.385. Barr, S.I., Increased dairy product or calcium intake: is body weight or composition affected inhumans? J Nutr, 2003. 133(1): p. 245S-248S.386. Lanou, A.J. and N.D. Barnard, Dairy and weight loss hypothesis: an evaluation of the clinicaltrials. Nutr Rev, 2008. 66(5): p. 272-279.387. Rajpathak, S.N., et al., Calcium and dairy intakes in relation to long-term weight gain in US men.Am J Clin Nutr, 2006. 83(3): p. 559-66.388. Rosell, M., N.N. Hakansson, and A. Wolk, Association between dairy food consumption andweight change over 9 y in 19,352 perimenopausal women. Am J Clin Nutr, 2006. 84(6): p.1481-8.389. Wagner, G., et al., Effects of various forms of calcium on body weight and bone turnover markersin women participating in a weight loss program. J Am Coll Nutr, 2007. 26(5): p. 456-61.DRAFT <strong>Australian</strong> <strong>Dietary</strong> <strong>Guidelines</strong>- December 2011 237
390. Berkey, C.S., et al., Sugar-added beverages and adolescent weight change. Obes Res, 2004.12(5): p. 778-88.391. Berkey, C.S., et al., Milk, dairy fat, dietary calcium, and weight gain: a longitudinal study ofadolescents. Arch Pediatr Adolesc Med, 2005. 159(6): p. 543-50.392. Johnson, L., et al., Is sugar-sweetened beverage consumption associated with increased fatness inchildren? Nutrition, 2007. 23(7-8): p. 557-563.393. Newby, P.K., et al., Beverage consumption is not associated with changes in weight and bodymass index among low-income preschool children in North Dakota. J Am Diet Assoc, 2004.104(7): p. 1086-1094.394. Striegel-Moore, R.H., et al., Correlates of beverage intake in adolescent girls: the National Heart,Lung, and Blood Institute Growth and <strong>Health</strong> Study. J Pediatr, 2006. 148(2): p. 183-7.395. Cho, E., et al., Dairy foods, calcium, and colorectal cancer: a pooled analysis of 10 cohort studies.J Natl Cancer Inst, 2004. 96(13): p. 1015-22.396. Huncharek, M., J. Muscat, and B. Kupelnick, Colorectal cancer risk and dietary intake ofcalcium, vitamin D, and dairy products: a meta-analysis of 26,335 cases from 60 observationalstudies. Nutr Cancer, 2009. 61(1): p. 47-69.397. Sellers, T.A., et al., Unpasteurized milk consumption and subsequent risk of cancer. CancerCauses Control, 2008. 19(8): p. 805-11.398. Lee, J.E., et al., Intakes of coffee, tea, milk, soda and juice and renal cell cancer in a pooledanalysis of 13 prospective studies. Int J Cancer, 2007. 121(10): p. 2246-53.399. Alvarez-Leon, E.E., B. Roman-Vinas, and L. Serra-Majem, Dairy products and health: a reviewof the epidemiological evidence. Br J Nutr, 2006. 96(Suppl 1): p. S94-9.400. Missmer, S.A., et al., Meat and dairy food consumption and breast cancer: a pooled analysis ofcohort studies. Int J Epidemiol, 2002. 31(1): p. 78-85.401. Bandera, E.V., et al., Consumption of animal foods and endometrial cancer risk: a systematicliterature review and meta-analysis. Cancer Causes Control, 2007. 18(9): p. 967-88.402. Bonjour, J.P., et al., Inhibition of bone turnover by milk intake in postmenopausal women. Br JNutr, 2008. 100(4): p. 866-74.403. Hartman, J.W., et al., Consumption of fat-free fluid milk after resistance exercise promotesgreater lean mass accretion than does consumption of soy or carbohydrate in young, novice, maleweightlifters. Am J Clin Nutr, 2007. 86(2): p. 373.DRAFT <strong>Australian</strong> <strong>Dietary</strong> <strong>Guidelines</strong>- December 2011 238
404. Javaid, M.K., et al., Maternal and seasonal predictors of change in calcaneal quantitativeultrasound during pregnancy. J Clin Endocrinol Metab, 2005. 90(9): p. 5182-7.405. Lanou, A.J., S.E. Berkow, and N.D. Barnard, Calcium, dairy products, and bone health inchildren and young adults: a reevaluation of the evidence. Pediatrics, 2005. 115(3): p. 736-43.406. Teegarden, D., et al., <strong>Dietary</strong> calcium intake protects women consuming oral contraceptives fromspine and hip bone loss. J Clin Endocrinol Metab, 2005. 90(9): p. 5127-33.407. Volek, J.S., et al., Increasing fluid milk favorably affects bone mineral density responses toresistance training in adolescent boys. J Am Diet Assoc, 2003. 103(10): p. 1353-6.408. Feskanich, D., W.C. Willett, and G.A. Colditz, Calcium, vitamin D, milk consumption, and hipfractures: a prospective study among postmenopausal women. Am J Clin Nutr, 2003. 77(2): p.504.409. Kanis, J.A., et al., A meta-analysis of milk intake and fracture risk: low utility for case finding.Osteoporos Int, 2005. 16(7): p. 799-804.410. Mensink, R.P., et al., Effects of dietary fatty acids and carbohydrates on the ratio of serum total toHDL cholesterol and on serum lipids and apolipoproteins: a meta-analysis of 60 controlled trials.Am J Clin Nutr, 2003. 77(5): p. 1146-55.411. Temme, E., R.P. Mensink, and G. Hornstra, Comparison of the effects of diets enriched inlauric, palmitic, or oleic acids on serum lipids and lipoproteins in healthy women and men. Am JClin Nutr, 1996. 63(6): p. 897.412. Griffith, L.E., et al., The influence of dietary and nondietary calcium supplementation on bloodpressure: an updated metaanalysis of randomized controlled trials. Am J Hypertens, 1999. 12(1Pt 1): p. 84-92.413. Clare, D.A. and H.E. Swaisgood, Bioactive milk peptides: a prospectus. J Dairy Sci, 2000.83(6): p. 1187-95.414. Bolland, M.J., et al., Effect of calcium supplements on risk of myocardial infarction andcardiovascular events: meta-analysis. Br Med J, 2010. 341: p. c3691.415. Bolland, M.J., et al., Calcium supplements with or without vitamin D and risk of cardiovascularevents: reanalysis of the Women's <strong>Health</strong> Initiative limited access dataset and meta-analysis. BMJ,2011. 342: p. d2040.416. Green, J.H., C. Booth, and R. Bunning, Postprandial metabolic responses to milk enriched withmilk calcium are different from responses to milk enriched with calcium carbonate. Asia Pac J ClinNutr, 2003. 12(1): p. 109-19.DRAFT <strong>Australian</strong> <strong>Dietary</strong> <strong>Guidelines</strong>- December 2011 239
417. Resnick, L., et al., <strong>Dietary</strong> calcium modifies the pressor effects of dietary salt intake in essentialhypertension. J Hypertens, 1986. 4(suppl 6): p. S679-S681.418. Kalkwarf, H.J., J.C. Khoury, and B.P. Lanphear, Milk intake during childhood and adolescence,adult bone density, and osteoporotic fractures in US women. Am J Clin Nutr, 2003. 77(1): p.257-65.419. Albala, C., et al., Effects of replacing the habitual consumption of sugar-sweetened beverages withmilk in Chilean children. Am J Clin Nutr, 2008. 88(3): p. 605-611.420. Einarson, A., et al., Food-borne illnesses during pregnancy. Can Fam Physician, 2010. 56(9): p.869-70.421. Brand, J.C., et al., Lactose malabsorption in <strong>Australian</strong> Aboriginal children. Am J Clin Nutr, 1985.41(3): p. 620-2.422. Buttenshaw, R., et al. Lactose malabsorption and its temporal stability in Aboriginal children. inProc Nutr Soc Aust. 1990.423. Shaukat, A., et al., Systematic review: effective management strategies for lactose intolerance.Ann Intern Med, 2010. 152(12): p. 797-803.424. Pfeil, L.A., P.R. Katz, and P.J. Davis, Water metabolism, in Geriatric nutrition: a comprehensiveview, J.E. Morley, Z. Glick, and L.Z. Rubenstein, Editors. 1995, Raven Press: New York.425. Cheung, S.S. and T.M. McLellan, Influence of hydration status and fluid replacement on heattolerance while wearing NBC protective clothing. European journal of applied physiology andoccupational physiology, 1998. 77(1): p. 139-148.426. Hubbard, R.W. and L.E. Armstrong, The heat illnesses: biochemical, ultrastructural, and fluidelectrolyteconsiderations, in Human performance physiology and environmental medicine atterrestrial extremes, K.B. Pandolf, M.N. Sawka, and R.R. Gonzalez, Editors. 1988,Indianapolis: Benchmark Press, Inc. p. 305-360.427. Gardner, E., C. Ruxton, and A. Leeds, Black tea–helpful or harmful? A review of the evidence.Eur J Clin Nutr, 2006. 61(1): p. 3-18.428. Greenberg, J.A., G. Chow, and R.C. Ziegelstein, Caffeinated coffee consumption,cardiovascular disease, and heart valve disease in the elderly (from the Framingham Study). Am JCardiol, 2008. 102(11): p. 1502-8.429. Kuriyama, S., The relation between green tea consumption and cardiovascular disease asevidenced by epidemiological studies. J Nutr, 2008. 138(8): p. 1548S.DRAFT <strong>Australian</strong> <strong>Dietary</strong> <strong>Guidelines</strong>- December 2011 240
430. Lagiou, P., et al., Intake of specific flavonoid classes and coronary heart disease--a case-controlstudy in Greece. Eur J Clin Nutr, 2004. 58(12): p. 1643-8.431. Sesso, H.D., et al., Lack of association between tea and cardiovascular disease in college alumni.Int J Epidemiol, 2003. 32(4): p. 527.432. Fraser, M.L., G.S. Mok, and A.H. Lee, Green tea and stroke prevention: emerging evidence.Complement Ther Med, 2007. 15(1): p. 46-53.433. Okamoto, K., Habitual green tea consumption and risk of an aneurysmal rupture subarachnoidhemorrhage: a case-control study in Nagoya, Japan. Eur J Epidemiol, 2006. 21(5): p. 367-71.434. Tanabe, N., et al., Consumption of green and roasted teas and the risk of stroke incidence: resultsfrom the Tokamachi-Nakasato cohort study in Japan. Int J Epidemiol, 2008. 37(5): p. 1030-40.435. Arab, L., W. Liu, and D. Elashoff, Green and black tea consumption and risk of stroke: a metaanalysis.Stroke, 2009. 40(5): p. 1786-92.436. Hammar, N., et al., Association of boiled and filtered coffee with incidence of first nonfatalmyocardial infarction: the SHEEP and the VHEEP study. J Intern Med, 2003. 253(6): p. 653-9.437. Klatsky, A.L., et al., The confounded relation of coffee drinking to coronary artery disease. Am JCardiol, 2008. 101(6): p. 825-7.438. Rosner, S.A., et al., Coffee consumption and risk of myocardial infarction among older Swedishwomen. Am J Epidemiol, 2007. 165(3): p. 288.439. Sofi, F., et al., Coffee consumption and risk of coronary heart disease: a meta-analysis. NutrMetab Cardiovasc Dis, 2007. 17(3): p. 209-23.440. Greenberg, J.A., et al., Coffee, tea and diabetes: the role of weight loss and caffeine. Int J Obes(Lond), 2005. 29(9): p. 1121-9.441. Hamer, M., et al., Prospective study of coffee and tea consumption in relation to risk of type 2diabetes mellitus among men and women: The Whitehall II study. Br J Nutr, 2008. 100(05): p.1046-1053.442. Hu, G., et al., Joint association of coffee consumption and other factors to the risk of type 2diabetes: a prospective study in Finland. Int J Obes (Lond), 2006. 30(12): p. 1742-9.443. Odegaard, A.O., et al., Coffee, tea, and incident type 2 diabetes: the Singapore Chinese <strong>Health</strong>Study. Am J Clin Nutr, 2008. 88(4): p. 979-85.DRAFT <strong>Australian</strong> <strong>Dietary</strong> <strong>Guidelines</strong>- December 2011 241
444. Paynter, N.P., et al., Coffee and sweetened beverage consumption and the risk of type 2 diabetesmellitus: the atherosclerosis risk in communities study. Am J Epidemiol, 2006. 164(11): p. 1075-84.445. Smith, B., et al., Does coffee consumption reduce the risk of type 2 diabetes in individuals withimpaired glucose? Diabetes Care, 2006. 29(11): p. 2385.446. van Dam, R.M. and F.B. Hu, Coffee consumption and risk of type 2 diabetes: a systematic review.J Am Med Assoc, 2005. 294(1): p. 97-104.447. van Dam, R.M., et al., Coffee, caffeine, and risk of type 2 diabetes: a prospective cohort study inyounger and middle-aged U.S. women. Diabetes Care, 2006. 29(2): p. 398-403.448. Dubois, L., et al., Regular sugar-sweetened beverage consumption between meals increases riskof overweight among preschool-aged children. J Am Diet Assoc, 2007. 107(6): p. 924-934.449. Faith, M.S., et al., Fruit juice intake predicts increased adiposity gain in children from low-incomefamilies: weight status-by-environment interaction. Pediatrics, 2006. 118(5): p. 2066-75.450. <strong>For</strong>shee, R.A., P.A. Anderson, and M.L. Storey, Sugar-sweetened beverages and body massindex in children and adolescents: a meta-analysis. Am J Clin Nutr, 2008. 87(6): p. 1662-1671.451. Gibson, S., Sugar-sweetened soft drinks and obesity: a systematic review of the evidence fromobservational studies and interventions. Nutr Res Rev, 2008. 21(2): p. 134-147.452. Malik, V.S., M.B. Schulze, and F.B. Hu, Intake of sugar-sweetened beverages and weight gain: asystematic review. Am J Clin Nutr, 2006. 84(2): p. 274-288.453. Phillips, S.M., et al., Energy-dense snack food intake in adolescence: longitudinal relationship toweight and fatness. Obes Res, 2004. 12(3): p. 461-72.454. Sichieri, R., et al., School randomised trial on prevention of excessive weight gain by discouragingstudents from drinking sodas. Public <strong>Health</strong> Nutr, 2009. 12(2): p. 197-202.455. Stookey, J.D., et al., Replacing sweetened caloric beverages with drinking water is associated withlower energy intake. Obesity (Silver Spring), 2007. 15(12): p. 3013-22.456. Tam, C.S., et al., Soft drink consumption and excess weight gain in <strong>Australian</strong> school students:results from the Nepean study. Int J Obesity, 2006. 30(7): p. 1091-3.457. Taylor, R.W., et al., APPLE Project: 2-y findings of a community-based obesity prevention programin primary school age children. Am J Clin Nutr, 2007. 86(3): p. 735-42.DRAFT <strong>Australian</strong> <strong>Dietary</strong> <strong>Guidelines</strong>- December 2011 242
458. Vartanian, L.R., M.B. Schwartz, and K.D. Brownell, Effects of soft drink consumption onnutrition and health: a systematic review and meta-analysis. Am J Public <strong>Health</strong>, 2007. 97(4): p.667-75.459. Wolff, E. and M.L. Dansinger, Soft drinks and weight gain: how strong is the link? Medscape JMed, 2008. 10(8): p. 189.460. Pelucchi, C. and C. La Vecchia, Alcohol, coffee, and bladder cancer risk: a review ofepidemiological studies. Eur J Cancer Prev, 2009. 18(1): p. 62-8.461. Villanueva, C.M., et al., Total and specific fluid consumption as determinants of bladder cancerrisk. Int J Cancer, 2006. 118(8): p. 2040-2047.462. Zeegers, M.P.A., et al., The association between smoking, beverage consumption, diet andbladder cancer: a systematic literature review. World J Urol, 2004. 21(6): p. 392-401.463. Tang N, W.Y., Ma J, Mang B & Yu R., Coffee consumption and risk of lung cancer: A metaanalysis.Lung Cancer, 2009. (In Press at time of review).464. Tang, N., et al., Coffee consumption and risk of breast cancer: a metaanalysis. Am J ObstetGynecol, 2009. 200(3): p. 290 e1-9.465. Michels, K.B., et al., Coffee, tea, and caffeine consumption and incidence of colon and rectalcancer. J Natl Cancer Inst, 2005. 97(4): p. 282-92.466. Lee, K.J., et al., Coffee consumption and risk of colorectal cancer in a population-basedprospective cohort of Japanese men and women. Int J Cancer, 2007. 121(6): p. 1312-8.467. Tavani, A. and C. La Vecchia, Coffee, decaffeinated coffee, tea and cancer of the colon andrectum: a review of epidemiological studies, 1990-2003. Cancer Causes Control, 2004. 15(8):p. 743-57.468. Steevens, J., et al., Tea and coffee drinking and ovarian cancer risk: results from the NetherlandsCohort Study and a meta-analysis. Br J Cancer, 2007. 97(9): p. 1291-4.469. Song, Y.J., et al., Coffee, tea, colas, and risk of epithelial ovarian cancer. Cancer EpidemiolBiomarkers Prev, 2008. 17(3): p. 712-6.470. Silvera, S.A., et al., Intake of coffee and tea and risk of ovarian cancer: a prospective cohortstudy. Nutr Cancer, 2007. 58(1): p. 22-7.471. Bravi, F., et al., Coffee drinking and endometrial cancer risk: a metaanalysis of observationalstudies. Am J Obstet Gynecol, 2009. 200(2): p. 130-135.DRAFT <strong>Australian</strong> <strong>Dietary</strong> <strong>Guidelines</strong>- December 2011 243
472. Larsson, S.C., E. Giovannucci, and A. Wolk, Coffee consumption and stomach cancer risk in acohort of Swedish women. Int J Cancer, 2006. 119(9): p. 2186-9.473. Bravi, F., et al., Coffee drinking and hepatocellular carcinoma risk: a meta-analysis. Hepatology,2007. 46(2): p. 430-5.474. Su, L.J. and L. Arab, Tea consumption and the reduced risk of colon cancer -- results from anational prospective cohort study. Public <strong>Health</strong> Nutr, 2002. 5(3): p. 419-25.475. Dora, I., et al., Black tea consumption and risk of rectal cancer in Moscow population. AnnEpidemiol, 2003. 13(6): p. 405-11.476. Kristensen, M., et al., Short-term effects on bone turnover of replacing milk with cola beverages:a 10-day interventional study in young men. Osteoporos Int, 2005. 16(12): p. 1803-8.477. Libuda, L., et al., Association between long-term consumption of soft drinks and variables of bonemodeling and remodeling in a sample of healthy German children and adolescents. Am J ClinNutr, 2008. 88(6): p. 1670.478. Manias, K., D. McCabe, and N. Bishop, Fractures and recurrent fractures in children; varyingeffects of environmental factors as well as bone size and mass. Bone, 2006. 39(3): p. 652-7.479. Tucker, K.L., et al., Colas, but not other carbonated beverages, are associated with low bonemineral density in older women: The Framingham Osteoporosis Study. Am J Clin Nutr, 2006.84(4): p. 936.480. Ahokas, J.T., et al., Review of water fluoridation and fluoride intake from discretionary fluoridesupplements, 1999, National <strong>Health</strong> and Medical Research Council: Melbourne.481. Young, W.G., Tooth wear: diet analysis and advice. Int Dent J, 2005. 55(2): p. 68-72.482. Kazoullis, S., et al., Common dental conditions associated with dental erosion in schoolchildren inAustralia. Pediatr Dent, 2007. 29(1): p. 33-9.483. American Academy of Pediatrics, Soft drinks in schools. Pediatrics, 2004. 113(1 Pt 1): p. 152-4.484. Keijzers, G.B., et al., Caffeine can decrease insulin sensitivity in humans. Diabetes Care, 2002.25(2): p. 364.485. Yoshioka, K., et al., Coffee consumption and risk of type 2 diabetes mellitus. Lancet, 2003.361(9358): p. 703.DRAFT <strong>Australian</strong> <strong>Dietary</strong> <strong>Guidelines</strong>- December 2011 244
486. Lopez-Ridaura, R., et al., Magnesium intake and risk of type 2 diabetes in men and women.Diabetes Care, 2004. 27(1): p. 134.487. Curin, Y. and R. Andriantsitohaina, Polyphenols as potential therapeutical agents againstcardiovascular diseases. Pharmacological reports, 2005. 57: p. 97.488. Ratnayake, W.M. and C. Galli, Fat and fatty acid terminology, methods of analysis and fatdigestion and metabolism: a background review paper. Ann Nutr Metab, 2009. 55(1-3): p. 8-43.489. Melanson, E.L., A. Astrup, and W.T. Donahoo, The relationship between dietary fat and fattyacid intake and body weight, diabetes, and the metabolic syndrome. Ann Nutr Metab, 2009.55(1-3): p. 229-243.490. Mozaffarian, D., R. Micha, and S. Wallace, Effects on coronary heart disease of increasingpolyunsaturated fat in place of saturated fat: a systematic review and meta-analysis of randomizedcontrolled trials. PLoS Med, 2010. 7(3): p. e1000252.491. Balk, E.M., et al., Effects of omega-3 fatty acids on coronary restenosis, intima-media thickness,and exercise tolerance: A systematic review. Atherosclerosis, 2006. 184(2): p. 237-246.492. Balk, E.M., et al., Effects of omega-3 fatty acids on serum markers of cardiovascular disease risk:a systematic review. Atherosclerosis, 2006. 189(1): p. 19-30.493. Castro, I.A., L.P. Barroso, and P. Sinnecker, Functional foods for coronary heart disease riskreduction: a meta-analysis using a multivariate approach. Am J Clin Nutr, 2005. 82(1): p. 32-40.494. Eslick, G.D., et al., Benefits of fish oil supplementation in hyperlipidemia: a systematic review andmeta-analysis. Int J Cardiol, 2009. 136(1): p. 4-16.495. Hooper, L., et al., Omega 3 fatty acids for prevention and treatment of cardiovascular disease.Cochrane Database Syst Rev, 2004(4): p. CD003177.496. Lee, K.W. and G.Y.H. Lip, Effects of lifestyle on hemostasis, fibrinolysis, and platelet reactivity: asystematic review. Arch Intern Med, 2003. 163(19): p. 2368-2392.497. Studer, M., et al., Effect of different antilipidemic agents and diets on mortality: a systematicreview. Arch Intern Med, 2005. 165(7): p. 725.498. Wang, C., et al., n-3 fatty acids from fish or fish-oil supplements, but not alpha-linolenic acid,benefit cardiovascular disease outcomes in primary- and secondary-prevention studies: a systematicreview. Am J Clin Nutr, 2006. 84(1): p. 5-17.499. Wendland, E., et al., Effect of alpha linolenic acid on cardiovascular risk markers: a systematicreview. Heart, 2006. 92(2): p. 166-169.DRAFT <strong>Australian</strong> <strong>Dietary</strong> <strong>Guidelines</strong>- December 2011 245
500. Food and Agriculture Organization of the United Nations and the World <strong>Health</strong>Organization, Fats and fatty acids in human nutrition. Report of an expert consultation, 2010,Food and Agriculture Organization of the United Nations and the World <strong>Health</strong>Organization: Rome.501. Ulbak, J., et al., Diet and blood pressure in 2.5-y-old Danish children. Am J Clin Nutr, 2004.79(6): p. 1095-1102.502. Schack-Nielsen, L., et al., Arterial stiffness in 10-year-old children: current and earlydeterminants. Br J Nutr, 2005. 94(6): p. 1004-1011.503. Sanders, T.A.B., et al., Influence of an algal triacylglycerol containing docosahexaenoic acid(22:6n-3) and docosahentaenoic acid (22:5n-6) on cardiovascular risk factors in healthy men andwomen. Br J Nutr, 2006. 95(3): p. 525-531.504. Raitakari, O.T., et al., Endothelial function in healthy 11-year-old children after dietaryintervention with onset in infancy: the Special Turku Coronary Risk Factor Intervention Project forchildren (STRIP). Circulation, 2005. 112(24): p. 3786-3794.505. Psaltopoulou, T., et al., Olive oil, the Mediterranean diet, and arterial blood pressure: the GreekEuropean Prospective Investigation into Cancer and Nutrition (EPIC) study [corrected] [publishederratum appears in AM J CLIN NUTR 2005 May;81(5):1181]. Am J Clin Nutr, 2004. 80(4): p.1012-1018.506. Perona, J.S., et al., Plasma lipid modifications in elderly people after administration of two virginolive oils of the same variety (Olea europaea var. hojiblanca) with different triacylglycerolcomposition. Br J Nutr, 2003. 89(6): p. 819-26.507. Bondia-Pons, I., et al., Moderate consumption of olive oil by healthy European men reducessystolic blood pressure in non-Mediterranean participants. J Nutr, 2007. 137(1): p. 84-7.508. Alonso, A., et al., Olive oil consumption and reduced incidence of hypertension: the SUN study.Lipids, 2004. 39(12): p. 1233-8.509. Damsgaard, C.T., et al., Fish oil in combination with high or low intakes of linoleic acid lowersplasma triacylglycerols but does not affect other cardiovascular risk markers in healthy men. JNutr, 2008. 138(6): p. 1061-1066.510. Berry, S.E., et al., The solid fat content of stearic acid-rich fats determines their postprandialeffects. Am J Clin Nutr, 2007. 85(6): p. 1486-94.511. Eckel, R.H., et al., Carbohydrate balance predicts weight and fat gain in adults. Am J Clin Nutr,2006. 83(4): p. 803-808.DRAFT <strong>Australian</strong> <strong>Dietary</strong> <strong>Guidelines</strong>- December 2011 246
512. Kratz, M., et al., The impact of dietary fat composition on serum leptin concentrations in healthynonobese men and women. Journal of Clinical Endocrinology & Metabolism, 2002. 87(11): p.5008-14.513. Lovegrove, J.A., et al., Moderate fish-oil supplementation reverses low-platelet, long-chain n-3polyunsaturated fatty acid status and reduces plasma triacylglycerol concentrations in British Indo-Asians. Am J Clin Nutr, 2004. 79(6): p. 974-982.514. Nicholls, S.J., et al., Consumption of saturated fat impairs the anti-inflammatory properties ofhigh-density lipoproteins and endothelial function. J Am Coll Cardiol, 2006. 48(4): p. 715-720.515. Nosaka, N., et al., Effects of dietary medium-chain triacylglycerols on serum lipoproteins andbiochemical parameters in healthy men. Bioscience, Biotechnology & Biochemistry, 2002.66(8): p. 1713-8.516. Owen, B. and T.M.S. Wolever, Effect of fat on glycaemic responses in normal subjects: a doseresponsestudy. Nutr Res, 2003. 23(10): p. 1341-1347.517. Rueda-Clausen, C.F., et al., Olive, soybean and palm oils intake have a similar acute detrimentaleffect over the endothelial function in healthy young subjects. Nutr Metab Cardiovasc Dis, 2007.17(1): p. 50-57.518. Tahvonen, R.L., et al., Black currant seed oil and fish oil supplements differ in their effects onfatty acid profiles of plasma lipids, and concentrations of serum total and lipoprotein lipids, plasmaglucose and insulin. The Journal of Nutritional Biochemistry, 2005. 16(6): p. 353-359.519. Tholstrup, T., et al., Effects of butter high in ruminant trans and monounsaturated fatty acids onlipoproteins, incorporation of fatty acids into lipid classes, plasma C-reactive protein, oxidativestress, hemostatic variables, and insulin in healthy young men. Am J Clin Nutr, 2006. 83(2): p.237-243.520. MacLean, C.H., et al., Effects of omega-3 fatty acids on cancer risk: a systematic review. J AmMed Assoc, 2006. 295(4): p. 403-15.521. van de Rest, O., et al., Effect of fish-oil supplementation on mental well-being in older subjects: arandomized, double-blind, placebo-controlled trial. Am J Clin Nutr, 2008. 88(3): p. 706-13.522. Laitinen, M., et al., Fat intake at midlife and risk of dementia and Alzheimer's disease: apopulation-based study. Dementia and Geriatric Cognitive Disorders, 2006. 22(1): p. 99-107.523. Mamalakis, G., et al., Depression and serum adiponectin and adipose omega-3 and omega-6 fattyacids in adolescents. Pharmacology Biochemistry and Behavior, 2006. 85(2): p. 474-479.DRAFT <strong>Australian</strong> <strong>Dietary</strong> <strong>Guidelines</strong>- December 2011 247
524. Morris, M.C., et al., Consumption of fish and n-3 fatty acids and risk of incident Alzheimerdisease. Arch Neurol, 2003. 60(7): p. 940-946.525. Hiroi, M., et al., The combination of genetic variations in the PRDX3 gene and dietary fat intakecontribute to obesity risk. Obesity (Silver Spring), 2010.526. Fantuzzi, G., Adipose tissue, adipokines, and inflammation. J Allergy Clin Immunol, 2005.115(5): p. 911-919.527. Jain, S.S. and R.P. Bird, Elevated expression of tumor necrosis factor-alpha signaling molecules incolonic tumors of Zucker obese (fa/fa) rats. Int J Cancer, 2010. 127(9): p. 2042-50.528. Renehan, A.G., et al., Incident cancer burden attributable to excess body mass index in 30European countries. Int J Cancer, 2010. 126(3): p. 692-702.529. Alberti, K.G., et al., Harmonizing the metabolic syndrome: a joint interim statement of theInternational Diabetes Federation Task <strong>For</strong>ce on Epidemiology and Prevention; National Heart,Lung, and Blood Institute; American Heart Association; World Heart Federation; InternationalAtherosclerosis Society; and International Association for the Study of Obesity. Circulation, 2009.120(16): p. 1640-5.530. Baghurst K, <strong>Dietary</strong> fats, marbling and human health. <strong>Australian</strong> Journal of ExperimentalAgriculture, 2004. 44: p. 635-644.531. National Heart Foundation of Australia (National Blood Pressure and Vascular DiseaseAdvisory Committee), Guide to management of hypertension, 2008, National HeartFoundation of Australia.532. Sacks, F.M., et al., The effect of pravastatin on coronary events after myocardial infarction inpatients with average cholesterol levels. N Engl J Med, 1996. 335(14): p. 1001-9.533. Ramsden, C.E., et al., n-6 fatty acid-specific and mixed polyunsaturate dietary interventions havedifferent effects on CHD risk: a meta-analysis of randomised controlled trials. Br J Nutr, 2010.104(11): p. 1586-600.534. Brown, M.A., et al., <strong>Dietary</strong> fat and carbohydrate composition: Metabolic Disease. In, FatDetection: taste, texture and post ingestive effects, F.i.N. Montmayeur J-P and leCoutre, Editor2010, CRC Press Florida.535. Galli, C. and P.C. Calder, Effects of fat and fatty acid intake on inflammatory and immuneresponses: a critical review. Ann Nutr Metab, 2009. 55(1-3): p. 123-39.536. Crawford, M.A., R.P. Bazinet, and A.J. Sinclair, Fat intake and CNS functioning: ageing anddisease. Ann Nutr Metab, 2009. 55(1-3): p. 202-28.DRAFT <strong>Australian</strong> <strong>Dietary</strong> <strong>Guidelines</strong>- December 2011 248
537. Daniels, S.R. and F.R. Greer, Lipid screening and cardiovascular health in childhood. Pediatrics,2008. 122(1): p. 198-208.538. McGill, H.C., C.A. McMahan, and S.S. Gidding, Are pediatricians responsible for prevention ofadult cardiovascular disease? Nat Clin Pract Cardiovasc Med, 2009. 6(1): p. 10-1.539. Niinikoski, H., et al., Impact of repeated dietary counseling between infancy and 14 years of ageon dietary intakes and serum lipids and lipoproteins: the STRIP study. Circulation, 2007. 116(9):p. 1032.540. Clarke, R., et al., Cholesterol fractions and apolipoproteins as risk factors for heart diseasemortality in older men. Arch Intern Med, 2007. 167(13): p. 1373-8.541. U.S. Department of <strong>Health</strong>, Education, and Welfare, <strong>Health</strong>y People - The Surgeon General'sreport on health promotion and disease prevention 1979, Washington D.C.: U.S. Departmentof <strong>Health</strong>, Education and Welfare.542. Chen, J., et al., Metabolic syndrome and salt sensitivity of blood pressure in non-diabetic people inChina: a dietary intervention study.[see comment]. Lancet, 2009. 373(9666): p. 829-35.543. Charlton, K.E., et al., A food-based dietary strategy lowers blood pressure in a low socio-economicsetting: a randomised study in South Africa. Public <strong>Health</strong> Nutr, 2008. 11(12): p. 1397-406.544. China Salt Substitute Study Collaborative, G., Salt substitution: a low-cost strategy for bloodpressure control among rural Chinese. A randomized, controlled trial.[see comment]. J Hypertens,2007. 25(10): p. 2011-8.545. Takahashi, Y., et al., Blood pressure change in a free-living population-based dietary modificationstudy in Japan. J Hypertens, 2006. 24(3): p. 451-458.546. Robertson, J.I. and J.I.S. Robertson, <strong>Dietary</strong> salt and hypertension: a scientific issue or a matterof faith? Journal of Evaluation in Clinical Practice, 2003. 9(1): p. 1-22.547. Obarzanek, E., et al., Individual blood pressure responses to changes in salt intake: results fromthe DASH-Sodium trial.[see comment]. Hypertension, 2003. 42(4): p. 459-67.548. Nowson, C.A., et al., Low-sodium dietary approaches to stop hypertension-type diet includinglean red meat lowers blood pressure in postmenopausal women. Nutr Res, 2009. 29(1): p. 8-18.549. Melander, O., et al., Moderate salt restriction effectively lowers blood pressure and degree of saltsensitivity is related to baseline concentration of renin and N-terminal atrial natriuretic peptide inplasma. J Hypertens, 2007. 25(3): p. 619-627.DRAFT <strong>Australian</strong> <strong>Dietary</strong> <strong>Guidelines</strong>- December 2011 249
550. Kawano, Y., et al., Report of the working group for dietary salt reduction of the Japanese Societyof Hypertension: (1) Rationale for salt restriction and salt-restriction target level for themanagement of hypertension. Hypertension Research - Clinical & Experimental, 2007.30(10): p. 879-86.551. Jürgens, G. and A. Graudal Niels, Effects of low sodium diet versus high sodium diet on bloodpressure, renin, aldosterone, catecholamines, cholesterols, and triglyceride. Cochrane DatabaseSyst Rev, 2004(1).552. Hooper, L., et al., Advice to reduce dietary salt for prevention of cardiovascular disease.[update ofCochrane Database Syst Rev. 2003;(3):CD003656; PMID: 12917977]. Cochrane DatabaseSyst Rev, 2004(1): p. CD003656.553. He, F.J. and G.A. MacGregor, Effect of longer-term modest salt reduction on blood pressure.Cochrane Database Syst Rev, 2004(3): p. CD004937.554. Geleijnse, J.M., F.J. Kok, and D.E. Grobbee, Impact of dietary and lifestyle factors on theprevalence of hypertension in Western populations. European Journal of Public <strong>Health</strong>, 2004.14(3): p. 235-239.555. Geleijnse, J.M., F.J. Kok, and D.E. Grobbee, Blood pressure response to changes in sodium andpotassium intake: a metaregression analysis of randomised trials. J Hum Hypertens, 2003. 17(7):p. 471-80.556. Dickinson, K.M., J.B. Keogh, and P.M. Clifton, Effects of a low-salt diet on flow-mediateddilatation in humans. Am J Clin Nutr, 2009. 89(2): p. 485-490.557. Dickinson, B.D. and S. Havas, Reducing the population burden of cardiovascular disease byreducing sodium intake: a report of the council on science and public health. Arch Intern Med,2007. 167(14): p. 1460-1468.558. Geleijnse, J.M. and D.E. Grobbee, High salt intake early in life: does it increase the risk ofhypertension? J Hypertens, 2002. 20(11): p. 2121-2124.559. Beevers, D.G., The epidemiology of salt and hypertension. Clinical Autonomic Research, 2002.12(5): p. 353-7.560. Chang, H.Y., et al., Effect of potassium-enriched salt on cardiovascular mortality and medicalexpenses of elderly men. Am J Clin Nutr, 2006. 83(6): p. 1289-96.561. Cook, N.R., et al., Long term effects of dietary sodium reduction on cardiovascular diseaseoutcomes: observational follow-up of the trials of hypertension prevention (TOHP). Br Med J,2007. 334(7599): p. 885-888.DRAFT <strong>Australian</strong> <strong>Dietary</strong> <strong>Guidelines</strong>- December 2011 250
562. Cook, N.R., et al., Joint effects of sodium and potassium intake on subsequent cardiovasculardisease: the Trials of Hypertension Prevention follow-up study. Arch Intern Med, 2009. 169(1):p. 32-40.563. He, J., et al., <strong>Dietary</strong> sodium intake and incidence of congestive heart failure in overweight USmen and women: first National <strong>Health</strong> and Nutrition Examination Survey Epidemiologic Follow-upStudy. Arch Intern Med, 2002. 162(14): p. 1619-1624.564. Reddy, K.S. and M.B. Katan, Diet, nutrition and the prevention of hypertension andcardiovascular diseases... Diet, Nutrition and the Prevention of Chronic Diseases: scientificbackground papers of the Joint WHO/FAO Expert Consultation (Geneva, 28 January-1 February2002). Public <strong>Health</strong> Nutr, 2004. 7(1A): p. 167-186.565. Lawes, C.M., S. Vander Hoorn, and A. Rodgers, Global burden of blood-pressure-relateddisease, 2001. Lancet, 2008. 371(9623): p. 1513-8.566. Law, M.R., J.K. Morris, and N.J. Wald, Use of blood pressure lowering drugs in the prevention ofcardiovascular disease: meta-analysis of 147 randomised trials in the context of expectations fromprospective epidemiological studies. Br Med J, 2009. 338: p. b1665.567. Key, T.J., et al., Diet, nutrition and the prevention of cancer. Public <strong>Health</strong> Nutr, 2004. 7(1A):p. 187-200.568. Commonwealth Department of <strong>Health</strong>, <strong>Dietary</strong> guidelines for <strong>Australian</strong>s, 1982: Canberra,ACT.569. National <strong>Health</strong> and Medical Research Council, <strong>Dietary</strong> <strong>Guidelines</strong> for <strong>Australian</strong>s, 1992,Commonwealth of Australia: Canberra.570. Food Standards Australia and New Zealand, Final assessment report - Proposal P230 -Consideration of mandatory fortification with iodine for New Zeland, 2008, Food StandardsAustralia New Zealand.571. Duley, L. and D. Henderson-Smart, Reduced salt intake compared to normal dietary salt, orhigh intake, in pregnancy. Cochrane Database Syst Rev, 1999(2): p. CD001687.572. <strong>Australian</strong> Institute of <strong>Health</strong> and Welfare, <strong>Health</strong> expenditure Australia 2007-08, cat. no.HWE 46, 2009: Canberra, ACT.573. Fiorito, L.M., et al., Girls' early sweetened carbonated beverage intake predicts different patternsof beverage and nutrient intake across childhood and adolescence. J Am Diet Assoc, 2010.110(4): p. 543-550.DRAFT <strong>Australian</strong> <strong>Dietary</strong> <strong>Guidelines</strong>- December 2011 251
574. Libuda, L., et al., Pattern of beverage consumption and long-term association with body-weightstatus in German adolescents--results from the DONALD study. Br J Nutr, 2008. 99(6): p. 1370-9.575. Bes-Rastrollo, M., et al., Predictors of weight gain in a Mediterranean cohort: the SeguimientoUniversidad de Navarra Study 1. Am J Clin Nutr, 2006. 83(2): p. 362-70; quiz 394-5.576. Palmer, J.R., et al., Sugar-sweetened beverages and incidence of type 2 diabetes mellitus inAfrican American women. Arch Intern Med, 2008. 168(14): p. 1487-92.577. Laville, M. and J.A. Nazare, Diabetes, insulin resistance and sugars. Obes Rev, 2009. 10(Suppl1): p. 24-33.578. Esposito, K., et al., Prevention of type 2 diabetes by dietary patterns: a systematic review ofprospective studies and meta-analysis. Metab Syndr Relat Disord, 2010. 8(6): p. 471-6.579. Malik, V.S., et al., Sugar-sweetened beverages and risk of metabolic syndrome and type 2diabetes: a meta-analysis. Diabetes Care, 2010. 33(11): p. 2477-83.580. Mann, J.I., A.S. Truswell, and E.B. Manning, Effects on serum lipids of reducing dietary sucrose orstarch for 22 weeks in normal men. S Afr Med J, 1972. 46(25): p. 827-34.581. Silvera, S.A., et al., <strong>Dietary</strong> carbohydrates and breast cancer risk: a prospective study of the rolesof overall glycemic index and glycemic load.[erratum appears in Int J Cancer. 2006 May1;118(9):2372]. Int J Cancer 2005. 114(4): p. 653-8.582. Michaud, D.S., et al., <strong>Dietary</strong> sugar, glycemic load, and pancreatic cancer risk in a prospectivestudy. Journal of the National Cancer Institute, 2002. 94(17): p. 1293-300.583. Michaud, D.S., et al., <strong>Dietary</strong> glycemic load, carbohydrate, sugar, and colorectal cancer risk inmen and women. Cancer Epidemiol Biomarkers Prev, 2005. 14(1): p. 138-47.584. De Stefani, E., et al., <strong>Dietary</strong> patterns and risk of bladder cancer: a factor analysis in Uruguay.Cancer Causes Control, 2008. 19(10): p. 1243-9.585. Nothlings, U., et al., <strong>Dietary</strong> glycemic load, added sugars, and carbohydrates as risk factors forpancreatic cancer: the Multiethnic Cohort Study. Am J Clin Nutr, 2007. 86(5): p. 1495-501.586. World Cancer Research Fund and American Institute for Cancer Research, Food, nutrition,and the prevention of cancer: a global perspective, 1997, American Institute for CancerResearch: Washington DC.587. Miller, W.D., Dental caries. Am J Dent Sci, 1883. 17: p. 77-130.DRAFT <strong>Australian</strong> <strong>Dietary</strong> <strong>Guidelines</strong>- December 2011 252
588. Burt, B.A., et al., The effects of sugars intake and frequency of ingestion on dental cariesincrement in a three-year longitudinal study. J Dent Res, 1988. 67(11): p. 1422-9.589. Warren, J.J., et al., A longitudinal study of dental caries risk among very young low SES children.Community Dent Oral Epidemiol, 2009. 37(2): p. 116-122.590. Ruottinen, S., et al., Sucrose intake since infancy and dental health in 10-year-old children.Caries research, 2000. 38(2): p. 142-148.591. Marshall, T.A., et al., Comparison of the intakes of sugars by young children with and withoutdental caries experience. J Am Dent Assoc, 2007. 138(1): p. 39.592. Levy, S.M., et al., Fluoride, beverages and dental caries in the primary dentition. Caries Res,2003. 37(3): p. 157-65.593. Anderson, C.A., et al., Sucrose and dental caries: a review of the evidence. Obes Rev, 2009.10(Suppl 1): p. 41-54.594. Gibson, S. and S. Williams, Dental caries in pre-school children: associations with social class,toothbrushing habit and consumption of sugars and sugar-containing foods. Further analysis ofdata from the National Diet and Nutrition Survey of children aged 1.5-4.5 years. Caries research,1999. 33(2): p. 101.595. American Academy of Pediatrics, Clinical Practice Guideline: Diagnosis and Evaluation of theChild With Attention-Deficit/Hyperactivity Disorder. Pediatrics, 2000. 105(5).596. Walsh, L.J., Preventive dentistry for the general dental practitioner. Aust Dent J, 2000. 45(2): p.76-82.597. Balakrishnan, M., R.S. Simmonds, and J.R. Tagg, Dental caries is a preventable infectiousdisease. Aust Dent J, 2000. 45(4): p. 235-245.598. Mattes, R.D., <strong>Dietary</strong> compensation by humans for supplemental energy provided as ethanol orcarbohydrate in fluids. Physiol Behav, 1996. 59(1): p. 179-187.599. Raben, A., et al., Sucrose compared with artificial sweeteners: different effects on ad libitum foodintake and body weight after 10 wk of supplementation in overweight subjects. Am J Clin Nutr,2002. 76(4): p. 721-9.600. Krebs-Smith, S.M., Choose beverages and foods to moderate your intake of sugars: measurementrequires quantification. J Nutr, 2001. 131(2S-1): p. 527S-535S.DRAFT <strong>Australian</strong> <strong>Dietary</strong> <strong>Guidelines</strong>- December 2011 253
601. Marriott, B.P., et al., Intake of added sugars and selected nutrients in the United States, National<strong>Health</strong> and Nutrition Examination Survey (NHANES) 2003-2006. Crit Rev Food Sci Nutr,2010. 50(3): p. 228-58.602. Lam, M., et al., Children's acceptance of xylitol-based foods. Community Dent Oral Epidemiol,2000. 28(2): p. 97-101.603. Davies, M.J., et al., Dental caries among <strong>Australian</strong> Aboriginal, non-Aboriginal <strong>Australian</strong>-born, andoverseas-born children. Bull World <strong>Health</strong> Organ, 1997. 75(3): p. 197.604. Chikritzhs, T., K. Fillmore, and T. Stockwell, A healthy dose of scepticism: Four good reasons tothink again about protective effects of alcohol on coronary heart disease. Drug and AlcoholReview, 2009. 28(4): p. 441-444.605. Calabria, B., et al., Epidemiology of alcohol related burden of disease among Indigenous<strong>Australian</strong>s. Aust N Z J Public <strong>Health</strong>, 2010. 34: p. S47-S51.606. Chikritzhs, T.N., et al., Mortality and life-years lost due to alcohol: a comparison of acute andchronic causes. Med J Aust, 2001. 174(6): p. 281-284.607. Collins, D.J. and H.M. Lapsley, The costs of tobacco, alcohol and illicit drug abuse to <strong>Australian</strong>society in 2004/05, 2008, Commonwealth Department of <strong>Health</strong> and Ageing: Canberra.608. Xiao, J., et al., Impact of Alcohol on the Population of Western Australia, D.o.H.W.Epidemiology Branch, Editor 2008.609. National <strong>Health</strong> and Medical Research Council, <strong>Australian</strong> <strong>Guidelines</strong> to Reduce <strong>Health</strong> Risksfrom Drinking Alcohol, 2009, Commonwealth of Australia: Canberra.610. Banwell, C., How many standard drinks are there in a glass of wine? Drug Alcohol Rev, 1999.18(1): p. 99-101.611. Arriola, L., et al., Alcohol intake and the risk of coronary heart disease in the Spanish EPIC cohortstudy. Heart, 2010. 96(2): p. 124-30.612. Simons, L.A., et al., Alcohol intake and survival in the elderly: a 77 month follow-up in the Dubbostudy. Aust N Z J Med, 1996. 26(5): p. 662-70.613. Cullen, K.J., M.W. Knuiman, and N.J. Ward, Alcohol and mortality in Busselton, WesternAustralia. Am J Epidemiol, 1993. 137(2): p. 242-8.614. Costanzo, S., et al., Alcohol consumption and mortality in patients with cardiovascular disease: ameta-analysis. J Am Coll Cardiol, 2010. 55(13): p. 1339-47.DRAFT <strong>Australian</strong> <strong>Dietary</strong> <strong>Guidelines</strong>- December 2011 254
615. Ronksley, P.E., et al., Association of alcohol consumption with selected cardiovascular diseaseoutcomes: a systematic review and meta-analysis. BMJ, 2011. 342: p. d671.616. Roerecke, M. and J. Rehm, Ischemic heart disease mortality and morbidity rates in formerdrinkers: a meta-analysis. Am J Epidemiol, 2011. 173(3): p. 245-258.617. Schooling, C.M., et al., Moderate alcohol use and mortality from ischaemic heart disease: aprospective study in older Chinese people. PLoS One, 2008. 3(6).618. Sierksma, A., et al., Moderate alcohol consumption reduces plasma C-reactive protein andfibrinogen levels; a randomized, diet-controlled intervention study. Eur J Clin Nutr, 2002. 56(11):p. 1130-6.619. Badia, E., et al., Decreased tumor necrosis factor-induced adhesion of human monocytes toendothelial cells after moderate alcohol consumption. Am J Clin Nutr, 2004. 80(1): p. 225-30.620. Hansen, A.S., et al., Effect of red wine and red grape extract on blood lipids, haemostatic factors,and other risk factors for cardiovascular disease. Eur J Clin Nutr, 2005. 59(3): p. 449-55.621. Tsang, C., et al., The influence of moderate red wine consumption on antioxidant status andindices of oxidative stress associated with CHD in healthy volunteers. Br J Nutr, 2005. 93(2): p.233-240.622. Avellone, G., et al., Effects of moderate Sicilian red wine consumption on inflammatorybiomarkers of atherosclerosis. Eur J Clin Nutr, 2006. 60(1): p. 41-7.623. Addolorato, G., et al., Effects of short-term moderate alcohol administration on oxidative stressand nutritional status in healthy males. Appetite, 2008. 50(1): p. 50-56.624. Beulens, J.W.J., et al., Moderate alcohol consumption and lipoprotein-associated phospholipaseA2 activity. Nutr Metab Cardiovasc Dis, 2008. 18(8): p. 539-544.625. Tousoulis, D., et al., Acute effects of different alcoholic beverages on vascular endothelium,inflammatory markers and thrombosis fibrinolysis system. Clinical Nutrition, 2008. 27(4): p.594-600.626. Costanzo, S., et al., Cardiovascular and overall mortality risk in relation to alcohol consumption inpatients with cardiovascular disease. Circulation, 2010. 121(17): p. 1951.627. Bagnardi, V., et al., Does drinking pattern modify the effect of alcohol on the risk of coronaryheart disease? Evidence from a meta-analysis. Journal of epidemiology and community health,2008. 62(7): p. 615.DRAFT <strong>Australian</strong> <strong>Dietary</strong> <strong>Guidelines</strong>- December 2011 255
628. Ma, X.J., et al., [Genetic characteristics of familial type 2 diabetes pedigrees: a preliminary analysisof 4468 persons from 715 pedigrees]. Zhonghua Yi Xue Za Zhi, 2008. 88(36): p. 2541-3.629. Taylor, B., et al., Alcohol and hypertension: gender differences in dose–response relationshipsdetermined through systematic review and meta analysis. Addiction, 2009. 104(12): p. 1981-1990.630. Savica, V., G. Bellinghieri, and J.D. Kopple, The effect of nutrition on blood pressure. Annu RevNutr, 2010. 30: p. 365-401.631. Hackam, D.G., et al., The 2010 Canadian Hypertension Education Program recommendations forthe management of hypertension: part 2 - therapy. Can J Cardiol, 2010. 26(5): p. 249-58.632. National Stroke Foundation, Clinical <strong>Guidelines</strong> for Acute Stroke Management2007,Melbourne: National Stroke Foundation.633. Allen, N.E., et al., Moderate alcohol intake and cancer incidence in women. J Natl Cancer Inst,2009. 101(5): p. 296-305.634. Terry, M.B., et al., Lifetime alcohol intake and breast cancer risk. Ann Epidemiol, 2006. 16(3):p. 230-40.635. Petri, A.L., et al., Alcohol intake, type of beverage, and risk of breast cancer in pre- andpostmenopausal women. Alcoholism: Clinical and Experimental Research, 2004. 28(7): p.1084-1090.636. Newcomb, P.A., et al., No difference between red wine or white wine consumption and breastcancer risk. Cancer Epidemiol Biomarkers Prev, 2009. 18(3): p. 1007-10.637. Li, Y., et al., Wine, liquor, beer and risk of breast cancer in a large population. European Journalof Cancer, 2009. 45(5): p. 843-50.638. Deandrea, S., et al., Alcohol and breast cancer risk defined by estrogen and progesterone receptorstatus: a case-control study. Cancer Epidemiol Biomarkers Prev, 2008. 17(8): p. 2025-8.639. Bessaoud, F. and J.P. Daurès, Patterns of alcohol (especially wine) consumption and breastcancer risk: a case-control study among a population in Southern France. Annals ofEpidemiology, 2008. 18(6): p. 467-475.640. Fuchs, C.S., et al., The influence of folate and multivitamin use on the familial risk of colon cancerin women. Cancer Epidemiol Biomarkers Prev, 2002. 11(3): p. 227.641. Bongaerts, B.W., et al., Alcohol and the risk of colon and rectal cancer with mutations in the K-ras gene. Alcohol, 2006. 38(3): p. 147-54.DRAFT <strong>Australian</strong> <strong>Dietary</strong> <strong>Guidelines</strong>- December 2011 256
642. Purdue, M.P., et al., Type of alcoholic beverage and risk of head and neck cancer--a pooledanalysis within the INHANCE Consortium. Am J Epidemiol, 2009. 169(2): p. 132-42.643. Liang, W., et al., Mortality rate of alcoholic liver disease and risk of hospitalization for alcoholicliver cirrhosis, alcoholic hepatitis and alcoholic liver failure in Australia between 1993 and 2005.Internal Medicine Journal, 2011. 41(1a): p. 34-41.644. Rehm, J., et al., Alcohol as a risk factor for liver cirrhosis: a systematic review and meta analysis.Drug and Alcohol Review, 2010. 29(4): p. 437-445.645. Stampfer, M.J., et al., Effects of moderate alcohol consumption on cognitive function in women. NEngl J Med, 2005. 352(3): p. 245-53.646. Solfrizzi, V., et al., Alcohol consumption, mild cognitive impairment, and progression to dementia.Neurology, 2007. 68(21): p. 1790-9.647. Ruitenberg, A., et al., Alcohol consumption and risk of dementia: the Rotterdam Study. Lancet,2002. 359(9303): p. 281-6.648. Luchsinger, J.A., et al., Alcohol intake and risk of dementia. J Am Geriatr Soc, 2004. 52(4): p.540-6.649. Letenneur, L., S. Larrieu, and P. Barberger-Gateau, Alcohol and tobacco consumption as riskfactors of dementia: a review of epidemiological studies. Biomedecine & Pharmacotherapy,2004. 58(2): p. 95-99.650. Harper, C., The neuropathology of alcohol-specific brain damage, or does alcohol damage thebrain? Journal of Neuropathology & Experimental Neurology, 1998. 57(2): p. 101.651. Deng, J., et al., A 2-year follow-up study of alcohol consumption and risk of dementia. ClinNeurol Neurosurg, 2006. 108(4): p. 378-83.652. Brown, S.A. and S.F. Tapert, Adolescence and the trajectory of alcohol use: basic to clinicalstudies. Annals of the New York Academy of Sciences, 2004. 1021(1): p. 234-244.653. Cargiulo, T., Understanding the health impact of alcohol dependence. Am J <strong>Health</strong> Syst Pharm,2007. 64(5 Suppl 3): p. S5-11.654. Chen, C.Y. and C.L. Storr, Alcohol use and health-related quality of life among youth in Taiwan.Journal of Adolescent <strong>Health</strong>, 2006. 39(5): p. 752. e9-752. e16.655. Deas, D. and E.S. Brown, Adolescent substance abuse and psychiatric comorbidities. J ClinPsychiatry, 2006. 67(7): p. e02.DRAFT <strong>Australian</strong> <strong>Dietary</strong> <strong>Guidelines</strong>- December 2011 257
656. Turner, R.J. and A.G. Gil, Psychiatric and substance use disorders in South Florida: racial/ethnicand gender contrasts in a young adult cohort. Archives of General Psychiatry, 2002. 59(1): p.43.657. National <strong>Health</strong> and Medical Research Council, <strong>Australian</strong> Alcohol <strong>Guidelines</strong>: health risks andbenefits, 2001, Commonwealth of Australia: Canberra.658. Truswell, A.S., <strong>Australian</strong> experience with the Wernicke-Korsakoff syndrome. Addiction, 2000.95(6): p. 829-32.659. Rolland, S. and A.S. Truswell, Wernicke-Korsakoff syndrome in Sydney hospitals after 6 years ofthiamin enrichment of bread. Public <strong>Health</strong> Nutr, 1998. 1(2): p. 117-22.660. Edenberg, H.J., The genetics of alcohol metabolism: role of alcohol dehydrogenase and aldehydedehydrogenase variants. Alcohol Res <strong>Health</strong>, 2007. 30(1): p. 5-13.661. Whitfield, J.B. and N.G. Martin, Alcohol consumption and alcohol pharmacokinetics: interactionswithin the normal population. Alcoholism: Clinical and Experimental Research, 1994. 18(2): p.238-243.662. Li, T.-K., et al., Gender and ethnic differences in alcohol metabolism. Alcoholism: Clinical andExperimental Research, 1998. 22(3): p. 771-772.663. Bellis, M.D., et al., Prefrontal cortex, thalamus, and cerebellar volumes in adolescents and youngadults with adolescent onset alcohol use disorders and comorbid mental disorders. Alcohol ClinExp Res, 2005. 29(9): p. 1590-1600.664. White, A.M. and H.S. Swartzwelder, Hippocampal function during adolescence: a unique targetof ethanol effects. Annals of the New York Academy of Sciences, 2004. 1021(1): p. 206-220.665. Brinton, E.A., Effects of ethanol intake on lipoproteins and atherosclerosis. Curr Opin Lipidol,2010. 21(4): p. 346-51.666. American Diabetes Association, Nutrition recommendations and interventions for diabetes: aposition statement of the American Diabetes Association. Diabetes Care, 2007. 30(Suppl 1): p.S48-65.667. CMP Medica, MIMS Annual 2007, 2007, CMP Medica: St Leonards, NSW.668. Lee, Y., et al., Systematic review of health behavioral risks and cognitive health in older adults. IntPsychogeriatr, 2010. 22(2): p. 174-87.DRAFT <strong>Australian</strong> <strong>Dietary</strong> <strong>Guidelines</strong>- December 2011 258
669. Arntzen, K., et al., Moderate wine consumption is associated with better cognitive test results: a 7year follow up of 5033 subjects in the Tromsø Study. Acta Neurologica Scandinavica, 2010.122: p. 23-29.670. <strong>Australian</strong> Institute of <strong>Health</strong> and Welfare, 2007 National Drug Strategy Household Survey:detailed findings. Cat. no. PHE 107, 2008, <strong>Australian</strong> Institute of <strong>Health</strong> and Welfare:Canberra.671. <strong>Australian</strong> Bureau of Statistics, Apparent Consumption of Alcohol, Australia, 2008-09. Cat. no.4307.0.55.001, 2010, <strong>Australian</strong> Bureau of Statistics: Canberra.672. National Preventative <strong>Health</strong> Taskforce, Australia: the healthiest country by 2020. A discussionpaper, 2008, Commonwealth of Australia: Canberra.673. Giglia, R. and C. Binns, Alcohol and lactation: a systematic review. Nutr Diet, 2006. 63(2): p.103-116.674. Giglia, R.C., et al., The effect of alcohol intake on breastfeeding duration in <strong>Australian</strong> women.Acta Paediatr, 2008. 97(5): p. 624-9.675. Aira, M., S. Hartikainen, and R. Sulkava, Community prevalence of alcohol use and concomitantuse of medication—a source of possible risk in the elderly aged 75 and older? Int J GeriatrPsychiatry, 2005. 20(7): p. 680-685.676. Fletcher, P.C. and J.P. Hirdes, Risk factors for accidental injuries within senior citizens' homes:analysis of the Canadian survey on ageing and independence. Journal of GerontologicalNursing, 2005. 31(2): p. 49.677. Mukamal, K., et al., Alcohol consumption, bone density, and hip fracture among older adults: thecardiovascular health study. Osteoporosis international, 2007. 18(5): p. 593-602.678. <strong>Australian</strong> Institute of <strong>Health</strong> and Welfare, The problem of osteoporotic hip fracture inAustralia., 2010.679. Cheyne, E.H., et al., Influence of alcohol on cognitive performance during mild hypoglycaemia;implications for Type 1 diabetes. Diabet Med, 2004. 21(3): p. 230-7.680. Tolman, K.G. and A.S. Dalpiaz, Treatment of non-alcoholic fatty liver disease. Ther Clin RiskManag, 2007. 3(6): p. 1153-63.681. Ferreira, S.E., et al., Effects of energy drink ingestion on alcohol intoxication. Alcohol Clin ExpRes, 2006. 30(4): p. 598-605.DRAFT <strong>Australian</strong> <strong>Dietary</strong> <strong>Guidelines</strong>- December 2011 259
682. Price, S.R., et al., Energy drink co administration is associated with increased reported alcoholingestion. Drug and Alcohol Review, 2010. 29(3): p. 331-333.683. Thombs, D.L., et al., Event-level analyses of energy drink consumption and alcohol intoxication inbar patrons. Addict Behav, 2010. 35(4): p. 325-30.684. Weldy, D.L., Risks of alcoholic energy drinks for youth. J Am Board Fam Med, 2010. 23(4): p.555-8.685. World <strong>Health</strong> Organization, Obesity: preventing and managing the global epidemic. Report of aWHO consultation (WHO Technical Report Series No. 894), in World <strong>Health</strong> Organ Tech RepSer2000, World <strong>Health</strong> Organization: Geneva. p. i-xii, 1-253.686. Caballero, B., The global epidemic of obesity: an overview. Epidemiol Rev, 2007. 29: p. 1-5.687. World <strong>Health</strong> Organization Expert Committee on Physical Status, Physical status: the useand interpretation of anthropometry, 1995, World <strong>Health</strong> Organization: Geneva.688. World <strong>Health</strong> Organization, Global strategy on diet, physical activity and health, 2004, World<strong>Health</strong> Organization: Geneva.689. Willett, W.C., W.H. Dietz, and G.A. Colditz, <strong>Guidelines</strong> for healthy weight. N Engl J Med,1999. 341(6): p. 427-34.690. National <strong>Health</strong> and Medical Research Council, Acting on Australia’s weight: A strategic planfor the prevention of overweight and obesity, 1997, Commonwealth of Australia: Canberra.691. World <strong>Health</strong> Organization. Global database on Body Mass Index: an interactive surveillancetool for monitoring nutrition transition 2011 [cited 2011 18 May]; Available from:http://apps.who.int/bmi/index.jsp.692. Hocking, S., et al., The Western <strong>Australian</strong> Chief <strong>Health</strong> Officer’s Report 2010, 2010,Department of <strong>Health</strong>, WA: Perth.693. Queensland <strong>Health</strong>, Risk factor impact on the burden of disease and injury in Queensland, 2007,2010, Queensland <strong>Health</strong>.694. <strong>Australian</strong> Bureau of Statistics, National <strong>Health</strong> Survey: Summary of Results, 2007-2008, 2010,<strong>Australian</strong> Bureau of Statistics: Canberra.695. Institute of Medicine, Bridging the evidence gap in obesity prevention:a framework to informdecision making, 2010, Institute of Medicine: Washington DC.DRAFT <strong>Australian</strong> <strong>Dietary</strong> <strong>Guidelines</strong>- December 2011 260
696. Rokholm, B., J.L. Baker, and T.I. Sorensen, The levelling off of the obesity epidemic since theyear 1999--a review of evidence and perspectives. Obes Rev, 2010. 11(12): p. 835-46.697. Abbott, R.A., et al., <strong>Health</strong>y Kids Queensland Survey 2006 — Summary Report, Queensland<strong>Health</strong>, Editor 2007: Brisbane.698. Hands, B., et al., Physical activity and nutrition levels in Western <strong>Australian</strong> children andadolescents: report, 2004, Western <strong>Australian</strong> Government: Perth.699. Hardy, L., SPANS 2010 - NSW Schools Physical Activity and Nutrition Survey - ExecutiveSummary, 2011, NSW Department of <strong>Health</strong>: Sydney.700. Martin, K., et al., Child and Adolescent Physical Activity and Nutrition Survey 2008: key findings,2008, Physical Activity Taskforce (Western Australia): Perth.701. Olds, T.S., et al., Trends in the prevalence of childhood overweight and obesity in Australiabetween 1985 and 2008. Int J Obesity, 2010. 34(1): p. 57-66.702. Gill, T.P., et al., Childhood obesity in Australia remains a widespread health concern that warrantspopulation-wide prevention programs. Med J Aust, 2009. 190(3): p. 146-8.703. Lobstein, T., L. Baur, and R. Uauy, Obesity in children and young people: a crisis in public health.Obes Rev, 2004. 5(Suppl 1): p. 4-104.704. Olshansky, S.J., et al., A potential decline in life expectancy in the United States in the 21stcentury. N Engl J Med, 2005. 352(11): p. 1138-45.705. Haby, M. and A. Markwick, Future prevalence of overweight and obesity in <strong>Australian</strong> childrenand adolescents, 2005-2025, 2008, Department of Human Services: Melbourne.706. Prospective Studies Collaboration, et al., Body-mass index and cause-specific mortality in 900000 adults: collaborative analyses of 57 prospective studies. Lancet, 2009. 373(9669): p. 1083-96.707. <strong>Australian</strong> Institute of <strong>Health</strong> and Welfare, Australia's health 2008. Cat. no. AUS 99, 2008,<strong>Australian</strong> Institute of <strong>Health</strong> and Welfare: Canberra.708. Barba, C., et al., Appropriate body-mass index for Asian populations and its implications for policyand intervention strategies. Lancet, 2004. 363(9403).709. Flicker, L., et al., Body mass index and survival in men and women aged 70 to 75. J Am GeriatrSoc, 2010. 58(2): p. 234-41.DRAFT <strong>Australian</strong> <strong>Dietary</strong> <strong>Guidelines</strong>- December 2011 261
710. National <strong>Health</strong> and Medical Research Council, Clinical Practice <strong>Guidelines</strong> for theManagement of Overweight and Obesity in Adults, 2003, Commonwealth of Australia:Canberra.711. de Onis, M., et al., Development of a WHO growth reference for school-aged children andadolescents. Bull World <strong>Health</strong> Organ, 2007. 85(9): p. 660-7.712. Cole, T.J., et al., Establishing a standard definition for child overweight and obesity worldwide:international survey. Br Med J, 2000. 320(7244): p. 1240-3.713. Cole, T.J., et al., Body mass index cut offs to define thinness in children and adolescents:international survey. Br Med J, 2007. 335(7612): p. 194.714. Withrow, D. and D.A. Alter, The economic burden of obesity worldwide: a systematic review ofthe direct costs of obesity. Obes Rev, 2011. 12(2): p. 131-41.715. Stevens, J., et al., The effect of age on the association between body-mass index and mortality. NEngl J Med, 1998. 338(1): p. 1-7.716. Diehr, P., et al., Weight, mortality, years of healthy life, and active life expectancy in older adults.J Am Geriatr Soc, 2008. 56(1): p. 76-83.717. Denney-Wilson, E., et al., Body mass index, waist circumference, and chronic disease risk factorsin <strong>Australian</strong> adolescents. Arch Pediatr Adolesc Med, 2008. 162(6): p. 566-73.718. Clarke, P.J., et al., Midlife health and socioeconomic consequences of persistent overweight acrossearly adulthood: findings from a national survey of American adults (1986-2008). Am JEpidemiol, 2010. 172(5): p. 540-8.719. Biro, F.M. and M. Wien, Childhood obesity and adult morbidities. Am J Clin Nutr, 2010. 91(5):p. 1499S-1505S.720. Oates, R.K., Non-organic failure to thrive. Aust Paediatr J, 1984. 20(2): p. 95-100.721. Pugliese, M.T., et al., Parental health beliefs as a cause of nonorganic failure to thrive. Pediatrics,1987. 80(2): p. 175-82.722. National <strong>Eat</strong>ing Disorders Collaborative, <strong>Eat</strong>ing disorders- prevention, treatment andmanagement: an evidence review, 2010, National <strong>Eat</strong>ing Disorders Collaborative 2010.723. Stubbs, C.O. and A.J. Lee, The obesity epidemic: both energy intake and physical activitycontribute. Med J Aust, 2004. 181(9): p. 489-91.DRAFT <strong>Australian</strong> <strong>Dietary</strong> <strong>Guidelines</strong>- December 2011 262
724. Bensimhon, D.R., W.E. Kraus, and M.P. Donahue, Obesity and physical activity: a review. AmHeart J, 2006. 151(3): p. 598-603.725. Haskell, W.L., et al., Physical activity and public health: updated recommendation for adults fromthe American College of Sports Medicine and the American Heart Association. Circulation, 2007.116(9): p. 1081-93.726. Swinburn, B. and G. Egger, The runaway weight gain train: too many accelerators, not enoughbrakes. Br Med J, 2004. 329(7468): p. 736-9.727. Swinburn, B., G. Sacks, and E. Ravussin, Increased food energy supply is more than sufficient toexplain the US epidemic of obesity. Am J Clin Nutr, 2009. 90(6): p. 1453-6.728. Swinburn, B.A., et al., Diet, nutrition and the prevention of excess weight gain and obesity. Public<strong>Health</strong> Nutr, 2004. 7(1A): p. 123-46.729. Sacks, G., B.A. Swinburn, and M.A. Lawrence, A systematic policy approach to changing thefood system and physical activity environments to prevent obesity. Aust New Zealand <strong>Health</strong>Policy, 2008. 5: p. 13.730. Drewnowski, A. and S.E. Specter, Poverty and obesity: the role of energy density and energycosts. Am J Clin Nutr, 2004. 79(1): p. 6-16.731. Badland, H. and G. Schofield, Transport, urban design, and physical activity: an evidence-basedupdate. Transportation Research Part D: Transport and Environment, 2005. 10(3): p. 177-196.732. Jackson, R.J. and C. Kochtitzky, Creating a healthy environment: the impact of the builtenvironment on public health, 2001, Sprawl Watch: Washington DC.733. Oliver, L.N. and M.V. Hayes, Neighbourhood socio-economic status and the prevalence ofoverweight Canadian children and youth. Can J Public <strong>Health</strong>, 2005. 96(6): p. 415-20.734. Gill, T., L. King, and K. Webb, Best options for promoting healthy weight and preventing weightgain in NSW, 2005, NSW Centre for Public <strong>Health</strong> Nutrition: Sydney.735. Kumanyika, S.K., The obesity epidemic: looking in the mirror. Am J Epidemiol, 2007. 166(3): p.243-5.736. Ebbeling, C.B., D.B. Pawlak, and D.S. Ludwig, Childhood obesity: public-health crisis, commonsense cure. Lancet, 2002. 360(9331): p. 473-82.737. McLaren, L., Socioeconomic status and obesity. Epidemiol Rev, 2007. 29: p. 29-48.DRAFT <strong>Australian</strong> <strong>Dietary</strong> <strong>Guidelines</strong>- December 2011 263
738. Papas, M.A., et al., The built environment and obesity. Epidemiol Rev, 2007. 29: p. 129-43.739. National Obesity Taskforce, <strong>Health</strong>y Weight 2008 - Australia's future - The national actionagenda for children and young people and their families, 2003, Commonwealth of Australia:Canberra.740. Commonwealth Department of Community Services and <strong>Health</strong>, National dietary survey ofschoolchildren (10-15 years), 1985. Report no. 1. Foods consumed, 1988, <strong>Australian</strong>Government Publishing Service: Canberra.741. Commonwealth Department of Community Services and <strong>Health</strong>, National dietary survey ofschoolchildren (10-15 years), 1985. Report no. 2. Nutrient intakes 1989, <strong>Australian</strong>Government Publishing Service: Canberra.742. Commonwealth Department of Community Services and <strong>Health</strong> in collaboration with theNational Heart Foundation, National dietary survey of adults: 1983. No. 2. Nutrient intakes,1987, <strong>Australian</strong> Government Printing Service: Canberra.743. Commonwealth Department of <strong>Health</strong> in collaboration with the National HeartFoundation, National dietary survey of adults: 1983 : No. 1. Foods consumed 1986, <strong>Australian</strong>Government Publishing Service: Canberra.744. Rangan AM, S.S., Hector DJ, Gill TP, Webb KL., Consumption of 'extra' foods by <strong>Australian</strong>adults: types, quantities and contribution to energy and nutrient intake. Eur J Clin Nutr, 2009.63(Oct 29): p. 865-871.745. Stubbs, C.O., Determinants of the Global Obesity Epidemic: Contributions of Early Life, Nutrition,Physical Activity, Television, Smoking and Economic and Social Change, in New Developments inObesity Research, L.A. Melrose, Editor 2006, Nova Publishers: New York. p. 121-152.746. Prentice, A.M., et al., Energy expenditure in overweight and obese adults in affluent societies: ananalysis of 319 doubly-labelled water measurements. Eur J Clin Nutr, 1996. 50(2): p. 93-7.747. Gebel, K., et al., Creating healthy environments: A review of links between the physicalenvironment, physical activity and obesity, NSW <strong>Health</strong> Department and NSW Centre forOverweight and Obesity, Editor 2005: Sydney748. Armstrong, T., A. Bauman, and J. Davies, Physical activity patterns of <strong>Australian</strong> adults. Resultsof the 1999 National Physical Activity Survey, 2000, <strong>Australian</strong> Institute of <strong>Health</strong> and Welfare:Canberra.749. Queensland <strong>Health</strong>, The <strong>Health</strong> of Queenslanders 2010; third report of the Chief <strong>Health</strong> OfficerQueensland, Queensland <strong>Health</strong>, Editor 2010: Brisband, Queensland. p. 115.DRAFT <strong>Australian</strong> <strong>Dietary</strong> <strong>Guidelines</strong>- December 2011 264
750. Centre for Epidemiology and Research, The health of the people of New South Wales - Reportof the Chief <strong>Health</strong> Officer. Summary Report, 2010, NSW Department of <strong>Health</strong>, Editor 2010,NSW Department of <strong>Health</strong>: Sydney, NSW.751. Booth, M.L., et al., Change in the prevalence of overweight and obesity among young <strong>Australian</strong>s,1969-1997. Am J Clin Nutr, 2003. 77(1): p. 29-36.752. Booth, M.L., et al., Methods of the NSW Schools Physical Activity and Nutrition Survey (SPANS). JSci Med Sport, 2005. 8(3): p. 284-93.753. Bauman, A., et al., Getting Australia active: towards better practice for the promotion of physicalactivity, 2002, National Public <strong>Health</strong> Partnership: Melbourne.754. Woodcock, J., et al., Non-vigorous physical activity and all-cause mortality: systematic review andmeta-analysis of cohort studies. Int J Epidemiol, 2011. 40(1): p. 121-38.755. Janssen, I. and A.G. Leblanc, Systematic review of the health benefits of physical activity andfitness in school-aged children and youth. Int J Behav Nutr Phys Act, 2010. 7: p. 40.756. Warburton, D.E., C.W. Nicol, and S.S. Bredin, <strong>Health</strong> benefits of physical activity: the evidence.Can Med Assoc J, 2006. 174(6): p. 801-9.757. Brown, W.J., et al., Leisure time physical activity in <strong>Australian</strong> women: relationship with well beingand symptoms. Res Q Exerc Sport, 2000. 71(3): p. 206-16.758. Nelson, M.C. and P. Gordon-Larsen, Physical activity and sedentary behavior patterns areassociated with selected adolescent health risk behaviors. Pediatrics, 2006. 117(4): p. 1281-90.759. Commonwealth Department of <strong>Health</strong> and Ageing. Measure up - weight and waistmeasurements. 2010 [cited 2011 27 March]; Available from:http://www.health.gov.au/internet/abhi/publishing.nsf/Content/Weight,+waist+circumference+and+BMI-lp.760. Dunstan, D., et al., Diabesity & Associated Disorders in Australia - 2000, 2001, InternationalDiabetes Institute: Melbourne.761. Bautista-Castana, I., J. Doreste, and L. Serra-Majem, Effectiveness of interventions in theprevention of childhood obesity (Structured abstract). Eur J Epidemiol, 2004(7): p. 617-622.762. Campbell, K.J. and K.D. Hesketh, Strategies which aim to positively impact on weight, physicalactivity, diet and sedentary behaviours in children from zero to five years. A systematic review ofthe literature. Obes Rev, 2007. 8(4): p. 327-38.DRAFT <strong>Australian</strong> <strong>Dietary</strong> <strong>Guidelines</strong>- December 2011 265
763. Kamath, C.C., et al., Clinical review: behavioral interventions to prevent childhood obesity: asystematic review and metaanalyses of randomized trials. J Clin Endocrinol Metab, 2008.93(12): p. 4606-15.764. Stice, E., H. Shaw, and C.N. Marti, A meta-analytic review of obesity prevention programs forchildren and adolescents: the skinny on interventions that work. Psychol Bull, 2006(5): p. 667-691.765. Summerbell, C.D., et al., Interventions for preventing obesity in children. Cochrane DatabaseSyst Rev, 2005(3).766. Lemmens, V.E., et al., A systematic review of the evidence regarding efficacy of obesity preventioninterventions among adults. Obes Rev, 2008. 9(5): p. 446-55.767. Orozco Leonardo, J., et al., Exercise or exercise and diet for preventing type 2 diabetes mellitus.Cochrane Database Syst Rev, 2008(3).768. Food and Agriculture Organization of the United Nations and the World <strong>Health</strong>Organization, FAO/WHO Expert Consultation on Fats and Fatty Acids in Human Nutrition, 2008,Food and Agriculture Organization of the United Nations and the World <strong>Health</strong>Organization,.769. Fiorito, L.M., et al., Beverage intake of girls at age 5 y predicts adiposity and weight status inchildhood and adolescence. Am J Clin Nutr, 2009. 90(4): p. 935-42.770. Vrolix R, M.R., Variability of the glycemic response to single food products in healthy subjects.Contemporary Clinical Trials, 2010. 31(1): p. 5-11.771. Johnson, L., et al., Reflections from a systematic review of dietary energy density and weight gain:is the inclusion of drinks valid?. [Review] [62 refs]. Obesity Reviews, 2009. 10(6): p. 681-92.772. Hite, A.H., et al., In the face of contradictory evidence: report of the <strong>Dietary</strong> <strong>Guidelines</strong> forAmericans Committee. Nutrition, 2010. 26(10): p. 915-24.773. Owen, C.G., et al., Effect of infant feeding on the risk of obesity across the life course: aquantitative review of published evidence. Pediatrics, 2005. 115(5): p. 1367-77.774. Araujo, C.L., et al., Effect of birth size and proportionality on BMI and skinfold thickness in earlyadolescence: prospective birth cohort study. Eur J Clin Nutr, 2009. 63(5): p. 634-9.775. Kuh, D., et al., Birth weight, childhood growth and abdominal obesity in adult life. Int J ObesRelat Metab Disord, 2002. 26(1): p. 40-7.DRAFT <strong>Australian</strong> <strong>Dietary</strong> <strong>Guidelines</strong>- December 2011 266
776. Monasta, L., et al., Early-life determinants of overweight and obesity: a review of systematicreviews. Obes Rev, 2010. 11(10): p. 695-708.777. Monteiro, P.O. and C.G. Victora, Rapid growth in infancy and childhood and obesity in later life--a systematic review. Obes Rev, 2005. 6(2): p. 143-54.778. Nader, P.R., et al., Identifying risk for obesity in early childhood. Pediatrics, 2006. 118(3): p.e594-601.779. Mamun, A.A., et al., Does maternal smoking during pregnancy have a direct effect on futureoffspring obesity? Evidence from a prospective birth cohort study. Am J Epidemiol, 2006. 164(4):p. 317-25.780. Landhuis, C.E., et al., Childhood sleep time and long-term risk for obesity: a 32-year prospectivebirth cohort study. Pediatrics, 2008. 122(5): p. 955-60.781. Marshall, S.J., et al., Relationships between media use, body fatness and physical activity inchildren and youth: a meta-analysis. [Review] [76 refs]. International Journal of Obesity &Related Metabolic Disorders: Journal of the International Association for the Study ofObesity, 2004. 28(10): p. 1238-46.782. Rey-Lopez, J.P., et al., Sedentary behaviour and obesity development in children and adolescents.Nutr Metab Cardiovasc Dis, 2008. 18(3): p. 242-51.783. Biddle, S.J., et al., Physical activity and sedentary behaviours in youth: issues and controversies. J RSoc Promot <strong>Health</strong>, 2004. 124(1): p. 29-33.784. Coon, K.A. and K.L. Tucker, Television and children's consumption patterns: a review of theliterature. Minerva Pediatr, 2002. 54(5): p. 423-36.785. Goldani, M.Z., et al., Do early life factors influence body mass index in adolescents? Braz J MedBiol Res, 2007. 40(9): p. 1231-6.786. Langenberg, C., et al., Central and total obesity in middle aged men and women in relation tolifetime socioeconomic status: evidence from a national birth cohort. J Epidemiol Community<strong>Health</strong>, 2003. 57(10): p. 816-22.787. Power, C., et al., Life-course influences on health in British adults: effects of socio-economicposition in childhood and adulthood. Int J Epidemiol, 2007. 36(3): p. 532-9.788. Wright, C.M. and L. Parker, <strong>For</strong>ty years on: the effect of deprivation on growth in two Newcastlebirth cohorts. Int J Epidemiol, 2004. 33(1): p. 147-52.DRAFT <strong>Australian</strong> <strong>Dietary</strong> <strong>Guidelines</strong>- December 2011 267
789. Jyoti, D.F., E.A. Frongillo, and S.J. Jones, Food insecurity affects school children's academicperformance, weight gain, and social skills. J Nutr, 2005. 135(12): p. 2831-9.790. Senf, J.H., C.M. Shisslak, and M.A. Crago, Does dieting lead to weight gain? A four-yearlongitudinal study of middle school girls. Obesity, 2006. 14(12): p. 2236-41.791. Field, A.E., et al., Relation between dieting and weight change among preadolescents andadolescents. Pediatrics, 2003. 112(4): p. 900-6.792. Mamun, A.A., et al., Do childhood sleeping problems predict obesity in young adulthood? Evidencefrom a prospective birth cohort study. Am J Epidemiol, 2007. 166(12): p. 1368-73.793. Taveras, E.M., et al., Short sleep duration in infancy and risk of childhood overweight. ArchPediatr Adolesc Med, 2008. 162(4): p. 305-11.794. Timlin, M.T., et al., Breakfast eating and weight change in a 5-year prospective analysis ofadolescents: Project EAT (<strong>Eat</strong>ing Among Teens). Pediatrics, 2008. 121(3): p. e638-45.795. Gilles, A., et al., Comparing active pediatric obesity treatments using meta-analysis. J Clin ChildAdolesc Psychol, 2008. 37(4): p. 886-92.796. Young, K.M., et al., A meta-analysis of family-behavioral weight-loss treatments for children. ClinPsychol Rev, 2007. 27(2): p. 240-9.797. Berry, D., et al., Family-based interventions for childhood obesity: a review. Journal of familynursing, 2004. 10(4): p. 429.798. Kelly, S.A. and B.M. Melnyk, Systematic review of multicomponent interventions with overweightmiddle adolescents: implications for clinical practice and research. Worldviews Evid Based Nurs,2008. 5(3): p. 113-35.799. Doak, C.M., et al., The prevention of overweight and obesity in children and adolescents: a reviewof interventions and programmes. Obes Rev, 2006. 7(1): p. 111-36.800. Cole, K., et al., An integrative research review: effective school-based childhood overweightinterventions. J Spec Pediatr Nurs, 2006. 11(3): p. 166-77.801. Astrup, A., et al., The role of low-fat diets in body weight control: a meta-analysis of ad libitumdietary intervention studies. Int J Obes Relat Metab Disord, 2000. 24(12): p. 1545-52.802. Willett, W.C. and R.L. Leibel, <strong>Dietary</strong> fat is not a major determinant of body fat. Am J Med,2002. 113(Suppl 9B): p. 47S-59S.DRAFT <strong>Australian</strong> <strong>Dietary</strong> <strong>Guidelines</strong>- December 2011 268
803. Prentice, A.M. and S.A. Jebb, Fast foods, energy density and obesity: a possible mechanistic link.Obes Rev, 2003. 4(4): p. 187-94.804. McCrory, M.A., et al., A twin study of the effects of energy density and palatability on energyintake of individual foods. Physiol Behav, 2006. 87(3): p. 451-9.805. Paddon-Jones, D., et al., Protein, weight management, and satiety. Am J Clin Nutr, 2008.87(5): p. 1558S-1561S.806. Drewnowski, A. and N. Darmon, The economics of obesity: dietary energy density and energycost. Am J Clin Nutr, 2005. 82(1 Suppl): p. 265S-273S.807. Bowman, S.A., et al., Effects of fast-food consumption on energy intake and diet quality amongchildren in a national household survey. Pediatrics, 2004. 113(1 Pt 1): p. 112-8.808. Pereira, M.A., et al., Fast-food habits, weight gain, and insulin resistance (the CARDIA study): 15-year prospective analysis. Lancet, 2005. 365(9453): p. 36-42.809. Ledikwe, J.H., J.A. Ello-Martin, and B.J. Rolls, Portion sizes and the obesity epidemic. J Nutr,2005. 135(4): p. 905-9.810. Cameron-Smith, D., S.A. Bilsborough, and T.C. Crowe, Upsizing Australia's waistline: thedangers of "meal deals". Med J Aust, 2002. 177(11-12): p. 2-16.811. Franz, M.J., et al., Weight-loss outcomes: a systematic review and meta-analysis of weight-lossclinical trials with a minimum 1-year follow-up. J Am Diet Assoc, 2007. 107(10): p. 1755-67.812. Goodpaster, B.H., et al., Effects of diet and physical activity interventions on weight loss andcardiometabolic risk factors in severely obese adults: a randomized trial. J Am Med Assoc, 2010.304(16): p. 1795-802.813. Medibank Private Ltd, Obesity in Australia: financial impacts and cost benefits of intervention,2010, Medibank Private Ltd.814. Colagiuri, S., et al., The cost of overweight and obesity in Australia. Med J Aust, 2010. 192(5): p.260-4.815. Marks, G.C., C. Coyne, and G. Pang, Type 2 diabetes costs in Australia - the potential impact ofchanges in diet, physical activity and levels of obesity, 2001, <strong>Australian</strong> Food and NutritionModelling Unit: Brisbane.816. National Public <strong>Health</strong> Partnership, Be Active Australia: A Framework for <strong>Health</strong> Sector Actionfor Physical Activity 2005–2010, V. Department of Human Services, Editor 2005, NationalPublic <strong>Health</strong> Partnership: Melbourne.DRAFT <strong>Australian</strong> <strong>Dietary</strong> <strong>Guidelines</strong>- December 2011 269
817. Hu, F.B., et al., Television watching and other sedentary behaviors in relation to risk of obesity andtype 2 diabetes mellitus in women. J Am Med Assoc, 2003. 289(14): p. 1785-91.818. Martinez-Gonzalez, M.A., et al., Physical inactivity, sedentary lifestyle and obesity in theEuropean Union. Int J Obes Relat Metab Disord, 1999. 23(11): p. 1192-201.819. Brown, W.J., Y.D. Miller, and R. Miller, Sitting time and work patterns as indicators ofoverweight and obesity in <strong>Australian</strong> adults. International Journal of Obesity & RelatedMetabolic Disorders: Journal of the International Association for the Study of Obesity,2003. 27(11): p. 1340-6.820. Saris, W.H., et al., How much physical activity is enough to prevent unhealthy weight gain?Outcome of the IASO 1st Stock Conference and consensus statement. Obes Rev, 2003. 4(2): p.101-14.821. Blair, S.N., M.J. LaMonte, and M.Z. Nichaman, The evolution of physical activityrecommendations: how much is enough? Am J Clin Nutr, 2004. 79(5).822. Petersen, L., P. Schnohr, and T. Sørensen, Longitudinal study of the long-term relation betweenphysical activity and obesity in adults. International Journal of Obesity, 2003. 28(1): p. 105-112.823. Schoeller, D.A., But how much physical activity? Am J Clin Nutr, 2003. 78(4): p. 669-70.824. Martinez-Gomez, D., et al., Recommended levels of physical activity to avoid an excess of bodyfat in European adolescents: the HELENA Study. Am J Prev Med, 2010. 39(3): p. 203-11.825. Caterson, I.D. and N. Finer, Emerging pharmacotherapy for treating obesity and associatedcardiometabolic risk. Asia Pacific, 2006. 15: p. 55-62.826. National <strong>Health</strong> and Medical Research Council, * Title to be confirmed once published -Obesity treatment guidelines, 2011, National <strong>Health</strong> and Medical Research Council: Canberra.827. Callaway, L.K., M.J. O'Callaghan, and H.D. McIntyre, Barriers to addressing overweight andobesity before conception. Med J Aust, 2009. 191(8): p. 425-428.828. Mamun, A.A., et al., Associations of excess weight gain during pregnancy with long-term maternaloverweight and obesity: evidence from 21 y postpartum follow-up. Am J Clin Nutr, 2010. 91(5):p. 1336-41.829. Dodd, J.M., et al., Antenatal interventions for overweight or obese pregnant women: a systematicreview of randomised trials: a systematic review of randomised trials. BJOG: An InternationalJournal of Obstetrics & Gynaecology, 2010. 117(11): p. 1316-1326.DRAFT <strong>Australian</strong> <strong>Dietary</strong> <strong>Guidelines</strong>- December 2011 270
830. Callaway, L.K., et al., The prevalence and impact of overweight and obesity in an <strong>Australian</strong>obstetric population. Med J Aust, 2006. 184(2): p. 56-9.831. Institute of Medicine, Preventing Childhood Obesity: <strong>Health</strong> in the Balance, 2005, Institute ofMedicine of the National Academies: Washington DC.832. Institute of Medicine, N.R.C., Weight Gain During Pregnancy: Reexamining the <strong>Guidelines</strong>. ,2009, The National Academies Press.: Washington, DC.833. Budge, H., et al., Maternal nutritional programming of fetal adipose tissue development: longtermconsequences for later obesity. Birth defects research. Part C, Embryo today: reviews,2005. 75(3): p. 193-9.834. Boney, C.M., et al., Metabolic syndrome in childhood: association with birth weight, maternalobesity, and gestational diabetes mellitus. Pediatrics, 2005. 115(3): p. e290-6.835. Fraser, A., et al., Associations of gestational weight gain with maternal body mass index, waistcircumference, and blood pressure measured 16 y after pregnancy: the Avon Longitudinal Study ofParents and Children. Am J Clin Nutr, 2011.836. Kinnunen, T.I., et al., Reducing postpartum weight retention--a pilot trial in primary health care.Nutr J, 2007. 6: p. 21.837. Harding, J.E., The nutritional basis of the fetal origins of adult disease. Int J Epidemiol, 2001.30(1): p. 15.838. Makrides, M., Early childhood nutrition and cognitive outcome. Proc Nutr Soc Aust., 1998. 22:p. 216-222.839. Cooper, C., et al., Growth in infancy and bone mass in later life. Ann Rheum Dis, 1997. 56(1):p. 17-21.840. Evans, W.J., Effects of aging and exercise on nutrition needs of the elderly. Nutr Rev, 1996. 54(1Pt 2): p. S35-9.841. Morley, J.E. and W.A. van Staveren, Undernutrition: diagnosis, causes, consequences andtreatment, in Food for the ageing population, M. Raats, L. de Groot, and W.A. van Staveren,Editors. 2009, Woodhead Publishing Limited: Cambridge.842. Nowson, C., Nutritional challenges in the elderly. <strong>Australian</strong> Doctor, 2009(27 March): p. 25-30.843. Corrada, M.M., et al., Association of body mass index and weight change with all-cause mortalityin the elderly. Am J Epidemiol, 2006. 163(10): p. 938-49.DRAFT <strong>Australian</strong> <strong>Dietary</strong> <strong>Guidelines</strong>- December 2011 271
844. Truswell, A.S., <strong>Dietary</strong> guidance for older <strong>Australian</strong>s. Nutr Diet, 2009. 66(4): p. 243-248.845. Strandberg, T.E. and K.H. Pitkala, Frailty in elderly people. Lancet, 2007. 369(9570): p. 1328-9.846. Wahlqvist ML, K.-B.A., Ross K, Setter T, Tienboon T., Growth and Ageing. In: Nutritrion andmetabolism, ed. M.I. Gibney M, Roche HM (eds)2001, London: The Nutrition Society.847. Leggo, M., et al., A quality improvement nutrition screening and intervention program available toHome and Community Care eligible clients. Nutr Diet, 2008. 65(2): p. 162-167.848. Banks, M., et al., Prevalence of malnutrition in adults in Queensland public hospitals andresidential aged care facilities. Nutr Diet, 2007. 64(3): p. 172-178.849. Nelson, M.E., et al., Physical activity and public health in older adults: recommendation from theAmerican College of Sports Medicine and the American Heart Association. Circulation, 2007.116(9): p. 1094-105.850. Commonwealth Department of <strong>Health</strong> and Ageing. Physical Activity <strong>Guidelines</strong>. 2010 [cited2011 30 March]; Available from:http://www.health.gov.au/internet/main/publishing.nsf/content/health-pubhlth-strateg-physact-guidelines.851. Gregg, E.W., M.A. Pereira, and C.J. Caspersen, Physical activity, falls, and fractures amongolder adults: a review of the epidemiologic evidence. J Am Geriatr Soc, 2000. 48(8): p. 883-893.852. Kujala, U.M., et al., Physical activity and osteoporotic hip fracture risk in men. Arch Intern Med,2000. 160(5): p. 705-8.853. Glass, T.A., et al., Population based study of social and productive activities as predictors ofsurvival among elderly Americans. Br Med J, 1999. 319(7208): p. 478.854. Cunningham, J. and D. Mackerras, Occasional Paper - Overweight and Obesity Indigenous<strong>Australian</strong>s 1994, 1998, <strong>Australian</strong> Bureau of Statistics: Canberra.855. O’Dea, K., Body fat distribution and health outcome in <strong>Australian</strong> Aborigines. Proc Nutr SocAust, 1987. 12: p. 56-65.856. Cunningham, J., et al., Perceived weight versus Body Mass Index among urban Aboriginal<strong>Australian</strong>s: do perceptions and measurements match? Aust N Z J Public <strong>Health</strong>, 2008. 32(2):p. 135-138.DRAFT <strong>Australian</strong> <strong>Dietary</strong> <strong>Guidelines</strong>- December 2011 272
857. <strong>Australian</strong> Institute of <strong>Health</strong> and Welfare, Aboriginal and Torres Strait Islander <strong>Health</strong>Performance Framework, 2008 report: Detailed analyses., 2008, <strong>Australian</strong> Institute of <strong>Health</strong>and Welfare: Canberra.858. Turrell, G., et al., Socioeconomic differences in food purchasing behaviour and suggestedimplications for diet-related health promotion. J Hum Nutr Diet, 2002. 15(5): p. 355-64.859. Maillot, M., et al., Nutrient-dense food groups have high energy costs: an econometric approachto nutrient profiling. J Nutr, 2007. 137(7): p. 1815.860. World <strong>Health</strong> Organization, International Code of Marketing of Breast-milk Substitutes, 1981,World <strong>Health</strong> Organization: Geneva.861. Ip, S., et al., Breastfeeding and maternal and infant health outcomes in developed countries. EvidRep Technol Assess (Full Rep), 2007(153): p. 1-186.862. American Academy of Pediatrics, Pediatric Nutrition Handbook. Fifth ed, ed. R.E.Kleinman2004, Washington DC: American Academy of Pediatrics. 1178.863. Prentice, A., Constituents of human milk. Food Nutr Bull, 1996. 17: p. 305-312.864. Centre for Epidemiology and Research, 2005-2006 Report on child health from the New SouthWales Population <strong>Health</strong>y Survey, N.D.o. <strong>Health</strong>, Editor 2008a, NSW Department of <strong>Health</strong>:Sydney.865. Akre, J., Infant feeding. The physiological basis. Bull World <strong>Health</strong> Organ, 1989(67 Suppl): p.1-108.866. Kramer, M. and R. Kakuma, Optimal duration of exclusive breastfeeding. Cochrane DatabaseSyst Rev, 2002(1): p. CD003517.867. Horta, B.L., et al., Evidence on the long-term effects of breastfeeding. Geneva: World <strong>Health</strong>Organization, 2007.868. Anderson, J., K. Malley, and R. Snell, Is 6 months still the best for exclusive breastfeeding andintroduction of solids? A literature review with consideration to the risk of the development ofallergies. Breastfeeding review: professional publication of the Nursing Mothers' Associationof Australia, 2009. 17(2): p. 23.869. Kramer, M.S., et al., Effects of prolonged and exclusive breastfeeding on child height, weight,adiposity, and blood pressure at age 6.5 y: evidence from a large randomized trial. Am J ClinNutr, 2007. 86(6): p. 1717.DRAFT <strong>Australian</strong> <strong>Dietary</strong> <strong>Guidelines</strong>- December 2011 273
870. Agostoni, C., et al., Complementary feeding: a commentary by the ESPGHAN Committee onNutrition. J Pediatr Gastroenterol Nutr, 2008. 46(1): p. 99.871. World <strong>Health</strong> Organization, Equity, social determinant and public health programmes, E. Blasand A.S. Kurup, Editors. 2010, World <strong>Health</strong> Organization: Geneva.872. Prescott, S.L., et al., The importance of early complementary feeding in the development of oraltolerance: concerns and controversies. Pediatr Allergy Immunol, 2008. 19(5): p. 375-80.873. Scott, J.A., et al., Predictors of the early introduction of solid foods in infants: results of a cohortstudy. BMC Pediatr, 2009. 9: p. 60.874. Britton, C., et al., Support for breastfeeding mothers. Cochrane Database Syst Rev, 2007(1):p. CD001141.875. Chung, M., et al., Interventions in primary care to promote breastfeeding: an evidence review forthe U.S. Preventive Services Task <strong>For</strong>ce. Ann Intern Med, 2008. 149(8): p. 565-82.876. Hector, D. and L. King, Interventions to encourage and support breastfeeding. NSW Public<strong>Health</strong> Bull, 2005. 16(3-4): p. 56-61.877. Landers, M., R. Hughes, and K. Graham, The Darling Downs Breastfeeding Study1998,Toowoomba: Darling Downs Public <strong>Health</strong> Unit.878. Scott, J. and C. Binns, Breastfeeding: are boys missing out? Birth (Berkeley, Calif.), 1999.26(4): p. 276.879. Scott, J.A., et al., Factors associated with the duration of breastfeeding amongst women in Perth,Australia. Acta Paediatr, 1999. 88(4): p. 416-21.880. Scott, J.A., et al., Psychosocial factors associated with the abandonment of breastfeeding prior tohospital discharge. Journal of Human Lactation, 2001. 17(1): p. 24.881. Simopoulos, A.P., J. Oliveira, and I.D. Desai, Behavioral and metabolic aspects of breastfeeding:international trends1995: S Karger AG.882. Kramer, M.S., et al., Breastfeeding and infant growth: biology or bias? Pediatrics, 2002. 110(2Pt 1): p. 343-7.883. Kramer, M.S., et al., Promotion of Breastfeeding Intervention Trial (PROBIT): a randomized trial inthe Republic of Belarus. J Am Med Assoc, 2001. 285(4): p. 413-20.884. Dewey, K.G., Growth characteristics of breast-fed compared to formula-fed infants. BiolNeonate, 1998. 74(2): p. 94-105.DRAFT <strong>Australian</strong> <strong>Dietary</strong> <strong>Guidelines</strong>- December 2011 274
885. Demmelmair, H., J. von Rosen, and B. Koletzko, Long-term consequences of early nutrition.Early Hum Dev, 2006. 82(8): p. 567-74.886. Harder, T., et al., Duration of breastfeeding and risk of overweight: a meta-analysis. Am JEpidemiol, 2005. 162(5): p. 397-403.887. White House Task <strong>For</strong>ce on Childhood Obesity, Solving the problem of childhood obesitywithin a generation: report to the President, 2010: Washington, DC.888. Kuti, O., A.B. Adeyemi, and A.T. Owolabi, Breast-feeding pattern and onset of menstruationamong Yoruba mothers of South-west Nigeria. European J. of Contraception and Reproductive<strong>Health</strong>care, 2007. 12(4): p. 335-339.889. Romero-Gutiérrez, G., et al., Actual use of the lactational amenorrhoea method. European J. ofContraception and Reproductive <strong>Health</strong>care, 2007. 12(4): p. 340-344.890. Türk, R., F. Terzio lu, and K. Ero lu, The Use of Lactational Amenorrhea as A Method of FamilyPlanning in Eastern Turkey and Influential Factors. The Journal of Midwifery & Women’s<strong>Health</strong>, 2010. 55(1): p. e1-e7.891. Ip, S., et al., A summary of the Agency for <strong>Health</strong>care Research and Quality's evidence report onbreastfeeding in developed countries. Breastfeed Med, 2009. 4 Suppl 1: p. S17-30.892. Oddy, W.H., The long-term effects of breastfeeding on asthma and atopic disease. Adv Exp MedBiol, 2009. 639: p. 237-51.893. McGuire, W. and M. Anthony, Donor human milk versus formula for preventing necrotisingenterocolitis in preterm infants: systematic review. Archives of Disease in Childhood Fetal andNeonatal Edition, 2003. 88(1): p. F11.894. Barclay, A.R., et al., Systematic review: the role of breastfeeding in the development of pediatricinflammatory bowel disease. J Pediatr, 2009. 155(3): p. 421-6.895. Quigley, M., et al., Breastfeeding is associated with improved child cognitive development:evidence from the UK Millennium Cohort Study. Journal of epidemiology and communityhealth, 2009. 63(Suppl 2): p. 8.896. Medeiros, A.P.M., J.T.L. Ferreira, and C.M. Felício, Correlation between feeding methods, nonnutritivesucking and orofacial behaviors. Pró-Fono Revista de Atualização Científica, 2009.21(4): p. 315-319.897. Allen, J. and D. Hector, Benefits of breastfeeding. N S W Public <strong>Health</strong> Bull, 2005. 16(3-4): p.42-6.DRAFT <strong>Australian</strong> <strong>Dietary</strong> <strong>Guidelines</strong>- December 2011 275
898. Sobhy, S.I. and N.A. Mohame, The effect of early initiation of breast feeding on the amount ofvaginal blood loss during the fourth stage of labor. J Egypt Public <strong>Health</strong> Assoc, 2004. 79(1-2):p. 1-12.899. Chantry, C.J., P. Auinger, and R.S. Byrd, Lactation among adolescent mothers and subsequentbone mineral density. Arch Pediatr Adolesc Med, 2004. 158(7): p. 650.900. Dursun, N., et al., Influence of duration of total breast-feeding on bone mineral density in aTurkish population: does the priority of risk factors differ from society to society? Osteoporosisinternational, 2006. 17(5): p. 651-655.901. National <strong>Health</strong> and Medical Research Council, * Title to be confirmed - Infant FeedingLiterature Review, 2011, Commonwealth of Australia: Canberra.902. House of Representatives Standing Committee on <strong>Health</strong> and Ageing, The Best Start -Report on the inquiry into the health benefits of breastfeeding, 2007, Commonwealth ofAustralia: Canberra.903. Kuan, L.W., et al., <strong>Health</strong> system factors contributing to breastfeeding success. Pediatrics, 1999.104(3): p. e28.904. Hall Moran, V., et al., A systematic review of the nature of support for breast-feeding adolescentmothers. Midwifery, 2007. 23(2): p. 157-71.905. Volpe, E.M. and M. Bear, Enhancing breastfeeding initiation in adolescent mothers through theBreastfeeding Educated and Supported Teen (BEST) Club. Journal of Human Lactation, 2000.16(3): p. 196.906. Cooklin, A.R., S.M. Donath, and L.H. Amir, Maternal employment and breastfeeding: resultsfrom the longitudinal study of <strong>Australian</strong> children. Acta Paediatr, 2008. 97(5): p. 620-3.907. Baxter, J., A.R. Cooklin, and J. Smith, Which mothers wean their babies prematurely from fullbreastfeeding? An <strong>Australian</strong> cohort study. Acta Paediatr, 2009. 98(8): p. 1274-1277.908. Amir, L.H. and S.M. Donath, Socioeconomic status and rates of breastfeeding in Australia:evidence from three recent national health surveys. Med J Aust, 2008. 189(5): p. 254-6.909. Labbok, M.H., D. Clark, and A.S. Goldman, Breastfeeding: maintaining an irreplaceableimmunological resource. Nat Rev Immunol, 2004. 4(7): p. 565-572.910. Scott, J., et al., Factors associated with breastfeeding at discharge and duration of breastfeeding.Journal of paediatrics and child health, 2001. 37(3): p. 254-261.DRAFT <strong>Australian</strong> <strong>Dietary</strong> <strong>Guidelines</strong>- December 2011 276
911. Duong, D.V., C.W. Binns, and A.H. Lee, Breast-feeding initiation and exclusive breast-feeding inrural Vietnam. Public <strong>Health</strong> Nutr, 2004. 7(6): p. 795-9.912. Kaewsarn, P. and W. Moyle, Breastfeeding duration of Thai women. Aust Coll Midwives Inc J,2000. 13(1): p. 21-6.913. Li, L., et al., Factors associated with the initiation and duration of breastfeeding by Chinesemothers in Perth, Western Australia. J Hum Lact, 2004. 20(2): p. 188-95.914. Utaka, H., et al., Breastfeeding experiences of Japanese women living in Perth, Australia.Breastfeed Rev, 2005. 13(2): p. 5-11.915. Xu, F., et al., Breastfeeding in China: a review. Int Breastfeed J, 2009. 4: p. 6.916. Binns, C.W., et al., Breastfeeding by Aboriginal mothers in Perth. Nutr Diet, 2006. 63(1): p. 8-14.917. World <strong>Health</strong> Organization, Acceptable medical reasons for use of breastmilk substitutes, 2009,World <strong>Health</strong> Organization,: Geneva.918. Guise, J.M., et al., The effectiveness of primary care-based interventions to promote breastfeeding:systematic evidence review and meta-analysis for the US Preventive Services Task <strong>For</strong>ce. Ann FamMed, 2003. 1(2): p. 70-8.919. Baby Friendly <strong>Health</strong> Initiative. The Ten Steps to Successful Breastfeeding. 2011 [cited 201129 March]; Available from: http://www.bfhi.org.au/text/bfhi_ten_steps.html.920. Binns, C. and J. Scott, Breastfeeding: reasons for starting, reasons for stopping and problemsalong the way. Breastfeed Rev, 2002. 10(2): p. 13–19.921. Australia New Zealand Food Authority, Food safety standards: costs and benefits. An analysisof the regulatory impact of the proposed national food safety reforms 1999, Canberra: AustraliaNew Zealand Food Authority.922. Fraser, A., Bacterial toxins, 2001, National Food Safety database.923. Australia New Zealand Food Authority, Date marking: user guide to Standard 1.2. 5, DateMarking of Packaged Food, 2001, Australia New Zealand Food Authority: Canberra.924. Käferstein, F. and M. Abdussalam, Food safety in the 21st century. Bull World <strong>Health</strong> Organ,1999. 77(4): p. 347.DRAFT <strong>Australian</strong> <strong>Dietary</strong> <strong>Guidelines</strong>- December 2011 277
925. Desmarchelier, P.M., Foodborne disease: emerging problems and solutions. Med J Aust, 1996.165(11-12): p. 668-71.926. Nyachuba, D.G., Foodborne illness: is it on the rise? Nutr Rev, 2010. 68(5): p. 257-269.927. Abelson, P., et al., The annual cost of foodborne illness in Australia2006: Department of <strong>Health</strong>and Ageing.928. Crerar, S.K., et al., Foodborne disease: current trends and future surveillance needs in Australia.Med J Aust, 1996. 165: p. 672-5.929. Redmond, E.C. and C.J. Griffith, Consumer food handling in the home: a review of food safetystudies. J Food Prot, 2003. 66(1): p. 130-61.930. Australia New Zealand Communicable Diseases Network, <strong>For</strong>tnightly notifiable diseasestables, 1999, Communicable Diseases Intelligence,.931. Redmond, E.C. and C.J. Griffith, The importance of hygiene in the domestic kitchen: implicationsfor preparation and storage of food and infant formula. Perspectives in Public <strong>Health</strong>, 2009.129(2): p. 69-76.932. State Government of Victoria, Food safety at home., Department of <strong>Health</strong> Victoria, Editor2011: Melbourne, Victoria.933. Merry, G., Food poisoning prevention1997: Palgrave Macmillan Australia.934. Sprenger, R.A., Hygiene for management: a text for food hygiene courses1998, South YorkshireUK Highfield.935. US Department of Agriculture, Kitchen companion: your safe food guide, 2008, USDepartment of Agriculture: Washington, DC. .936. Cates, S.C., et al., Pregnant women and listeriosis: preferred educational messages and deliverymechanisms. J Nutr Educ Behav, 2004. 36(3): p. 121-7.937. Almanza, B.A., et al., Clients' safe food-handling knowledge and risk behavior in a home-deliveredmeal program. J Am Diet Assoc, 2007. 107(5): p. 816-21.938. Kendall, P.A., V.V. Hillers, and L.C. Medeiros, Food safety guidance for older adults. Clin InfectDis, 2006. 42(9): p. 1298-304.939. National <strong>Health</strong> and Medical Research Council, Implementing the dietary guidelines for<strong>Australian</strong>s. Report on the subcommittee on nutrition education., 1989: Canberra.DRAFT <strong>Australian</strong> <strong>Dietary</strong> <strong>Guidelines</strong>- December 2011 278
940. Cashel K, L.J., NUTTAB89-Nutrient Data Table for Use in Australia [Floppy Disc], Departmentof Community Services and <strong>Health</strong>, Editor 1989: Canberra.941. National <strong>Health</strong> and Medical Research Council, Recommended <strong>Dietary</strong> Intakes for use inAustralia, 1991, Commonwealth of Australia: Canberra.942. National <strong>Health</strong> and Medical Research Council, The Core Food Groups: the scientific basis fordeveloping nutrition education tools, 1995, Commonwealth of Australia: Canberra.943. Sobolewski R, C.J., Mackerras D., Which <strong>Australian</strong> food composition database should I use?Nutr Dietetics, 2010. 67: p. 37-40.944. Food Standards Australia and New Zealand. AUSNUT 2007. 2007 September 2011September 2011]; Available from:http://www.foodstandards.gov.au/consumerinformation/ausnut2007/.945. National Public <strong>Health</strong> Partnership, National Aboriginal and Torres Strait Islander NutritionStrategy and Action Plan 2000-2010, 2001.946. Food Standards Australia and New Zealand. NUTTAB 2010. 2010 September 2011September 2011]; Available from:http://www.foodstandards.gov.au/consumerinformation/nuttab2010/.947. Denney-Wilson, E., M. Booth, and L. Baur, Development of the <strong>Australian</strong> standard definition ofchild/adolescent overweight and obesity. Nutr Diet, 2003. 60(2): p. 74-77.948. World <strong>Health</strong> Organization. Growth reference data for 5-19 years. 2007 [cited 2011 30March]; Available from: http://www.who.int/growthref/en/.949. WHO Statistical Information System. Children aged
954. Beyerlein, A., A.M. Toschke, and R. von Kries, Risk factors for childhood overweight: shift ofthe mean body mass index and shift of the upper percentiles: results from a cross-sectional study.Int J Obes (Lond), 2010. 34(4): p. 642-8.955. Lee, J.M., et al., Getting heavier, younger: trajectories of obesity over the life course. Int J Obes(Lond), 2010. 34(4): p. 614-23.956. McLennan, J., Obesity in children. Tackling a growing problem. Aust Fam Physician, 2004. 33(1-2): p. 33-6.957. Nambiar, S., et al., Validating the waist height ratio and developing centiles for use amongstchildren and adolescents. Acta Paediatr, 2009. 98(1): p. 148-152.958. Sanigorski, A., et al., Reducing unhealthy weight gain in children through community capacitybuilding:results of a quasi-experimental intervention program, Be Active <strong>Eat</strong> Well. Int J Obesity,2008. 32(7): p. 1060-1067.959. Rasmussen-Torvik, L.J., et al., Influence of waist on adiponectin and insulin sensitivity inadolescence. Obesity (Silver Spring), 2009. 17(1): p. 156-61.960. Valery, P.C., et al., Prevalence of obesity and metabolic syndrome in Indigenous <strong>Australian</strong> youths.Obes Rev, 2009. 10(3): p. 255-61.961. McCarthy, H.D., Body fat measurements in children as predictors for the metabolic syndrome:focus on waist circumference. Proc Nutr Soc, 2006. 65(04): p. 385-392.962. Watts, K., et al., Waist circumference predicts cardiovascular risk in young <strong>Australian</strong> children. JPaediatr Child <strong>Health</strong>, 2008. 44(12): p. 709-15.963. Eisenmann, J.C., et al., Fatness, fitness, and cardiovascular disease risk factors in children andadolescents. Med Sci Sports Exerc, 2007. 39(8): p. 1251.964. Telford, R.D., et al., Discordance of international adiposity classifications in <strong>Australian</strong> boys andgirls - the LOOK study. Ann Hum Biol, 2008. 35(3): p. 334-41.965. Dhaliwal, S.S. and T.A. Welborn, Central obesity and multivariable cardiovascular risk asassessed by the Framingham prediction scores. Am J Cardiol, 2009. 103(10): p. 1403-7.966. Welborn, T.A. and S.S. Dhaliwal, Preferred clinical measures of central obesity for predictingmortality. Eur J Clin Nutr, 2007. 61(12): p. 1373-9.967. <strong>Australian</strong> Government Department of <strong>Health</strong> and Ageing. National Physical Activity<strong>Guidelines</strong> for Adults. . 2005; Available from:DRAFT <strong>Australian</strong> <strong>Dietary</strong> <strong>Guidelines</strong>- December 2011 280
http://www.health.gov.au/internet/main/publishing.nsf/content/phd-physical-activity-adultspdf-cnt.htm968. Miller, Y.D. and D.W. Dunstan, The effectiveness of physical activity interventions for thetreatment of overweight and obesity and type 2 diabetes. J Sci Med Sport, 2004. 7(1 Suppl): p.52-9.969. Genkinger, J.M., et al., Fruit, vegetable, and antioxidant intake and all-cause, cancer, andcardiovascular disease mortality in a community-dwelling population in Washington County,Maryland. Am J Epidemiol, 2004. 160(12): p. 1223.970. Liu, Y., et al., Vegetables, fruit consumption and risk of lung cancer among middle-aged Japanesemen and women: JPHC study. Cancer Causes Control, 2004. 15(4): p. 349-357.971. Smith-Warner, S.A., et al., Fruits, vegetables and lung cancer: a pooled analysis of cohort studies.Int J Cancer, 2003. 107(6): p. 1001-11.972. Wright, M.E., et al., Intakes of fruit, vegetables, and specific botanical groups in relation to lungcancer risk in the NIH-AARP Diet and <strong>Health</strong> Study. Am J Epidemiol, 2008. 168(9): p. 1024-34.973. Boyle, P. and B. Levin, World Cancer Report 2008. World Cancer Report 2008, 2008.974. van Duijnhoven, F.J.B., et al., Fruit, vegetables, and colorectal cancer risk: the EuropeanProspective Investigation into Cancer and Nutrition. Am J Clin Nutr, 2009. 89(5): p. 1441.975. Lee, J.E., et al., Intakes of fruit, vegetables, and carotenoids and renal cell cancer risk: a pooledanalysis of 13 prospective studies. Cancer Epidemiol Biomarkers Prev, 2009. 18(6): p. 1730-9.976. Dolwick Grieb, S.M., et al., Food groups and renal cell carcinoma: results from a case-controlstudy. J Am Diet Assoc, 2009. 109(4): p. 656-67.977. Weikert, S., et al., Fruits and vegetables and renal cell carcinoma: findings from the Europeanprospective investigation into cancer and nutrition (EPIC). Int J Cancer 2006. 118(12): p. 3133-3139.978. Rashidkhani, B., et al., Fruits, vegetables and risk of renal cell carcinoma: a prospective study ofSwedish women. Int J Cancer 2005. 113(3): p. 451-5.979. Stewart, B.W. and P. Kleihues, eds. World Cancer Research Report. 2003, InternationalAgency for Research on Cancer: Lyon.980. Boffetta, P., et al., Fruit and vegetable intake and overall cancer risk in the European ProspectiveInvestigation into Cancer and Nutrition (EPIC). J Natl Cancer Inst, 2010. 102(8): p. 529.DRAFT <strong>Australian</strong> <strong>Dietary</strong> <strong>Guidelines</strong>- December 2011 281
981. Liang, W. and C.W. Binns, Fruit, vegetables, and colorectal cancer risk: the European ProspectiveInvestigation into Cancer and Nutrition. Am J Clin Nutr, 2009. 90(4): p. 1112.982. Miura, K., et al., Relation of vegetable, fruit, and meat intake to 7-year blood pressure change inmiddle-aged men: the Chicago Western Electric Study. Am J Epidemiol, 2004. 159(6): p. 572-80.983. Freedman, N.D., et al., Fruit and vegetable intake and head and neck cancer risk in a largeUnited States prospective cohort study. Int J Cancer, 2008. 122(10): p. 2330-6.984. Ahn, Y.S., et al., Increased platelet calcium in thrombosis and related disorders and its correctionby nifedipine. Thromb Res, 1987. 45(2): p. 135-43.985. Alberola, A., et al., Crystal structures and magnetic properties of a sterically encumbereddithiadiazolyl radical, 2,4,6-(F3C)3C6H2CNSSN. Chem Commun (Camb), 2005(37): p. 4726-8.986. Atkins, G.J., et al., Human osteoblasts are resistant to Apo2L/TRAIL-mediated apoptosis. Bone,2002. 31(4): p. 448-56.987. Sunny, L. and L. Sunny, A low fat diet rich in fruits and vegetables may reduce the risk ofdeveloping prostate cancer. Asian Pac J Cancer Prev, 2005. 6(4): p. 490-6.988. Ello-Martin, J.A., et al., <strong>Dietary</strong> energy density in the treatment of obesity: a year-long trialcomparing 2 weight-loss diets. Am J Clin Nutr, 2007. 85(6): p. 1465-1477.989. Whybrow, S., et al., Effects of added fruits and vegetables on dietary intakes and body weight inScottish adults. Br J Nutr, 2006. 95(3): p. 496-503.990. Vrieling, A., et al., Fruit and vegetable consumption and pancreatic cancer risk in the EuropeanProspective Investigation into Cancer and Nutrition. Int J Cancer, 2009. 124(8): p. 1926-1934.991. Larsson, S.C., L. Bergkvist, and A. Wolk, Fruit and vegetable consumption and incidence ofgastric cancer: a prospective study. Cancer Epidemiol Biomarkers Prev, 2006. 15(10): p. 1998-2001.992. Food And Agriculture Organization of the United Nations and the World <strong>Health</strong>Organization, International Conference on Nutrition: World Declaration and Plan of Action forNutrition., 1992, Food And Agriculture Organization of the United Nations and the World<strong>Health</strong> Organization: Geneva.993. Lester, I.H., Australia's food and nutrition, 1994, <strong>Australian</strong> Government Publishing Service:Canberra.994. PHAA, <strong>Health</strong> inequities policy, 2009, Public <strong>Health</strong> Association of Australia: Canberra.DRAFT <strong>Australian</strong> <strong>Dietary</strong> <strong>Guidelines</strong>- December 2011 282
995. Atlantis, E., E.H. Barnes, and K. Ball, Weight status and perception barriers to healthy physicalactivity and diet behavior. Int J Obes (Lond), 2008. 32(2): p. 343-52.996. Baker, E.A., et al., The role of race and poverty in access to foods that enable individuals toadhere to dietary guidelines. Prev Chronic Dis, 2006. 3(3): p. A76.997. Bodnar, L.M. and A.M. Siega-Riz, A diet quality index for pregnancy detects variation in diet anddifferences by sociodemographic factors. Public <strong>Health</strong> Nutr, 2002. 5(6): p. 801-9.998. Cassady, D., K.M. Jetter, and J. Culp, Is price a barrier to eating more fruits and vegetables forlow-income families? J Am Diet Assoc, 2007. 107(11): p. 1909-15.999. Giskes, K., et al., A multilevel study of socio-economic inequalities in food choice behaviour anddietary intake among the Dutch population: the GLOBE study. Public <strong>Health</strong> Nutr, 2006. 9(1): p.75-83.1000. Giskes, K., et al., Socioeconomic inequalities in food purchasing: the contribution of respondentperceivedand actual (objectively measured) price and availability of foods. Prev Med, 2007.45(1): p. 41-8.1001. Kolodinsky, J., et al., Knowledge of current dietary guidelines and food choice by college students:better eaters have higher knowledge of dietary guidance. Journal of the American DieteticAssociation, 2007. 107(8): p. 1409-13.1002. Inglis, V., K. Ball, and D. Crawford, Why do women of low socioeconomic status have poorerdietary behaviours than women of higher socioeconomic status? A qualitative exploration.Appetite, 2005. 45(3): p. 334-43.1003. McNaughton, S.A., et al., An index of diet and eating patterns is a valid measure of diet quality inan <strong>Australian</strong> population. J Nutr, 2008. 138(1): p. 86-93.1004. Nelson, M., K. Dick, and B. Holmes, Food budget standards and dietary adequacy in low-incomefamilies. Proc Nutr Soc, 2002. 61(4): p. 569-77.1005. Sanchez, A., et al., Patterns and correlates of physical activity and nutrition behaviors inadolescents. Am J Prev Med, 2007. 32(2): p. 124-30.1006. Story, M., D. Neumark-Sztainer, and S. French, Individual and environmental influences onadolescent eating behaviors. J Am Diet Assoc, 2002. 102(3 Suppl): p. S40-51.1007. Turrell, G. and A.M. Kavanagh, Socio-economic pathways to diet: modelling the associationbetween socio-economic position and food purchasing behaviour. Public <strong>Health</strong> Nutr, 2006. 9(3):p. 375-83.DRAFT <strong>Australian</strong> <strong>Dietary</strong> <strong>Guidelines</strong>- December 2011 283
1008. Turrell, G., et al., Measuring socio-economic position in dietary research: is choice of socioeconomicindicator important? Public <strong>Health</strong> Nutr, 2003. 6(2): p. 191-200.1009. Collins, C.E., A.F. Young, and A. Hodge, Diet quality is associated with higher nutrient intakeand self-rated health in mid-aged women. J Am Coll Nutr, 2008. 27(1): p. 146-57.1010. Dynesen, A.W., et al., Sociodemographic differences in dietary habits described by foodfrequency questions--results from Denmark. Eur J Clin Nutr, 2003. 57(12): p. 1586-97.1011. Hearty, A.P., et al., Relationship between attitudes towards healthy eating and dietary behaviour,lifestyle and demographic factors in a representative sample of Irish adults. Appetite, 2007.48(1): p. 1-11.1012. Oldroyd, J., et al., The effectiveness of nutrition interventions on dietary outcomes by relativesocial disadvantage: a systematic review. J Epidemiol Community <strong>Health</strong>, 2008. 62(7): p. 573-9.1013. Power, E.M., Determinants of healthy eating among low-income Canadians. Can J Public <strong>Health</strong>,2005. 96 Suppl 3: p. S37-42, S42-8.1014. Wong, K.C., et al., Availability, affordability and quality of a healthy food basket in Adelaide,South Australia. Nutr Diet, 2011. 68(1): p. 8-14.1015. Statistics, A.B.o., National Aboriginal and Torres Strait Islander Survey 1994, ABS, Editor 1994,Commonwealth of Australia: Canberra.1016. Andrieu, E., N. Darmon, and A. Drewnowski, Low-cost diets: more energy, fewer nutrients. EurJ Clin Nutr, 2006. 60(3): p. 434-6.1017. Centre for Epidemiology and Research, 2007 report on adult health from the New SouthWales Population <strong>Health</strong> Survey, 2008b, NSW Department of <strong>Health</strong>: Sydney, NSW.1018. Department of Human Services, Victorian Population <strong>Health</strong> Survey 2007, D.o.H. Services,Editor 2008: Melbourne.1019. Burns, C., A review of the literature describing the link between poverty, food insecurity andobesity with specific reference to Australia, P.A. Unit, Editor 2004, Victorian <strong>Health</strong> PromotionFoundation: Melbourne.1020. <strong>Australian</strong> Institute of <strong>Health</strong> and Welfare, Aboriginal and Torres Strait Islander <strong>Health</strong>Performance Framework, 2006 report: detailed analyses. , AIHW, Editor 2007, AIHW:Canberra.DRAFT <strong>Australian</strong> <strong>Dietary</strong> <strong>Guidelines</strong>- December 2011 284
1021. <strong>Australian</strong> Bureau of Statistics. Consumer Price Index, Australia, March 2011 - Cat. no. 6401.0.2011 [cited 1 June 2011]; Available from:http://www.abs.gov.au/AUSSTATS/abs@.nsf/DetailsPage/6401.0Mar%202011?OpenDocument.1022. Baghurst, K.I., Social status, nutrition and the cost of healthy eating, in <strong>Dietary</strong> <strong>Guidelines</strong> for<strong>Australian</strong> Adults, K.I. Baghurst and C. Binns, Editors. 2003, National <strong>Health</strong> and MedicalResearch Council: Canberra.1023. Sanchez-Villegas, A., et al., A systematic review of socioeconomic differences in food habits inEurope: consumption of cheese and milk. Eur J Clin Nutr, 2003. 57(8): p. 917-29.1024. Vos, T., The burden of disease and injury in Aboriginal and Torres Strait Islander peoples 2003.2007: University of Queensland Centre for Burden of Disease and Cost-Effectiveness.1025. Carson, B., T. Dunbar, and R.D. Chenhall, Social determinants of Indigenous health2007: Allen& Unwin Academic.1026. Torzillo, P.J., et al., The state of health hardware in Aboriginal communities in rural and remoteAustralia. Aust N Z J Public <strong>Health</strong>, 2008. 32(1): p. 7-11.1027. <strong>Australian</strong> Bureau of Statistics and <strong>Australian</strong> Institute of <strong>Health</strong> and Welfare, The healthand welfare of Australia's Aboriginal and Torres Strait Islander peoples 2008, <strong>Australian</strong> Instituteof <strong>Health</strong> and Welfare: Canberra.1028. Ruben, A.R. and A.C. Walker, Malnutrition among rural aboriginal children in the Top End ofthe Northern Territory. Med J Aust, 1995. 162(8): p. 400.1029. Sayers, S.M., et al., An <strong>Australian</strong> Aboriginal birth cohort: a unique resource for a life course studyof an Indigenous population. A study protocol. BMC Int <strong>Health</strong> Hum Rights, 2003. 3(1): p. 1.1030. Northern Territory Government, Department of <strong>Health</strong> and Community Services: AnnualReport 2006-2007, 2007, Department of <strong>Health</strong> and Community Services: Casuarina.1031. Northern Territory Government, Northern Territory Market Basket Survey 2008, 2008,Northern Territory Department of <strong>Health</strong> and Families: Darwin.1032. Mackerras, D.E., et al., Growth and morbidity in children in the Aboriginal birth cohort study: theurban-remote differential. Med J Aust, 2003. 178(2): p. 56-60.1033. Vanlint, S.J., et al., Vitamin D insufficiency in Aboriginal <strong>Australian</strong>s. Women, 2011. 100: p. 120.1034. Coyne, T. and I. Darnton-Hill, <strong>Australian</strong> Aborigines’ nutrition and changing disease patterns.New Doctor, 1979. 12: p. 32-7.DRAFT <strong>Australian</strong> <strong>Dietary</strong> <strong>Guidelines</strong>- December 2011 285
1035. Naughton, J.M., K. O'Dea, and A.J. Sinclair, Animal foods in traditional <strong>Australian</strong> aboriginaldiets: polyunsaturated and low in fat. Lipids, 1986. 21(11): p. 684-90.1036. O'Dea, K., Traditional diet and food preferences of <strong>Australian</strong> Aboriginal hunter-gatherers. PhilosTrans R Soc Lond B Biol Sci, 1991. 334(1270): p. 233-40; discussion 240-1.1037. Shannon, C., Acculturation: Aboriginal and Torres Strait Islander nutrition. Asia Pac J Clin Nutr,2002. 11 Suppl 3: p. S576-8.1038. Lee, A., Transition of <strong>Australian</strong> Aboriginal diet and nutritional health. . Wld Rev Nutr Diet,1996. 79: p. 1-52.1039. Booth, S. and A. Smith, Food security and poverty in Australia-challenges for dietitians. <strong>Australian</strong>Journal of Nutrition and Dietetics, 2001. 58(3): p. 150-156.1040. House of Representatives Standing Committee on Aboriginal and Torres Strait Islanderaffairs, Everybody's business: remote Aboriginal and Torres Strait community stores, 2009,Commonwealth of Australia: Canberra.1041. Leonard, D., R. Beilin, and M. Moran, Which way kaikai blo umi? Food and nutrition in theTorres Strait. Aust J Public <strong>Health</strong>, 1995. 19(6): p. 589-595.1042. Meedeniya, J., A. Smith, and P. Carter, Food supply in rural South Australia: a survey on foodcost, quality and variety. 2000.1043. Beaumont, S., Tasmanian food price, availability, and quality survey1998, Hobart: TasmaniaDepartment of Community and <strong>Health</strong> Services.1044. Bowcock, R., Kimberley Market Basket Survey. Derby: Kimberley Public <strong>Health</strong>, 1999.1045. Price, R., et al., Surveys of food availability, quality and price in rural and remote communities ofthe Alice Springs and Barkly district: April and May 1998. Darwin: Territory <strong>Health</strong> Service,1998.1046. Sullivan, H., M. Gracey, and V. Hevron, Food costs and nutrition of Aborigines in remote areasof northern Australia. Med J Aust, 1987. 147(7): p. 334-7.1047. Cutter, T., Nutrition and food habits of the central <strong>Australian</strong> Aboriginal. The nutrition ofAborigines in relation to the ecosystem of central Australia. Melbourne: CSIRO, 1978: p.63-70.1048. House of Representatives, Inquiry into community stores in remote Aboriginal and Torres StraitIslander communities 2009., 2009, Commonwealth of Australia: Canberra.DRAFT <strong>Australian</strong> <strong>Dietary</strong> <strong>Guidelines</strong>- December 2011 286
1049. Altman, J., Hunter-gatherers today: An Aboriginal economy in north Australia1987, Canberra:<strong>Australian</strong> Institute of Aboriginal Studies.1050. Devitt, J., Traditional Aboriginal preferences in a changed context. Central <strong>Australian</strong> RuralPractitioners’ Association Newsletter, 1991. 14: p. 38-41.1051. Rae, C., et al., The role of bushfoods in contemporary Aboriginal diets. Proc Nut Soc Aus, 1982.7: p. 45-9.1052. Browne, J., S. Laurence, and S. Thorpe, Acting on food insecurity in urban Aboriginal and TorresStrait Islander communities: Policy and practice interventions to improve local access and supply ofnutritious food, 2009, Victorian Aboriginal Community Controlled <strong>Health</strong> Organisation:Melbourne.1053. Guest, C.S. and K. O'Dea, Diabetes in aborigines and other <strong>Australian</strong> populations. Aust J Public<strong>Health</strong>, 1992. 16(4): p. 340-9.1054. Doyle, J., et al., Developing nutrition and physical activity guidelines and interventions forAboriginal and Torres Strait Islander communities, 2007, Onemda Vic <strong>Health</strong> Koori <strong>Health</strong>Research Unit and Department of Human Services.: Shepparton.1055. Clough, A.R., K. Rowley, and K. O'Dea, Kava use, dyslipidaemia and biomarkers of dietaryquality in Aboriginal people in Arnhem Land in the Northern Territory (NT), Australia. Eur J ClinNutr, 2004. 58(7): p. 1090-1093.1056. Chan, L.C.K., et al., Association between anthropometric measures of obesity and cardiovascularrisk markers in a self-selected group of indigenous <strong>Australian</strong>s. Journal of Cardiovascular Risk,2007. 14(4): p. 515.1057. Lee, A., Bonson (Bailey), APV., Yarmirr, D., Mathews, J., O'Dea, K. , Sustainability of asuccessful Aboriginal community-based nutrition project. Med J Aust 1995. 162: p. 632-635.1058. Rowley, K.G., et al., Effectiveness of a community directed ‘healthy lifestyle’program in a remote<strong>Australian</strong> Aboriginal community. Aust N Z J Public <strong>Health</strong>, 2000. 24(2): p. 136-144.1059. Johannes, R.E. and J.W. MacFarlane, Traditional fishing in the Torres Strait islands1991: CSIRODivision of Fisheries, Marine Laboratories.1060. Haynes D, M.-W.K., Kwan D., Trace metal concentrations in Torres Strait green turtle (Cheloniamydas) tissues, 1997–1998. , 2001, Report prepared for the Torres Strait RegionalAuthority.1061. Cancer Council NSW, NSW healthy food basket cost, availability and quality survey, 2007,Cancer Council NSW: Sydney.DRAFT <strong>Australian</strong> <strong>Dietary</strong> <strong>Guidelines</strong>- December 2011 287
DRAFT <strong>Australian</strong> <strong>Dietary</strong> <strong>Guidelines</strong>- December 2011 288