Literature Review: Pregnant and breastfeeding ... - Eat For Health
Literature Review: Pregnant and breastfeeding ... - Eat For Health
Literature Review: Pregnant and breastfeeding ... - Eat For Health
- No tags were found...

You also want an ePaper? Increase the reach of your titles
YUMPU automatically turns print PDFs into web optimized ePapers that Google loves.
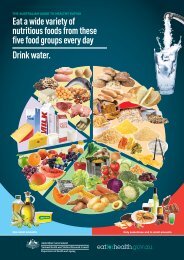
<strong>Literature</strong> <strong>Review</strong>: <strong>Pregnant</strong> <strong>and</strong><strong>breastfeeding</strong> womenPhilippa Middleton, Carmel Collins, Caroline Crowther, VickiFlenady, Maria Makrides, Alice Rumbold, Jo ZhouThe University of AdelaideAugust 2011
ContentsAbbreviations .................................................................................................................................................................................................................................... 6Systematic <strong>Review</strong> Methods ............................................................................................................................................................................................................... 8Pregnancy <strong>and</strong> <strong>breastfeeding</strong> dietary patterns .................................................................................................................................................................................. 11Included Studies .................................................................................................................................................................................................................................... 11Evidence Summaries .............................................................................................................................................................................................................................. 13Evidence Tables ..................................................................................................................................................................................................................................... 22References ............................................................................................................................................................................................................................................. 77Caffeine ........................................................................................................................................................................................................................................... 80Included Studies .................................................................................................................................................................................................................................... 80Evidence Summaries .............................................................................................................................................................................................................................. 81Evidence Tables ..................................................................................................................................................................................................................................... 84References ........................................................................................................................................................................................................................................... 105Cereal ............................................................................................................................................................................................................................................ 106Included Studies .................................................................................................................................................................................................................................. 106Evidence Summaries ............................................................................................................................................................................................................................ 107Evidence Table ..................................................................................................................................................................................................................................... 110References ........................................................................................................................................................................................................................................... 131Dairy Foods .................................................................................................................................................................................................................................... 133Included studies ................................................................................................................................................................................................................................... 133Evidence Summary .............................................................................................................................................................................................................................. 135Evidence Tables ................................................................................................................................................................................................................................... 141Dietary guidelines for pregnant <strong>and</strong> <strong>breastfeeding</strong> women: evidence report2
References ........................................................................................................................................................................................................................................... 196Dairy foods <strong>and</strong> eggs ...................................................................................................................................................................................................................... 199Included Studies .................................................................................................................................................................................................................................. 199Evidence summaries ............................................................................................................................................................................................................................ 200Evidence Tables ................................................................................................................................................................................................................................... 201References ........................................................................................................................................................................................................................................... 206Eggs ............................................................................................................................................................................................................................................... 207Included Studies .................................................................................................................................................................................................................................. 207Evidence Summaries ............................................................................................................................................................................................................................ 208Evidence Tables ................................................................................................................................................................................................................................... 210References ........................................................................................................................................................................................................................................... 224Fats <strong>and</strong> Oils .................................................................................................................................................................................................................................. 225Included Studies .................................................................................................................................................................................................................................. 225Evidence Summaries ............................................................................................................................................................................................................................ 226Evidence Tables ................................................................................................................................................................................................................................... 229References ........................................................................................................................................................................................................................................... 250Fish ................................................................................................................................................................................................................................................ 252Included Studies .................................................................................................................................................................................................................................. 252Evidence Summary .............................................................................................................................................................................................................................. 255Evidence Tables ................................................................................................................................................................................................................................... 263References ........................................................................................................................................................................................................................................... 342Fruit............................................................................................................................................................................................................................................... 347Included Studies .................................................................................................................................................................................................................................. 347Contents3
Evidence Summaries ............................................................................................................................................................................................................................ 348Evidence Tables ................................................................................................................................................................................................................................... 352References ........................................................................................................................................................................................................................................... 385Fruit & Vegetables ......................................................................................................................................................................................................................... 387Included Studies .................................................................................................................................................................................................................................. 387Evidence Summaries ............................................................................................................................................................................................................................ 388Evidence Tables ................................................................................................................................................................................................................................... 390References ........................................................................................................................................................................................................................................... 401Legumes ........................................................................................................................................................................................................................................ 402Included Studies .................................................................................................................................................................................................................................. 402Evidence Statements ........................................................................................................................................................................................................................... 403Evidence Tables ................................................................................................................................................................................................................................... 405References ........................................................................................................................................................................................................................................... 414Meat.............................................................................................................................................................................................................................................. 415Included Studies .................................................................................................................................................................................................................................. 415Evidence Summaries ............................................................................................................................................................................................................................ 417Evidence Tables ................................................................................................................................................................................................................................... 421References ........................................................................................................................................................................................................................................... 460Nuts <strong>and</strong> Seeds .............................................................................................................................................................................................................................. 463Included Studies .................................................................................................................................................................................................................................. 463Evidence Summaries ............................................................................................................................................................................................................................ 464Evidence Tables ................................................................................................................................................................................................................................... 465References ........................................................................................................................................................................................................................................... 475Dietary guidelines for pregnant <strong>and</strong> <strong>breastfeeding</strong> women: evidence report4
Salt / Sodium ................................................................................................................................................................................................................................. 476Included studies ................................................................................................................................................................................................................................... 476Evidence summaries ............................................................................................................................................................................................................................ 477Evidence Tables ................................................................................................................................................................................................................................... 478References ........................................................................................................................................................................................................................................... 482Sugar ............................................................................................................................................................................................................................................. 483Included Studies .................................................................................................................................................................................................................................. 483Evidence Summaries ............................................................................................................................................................................................................................ 484Evidence Tables ................................................................................................................................................................................................................................... 486References ........................................................................................................................................................................................................................................... 500Vegetables ..................................................................................................................................................................................................................................... 501Included Studies .................................................................................................................................................................................................................................. 501Evidence Statements ........................................................................................................................................................................................................................... 503Evidence Tables ................................................................................................................................................................................................................................... 508References ........................................................................................................................................................................................................................................... 544Excluded Studies ............................................................................................................................................................................................................................ 546References ........................................................................................................................................................................................................................................... 547Contents5
AbbreviationsAbbreviationAHEI-PBaPBMCBMICIDQI-PEPAFFQGAGDMGIGWGIGTIQRIUGRLALC-PUFAsLGAMDPAHPCAPnsPTBRCTsRRRSDSEMSESSGASHBGSIDsDietary guidelines for pregnant <strong>and</strong> <strong>breastfeeding</strong> women: evidence reportMeaningAlternate <strong>Health</strong>y <strong>Eat</strong>ing Index for PregnancyBenzo(a)pyreneBone Mineral ContentBody Mass IndexConfidence IntervalDiet Quality Index - PregnancyEicosapentaenoic acidFood frequency questionnaireGestational ageGestational diabetes mellitusGlycaemic indexGestational weight gainImpaired glucose toleranceInterquartile rangeIntrauterine growth restrictionLinoleic acidLong-chain polyunsaturated fatty acidsLarge for gestational ageMean DifferencePolycyclic aromatic hydrocarbonsPrincipal component factor analysisP value not significantPreterm birthR<strong>and</strong>omised controlled trialsReduced risk regressionSt<strong>and</strong>ard deviationSt<strong>and</strong>ard error of the meanSocio-economic statusSmall for gestational ageSex Hormone Binding GlobulinSudden infant death syndrome6
AbbreviationSRSSBMeaningSystematic reviewSugar sweetened beveragesAbbreviations7
Systematic <strong>Review</strong> MethodsIntroductionOur team from the University of Adelaide <strong>and</strong> the Women’s <strong>and</strong> Children’s <strong>Health</strong> Research Institute was contracted by NHMRC to comprehensively search forstudies reporting maternal <strong>and</strong> child outcomes resulting from, or associated with, maternal dietary patterns or specific foods or food groups. The team was led byPhilippa Middleton <strong>and</strong> comprises Professor Maria Makrides, Dr Carmel Collins, Dr Alice Rumbold, Dr Jo Zhou, Professor Caroline Crowther <strong>and</strong> Associate ProfessorVicki Flenady.QuestionsThe principal question addressed in this part of the systematic review was:What food groups consumed by pregnant <strong>and</strong> <strong>breastfeeding</strong> women, are associated with health outcomes for the mother <strong>and</strong>/or child?The groups included dietary patterns; fruit; vegetables; meat; dairy foods (cheese, milks <strong>and</strong> yoghurt); cereals/grains; legumes; nuts <strong>and</strong> seeds; fish; poultry; eggs;fat/oil; salt/sodium; sugars; <strong>and</strong> beverages.Search strategyWe searched the following databases <strong>and</strong> sources: Cochrane Library: issue 8, 2010 (published 4 August 2010); Other databases <strong>and</strong> sources to 31 July 2010 (including Pubmed, EMBASE, Austhealth, Google Scholar, Google, government <strong>and</strong> agency sources, otherdietary guidelines).These sources were searched from inception, with no date restrictions applied.We made extensive use of pearling <strong>and</strong> snowballing strategies on retrieved references.We did not apply language or publication status restrictions.Search terms included: Maternal diet, pregnancy diet, pregnancy intake, <strong>breastfeeding</strong> diet, <strong>breastfeeding</strong> intake alone <strong>and</strong> in combination with the food patterns <strong>and</strong> foodgroups specified above.We used Endnote to manage the references.Methods8
Inclusion <strong>and</strong> exclusion criteriaStudies needed to: be applicable to an Australian population be food-based not nutrient-based or assessing food supplements; <strong>and</strong> report maternal, fetal, infant, child (or child as an adult) health outcomes.Data extractionWe designed a data extraction sheet specifically for this project. <strong>For</strong> each included study, one person extracted descriptive information, study design, studyresults, potential risk of bias, <strong>and</strong> relevance of the study. At least one other person checked the data extraction.We used the NHMRC Hierarchies of Evidence to assign a level of evidence to each study, according to its particular hierarchy. Most included studies fell into theaetiology or intervention hierarchies.Risk of biasWe used the Cochrane risk of bias tool to criticially appraise r<strong>and</strong>omised controlled trials <strong>and</strong> adapted this tool <strong>and</strong> the set of NICE critical appraisal tools to assessother study designs such as cohort (aetiology) <strong>and</strong> case control studies.Each included study was assessed as being of low, low-moderate, moderate, moderate-high or high risk of bias.Structure of report<strong>For</strong> each food group, we provided: A table of included studies (alphabetical by first author’s surname with list of outcomes included in the study);An evidence summary arranged chronologically by outcome (e.g. pre-pregnancy, fetal, maternal antenatal, maternal postnatal, infant, child, child as anadult) <strong>and</strong> giving a quantitative results summary for each included study;Evidence tables of the detailed data extraction for each study, arranged alphabetically by first author’s surname); <strong>and</strong>References for that particular food group.Methods9
Included studiesWe included a total of 170 studies, with the following breakdown by food group (there is some overlap as some studies addressed multiple food groups <strong>and</strong>multiple outcomes):Food group Number of included studies Number of participantsDietary patterns 38 198,037Caffeine 13 42,710Cereal 20 27,201Dairy foods 45 91,797Dairy foods <strong>and</strong> eggs 4 3,918Eggs 14 17,892Fats <strong>and</strong> oils 18 68,398Fish 63 359,332Fruit 28 136,026Fruit & vegetables 10 91,247Legumes 9 17,640Meat 32 99,772Nuts <strong>and</strong> seeds 9 9,581Salt/sodium 4 6,275Sugar 14 20,286Vegetables 31 89,753Excluded studiesWe excluded 116 studies in the following categories: Narrative review 2 No perinatal outcomes 20 Nutrient, not food based 49 Supplements 21 Other 24.Dietary guidelines for pregnant <strong>and</strong> <strong>breastfeeding</strong> women: evidence report10
Pregnancy <strong>and</strong> <strong>breastfeeding</strong> dietary patternsIncluded StudiesStudyOutcomes1. Aaltonen 2008 Birthweight, birth length, head circumference at birth, infant blood pressure at 6 months, infant heart rate at 6 months, infantweight, length <strong>and</strong> head circumference at 6 months2. Brantsaeter 2009 Pre-eclampsia3. Chatzi 2008 Gestational age at birth, birthweight; child persistent wheeze, atopic wheeze, atopy (all at 6.5 years)4. Cole 2009 Child bone mass, lean mass, fat mass (all at 9 years)5. De Batlle 2008 Asthma, wheeze, rhinitis, sneezing, itchy-watery eyes (all at 6-7 years)6. Duarte-Salles 2010 Birthweight7. Hattevig 1989 Eczema, asthma, other atopic/allergic manifestations; Infant weight gain; maternal return to pre-pregnancy weight within 3months after birth; <strong>breastfeeding</strong>8. Haugen 2008 Preterm birth9. Haugen 2005 Fetal ductus shunting, fetal liver blood flow10. Hill 2005 Infant colic11. Kinnunen 2007a Achieving recommended dietary pattern; gestational weight gain, high birthweight, low birthweight12. Kinnunen 2007b Postpartum weight retention13. Knudsen 2008 SGA, birthweight14. Koebnick 2004 Vitamin B-12 deficiency (maternal)15. Koebnick 2001 Folate status during pregnancy16. Lange 2010 Child recurrent wheeze, asthma, eczema, lower respiratory tract infection, atopy (all at 3 years)17. Laraia 2007 “Pre-pregnancy BMI”18. Mikkelsen 2008 Preterm birth19. Moses 2009a Women’s need for insulin, birth outcomes20. North 2000 Child hypospadias21. Olafsdottir 2006 Gestational weight gain22. Radesky 2008 IGT, GDM23. Rifas-Shiman 2009 Pre-eclampsia, GDM, IGT, blood glucose, SGA, LGA, gestational weight gain24. Robinson 2007 Infant diet25. Rodriguez-Bernal FGR (weight, length, head circumference at birt6h)201026. Ross 1996 Childhood leukemiaDietary guidelines for pregnant <strong>and</strong> <strong>breastfeeding</strong> women: DRAFT evidence report11
27. Shaheen 2009 Wheeze at 6 months (transient, later onset, persistent); wheezing at 3.5 years; eczema (at 2.5 <strong>and</strong> 7.5 years); IgE at 7 years; hayfever at 7.5 years, bronchial responsiveness at 8-9 years; lung function (FEV1 <strong>and</strong> FVC) at 8-9 years28. Siega-Riz 2001 Preterm birth29. Stuebe 2009 Gestational weight gain30. Thompson 2010 SGA31. Tieu 2008 Birthweight, LGA, fasting blood glucose, gestational weight gain, GDM32. Uusitalo 2009 Gestational weight gain33. Vujkovic 2009 Spina bifida34. Vujkovic 2007 Cleft palate, postpartum maternal BMI35. Wolff 1995 Birthweight36. Xiang 2005 Breastmilk composition, infant growth37. Zeiger 1989 Allergy (various outcomes) ; birthweight; weight <strong>and</strong> height at 4,12 <strong>and</strong> 24 months; maternal third trimester weight gain38. Zhang 2006 GDMDietary guidelines for pregnant <strong>and</strong> <strong>breastfeeding</strong> women: evidence report12
Evidence SummariesMother1. In a Norwegian cohort study: significantly reduced rates of pre-eclampsia were associated witho a high or medium ‘vegetable’ pattern compared with a low ‘vegetable’ pattern (aOR 0.72 95% CI0.62 to 0.85 high; aOR 0.84 95% CI 0.73 to 0.97 medium) significantly increased rates of pre-eclampsia were associated witho a high ‘processed food’ pattern compared with a low ‘processed food’ pattern (aOR 1.21 95% CI1.03 to 1.41) no significant differences in pre-eclampsia rates were seen betweeno low <strong>and</strong> medium ‘processed food’ patterns (aOR 1.06 95% CI 0.91 to 1.23)o low <strong>and</strong> medium ‘potato <strong>and</strong> fish’ pattern (aOR 0.99 95% CI 0.86 to 1.15)o low <strong>and</strong> high ‘potato <strong>and</strong> fish’ pattern (aOR 1.00 95% CI 0.84 to 1.18)o low <strong>and</strong> medium ‘cakes <strong>and</strong> sweets’ pattern (aOR 1.00 95% CI 0.86 to 1.15)o low <strong>and</strong> high ‘cakes <strong>and</strong> sweets’ pattern (aOR 0.90 95% CI 0.76 to 1.06)2. In a US cohort study, significantly reduced rates of pre-eclampsia in the 2 nd trimester were associated withhigher diet quality (AHEI-P) although a significant reduction was not apparent in the 1 st trimester: 1 st trimester – aOR 0.96 95% CI 0.84 to 1.10 2 nd trimester – aOR 0.87 95% CI 0.76 to 1.003. In a US cohort study, women who were obese (but not overweight) before pregnancy were significantlymore likely to have a poorer quality diet (less grain, fruit <strong>and</strong> vegetables, more fat) during pregnancycompared with normal weight women: DQI-P score 53.3 [SD 12.0] for obese women; 55.3 [SD 11.3] for normal weight women (p < 0.05)4. In a retrospective cohort study from Finl<strong>and</strong>, pregnant women: gained more kilograms a week with diets high in ‘fast food’ (1.3 kg) <strong>and</strong> ‘traditional bread’ (0.9 kg) (p fortrend = < 0.0001 <strong>and</strong> 0.002 respectively); gained less weight per week (-0.7 kg) with a diet high in ‘alcohol <strong>and</strong> butter’ (p for trend = 0.014); <strong>and</strong> showed no significant differences in weight gain with ‘healthy’; ‘traditional meats’; ‘low fat’; <strong>and</strong>‘coffee’.5. In a US cohort study, neither excessive or inadequate weight gain during pregnancy were associated withdietary quality (as assessed by AHEI-P (per 5 points): Excessive weight gain - aOR 0.99 95% CI 0.94 to 1.04 (1 st trimester) <strong>and</strong> aOR 0.99 95% CI 0.94 to 1.04 (2 ndtrimester)Pregnancy <strong>and</strong> Breastfeeding Dietary PatternsN Level References23,423 II Brantsaeter 20091777 II Rifas-Shiman 20092394 II Laraia 20073360 III-3 Uusitalo 20091777 II Rifas-Shiman 200913
Inadequate weight gain - aOR 0.95 95% CI 0.88 to 1.02 (1 st trimester) <strong>and</strong> aOR 0.99 95% CI 0.92 to 1.07 (2 ndtrimester)In this study, no significant associations were seen between AHEI-P scores <strong>and</strong> gestational diabetes mellitus: AHEI-P score (per 5 points)aOR 0.97 95% CI 0.87 to 1.08 (1 st trimester)aOR 0.98 95% CI 0.87 to 1.09) (2 nd trimester)6. In a cohort study from Icel<strong>and</strong>, eating more in early pregnancy was not significantly associated with either atleast optimal gestational weight gain or excessive gestational weight gain, but eating more in late pregnancywas associated with significant increases in at least optimal gestational weight gain (aOR 3.32 95% CI 1.81to 6.09) <strong>and</strong> excessive gestational weight gain (aOR 2.04 95% CI 1.17 to 3.58)7. In a US cohort study, a vegetarian diet was associated with lower odds of excessive gestational weight gainin the first trimester (aOR 0.45 95% CI 0.27 to 0.76) but not the second trimester (aOR 0.70 95% CI 0.40 to1.20)8. In a nonr<strong>and</strong>omised intervention study from Finl<strong>and</strong>, meal pattern advice <strong>and</strong> advice to consume plenty offruits, vegetables <strong>and</strong> high fibre bread <strong>and</strong> to restrict high sugar snacks in late pregnancy was not associatedwith excessive gestational weight gain (aOR 1.82 95% CI 0.65 to 5.14)9. In a US RCT, women allocated to a dietary avoidance regimen during pregnancy compared with womenwith a st<strong>and</strong>ard diet, showed a significant reduction in third trimester weight gain (MD -1.24 kg 95% CI -1.30 to -1.18)10. In a US cohort study, diagnosis of GDM, or a diagnosis of either GDM or IGT, were not associated with: A western diet during pregnancy (red <strong>and</strong> processed meats, sugar-sweetened beverages, French fries, highfatdairy products, desserts, butter <strong>and</strong> refined grains); p for trend across quartiles for GDM = 0.80; A prudent diet during pregnancy (high in vegetables, fruit, legumes, fish, poultry, eggs, salad dressing, <strong>and</strong>whole grains); p for trend across quartiles for GDM = 0.3511. In a US cohort study, diagnosis of GDM wasNegatively associated with: A prudent pre-pregnancy <strong>and</strong> pregnancy (fruits, green leafy vegetables, poultry <strong>and</strong> fish): p for trend acrossquintiles = 0.017 (adjusted)Positively associated with: a western pre-pregnancy <strong>and</strong> pregnancy diet (red meat, processed meat, refined grain products, sweets,desserts, French fries <strong>and</strong> pizzas); p for trend across quintiles = 0.0011 (adjusted)No longer positively associated with: a western pre-pregnancy <strong>and</strong> pregnancy diet when adjusted for red <strong>and</strong> processed meat consumption (p fortrend across quintiles = 0.697 (adjusted)495 II Olafsdottir 20061338 II Stuebe 2009132 III-2 Kinnunen 2007a98 II(RCT)Zeiger 19891773 II Radesky 200813,110 II Zhang 2006Dietary guidelines for pregnant <strong>and</strong> <strong>breastfeeding</strong> women: evidence report14
12. In a Cochrane systematic review of RCTs one RCT of 63 women showed no significant differences in diagnosis of women with gestational diabetesmellitus between the low <strong>and</strong> high glycaemic index groups: RR 0.31 95% CI 0.01 to 7.40 fasting blood glucose concentrations were significantly lower in the low glycaemic index group: MD -0.28mmol/L 95% CI -0.53 to -0.02 (two trials, 82 women) no significant difference was seen for maternal weight gain during pregnancy: MD -3.33 kg 95% CI -12.73 to6.08 (two trials, 82 women)13. In an Australian RCT, fewer women with gestational diabetes mellitus in a low glycaemic index (GI) diet group required insulin:9/31 women in low GI group v 19/32 women in the high GI group (p = 0.023); <strong>and</strong> after the 19 women in the high GI group were switched to a low GI diet this became 9/31 women in lowGI group v 10/32 women in the high GI group (pns)14. In a German cohort study, compared with women with a western diet during pregnancy (high in refinedgrain <strong>and</strong> meat): Women with a ovo-lacto vegetarian diet during pregnancy had significantly lower serum B-12concentrations during pregnancy; p < 0.001; Women with a low meat diet during pregnancy also had significantly lower serum B-12 concentrationsduring pregnancy: p = 0.0515. In a German cohort study, compared with women with a western diet during pregnancy (high in refinedgrain <strong>and</strong> meat): Women with a ovo-lacto vegetarian diet during pregnancy had significantly higher rates of folate deficiencyduring pregnancy; aOR 0.10 95% CI 0.01 to 0.56; But nos significant difference was seen for women with a low meat diet during pregnancy; aOR 0.52 95% CI0.20 to 1.34Fetal16. In a UK cohort study, Reduced fetal ductus venous shunting was significantly associated with an ‘imprudent’ diet (high intakes ofcrisps/chips, sugar, confectionery, white bread, soft drinks, red meat <strong>and</strong> low intakes of fruit/vegetables,rice/pasta, yoghurt <strong>and</strong> wholemeal bread) (p = 0.04); but not with a ‘Western’ diet (with additional highintakes of fruit <strong>and</strong> vegetables) or a ‘vegetarian’ diet (vegetarian foods, confectionery, snack foods). Increased fetal liver blood flow was significantly associated with an ‘imprudent’ diet (see above) - p = 0.02;but not with a ‘Western’ diet (with additional high intakes of fruit <strong>and</strong> vegetables) or a ‘vegetarian diet(vegetarian foods, confectionery, snack foods).Congenital Anomalies82 I Tieu 200863 II Moses 2009a109 II Koebnick 2004109 II Koebnick 2001381pregnanciesII Haugen 2005Pregnancy <strong>and</strong> Breastfeeding Dietary Patterns15
17. In a case control study from the Netherl<strong>and</strong>s, increased risk of cleft lip or palate or both was associatedwith a western diet (high in meat, pizza, legumes <strong>and</strong> potatoes <strong>and</strong> low in fruit) during pregnancy, but nodifferences were seen for a prudent diet during pregnancy Western diet: aOR 1.7 95% CI 1.0 to 3.0 (cleft lip/palate); aOR 1.8 95% CI 1.0 to 2.9 (cleft palate only)18. In a case control study from the Netherl<strong>and</strong>s, a reduced risk of spina bifida was associated with aMediterranean diet (high intakes of vegetables, fruit, legumes, vegetable oil, cereal products, alcohol <strong>and</strong>fish; <strong>and</strong> low intake of potatoes, sugar <strong>and</strong> confectionery, sauces <strong>and</strong> condiments) in a reduced rankregression analysis: aOR 3.5 95% CI 1.5 to 8.2 (lowest quartile v highest quartile for Mediterranean diet)19. In a prospective cohort study, hypospadias in male offspring was associated with a maternal vegetarian dietduring pregnancy, compared with women who consumed an omnivorous diet during pregnancy: OR 3.5395% CI 1.56 to 7.98Birth Outcomes20. In a Danish cohort study, a Mediterranean diet (consumption of fish twice a week or more, intake of olive orcanola oil, high consumption of fruits <strong>and</strong> vegetables (5 a day or more), meat (other than poultry or fish) atmost twice a week, <strong>and</strong> at most 2 cups of coffee a day) was not associated with decreased preterm birthexcept for reduced early preterm birth (< 35 weeks) with the highest level of adherence to a Mediterrane<strong>and</strong>iet compared with the lowest: aOR 0.28 95% CI 0.11 to 0.76 (5 v 0 criteria). No significant differences were seen for preterm birth < 37 weeks for 5 compared with 0 criteria; or forpreterm birth < 37 weeks when 5 criteria were compared with 1-4 criteria for a Mediterranean diet.21. In a Norwegian cohort study, a Mediterranean diet (2 or more serves of fish per week, 5 or morevegetable/fruit serves per day, use olive oil or canola oil for cooking <strong>and</strong> dressings, eat no more than 2serves of meat per week <strong>and</strong> drink no more than 2 cups of coffee per day) was not associated withdecreased preterm birth (overall, early or late) when 5 criteria were compared with one, or 5 comparedwith 1-4 criteria22. In a cohort study from the USA, women with a less optimal compared with an optimal meal pattern duringpregnancy ( three meals <strong>and</strong> two or more snacks a day) demonstrated no difference in preterm birth rates(aOR 1.30 95% CI 0.96 to 1.76) but did show a higher rate of premature rupture of the membranes (aOR1.87 95% CI 1.02 to 3.43)23. In a Danish cohort study:o significantly reduced rates of SGA (z-score below 2.5 th percentile for the respective gender <strong>and</strong> GA) wereassociated witho a ‘health conscious’ diet compared with a ‘western’ diet (aOR 0.74 95% CI 0.64 to 0.86)o an ‘intermediate’ diet compared with a ‘western’ diet (aOR 0.68 95% CI 0.55 to 0.84)o no significant differences in birthweight (g, mean [SD]) were seen between any of the dietary patternsDietary guidelines for pregnant <strong>and</strong> <strong>breastfeeding</strong> women: evidence report481 III-3 Vujkovic 2007131 III-3 Vujkovic 20097928boysII North 200035,530 II Mikkelsen 200840,817 II Haugen 20082065 II Siega-Riz 200144,162 II Knudsen 200816
o ‘western’ diet 3583 [525]o ‘intermediate’ diet 3623 [490]o ‘health conscious’ diet 3616 [486], p > 0.0524. In a US cohort study, SGA (< 10 th percentile) was not associated with diet quality during pregnancy in eitherthe 1 st or 2 nd trimester: AHEI-P score (per 5 points) – aOR 0.92 95% CI 0.82 to 1.02 1 st trimester; aOR 1.00 95% CI 0.90 to 1.10 2 ndtrimester25. In a Spanish cohort study, reduced risk of fetal growth restriction (customised; 80% below the lower limitof the CI) was associated with higher AHEI-P scores for weight (p = 0.001 for trend across AHEI-P quintiles)but not length (p = 0.538) or head circumference (p = 0.070)26. In a New Zeal<strong>and</strong> case-control study, reduced risk of SGA (≤ 10 th percentile for sex <strong>and</strong> gestation) wassignificantly associated with a ‘traditional’ diet (meat (lamb in particular), potatoes, carrots (<strong>and</strong> other rootvegetables), peas, gravy <strong>and</strong> meat dishes such as cottage pie, apples/pears, citrus fruit, kiwifruit/feijoas,bananas, green vegetables, maize, dairy food, yoghurt <strong>and</strong> water); OR 0.79 95% CI 0.70 to 0.89aOR 0.86 95% CI 0.75 to 0.99but not with a ‘junk’ diet (icecream, sweet biscuits, scones, cakes, sweetened cereal, crisps, pies, lollies,chocolate bars, iceblocks <strong>and</strong> milo (chocolate energy drink) or a ‘fusion’ diet (fruits, fried rice/noodles, boiledrice/pasta, fish/shellfish, milk <strong>and</strong> low intake for tea/coffee, sherry/wine <strong>and</strong> hard cheeses): FusionOR 1.07 95% CI 0.95 to 1.21aOR 1.02 95% CI 0.85 to 1.21JunkOR 0.97 95% CI 0.70 to 1.09aOR 1.01 95% CI 0.88 to 1.1727. In a Spanish cohort study, no significant differences were seen between a high level of adherence to aMediterranean diet by women during pregnancy <strong>and</strong> gestational age (p = 0.477) or birthweight (p = 0.906).28. In an Australian RCT, neither birth centiles or ponderal index were significantly different for women withgestational diabetes who adopted a low or high glycaemic (GI) index diet during pregnancy: Birth centilesLow GI: 46.3 [SEM 5.0] v high GI: 54.3 [4.8], p = 0.25 Ponderal indexLow GI: 2.7 [SEM 0.05] v high GI: 2.6 [SEM 0.04], p = 0.121777 II Rifas-Shiman 2009787 II Rodriguez-Bernal 20101714children(844bornSGA)III-3 Thompson 2010507 II Chatzi 200863 II Moses 2009aPregnancy <strong>and</strong> Breastfeeding Dietary Patterns17
Three women (over both groups) had LGA (≥ 90 th centile) babies <strong>and</strong> two women in the low GI group had SGA(≤ 10 th centile) babies29. In a Spanish cohort study a diet high in benzo(a)pyrene (BaP) (from processed/cured meats, nuts <strong>and</strong> fats <strong>and</strong> oils) during the firsttrimester was significantly associated with lower birthweight (mean adjusted birthweight 142.73 g lowerfor the fourth compared with the first quartile of dietary BaP (p < 0.05)); but BaP in the third trimester was not significantly associated with birthweight; <strong>and</strong> total polycyclicaromatic hydrocarbon (PAH) dietary intake (from high consumption of shellfish, processed/cured meats,milk/yoghurt, bread, sweet dairy foods, alcoholic beverages <strong>and</strong> sugar <strong>and</strong> BaP) in either first or thirdtrimesters was not significantly associated with birthweight30. In a Cochrane systematic review, there were significantly fewer large for gestational age infants when women adopted a low GI diet: RR 0.09,95% CI 0.01 to 0.69 (one trial of 62 women); No significant difference in ponderal index: mean difference (MD) -0.18 95% CI -0.32 to -0.04 (two trials; 82women); Effect for women on the LGI diet on birthweight were not conclusive under a r<strong>and</strong>om-effects model (twotrials; WMD -527.64 g, 95% CI -1119.20 to 63.92)31. In a US cohort study, large for gestational age was not associated with diet quality (AHEI-P) duringpregnancy in either the 1 st or 2 nd trimester: aOR 0.95 95% CI 0.89 to 1.02 (1st trimester) aOR 0.99 95% CI 0.92 to 1.07 (2 nd trimester)32. In a nonr<strong>and</strong>omised intervention study from Finl<strong>and</strong>, meal pattern advice <strong>and</strong> advice to consume plenty offruits, vegetables <strong>and</strong> high fibre bread <strong>and</strong> to restrict high sugar snacks in late pregnancy was associatedwith significantly decreased rates of high birthweight (≥ 4000 g); p = 0.006) but not low birthweight (< 2500g)33. In a Finnish RCT, compared with a control group, children of the women in the dietary advice/healthy dietgroup did not show significant differences for: Birthweight, birth length or head circumference at birth; Infant blood pressure, infant heart rate, infant weight, length or head circumference at six months34. In a US cohort study, birthweight was positively associated with nutrient dense (plenty of fruit <strong>and</strong>vegetables <strong>and</strong> low fat dairy foods) <strong>and</strong> protein rich (low fat meat, processed meats <strong>and</strong> high fat dairyfoods) maternal diet patterns <strong>and</strong> negatively associated with nutrient dilute (high calorie snacks <strong>and</strong>desserts) <strong>and</strong> transitional (high in fats <strong>and</strong> oils, breads <strong>and</strong> cereals, low in vitamin A <strong>and</strong> C rich vegetables,high fat meat <strong>and</strong> sugar) maternal diet patterns657 II Duarte-Salles 2010107 I Tieu 20081777 II Rifas-Shiman 2009132 III-2 Kinnunen 2007a171 II Aaltonen 2008549women<strong>and</strong>their778II Wolff 1995Dietary guidelines for pregnant <strong>and</strong> <strong>breastfeeding</strong> women: evidence report18
Breastfeeding35. In a nonr<strong>and</strong>omised comparison from Sweden, full <strong>breastfeeding</strong> rates were not significantly differentbetween a maternal diet group (no eggs, cow’s milk or fish from birth to three months) <strong>and</strong> the no dietgroup: > 3 months: 59% versus 68% Up to 6 months: 43% versus 36%36. In a cohort study from China <strong>and</strong> Sweden, breastmilk of the Chinese women was less balanced (significantlyricher in LA <strong>and</strong> lower in EPA <strong>and</strong> DHA) than Swedish women (who consumed higher rates of bread, potato,pasta, milk <strong>and</strong> cheese); <strong>and</strong> no differences were seen for infant growthMaternal Postpartum Follow-Up37. In a case-control study from the Netherl<strong>and</strong>s, increased maternal postpartum BMI at 14 months wassignificantly associated with a western diet (high in meat, pizza, legumes <strong>and</strong> potatoes <strong>and</strong> low in fruit) butno BMI differences were seen across the tertiles of a prudent diet (high intake of fish, garlic, nuts, <strong>and</strong>vegetables): Western diet – p for trend 0.01 Prudent diet – p for trend 0.7538. In a nonr<strong>and</strong>omised comparison from Sweden, significantly more women in a diet group (no eggs, cows’milk or fish from birth to three months) returned to their pre-pregnancy weight in three months comparedwith the no diet group: 66% versus 20%, p < 0.00139. In a nonr<strong>and</strong>omised intervention study from Finl<strong>and</strong>, meal pattern advice <strong>and</strong> advice to consume plenty offruits, vegetables <strong>and</strong> high fibre bread <strong>and</strong> to restrict high sugar snacks after birth was associated withsignificantly more women not retaining extra weight gained during gestation (aOR 3.89 95% CI 1.16 to13.04) at 10 months postpartumChildhood Asthma, Eczema <strong>and</strong> Other Allergy Outcomes40. In an Australian RCT, exclusively breastfed infants whose mothers consumed a low allergen diet showedsignificantly greater improvement in colic symptoms compared with mothers whose diets contained thoseallergenic foods: ARR 0.37 95% CI 0.18 to 0.5641. In a US RCT, women (third trimester <strong>and</strong> while <strong>breastfeeding</strong>) <strong>and</strong> their infants (when <strong>breastfeeding</strong> wassupplemented or stopped) allocated to a dietary avoidance regimen compared with women <strong>and</strong> infantswith a st<strong>and</strong>ard diet, showed: No significant differences in birthweight, infant weight or height at 4, 12 <strong>and</strong> 24 months; Lower mean third trimester weight gain: MD -1.24 kg 95% CI -1.30 to -1.18; Lower rates of any atopic disorder at 12 months, but not at 4 or 24 months;children115 III-2 Hattevig 198957 II Xiang 2005164 III-3 Vujkovic 2007115 III-2 Hattevig 198992 III-2 Kinnunen 2007b107 II Hill 2005379 II Zeiger 1989Pregnancy <strong>and</strong> Breastfeeding Dietary Patterns19
No significant difference in asthma at 4, 12 <strong>and</strong> 24 months;Lower food allergy at 12 <strong>and</strong> 24 months , p = 0.007 <strong>and</strong> 0.005 respectively;Cumulative reduction in food allergy at 4 years, with similar current prevalence;No significant differences at 7 years for food allergy, atopic dermatitis, allergic rhinitis, asthma, anyatopic disease, lung function or aeroallergen sensitisations42. In a nonr<strong>and</strong>omised comparison from Sweden, children whose mothers had a diet free from eggs, cow’smilk or fish from birth to three months were significantly less likely to develop eczema up to six monthscompared with the no diet group, but this effect was not sustained from nine to 18 months115 III-2 Hattevig 1989No significant differences between the diet <strong>and</strong> no diet groups were seen for asthma <strong>and</strong> adverse reactions ofinfants to eggs, cows’ milk <strong>and</strong> fish up to 18 months of age43. In a US cohort study, recurrent wheeze, asthma, eczema, or respiratory infection in children at 3 years wasnot associated with either a high maternal adherence to a Mediterranean diet (high dairy, fish, fruit,legumes, nuts, unsaturated fats, vegetables, <strong>and</strong> whole grains <strong>and</strong> low red <strong>and</strong> processed meats); or AHEI-P;or a prudent diet (fruits, tomatoes, cabbage, leafy green vegetables, poultry, fish).44. In a UK cohort study, wheeze in children at 6 months <strong>and</strong> 3.5 years, eczema at 2.5 years <strong>and</strong> 7.5 years,hay fever at 7.5 years, bronchial responsiveness <strong>and</strong> lung function at 8.9 years of age were not generallyassociated with various dietary patterns such as ‘health conscious’, ‘traditional’, ‘processed’, ‘vegetarian’ or‘confectionery’. In a subset of 4198 children, those whose mothers had a ‘health conscious’ diet (salad, fruit, fruit juices,rice, pasta, oat/bran based breakfast cereals, fish, pulses, cheese, nonwhite bread) were more likely to havea positive IgE (aOR 1.07 95% CI 1.00 to 1.14) <strong>and</strong> <strong>and</strong> those whose mothers had a ‘traditional’ diet(vegetables, red meat, poultry) were less likely to have a positive IgE (aOR 0.96 95% CI 0.91 to 1.00).45. In a Spanish cohort study, reductions in persistent wheeze, atopic wheeze <strong>and</strong> atopy in children at 6.5years of age were associated with a high adherence to a Mediterranean diet by their mothers: Persistent wheeze aOR 0.22 95% CI 0.08 to 0.58 Atopic wheeze aOR 0.30 95% CI 0.10 to 0.90 Atopy aOR 0.55 95% CI 0.31 to 0.9746. In a Mexican retrospective cohort study, asthma, wheezing <strong>and</strong> most allergy symptoms in children at 6-7years of age were not associated with their mothers adhering to a Mediterranean diet (high in vegetables,legumes, fruits <strong>and</strong> nuts, cereals <strong>and</strong> fish <strong>and</strong> low in dairy products, meat, junk food <strong>and</strong> fat): Asthma (ever in child) aOR 1.03 95% CI 0.67 to 1.56 Wheezing (ever in child) aOR 0.74 95% CI 0.55 to 1.01 Rhinitis (ever in child) aOR 0.64 95% CI 0.36 to 1.151376children8,886children483children1326childrenII Lange 2010II Shaheen 2009II Chatzi 2008III-2 De Batlle 2008Dietary guidelines for pregnant <strong>and</strong> <strong>breastfeeding</strong> women: evidence report20
Other Childhood Outcomes47. In a cohort study from the UK, high diet quality of infants was positively associated with a high qualitymaternal diet: Association between maternal prudent diet <strong>and</strong> ‘infant guidelines’ diet6 months: ß 0.196 95% CI 0.135 to 0.257; p < 0.00112 months: ß 0.282 95% CI 0.220 to 0.343; p < 0.001 Association between maternal prudent diet <strong>and</strong> ‘adult’ diet6 months: ß -0.074 95% CI -0.132 to -0.015; p < 0.0512 months: ß -0.215 95% CI -0.270 to -0.160; p < 0.00148. In a case-control study from North America, childhood acute myeloid leukemia (but not acutelymphoblastic leukemia) in children up to one year of age was associated with moderate to highconsumption of foods containing DNA topoisomerase II inhibitors (beans, fresh <strong>and</strong> canned vegetables,fruits, soy, coffee, wine, black <strong>and</strong> green tea <strong>and</strong> cocoa); OR for acute myeloid leukemia (high versus low consumption): 10.2 95% CI 1.1 to 96.4) OR for acute lymphoblastic leukemia (high versus low consumption (0.5 95% CI 0.2 to 1.4)49. In a nonr<strong>and</strong>omised comparison from Sweden, infant weight gain up to 18 months did not differsignificantly between women with a diet free from eggs, cow’s milk <strong>and</strong> fish from birth to three monthspostpartum <strong>and</strong> women with an unrestricted diet50. In a UK cohort study, most measures of bone mass in children at 9 years of age were positively associatedwith their mothers adhering to a prudent diet (high intake of fruit, vegetables, wholemeal bread, rice, pasta,yoghurt, cheese, fish, reduced fat milk <strong>and</strong> low intake of white bread, added sugar, tinned vegetables, fullfat milk <strong>and</strong> crisps) in pregnancy: Child whole body bone area at 9 years: positive correlation with maternal prudent diet in late pregnancy: r =0.24, p = 0.001 (adjusted for age <strong>and</strong> sex) Bone mineral content at 9 years: positive correlation with maternal prudent diet in late pregnancy: r = 0.23,p = 0.001 (adjusted for age <strong>and</strong> sex)1434children303cases;468controlsII Robinson 2007III-3 Ross 1996115 III-2 Hattevig 1989198childrenII Cole 2009Pregnancy <strong>and</strong> Breastfeeding Dietary Patterns21
3628 (3542 to 3713) 3600 (3483 to 3716) pnsBirth length, cm (mean difference 95% CI)Diet group (n = 78) Control group (n = 78) p value51.3 (51.0 to 51.7) 51.0 (50.5 to 51.5) pnsHead circumference at birth, cm (mean difference 95% CI)Diet group (n = 78) Control group (n = 77) p value35.1 (34.9 to 35.4) 35.1 (34.8 to 35.5) pnsFollowupConfoundingRisk of biasRelevanceOther comments6 months after birthNAModerate risk of bias:No details about method of allocation concealment;Not feasible to blind this intervention;28/171 (16.4%) lost to follow-up at 6 months – 13 in the diet group (2 miscarriages, 2 due to illness in mother, 1 due to illness in child, 4 unwilling tocontinue, 2 moved, 1 unknown, 1 twin pair excluded) <strong>and</strong> 15 in the control group (3 due to illness in mother, 2 due to illness in child, 8 unwilling tocontinue, 2 unknown).<strong>For</strong> the primary outcome of infant blood pressure at 6 months, results were available for 113/171 (66.1%) infantsLikely to be relevant for Australian womenNCT00167700Total energy intake remained comparable between the groups although women in the dietary intervention group consumed significantly less butter <strong>and</strong>more margarine <strong>and</strong> vegetable oilStudy probably underpowered (no sample size calculation reported)Pregnancy <strong>and</strong> Breastfeeding Dietary Patterns23
Reference Brantsaeter 2009Dietary patterns 1) Vegetable (high positive loadings on vegetables, cooking oil, olive oil, fruits <strong>and</strong> berries, rice <strong>and</strong> chicken)2) Processed food (high positive loadings on processed meat products, white bread, French fries, salty snacks <strong>and</strong> sugar-sweetened drinks; highnegative loadings on oily fish, high fibre breakfast cereals <strong>and</strong> lean fish)3) Potato <strong>and</strong> fish (high positive loadings on cooked potatoes, processed fish, lean fish, fish spread <strong>and</strong> shellfish <strong>and</strong> margarine)4) Cakes <strong>and</strong> sweets (high positive loadings on cakes, waffles, pancakes, buns, ice cream, sweet biscuits, sweets <strong>and</strong> chocolate)Study typeProspective cohort (factor analysis)Level of evidence II (aetiology)SettingNorway, from February 2002 to 2007; part of Norwegian Mother <strong>and</strong> Child Cohort Study (MoBa)FundingNorwegian Ministry of <strong>Health</strong>; Norwegian Research Council; European CommissionParticipants23,423 nulliparous pregnant women; > 99% Caucasian ethnicityBaseline comparisons All reported baseline characteristics were adjusted – see Confounding[vitamin D was adjusted for in a separate analysis but this did not alter any of the associations]Dietary assessment FFQTimingGeneral health questionnaire at 15 weeks GA; FFQ at 17-22 weeks GAComparison4 dietary patterns: See Dietary patterns aboveOutcomesPre-eclampsia (defined as blood pressure > 140/90 after 20 weeks GA, combined with proteinuria >+1 dipstick on at least 2 occasions)ResultsVegetable patternLowest tertile v middle tertile: aOR 0.84 95% CI 0.73 to 0.97Lowest tertile v highest tertile: aOR 0.72 95% CI 0.62 to 0.85Processed food patternLowest tertile v middle tertile: aOR 1.06 95% 0.91 to 1.23Lowest tertile v highest tertile: aOR 1.21 95% CI 1.03 to 1.41Potato <strong>and</strong> fish patternLowest tertile v middle tertile: aOR 0.99 95% CI 0.86 to 1.15Lowest tertile v highest tertile: aOR 1.00 95% CI 0.84 to 1.18Cakes <strong>and</strong> sweets patternLowest tertile v middle tertile: aOR 1.00 95% CI 0.86 to 1.15Lowest tertile v highest tertile: aOR 0.90 95% CI 0.76 to 1.06FollowupConfoundingRisk of biasRelevanceOther commentsTo birthAdjusted for maternal prepregnancy BMI, maternal age, maternal height, length of education, smoking, hypertension prior to pregnancy, dietarysupplement use, total energy intakeLow-moderate:healthier women more likely to participate; possibility of residual confoundingMore fish intake than an Australian population; less ethnic diversity than Australia;Difficult to interpret results with some overlapping food groups between the four dietary patterns;Overall participation in MoBa was about 44%Dietary guidelines for pregnant <strong>and</strong> <strong>breastfeeding</strong> women: evidence report24
Reference Chatzi 2008Dietary patterns Mediterranean diet (high intake of vegetables, legumes, fruits <strong>and</strong> nuts, cereal, fish, dairy products <strong>and</strong> low intake of red meat)Study typeProspective cohort studyLevel of evidence II (aetiology)Setting Women presenting antenatal care at general practices in Menorca, a Mediterranean isl<strong>and</strong> in Spain (mid 1997 to mid 1998)FundingInstituto de Salud Carlos III red de Grupos Infancia y Media Ambiente, the Fundacio “La Caixa”, Instituto de Salud Carlos III, red de Centros deInvestigacion en Epidemiologica y Salud Publica, EU, National Center for Environmental <strong>Health</strong>, USA, the GA2LEN project, Ministry of Education <strong>and</strong>Science, Spain, Oficina de Ciencia y Tecnologia, Generalitat Valenciana.Participants482 children of 507 women who had attended antenatal care in MenorcaBaseline comparisons See confounding belowTimingnot clear when women did FFQ <strong>and</strong> period of pregnancy it was intended to coverComparison Mediterranean diet score (0 = minimal adherence to 7 = maximal adherence): high Mediterranean diet quality (4-7) v low Mediterranean diet quality (≤3) [dairy assumed to be protective for pregnant women; alcohol consumption not included in the score]OutcomesPersistent wheeze, atopic wheeze <strong>and</strong> atopy at 6.5 years [gestational age; birthweight]ResultsPersistent wheeze at 6.5 yearsaOR 0.23 95% CI 0.09 to 0.60 (also adjusted for firstborn <strong>and</strong> lower respiratory tract infections at age 1)aOR 0.22 95% CI 0.08 to 0.58 (additionally adjusted for child’s adherence to a Mediterranean diet)Atopic wheeze at 6.5 yearsaOR 0.34 95% CI 0.12 to 0.97 (also adjusted for birthweight <strong>and</strong> maternal atopy)aOR 0.30 95% CI 0.10 to 0.90 (additionally adjusted for child’s adherence to a Mediterranean diet)Atopy at 6.5 yearsaOR 0.55 95% CI 0.32 to 0.97 (also adjusted for birthweight <strong>and</strong> maternal atopy)aOR 0.55 95% CI 0.31 to 0.97 (additionally adjusted for child’s adherence to a Mediterranean diet)High level of adherence to a Mediterranean diet <strong>and</strong> gestational age: p = 0.477High level of adherence to a Mediterranean diet <strong>and</strong> birthweight: p = 0.906Followup6.5 yearsConfounding Analyses adjusted for gender, maternal <strong>and</strong> paternal asthma, maternal social class <strong>and</strong> education, BMI at age 6.5 years <strong>and</strong> total energy intake at 6.5yearsRisk of biasLow risk of bias: Results from 468/482 children (97%) able to be analysed (6 incomplete data <strong>and</strong> 8 implausible values);RelevanceDiets in Menorca may differ from diets of Australian women, particularly urban womenOther commentsPregnancy <strong>and</strong> Breastfeeding Dietary Patterns25
Reference Cole 2009Dietary patterns ‘Prudent’ diet (high intake of fruit, vegetables, wholemeal bread, rice, pasta, yoghurt, cheese, fish, reduced fat milk <strong>and</strong> low intake of white bread, addedsugar, tinned vegetables, full fat milk <strong>and</strong> crisps)Study typeProspective cohort studyLevel of evidence II (aetiology)SettingPrincess Anne Maternity Hospital, Southampton, UKFundingNational Osteoporosis Society, UK; North East Thames NHS R&D Directorate, Arthritis Research Campaign; The Cohen Trust; WellChild.Participants198 children of white women > 16 years of age with singleton pregnancies of < 17 weeks gestation. Women were recruited in 1991-2 <strong>and</strong> when theirchildren approached 9 years of age, 461 women who still lived in Southampton were invited to participate <strong>and</strong> 251 (47%) of these women agreed toattend a clinic with their child.Exclusions: Diabetic women <strong>and</strong> those who had undergone hormonal treatment to conceive.Baseline comparisons Participants slightly older, less likely to have smoked at conception, better educated <strong>and</strong> had a higher late pregnancy prudent diet score thannonparticipantsTimingFFQ for preceding 3 months in early (15 weeks gestation) <strong>and</strong> late pregnancy (32 weeks gestation)ComparisonHigh score v lower score for prudent dietOutcomesChild’s bone mass (bone mineral content (BMC)) at 9 years; lean <strong>and</strong> fat massResultsChild whole body bone area at 9 years:Positive correlation with maternal prudent diet in late pregnancy: r = 0.24, p = 0.001 (adjusted for age <strong>and</strong> sex)Child BMC at 9 years:Positive correlation with maternal prudent diet in late pregnancy: r = 0.23, p = 0.001 (adjusted for age <strong>and</strong> sex)[p = 0.02 adjusted for maternal social class, education, body build <strong>and</strong> smoking; p = 0.03 additionally adjusted for child’s height, weight,sports participation, <strong>and</strong> milk intake; p = 0.04 additionally adjusted for maternal vitamin D status]Child areal bone mass density at 9 years:Positive correlation with maternal prudent diet in late pregnancy: r = 0.15, p = 0.02 (adjusted for age <strong>and</strong> sex)Child volumetric bone density mass at 9 years:No significant relationship with maternal dietary patternChild lumbar spine BMC at 9 years:Positive correlation with maternal prudent diet in late pregnancy: r = 0.17, p = 0.02 (adjusted for age <strong>and</strong> sex)Child lumbar spine bone density mass at 9 years:Positive correlation with maternal prudent diet in late pregnancy: r = 0.18, p = 0.01 (adjusted for age <strong>and</strong> sex)Percentage of total variance in whole body bone areal bone mass density <strong>and</strong> BMC explained by maternal prudent diet in late pregnancy ranged from2% to 6%.Child lean mass at 9 years:<strong>For</strong> an SD increase in late pregnancy prudent diet score, lean mass rose by 656.0 g 95% CI 304.3 to 1007.7 (adjusted for age <strong>and</strong> sex) [similarresults with high score in early pregnancy]Child fat mass at 9 years:Dietary guidelines for pregnant <strong>and</strong> <strong>breastfeeding</strong> women: evidence report26
No significant associations with prudent diet score either in early or late pregnancyFollowupConfoundingRisk of biasRelevanceOther comments9 yearsSignificant associations between diet <strong>and</strong> factors such as maternal social class; analyses adjusted for these factors only presented for BMCModerate-high risk of bias: Poor initial response rate (47%); high attrition from 251 to 198 children (only able to trace some of the cohort); noexplanation given for only including white women.Population <strong>and</strong> dietary patterns likely to be relevant to Australian womenPregnancy <strong>and</strong> Breastfeeding Dietary Patterns27
Reference De Batlle 2008Dietary patterns Mediterranean diet scores (women in the upper half of consumption of vegetables, legumes, fruits <strong>and</strong> nuts, cereals <strong>and</strong> fish <strong>and</strong> in the lower half ofconsumption of dairy products, meat, junk food <strong>and</strong> fat added 1 to their score)Study typeRetrospective cohort studyLevel of evidence III-2 (aetiology)SettingMexican schoolsFundingNational Center for Enviromental <strong>Health</strong>, Center for Disease Control <strong>and</strong> Prevention, USA; Ministry of <strong>Health</strong>, Mexico; Ministry of <strong>Health</strong>, Spain,GA 2 LEN Proect (EU), Ministry of Education <strong>and</strong> Science, SpainParticipants1476 children, 6-7 years oldBaseline comparisons Participating women were more likely to have higher education levels, less likely to smoke <strong>and</strong> less likely to have asthmaTimingDuring pregnancy (not further specified)ComparisonHigh versus lower Mediterranean diet scores (1 st tertile v 2 nd <strong>and</strong> 3 rd tertiles)OutcomesAsthma, allergic rhinitisResultsAsthma (ever in child):aOR 1.03 95% CI 0.67 to 1.56 [n assumed to be 1326]Wheezing (ever in child):aOR 0.74 95% CI 0.55 to 1.01 [n assumed to be 1326]Wheezing (currently in child):aOR 1.02 95% CI 0.65 to 1.60 [n assumed to be 1326]Rhinitis (ever in child):aOR 0.64 95% CI 0.36 to 1.15 [n assumed to be 1326]Rhinitis (currently in child):aOR 0.87 95% CI 0.65 to 1.18 [n assumed to be 1326]Sneezing (currently in child):aOR 0.71 95% 0.53 to 0.97 [n assumed to be 1326]Itchy-watery eyes (currently in child):aOR 0.96 95% CI 0.64 to 1.45 [n assumed to be 1326](similar results for all crude analyses)FollowupConfoundingRisk of biasRelevanceOther commentsNot stated but presumed to be 6-7 yearsAnalyses were adjusted for gender of child, physical exercise of child, current tobacco smoking at home, maternal education, maternal asthma,maternal rhinitisModerate to high risk of bias; 81% (2528/3125) parents consented to participation; 489 children were subsequently excluded because of no diet data;high risk of recall bias, as mothers were asked to recall their diet during their pregnancy from over 6 years earlier.Nutrition status of pregnant women in Mexico may be different to women in AustraliaThis study also looked at associations between children’s diet <strong>and</strong> asthma <strong>and</strong> allergy outcomesDietary guidelines for pregnant <strong>and</strong> <strong>breastfeeding</strong> women: evidence report28
Reference Duarte-Salles 2010Dietary patterns Diet high in polycyclic aromatic hydrocarbons (PAH) – from high consumption of shellfish, processed/cured meats, milk/yoghurt, bread, sweet dairyfoods, alcoholic beverages <strong>and</strong> sugar <strong>and</strong> benzo(a)pyrene (BaP) – from processed or cured meat, nuts <strong>and</strong> fats <strong>and</strong> oilsStudy typeProspective cohort studyLevel of evidence II (aetiology)SettingSabadell, SpainFundingSpanish Ministry of <strong>Health</strong>, Instituto de Salud Carlos III, Generalitat de Catalunya-CIRITParticipants 657 women recruited in the first trimester of pregnancy (part of INMA project) from July 2004 to July 2006Baseline comparisons Not reportedDietary assessment FFQTiming“during first <strong>and</strong> third trimesters”ComparisonAmounts of dietary PAH <strong>and</strong> total PAH; <strong>and</strong> BaPOutcomesBirthweightResultsBirthweightBaP in first trimester significantly associated with lower birth weight (after adjusting for potential confounders such as cigarette smokeexposure): mean birthweight 142.73 lower for the fourth compared with the first quartile of dietary BaP (p < 0.05);BaP in third trimester not significantly associated with birthweight;Total PAH in either first or third trimesters not associated with birthweightFollowupConfoundingRisk of biasRelevanceOther commentsTo birthNot reported which confounders were used in analyses (except for cigarette smoke exposure)Unclear risk of bias: confounders <strong>and</strong> birthweight results not fully reportedWomen in this study likely to consume more cured meats than Australian womenSmoking during pregnancy was associated with higher dietary PAH in the study populationPregnancy <strong>and</strong> Breastfeeding Dietary Patterns29
ReferenceFood typeStudy typeLevel of evidenceSettingFundingParticipantsBaseline comparisonsDietary assessmentTimingComparisonOutcomesResultsHattevig 1989 (<strong>and</strong> Hattevig 1999 – 10 year follow-up)Eggs, cows’ milk <strong>and</strong> fishNonr<strong>and</strong>omised concurrent comparison; groups from two different locationsIII-2 (intervention)Southwestern SwedenSwedish Medical Research Council, Konsul Th Berg Foundation, Council of Skaraborg, KSS Barnmed Foundation115 children of pregnant women in southwestern Sweden visiting antenatal clinics from August 1984 to March 1986, with a history of previous orpresent atopic dermatitis, allergic rhinoconjunctivitis or asthma in the pregnant woman, her husb<strong>and</strong> or their children. Families had to be non-smoking<strong>and</strong> without indoor pet animalsNot reportedn/an/aDiet group (n = 65 infants): dietitian advised family how to achieve a diet free from eggs, cows’ milk <strong>and</strong> fish from birth for 3 months (mothers weresupplemented with extra calcium <strong>and</strong> multivitamins during the 3 month diet period);Non diet group (n = 50): usual care (no particular dietary information was given)Infant diet was the same for both groups – only breastmilk <strong>and</strong>/or formula based on hydrolysed casein during first 6 months, after 6 months,supplementary foods, including cows’ milk products were introduced in all children. Products containing eggs <strong>and</strong> fish were not introduced until after 9months of age. Supplemental A-D vitamins were given at 6 weeks.Dermatitis (eczema), asthma (3 or more bronchial obstructions) <strong>and</strong> other atopic/allergic manifestations;Infant weight gain;Maternal return to pre-pregnancy weight within 3 months after birth; <strong>breastfeeding</strong>Maternal return to pre-pregnancy weight within 3 months after birth:66% of mothers in the diet group compared with 20% in the non diet group; p < 0.001Breastfeeding:Full <strong>breastfeeding</strong> > 3 months: 59% in diet group compared with 68% in non diet group, pnsFull <strong>breastfeeding</strong> up to 6 months: 43% in diet group compared with 36% in non diet group, pnsInfant weight gainNo significant difference between infants in the diet <strong>and</strong> non diet groups (exact numbers not reported)Age interval (months) Diet group: n= 65; No diet group: n=500-3 0-6 0-9 0-12 0-18Eczema Diet 3.1%* 10.8%* 16.9% 23.1% 26.2%No diet 22.0%* 28.0%* 30.0% 28.0% 40.0%Asthma /bronchial obs.Diet 0 3.1% 4.6% 7.7% 14.0%No diet 0 2.0% 4.0% 8.0% 8.0%Other Diet 0 3.1% 9.2% 13.8% 16.9%No diet 0 2.0% 4.0% 10.0% 10.0%Dietary guidelines for pregnant <strong>and</strong> <strong>breastfeeding</strong> women: evidence report30
Adverse reactions to:Eggs Diet 0 1.5% 1.5% 1.5% 7.7%No diet 2.0% 2.0% 2.0% 2.0% 6.0%Cows’ milk Diet 0 3.1% 10.8% 10.8% 10.8%No diet 4.0% 6.0$ 14.0% 14.0% 14.0%Fish Diet 0 3.1% 3.1% 3.1% 3.1%No Diet 0 0 0 3.1% 3.1%Totals Diet 0 6.0% 10.8% 10.8% 12.3%No Diet 6.0% 8.0% 16.0% 18.0% 18.0%Atopic dermatitis in children at 10 years of age:Current: 18/50 in diet group versus 14/65 in non-diet group, pnsCumulative: 28/50 in diet group versus 30/60 in non-diet group, pnsBronchial asthma in children at 10 years of age:Current: 9/50 in diet group versus 11/65 in non-diet group, pnsCumulative: 14/50 in diet group versus 14/60 in non-diet group, pnsAllergic rhinocomjunctivis in children at 10 years of age:Current: 20/50 in diet group versus 18/65 in non-diet group, pnsCumulative: 22/50 in diet group versus 19/60 in non-diet group, pnsAdverse reactions to food (eggs, cow’s milk or fish) in children at 10 years of age:7/50 in diet group versus 8/65 in non-diet group, pns* statistically significant difference between groupsFollowupConfoundingRisk of biasRelevanceOther commentsFirst 18 months of life; children at 10 years of ageNot reported that any adjustments to analyses were madeModerate risk of bias; losses not clearly reported – 8/121 (6.6%) infants failed to complete study (but 237 pregnant women were recruited); imbalancein final numbers in the two study groups; groups matched on atopic but no other factors reportedMay be difficult to adhere to a strict non egg, non cows’ milk <strong>and</strong> non fish dietLikely to be underpoweredPregnancy <strong>and</strong> Breastfeeding Dietary Patterns31
Reference Haugen 2008Dietary patterns Mediterranean-type diet – 5 criteria (2 or more serves of fish per week, 5 or more vegetable/fruit serves per day, use olive oil or canola oil for cooking<strong>and</strong> dressings, eat no more than 2 serves of meat per week <strong>and</strong> drink no more than 2 cups of coffee per day).Study typeProspective cohort studyLevel of evidence II (aetiology)SettingNorway (part of the Norwegian Mother <strong>and</strong> Child Cohort Study (MoBa))FundingNorwegian Ministry of <strong>Health</strong>, NIH/NINDS, Norwegian Research Council/FUGE, EU FP& consortium, Metabolic Programming (EARNEST).Participants40,817 pregnancies of women recruited for MoBa from February 2002 to February 2005 of whom 26,563 (65%) met the following criteria: women had tobe non-smoking, BMI between 19 <strong>and</strong> 32, aged between 21 <strong>and</strong> 38 years when giving birth, with a singleton birth.Exclusions: more than 3 spontaneous abortions, energy intake less than 4,200 kJ <strong>and</strong> more than 16,700 kJ.Baseline comparisons See confounding belowDietary assessment FFQTimingat 17-24 weeks gestationComparison All 5 Mediterranean diet criteria met (n = 569) v 1-4 criteria met (n = 25,397) v no criteria met (n = 159)OutcomesPreterm birth (after week 21 <strong>and</strong> before week 37); late preterm birth (week 35-36) <strong>and</strong> early preterm birth (< 35 weeks)Results5 v 0 criteria:Preterm birth (< 37 weeks): (n = 728; 36 cases)OR 0.71 95% CI 0.34 to 1.51aOR 0.73 95% CI 0.32 to 1.68Early preterm birth (< 35 weeks): (n = 702; 10 cases)OR 1.12 95% CI 0.24 to 5.33aOR 0.93 95% CI 0.16 to 5.37Late preterm birth (35-36 weeks): (n = 718; 26 cases)OR 0.62 95% CI 0.26 to 1.45aOR 0.66 95% CI 0.25 to 1.695 v 1-4 criteria:Preterm birth (< 37 weeks): (n = 25,966; 1174 cases)OR 1.01 95% CI 0.68 to 1.51aOR 1.06 95% CI 0.71 to 1.58Early preterm birth (< 35 weeks): (n = 25,264; 472 cases)OR 0.77 95% CI 0.38 to 1.55aOR 0.80 95% CI 0.40 to 1.62Late preterm birth (35-36 weeks): (n = 25,494; 702)OR 1.18 95% CI 0.73 to 1.90aOR 1.24 95% CI 0.77 to 2.0FollowupTo birthConfoundingAnalyses were adjusted for mother’s BMI <strong>and</strong> height, educational level, parity <strong>and</strong> marital statusRisk of biasModerate: some dietary intakes were different between groups <strong>and</strong> were not controlled for (e.g. women meeting all 5 criteria had higher significantlyDietary guidelines for pregnant <strong>and</strong> <strong>breastfeeding</strong> women: evidence report32
RelevanceOther commentshigher egg consumption than the other women, <strong>and</strong> thus a higher cholesterol level); intake of nuts <strong>and</strong> cereals was not evaluatedModerate: low red meat consumption not typical for many Australian womenChosen cutoff points unbalanced – might have been better to compare all 5 criteria met v 3-4 v 1-2 v none.Preterm birth rates were lower than expected, likely due to exclusion of smokersPregnancy <strong>and</strong> Breastfeeding Dietary Patterns33
Reference Haugen 2005Dietary patterns <strong>Health</strong>y diet:Imprudent diet: high intakes of crisps/chips, sugar, confectionery, white bread, soft drinks, red meat; <strong>and</strong> low intakes of fruit/vegetables, rice/pasta,yoghurt, <strong>and</strong> wholemeal bread.Western diet: with additional high intakes of fruit <strong>and</strong> vegetables.Vegetarian: vegetarian foods, confectionery, snack foods.Study typeProspective cohortLevel of evidence II (aetiology)SettingUKFundingBritish Heart Foundation, UK Medical Research Council, Dunhill Medical Trust, Research Council of NorwayParticipants381 pregnancies in low-risk womenBaseline comparisons Reported but not compared with relevant populationDietary assessment FFQTimingWomen recruited in early pregnancyComparison<strong>Health</strong>y; imprudent; western; ‘vegetarian’ dietsOutcomesFetal hepatic blood flow at 36 weeks gestation (‘liver-sparing’ leading to increased liver blood flow may be linked to increased adult cardiovascular risk)ResultsDuctus venous shunting in fetus:Reduced with an imprudent diet (p = 0.04) (independent of maternal slimness)No significant difference with a western diet (p = 0.45);No significant difference with a vegetarian diet (p = 0.89)Liver blood flow in fetus:Increased with an imprudent diet (p = 0.02) (independent of maternal slimness);No significant difference with a western diet (p = 0.83);No significant difference with a vegetarian diet (p = 0.95)FollowupConfoundingRisk of biasRelevanceOther commentsNone“results not related to gestational age” also see comments in resultsUnclear; not many details reportedRelevant population; relevance of the outcomes limited until subsequent research is undertakenExploratory studyDietary guidelines for pregnant <strong>and</strong> <strong>breastfeeding</strong> women: evidence report34
Reference Hill 2005Dietary patterns Low allergen maternal diet: mothers excluded cow’s milk, eggs, peanuts, tree nuts, wheat, soy <strong>and</strong> fish from their dietControl diet: mothers in the control group consumed the foods listed aboveStudy typeRCTLevel of evidence II (intervention)SettingCommunity based infant health centres in Melbourne, AustraliaFundingRicegrowers’ Cooperative Ltd (Leeton, Australia)Participants107 exclusively breastfed infants presenting with colic (first six weeks of life); recruited between 2000 <strong>and</strong> 2002 – infants were well, term (> 37 weeks),singleton pregnancy, no significant obstetric complications or history of maternal substance abuse, no perinatal morbidity other than distress:Colic was defined as parent-reported infant distress exceeding 180 minutes per 24 hours on 3 days in the week before presentation;Mothers on strict vegan diets were excluded; three mothers on balanced ovo-lacto-vegetarian diets were included in the studyBaseline comparisons NADietary assessment NATimingAll except three mother-child dyads commenced the intervention before infant was six weeks old (three infants were assigned at 7.4, 8.0 <strong>and</strong> 8.6 weeksrespectively); intervention lasted 7 daysComparisonLow allergen maternal diet (mothers asked to exclude all foods containing dairy products, soy, wheat, eggs, peanuts, tree nuts <strong>and</strong> fish from their diet;their diet included a rice mild drink (supplied), meats, vegetables, fruits <strong>and</strong> cereals (corn <strong>and</strong> rice) <strong>and</strong> calcium supplement) versus maternal diet(mothers received 7 days rations of a soy <strong>and</strong> cow’s milk powder <strong>and</strong> were asked to consume 1 serve of peanuts, 1 serve of wheat <strong>and</strong> 1 chocolatemuesli bar a day, which were supplied)Both diets avoided food preservatives, colours <strong>and</strong> additives; Adherence to the diet was monitored with diet diaries on the last 2 days of the interventionOutcomesChange in cry/fuss duration over 48 hours, after 7 daysResults Improvement of ≥ 25% in cry/fuss score (two days before intervention versus days 6 <strong>and</strong> 7)Low allergen diet: 35/47 (74%)Control diet: 16/43 (37%)ARR 0.37 95% CI 0.18 to 0.56, p < 0.001- This analysis restricted to women fully adhering to dietsLow allergen diet: 33/44 (75%)Control diet: 14/24 (58%)p = 0.15Cry/fuss duration ≥ 360 min per 48 hr (days 6 <strong>and</strong> 7)Low allergen diet: 30/47 (64%)Control diet: 31/43 (72%)ARR 0.08 95% CI -0.11 to 0.27, p = 0.402No significant differences seen in maternal assessmentsNoncompliance in the control arm was associated with a lack of early response (i.e. these women chose to eliminate some of the foods)Followup7 days (duration of intervention)ConfoundingNARisk of biasLow risk of bias; r<strong>and</strong>omisation schedule provided by statistician, third party r<strong>and</strong>omisation; 90/107 infants completed the trial (47 in the low allergengroup <strong>and</strong> 43 in the control group); infants of noncompleters in the control group had a higher distress score at baselineRelevanceRelevant to Australian women <strong>and</strong> infants; low allergen diet may difficult to sustainOther commentsPregnancy <strong>and</strong> Breastfeeding Dietary Patterns35
ReferenceKinnunen 2007aDietary patterns Advice to 1) have a regular meal pattern, emphasising the importance of breakfast <strong>and</strong> at least one hot meal every day; 2) to eat at least 5 portions (400g) per day of different kinds of vegetables, fruits <strong>and</strong> berries, 3) to consume mostly high fibre bread (≥ 5 g fibre/100 g) <strong>and</strong> 4) to restrict the intake ofhigh-sugar snacks to ≤ 1 portion per day (e.g. 50 g sweets, one pastry, one piece of cake, two biscuits, 2 dl ice cream or a glass of soft drink) [plusadvice to be physically active]Study typeControlled trialLevel of evidence III-2 (nonr<strong>and</strong>omised concurrent comparison; interventions)SettingSix antenatal clinics in Finl<strong>and</strong> (3 intervention, 3 control)FundingUS NIH, Ministry of Education <strong>and</strong> Ministry of Social Affairs <strong>and</strong> <strong>Health</strong>, Finl<strong>and</strong>Participants 132 pregnant primiparas; recruited between August 2004 <strong>and</strong> January 2005Exclusion criteria: under 18 years of age, type I or II diabetes mellitus (but not GDM), twin pregnancy, physical disability that prevents exercising,otherwise problematic pregnancy, substance abuse, treatment or clinical history for any psychiatric illness, inability to speak Finnish <strong>and</strong> intention tochange residence within 3 months.Baseline comparisons Women in the intervention group were younger, less educated, more often smokers with higher pregnancy BMI than the control groupDietary assessment FFQTiming22-24 weeks gestation, 37 weeks gestationComparisonIntervention (dietary <strong>and</strong> physical activity counselling) versus st<strong>and</strong>ard antenatal careOutcomesAchieving recommended dietary pattern; gestational weight gainResultsIntervention (n = 48) Control (n = 56) p valueTotal gestation weight gain (kg, SD) 14.6 [5.4] 14.3 [4.1] 0.77Exceeding recommendations* OR 1.82 95% CI 0.65 to 5.14 1.00 0.26Veg, fruit, berries (portions/day) at 37 w** 3.8 [1.7] (n = 40) 3.2 [1.5] (n = 53)Adj mean difference = +0.8 95% CI 0.3 to 1.4) 0.004High-fibre bread (% of total bread) at 37 w** 67 [29] (n = 39) 53 [24] (n = 54)Adj mean difference = +11.8 95% CI 0.6 to 23.1 0.04High-sugar snacks (portions/day) at 37 w** 1.6 [1.3] (n = 40) 1.8 [1.1] (n = 55)Adj mean difference =-0.3 95% CI -0.8 to 0.1) 0.16High birthweight (≥ 4000 g) 0 8 0.006Low birthweight (< 2500 g) 0 1 pnsFollowupConfoundingRisk of biasRelevanceOther commentsTo birth*Adjusted for age, pre-pregnancy BMI, education, pre-pregnancy smoking status, oedema <strong>and</strong> week of gestation in last weight measurement**adjusted for baseline intake of the outcome variable, pre-pregnancy age, BMI, education <strong>and</strong> smoking statusModerate risk of bias: 20/69 (29%) lost to followup in the intervention group <strong>and</strong> 7/63 (11%) in the control group; method of allocation to intervention orcontrol not reportedLikely to be reasonably relevant to Australian womenPilot for a larger studyDietary guidelines for pregnant <strong>and</strong> <strong>breastfeeding</strong> women: evidence report36
ReferenceKinnunen 2007bDietary patterns Advice to 1) have a regular meal pattern, emphasising the importance of breakfast <strong>and</strong> at least one hot meal every day; 2) to eat at least 5 portions (400g) per day of different kinds of vegetables, fruits <strong>and</strong> berries, 3) to consume mostly high fibre bread (≥ 5 g fibre/100 g) <strong>and</strong> 4) to restrict the intake ofhigh-sugar snacks to ≤ 1 portion per day (e.g. 50 g sweets, one pastry, one piece of cake, two biscuits, 2 dl ice cream or a glass of soft drink) [plusadvice to be physically active]Study typeControlled trial (ISRCTN21512277)Level of evidence III-2 (nonr<strong>and</strong>omised concurrent comparison; interventions)SettingSix antenatal clinics in Finl<strong>and</strong> (three intervention; three control)FundingUS NIH, Ministry of Education <strong>and</strong> Ministry of Social Affairs <strong>and</strong> <strong>Health</strong>, Finl<strong>and</strong>, Doctoral Programs in Public <strong>Health</strong>, Finl<strong>and</strong>Participants 92 postpartum primiparas; recruited between August 2004 <strong>and</strong> January 2005Exclusion criteria: under 18 years of age, type I or II diabetes mellitus (but not GDM), twin pregnancy, physical disability that prevents exercising,otherwise problematic pregnancy, substance abuse, treatment or clinical history for any psychiatric illness, inability to speak Finnish <strong>and</strong> intention tochange residence within 3 months.Baseline comparisons Characteristics of women in the intervention <strong>and</strong> control groups were not significantly differentDietary assessment FFQTiming2, 5, 6 <strong>and</strong> 10 months postpartumComparisonIntervention (dietary <strong>and</strong> physical activity counselling from 2 to 10 months postpartum) versus st<strong>and</strong>ard antenatal careOutcomesAchieving recommended dietary pattern; gestational weight retentionResultsIntervention (n = 46) Control (n = 37) aOR/MD (95% CI)Retained ≤ 0 kg at 10 m pp* 23 (50%) 11 (30%) 3.89 (1.16 to 13.04)Weight retention, mean (kg, SD) at m pp 1.8 [4.3] 1.0 [4.4] 0.8 (-1.1 to 2.7)Waist circumf at 10 months pp, mean (cm SD) 78.1 [10.2] 75.4 [6.2] 1.0 (0.7 to 2.7)Veg, fruit, beries (prtions/day) at 10 m pp** 2.6 [1.4] (n = 44) 2.5 [2.1] (n = 37)Adj mean difference = +0.2 95% CI -0.3 to 0.8High-fibre bread (% total bread) at 10 mpp** 65 [27] (n = 44) 52 [31] (n = 37)Adj mean difference = + 16.1 95% CI 4.3 to 27.9High-sugar snacks (portions/day) at 10 mpp** 2.1 [1.2] (n = 44) 2.1 [1.4] (n = 37)Adj mean difference = 0.0 95% CI -0.6 to 0.6)FollowupConfoundingRisk of biasRelevanceOther commentsTo 10 months posptpartum*Adjusted for age, pre-pregnancy BMI, education, gestational weight gain, weight at 2 months postpartum, duration of exclusive <strong>breastfeeding</strong> <strong>and</strong>smoking status**baseline intake of the outcome variable, age, education, smoking status, gesational weight gain <strong>and</strong> BMI at 2 months postpartumModerate risk of bias: 5/53 (9%) lost to followup in the intervention group <strong>and</strong> 2/39 (5%) in the control group; three clinics volunteered to be interventionclinics <strong>and</strong> the other three clinics were controlsLikely to be reasonably relevant to Australian womenUnderpowered; pilot for a larger studyPregnancy <strong>and</strong> Breastfeeding Dietary Patterns37
Reference Knudsen 2008Dietary patterns 1) Red <strong>and</strong> processed meat, high-fat dairy;2) Veg, fruit, poultry, fish;3) IntermediateStudy typeProspective cohort (factor analysis)Level of evidence II (aetiology)SettingCopenhagen, Denmark; from 1997 to 2002; part of the Danish National Birth CohortFundingMarch of Dimes Birth Defects Foundation, Danish National Research Foundation, European Union, Pharmacy Foundation, Egmont Foundation,Augustinus Foundation, <strong>Health</strong> FoundationParticipants44,162 adequately nourished pregnant women (who went to give birth to a live born, fullterm singleton child)Baseline comparisons All reported baseline characteristics were adjusted – see ConfoundingTimingFFQ in week 25, recording previous 4 weeks intakeComparison 1) Western Diet (high intake of high-fat dairy, refined grains, processed <strong>and</strong> red meat, animal fat (butter <strong>and</strong> lard), potatoes, sweets, beer, coffee <strong>and</strong>high-energy drinks; highest energy intake (35% from fat))2) <strong>Health</strong> Conscious Diet (high intake of fruits, vegetables, fish, poultry, breakfast cereals, vegetable juice <strong>and</strong> water; avoidance of foods with a highfat content; lowest energy intake (25% from fat))3) Intermediate (high intake of low-fat dairy <strong>and</strong> fruit juice, fruits <strong>and</strong> vegetables, red meat <strong>and</strong> dairy products; 30% of energy intake from fat)Alcohol intake was low for all groupsOutcomesFetal growth (SGA - defined as z-score below 2.5 th percentile for the respective gender <strong>and</strong> GA); birthweightResultsSGAWestern diet: OR 1.00 (reference) [n=7619]Intermediate: OR 0.68 95% CI 0.55 to 0.84 (p=0.0004) [29,514]<strong>Health</strong> conscious: OR 0.74 95% CI 0.64 to 0.86) (p=0.0001) [n=7479]Birthweight (g) :(mean, SD)Western diet: 3583 [515]Intermediate: 3623 [490]<strong>Health</strong> conscious: 3616 [486], p>0.05FollowupTo birthConfoundingAdjusted for parity, maternal smoking, age, height, pre-pregnancy weight <strong>and</strong> father’s heightRisk of bias Low risk of bias: healthier women more likely to participate (response rate not reported but possibly about 50%);likely to be residual confounding (e.g. SES)RelevanceNot clear how similar these patterns <strong>and</strong> their frequency would be for Australia;Only included term babies;Diet from 21-25 weeks GA may not influence fetal growth as much as dietary intake earlier in pregnancyOther comments Not clear which individual foods or nutrients (<strong>and</strong> relative quantities) may be particularly influencing SGADietary guidelines for pregnant <strong>and</strong> <strong>breastfeeding</strong> women: evidence report38
Reference Koebnick 2004Dietary patterns Vegetarian diet: no meat or meat products; plant based diet (high consumption of raw vegetables (> 100 g/d), preference for wholegrain products (ratioof refined grain products/wholegrain products < 0.95))Low meat diet: limited meat consumption (meat < 300 g/week <strong>and</strong> meat products < 105 g/week); plant based diet (high consumption of raw vegetables(> 100 g/d), preference for wholegrain products (ratio of refined grain products/wholegrain products < 0.95))Western diet (control group): similar to diet of average German population (mainly refined grain products (ratio of refined grain products/wholegrainproducts > 1.05) <strong>and</strong> > 300 g meat <strong>and</strong> 105 g meat products per week <strong>and</strong> < 100g unheated vegetables per dayStudy typeProspective cohort (3 concurrent comparisons)Level of evidence II (aetiology)SettingErlangen, GermanyFundingEden Foundation, Stoll VITA Foundation, GermanyParticipants109 healthy pregnant women with less than 4 prior pregnancies at any stage of pregnancy (recruited by advertisements in health magazines <strong>and</strong> bygynaecologists from 1995 to 1997);Participants in the vegetarian <strong>and</strong> low meat diet groups could not have changed their diet substantially for at least three years; participants in the controlgroup were only included if they did not follow any special dietBaseline comparisons Vegetarians <strong>and</strong> low meat eaters had lower prepregnancy BMIs than the control groupSee Confounding belowTimingFFQ when recruited, recording usual dietary intake before pregnancy;Information on dietary intake <strong>and</strong> blood samples were collected at 9-12 weeks, 20-22 weeks, <strong>and</strong> 36-38 weeks gestationComparison Vegetarian (ovo-lacto) diet: n = 27Low meat diet: n = 43Western diet (control group): n = 39OutcomesMaternal B-12 concentrationsResultsSerum B-12 concentrations, pmol/L (medians with 25 th <strong>and</strong> 75 th percentiles)Trimester ovo-lacto vegetarian Low meat diet Western diet1 179 (100-317); n=16 209 (160-293); n=29 249 (201-310); n=312 176 (102-271); n=25 215 (151-269); n=42 238 (190-305); n=393 127 (90-184); n=19 164 (125-208); n=34 169 (141-213); n=38Ovo-lacto vegetarian versus western diet: p < 0.001Low meat versus western diet: p = 0.05FollowupConfoundingRisk of biasRelevanceOther commentsLow serum vitamin B-12 in at least trimester (with western diet group as reference):Ovo-lacto vegetarian diet: OR 3.9 95% CI 1.9 to 6.1Low meat diet: OR 1.8 95% CI 1.0 to 3.9To birthAdjusted for supplemental vitamin B-12,maternal age <strong>and</strong> first, second or third trimesterLow-moderate risk of bias: risk of selection bias from advertising in health magazines; reasons for missing B-12 measurements not reportedLikely to be similar to Australian women; perhaps higher use of supplements in GermanyOther possible confounders e.g. from choosing a vegetarian lifestyleB-12 status is a risk factor for neural tube defectsPregnancy <strong>and</strong> Breastfeeding Dietary Patterns39
Reference Koebnick 2001Dietary patterns Vegetarian diet: no meat or meat products; plant based diet (high consumption of raw vegetables (> 100 g/d), preference for wholegrain products (ratioof refined grain products/wholegrain products < 0.95))Low meat diet: limited meat consumption (meat < 300 g/week <strong>and</strong> meat products < 105 g/week); plant based diet (high consumption of raw vegetables(> 100 g/d), preference for wholegrain products (ratio of refined grain products/wholegrain products < 0.95))Western diet (control group): similar to diet of average German population (mainly refined grain products (ratio of refined grain products/wholegrainproducts > 1.05) <strong>and</strong> > 300 g meat <strong>and</strong> 105 g meat products per week <strong>and</strong> < 100g unheated vegetables per dayStudy typeProspective cohort (3 concurrent comparisons)Level of evidence II (aetiology)Setting Erlangen, Germany – same cohort as described in Koebnick 2004FundingNot reportedParticipants109 healthy pregnant women with less than 4 prior pregnancies at any stage of pregnancy (recruited by advertisements in health magazines <strong>and</strong> bygynaecologists from 1995 to 1997);Baseline comparisons Vegetarians <strong>and</strong> low meat eaters had lower prepregnancy BMIs <strong>and</strong> lower B-12 status than the control groupSee Confounding belowTimingFFQ when recruited, recording usual dietary intake before pregnancy;Information on dietary intake <strong>and</strong> blood samples were collected at 9-12 weeks, 20-22 weeks, <strong>and</strong> 36-38 weeks gestationComparison Vegetarian (ovo-lacto) diet: n = 27Low meat diet: n = 43Western diet (control group): n = 39OutcomesMaternal folate concentrationsResultsFolate deficiency (red blood cell folate < 320 nmol/L)Western diet:referenceOvo lacto vegetarian diet: aOR 0.10 95% CI 0.01 to 0.56Low meat diet: aOR 0.52 95% CI 0.20 to 1.34FollowupConfoundingRisk of biasRelevanceOther commentsTo 36-38 weeks gestationAdjusted for age, pre-pregnancy BMI, parity, smoking habits <strong>and</strong> oral contraceptive use before pregnancyLow-moderate risk of bias: risk of selection bias from advertising in health magazines; of 249 responding women, 203 received a questionnaire; 22 werenot interested in further participation <strong>and</strong> 24 were excluded from further participation (1 pregnant with twins, 9 were taking supplements, 14 lived > 200km from the study site; 2/203 failed to complete questionnaire. 92/201 women then excluded – 10 taking supplements, 4 metabolic diseases, 68 notconsuming a predominant vegetarian diet nor average western diet, 10 missing blood analyses for folate status, leaving 109 women in the study;12/27 women in the ovo-lacto vegetarian group, 21/43 in the low meat group <strong>and</strong> 27/39 in the western diet group had a complete longitudinalassessmentLess relevant to Australian women now that there is m<strong>and</strong>atory folate fortification in AustraliaOther possible confounders e.g. from choosing a vegetarian lifestyle?Dietary guidelines for pregnant <strong>and</strong> <strong>breastfeeding</strong> women: evidence report40
Reference Lange 2010Dietary patterns MediterraneanStudy typeProspective cohortLevel of evidence II (aetiology)SettingWomen recruited obstetric offices in a large multispecialty group practice in eastern MassachusettsFundingNIH (Disclosure of potential conflict interest from investigators includes links with AstraZeneca, Dey, GlaxoSmithKline, Merck, Novartis)Participants1376 mother-infant pairs from Project Viva; women with a singleton pregnancyExclusions: multiple gestation, inability to answer questions in English, plans to move out of the area before birth, gestational age > 22 weeks at theinitial antenatal appointmentBaseline comparisons Maternal participants in the study were more likely to be white, to have college or graduate education, higher income, low prepregnancy BMI, than thewomen excluded from the studyDietary assessment Mediterranean diet score; Alternate <strong>Health</strong>y <strong>Eat</strong>ing Index modified for pregnancy (AHEI-P); principal components analysisTimingWomen were interviewed after the initial antenatal visit, at an average of 10 weeks gestation <strong>and</strong> given questionnaires to return by mail; interview atsecond visit at 26-28 weeks gestation <strong>and</strong> given questionnaires to return by mail; newborn measurements were taken <strong>and</strong> a brief interview occurredwithin 72 hours of birth; questionnaires on infant health were administered at 6 months, 1 year <strong>and</strong> annually thereafterMean responses to dietary assessments were averaged across the first <strong>and</strong> second trimester.Comparison 1) Mediterranean diet score 0-9; high score best: one point if above median consumption for dairy, fish, fruit, legumes, nuts, unsaturated-to-saturatedfat ratio, vegetables <strong>and</strong> whole grains, intake of red <strong>and</strong> processed meats below the median median value [alcohol was excluded from the analysis]– low (0-3) v middle (4-5) v high (6-9) score.2) AHEI-P 90 point scale: 10 possible points for each of vegetables, fruit, ratio of white to red meat, fibre, trans fat; ratio of polyunsaturated tosaturated fatty acids, folate, calcium <strong>and</strong> iron from foods – quartiles compared.3) Patterns of correlated food groups identified through principal component analysis:a. Prudent diet: fruits, tomatoes, cabbages, leafy green vegetables, poultry, fishb. Western diet: red meat, processed meat, refined grains, snacks, sweets, desserts, French fries <strong>and</strong> pizza.Outcomes Recurrent wheeze at 3 years (compared with no wheeze at all in the first 3 years of life); Asthma (parental report of a doctor diagnosis of asthma in the child at any time up to 3 years); Eczema (parental report of a doctor’s diagnosis of eczema) up to 3 years; Lower respiratory infection (parental report of having had bronchiolitis, pneumonia, or bronchitis/croup at any time up to 3 years) Atopy (in a subset of 721 children at 3 years of age)ResultsRecurrent wheeze:Mediterranean diet score:OR 0.92 95% CI 0.85 to 1.00 per 1 point increase in scoreaOR 0.98 95% CI 0.89 to 1.08 per 1 point increase in scoreMediterranean diet score (high v low):OR 0.64 95% CI 0.43 to 0.95AHEI-P:OR 0.92 95% CI 0.77 to 1.08 per 10 pointsaOR 1.07 95% CI 0.87 to 1.30 per 10 pointsAHEI-P (highest v lowest quartile):OR 0.87 95% CI 0.55 to 1.37Pregnancy <strong>and</strong> Breastfeeding Dietary Patterns41
Prudent:OR 0.98 95% CI 0.82 to 1.18aOR 1.02 95% CI 0.83 to 1.26Western:OR 1.07 95% CI 0.91 to 1.26aOR 0.98 95% CI 0.81 to 1.19Asthma:Mediterranean diet score:OR 0.97 95% CI 0.91 to 1.03 per 1 point increase in scoreaOR 1.01 95% CI 0.94 to 1.09 per 1 point increase in scoreAHEI-P:OR 0.96 95% CI 0.84 to 1.09 per 10 pointsaOR 1.07 95% CI 0.92 to 1.25 per 10 pointsPrudent:OR 1.02 95% CI 0.89 to 1.16aOR 1.08 95% CI 0.93 to 1.26Western:OR 1.00 95% CI 0.87 to 1.14aOR 0.89 95% CI 0.76 to 1.04Eczema:Mediterranean diet score:OR 1.01 95% CI 0.95 to 1.06 per 1 point increase in scoreaOR 1.00 95% CI 0.94 to 1.06 per 1 point increase in scoreAHEI-P:OR 0.97 95% CI 0.87 to 1.08 per 10 pointsaOR 0.94 95% CI 0.82 to 1.08 per 10 pointsPrudent:OR 1.01 95% CI 0.90 to 1.13aOR 0.95 95% CI 0.83 to 1.09Western:OR 1.04 95% CI 0.93 to 1.17aOR 1.06 95% CI 0.93 to 1.22Respiratory infection:Mediterranean diet score:OR 1.03 95% CI 0.97 to 1.09 per 1 point increase in scoreDietary guidelines for pregnant <strong>and</strong> <strong>breastfeeding</strong> women: evidence report42
aOR 1.04 95% CI 0.98 to 1.10 per 1 point increase in scoreAHEI-P:OR 0.95 95% CI 0.85 to 1.07 per 10 pointsaOR 0.96 95% CI 0.85 to 1.10 per 10 pointsPrudent:OR 0.96 95% CI 0.85 to 1.09aOR 0.96 95% CI 0.84 to 1.11Western:OR 1.09 95% CI 0.97 to 1.23aOR 1.06 95% CI 0.93 to 1.21Atopy in a subset of children with IgE results (n = 721)Mediterranean diet score:OR 1.06 95% CI 0.99 to 1.14 per 1 point increase in scoreaOR 1.08 95% CI 0.99 to 1.18 per 1 point increase in scoreAHEI-P:OR 1.16 95% CI 1.00 to 1.34 per 10 pointsaOR 0.96 95% CI 0.85 to 1.10 per 10 pointsPrudent:OR 1.24 95% CI 1.05 to 1.46aOR 1.12 95% CI 0.93 to 1.36Western:OR 0.90 95% CI 0.77 to 1.04aOR 0.93 95% CI 0.79 to 1.11FollowupConfoundingRisk of biasRelevanceOther comments3 yearsAdjusted for child’s sex, maternal race, maternal education level, household income, maternal <strong>and</strong> paternal history of asthma [eczema for eczemaoutcome], presence of children < 12 years of age at home, maternal prepregnancy BMI, <strong>breastfeeding</strong> duration, passive smoke exposureLow risk of bias: Of the 2128 infants in Project Viva, 228 had missing maternal diet data, <strong>and</strong> an additional 524 did not have 3 year outcome data,leaving 1376 (64.7%) mother-child pairs for analysis.Likely to be relevant to an Australian populationPregnancy <strong>and</strong> Breastfeeding Dietary Patterns43
Reference Laraia 2007Dietary patterns Diet Quality Index for Pregnancy (DQI-P) – based on intake of grains, vegetables, fruits, folate, iron, fat <strong>and</strong> a meal pattern scoreStudy typeProspective cohort studyLevel of evidence II (aetiology)SettingNorth Carolina, US (part of the Pregnancy, Infection <strong>and</strong> Nutrition (PIN) cohort)FundingNational Institute of Child <strong>Health</strong> <strong>and</strong> Human Development; NIHParticipants 2394 predominantly lower to middle income women, recruited between 24 <strong>and</strong> 29 weeks gestation (1995-2000)Baseline comparisons Mean DQI-P score varied significantly by socio-demographic characteristics; there were higher mean DQI-scores for women who engaged in prepregnancyvigorous exercise <strong>and</strong> pre-pregnancy vitamin useDietary assessment Modified block FFQTimingSelf-report at 26-28 weeks gestation covering previous 3 months (corresponding to the 2 nd trimester)ComparisonBMI categoriesOutcomesPregravid weight status (not an outcome but there is an association)ResultsProportion of women meeting IOM meal pattern requirement [SD]Underweight 70.1 [45.8]Normal weight 68.1 [46.6]Overweight 63.4 [48.3]Obese 60.0 [49.0]Obese group significantly different from normal weight (p < 0.05) <strong>and</strong> underweight (p < 0.01)Average DQI-P score [SD]Underweight 57.2 [11.7]Normal weight 55.3 [11.3]Overweight 55.2 [11.5]Obese 53.3 [12.0]Obese group significantly different from normal weight (p < 0.05) <strong>and</strong> underweight (p < 0.01)Lowest v highest DQI-P tertile by BMI status (OR; 95% CIs)OR aOR* aORObese 1.87 (1.37 to 2.55) 1.86 (1.32 to 2.62) 1.76 (1.24 to 2.49)Overweight 1.29 (0.88 to 1.88) 1.32 (0.88 to 1.99) 1.31 (0.87 to 1.99)Normal weight 1.29 (0.98 to 1.72) 1.43 (1.05 to 1.94) 1.38 (1.01 to 1.89)Underweight 1.00 1.00 1.00FollowupConfoundingRisk of biasRelevanceOther comments*adjusted for age, ethnicity, level of education, poverty, number of children, smoking during pregnancy only26 to 31 weeks gestationAge, ethnicity, level of education, poverty, number of children, smoking during pregnancy, regular vitamin use prior to pregnancy, vigorous leisureactivity 3 months prior to pregnancyLow risk of bias: would have been better to have used normal weight women as the reference rather than underweight women DQI-P tertile comparisonLikely to be relevant to Australian womenDietary guidelines for pregnant <strong>and</strong> <strong>breastfeeding</strong> women: evidence report44
Reference Mikkelsen 2008Dietary patterns Mediterranean diet (consumption of fish twice a week or more, intake of olive or canola oil, high consumption of fruits <strong>and</strong> vegetables (5 a day or more),meat (other than poultry or fish) at most twice a week, <strong>and</strong> at most 2 cups of coffee a day)Study typeProspective cohort studyLevel of evidence IISettingDenmark (part of the Danish National Birth Cohort (DBNC))FundingMarch of Dimes Birth Defects Foundation, Danish National Research Foundation, Danish Medical Research Foundation, Danish <strong>Health</strong> Foundation,Danish Heart Foundation, EU FP7 consortium (EARNEST), Pharmacy Foundation, Egmont Foundation, Augustinus Foundation.Participants 35,530 pregnant women recruited from 1996 to 2002Exclusions: women who smoked, women aged < 21 <strong>and</strong> > 38 years, BMI < 19 <strong>and</strong> > 32, a history of more than 3 abortions, twin pregnancies, chronichypertension, women with a calculated energy intake < 4,200 kJ <strong>and</strong> > 16,700 kJBaseline comparisons BMIs were significantly lower in the MD <strong>and</strong> none groups.Dietary assessment FFQTimingFFQ mailed to all DBNC participants in 25 th week of gestationComparisonMediterranean diet (fulfilled all 5 criteria – see above) v partial (fulfilled 1-4 criteria) v none (none of the criteria fulfilled)OutcomesPreterm birthResults5 v 0 CRITERIA:Preterm birth < 37 weeksOR 0.79 95% CI 0.50 to 1.27aOR 0.61 95% CI 0.35 to 1.05Early preterm birth < 35 weeksOR 0.52 95% CI 0.22 to 1.22aOR 0.28 95% CI 0.11 to 0.76Late preterm birth 35-36 weeksOR 0.94 95% CI 0.54 to 1.65aOR 0.82 95% CI 0.43 to 1.575 v 1-4 CRITERIA:Preterm birth < 37 weeksOR 1.00 95% CI 0.74 to 1.33aOR 0.92 95% CI 0.69 to 1.24Early preterm birth < 35 weeksOR 0.63 95% CI 0.35 to 1.15aOR 0.58 95% CI 0.32 to 1.06Late preterm birth 35-36 weeksOR 1.20 95% CI 0.86 to 1.67aOR 1.11 95% CI 0.80 to 1.55Pregnancy <strong>and</strong> Breastfeeding Dietary Patterns45
FollowupTo birthConfoundingAdjusted for parity, BMI, maternal height, socioeconomic status <strong>and</strong> cohabitant statusRisk of bias Low risk of bias; GA based mostly on ultrasound; 0.36% missing data (127/35657)RelevanceRelevance limited by exclusion of smokers <strong>and</strong> obese womenOther comments Partial group comprised 95.2% of all women in the study – might have been better to separate further in moderate <strong>and</strong> low fulfilment categoriesDietary guidelines for pregnant <strong>and</strong> <strong>breastfeeding</strong> women: evidence report46
ReferenceDietary patternsStudy typeLevel of evidenceSettingFundingParticipantsBaseline comparisonsDietary assessmentTimingComparisonOutcomesResultsMoses 2009aLow versus higher glycaemic index (GI) diets (same carbohydrate intake of 175 g/day but varying foods):- Low GI (including pasta, grain breads, unprocessed breakfast cereals with a high fibre content)- High GI (advised to follow a high fibre, low sugar diet with no specific mention of glycaemic index; potatoes, whole wheat bread, specific high fibre,moderate-high GI breakfast cereals were recommended)RCTII (intervention)Illawarra region, NSW, AustraliaIllawarra Diabetes Service <strong>and</strong> University of Sydney63 women with gestational diabetes mellitus (GDM); aged 18 to 40 years, singleton pregnancy, no previous GDM, non-smoker, seen for first dietary visitbetween 28 to 32 weeks gestation (recruited between October 2007 to September 2008).Exclusions: any condition or medication that could affect glucose levels, unwillingness to follow the prescribed diet.NANADietary changes starting from 28 weeks to 32 weeks gestationLow (31 women) v high GI diet (32 women)Need for insulin (fasting glucose ≥ 5.5 mmol/L <strong>and</strong>/or 1-hour postpr<strong>and</strong>ial glucose was ≥ 8.0 mmol/L); birthweight (adjusted for sex, gestational age,maternal age, parity, height, <strong>and</strong> prepregnancy weight); ponderal indexNeed for insulin9/31 women in low GI group v 19/32 women in the high GI group (p = 0.023)Need for insulin after the 19 high GI women were switched to a low GI diet9/31 women in low GI group v 10/32 women in the high GI group (pns)Maternal weight gain from baseline to birth; induction of labour, mode of birth, or gestational age at birth were not significantly differentbetween groups (data not reported in paper)Birth centileLow GI: 46.3 [SEM 5.0] v high GI: 54.3 [4.8], p = 0.25Ponderal indexLow GI: 2.7 [SEM 0.05] v high GI: 2.6 [SEM 0.04], p = 0.12LGA (≥ 90 th centile)3 women (over both groups)SGA (≤ 10 th centile)2 women in the low GI groupFollowupTo birthConfoundingNARisk of biasModerate risk of bias: Computer generated r<strong>and</strong>om number list, allocation method not reported; study dietitians not blinded, no missing data reported.RelevanceRelevant to Australian womenOther comments Energy intake <strong>and</strong> GI were similar between groups after interventionPregnancy <strong>and</strong> Breastfeeding Dietary Patterns47
Reference North 2000Dietary patterns Vegetarian dietStudy typeProspective cohort studyLevel of evidence II (aetiology)SettingBristol, UK (part of ALSPAC <strong>and</strong> the WHO initiated European Longitudinal Study of Pregnancy <strong>and</strong> Childhood)FundingMRC, Wellcome Trust, Department of <strong>Health</strong>, Department of the Environment, MAFF, Nutricia, Nestle <strong>and</strong> other companies, BBCParticipants7928 boys born to women between April 1991 <strong>and</strong> December 1992; with 51 cases of hypospadias (= 64 per 10,000 male births)Baseline comparisons Mothers who had influenza during pregnancy; <strong>and</strong> mothers who took codeine in the first trimester in pregnancy had high rates of hypospadias in theirmale offspringDietary assessment Whether currently vegetarian (i.e. during pregnancy) or had previously been soTimingQuestionnaires at 8, 18 <strong>and</strong> 32 weeks gestation (this assessed current dietary behaviour); <strong>and</strong> at various ages of the childComparisonVegetarian diet (5.1% of women) versus omnivorous dietOutcomesHypospadiasResults2.2% of women who were vegetarian during pregnancy gave birth to a boy with hypospadias, compared with 0.06% of omnivorous women;OR 3.53 95% CI 1.56 to 7.98This did not differ greatly between vegetarian women who did <strong>and</strong> did not take iron supplements - in contrast to omnivorous women*Vegetarian women (taking or not taking iron supplements): OR of hypospadias 4.99 95% CI 2.10 to 11.88, using omnivorous women who did not takeiron supplements as reference.Of the 163 mothers who reported only buying organic fruit <strong>and</strong> vegetables, none had a son with hypospadias (but only one case would have beenexpected).FollowupConfoundingRisk of biasRelevanceOther commentsIncidence of hypospadias in children of women with a vegetarian diet prior to pregnancy (but not during pregnancy) was no significantly different fromthose women who had never been vegetarian.To diagnosis of hypospadiasAnalyses were not adjustedMedium risk of bias: analyses were not adjusted for potentially important confoundersLikely to be reasonably relevant to Australian womenAuthors hypothesise a possible link between phytoestrogens <strong>and</strong> hypospadias; could be pesticides, foods such as soyOmnivorous women who took iron supplements had increased risk of hypospadias in their male offspring*Dietary guidelines for pregnant <strong>and</strong> <strong>breastfeeding</strong> women: evidence report48
Reference Olafsdottir 2006Dietary patterns <strong>Eat</strong>ing more (in either early or late pregnancy)Study typeProspective cohort studyLevel of evidence II (aetiology)SettingIcel<strong>and</strong>FundingIcel<strong>and</strong>ic Research Council, University of Icel<strong>and</strong> Research FundParticipants495 r<strong>and</strong>omly selected healthy pregnant women attending a routine first antenatal visitBaseline comparisons See confounding belowDietary assessment FFQTimingAt 11-15 weeks gestation; <strong>and</strong> 34-37 weeks gestation (to reflect food intake for the last 3 months)Comparison<strong>Eat</strong>ing more versus not eating more than usual (in either early or late pregnancy)OutcomesGestational weight gain (optimal weight gain defined as 12.1 to 18.0 kg for women with normal pre-pregnancy weight; <strong>and</strong> 7.1 to 12.0 kg for overweightwomen)Results20% of the 301 women with BMI < 25 at first visit had excessive gestational weight gain;55% of the 194 women with BMI ≥ 25 at first visit had excessive gestational weight gain<strong>Eat</strong>ing more in early pregnancyAt least optimal weight gain: aOR 1.00 95% 0.55 to 1.84Excessive weight gain: aOR 1.60 95% CI 0.91 to 2.79<strong>Eat</strong>ing more in late pregnancyAt least optimal weight gain: aOR 3.32 95% 1.81 to 6.09Excessive weight gain: aOR 2.04 95% CI 1.17 to 3.58FollowupConfoundingRisk of biasRelevanceOther commentsTo birthAdjusted for maternal age, gestational length <strong>and</strong> smokingLow to moderate risk of bias: of the 549 women enrolled, 495 (90%) completed the study; 54 women were excluded (17 miscarriage/stillbirths, 5 sets oftwins or triplets, 17 preterm births, 15 missing data); 89 women did not complete FFQ at the second timepoint <strong>and</strong> so only 406 women could beincluded for measures relating to late pregnancy; limited number of confounders used in adjusted analysesLikely to be reasonably relevant to Australian womenPregnancy <strong>and</strong> Breastfeeding Dietary Patterns49
Reference Radesky 2008Food typePrudent pattern (high in vegetables, fruit, legumes, fish, poultry, eggs, salad dressing, <strong>and</strong> whole grains);Western pattern (red <strong>and</strong> processed meats, sugar-sweetened beverages, French fries, high-fat dairy products, desserts, butter <strong>and</strong> refined grains)Study typeProspective cohort studyLevel of evidence II (aetiology)SettingBoston, MA, USAFundingNIH, March of Dimes Birth Defects Foundation, Harvard Medical School Division of Nutrition, Harvard Pilgrim <strong>Health</strong> Care FoundationParticipants1773 women with singleton pregnancies enrolled in Project Viva (initial antenatal visit before 22 weeks gestation, able to complete study forms inEnglish, did not plan to move out of the study area before birthBaseline comparisons Included women had lower pregnancy BMIs than excluded women, were less likely to be African-American or Hispanic, to have low SESDietary assessmentTimingComparisonOutcomesResultsSee confounding belowFFQFFQ completed at first antenatal visit at a mean 11.8 weeks GA (range 5-25.6 weeks) - to assess diet during first trimesterWestern pattern; prudent pattern (quartiles)Glucose tolerance testing at 26-28 weeks gestation – GDM; impaired glucose tolerance (IGT)Normal glucose tolerance defined as: < 140 mg/dL 1 hour after a 50 g glucose load (non-fasting oral glucose challenge test);IGTdefined as ≥ 140 mg/dL on non-fasting oral glucose challenge test but 0 or 1 abnormal result for a fasting glucose tolerance test (100g oral glucoseload where normal = < 95 mg/dL at baseline, < 180 mg/dL at 1 h, < 155 mg/dL at 2 h <strong>and</strong> < 140 mg/dL at 3 h;GDM defined as ≥ 140 mg/dL on non-fasting oral glucose challenge test with 2 or more abnormal GTT results(<strong>For</strong> the 39 women with incomplete glucose testing data, medical records were used to assign them to normal glucose tolerance (n = 7), IGT (n = 10), orGDM (n = 22).GDM (increasing quartiles of Western pattern):Q1: aOR 1 (reference)Q2: aOR 1.14 95% CI 0.56 to 2.29Q3: aOR 1.63 95% CI 0.84 to 3.19Q4: aOR 0.87 95% CI 0.41 to 1.83P for trend = 0.80GDM (increasing quartiles of Prudent pattern):Q1: aOR 1 (reference)Q2: aOR 0.56 95% CI 0.26 to 1.21Q3: aOR 1.06 95% CI 0.55 to 2.05Q4: aOR 1.13 95% CI 0.59 to 2.16P for trend = 0.35FollowupConfoundingCombined GDM/IGT: similar null results (exact numbers not reported in paper)To birthAdjusted for maternal age, pre-pregnancy BMI, ethnicity, family history of diabetes, history of GDM in a prior pregnancy, smoking in index pregnancy;Used energy partition models <strong>and</strong> nutrient density substitution models to study the simultaneous effects of different macronutrients on GDM <strong>and</strong> IGTrisk;Other studies have not adjusted for different types of fats (which may have opposing effects on risk of GDM)Dietary guidelines for pregnant <strong>and</strong> <strong>breastfeeding</strong> women: evidence report50
Risk of biasRelevanceOther commentsLow risk of bias: Of 2128 women who gave birth to a live infant, 24 were excluded for missing or incomplete glucose tolerance testing records; 18 with ahistory of previous type 1 or 2 DM or PCOS with glucose intolerance, 342 missing or implausible first trimester diet information; 11 completion of FFQafter 26 weeks GA (i.e. after glucose tolerance screening) or on an unknown date; leaving 1773 (83.3%) available for analysisLikely to be relevant to Australian womenPaper concludes that “nutritional status entering pregnancy, as reflected by pre-pregnancy BMI, is probably more important than pregnancy diet indevelopment of GDM”Pregnancy <strong>and</strong> Breastfeeding Dietary Patterns51
Reference Rifas-Shiman 2009Dietary patterns Dietary quality (AHEI-P)Study typeProspective cohort studyLevel of evidence II (aetiology)SettingLarge multispecialty urban/suburban group practice in eastern Massachusetts, USAFundingNIH, Harvard Medical School, Harvard Pilgrim <strong>Health</strong> Care FoundationParticipants1,777 women (part of Project Viva)Exclusions: multiple gestations, inability to answer questions in English, plans to move out of the area before birth, GA > 22 completed weeks at initialantenatal visitBaseline comparisons Compared with the overall cohort, participants in this subset had higher educational status but were similar in household income, marital status, nauseastatus age <strong>and</strong> BMIDietary assessment FFQTimingFFQ assessing diet during early pregnancy; <strong>and</strong> at 26-28 weeks gestation assessing diet during the preceding 3 monthsComparisonAHEI-P scores: 90 point scale, each of the following components contributing 10 possible points: vegetables, fruit, ratio of white (poultry or fish) to redmeat, fibre, trans fat, ratio of polyunsaturated to saturated fatty acids, <strong>and</strong> folate, calcium <strong>and</strong> iron from foods [excluded the nuts <strong>and</strong> soy component<strong>and</strong> the alcohol component – tofu <strong>and</strong> soybeans were included in the vegetable component]OutcomesPre-eclampsia, glucose tolerance, pregnancy weight gain, SGA ( < 10 th percentile), LGA (> 90 th percentile)Resultsn = 1,777 for 1 st trimester; 1,666 for 2 nd trimesterLGA (compared with average for GA)AHEI-P score (per 5 points)aOR 0.95 95% CI 0.89 to 1.02 (1st trimester)aOR 0.99 95% CI 0.92 to 1.07 (2 nd trimester)SGA (compared with average for GA)AHEI-P score (per 5 points)aOR 0.92 95% CI 0.82 to 1.02) (1 st trimester)aOR 1.00 95% CI 0.90 to 1.10) (2 nd trimester)Excessive pregnancy weight gain (compared with adequate weight gain) [IOM definitions]AHEI-P score (per 5 points)aOR 0.99 95% CI 0.94 to 1.04) (1 st trimester)aOR 0.99 95% CI 0.94 to 1.04) (2 nd trimester)Inadequate pregnancy weight gain (compared with adequate weight gain) [IOM definitions]AHEI-P score (per 5 points)aOR 0.95 95% CI 0.88 to 1.02) (1 st trimester)aOR 0.99 95% CI 0.92 to 1.07) (2 nd trimester)Pre-eclampsia (compared with normal)AHEI-P score (per 5 points)aOR 0.96 95% CI 0.84 to 1.10) (1 st trimester)aOR 0.87 95% CI 0.76 to 1.00) (2 nd trimester)Dietary guidelines for pregnant <strong>and</strong> <strong>breastfeeding</strong> women: evidence report52
Gestational diabetes (compared with normal glucose status)AHEI-P score (per 5 points)aOR 0.97 95% CI 0.87 to 1.08 (1 st trimester)aOR 0.98 95% CI 0.87 to 1.09) (2 nd trimester)Impaired glucose tolerance (compared with normal glucose status)AHEI-P score (per 5 points)aOR 1.00 95% CI 0.93 to 1.08 (1 st trimester)aOR 0.96 95% CI 0.89 to 1.03) (2 nd trimester)Blood glucose (mg/dL) regression estimateAHEI-P score (per 5 points)-0.64 95% CI -1.25 to -0.02 (1 st trimester)-0.83 95% CI -1.46 to -0.20 (2 nd trimester)FollowupConfoundingRisk of biasRelevanceOther commentsTo birthAdjusted for maternal age, BMI, parity,education, <strong>and</strong> ethnicityLow risk of bias: Results for 1,777 of 2,670 (84%) women enrolled able to be included in the primary analysisLikely to be relevant for Australian womenPregnancy <strong>and</strong> Breastfeeding Dietary Patterns53
Reference Robinson 2007Dietary patterns Prudent diet (high intakes of fruit, vegetables, wholemeal bread, rice <strong>and</strong> pasta <strong>and</strong> low intakes of white bread, added sugar, <strong>and</strong> tinned vegetables)Study typeProspective cohort studyLevel of evidence II (aetiology)SettingSouthamptonFundingMedical Research Council, University of Southampton, British Heart Foundation <strong>and</strong> the Food St<strong>and</strong>ards AgencyParticipants 1434 infants born to women in the Southampton Women’s Survey between 1999 <strong>and</strong> 2003Baseline comparisons Various maternal characteristics used in the regression analysis (see confounding below)Dietary assessment FFQTimingPre-pregnancyComparisonPrudent v less prudent maternal dietOutcomesInfant diet at 6 <strong>and</strong> 12 months (‘infant guidelines’ diet = higher consumption of fruits, vegetables <strong>and</strong> home-prepared foods; ‘adult’ diet = highconsumption of chips, savoury snacks <strong>and</strong> biscuits)ResultsAssociation between maternal prudent diet <strong>and</strong> ‘infant guidelines’ diet6 months: ß 0.196 95% CI 0.135 to 0.257; p < 0.00112 months: ß 0.282 95% CI 0.220 to 0.343; p < 0.001Association between maternal prudent diet <strong>and</strong> ‘adult’ diet6 months: ß -0.074 95% CI -0.132 to -0.015; p < 0.0512 months: ß -0.215 95% CI -0.270 to -0.160; p < 0.001FollowupConfoundingRisk of biasRelevanceOther commentsTo 12 monthsAdjusted for maternal education, age, BMI, smoking status, time spent watching television, age of introducing solid foods to infant, birth orderLow-moderate risk of bias: results available for 1434/1973 (73%) infants at both 6 <strong>and</strong> 12 months of age (no further details given)Likely to be relevant to Australian women‘Infant guidelines’ diet also significantly associated with maternal education, time spent watching television, <strong>and</strong> birth order;‘Adult’ diet also significantly associated with maternal education, maternal age, BMI, smoking status, age of introduction of solid foods, <strong>and</strong> birth orderDietary guidelines for pregnant <strong>and</strong> <strong>breastfeeding</strong> women: evidence report54
Reference Rodriguez-Bernal 2010Dietary patterns Alternate <strong>Health</strong>y <strong>Eat</strong>ing Index for Pregnancy (AHEI-P) – consisting of 10 components of ideal intakes (5 serves of vegetables/day, 4 serves of fruit/day,1 serve of nuts <strong>and</strong> soy/day, ≥ 4:1 ratio of white meat (fish <strong>and</strong> poultry) to red meat, 15 g/day cereal fibre, trans fat ≤ 0.5% of energy), ≥ 1 ratio ofpolyunsaturated to saturated fat, folate (≥ 600 g/day (sic)), iron (≥ 27 mg/day) <strong>and</strong> calcium (≥ 1000 mg/day) intakes from foods. Maximum possible scorewas 100, (10 x 10) with 1 point subtracted for each 10% decrease in intake.Study typeProspective cohort studyLevel of evidence II (aetiology)SettingValencia, Spain (part of the INMA cohort)FundingInstituto de Salud Carlos III, FISFEDER, Conselleria de Sanitat Generalit ValencianaParticipants 787 women (with a singleton live birth between May 2004 <strong>and</strong> February 2006)Baseline comparisons See confounding belowDietary assessment FFQTiming10-13 weeks GA (to reflect diet in first trimester)ComparisonQuintilesOutcomesCustomised fetal growth restriction (weight, length <strong>and</strong> head circumference); taking into account parental (maternal preconception weight, height <strong>and</strong>parity <strong>and</strong> paternal height) <strong>and</strong> newborn variables (sex <strong>and</strong> gestational age). Fetal growth restriction was 80% below the lower limit of the CI.ResultsFGR in weightAHEI-P (range) n OR (95% CI)Q1 (35-47) 149 1.00Q2 (48-51) 154 0.55 (0.28 to 1.08)Q3 (52-55) 140 0.35 (0.16 to 0.76)Q4 (56-60) 166 0.51 (0.26 to 0.99)Q5 (61-75) 173 0.24 (0.10 to 0.55)P for trend = 0.001FGR in lengthAHEI-P (range) n OR (95% CI)Q1 (35-47) 149 1.00Q2 (48-51) 154 1.28 (0.60 to 2.73)Q3 (52-55) 140 0.62 (0.25 to 1.54)Q4 (56-60) 166 1.15 (0.54 to 2.46)Q5 (61-75) 173 0.78 (0.34 to 1.80)P for trend = 0.538FGR in head circumferenceAHEI-P (range) n OR (95% CI)Q1 (35-47) 149 1.00Q2 (48-51) 154 0.46 (0.21 to 0.99)Q3 (52-55) 140 0.49 (0.22 to 1.08)Q4 (56-60) 166 0.60 (0.29 to 1.23)Q5 (61-75) 173 0.40 (0.17 to 0.90)P for trend = 0.070FollowupTo birthConfoundingFGR in weight: adjusted for smoking status, weight gain during first trimester, folic acid supplement usePregnancy <strong>and</strong> Breastfeeding Dietary Patterns55
Risk of biasRelevanceOther commentsFGR in length: adjusted for smoking status, weight gain during first trimester, <strong>and</strong> maternal heightFGR in head circumference: smoking status, caffeine intake during first trimester, parity, maternal height, <strong>and</strong> weight gain during first trimester.Moderate risk of bias: 54% participation rate; dichotomous outcomes adjusted for fewer factors than in the regression analysis (not extracted here) e.g.education levelLikely to be relevant for Australian womenDiffers from Rifas-Shiman 2009 (Project Viva) by retaining nuts <strong>and</strong> soy category in AHEI-P <strong>and</strong> in adjusting for folic, calcium <strong>and</strong> iron supplement use(but only in some analyses)Dietary guidelines for pregnant <strong>and</strong> <strong>breastfeeding</strong> women: evidence report56
Reference Ross 1996Dietary patterns Foods containing DNA topoisomerase II inhibitors: beans, fresh vegetables, canned vegetables, fruits, soy, coffee, wine, black tea, green tea, cocoaStudy type Case control study (Children’s Cancer Group studies E09, E14, E15)Level of evidence III-3 (aetiology)SettingUnited States <strong>and</strong> CanadaFundingUniversity of Minnesota Children’s Cancer Research Fund, NIH, NCIParticipants303 cases diagnosed at one year or less;468 matched controlsBaseline comparisons See confounding belowDietary assessment FFQTimingDuring pregnancyComparisonLow (score < 15: 28% of women) versus medium (score 15-19; 40% of women) versus high exposure (20+; 32% of women);Score = combined total for each food (0 = never; 1 = 1/month; 2 = 1-3/month; 3 = 1-3/week; 4 = 4-6/week; 5 = dailyOutcomesChildhood leukemia: acute lymphoblastic leukemia (ALL); acute myeloid leukemia (AML)ResultsOverall leukemiaCasesORLow 21 1.0Medium 38 2.1 (0.9 to 5.0)High 23 1.1 (0.5 to 2.3)ALL 17 1.0Low 26 1.3 (0.4 to 4.2)Medium 10 0.5 (0.2 to 1.4)HighAMLLow 4 1.0Medium 12 9.8 (1.1 to 84.8)High 10 10.2 (1.1 to 96.4)FollowupConfoundingRisk of biasRelevanceOther commentsn/aAdjusted for maternal educationModerate risk of bias: results available for approx 83% of eligible cases (missing cases due to parental refusal, loss to follow-up <strong>and</strong> other unspecifiedreasons); Canadian mothers were subsequently excluded; adjustment made only for one variable (maternal education); mothers needed to recallexposures of up to 10 years agoLikely to be relevant to Australian womenChildhood leukemias are rare – 32 cases per million livebirths in USA per year; 80% show a genetic abnormality (involving the MLL gene) which isthought to occur in utero; <strong>and</strong> these are predominantly AMLPregnancy <strong>and</strong> Breastfeeding Dietary Patterns57
Reference Shaheen 2009Dietary patterns 5 dietary patterns (see Comparisons below)Study typeProspective cohort study: from ALSPACLevel of evidence II (aetiology)SettingAvon, UK (part of ALSPAC)FundingUK MRC, Wellcome Trust, University of Bristol, Asthma UKParticipants14,062 childrenBaseline comparisons See Confounding belowTimingWomen completed FFQ at 32 weeks gestationComparisons ‘<strong>Health</strong> conscious’ salad, fruit, fruit juices, rice, pasta, oat/bran based breakfast cereals, fish, pulses, cheese, non-white bread; ‘Traditional’ vegetables, red meat, poultry; ‘Processed’ meat pies, sausages, burgers, fried foods, pizza, chips, crisps, white bread, eggs, baked beans; ‘Vegetarian’ meat substitutes, pulses, nuts, herbal tea; ‘Confectionery’ chocolate, sweets, biscuits, cakes, puddings.OutcomesEczema, wheezing, asthma, hayfever, atopy, pulmonary functionResults OR (95% CI) aOR (95% CI)Transient infant wheeze at 6 months (n = 8886)<strong>Health</strong> conscious 0.88 (0.83 to 0.94) 0.98 (0.90 to 1.06)Traditional 0.94 (0.88 to 1.10) 0.95 (0.89 to 1.02)Processed 1.12 (1.05 to 1.20) 0.99 (0.91 to 1.08)Confectionery 1.02 (0.96 to 1.09) 1.03 (0.95 to 1.10)Vegetarian 1.00 (0.94 to 1.07) 1.00 (0.94 to 1.06)Later onset wheeze at 6 months (n = 8886)<strong>Health</strong> conscious 0.94 (0.87 to 1.02) 0.93 (0.84 to 1.03)Traditional 1.00 (0.93 to 1.09) 1.00 (0.92 to 1.09)Processed 1.10 (1.01 to 1.20) 1.03 (0.93 to 1.13)Confectionery 1.00 (0.93 to 1.08) 0.96 (0.87 to 1.06)Vegetarian 0.94 (0.87 to 1.02) 0.92 (0.85 to 1.00)Persistent wheeze at 6 months (n = 8886)<strong>Health</strong> conscious 0.78 (0.70 to 0.87) 1.00 (0.86 to 1.16)Traditional 0.95 (0.85 to 1.06) 0.96 (0.86 to 1.08)Processed 1.27 (1.15 to 1.40) 1.00 (0.88 to 1.13)Confectionery 1.02 (0.91 to 1.14) 1.02 (0.90 to 1.16)Vegetarian 1.07 (0.98 to 1.17) 1.06 (0.96 to 1.16Eczema at 2.5 years (n = 9516)<strong>Health</strong> conscious 1.12 (1.07 to 1.17) 1.06 (0.99 to 1.12)Traditional 0.99 (0.95 to 1.04) 1.00 (0.95 to 1.05)Processed 0.95 (0.90 to 1.00) 0.97 (0.91 to 1.03)Confectionery 1.02 (0.97 to 1.07) 1.03 (0.97 to 1.08)Dietary guidelines for pregnant <strong>and</strong> <strong>breastfeeding</strong> women: evidence report58
Vegetarian 0.98 (0.94 to 1.03) 0.99 (0.94 to 1.04)Eczema at 7.5 years (n = 7693)<strong>Health</strong> conscious 1.12 (1.05 to 1.19) 1.04 (0.95 to 1.13)Traditional 0.99 (0.93 to 1.06) 0.99 (0.92 to 1.05)Processed 0.95 (0.89 to 1.02) 0.96 (0.88 to 1.05)Confectionery 1.04 (0.97 to 1.10) 1.03 (0.95 to 1.11)Vegetarian 1.02 (0.96 to 1.08) 1.01 (0.95 to 1.08)Wheezing at 3.5 years (n = 8886)<strong>Health</strong> conscious 0.90 (0.84 to 0.96) 0.96 (0.88 to 1.05)Traditional 0.99 (0.93 to 1.06) 1.00 (0.93 to 1.07)Processed 1.14 (1.07 to 1.22) 1.02 (0.94 to 1.10)Confectionery 1.00 (0.94 to 1.07) 0.98 (0.91 to 1.06)Vegetarian 0.99 (0.93 to 1.05 0.97 (0.91 to 1.04)IgE at 7 years (n = 4819) GM ratio<strong>Health</strong> conscious 1.07 (1.02 to 1.13) 1.07 (1.00 to 1.14)Traditional 0.98 (0.93 to 1.02) 0.96 (0.91 to 1.00)Processed 1.01 (0.96 to 1.06) 0.97 (0.91 to 1.04)Confectionery 1.00 (0.96 to 1.05) 1.00 (0.94 to 1.06)Vegetarian 1.05 (1.01 to 1.10) 1.07 (1.02 to 1.12)Hay fever at 7.5 years (n = 7674)<strong>Health</strong> conscious 1.06 (0.98 to 1.15) 1.00 (0.91 to 1.11)Traditional 1.06 (0.98 to 1.15) 1.04 (0.96 to 1.13)Processed 0.91 (0.82 to 1.00) 0.93 (0.83 to 1.04)Confectionery 1.02 (0.94 to 1.10) 1.01 (0.92 to 1.11)Vegetarian 0.96 (0.89 to 1.05) 0.97 (0.89 to 1.06)Bronchial responsiveness at 8-9 years GM ratio<strong>Health</strong> conscious 0.99 (0.94 to 1.05) 1.01 (0.94 to 1.08)Traditional 1.01 (0.96 to 1.07) 1.02 (0.97 to 1.08)Processed 1.01 (0.95 to 1.07) 1.03 (0.96 to 1.10)Confectionery 0.96 (0.91 to 1.01) 0.96 (0.90 to 1.02)Vegetarian 1.02 (0.97 to 1.08) 1.03 (0.98 to 1.08)Lung function (FEV1) at 8-9 years: n = 6192 (unadjusted <strong>and</strong> adjusted difference (SDs) <strong>and</strong> 95% CIs)<strong>Health</strong> conscious 0.03 (0.01 to 0.06) 0.02 (-0.01 to 0.06)Pregnancy <strong>and</strong> Breastfeeding Dietary Patterns59
Traditional 0.02 (-0.01 to 0.05) 0.02 (-0.01 to 0.05)Processed -0.03 (-0.06 to -0.00) -0.02 (-0.06 to 0.01)Confectionery -0.01 (-0.03 to 0.02) -0.01 (-0.04 to 0.02)Vegetarian 0.01 (-0.02 to 0.03) 0.01 (-0.01 to 0.04)Lung function (FVC) at 8-9 years: n = 6285 (unadjusted <strong>and</strong> adjusted difference (SDs) <strong>and</strong> 95% CIs)<strong>Health</strong> conscious 0.01 (-0.01 to 0.04) 0.01 (-0.03 to 0.04)Traditional 0.02 (-0.01 to 0.04) 0.02 (-0.01 to 0.04)Processed -0.05 (-0.07 to -0.02) -0.04 (-0.07 to -0.01)Confectionery -0.01 (-0.03 to 0.02) -0.00 (-0.03 to 0.03)Vegetarian 0.02 (-0.01 to 0.04) 0.02 (-0.01 to 0.05)FollowupConfoundingRisk of biasRelevanceOther commentsUp to 8-9 yearsMaternal factors during pregnancy (energy intake, smoking, infections, antibiotics <strong>and</strong> paracetamol); other maternal factors (educational level, housingtenure, financial difficulties, pre-pregnancy BMI, ethnicity, age, parity, history of asthma, eczema, rhinoconjunctivitis, migraine); sex of child, gestationalage, breast fed in first 6 months, day care at 8 months, multiple pregnancy, pets in infancy, damp/condensation/mould, child exposed to environmentaltobacco smoke at weekends, season of birth, season of FFQ completion, birth weight, head circumference, birth length. Also number of youngersiblings <strong>and</strong> child’s BMI at 7 years for later childhood outcomes.Moderate risk of bias: 37% attrition at 6 months – attrition “was greatest among families of lower socioeconomic status” (no other details given). Havenot controlled for child’s own diet; ‘over’-adjusted in other areas?Likely to be relevant to Australian womenDietary guidelines for pregnant <strong>and</strong> <strong>breastfeeding</strong> women: evidence report60
Reference Siega-Riz 2001Dietary patterns Meal patterns in second trimester of pregnancy (reported number of meals (breakfast, lunch <strong>and</strong> dinner) <strong>and</strong> snacks consumed per day);Optimal meal pattern was defined as three meals <strong>and</strong> two or more snacks per dayStudy typeProspective cohort studyLevel of evidence II (aetiology)SettingData from Pregnancy, Infection <strong>and</strong> Nutrition (PIN) Study, USAFundingNICHHD, Institute of Nutrition, Wake Area <strong>Health</strong> Education Center, North Carolina, USAParticipants2065 predominantly lower-to-middle income women between 24 <strong>and</strong> 29 weeks gestation recruited from August 1995 to December 1998; 42% African-American womenBaseline comparisons Risk of preterm birth was slightly higher among the successfully recruited women than among those who refusedSee confounding belowDietary assessment FFQTimingDiet assessed at 24-29 weeks GA to reflect diet during the second trimesterComparisonReferent group: women who ate three meals <strong>and</strong> two or more snacks a dayOutcomesPreterm birth (< 37 weeks); early preterm birth (< 34 weeks); premature rupture of the membranesResultsMeal Pattern % of women % preterm birth3 Meals plus 2 or more snacks 71.5 10.63 meals plus no snacks 4 16.63 meals plus 1 snack 0.2 02 meals plus no snacks 0.5 9.02 meals plus 1 snack 14.5 12.42 meals plus 2 or more snacks 7.8 13.81 meal regardless of number of snacks 1.0 19.0Preterm birth (less optimal versus optimal meal pattern)Crude RR: 1.27 95% 0.98 to 1.63aOR: 1.30 95% CI 0.96 to 1.76Early preterm birthCrude RR: 1.56 95% CI 0.92 to 2.63aOR: 1.57 95% CI 0.88 to 2.79Preterm LabourCrude RR: 1.0 95% CI 0.61 to 1.65aOR: 1.11 95% CI 0.64 to 1.89Premature rupture of the membranesCrude RR: 1.91 95% CI 1.09 to 3.33aOR: 1.87 95% CI 1.02 to 3.43FollowupConfoundingTo birthAdjusted for pregravid BMI, total energy intake, supplement use (other potential confounders discarded from model due to lack of influence);Further adjustment restricted to spontaneous preterm birth only made little difference to estimates of effectPregnancy <strong>and</strong> Breastfeeding Dietary Patterns61
Risk of biasRelevanceOther commentsLow risk of bias: Of 4160 eligible women, 2,505 (60%) were successfully recruited into the PIN study; 2247 (90%) completed the FFQ; 2065 women hadsufficiently complete data for analysisDifferent ethnic mix compared with AustraliaWomen who consumed meals less frequently were slightly heavier prior to pregnancy, older <strong>and</strong> less compliant with taking their antenatal supplement;The total energy requirement of women consuming 3 meals plus 2 or more snacks a day was significantly higher than that of women with less than theoptimal frequency of food intakeDietary guidelines for pregnant <strong>and</strong> <strong>breastfeeding</strong> women: evidence report62
Reference Stuebe 2009Dietary patterns Vegetarian diet (defined as a diet that “excludes certain animal products” )Study typeProspective cohort study (Project Viva)Level of evidence II (aetiology)Setting8 urban <strong>and</strong> suburban obstetric offices of a multispecialty group practice in eastern Massachusetts, USAFundingUS NIH, Harvard Medical School, Harvard Pilgrim <strong>Health</strong> Care FoundationParticipants1338 women giving birth to a live singleton infant, < 22 weeks gestation at study entry; 379 (27%) were overweight (BMI ≥ 26); 703 (51%) experiencedexcessive weight gainExclusions: not fluent in EnglishBaseline comparisons See confounding belowDietary assessment FFQTimingAdministered in first <strong>and</strong> second trimesters of pregnancyComparisonVegetarian diet in first <strong>and</strong> second trimester versus not vegetarianOutcomes Excessive gestational weight gain (IOM 1990)ResultsExcessive gestational weight gain: vegetarian vs no vegetarian diet:1 st trimester: aOR 0.45 95% CI 0.27 to 0.762 nd trimester: aOR 0.70 95% CI 0.40 to 1.201 st trimester: multivariate logistic regression model:aOR 0.48 95% CI 0.48 to 0.81-1.65 kg 95% CI -2.79 to -0.51FollowupConfoundingRisk of biasRelevanceOther commentsTo birthAdjusted for pre-pregnancy BMI, maternal age, race/ethnicity, smoking status, gestational age at birth, nausea in first trimester in pregnancyLow risk of bias: Of 2083 eligible women, 1388 (67%) of women had data available for analysis (31 had missing information on pre-pregnancy BMI <strong>and</strong>gestational weight gain; 226 had missing covariate information <strong>and</strong> 438 had missing data on either first or second-trimester diet <strong>and</strong> mid-pregnancyphysical activity); included women were less likely to be African-American or Hispanic, to be younger, multiparous <strong>and</strong> obeseLikely to be relevant to Australian womenPregnancy <strong>and</strong> Breastfeeding Dietary Patterns63
Reference Thompson 2010Dietary patterns 1) Traditional (meat (lamb in particular), potatoes, carrots (<strong>and</strong> other root vegetables), peas, gravy <strong>and</strong> meat dishes such as cottage pie, apples/pears,citrus fruit, kiwifruit/feijoas, bananas, green vegetables, maize, dairy food, yoghurt <strong>and</strong> water);2) Junk (icecream, sweet biscuits, scones, cakes, sweetened cereal, crisps, pies, lollies, chocolate bars, iceblocks <strong>and</strong> milo (chocolate energy drink);3) Fusion (fruits, fried rice/noodles, boiled rice/pasta, fish/shellfish, milk <strong>and</strong> low intake for tea/coffee, sherry/wine <strong>and</strong> hard cheeses).Study typeCase-controlLevel of evidence III-3 (aetiology)SettingNew Zeal<strong>and</strong>Funding<strong>Health</strong> Research Council of New Zeal<strong>and</strong>, Foundation for the Newborn, Child <strong>Health</strong> Research FoundationParticipantsMothers of 1714 children born between October 1995 <strong>and</strong> November 1997 (844 born SGA <strong>and</strong> 870 born appropriate for GA)Baseline comparisons Different dietary patterns were associated with multiple different socio-demographic characteristicsDietary assessment FFQTimingAfter birth (for diet in first <strong>and</strong> last month of pregnancy)ComparisonFusion v junk v traditional dietsOutcomesSGA (≤ 10th percentile for sex <strong>and</strong> gestation)ResultsSGAFusionOR 1.07 95% CI 0.95 to 1.21aOR 1.02 95% CI 0.85 to 1.21JunkOR 0.97 95% CI 0.70 to 1.09aOR 1.01 95% CI 0.88 to 1.17TraditionalOR 0.79 95% CI 0.70 to 0.89aOR 0.86 95% CI 0.75 to 0.99FollowupConfoundingRisk of biasRelevanceOther commentsTo birthAdjusted for gestation, infant sex, maternal smoking in pregnancy, maternal pre-pregnancy height <strong>and</strong> weight, parity, ethnicity <strong>and</strong> maternalhypertensionLow risk of bias (in addition to that inherent in a study with a case-control design such as recall bias)Not clear if these three patterns reflect dietary patterns of pregnant Australian womenPresented only the results for early diet, as relationships with late diet were very similarDietary guidelines for pregnant <strong>and</strong> <strong>breastfeeding</strong> women: evidence report64
Reference Tieu 2008Dietary patterns Low v high glycaemic indexStudy typeSRLevel of evidence I (intervention)SettingTrials from North America <strong>and</strong> AustraliaFundingPart funding from the Australian Department of <strong>Health</strong> <strong>and</strong> AgeingParticipants3 RCTs (total of 107 women)Baseline comparisons NADietary assessment NATimingDuring pregnancyComparisonLow versus high glycaemic diet during pregnancyOutcomesLGA, birthweight, ponderal index, maternal fasting glucose concentrationsResultsIn one trial of 62 women, there were significantly fewer large for gestational age infants when women adopted a low GI diet:RR 0.09, 95% CI 0.01 to 0.69Ponderal index: mean difference (MD) -0.18 95% CI -0.32 to -0.04 (two trials; 82 women)Results for women on the LGI diet on birthweight were not conclusive under a r<strong>and</strong>om-effects model (two trials; WMD -527.64 g, 95% CI -1119.20 to63.92);Maternal fasting glucose concentrations: MD -0.28 mmol/L 95% CI -0.54 to -0.02 (two trials, 82 women).Maternal weight gain during pregnancy: MD -3.33 kg 95% CI -12.73 to 6.08 (two trials, 82 women)FollowupConfoundingRisk of biasRelevanceOther commentsTo birthNALow risk of biasLikely to be relevant to Australian womenOne of the trials also included a st<strong>and</strong>ard exercise regimen for all participantsPregnancy <strong>and</strong> Breastfeeding Dietary Patterns65
Reference Uusitalo 2009Dietary patterns Seven dietary patterns: Fast food (sweets, fast food, snacks, chocolate, fried potatoes, soft drinks, high-fat pastry, cream, fruit juices, white bread, savoury, processedmeat, sausage, eggs [low loading for wholegrain bread <strong>and</strong> potatoes]) Alcohol <strong>and</strong> butter (beer, wine <strong>and</strong> liquor, butter, salad dressing, soft drinks [low loading of soft margarine 80%, fruits, breakfast cereals, fruit juices,high-fat milk]) <strong>Health</strong>y (leafy vegetables, cabbage, fish, vegetarian dishes, legumes <strong>and</strong> mushrooms, roots, berries, salad dressing, breakfast cereals, poultry,fruits, nuts <strong>and</strong> seeds, rice <strong>and</strong> pasta, eggs, low-fat cheese, low-fat sour milk, meat dishes, cream, processed vegetables) Traditional bread (low-fat pastry, whole grain bread, high-fat pastry, tea, high-fat cheese, sugar <strong>and</strong> jam, berry juices, potatoes, breakfast cereals,butter, processed meat, savoury, nuts <strong>and</strong> seeds, meat dishes, high-fat sour milk, berries) Traditional meat (meat, meat dishes, sausage, potatoes, processed meat, soft margarine 80%, organ meat, processed vegetables [low loading fornuts <strong>and</strong> seeds, breakfast cereals]) Low fat (spread (butter-vegetable oil 40-60%; soft margarine 40-60%), low-fat cheese, low-fat milk, processed meat, wholegrain bread, low-fat sourmilk, light soft drinks [low loading for high-fat milk, high-fat sour milk, soft margarine 80%) Coffee (coffee, milk in coffee, high-fat milk, low-fat pastry, sausage [low loading of tea])Study typeRetrospective cohort studyLevel of evidence III-3 (aetiology)SettingOulu <strong>and</strong> Tampere, Finl<strong>and</strong> (Finnish Birth Registry); part of the Finnish Type 1 Diabetes Prediction <strong>and</strong> Prevention (DIPP) Nutrition StudyFundingAcademy of Finl<strong>and</strong>, Finnish Diabetes Association, Finnish Diabetes Research Foundation, Finnish Pediatric Research Foundation, Juho VainioFoundation, Yrjo Jahnsson Foundation, Alma <strong>and</strong> K. A. Snellman Foundation, European Foundation for the Study of Diabetes, Special Public Grants formedical research at participating university hospitals, Juvenile Diabetes Research Foundation International, Novo Nordisk Foundation, EU Biomed 2.Participants3360 women giving birth in 1997-2002 whose baby carried human leucocyte antigen-conferred susceptibility to type 1 diabetesBaseline comparisons Not reported (only overall baseline characteristics)Dietary assessment FFQTimingFFQ after birth; reflecting diet during the 8 th month of pregnancyComparisonSeven dietary patterns: See Dietary patterns aboveOutcomesMaternal weight gainResultsMean maternal weight gain rate (kg/week) [SE]Dietary pattern 1 st quartile (lowest) 2 nd quartile 3 rd quartile 4 th quartile highest P for trend<strong>Health</strong>y 0.427 [0.005] 0.435 [0.005] 0.431 [0.005] 0.416 [0.005] 0.059- adjusted* 0.431 [0.010] 0.441 [0.010] 0.435 [0.010] 0.423 [0.010] 0.109Fast food 0.401 [0.005] 0.442 [0.005] 0.436 [0.005] 0.450 [0.005] < 0.0001- adjusted* 0.412 [0.010] 0.429 [0.010] 0.439 [0.010] 0.455 [0.010] < 0.0001Traditional meat 0.432 [0.005] 0.433 [0.005] 0.431 [0.005] 0.431 [0.005] 0.022- adjusted* 0.431 [0.010] 0.434 [0.010] 0.440 [0.010] 0.426 [0.010] 0.262Traditional bread 0.407 [0.005] 0.434 [0.005] 0.429 [0.005] 0.438 [0.005] 0.0002- adjusted* 0.414 [0.010] 0.438 [0.010] 0.433 [0.009] 0.444 [0.010] 0.0002Low fat 0.434 [0.005] 0.419 [0.005] 0.433 [0.005] 0.423 [0.005] 0.123- adjusted* 0.435 [0.009] 0.425 [0.010] 0.438 [0.010] 0.435 [0.010] 0.252Coffee 0.429 [0.005] 0.436 [0.005] 0.429 [0.005] 0.415 [0.005] 0.046- adjusted* 0.428 [0.010] 0.437 [0.010] 0.436 [0.010] 0.429 [0.009] 0.443Alcohol <strong>and</strong> butter 0.443 [0.005] 0.436 [0.005] 0.423 [0.005] 0.407 [0.005] < 0.0001- adjusted* 0.443 [0.010] 0.438 [0.010] 0.431 [0.010] 0.421 [0.010] 0.014Dietary guidelines for pregnant <strong>and</strong> <strong>breastfeeding</strong> women: evidence report66
‘Fast food’ – pregnant women in highest quartile gained 1.3 kg more weight on average during pregnancy than the lowest quartile;Respective figures for ‘traditional bread’ <strong>and</strong> ‘alcohol <strong>and</strong> butter’ were +0.9 kg <strong>and</strong> –0.7 kgFollowup 39 th gestational week (range 24-44 weeks): mean follow-up time (from first antenatal visit) was 29.2 weeks SD 3.0.Confounding*maternal weight gain analysis was adjusted for maternal age, initial BMI, parity, vocational education, smoking, place of residence, birthweight of baby,gestational week of the first weight measurementRisk of biasLow risk of bias: 71% (3783/5362) DIPP study mothers took part in this study; data available for 3360/3783 (89%) of these women (53 women hadincomplete FFQ, 98 twin or triplet pregnancies, 272 women with incomplete weight gain information)RelevanceLikely to be reasonably relevant to Australian womenOther commentsPregnancy <strong>and</strong> Breastfeeding Dietary Patterns67
Reference Vujkovic 2009Dietary patterns Mediterranean diet (high intakes of vegetables, fruit, legumes, vegetable oil, cereal products, alcohol <strong>and</strong> fish; <strong>and</strong> low intakes of potatoes, sugar <strong>and</strong>confectionery, sauces <strong>and</strong> condiments)Study typeCase-controlLevel of evidence III-3 (Aetiology)Setting8 clinics in the Netherl<strong>and</strong>s, 1999-2001 (part of a case-control study of 77 mothers of children with spina bifida <strong>and</strong> 151 control mothers)FundingNetherl<strong>and</strong>s Organization for Scientific ResearchParticipants50 mothers of children with spina bifida <strong>and</strong> 81 control mothers (specifically Dutch Caucasian mothers <strong>and</strong> children with nonsyndromicmeningo(myelo)cele)Exclusion criteria were: pregnant or <strong>breastfeeding</strong> at the time of the current study, consanguinity, a familial relationship between the case <strong>and</strong> controlfamilies, maternal diabetes mellitus, changed diet compared to periconception period (4 weeks before to 8 weeks after conception, severe nausea<strong>and</strong>/or vomiting starting after the first week of pregnancy resulting in a changed or decreased food intake, mothers whose nutritional intake data <strong>and</strong>/orbiomarkers were incomplete.Baseline comparisons Case mothers had a slightly higher BMI, lower education, <strong>and</strong> used less folic acid supplements <strong>and</strong> alcohol at the time of the study (<strong>and</strong> case mothersalso used less alcohol in the periconceptional period).TimingFFQ at 14 months after the birth of the index child, covering intake in the previous three monthsComparisonWeak versus strong use of a Mediterranean diet (lowest v higher quartiles)OutcomesRisk of spina bifidaResultsSpina bifida (Principal component factor analysis (PCA))Lowest v higher quartiles: 18 v 32 children with spina bifida compared with 14 v 67 in control group:crude OR 2.7 95% CI 1.2 to 6.1; adjusted OR 2.3 95% CI 0.9 to 5.6Reduced rank regression (RRR)Lowest v higher quartiles: 20 v 30 children with spina bifida compared with 13 v 68 in control group:crude OR 3.5 95% 1.5 to 7.9; adjusted OR 3.5 95% CI 1.5 to 8.2)FollowupConfoundingRisk of biasRelevanceOther commentsNA (case control study)Mediterranean diet was associated with a higher maternal age at birth of the index child, higher education <strong>and</strong> more alcohol consumption (at time of thestudy <strong>and</strong> in the periconceptional period). Adjustments for confounders including maternal BMI, age at the index pregnancy <strong>and</strong> periconceptional folicacid supplementation did not significantly differ from unadjusted analyses for dietary pattern assessed by reduced rank regression but for PCA, theadjusted analysis was no longer statistically significant (see Results above).Analyses were not adjusted for level of education because “there was a strong association between education <strong>and</strong> use of the Mediterranean diet”.Moderate risk of bias:Recall bias – women may not have been able to accurately recall whether their current diet was similar to their diet in the periconception period;Losses - 18/77 case mothers <strong>and</strong> 38/151 control mothers were excluded due to excessive vomiting <strong>and</strong>/or a reported change in nutritional intake in thepericonception period compared with time of the study; a further 4 case mothers <strong>and</strong> 4 control mothers were excluded because information onexcessive vomiting in the periconception period <strong>and</strong>/or change in nutritional pattern was lacking; 5 case mothers <strong>and</strong> 28 control mothers were excludedbecause of incomplete FFQs.All women were Caucasian; food fortification with folate was not m<strong>and</strong>atoryDietary guidelines for pregnant <strong>and</strong> <strong>breastfeeding</strong> women: evidence report68
Reference Vujkovic 2007Dietary patterns Western diet (high in meat, pizza, legumes <strong>and</strong> potatoes <strong>and</strong> low in fruits); Prudent diet (high intakes of fish, garlic, nuts, <strong>and</strong> vegetables <strong>and</strong> higherfrequency of hot meals per day)Study typeCase-controlLevel of evidence III-3 (aetiology)SettingNetherl<strong>and</strong>sFundingRoyal Netherl<strong>and</strong>s Academy of Arts <strong>and</strong> Sciences, Mother <strong>and</strong> Child Centre, University Medical Center, RotterdamParticipants481 Dutch European mothers (203 with a child with cleft lip or cleft palate <strong>and</strong> 178 controls)Exclusions: pregnant, <strong>breastfeeding</strong>, current folic acid supplement use, a different current diet than in the preconception period, hyperemesis or nauseain pregnancy.Baseline comparisons See confounding belowDietary assessment FFQTimingAssessed 14 months after the birth of the index child (to estimate preconception intake)ComparisonTertiles of western diet; tertiles of prudent dietOutcomesCleft lip, cleft palate, [BMI at time of study]ResultsCleft lip or palate or bothn/N OR (95% CI) aOR1 (95% CI) aOR cleft palate only (95% CI)CasesControlsWesternT1 58/127 (28.6%) 69 (38.8%) 1.00 1.00 1.00T2 67/127 (33.0%) 60 (33.7) 1.3 (0.8 to 2.2) 1.2 (0.7 to 2.1) 1.2 (0.8 to 2.1)T3 78/127 (38.4%) 49 (27.5%) 1.9 (1.2 to 3.1) 1.7 (1.0 to 3.0) 1.8 (1.0 to 2.9)PrudentT1 68/127 (33.5%) 59 (33.1%) 1.00 1.00 1.00T2 64/127 (31.5%) 63 (35.4%) 0.9 (0.5 to 1.4) 0.8 (0.5 to 1.4) 0.7 (0.5 to 1.2)T3 71/127 (35.0%) 56 (31.5%) 1.1 (0.7 to 1.8) 1.7 (1.0 to 3.0) 1.3 (0.6 to 1.7)BMI at 14 months postpartum, median (5 th percentile, 95 th percentile)(N = 164; 83 case mothers, 81 control mothers)WesternT1 23.3 (18.8, 30.9)T2 23.9 (20.1, 30.5)T3 25.9 (20.7, 39.6)P value for trend 0.01PrudentT1 24.0 (20.1, 35.9)T2 25.0 (17.8, 37.2)T3 23.8 (19.6, 30.2)P value for trend 0.75FollowupNAPregnancy <strong>and</strong> Breastfeeding Dietary Patterns69
Confounding 1) Western diet adjusted for maternal education, smoking, alcohol consumption, periconception folic acid intake <strong>and</strong>/or multivitamin intake2) Prudent diet adjusted for maternal education, periconception folic acid intake <strong>and</strong>/or multivitamin intakeRisk of biasLow risk of bias: 381/442 (86.2%) women’s data available – 22 case <strong>and</strong> 39 control mothers were excluded; inherent risk of recall bias with study designRelevanceLikely to be relevant to Australian womenOther commentsDietary guidelines for pregnant <strong>and</strong> <strong>breastfeeding</strong> women: evidence report70
Reference Wolff 1995Dietary patterns Seven patterns: nutrient dense (frequent consumption of vitamin A <strong>and</strong> vitamin C rich fruits <strong>and</strong> vegetables; other fruits <strong>and</strong> vegetables <strong>and</strong> low fat dairyproducts such as skim milk, low fat milk <strong>and</strong> yoghurt (“most consistent with dietary recommendations”); traditional (frequent consumption of flour <strong>and</strong>corn, legumes (including nuts <strong>and</strong> seeds, high fat meats, sugar (including soft drinks)); transitional (high in fats <strong>and</strong> oils, breads <strong>and</strong> cereals, non vitaminA <strong>and</strong> C rich vegetables, high fat meats <strong>and</strong> sugar), nutrient dilute (salty snacks (chips, popcorn, pretzels), non-dairy desserts = high calorie, high insodium <strong>and</strong> sugar); protein rich (high consumption of dairy desserts, low fat meat (fish <strong>and</strong> poultry) <strong>and</strong> processed meats); high fat dairy foods (wholemilk <strong>and</strong> cheese, soups); mixed (mixed dishes, soup, processed meats)Study typeProspective cohort studyLevel of evidence II (aetiology)SettingUnited States Hispanic <strong>Health</strong> <strong>and</strong> Nutrition Examination SurveyFundingNot reportedParticipants549 Mexican American mothers <strong>and</strong> their children (n = 778); singleton pregnancies. Women pregnant at the time of the survey <strong>and</strong> women withdiabetes were excludedBaseline comparisons See confounding belowDietary assessment Factor analysis <strong>and</strong> FFQTimingNot statedComparisonSeven dietary patterns as described aboveOutcomesBirthweightResultsRegression analysis for birthweight was significant for:Regression coefficient SE p valueNutrient dense pattern 20.4 4.6 0.0001Nutrient dilute pattern -22.2 10.0 0.05Protein rich pattern 36.1 14.1 0.05Transitional patternDescribed as being negatively correlated with birthweight (actual numbers not reported)FollowupConfoundingRisk of biasRelevanceOther commentsTo birthStepwise regression conducted but not clear how this adjusted for confoundersModerate risk of bias: unclear how adjustment for potential confounders was done; amount of missing data not clearMexican American diet different from that of Australian womenPregnancy <strong>and</strong> Breastfeeding Dietary Patterns71
Reference Xiang 2005Dietary patterns Chinese (staples of rice, steamed bun, noodles, Chinese cabbage, bean curd <strong>and</strong> pork) v Swedish dietary pattern (bread, potato, pasta, milk, sour milk<strong>and</strong> cheese) - further details in Table III of paperStudy typeProspective (partly retrospective) cohort study <strong>and</strong> concurrent comparisonLevel of evidence II (aetiology)SettingBeijing, China <strong>and</strong> Stockholm, SwedenFundingNot reportedParticipants40 lactating women (23 Chinese women (23 infants) <strong>and</strong> 17 Swedish women (19 infants))Baseline comparisons Similar except for lower weight for Chinese womanDietary assessment 3 day dietary recordsTimingDiet assessed 3 months after birthComparisonDiets of Chinese <strong>and</strong> Swedish womenOutcomesBirthweight, birth length, weight gain at 3 months, length gain at 3 months, breastmilk composition (long-chain polyunsaturated fatty acids (LC-PUFAs))ResultsSummary: Breastmilk of Chinese women is less balanced in regard to LC-PUFAs than Swedish women; <strong>and</strong> infant growth did not differ significantlybetween the two groupsBreastmilk of Chinese women is significantly richer in linoleic acid (LA) <strong>and</strong> lower in eicosapentaenoic acid (EPA) <strong>and</strong> docosahexaenoic acid (DHA)than that of Swedish womenWeight gain at 3 months (g/kg/d)Chinese infants (n = 21): 9.68 SD?0.58Swedish infants (n= 19): 8.56 SD?0.39Length gain at 3 months (cm/wk)Chinese infants (n = 16): 0.90 SD?0.05Swedish infants (n= 19): 0.96 SD?0.03FollowupConfoundingRisk of biasRelevanceOther commentsTo 3 monthsNo mention of any adjustment for confoundingModerate risk of bias: no adjustment for potential confounders; not clear if the variance measure is SDSwedish diet closer to the diet of most Australian womenStudy underpowered to detect infant growth differencesDietary guidelines for pregnant <strong>and</strong> <strong>breastfeeding</strong> women: evidence report72
Reference Zeiger 1989; Zeiger 1995Dietary patterns Combined maternal <strong>and</strong> infant dietary avoidance regimen versus st<strong>and</strong>ard dietsStudy typeRCTLevel of evidence II (intervention)SettingSan Diego, USAFundingMead Johnson Nutritional Division, Lincoln Diagnostic Laboratories, Marion Laboratories, PharmaciaParticipants379 infants born to allergic parents between November 1981 <strong>and</strong> July 1984; families were included in the study if at least one parent had a history of anatopic disorder <strong>and</strong> specific IgE by skin or RAST testing ;288 families were evaluated at 4 months (103 from the dietary avoidance group <strong>and</strong> 185 from the control group)Baseline comparisons NADietary assessment NATimingMother: last trimester of pregnancy <strong>and</strong> while <strong>breastfeeding</strong>Infant: when <strong>breastfeeding</strong> was supplemented or stoppedComparisonDietary avoidance group:Mother: total avoidance of milk (dairy food), egg, <strong>and</strong> peanut products; avoidance of concentrated soy foods (e.g. tofu) <strong>and</strong> limit of 2 daily serves ofwheat, using other grains to meet cereal <strong>and</strong> starch requirementsInfant: casein hydrolysate formula when <strong>breastfeeding</strong> stopped or was supplemented – until 12 months; solid foods introduced to these infants at 6months, starting with nonlegume vegetables, followed rice cereal at 7 months, meats at 8 months, noncitrus fruits <strong>and</strong> juices at 9 months, cow’smilk at12 months <strong>and</strong> wheat, soy, corn <strong>and</strong> citrus thereafter at monthly intervals. Egg to be started at 24 months <strong>and</strong> peanut <strong>and</strong> fish at 36 monthsversusSt<strong>and</strong>ard diet group: pregnant <strong>and</strong> <strong>breastfeeding</strong> women were encouraged to follow st<strong>and</strong>ard diets; a cow’s milk based whey infant formula wasprovided for supplementation or weaning thorugh the first year; solids foods were introduced as follows (no solids until four months when cereal wasintroduced, followed by vegetables, fruits <strong>and</strong> egg yolks at 6 months, meats at 8 months, <strong>and</strong> whole cow’s milk <strong>and</strong> egg whites at 12 months)OutcomesAtopic dermatitis (three probable or four definite of pruritus, typical morphology <strong>and</strong> distribution, tendency toward chronicity or recurrence <strong>and</strong>concurrent specific IgE at the time the rash was present);Urticaria angioedema (on basis of morphology – definite when physician confirmed or unduly severe or probable when parentally reported <strong>and</strong>consistent in morphology);Allergic rhinitis (characteristic sneezing, itching <strong>and</strong>/or rhinorrhea with existing IgE <strong>and</strong> nasal eosonophiliaGI disease (vomiting or diarrhoea after ingestion of an offending food on at least two occasions with concomitant food-specific IgEFood allergy (probable when food-specific IgE was associated with atopic dermatitis, urticaria induced at least twice by foods <strong>and</strong> GI allergy; a positivedouble-blind food challenge or a severe food reaction with co-existing food-specific IgE was considered definite food allergyBirthweight; weight <strong>and</strong> height at 4,12 <strong>and</strong> 24 monthsMaternal third trimester weight gainResultsN Dietary avoidance N ControlBirthweight (kg) 103 3.39 [0.50] 173 3.47 [0.59] MD -0.08 95% CI -0.21 to 0.59Birthweight (term singletons) 99 3.42 [4.8] 159 3.52 [0.47] MD -0.10 95% CI -0.22 to 0.02Weight at 4 mo 99 6.64 [0.78] 159 6.71 [0.91] MD -0.07 95% CI -0.28 to 0.14Weight at 12 mo 95 9.50 [1.20] 151 9.62 [1.22] MD -0.12 95% CI -0.43 to 0.19Weight at 24 mo 93 12.44 [1.74] 142 12.57 [1.66] MD -0.13 95% CI -0.58 to 0.32Height at 4 mo (cm) 99 64.8 [1.9] 159 64.9 [2.3] MD -0.10 95% CI -0.62 to 0.42Height at 12 mo 95 76.6 [1.9] 151 76.9 [3.0] MD -0.30 95% CI -1.01 to 0.41Height at 24 mo 93 88.9 [3.7] 141 89.4 [3.7] MD -0.50 95% CI -1.47 to 0.47Pregnancy <strong>and</strong> Breastfeeding Dietary Patterns73
FollowupConfoundingRisk of biasMaternal third trimester weight gain (kg)98 4.86 [0.24] 146 6.10 [0.20] MD -1.24 95% CI -1.30 to -1.18Allergic rhinitis: no significant differences between dietary avoidance <strong>and</strong> control groups at 4, 12 <strong>and</strong> 24 months of ageAtopic dermatitis: no significant differences between dietary avoidance <strong>and</strong> control groups at 4 <strong>and</strong> 24 months of age, significantly lower (borderline) in dietaryavoidance group at 12 months (p = 0.052)Hives: no significant differences between dietary avoidance <strong>and</strong> control groups at 4 <strong>and</strong> 24 months of age, significantly lower (?) in dietary avoidance group at 12months (from graph; no p value given)Skin (AD or hives): no significant differences between dietary avoidance <strong>and</strong> control groups at 4 <strong>and</strong> 24 months of age; significantly lower in dietary avoidancegroup at 12 months (p = 0.018)GI disorder: no significant differences between dietary avoidance <strong>and</strong> control groups at 4, 12 <strong>and</strong> 24 months of ageSkin or GI disorder: no significant differences between dietary avoidance <strong>and</strong> control groups at 4 <strong>and</strong> 24 months of age, significantly lower in dietary avoidancegroup at 12 months (p = 0.005)Asthma: no significant differences between dietary avoidance <strong>and</strong> control groups at 4, 12 <strong>and</strong> 24 months of ageAny atopic disorder: no significant differences between dietary avoidance <strong>and</strong> control groups at 4 <strong>and</strong> 24 months of age; significantly lower in dietary avoidancegroup at 12 months (p = 0.013)Food allergy (includes atopic dermatitis, urticaria/ angioedema, <strong>and</strong> /or GI disease with specific food IgE)N Dietary avoidance N Control P-valueFood allergy (12 mo): 99 177- Definite 2.0% 7.9% 0.059- Probable 3.0% 8.5% 0.021- TOTAL 5.0% 16.4% 0.007Food allergy (24 mo): 97 169- Definite 4.1% 8.9% 0.216- Probable 3.1% 11.2% 0.021- TOTAL 7.2% 20.1% 0.005Food associated with positive challenges in the control group included egg (n=8), milk (n=4), peanut (n=1) <strong>and</strong> soy (n=1). In the dietaryavoidance group, peanut (n=2) <strong>and</strong> egg (n=1) caused positive food challenges.4 year follow-up: cumulative reduction in food allergy in infancy by maternal/infant food allergen avoidance at 4 years, but the currentprevalence at 4 years was similar (about 5% in each group) <strong>and</strong> failed to affect respiratory allergy development from birth to 4 years7 year follow-up: No significant differences between groups for food allergy, atopic dermatitis, allergic rhinitis, asthma, any atopic disease, lungfunction or aeroallergen sensitisationsSeven yearsNAModerate risk of bias: unclear method of allocation concealment; losses to follow-up – 64/167 (38%) in the dietary avoidance group <strong>and</strong> 27/212 (13%) inthe control group (14 families in each group were found not to be atopic <strong>and</strong> so they were postr<strong>and</strong>omisation exclusions; in the dietary avoidance group,48 families had difficulty adhering <strong>and</strong> left the study; in the control group there were 7 miscarriages or stillbirth <strong>and</strong> one neonatal death, five familiesDietary guidelines for pregnant <strong>and</strong> <strong>breastfeeding</strong> women: evidence report74
RelevanceOther commentsmoved); at 12 months, attrition rate was 4% for the dietary avoidance group <strong>and</strong> 6% for the control group <strong>and</strong> at 24 months the respective rates ofattrition were 4% <strong>and</strong> 9%; 14 infants in the dietary avoidance group were exposed to potential allergens (e.g. milk); attrition at 4 years was 15% in thedietary avoidance group <strong>and</strong> 18% in the control group)Relevant to Australian families; dietary intervention may be difficult to sustainMothers in the diet avoidance group were supplemented with calcium;Symptoms such as colic, irritability <strong>and</strong> refusal of foods were not considered atopic manifestations;In both groups about 70% of infants breastfed for at least 4 months <strong>and</strong> about 40% at 8 months;Infants in the diet avoidance group were introduced to potentially allergenic foodstuffs later than control infants;Excluded from Kramer Cochrane reviewPregnancy <strong>and</strong> Breastfeeding Dietary Patterns75
Reference Zhang 2006Food typePrudent diet: fruits, green leafy vegetables, poultry <strong>and</strong> fishWestern diet: red meat, processed meat, refined grain products, sweets, desserts, French fries <strong>and</strong> pizzaStudy typeProspective cohortLevel of evidence II (aetiology)SettingUSAFundingNIHParticipants13,110 women who were free of cardiovascular disease, cancer, type 2 diabetes <strong>and</strong> history of GDM with at least one singleton pregnancy between1992 to 1998 (part of the Nurses’ <strong>Health</strong> Study II);Exclusions: incomplete FFQ, implausible dietary intakeBaseline comparisons See Confounding belowSensitivity analyses done for nulliparous women as they were over-represented (due to exclusion of women with a history of GDM)Dietary assessment FFQTimingDietary intake over previous year (i.e. at least some pre-pregnancy coverage)ComparisonQuintiles of prudent <strong>and</strong> western dietary pattern scoresOutcomesGDMResultsGDM (RR 95% CI)Q1 Q2 Q3 Q4 Q5 P for trendWestern patternNumber of cases of 127 135 151 155 190GDMPerson-years 19,231 20,227 20,269 20,146 19,759aRR (age, parity) 1.00 1.16 (0.91 to 1.40) 1.39 (1.09 to 1.76) 1.49 (1.18 to 1.89) 1.97 (1.57 to 2.48) < 0.0001aRR (age parity, BMI) 1.00 1.11 (0.87 to 1.42) 1.28 (1.01 to 1.62) 1.34 (1.06 to 1.70) 1.68 (1.33 to 2.11) < 0.0001aRR (see below) 1.00 1.09 (0.85 to 1.41) 1.22 (0.94 to 1.59) 1.25 (0.94 to 1.65) 1.63 (1.20 to 2.21) 0.0011Additional adjustment for red meat <strong>and</strong> processed meat1.00 0.92 (0.71 to 1.19) 0.92 (0.69 to 1.22) 0.86 (0.62 to 1.18) 1.03 (0.72 to 1.48) 0.697Prudent patternNumber of cases of 177 151 138 163 129GDMPerson-years 19,901 20,066 20,000 20,572 19,093aRR (age, parity) 1.41 (1.12 to 1.77) 1.18 (0.94 to 1.50) 1.07 (0.84 to 1.36) 1.21 (0.96 to 1.53) 1.00 0.010aRR (age parity, BMI) 1.37 (1.09 to 1.72) 1.19 (0.94 to 1.51) 1.07 (0.84 to 1.36) 1.20 (0.95 to 1.51) 1.00 0.017NOTE: no data in paper for the third adjusted prudent pattern analysis, have assumed p for trend is 0.018FollowupConfoundingRisk of biasRelevanceOther commentsvariableAnalyses were adjusted for parity, age, BMI, smoking status, race/ethnicity, family history of diabetes, physical activity, alcohol consumption, <strong>and</strong> totalenergy intakeLow risk of biasLikely to be relevant to Australian womenBased on assumption that a woman’s diet remains similar over timeDietary guidelines for pregnant <strong>and</strong> <strong>breastfeeding</strong> women: evidence report76
ReferencesAaltonen J, Ojala T, Laitinen K, Piirainen TJ, Poussa TA <strong>and</strong> Isolauri E."Evidence of infant blood pressure programming by maternal nutritionduring pregnancy: a prospective r<strong>and</strong>omized controlled intervention study." JPediatr 2008: 152(1): 79-84, e1-2.Brantsaeter AL, Haugen M, Samuelsen SO, Torjusen H, Trogstad L, Alex<strong>and</strong>erJ, Magnus P <strong>and</strong> Meltzer HM. "A dietary pattern characterized by high intakeof vegetables, fruits, <strong>and</strong> vegetable oils is associated with reduced risk ofpreeclampsia in nulliparous pregnant Norwegian women." J Nutr 2009:139(6): 1162-8.Chatzi L, Torrent M, Romieu I, Garcia-Esteban R, Ferrer C, Vioque J, KogevinasM <strong>and</strong> Sunyer J. "Mediterranean diet in pregnancy is protective for wheeze<strong>and</strong> atopy in childhood." Thorax 2008: 63(6): 507-13.Cole ZA, Gale CR, Javaid MK, Robinson SM, Law C, Boucher BJ, Crozier SR,Godfrey KM, Dennison EM <strong>and</strong> Cooper C. "Maternal dietary patterns duringpregnancy <strong>and</strong> childhood bone mass: a longitudinal study." J Bone Miner Res2009: 24(4): 663-8.de Batlle J, Garcia-Aymerich J, Barraza-Villarreal A, Anto JM <strong>and</strong> Romieu I."Mediterranean diet is associated with reduced asthma <strong>and</strong> rhinitis inMexican children." Allergy 2008: 63(10): 1310-6.Duarte-Salles T, Mendez MA, Pessoa V, Guxens M, Aguilera I, Kogevinas M<strong>and</strong> Sunyer J. "Smoking during pregnancy is associated with higher dietaryintake of polycyclic aromatic hydrocarbons <strong>and</strong> poor diet quality." Public<strong>Health</strong> Nutr 2010: 1-10.Hattevig G, Kjellman B, Sigurs N, Bjorksten B <strong>and</strong> Kjellman NI. "Effect ofmaternal avoidance of eggs, cow's milk <strong>and</strong> fish during lactation upon allergicmanifestations in infants." Clin Exp Allergy 1989: 19(1): 27-32.Pregnancy <strong>and</strong> Breastfeeding Dietary PatternsHaugen G, Hanson M, Kiserud T, Crozier S, Inskip H <strong>and</strong> Godfrey KM. "Fetalliver-sparing cardiovascular adaptations linked to mother's slimness <strong>and</strong>diet." Circ Res 2005: 96(1): 12-4.Haugen M, Meltzer HM, Brantsaeter AL, Mikkelsen T, Osterdal ML, Alex<strong>and</strong>erJ, Olsen SF <strong>and</strong> Bakketeig L. "Mediterranean-type diet <strong>and</strong> risk of pretermbirth among women in the Norwegian Mother <strong>and</strong> Child Cohort Study(MoBa): a prospective cohort study." Acta Obstet Gynecol Sc<strong>and</strong> 2008: 87(3):319-24.Hill DJ, Roy N, Heine RG, Hosking CS, Francis DE, Brown J, Speirs B, SadowskyJ <strong>and</strong> Carlin JB. "Effect of a low-allergen maternal diet on colic amongbreastfed infants: a r<strong>and</strong>omized, controlled trial." Pediatrics 2005: 116(5):e709-15.Kinnunen TI, Pasanen M, Aittasalo M, Fogelholm M, Hilakivi-Clarke L,Weiderpass E <strong>and</strong> Luoto R. "Preventing excessive weight gain duringpregnancy - a controlled trial in primary health care." Eur J Clin Nutr 2007a:61(7): 884-91.Kinnunen TI, Pasanen M, Aittasalo M, Fogelholm M, Weiderpass E <strong>and</strong> LuotoR. "Reducing postpartum weight retention--a pilot trial in primary healthcare." Nutr J 2007b: 6: 21.Knudsen VK, Orozova-Bekkevold IM, Mikkelsen TB, Wolff S <strong>and</strong> Olsen SF."Major dietary patterns in pregnancy <strong>and</strong> fetal growth." Eur J Clin Nutr 2008:62(4): 463-70.Koebnick C, Heins UA, Hoffmann I, Dagnelie PC <strong>and</strong> Leitzmann C. "Folatestatus during pregnancy in women is improved by long-term high vegetableintake compared with the average western diet." J Nutr 2001: 131(3): 733-9.77
Koebnick C, Hoffmann I, Dagnelie PC, Heins UA, Wickramasinghe SN,Ratnayaka ID, Gruendel S, Lindemans J <strong>and</strong> Leitzmann C. "Long-term ovolactovegetarian diet impairs vitamin B-12 status in pregnant women." J Nutr2004: 134(12): 3319-26.Lange NE, Rifas-Shiman SL, Camargo CA, Jr., Gold DR, Gillman MW <strong>and</strong>Litonjua AA. "Maternal dietary pattern during pregnancy is not associatedwith recurrent wheeze in children." J Allergy Clin Immunol 2010: 126(2):250-5, 5 e1-4.Laraia BA, Bodnar LM <strong>and</strong> Siega-Riz AM. "Pregravid body mass index isnegatively associated with diet quality during pregnancy." Public <strong>Health</strong> Nutr2007: 10(9): 920-6.Mikkelsen TB, Osterdal ML, Knudsen VK, Haugen M, Meltzer HM, Bakketeig L<strong>and</strong> Olsen SF. "Association between a Mediterranean-type diet <strong>and</strong> risk ofpreterm birth among Danish women: a prospective cohort study." ActaObstet Gynecol Sc<strong>and</strong> 2008: 87(3): 325-30.Moses RG, Barker M, Winter M, Petocz P <strong>and</strong> Br<strong>and</strong>-Miller JC. "Can a lowglycemicindex diet reduce the need for insulin in gestational diabetesmellitus? A r<strong>and</strong>omized trial." Diabetes Care 2009a: 32(6): 996-1000.North K <strong>and</strong> Golding J. "A maternal vegetarian diet in pregnancy is associatedwith hypospadias. The ALSPAC Study Team. Avon Longitudinal Study ofPregnancy <strong>and</strong> Childhood." BJU Int 2000: 85(1): 107-13.Olafsdottir AS, Skuladottir GV, Thorsdottir I, Hauksson A <strong>and</strong> SteingrimsdottirL. "Maternal diet in early <strong>and</strong> late pregnancy in relation to weight gain." Int JObes (Lond) 2006: 30(3): 492-9.Radesky JS, Oken E, Rifas-Shiman SL, Kleinman KP, Rich-Edwards JW <strong>and</strong>Gillman MW. "Diet during early pregnancy <strong>and</strong> development of gestationaldiabetes." Paediatr Perinat Epidemiol 2008: 22(1): 47-59.Dietary guidelines for pregnant <strong>and</strong> <strong>breastfeeding</strong> women: evidence reportRifas-Shiman SL, Rich-Edwards JW, Kleinman KP, Oken E <strong>and</strong> Gillman MW."Dietary quality during pregnancy varies by maternal characteristics inProject Viva: a US cohort." J Am Diet Assoc 2009: 109(6): 1004-11.Robinson S, Marriott L, Poole J, Crozier S, Borl<strong>and</strong> S, Lawrence W, Law C,Godfrey K, Cooper C <strong>and</strong> Inskip H. "Dietary patterns in infancy: theimportance of maternal <strong>and</strong> family influences on feeding practice." Br J Nutr2007: 98(5): 1029-37.Rodriguez-Bernal CL, Rebagliato M, Iniguez C, Vioque J, Navarrete-MunozEM, Murcia M, Bolumar F, Marco A <strong>and</strong> Ballester F. "Diet quality in earlypregnancy <strong>and</strong> its effects on fetal growth outcomes: the Infancia y MedioAmbiente (Childhood <strong>and</strong> Environment) Mother <strong>and</strong> Child Cohort Study inSpain." Am J Clin Nutr 2010: 91(6): 1659-66.Ross JA, Potter JD, Reaman GH, Pendergrass TW <strong>and</strong> Robison LL. "Maternalexposure to potential inhibitors of DNA topoisomerase II <strong>and</strong> infant leukemia(United States): a report from the Children's Cancer Group." Cancer CausesControl 1996: 7(6): 581-90.Shaheen SO, Northstone K, Newson RB, Emmett PM, Sherriff A <strong>and</strong>Henderson AJ. "Dietary patterns in pregnancy <strong>and</strong> respiratory <strong>and</strong> atopicoutcomes in childhood." Thorax 2009: 64(5): 411-7.Siega-Riz AM, Herrmann TS, Savitz DA <strong>and</strong> Thorp JM. "Frequency of eatingduring pregnancy <strong>and</strong> its effect on preterm delivery." Am J Epidemiol 2001:153(7): 647-52.Stuebe AM, Oken E <strong>and</strong> Gillman MW. "Associations of diet <strong>and</strong> physicalactivity during pregnancy with risk for excessive gestational weight gain." AmJ Obstet Gynecol 2009: 201(1): 58 e1-8.Thompson JM, Wall C, Becroft DM, Robinson E, Wild CJ <strong>and</strong> Mitchell EA."Maternal dietary patterns in pregnancy <strong>and</strong> the association with small-forgestational-ageinfants." Br J Nutr 2010: 103(11): 1665-73.78
Tieu J, Crowther CA <strong>and</strong> Middleton P. "Dietary advice in pregnancy forpreventing gestational diabetes mellitus." Cochrane Database Syst Rev 2008:(2): CD006674.Uusitalo U, Arkkola T, Ovaskainen ML, Kronberg-Kippila C, Kenward MG,Veijola R, Simell O, Knip M <strong>and</strong> Virtanen SM. "Unhealthy dietary patterns areassociated with weight gain during pregnancy among Finnish women." Public<strong>Health</strong> Nutr 2009: 12(12): 2392-9.Vujkovic M, Ocke MC, van der Spek PJ, Yazdanpanah N, Steegers EA <strong>and</strong>Steegers-Theunissen RP. "Maternal Western dietary patterns <strong>and</strong> the risk ofdeveloping a cleft lip with or without a cleft palate." Obstet Gynecol 2007:110(2 Pt 1): 378-84.Vujkovic M, Steegers EA, Looman CW, Ocke MC, van der Spek PJ <strong>and</strong>Steegers-Theunissen RP. "The maternal Mediterranean dietary pattern isassociated with a reduced risk of spina bifida in the offspring." BJOG 2009:116(3): 408-15.Xiang M, Harbige LS <strong>and</strong> Zetterstrom R. "Long-chain polyunsaturated fattyacids in Chinese <strong>and</strong> Swedish mothers: diet, breast milk <strong>and</strong> infant growth."Acta Paediatr 2005: 94(11): 1543-9.Zeiger RS, Heller S, Mellon MH, <strong>For</strong>sythe AB, O'Connor RD, Hamburger RN<strong>and</strong> Schatz M. "Effect of combined maternal <strong>and</strong> infant food-allergenavoidance on development of atopy in early infancy: a r<strong>and</strong>omized study." JAllergy Clin Immunol 1989: 84(1): 72-89.Zeiger RS <strong>and</strong> Heller S. "The development <strong>and</strong> prediction of atopy in high-riskchildren: follow-up at age seven years in a prospective r<strong>and</strong>omized study ofcombined maternal <strong>and</strong> infant food allergen avoidance." J Allergy ClinImmunol 1995: 95(6): 1179-90.Zhang C, Schulze MB, Solomon CG <strong>and</strong> Hu FB. "A prospective study of dietarypatterns, meat intake <strong>and</strong> the risk of gestational diabetes mellitus."Diabetologia 2006b: 49(11): 2604-13.Wolff CB <strong>and</strong> Wolff HK. "Maternal eating patterns <strong>and</strong> birth weight ofMexican American infants." Nutr <strong>Health</strong> 1995: 10(2): 121-34.Pregnancy <strong>and</strong> Breastfeeding Dietary Patterns79
Included StudiesCaffeineStudyOutcomes1. Adeney 2007 GDM2. Bakker 2010 Fetal growth, SGA, preterm birth, low birthweight, birthweight3. Brekke 2009 Beta cell autoimmunity4. Chen 2009 GDM5. Giordano 2008 Child hypospadias <strong>and</strong> cryptorchidism6. Greenwood 2010 Miscarriage/stillbirth7. Haggarty 2009 Deprivation8. Knox 1972 Anencephalus9. Lagiou 2006 Maternal pregnancy oestradiol, unconjugated oestriol, sex hormone binding globulin (SHBG), progesterone, prolactin10. Leviton 2002 SR Maternal outcomes, spontaneous abortion, fetal death, congenital anomalies, preterm birth, low birthweight, SGA, perinataldeath, infant growth, SIDS11. Peck 2010 SR Spontaneous abortion, fetal death, preterm birth, congenital anomalies, SGA, LBW12. Pollack 2010 Pregnancy loss13. Robinson 2009 Maternal blood glucose, insulin <strong>and</strong> insulin sensitivity indexDietary guidelines for pregnant <strong>and</strong> <strong>breastfeeding</strong> women: evidence report80
Evidence SummariesMaternal Outcomes1. In a US cohort study, consumption of sugar-sweetened cola beverages was associated withan increased risk of gestational diabetes mellitus, although this was not the case for dietcola beverages: aOR for GDM with sugar-sweetened cola beverages: 1.22 (1.01 to 1.47); p trend = 0.04 aOR for GDM with diet cola beverages: 0.90 (0.78 to 1.03) p trend = 0.072. In a Canadian crossover RCT, women with gestational diabetes mellitus who consumed acaffeine capsule (equivalent to 1- 2 cups of coffee) had a significantly lower insulinsensitivity index: 3.96 [1.02] caffeine versus 4.81 [1.05] placebo, p = 0.013. In a US cohort study, moderate caffeine consumption prior to <strong>and</strong> during pregnancy (up toone cup a day) was significantly associated with reduced risk of gestational diabetesmellitus: aRR 0.48 95% CI 0.28 to 0.82 particularly for caffeine consumption prior topregnancy (but not for high consumption (more than one cup a day))4. In a Scottish cohort study, high intakes of tea <strong>and</strong> coffee were significantly associated withhigher levels of deprivation (p < 0.001)5. In a US cohort study, caffeine intake during pregnancy was not associated with thefollowing possible breast cancer precursors (maternal pregnancy oestradiol, unconjugatedoestriol, sex hormone binding globulin (SHBG), progesterone, <strong>and</strong> prolactin)6. In a systematic review, one cohort study reported that women who consumed more thanfive cups of coffee a day during pregnancy had increased rates of heart failure <strong>and</strong>anaemia (unadjusted analyses)Congenital Anomalies7. In a UK case control study, coffee, cocoa <strong>and</strong> drinking chocolate were negativelyassociated with cases of anencephalus; <strong>and</strong> tea was positively associated with cases ofanencephalus8. In a Sicilian case control study, no associations were seen between caffeine consumptionduring pregnancy <strong>and</strong> hypospadias <strong>and</strong>/or cryptorchidism9. In the eight studies (including over 33,500 women) in the systematic review addressingthis question, caffeine/coffee consumption prior to, or during, pregnancy was notgenerally associated with risk of congenital anomaliesN Level References13,475 II Chen 200927 (8) II Robinson 20091744 II Adeney 20071277 II Haggarty 2009277 II Lagiou 20061 study(9921women)NotreportedI Leviton 2002III-3 Knox 197290 cases;202controlsIII-3 Giordano 20088 studies I Leviton 2002Caffeine81
10. In the eleven studies (including over 33,000 women) in the systematic review addressingthis question, caffeine/coffee consumption prior to, or during, pregnancy was notassociated with risk of congenital anomalies in five studies. In other studies, intake of teashowed some association with reduced risk of Down syndrome <strong>and</strong> spina bifida <strong>and</strong>caffeine overall or coffee showed associations with increased risk of oral clefts,cryptorchidism <strong>and</strong> spina bifidaPregnancy Loss/Spontaneous Abortion/Fetal Death11. In a UK cohort study, high caffeine intake (300 mg/day or more) in the first trimester wassignificantly associated with miscarriage or stillbirth (aOR 5.1 95% CI 1.6 to 16.4)12. In a systematic review, all but three of the 13 relevant cohort <strong>and</strong> case-control studiesreported that high to very high caffeine intake in the preconception period <strong>and</strong>/or the firsttrimester of pregnancy was significantly associated with spontaneous abortion or fetaldeath; In the largest study (Bech 2005; 88,842 pregnancies) HR for spontaneous abortion < 20weeks gestation was 1.5 95% CI 1.0 to 2.2 for women consuming ≥ 8 cups of coffee a dayduring pregnancy compared with non-coffee drinkers; the corresponding HR for stillbirthat 20-27 weeks gestation was 2.3 95% CI 1.3 to 3.913. In a US cohort study of women planning a pregnancy, pre-pregnancy caffeine consumptionwas associated with a marginally lower risk of pregnancy loss: aRR 0.98 95% CI 0.96 to0.9914. Of the 16 studies in the systematic review addressing this question, only four reportedsignificantly higher rates of spontaneous abortion with high caffeine/coffee consumptionprior to, or during, pregnancyPreterm Birth, SGA, Low Birthweight15. In a Dutch cohort study, caffeine consumption during pregnancy was inversely associatedwith low birthweight <strong>and</strong> small for gestational age, but no association was seen forpreterm birth: Low birthweight: aOR 2.58 95% CI 1.26 to 5.30 (≥ 6 cups/day versus < 2) Small for gestational age: aOR 1.38 95% CI 1.08 to 1.76 (2 to 3.9 cups/day versus < 2) Preterm birth: aOR 1.35 95% 0.58 to 3.15 (≥ 6 cups/day versus < 2)16. Only one of the 14 relevant studies in this systematic review reported that maternalcaffeine consumption prior to or during pregnancy was associated with an increased risk ofpreterm birth; approximately half the studies addressing SGA/IUGR <strong>and</strong> LBW reportedpositive associations11 studies I Peck 20102643 II Greenwood 201013 studies I Peck 201066 II Pollack 201016 studies I Leviton 20027346 II Bakker 201014 studies(pretermbirth);10 studiesI Leviton 2002Dietary guidelines for pregnant <strong>and</strong> <strong>breastfeeding</strong> women: evidence report82
17. <strong>Review</strong> concludes that “Larger studies considering total caffeine exposure consistentlyreported no increased risk of delivery before 37 weeks of gestation”; approximately halfthe studies addressing SGA/IUGR <strong>and</strong> LBW reported positive associations with caffeineexposureChild Outcomes18. In a Swedish cohort study less than daily caffeine consumption during pregnancy wasassociated with a reduced risk of beta cell autoimmunity, but this association disappearedafter adjustment(SGA);9 studies(LBW)11 studies(pretermbirth);15 studies(SGA/LBW)I Peck 20105724 II Brekke 2009Caffeine83
Evidence TablesReference Adeney 2007CAFFEINECoffeeStudy typeProspective cohort studyLevel of evidence II (aetiology)Setting Seattle <strong>and</strong> Tacoma, WA, USA (part of the OMEGA study); December 1996 <strong>and</strong> September 2002FundingNIHParticipants1744 non-diabetic pregnant womenBaseline comparisons See confounding belowDietary assessment Structured interviewTimingAt 13 weeks gestationComparisonNone versus moderate (0.5 to 7 cups of caffeinated coffee a week) versus high (more than 7 cups of caffeinated coffee a week)OutcomesGDMResultsGDM (aRR): weekly caffeinated coffee consumptionn/N aRR P value fortrendNone 36/600 1.00Moderate 24/798 0.48 95% CI 0.28 to 0.82High 15/346 0.66 95% CI 0.35 to 1.25 0.22GDM (aRR): timing of caffeinated coffee consumptionn/NaRRNever 36/589 1.00Before pregnancy only 16/567 0.45 95% CI 0.25 to 0.83Before <strong>and</strong> during pregnancy 23/576 0.64 95% CI 0.37 to 1.10FollowupConfoundingRisk of biasRelevanceOther commentsTo GDM diagnosisAdjusted for maternal age, smoking during pregnancy, alcohol use before pregnancy, maternal race, pre-pregnancy BMI, chronic hypertensionLow risk of bias: Of the 2381 women approached, results from 1744 (73.2%) women were available for analysis: 381 refused to participate, 120 womenwere lost to follow-up <strong>and</strong> exclusions were spontaneous (n = 34) or induced (n = 15) abortion, fetal death prior to 28 weeks gestation (n = 5), priorinsulin-dependent (n = 18) or type 2 (n = 7) diabetes, missing or incomplete data (n = 57)Probably relevant to Australian womenDietary guidelines for pregnant <strong>and</strong> <strong>breastfeeding</strong> women: evidence report84
Reference Bakker 2010CAFFEINECoffee <strong>and</strong> tea (unit = 90 mg caffeine, based on 1 cup of caffeinated coffee)Study typeProspective cohort studyLevel of evidence II (aetiology)Setting Rotterdam, Netherl<strong>and</strong>s (2001-2005)FundingErasmus Medical Center Rotterdam, Erasmus University Rotterdam, Netherl<strong>and</strong>s Organization for <strong>Health</strong> Research <strong>and</strong> DevelopmentParticipants7346 pregnant women of all ethnicities (part of Generation R study)Baseline comparisons Compared with women consuming no or < 2 units of caffeine a day, women consuming more caffeine tended to be older <strong>and</strong> taller <strong>and</strong> to have moreprevious births <strong>and</strong> be more frequently Dutch or European, less frequently smokers <strong>and</strong> more frequently alcohol consumers, with higher total dietaryenergy intakes.Dietary assessment Postal questionnairesTimingIn the first, second <strong>and</strong> third trimester (91%, 80% <strong>and</strong> 77% response rate respectively)Comparison< 2, 2-3.9, 4-5.9 <strong>and</strong> ≥ 6 units/dayOutcomesFetal growth characteristics in each trimester, small for gestational age (defined as gestational age-adjusted birthweight below 5 th percentile in the studycohort) low birthweight (< 2500 g), preterm birth (< 37 weeks)ResultsHead circumference in 2 nd , 3 rd trimester <strong>and</strong> birth:Not consistently associated with maternal caffeine intakeEstimated fetal weight in 2 nd <strong>and</strong> 3 rd trimester:Not consistently associated with maternal caffeine intakeAll length measures:Inversely associated with caffeine intake (p < 0.05)Fetal crown-rump length in 1 st trimester:≥ 6 caffeine units/day v no caffeine during pregnancy MD -4.54 mm 95% CI -8.89 to -0.09Fetal femur length in 3 rd trimester:≥ 6 caffeine units/day v no caffeine during pregnancy MD -0.55 mm 95% CI -1.09 to -0.02Fetal head circumference growth:No consistent association with maternal caffeine intake on regression analysisFetal weight growth:Impaired growth with maternal caffeine intakeFetal length growth:Impaired growth with maternal caffeine intakeBirthweight:≥ 6 caffeine units/day v no caffeine during pregnancy MD -100.27 g 95% CI -197.05 to -3.49CaffeineLow birthweight:< 2 caffeine units/day = reference (n = 205/4329)85
2-3.9 caffeine units/day aOR 1.08 (95% CI 0.84 to 1.40) (n = 96/2211)4-5.9 caffeine units/day aOR 1.19 95% CI 0.73 to 1.95 (n = 19/439)≥ 6 caffeine units/day aOR 2.58 95% CI 1.26 to 5.30 (n = 9/104)Small for gestational age:< 2 caffeine units/day = reference (n = 204/4329)2-3.9 caffeine units/day aOR 1.38 (95% CI 1.08 to 1.76) (n = 119/2211)4-5.9 caffeine units/day aOR 1.50 95% CI 0.96 to 2.36 (n = 24/439)≥ 6 caffeine units/day aOR 1.87 95% CI 0.84 to 4.15 (n = 7/104)Preterm birth:< 2 caffeine units/day = reference (n = 193/4329)2-3.9 caffeine units/day aOR 0.92 95% CI 0.72 to 1.18) (n = 116/2211)4-5.9 caffeine units/day aOR 1.12 95% CI 0.71 to 1.73 (n = 21/439)≥ 6 caffeine units/day aOR 1.35 95% CI 0.58 to 3.15 (n = 7/104)FollowupConfoundingRisk of biasRelevanceOther commentsTo birthAdjusted for gestational age at visit, maternal age, educational level, ethnicity, parity, smoking habits, alcohol consumption, height, BMI at intake,nutritional intake (total energy, total carbohydrate, total fat <strong>and</strong> total protein), folic acid supplement use, maternal pregnancy complications (pregnancyinducedhypertension, pre-eclampsia <strong>and</strong> gestational diabetes) <strong>and</strong> fetal sex.Moderate:Only a minority of women were in the lowest (= none) <strong>and</strong> highest consumption groups (238, 5.8% <strong>and</strong> 111, 2.9% respectively in the third trimester, forexample). This means that outcomes such as low birthweight are based on low numbers.Missing data: 8880 pregnant women enrolled; 1284 (14.5%) excluded due to no information about coffee or tea consumption, further exclusions for 80twin births, 23 induced abortions, 68 fetal deaths, 28 losses to follow-up, 48 missing birthweights <strong>and</strong> 3 gestational age < 25 weeks, leaving outcomesfor 7346 women for analysis;Fetal ultrasounds only done when last menstrual period was reliably known <strong>and</strong> only 5324/7346 (73%) of women’s birth outcomes available for analysis.Probably relevant to Australian women, though caffeine intake patterns may be differentMore detailed results available from supplementary online files;No apparent dose response e.g. for SGADietary guidelines for pregnant <strong>and</strong> <strong>breastfeeding</strong> women: evidence report86
Reference Brekke 2009Food typeCaffeineStudy typeProspective cohort studyLevel of evidence II (aetiology)Setting5 year follow up of babies born in Southeast Sweden between 1 October 1997 <strong>and</strong> 1 October 1999 <strong>and</strong> invited to be in the South east Sweden (ABIS)study.FundingJDRF-Wallenberg Foundations, Swedish Medical Research Council, Swedish Child Diabetes Foundation, Swedish Diabetes Association, SwedishDairy Association R & D, Majblomman Foundation <strong>and</strong> the Novo Nordisk Foundation.Participants5 year follow up of 5724 children who completed 2 of the 3 possible blood samplings (study cohort), 36% of the total 16004 children participating inABIS (the primary cohort).Dietary assessment FFQ performed after birth, but used to recall diet during pregnancy, Food groups classified according to daily, 3-5 times/week, 1-2 times/wk or
Reference Chen 2009Food groupsCaffeine: sugar-sweetened cola beverages (SSB); diet cola beveragesStudy typeProspective cohortLevel of evidence II (aetiology)SettingUS (Nurses’ <strong>Health</strong> Study)FundingNIHParticipants 13,475 women who reported at least one singleton pregnancy between 1992 <strong>and</strong> 2001Exclusions: history of diabetes, cancer, cardiovascular disease or GDM on 1989 or 1991 questionnairesBaseline comparisons See confounding belowDietary assessments FFQTimingConsumption of cola SSBs before pregnancyComparison0.3 serves of SSBs a month versus 1-4 a week versus ≥ 5 a week versus 1 a dayOutcomesGDMResultsGDM (RR 95% CI)SSB consumption0-3 serves/month 1-4 serves/week ≥5 servers/week 1 serve/day P for trendSugar-sweetened colaCases/person-years 544/332,516 168/113,899 148/98,214Model 1 1.00 1.12 (0.94 to 1.33) 1.39 (1.16 to 1.67) 1.39 (1.16 to 1.67) < 0Model 2 0 1.07 (0.90 to 1.28) 1.26 (1.04 to 1.51) 1.25 (1.04 to 1.51) 0.02Model 3 1.00 1.11 (0.93 to 1.32) 1.29 (1.07 to 1.56) 1.29 (1.07 to 1.55) 0.007Model 4 1.00 1.08 (0.90 to 1.28) 1.22 (1.01 to 1.47) 1.22 (1.01 to 1.47) 0.04Diet ColaCases/person-years 356/472,125 322/42,326 182/30,178Model 1 1.00 0.92 (0.75 to1.13) 1.03 (0.88 to 1.20) 1.04 (0.92 to 1.17) 0.53Model 2 1.00 0.97 (0.79 to 1.19) 1.07 (0.91 to 1.25) 1.06 (0.94 to 1.20) 0.34Model 3 1.00 0.87 (0.71 to 1.07) 0.86 (0.73 to 1.00) 0.90 (0.79 to 1.02) 0.10Model 4 1.00 0.90 (0.72 to 1.12) 0.86 (0.72 to 1.02) 0.90 (0.78 to 1.03) 0.07Length of followupConfoundingRisk of biasRelevanceOther comments10 yearsModel 1: adjusted for age <strong>and</strong> parityModel 2: adjusted for age <strong>and</strong> parity; plus race/ethnicity; smoking status, family history of diabetes in a first degree relative, alcohol intake, physicalactivityModel 3: adjusted for age <strong>and</strong> parity, race/ethnicity; smoking status, family history of diabetes in a first degree relative, alcohol intake, physical activity;plus BMIModel 4: adjusted for age <strong>and</strong> parity, race/ethnicity; smoking status, family history of diabetes in a first degree relative, alcohol intake, physical activity;BMI, plus Western dietary patternLow-moderate risk of bias: typically 90% followup rate; analyses did not control for other caffeine useLikely to be relevant to Australian womenCaramel colouring in cola drinks is rich in advanced glycation end products, but positive association was not seen for diet cola (see Caffeine food group)– may be that consuming cola SSBs is a lifestyle marker;Dietary guidelines for pregnant <strong>and</strong> <strong>breastfeeding</strong> women: evidence report88
Reference Giordano 2008Food typeCaffeine: coffeeStudy typeCase-control studyLevel of evidence III-3 (aetiology)SettingSicily, ItalyFundingSicilian Congenital Malformation RegistryParticipants90 cases: 43 cases of hypospadias <strong>and</strong> 48 cases of cryptorchidism (both in one infant)202 controls: r<strong>and</strong>omly selected controls born in the same year <strong>and</strong> the same regionBirths between 1998 to 2003Baseline comparisons Low birthweight, low maternal education, mother’s history of gynaecological disease <strong>and</strong> father’s history of urogenital diseases differed significantlybetween cases <strong>and</strong> controlsSee confounding belowDietary assessment Interview on maternal diet <strong>and</strong> food frequenciesTimingFFQComparisonConsumption of coffee versus no coffee consumptionOutcomesHypospadias <strong>and</strong> cryptorchidismResultsCases Controls ORCoffeeHypospadiasNo 10 (23.3%) 54 (26.7%) 1.00Yes 33 (76.7%) 148 (73.3%) 1.20 95% CI 0.56 to 2.61CryptorchidismNo 12 (25.0%) 54 (26.7%) 1.00Yes 36 (75.0%) 148 (73.3%) 1.09 95% CI 0.53 to 2.26Hypospadias <strong>and</strong> cryptorchidismNo 22 (24.4%) 54 (26.7%) 1.00Yes 68 (75.6%) 148 (73.3%) 1.13 95% CI 0.64 to 2.00Followupn/aConfoundingResults for coffee were not presented as adjusted analysesRisk of bias Moderate risk of bias: Participation rate of parents <strong>and</strong> data collection rate of cases was lower than that of controls (76% versus 91%);RelevanceLikely to be reasonably relevant for Australian women, although hypospadias rates very high <strong>and</strong> unlikely that most Australian women will have suchhigh pesticide exposureOther comments Ragusa region in Sicily is a region of intensive agriculture (involving high rates of pesticide <strong>and</strong> other chemical use) with high rates of hypospadias <strong>and</strong>cryptorchidismCaffeine89
ReferenceGreenwood 2010 (CARE group)Food typeCaffeine (both food <strong>and</strong> drink <strong>and</strong> over the counter medications)Study typeProspective cohort studyLevel of evidence II (aetiology)Setting Two UK maternity units recruited women from September 2003 to June 2006FundingFood St<strong>and</strong>ards Agency, UKParticipants2643 pregnant women (between 8 <strong>and</strong> 12 weeks gestation) aged 18-45 years with singleton pregnanciesExclusions: women with prior chronic disease, psychiatric disease, HIV or hepatitis BDietary assessment Validated tool to assess caffeine intake at different stages of pregnancy (4 weeks before pregnancy, weeks 1-4, weeks 5-12, weeks 13-28, weeks 28-36or end of pregnancy)Baseline comparisons See confounding belowTimingSee Dietary assessmentComparison< 100 versus 100-199 versus 200-299 versus 300+ mg caffeine per dayOutcomesMiscarriage (spontaneous pregnancy loss between 12 <strong>and</strong> 24 weeks), <strong>and</strong> stillbirth (birth ≥ 24 weeks with no signs of life at birth)[fetal growth was reported in CARE 2008 included in Peck 2010 SR]ResultsMiscarriage or stillbirth Caffeine (mg/day) n/N aOR (95% CI) P trendAverage caffeine intake over 1 st trier
Reference Haggarty 2009Dietary patterns Caffeine: tea <strong>and</strong> coffeeStudy typeProspective cohort studyLevel of evidence II (aetiology)SettingAberdeen, Scotl<strong>and</strong>FundingUK Food St<strong>and</strong>ards AgencyParticipants1277 sequentially enrolled pregnant women attending Aberdeen Maternity Hospital for ultrasound (a further 184 women were recruited later inpregnancy).Exclusions: diabetic women, women with multiple pregnancies, women who conceived as a result of fertility treatment, or clinical data not availableBaseline comparisons See confounding belowAssessmentFFQTimingAssessed at 19 weeks gestationComparisonIntake of tea <strong>and</strong> coffee by deciles of deprivationOutcomesDeprivation (assessed using the Scottish Index of Multiple Deprivation);Low birthweight (defined as < 2500 g or lowest decile for birthweight z score adjusted for gestational age, sex <strong>and</strong> parity)Preterm birth (< 37 weeks)Admission to neonatal unitResultsDeprivationTea <strong>and</strong> coffee: significantly higher intake with higher levels of deprivation (p < 0.001)FollowupConfoundingRisk of biasRelevanceOther commentsTo neonatal period(Some?) analyses adjusted for energy intakeLow to moderate risk of bias: low attrition, some lack of detail in reporting of outcomesLikely to be relevant to Australian womenAbout 40-50% of the least deprived women reported taking folic acid supplements compared with about 20% for the most deprived women;Most birth outcome associations were reported by nutrient rather than food group;Not easy to deduce quantities of intake of foods (main graphs reported as change in intake by deprivation decile)Caffeine91
Reference Knox 1972Food typeCaffeine: coffee powder, cocoa, drinking chocolate, teaStudy typeCase control (cases matched to food consumption at population level for a particular period)Level of evidence III-3 (aetiology)SettingBirmingham, UKFundingNot reportedCases Stillbirths <strong>and</strong> infant deaths due to anencephalus between 1961 <strong>and</strong> 1967Baseline comparisons n/aDietary assessment Population surveysTimingEach quarterComparisonMonthly stillbirths <strong>and</strong> infant deaths due to anencephalus matched to quarterly consumption of main food stuffs (in previous five to nine months)OutcomesAnencephalusResultsCoffee powder negatively associated with cases of anencephalus; r = -0.59 after a lag interval of six monthsCocoa, drinking chocolate negatively associated with cases of anencephalus; r = -0.71 after a lag interval of five monthsTea positively associated with cases of anencephalus; r = +0.49 after a lag interval of nine monthsFollowupConfoundingRisk of biasRelevanceOther commentsn/aAnalyses were not adjustedHigh risk of bias: links between population consumption of foods <strong>and</strong> anencephalus very distal <strong>and</strong> no control for potential confoundersLikely to differ from a modern Australian dietFood consumption of total population not likely to reflect food consumption of pregnant women; <strong>and</strong> will not be able to reflect differences between dietsof individual or specific groupsDietary guidelines for pregnant <strong>and</strong> <strong>breastfeeding</strong> women: evidence report92
Reference Lagiou 2006Food typeCaffeineStudy typeProspective cohort studyLevel of evidence II (aetiology)SettingBoston, USAFundingNIHParticipants 277 pregnant women who were Caucasian, < 40 years old <strong>and</strong> having a parity of no more than two (recruited between March 1994 <strong>and</strong> October 1995).Exclusions: women who had taken any kind of hormonal medication during the index pregnancy, with a prior diagnosis of diabetes mellitus or thyroiddisease, or if the fetus had a known major anomaly.Dietary assessment FFQTimingMailed to women prior to a routine antenatal visit around 27 weeks GA, to reflect women’s dietary intake during the second trimester of pregnancyBaseline comparisons Women in the study likely to be older, better educated, primiparae, lower BMI <strong>and</strong> less likely to smoke than pregnant women in the general USpopulationComparisonCoffee during pregnancy v noneOutcomes Maternal pregnancy oestradiol, unconjugated oestriol, sex hormone binding globulin (SHBG), progesterone, prolactin – women’s blood was taken at 16<strong>and</strong> 27 completed weeks GA.ResultsMaternal oestradiol16 completed weeks GA: -2.4% change 95% CI -12.0 to 8.327 completed weeks GA: -4.8% change 95% CI -8.9 to 0.5Maternal oestriol16 completed weeks GA: -4-6% change 95% CI -13.7 to 5.427 completed weeks GA: -3.0% change 95% CI -10.6 to 5.4Maternal SHBG16 completed weeks GA: -3.9% change 95% CI -10.3 to 2.927 completed weeks GA: -1.0% change 95% CI -7.9 to 6.5Maternal progesterone16 completed weeks GA: 5.7% change 95% CI -0.6 to 12.327 completed weeks GA: 3.6% change 95% CI -2.5 to 10.1Maternal prolactin16 completed weeks GA: -0.5% change 95% CI -12.7 to 13.527 completed weeks GA: 7.9% change 95% CI -2.4 to 19.2FollowupConfoundingRisk of biasRelevanceOther comments27 completed weeks GAAdjusted for age, parity, gender of offspring, smoking <strong>and</strong> GA at blood measurementLow to moderate risk of bias: 277 of 402 (68.9%) eligible women were included – 77 refused to participate, 9 were subsequently excluded because theindex pregnancy was terminated through a spontaneous or induced abortion, 2 were excluded because of twin birth <strong>and</strong> 10 were lost to follow-up afterthe initial meeting.Indirect outcomes for (risk of) breast cancerStudy authors postulate that the associations between breast cancer risk <strong>and</strong> increased birthweight are mediated through endocrine hormonesCaffeine93
Reference Leviton 2002Food typeCaffeineStudy typeSR (included studies: Al-Ansary 1994, Alderette 1995, Armstrong 1992, Barr 1984, Beaulac-Baillargeon 1987, Berkowitz 1982, Bolumar 1997, Borlee1978, Brooke 1989, Caan 1989, Christianson 1989, Cnattingius 2000, Cook 1996, Curtis 1997, Dlugosz 1996, Dominguez-Rojas 1994, Fenster 1991a<strong>and</strong> b, Fenster 1997, Florack 1994, <strong>For</strong>d 1998, <strong>For</strong>tier 1993, Fried 1987, Furuhashi 1985, Grodstein 1993, Grosso 2001, Hansteen 1990, Hatch 1993,Infante-Rivard 1993, Joesoef 1990, Klebanoff 1999, Kline 1991, Kurrpa 1983, Kuzma 1982, Larroque 1993, Linn 1982, Little 1993, Martin 1986, Martin1987, Mau 1974, McDonald 1992a <strong>and</strong> b, Mills 1993, Munoz 1988, Olsen 1991, Parazzini 1991, Parazzini 1994, Pastore 1995, Peacock 1991, Peacock1995, Rondo 1996, Rosenberg 1982, Shu 1995, Srisuphan 1986, Stanton 1995, Tebbutt 1984, Tierson 1987, van den Berg 1977, Vlajinac 1997,Warburton 1980, Watkinson 1985, Weathersbee 1977, Wilcox 1988, Williams 1990, Williams 1992, Windham 1995, Wisborg 1996Level of evidence I (aetiology)SettingVaried between studiesFundingNot reportedParticipants65 studiesDietary assessment Varied between studiesTimingVaried between studiesBaseline comparisons Varied between studiesComparisonVaried between studiesOutcomesMaternal outcomes, spontaneous abortion, fetal death, congenital anomalies, preterm birth, low birthweight, SGA, perinatal death, infant growth, SIDS[birthweight was included as an outcome in the review but was not included here]ResultsMaternal Outcomes Furuhashi 1985 (9921 women)Women who consumed more than 5 cups of coffee a day during pregnancy had increased rates of heart failure <strong>and</strong> anaemia (unadjusted analyses)Spontaneous Abortion Weathersbee 1977 (489 households)Of the 16 women (1%) consuming at least 600 mg of caffeine per day, 15 had birth complications (including eight miscarriages); this study had anumber of serious flaws Warburton 1980This abstract reports an association between caffeine consumption <strong>and</strong> triploid abortions, but may be a chance finding Watkinson 1985 (284 women)This study did not find an association between caffeine consumption <strong>and</strong> spontaneous abortion Srisuphan 1986 (3135 women)“non-significant elevation” in risk of late spontaneous abortion; OR 1.95, p = 0.07) Hansteen 1990“observation of an over-representation of “heavy” coffee drinkers among aborters has virtually no meaning” Furuhashi 1985 (9921 women)Women who consumed more than 5 cups of coffee a day had increased rates of “impending abortion” <strong>and</strong> compared with women who did not drinkcoffee during pregnancy, all coffee drinkers combined had a significantly higher rate of spontaneous abortion (unadjusted analyses) Hansteen 1990Study has “virtually no meaning” Fenster 1991 (607 cases; 1284 controls)<strong>For</strong> heavy caffeine consumers (300 mg or more of caffeine a day) aOR of spontaneous abortion was 1.2 95% 0.8 to 1.9 Kline 1991 (927 women)The only form of spontaneous abortion associated with caffeine consumption in the month before pregnancy was for monosomy X; for caffeineDietary guidelines for pregnant <strong>and</strong> <strong>breastfeeding</strong> women: evidence report94
consumption during pregnancy, there was a significant association with both chromosomally normal <strong>and</strong> chromosomally aberrant spontaneousabortionsParazzini 1991 (94 cases with recurrent miscarriages, 176 controls)Coffee consumption was not associated with risk of recurrent abortion (OR 1.4 95% CI 0.7 to 2.6)Armstrong 1992 (56,067 women)OR for spontaneous abortion was 1.2 95% CI 1.0 to 1.3 for women who consumed 5-9 cups of coffee during the index pregnancy <strong>and</strong> 1.2 95% CI0.97 to 1.5 for women who consumed 10 or more cups of coffee a day; study likely to be subject to selection biasMills 1993 (431 women)aOR for spontaneous abortion among women in the highest caffeine consumption group (300 mg or more per day) was 1.2 95% CI 0.9 to 1.5(study likely to be underpowered)Al-Ansary 1994 (226 cases; 226 controls)More cases consumed > 150 mg caffeine per day than did controls (OR 1.9 95% 1.2 to 3.0) – not adjusted for potential confoundersParazzini 1994 (462 cases; 814 controls)aOR 2.1 95% CI 1.7 to 2.1 for spontaneous abortion associated with any coffee consumption during pregnancyDominguez-Rojas 1994 (711 women; retrospective study)24% rate of spontaneous abortion in women who drank any coffee <strong>and</strong> 71% in women who consumed more than 420 mg of caffeine a dayduring the first trimester (unadjusted analyses)Dlugosz 1996 (2849 women)The increased risk of fetal loss associated with consumption of 3 or more cups of coffee/day was not seen with consumption of more than 300 mgof caffeineFenster 1997 (5144 women)Consumption of caffeine was not associated with spontaneous abortion but decaffeinated coffee wasKlebanoff 1999 (591 cases; 2558 controls)Only extremely high serum paraxanthine concentrations (a coffee metabolite) were associated with spontaneous abortionCnattingius 2000 (562 cases; 953 controls)Women who drank the most caffeine were at elevated risk of miscarriageFetal Death Weathersbee 1977 (489 households)Of the 16 women (1%) consuming at least 600 mg of caffeine per day, 15 had birth complications (including five stillbirths); this study had a numberof serious flaws Tierson 1987 (400 women)“A strong inverse association was seen between fetal death <strong>and</strong> the consumption of “some caffeine” during the pregnancy” Infante-Rivard 1993 (331 cases; 993 controls)aOR for fetal loss associated with caffeine intake > 321 mg per day during pregnancy were 2.6 95% CI 1.4 to 5.0; with a dose-related linear trend inwhich the OR was increased by a factor of 1.2 for each 100 mg of caffeine consumed per day during pregnancy (results regarded as unreliable dueto selection bias <strong>and</strong> confounding) Little 1993 (set of case-control studies, n’s not reported)AOR of antepartum stillbirth was 1.4 <strong>and</strong> 1.2 for intrapartum stillbirth (95% CIs not reported) where mothers consumed five or more cups ofcaffeine-containing coffee or tea a day (results regarded as unreliable due to surprising effects of adjustment (smoking <strong>and</strong> alcohol both showedprotective effects))CaffeineCongenital Anomalies Borlee 1978 (case control study with 202 cases <strong>and</strong> 175 controls)Consumption of 8 or more cups of coffee a day in mothers of infants with congenital anomalies was nearly twice as common in case mothers as in95
control mothers. No adjustment for alcohol consumption was made.Linn 1982 (12,205 women)After adjustment for potential confounders, coffee consumption during pregnancy was not significantly associated with congenital anomalies.Rosenberg 1982 (2030 cases, 712 controls)After adjustment for confounders, no significant associations were seen between maternal caffeine use (up to 400 mg/day or more) <strong>and</strong> six groupsof congenital malformations (inguinal hernia, cleft lip with or without cleft palate, isolated cleft palate, cardiac defect excluding isolated heartmurmur, plyloric stenosis <strong>and</strong> neural tube fusion defect).Kurrpa 1983 (case control study with 806 cases <strong>and</strong> 806 controls)No significant association between coffee drinking during pregnancy <strong>and</strong> risk of any malformation (aOR 1.1 95% CI 0.8 to 1.3). Malformationsincluded CNS defects, orofacial clefts, structural skeletal defects, or cardiovascular malformations.Tebbutt 1984 (39 women)“No valid conclusions about the association of caffeine <strong>and</strong> pregnancy outcome can be based on the results of this study”Furuhashi 1985 (9921 women)Women who consumed more than 5 cups of coffee a day had an increased incidence of offspring of chromosomal anomalies or multiple congenitalanomalies (but this was not shown for risk of overall congenital anomalies); analyses were unadjustedKline 1991 (927 women)The only form of spontaneous abortion associated with caffeine consumption in the month before pregnancy was for monosomy X; for caffeineconsumption during pregnancy, there was a significant association with both chromosomally normal <strong>and</strong> chromosomally aberrant spontaneousabortionsMcDonald 1992 (number of women not reported)Of the eight groups of congenital defects evaluated, only the cardiovascular group showed a statistically significant association with consumption ofthree or more cups per day (OR 1.5 95% CI 1.1 to 2.2)Preterm birth, low birthweight, SGA, IUGR Mau 1974 (5200 women)“Frequent” consumption of coffee during the first three months of pregnancy was associated with an increased frequency of low birthweight (< 2500g) <strong>and</strong> birthweights below the 10th percentile for gestational age, but was not significantly related to preterm birth (before day 260).“Frequent” consumption of tea or cola was not related to low birthweight. Study was inadequately controlled. Weathersbee 1977 (489 households)Of the 16 women (1%) consuming at least 600 mg of caffeine per day, 15 had birth complications (including two preterm births); this study had anumber of serious flaws Van den Berg 1977 (15,000 women) – Hogue 1981 reanalysisMaternal consumption of 7 or more cups of coffee a day had a significantly increased risk of low birthweight babies (RR 1.2 – no CIs reported).Some adjustment for smoking but this was judged to be inadequate. Berkowitz 1982Consumption of four or more cups of coffee per day during pregnancy does not appear to increase the risk of preterm birth by a factor of 2.5 Linn 1982 (12,205 women)After adjustment for potential confounders, coffee consumption during pregnancy was not significantly associated with low birthweight, or pretermbirth, but aOR of 1.5 was found for premature rupture of membranes in women drinking 4 or more cups of coffee a day. Kuzma 1982 (5093 women)<strong>Review</strong> authors conclude that due to multiple flaws, this study cannot be used to draw any inferences about maternal caffeine consumption <strong>and</strong>intrauterine growth Tebbutt 1984 (39 women)“No valid conclusions about the association of caffeine <strong>and</strong> pregnancy outcome can be based on the results of this study” Furuhashi 1985 (9921 women)Dietary guidelines for pregnant <strong>and</strong> <strong>breastfeeding</strong> women: evidence report96
Women who consumed more than 5 cups of coffee a day had increased rates of preterm labour <strong>and</strong> SGA babies (unadjusted analyses)Martin 1986 (number of women not reported)Caffeine consumption during pregnancy is not significantly related to the risk of low birthweight or preterm birthBeaulac-Baillargeon 1987 (number of women not reported); retrospective studyBirthweight was lowest for offspring of women who smoked 15 or more cigarettes a day <strong>and</strong> consumed 300 or more mg of caffeine a dayMartin 1987 (number of women not reported)Odds (adjusted) of low birthweight in term infants were higher for caffeine use during pregnancy in a dose response fashion; no significantrelationship was seen between caffeine consumption <strong>and</strong> preterm birthCaan 1989 (131 cases; 136 controls)Consumption of more than 300 mg of caffeine a day during pregnancy was not associated with a significantly higher risk of low birthweightcompared with women who consumed no caffeineFenster 1991 (1230 women – retrospective study)Consumption of 300 mg or more of caffeine per day during the month before pregnancy was associated with a significantly increased risk ofintrauterine growth restriction but not with low birthweight or preterm birthMcDonald 1992 (40,000 women)OR for preterm birth was 1.1 95% CI 0.9 to 1.3 for women who consumed 5-9 cups a day <strong>and</strong> 1.2 95% CI 0.9 to 1.8 for women who consumed 10cups a day or more during the pregnancy;OR for SGA (bottom 5% for gestational age) was 1.3 95% 1.1 to 1.7 <strong>and</strong> 1.4 95% CI 0.97 to 2.0, respectively;OR for low birthweight was 1.4 95% CI 1.0 to 2.0 for women who consumed 10 cups of coffee or more during the pregnancyWilliams 1992 (307 women)Compared with women who consumed no coffee, those who consumed three cups of coffee a day during pregnancy had OR for premature ruptureof membranes 2.4 95% CI 1.5 to 4.0, but the risk did not increase with increasing number of cups of coffee consumed per day (analyses notadjusted for smoking)Mills 1993 (431 women)aOR for IUGR (
Perinatal Deaths Tebbutt 1984 (39 women)“No valid conclusions about the association of caffeine <strong>and</strong> pregnancy outcome can be based on the results of this study”SIDS <strong>For</strong>d 1998 (number of women not reported)Consumption of more than 400 mg of caffeine during the third trimester was associated with an increased risk of cot death months after birth (didnot control for smoking)FollowupConfoundingRisk of biasRelevanceOther commentsInfant Growth Barr 1984 (1529 women)Caffeine consumption during pregnancy was not related to infant length, weight or head circumference at 8 months of age (adjusted analyses) Fried 1987 (number of women not stated)Caffeine consumption during pregnancy was not significantly related to infant growth at 12 or 24 months of ageVaried between studiesVaried between studiesLow-moderate risk bias: some study outcomes are incompletely reported; Confounding (especially smoking) <strong>and</strong> failure to adjust for lack of coffee‘aversion’ increased the risk of bias in many of the included studies;Also see comments above in Results sectionLikely to be relevant to Australian womenThe Martin 1985 study demonstrated that women with high caffeine consumption are distinctly different from other pregnant women, underlying theimportance of controlled for the confounding effects of smoking.Pregnancy signal postulate – continued caffeine consumption during pregnancy may be a marker of suboptimal placental hormonal synthesis, whichmay lead to pregnancy lossDietary guidelines for pregnant <strong>and</strong> <strong>breastfeeding</strong> women: evidence report98
Reference Peck 2010Food groupCAFFEINE: Beverages (coffee, tea, soft drinks), chocolate <strong>and</strong> some medicationsStudy typeSystematic reviewIncludes: Balat 2003, Bech 2005, Bech 2006, Bech 2007 (RCT), Bille 2007, Bracken 2003, Browne 2007, CARE Study Group 2008 (=Boylan 2008),Chiaffarino 2006, Clausson 2002, Collier 2009, Diego 2007, George 2006, Gianelli 2003, Grosso 2001, Grosso 2006, Haugen 2008, Infante-Rivard2007, Johansen 2009, Karypidis 2006, Khoury 2004, Klebanoff 2002, Klonoff-Cohen 2002, Maconochie 2007, Matijasevich 2006, Mikkelsen 2008, Miller2009, Mongraw-Chaffin 2008, Natsume 2000, Orskou 2003, Parazzini 2005, Rasch 2003, Santos 2005, Sata 2005, Savitz 2008, Schmidt 2009,Signorello 2001, Slickers 2008, Tolstrup 2003, Torfs 2000, Tough 2003, Tsubouchi 2006, Vik 2003, Wen 2001, Weng 2008, Wisborg 2003, Xue 2008,Zusterzeel 2000.Level of evidence I (Aetiology)Setting International (human studies of caffeine <strong>and</strong> reproductive health published between January 2000 <strong>and</strong> December 2009)FundingCaffeine Working Group of the North American Branch of the International Life Sciences Institute (which received funding for this project from theNational Coffee Association)Participants48 studiesBaseline comparisons NADietary assessment Varied between studiesTimingVaried between studiesComparisonVaried between studiesOutcomesReproductive health outcomes (spontaneous abortion, fetal death, preterm birth, congenital malformations, fetal growth restriction)ResultsSpontaneous AbortionSummary from paper: “current evidence remains insufficient to permit conclusions regarding the potential role of caffeine in spontaneousabortion” Wen 2001 (584 women):≥ 100 mg/day caffeine during the first trimester at elevated risk100-299 mg/day RR 2.0 95% CI 1.0 to 4.1; ≥ 300 mg/day RR 2.5 95% CI 1.0 to 6.4 (compared with < 20 mg/day), partially controlled for smoking. Klonoff-Cohen 2002 (62 women):In IVF pregnancies, miscarriage with > 50 mg/day caffeine during the week of the initial clinic visits OR 6.2 95% CI 0.9 to 40.8, (not controlled forsmoking). Khoury 2004 (191 women):In women with type 1 diabetes pregnant or planning a pregnancy, spontaneous abortions ≤ 20 weeks with first trimester consumption of 1-2 cupsof caffeinated beverages/day OR 3.8 95% CI 0.8 to 16.9 <strong>and</strong> for ≥ 3 cups per day OR 5.5 95% CI 1.2 to 22.0 compared with no caffeine intake,(did not account for different amounts of caffeine in different beverages). Bech 2005 (88,482 pregnancies):Heavy coffee drinkers (≥ 8 cups/day) HR 1.5 95% 1.0 to 2.2 for spontaneous abortion < 20 weeks gestation (compared with non-coffee drinkers). Weng 2008 (1063 women):Caffeine intake ≥ 200 mg/day HR 2.2 95% CI 1.3 to 3.7 for miscarriage compared with no caffeine intake, (result likely to be affected byconfounding) Savitz 2008 (2407 women)Among women interviewed after miscarriage, current caffeine consumption of ≥ 144.3 mg/day OR was 1.9 95% CI 1.1 to 3.5 for spontaneousabortion compared with women not consuming caffeine. In contrast, OR was 1.1 95% CI 0.6 to 1.8 among women interviewed before their loss(indicating possible recall bias) Tolstrup 2003 (1381 pregnancies)aOR 1.7 95% CI 1.0 to 3.0 for miscarriage (defined in this study as < 28 weeks gestation) for women consuming > 900 mg caffeine per day fromcoffee or tea (after adjustment for maternal age, marital status, cigarette smoking, <strong>and</strong> alcohol intake. At lower consumption levels (similar to otherCaffeine99
studies e.g. 300 mg/day) no association was seen between caffeine intake <strong>and</strong> miscarriage.Giannelli 2003 (160 cases; 314 controls)Women consuming > 300 mg/day during pregnancy (compared with < 151 mg/day): OR 1.9 95% CI 1.0 to 3.6 for 301-500 mg/day <strong>and</strong> OR 2.295% CI 1.1 to 4.4 for ≥ 500 mg/day.Rasch 2003 (303 cases; 1168 controls)Women consuming ≥ 375 mg/day (compared with ≤ 199 mg/day): OR 2.2 95% CI 1.5 to 3.2 (result may be affected by confounding <strong>and</strong> missingdata)Maconochie 2007 (603 cases; 6116 controls)aOR 1.0 95% CI 0.7 to 1.5 for miscarriage with 301-500 mg/day; <strong>and</strong> 1.1 95% CI 0.8 to 1.7 for > 500 mg/day, compared with no caffeineconsumption (includes adjustment for nausea severity), potential for differential recall between cases <strong>and</strong> controlsGeorge 2006 (108 cases, 583 controls)OR for repeated miscarriage 1.8 95% CI 0.8 to 3.9 for ≥ 300 mg/day; significant for non-smoker subgroup <strong>and</strong> nonsignificant for smoker subgroup(interaction test not significant)Fetal Death: Wisborg 2003 (18,478 pregnancies)OR 2.2 95% CI 1.0 to 4.7 of stillbirth for women drinking ≥ 8 cups of coffee at 16 weeks gestation compared with women not drinking coffee;pregnancy ‘signal’ not considered Bech 2005 (88,482 pregnancies)Women consuming ≥ 8 cups of coffee/day HR 2.3 95% CI 1.3 to 3.9 for stillbirth at 20-27 weeks gestation, HR 1.3 95% CI at 0.7 to 2.4 after 27weeks gestation (not stated, but assumed to be compared with non-coffee drinkers);Women consuming ≥ 4 cups of coffee/day HR 2.3 95% 1.2 to 4.3 for stillbirth due to placental dysfunction, but associations were not apparentfor unexplained intrauterine deaths, umbilical cord complications, congenital malformations, other conditions such as infection <strong>and</strong> maternaldisease, or intrapartum deaths. Matijasevich 2006 (382 cases, 792 controls)OR 2.3 95% CI 1.2 to 4.4 of fetal death with mean caffeine (from mate (herbal tea) <strong>and</strong> coffee) consumption of ≥ 300 mg/day, likely exposuremisclassification as soft drink, chocolate <strong>and</strong> black tea not considered.Preterm BirthSummary from paper: “Larger studies considering total caffeine exposure consistently reported no increased risk fo delivery before 37weeks of gestation” Clausson 2002 (873 women)No significant difference seen for gestational age for groups of 0-99, 100-299, 300-499 or ≥ 500 mg caffeine/day across entire pregnancy Klebanoff 2002 (2515 women)Data for caffeine metabolites in serum do not support an association between third trimester paraxanthine concentrations <strong>and</strong> pregnancy durationor preterm birth Klonoff-Cohen 2002 (39 women):Maternal caffeine intake > 50 mg/day during the week of the first fertility clinic visit was associated with a 3.5 week decrease (95% CI -6.7 to -0.3) ingestational age compared with women reporting 0-2 mg/day [results for intake during pregnancy were not reported] Bracken 2003 (2291 women)No associations between caffeine use (≥ 150 mg/day v < 150 mg/day) <strong>and</strong> preterm birth were seen (self-reported caffeine use <strong>and</strong> urinary caffeineconcentrations) Tough 2003 (323 women – case-control)Crude OR 1.4 95% CI 1.0 to 1.9 between coffee consumption (< 1 cup/day versus ≥ 1 cup/day) but this association lost its significance onmultivariate analysisDietary guidelines for pregnant <strong>and</strong> <strong>breastfeeding</strong> women: evidence report100
Khoury 2004 (191 women with diabetic pregnancies)No association seen for serves of caffeine drinks (coffee, tea <strong>and</strong> soft drinks all equally weighted) <strong>and</strong> preterm birthSantos 2005 (5189 women – retrospective)No significant relationship seen between caffeine consumption (mate) <strong>and</strong> preterm birthChiaffarino 2006 (520 cases, 1966 controls)Reduced risk for women who consumed two or more servings of coffee a day compared with nonconsumers (OR 0.5 95%CI 0.3 to 0.8); but didnot reach statistical significance for preterm birth of an appropriate for gestational age infant (OR 0.8 95% CI 0.6 to 1.1)Bech 2007 (RCT of 1197 heavy coffee drinkers in last half of pregnancy)No significant relationship seen between caffeine consumption <strong>and</strong> preterm birthMikkelsen 2008 (35530 women)Coffee intake ≤ 2 cups per day was associated with lower odds of early preterm birth (aOR 0.7 95% CI 0.6 to 0.9), with no association withlater preterm birth (aOR 0.9 95% CI 0.8 to 1.1) compared with > 2 cups per day.Haugen 2008 (26,563 women)Consuming ≤ 2 cups of coffee a day was not associated with reduced odds of giving birth before 35 weeks (OR 1.11 95% CI 0.83 to 1.49) or duringthe 35th <strong>and</strong> 36 th weeks (OR 1.15 95% CI 0.90 to 1.46)Congenital Malformations Natsume 2000 (306 cases <strong>and</strong> matched controls)Due to high risk of bias review authors conclude that this study “does not make a meaningful contribution” Khoury 2004 (191 pregnant women with type 1 diabetes)Any consumption of caffeine during the first trimester (none versus one or more cups of coffee, tea or soft drinks) was not associated with majormalformations (crude OR 2.0 95% CI 0.4 to 11.2) Torfs 2000 (997 cases; 1007 controls)A protective association between heavy coffee intake (≥ 4 cups a day compared to < 4 cups a day) <strong>and</strong> Down syndrome was observed among nonsmokers(OR 0.5 95% CI 0.3 to 0.8) but not smokers (OR 1.6 95% CI 0.8 to 3.4) (non-smoking heavy caffeine users more likely to miscarry?) Bille 2007 (134 cases; 828 controls)No associations with coffee intake for all oral clefts combined or by subtype; mothers of babies with isolated cleft palate had 2.5 95% CI 1.1 to 5.6greater odds of consuming 5 or more cups of tea a day compared with mothers of controls. Weekly cola intake exceeding one litre was marginallyassociated with cleft lip with or without cleft palate (OR 1.5 95% CI 0.9 to 2.4) Browne 2007 (4196 cases; 3957 controls)No positive associations between pre-pregnancy caffeine intake <strong>and</strong> cardiovascular malformations Mongraw-Chaffin 2008 (84 cases; 252 controls)Significant association between cryptorchidism <strong>and</strong> caffeine intake equivalent to three cups of coffee a day (aOR 1.4 95% CI 1.1 to 1.9) Slickers 2008 (75 cases; 868 controls)No associations with ‘non-negligible’ caffeine intake in the year preceding pregnancy <strong>and</strong> renal agenesis or renal hypoplasia were seen (aOR 1.0195% CI 0.58 to 1.75) Miller 2009 (464 cases; 4940 controls)Significant associations were seen between risk of anorectal atresia in offspring <strong>and</strong> caffeine intake: OR 1.4 95% CI 1.0 to 1.9 for 10 to 99 mg; OR1.3 95% CI 1.0 to 1.8 for 100 to 299 mg; OR 1.5 95% CI 1.0 to 2.2 for ≥ 300 mg – compared with < 10 mg (analyses not adjusted e.g. for smoking) Johansen 2009 (573 cases; 763 controls)No associations seen for total caffeine intake (coffee, tea <strong>and</strong> soft drink) <strong>and</strong> risk of cleft lip with or without cleft palate (aOR 1.2 95% CI 0.7 to 2.0for ≥ 500 mg compared with 0 to 100 mg; or cleft palate only (aOR 1.1 95% CI 0.5 to 2.2): coffee intake was associated with cleft lip with or withoutcleft palate (aOR 1.6 95% CI 1.1 to 2.4 for ≥ 3 cups a day), but not cleft palate only. In contrast tea appeared to be protective. Schmidt 2009 (758 cases; 4143 controls)Caffeine101
Associations with spina bifida were seen for any consumption of caffeine in the year prior to pregnancy (≥ 10 mg/day: OR 1.4 95% CI 1.1 to 1.9)any caffeinated coffee (≥ 1 cup/month: OR 1.3 95% CI 1.0 to 1.6) <strong>and</strong> any caffeinated soft drink (> 0 per day; OR 1.2 95% CI 1.0 to 1.6). Anyconsumption of caffeinated tea was found to be protective for spina bifida (OR 0.7 95% CI 0.6 to 0.9)Associations with encephalocele were seen for coffee (only 1 cup/day <strong>and</strong> not higher) <strong>and</strong> tea; no associations with anencephaly were observedCollier 2009 (2344 cases; 5711 controls)Modestly elevated risk for most orofacial cleft outcomes for total caffeine intake in the year prior to pregnancy (coffee, tea, soft drink, <strong>and</strong> chocolate)but no dose response effect seenFetal Growth Restriction Grosso 2001 (2714 women)No association seen between IUGR <strong>and</strong> caffeine intake during the first or seventh month of pregnancy Clausson 2002 (873 women)No differences seen in Z-scores across categories of caffeine intake Klebanoff 2002 (number of women not reported)Risk of SGA increased with rising third trimester serum paraxanthine concentrations but only among smokersFollowupVaried between studiesConfoundingVaried between studies; see comments above in Results sectionRisk of biasLow to moderate risk of bias: Confounding (especially smoking) <strong>and</strong> failure to adjust for lack of coffee ‘aversion’ increased the risk of bias in many of theincluded studies;Also see comments above in Results sectionRelevanceResults from most studies relevant to Australian womenOther comments Pregnancy signal – see comments for Leviton 2002Dietary guidelines for pregnant <strong>and</strong> <strong>breastfeeding</strong> women: evidence report102
Reference Pollack 2010Food groupCaffeineStudy typeProspective cohort studyLevel of evidence II (aetiology)SettingUSAFundingGreat Lakes Protection Fund, Agency for Toxic Substances <strong>and</strong> Disease Registry, Intramural Research Program of the Eunice Kennedy ShriverNational Institute of Child <strong>Health</strong> <strong>and</strong> Human DevelopmentParticipants 79 women discontinuing contraception <strong>and</strong> planning to become pregnant in the next 6 months; 68 (86%) of women became pregnant, with 54 (79%)women having live births <strong>and</strong> 14 (21%) experiencing pregnancy lossesBaseline comparisons See confounding belowDietary assessment Daily diariesTimingThrough 12 menstrual cycles (or until pregnancy)ComparisonAmount of caffeine intake as daily cups (actual amounts not reported but only 24% of women consumed more than three caffeinated beverages daily;equating to > 300 mg caffeine)OutcomesPregnancy lossResultsn Risk of pregnancy loss Hazard of pregnancy lossAll women 66 aRR 0.98 95% CI 0.96 to 0.99 aHR 0.97 95% CI 0.95 to 1.00Nulligravid 13 aRR 0.98 95% CI 0.95 to 1.01 aHR 0.98 95% CI 0.94 to 1.02Gravid 53 aRR 0.96 95% CI 0.94 to 0.99 aHR 0.96 95% CI 0.92 to 1.00FollowupConfoundingRisk of biasRelevanceOther commentsUntil pregnancy confirmed or up to 12 menstrual cyclesAdjusted for age <strong>and</strong> average alcohol <strong>and</strong> cigarette consumption per st<strong>and</strong>ardised 28-day cycle (<strong>and</strong> prior spontaneous pregnancy loss for gravidwomen)Moderate risk of bias: 113/244 women (43%) agreed to participate, 79 women completed the study; women who conceived earlier had lower caffeineexposureLikely to be of relevance to Australian womenStudy likely to be underpoweredCaffeine103
Reference Robinson 2009Food groupCaffeineStudy typeRCT (crossover)Level of evidence II (intervention)SettingCanadaFundingCanadian Foundation for Women’s <strong>Health</strong>Participants27 pregnant women recruited as part of routine screening for gestational diabetes mellitus at 24 to 28 weeks gestation (19 negative screens <strong>and</strong> 8 withan initial positive screen)Exclusions: pre-pregnancy BMI > 30, smokers, taking medications that could interfere with glucose uptake or metabolism, known medical or obstetricalcomplicationsBaseline comparisons n/aDietary assessment n/aTiming28 to 29 weeks gestation; <strong>and</strong> 29 to 30 weeks gestation (crossover)ComparisonCaffeine capsule (3 mg/kg; equivalent to 1-2 cups coffee) versus placebo capsuleOutcomesMaternal blood glucose, insulin <strong>and</strong> insulin sensitivity indexResults<strong>Pregnant</strong> women (controls): n = 19 Women with GDM: n = 8Mean [SEM] Placebo Caffeine p Placebo Caffeine pGlucose (mmol/L/2h) 381 [28] 392 [23] ns 518 [35] 616 [42] 0.001Insulin (pmol/L/2h) 39236 [4653] 42632 [4675] ns 53661 [9141] 67207 [12538] 0.07Insulin Sensitivity Index 8.65 [0.74] 8.24 [0.90] ns 4.81 [1.05] 3.96 [1.02] 0.01FollowupConfoundingRisk of biasRelevanceOther commentsTo 30 weeks gestationn/aUnclear risk of bias: process of allocation concealment not described, trial described as “double blind”Likely to be relevant to Australian womenSmall sample sizeDietary guidelines for pregnant <strong>and</strong> <strong>breastfeeding</strong> women: evidence report104
ReferencesAdeney KL, Williams MA, Schiff MA, Qiu C <strong>and</strong> Sorensen TK. "Coffeeconsumption <strong>and</strong> the risk of gestational diabetes mellitus." Acta ObstetGynecol Sc<strong>and</strong> 2007: 86(2): 161-6.Bakker R, Steegers EA, Obradov A, Raat H, Hofman A <strong>and</strong> Jaddoe VW."Maternal caffeine intake from coffee <strong>and</strong> tea, fetal growth, <strong>and</strong> the risks ofadverse birth outcomes: the Generation R Study." Am J Clin Nutr 2010: 91(6):1691-8.Brekke H <strong>and</strong> Ludvigsson J. "Daily vegetable intake during pregnancynegatively associated to islet autoimmunity in the offspring--the ABIS study."Pediatr Diabetes 2010: 11(4): 244-50.Chen L, Hu FB, Yeung E, Willett W <strong>and</strong> Zhang C. "Prospective study of pregravidsugar-sweetened beverage consumption <strong>and</strong> the risk of gestationaldiabetes mellitus." Diabetes Care 2009: 32(12): 2236-41.Giordano F, Carbone P, Nori F, Mantovani A, Taruscio D <strong>and</strong> Figa-Talamanca I."Maternal diet <strong>and</strong> the risk of hypospadias <strong>and</strong> cryptorchidism in theoffspring." Paediatr Perinat Epidemiol 2008: 22(3): 249-60.Greenwood DC, Alwan N, Boylan S, Cade JE, Charvill J, Chipps KC, Cooke MS,Dolby VA, Hay AW, Kassam S, Kirk SF, Konje JC, Potdar N, Shires S, Simpson N,Taub N, Thomas JD, Walker J, White KL <strong>and</strong> Wild CP. "Caffeine intake duringpregnancy, late miscarriage <strong>and</strong> stillbirth." Eur J Epidemiol 2010: 25(4): 275-80.Haggarty P, Campbell DM, Duthie S, Andrews K, Hoad G, Piyathilake C <strong>and</strong>McNeill G. "Diet <strong>and</strong> deprivation in pregnancy." Br J Nutr 2009: 102(10):1487-97.Knox EG. "Anencephalus <strong>and</strong> dietary intakes." Br J Prev Soc Med 1972: 26(4):219-23.Lagiou P, Lagiou A, Samoli E, Hsieh CC, Adami HO <strong>and</strong> Trichopoulos D. "Dietduring pregnancy <strong>and</strong> levels of maternal pregnancy hormones in relation tothe risk of breast cancer in the offspring." Eur J Cancer Prev 2006: 15(1): 20-6.Leviton A <strong>and</strong> Cowan L. "A review of the literature relating caffeineconsumption by women to their risk of reproductive hazards." Food ChemToxicol 2002: 40(9): 1271-310.Peck JD, Leviton A <strong>and</strong> Cowan LD. "A review of the epidemiologic evidenceconcerning the reproductive health effects of caffeine consumption: a 2000-2009 update." Food Chem Toxicol 2010: 48(10): 2549-76.Pollack AZ, Buck Louis GM, Sundaram R <strong>and</strong> Lum KJ. "Caffeine consumption<strong>and</strong> miscarriage: a prospective cohort study." Fertil Steril 2010: 93(1): 304-6.Robinson LE, Spafford C, Graham TE <strong>and</strong> Smith GN. "Acute caffeine ingestion<strong>and</strong> glucose tolerance in women with or without gestational diabetesmellitus." J Obstet Gynaecol Can 2009: 31(4): 304-12.Caffeine105
Included StudiesCerealStudyOutcomes1. Chatzi 2008 Child persistent wheeze, atopic wheeze, atopy (all at 6.5 years)2. George 2005 “Breastfeeding”3. Godfrey 1996 Placental weight, birthweight4. Herrick 2003 Cortisol concentrations in offspring at 30 years of age5. Jensen 2004 Childhood acute lymphoblastic leukemia6. Knox 1972 Anencephalus7. Kwan 2009 Childhood acute lymphoblastic leukemia8. Lamb 2008 Islet autoimmunity9. Laraia 2007 “Pre-pregnancy BMI”10. Latva-Pukkila 2009 Nausea <strong>and</strong> vomiting during pregnancy11. Mitchell 2004 SGA12. Nwaru 2010 Allergic sensitisation in offspring by 5 years13. Petridou 2005 Childhood acute lymphoblastic leukemia14. Petridou 1998a Cerebral palsy at 8 years15. Petridou 1998b Birthweight16. Radesky 2008 IGT, GDM17. Stuebe 2009 GWG18. Venter 2009 Food hypersensitivity (FHS) in infants up to three years of age19. Willers 2007 Asthma, respiratory <strong>and</strong> atopic symptoms at 5 y20. Zhang 2006 GDMDietary guidelines for pregnant <strong>and</strong> <strong>breastfeeding</strong> women: evidence report106
Evidence SummariesMaternal Outcomes/Associations1. In a US cohort study, women who were obese before pregnancy were significantly less likelyto meet recommendations for cereal intake compared with overweight women: Adherence for normal or overweight women was 41.2% [SD 22.7] <strong>and</strong> 42.8% [SD 24.4]respectively compared with 40.4% [SD 23.6] for obese women (p < 0.05)2. In a US cohort study, maternal consumption of whole grains during pregnancy was notassociated with excessive gestational weight gain: aOR 1.06 95% CI 0.95 to 1.193. In a US cohort study, incidences of impaired glucose tolerance or gestational diabetesmellitus were not associated with maternal intake of whole grains during pregnancy: IGT (per serve of whole grains): aOR 1.05 95% CI 0.92 to 1.19 GDM (per serve of whole grains): aOR 0.90 95% CI 0.73 to 1.134. In a US cohort study, a reduced risk of gestational diabetes mellitus was seen in womenconsuming high amounts of cereal fibre during or before pregnancy – aOR 0.76 95% CI 0.59to 0.99 for > 7.2 g/day versus < 3.5 g/day; <strong>and</strong> aOR 0.77 95% CI 0.64 to 0.91 for each 5 g/dayincrement5. In a Finnish cohort study, nausea <strong>and</strong> vomiting during pregnancy was not associated withconsumption of grain products during pregnancyCongenital Anomalies6. In a case-control study from the UK, maternal consumption of total cereals was positivelyassociated with cases of anencephalus: r = +0.56 after a lag interval of five monthsBirth Outcomes7. In a New Zeal<strong>and</strong> case-control study, a reduced small-for-gestational age was associatedwith maternal cereal intake in the pre-conception period (p = 0.04) but this did not hold forcereal intake in the last month of pregnancy8. In a retrospective cohort study from Greece, there was a small but insignificant increase inbirthweight (31 g [SE37], p = 0.40) for each daily consumption of cereals <strong>and</strong> starchy roots,9. In a cohort study, no significant associations were seen in placental weight <strong>and</strong> birthweight(both p = 0.2) <strong>and</strong> maternal intake of cereal in late pregnancyBreastfeeding10. In a US cohort study, lactating women consumed significantly more wholegrain bread <strong>and</strong> significantly less whitebread during pregnancy <strong>and</strong> in the postpartum period than non-lactating women (p < 0.05);CerealN Level References2394 II Laraia 20071338 II Stuebe 20091773 II Radesky 200813,110 II Zhang 2006256 II Latva-Pukkila 2009Not reported III-3 Knox 1972844 cases,870 controlsIII-3 Mitchell 2004368 III-2 Petridou 1998b538 II Godfrey 1996149 II George 2005107
nonlactating women significantly reduced their consumption of sugared cereals in thepostpartum period compared with pregnancy (p < 0.05)Allergy Outcomes11. In a Spanish cohort study, no significant associations were seen between wheeze <strong>and</strong> atopyin children at 6.5 years of age <strong>and</strong> maternal cereal intake during pregnancy12. In a Finnish cohort study, no significant associations were seen between allergicsensitisation in children by 5 years of age <strong>and</strong> maternal cereal intake during pregnancy13. In a UK cohort study, associations between food hypersensitivity in children up to threeyears of age <strong>and</strong> maternal intake of wheat during pregnancy could not be determined due tosmall numbers14. In a Scottish cohort study, there were no consistent linear associations with respiratory <strong>and</strong>atopic outcomes in 5 year old children <strong>and</strong> maternal intake of wholegrain cereals duringpregnancyOther Childhood Outcomes15. In a US cohort study, development of islet autoimmunity (a precursor of type 1 diabetes) inchildren up to 15 years was not associated with maternal intake of cereals during pregnancy Gluten-containing foods: aHR (for one st<strong>and</strong>ard deviation change in reported consumption)0.89 95% CI 0.50 to 1.58 (127 mean monthly servings) Non-gluten cereal grains: aHR (for one st<strong>and</strong>ard deviation change in reported consumption)0.98 95% CI 0.64 to 1.51 (12 mean monthly servings)16. In a Greek case-control study, there was a borderline association between reduced risk ofcerebral palsy in children <strong>and</strong> maternal intake of cereals during pregnancy:Regression analysis for each unit of consumption of cereal 3 times per week: aOR 0.83 95% CI 0.72 to 0.96 aOR 0.85 95% CI 0.72 to 1.00 (additionally adjusted for all food groups)17. In a US case-control study, there was no association between childhood acute lymphoblasticleukemia <strong>and</strong> maternal consumption of grain products during pregnancy: aOR 0.86 95% CI0.37 to 1.9818. In a US case-control study, maternal consumption of grain products in pregnancy was notassociated with childhood acute lymphoblastic leukemia ( aOR 1.20 95% CI 0.70 to 2.05:median consumption 2.6 (25 th 75 th percentiles 2.0, 3.3) serves per day) whereas maternalconsumption of fibre cereals was significantly associated with a higher risk (aOR 1.12 95% CI1.07 to 1.26)482 children II Chatzi 2008931 children II Nwaru 2010696 children II Venter 20091212childrenII Willers 2007642 children II Lamb 2008109 children(cases)138 cases,138 controlsIII-3Petridou 1998aIII-3 Jensen 2004866 total III-3 Kwan 2009Dietary guidelines for pregnant <strong>and</strong> <strong>breastfeeding</strong> women: evidence report108
19. In a Greek case-control, there was no association between childhood acute lymphoblasticleukemia <strong>and</strong> cereal/starchy root intake (median Q1; 52 g/day: median Q5 164 g/day); p fortrend = 0.13Outcomes <strong>For</strong> Offspring As Adults20. In a Scottish cohort study, there was no association between cortisol concentrations in adultoffspring at 30 year followup <strong>and</strong> maternal bread consumption during pregnancy138 cases;138 controls251 men <strong>and</strong>womenIII-3 Petridou 2005II Herrick 2003Cereal109
Evidence TableReference Chatzi 2008Food typeCerealStudy typeProspective cohort studyLevel of evidence II (aetiology)Setting Women presenting antenatal care at general practices in Menorca, a Mediterranean isl<strong>and</strong> in Spain (mid 1997 to mid 1998)FundingInstituto de Salud Carlos III red de Grupos Infancia y Media Ambiente, the Fundacio “La Caixa” , Instituto de Salud Carlos III, red de Centros deInvestigacion en Epidemiologica y Salud Publica, EU, National Center for Environmental <strong>Health</strong>, USA, the GA 2 LEN project, Ministry of Education <strong>and</strong>Science, Spain, Oficina de Ciencia y Tecnologia, Generalitat Valenciana.Participants482 children of 507 women who had attended antenatal care in MenorcaBaseline comparisons See confounding belowDietary assessment FFQTimingnot clear when women did FFQ <strong>and</strong> period of pregnancy it was intended to coverComparison≤ 11.5 v > 11.5 serves of cereal per weekOutcomesPersistent wheeze, atopic wheeze <strong>and</strong> atopy at 6.5 yearsResultsPersistent wheeze at 6.5 yearsLow 21 (15.22%) v high 16 (11.27%); pns (also adjusted for firstborn <strong>and</strong> lower respiratory tract infections at age 1)Atopic wheeze at 6.5 yearsLow 14 (8.14%) v high 6 (3.51%); pns (also adjusted for birthweight <strong>and</strong> maternal atopy)Atopy at 6.5 yearsLow 34 (17.00%) v high 36 (17.06%) pns (also adjusted for birthweight <strong>and</strong> maternal atopy)Followup6.5 yearsConfounding Analyses adjusted for gender, maternal <strong>and</strong> paternal asthma, maternal social class <strong>and</strong> education, BMI at age 6.5 years <strong>and</strong> total energy intake at 6.5yearsRisk of biasLow risk of bias: Results from 468/482 children (97%) able to be analysed (4 incomplete data <strong>and</strong> 8 implausible values);RelevanceDiets in Menorca may differ from diets of Australian women, particularly urban womenOther commentsDietary guidelines for pregnant <strong>and</strong> <strong>breastfeeding</strong> women: evidence report110
Reference George 2005Food typeCereal (breads <strong>and</strong> sugared cereals)Study typeProspective cohort studyLevel of evidence II (aetiology)SettingTexas, USFundingNot reportedParticipants149 Medicaid-qualified women (30% white, 24% African American, 46% Hispanic) – recruited from a larger study on postpartum weight retentionInclusion criteria: 18 years or older; non-Hispanic white, African American or Hispanic ethnicity; birth of a health term infant, fluency <strong>and</strong> literacy inEnglish; absence of pregnancy-related abnormalities <strong>and</strong> disease conditions.Baseline comparisons Significant differences between lactating <strong>and</strong> non-lactating women – higher parity, BMI <strong>and</strong> lower education levels in non-lactating women.Dietary assessment Semiquantitative FFQ to cover pregnancy <strong>and</strong> first six months postpartumTimingFFQ administered at 6 weeks <strong>and</strong> 6 months postpartumComparisonNumber of serves of cerealsOutcomesBreastfeeding (exclusive or partial at 6 months postpartum)ResultsLactating women consumed significantly more wholegrain bread <strong>and</strong> significantly less white bread during pregnancy <strong>and</strong> in the postpartumperiod than non-lactating women (p < 0.05)FollowupConfoundingRisk of biasRelevanceOther commentsNonlactating women significantly reduced their consumption of sugared cereals in the postpartum period compared with pregnancy (p
Reference Godfrey 1996Food typeCereal proteinStudy typeProspective cohort studyLevel of evidence II (aetiology)SettingSouthampton, UKFundingDunhill Trust <strong>and</strong> Medical Research CouncilParticipants538 women who gave birth to a singleton term infantBaseline comparisons See confounding belowDietary assessment FFQTimingFFQ administered in early <strong>and</strong> late pregnancy, to reflect diet in the previous three monthsComparisonmean daily intake of cereal protein 33.7 g IQR 27.2, 40.2 in late pregnancyOutcomesBirthweight, placental weightResultsPlacental weightNo significant association seen between cereal protein intake in late pregnancy <strong>and</strong> placental weight (p = 0.2)BirthweightNo significant association seen between cereal protein intake in late pregnancy <strong>and</strong> birthweight (p = 0.2)FollowupConfoundingRisk of biasRelevanceOther commentsTo birthAdjusted for baby’s sex <strong>and</strong> gender <strong>and</strong> duration of gestation; <strong>and</strong> nutrient intakesLow risk of bias: of 636 women recruited, 596 (94%) agreed to participate; 39 gave birth before 37 weeks, 3 were not visited in late pregnancy <strong>and</strong>placental weight was not recorded for 16, leaving 538 term pregnancies with complete birth <strong>and</strong> nutrition data (85% of the 636 women recruited)Likely to be relevant for Australian womenDietary guidelines for pregnant <strong>and</strong> <strong>breastfeeding</strong> women: evidence report112
Reference Herrick 2003Food groupsCereal (bread)Study typeProspective cohortLevel of evidence II (aetiology)SettingMotherwell, Scotl<strong>and</strong>FundingDunhill Medical Trust, NIHParticipants251 men <strong>and</strong> women whose mothers’ food intakes had been recorded during pregnancy during 1967 to 1968. These women had been advised to eat0.45 kg of red meat a day <strong>and</strong> to avoid carbohydrate-rich foods during pregnancyBaseline comparisons See confounding belowDietary assessment Mothers asked about consumption of 10 foodsTimingEarly pregnancy (≤ 20 weeks); late pregnancy (> 20 weeks)Comparison Slices of bread per day (mean consumption in late pregnancy = 0.8 SD? 1.1)OutcomesCortisol concentrations in offspring aged 30 yearsResultsCortisol (change per unit change in maternal bread consumption during pregnancy)No significant associationLength of followupConfoundingRisk of biasRelevanceOther comments30 yearsAnalyses adjusted for offspring’s gender, social class at birth, BMI, alcohol consumption, <strong>and</strong> activity levelModerate risk of bias: <strong>For</strong> the 1432 records from 1967-8 recorded liveborn, singleton births with complete names, birth measurements <strong>and</strong> ≥ 1 dietrecord. 965 offspring were alive <strong>and</strong> living locally; <strong>and</strong> after attrition or declining to participate, 251 (17.5%) were available for analysis.Very high intake of meat <strong>and</strong> very low carbohydrate intake limits the relevance to current dietary intakes of Australian womenAuthors state that “in the setting of advice to follow a pregnancy diet high in protein <strong>and</strong> low in carbohydrate, an unbalanced pattern of higher meat/fish<strong>and</strong> lower green vegetable consumption in late pregnancy leads to elevated cortisol concentrations in the offspring"Cereal113
Reference Jensen 2004Food typeCereal: grain productsStudy typeCase controlLevel of evidence III-3 (aetiology)SettingCalifornia, USA (part of the Northern California Childhood Leukemia Study)FundingPHSParticipants138 matched cases <strong>and</strong> controls:Cases: Children under 15 years of age, with a parent who spoke English or Spanish, were resident in the study area at the time of diagnosis of acutelymphoblastic leukemia (ALL), with no prior diagnosis of cancerControls: identified from birth certificates matched to the case on date of birth, sex, maternal race, Hispanic ethnicity of mother or father, <strong>and</strong> county ofresidence at birthBaseline comparisons A priori potential confounders were identified as birthweight, <strong>breastfeeding</strong>, maternal age <strong>and</strong> education, parental occupation <strong>and</strong> smoking duringpregnancy – no evidence of confounding was seen for these variables. Also see Confounding below.Dietary assessment FFQTimingDietary intake to reflect the year before the index pregnancy (to indicate dietary status at the start of pregnancy)ComparisonServes of grain productsOutcomesChildhood acute lymphoblastic leukemiaResultsChildhood acute lymphoblastic leukemiaGrain products: aOR 0.86 95% CI 0.37 to 1.98: mean consumption 2.68 [SD 1.10] serves per dayFollowupConfoundingRisk of biasRelevanceOther commentsn/aAnalyses were adjusted for variables previously shown to be significantly associated with ALL in the overall study – income, prior fetal loss, child’sexposure to other children under age five, <strong>and</strong> maternal exposure to indoor insecticides during pregnancy; along with portion size <strong>and</strong> energyconsumptionLow-moderate risk of bias: Of eligible cases identified from January 1995 to November 1999, 83% consented to participate; 69% of the eligible controlsagreed to participate. Of the 161 matched pairs, seven pairs were excluded as the respondent was not the biological mother, 16 pairs were excludeddue to questionable dietary questionnaire data, leaving 138 matched pairs (86%); some recall bias likelyLikely to be relevant for Australian women, though some diet components may differ e.g. high bean consumptionDietary guidelines for pregnant <strong>and</strong> <strong>breastfeeding</strong> women: evidence report114
Reference Knox 1972Food typeCerealStudy typeCase control (cases matched to food consumption at population level for a particular period) – numbers not reportedLevel of evidence III-3 (aetiology)SettingBirmingham, UKFundingNot reportedCases Stillbirths <strong>and</strong> infant deaths due to anencephalus between 1961 <strong>and</strong> 1967Baseline comparisons n/aDietary assessment Population surveysTimingEach quarterComparisonMonthly stillbirths <strong>and</strong> infant deaths due to anencephalus matched to quarterly consumption of main food stuffs (in previous five to nine months)OutcomesAnencephalusResultsLarge white loaves positively associated with cases of anencephalus: r = +0.60 after a lag interval of six monthsFollowupConfoundingRisk of biasRelevanceOther commentsTotal cereals positively associated with cases of anencephalus: r = +0.56 after a lag interval of five monthsn/aAnalyses were not adjustedHigh risk of bias: links between population consumption of foods <strong>and</strong> anencephalus very distal <strong>and</strong> no control for potential confoundersLikely to differ from a modern Australian dietFood consumption of total population not likely to reflect food consumption of pregnant women; <strong>and</strong> will not be able to reflect differences between dietsof individual or specific groupsCereal115
Reference Kwan 2009Food typeCereals: rice, pasta, pizza, cereal (such as raisin bran, granola or shredded wheat, cornflakes, Cheerios, oatmeal, oat bran, grits), bagels, muffins,hamburger buns, biscuits, bread, corn bread, corn tortillas, flour tortillasStudy typeCase controlLevel of evidence III-3 (aetiology)Setting California, USA (part of the Northern California Childhood Leukemia Study – phase 1 <strong>and</strong> 2 (phase 1 reported in Jensen 2004)FundingPHS; Paul O’Gorman Foundation for Children with LeukemiaParticipants866 individuals - 282 matched cases <strong>and</strong> controls (205 pairs <strong>and</strong> 77 trios):Cases: Children under 15 years of age, with a parent who spoke English or Spanish, were resident in the study area at the time of diagnosis of acutelymphoblastic leukemia (ALL), with no prior diagnosis of cancerControls: identified from birth certificates matched to the case on date of birth, sex, maternal race, Hispanic ethnicity of mother or father, <strong>and</strong> county ofresidence at birth (in phase 1 (1995-99) only due to concerns about overmatching on potential environmental exposures linked to leukemia risk)Data collected from August 1995 to November 2002Baseline comparisons A priori potential confounders were identified as birthweight, <strong>breastfeeding</strong>, maternal age <strong>and</strong> education, <strong>and</strong> smoking during pregnancy.Also see Confounding below.Dietary assessment FFQTimingDietary intake to reflect the year before the index pregnancy (to indicate dietary status at the start of pregnancy)ComparisonServes of cerealsOutcomesChildhood acute lymphoblastic leukemiaResultsChildhood acute lymphoblastic leukemiaGrain products: aOR 1.20 95% CI 0.70 to 2.05: median consumption 2.6 (25 th 75 th percentiles 2.0, 3.3) serves per dayFibre cereals:aOR 1.12 95% CI 1.07 to 1.26 (number of serves not reported)Fibre from grains: aOR 0.99 95% CI 0.60 to 1.63 median consumption 5.79 (25 th 75 th percentiles 3.84, 8.58) serves per dayFollowupConfoundingRisk of biasRelevanceOther commentsn/aAnalyses were adjusted for total energy intake, household income, indoor insecticide exposure during pregnancy; <strong>and</strong> proportion of foods reported aslarge or extra-large portion sizeAlso adjusted for child’s diet, with little effect seen on resultsLow-moderate risk of bias: Of eligible cases identified from January 1995 to November 2002, 86% consented to participate; 56% of the eligible controlsagreed to participate. 190 participants excluded: leukemia diagnosis was not ALL (n = 127); no dietary data (n = 4); a case or a control respondent wasnot the biological mother (n = 14), questionable dietary questionnaire data (n = 45), leaving 282 matched sets (86%).Likely to be relevant for Australian women, though some diet components may differ e.g. high bean consumptionRegular use of any dietary supplement was not associated with risk of ALL;Authors did not comment on the positive association with fibre cerealsDietary guidelines for pregnant <strong>and</strong> <strong>breastfeeding</strong> women: evidence report116
Reference Lamb 2008Dietary patterns Cereals: Gluten-containing foods (brownies, cookies, cakes, cereals, oats, other grains, bread, muffins, hamburgers, hot dogs, meat s<strong>and</strong>wiches,pancakes, pasta, pie, pizza, pastries, beer, bran <strong>and</strong> wheat germ); non-gluten containing cereals (rice <strong>and</strong> corn)Study typePart of a longitudinal prospective birth cohort studyLevel of evidence II (aetiology)SettingDenver, Colorado, US (part of the Diabetes Autoimmunity Study in the Young (the DAISY))FundingNational Institutes of <strong>Health</strong>, Diabetes Endocrine Research CenterParticipants642 newborns at increased risk for type 1 diabetes (based on HLA genotype <strong>and</strong> family history), enrolled in the study from 1993 to 2004; 27 casesdefined as testing positive for islet autoantibodies at two consecutive blood draws <strong>and</strong> still positive (diabetic) at last follow-upBaseline comparisons See confounding belowDietary assessment FFQTimingFrom 1997 to 2004, mothers of infants enrolled in DAISY completed FFQ soon after birth, reflecting diet in the last trimester of pregnancy (but couldsubmit FFQ before child reached one year of age)ComparisonMonthly servings of gluten-containing foods <strong>and</strong> non-gluten cereal grainsOutcomes Islet autoimmunity in children (a precursor of type 1 diabetes) at 9 months, 15 months, 2 years <strong>and</strong> annually thereafter up to the age of 15ResultsGluten-containing foods:aHR (for one st<strong>and</strong>ard deviation change in reported consumption) 0.89 95% CI 0.50 to 1.58 (127 mean monthly servings)Non-gluten cereal grains:aHR (for one st<strong>and</strong>ard deviation change in reported consumption) 0.98 95% CI 0.64 to 1.51 (12 mean monthly servings)FollowupConfoundingRisk of biasRelevanceOther commentsUp to 15 yearsSize for gestational age, ethnicity, maternal education, household income, exposure to type 1 diabetes or GDM in utero, gender of child, maternal ageat birth, total calories of maternal dietModerate risk of bias: subset of DAISY only (later enrolments); <strong>and</strong> women were not reminded to submit FFQ, leading to possible selection bias; of the661 FFQs returned, 5 were excluded because incomplete, <strong>and</strong> 14 for implausible dietary intakes, leaving 642 FFQs for analysis; child’s diet notcontrolled forLikely to be relevant to some Australian women, although women in this study may have been at higher risk of diabetesCereal117
Reference Laraia 2007Dietary patterns % of cereal serving recommendationStudy typeProspective cohort studyLevel of evidence II (aetiology)SettingNorth Carolina, US (part of the Pregnancy, Infection <strong>and</strong> Nutrition (PIN) cohort)FundingNational Institute of Child <strong>Health</strong> <strong>and</strong> Human Development; NIHParticipants 2394 predominantly lower to middle income women, recruited between 24 <strong>and</strong> 29 weeks gestation (1995-2000)Baseline comparisons Mean DQI-P score varied significantly by socio-demographic characteristics; there were higher mean DQI-scores for women who engaged in prepregnancyvigorous exercise <strong>and</strong> pre-pregnancy vitamin useDietary assessment Modified block FFQTimingSelf-report at 26-28 weeks gestation covering previous 3 months (corresponding to the 2 nd trimester)ComparisonBMI categoriesOutcomesPregravid weight status (not an outcome but there is an association)ResultsAverage % of cereal serving recommendation [SD]Underweight 43.5 [22.8]Normal weight 41.2 [22.7]Overweight 42.8 [24.4]Obese 40.4 [23.6]P value for trend < 0.05*adjusted for age, ethnicity, level of education, poverty, number of children, smoking duringpregnancy onlyFollowupConfoundingRisk of biasRelevanceOther comments26 to 31 weeks gestationAge, ethnicity, level of education, poverty, number of children, smoking during pregnancy, regular vitamin use prior to pregnancy, vigorous leisureactivity 3 months prior to pregnancyLow risk of bias: better to have used normal weight women as the reference rather than underweight women DQI-P tertile comparisonLikely to be relevant to Australian womenDietary guidelines for pregnant <strong>and</strong> <strong>breastfeeding</strong> women: evidence report118
Reference Latva-Pukkila 2009Dietary patterns Grain productsStudy typeProspective cohort studyLevel of evidence II (aetiology)Setting Turku, Finl<strong>and</strong> (cohort from Piirainen 2006)FundingSocial Insurance Institution of Finl<strong>and</strong>, the Sigrid Juselius Foundation <strong>and</strong> the Academy of Finl<strong>and</strong>Participants256 pregnant womenBaseline comparisons Women with NVP were older <strong>and</strong> tended to be primiparous compared to those withoutDietary assessment 3 day food diariesTimingThree times during pregnancy (mean 14, 24 <strong>and</strong> 34 weeks gestation)ComparisonWith nausea <strong>and</strong> vomiting in pregnancy (NVP) versus no NVP;134 (72%) women reporting experiencing nausea; with 40 (30%) vomiting (9 (4.8%) more than once a day) during the first trimesterOutcomesInfluence of nausea <strong>and</strong> vomiting in pregnancy on dietary intake;Severity of NVP assessed as having no nausea <strong>and</strong> vomiting, only nausea, vomiting once a day or vomiting more than once a day, with the primaryoutcome being presence or absence of nauseaResultsWith NVP (n = 134) Without NVP (n = 53) pGrain products (g), median (IQR)daily211 (157 to 256) 202 (169 to 252) 0.952FollowupConfoundingRisk of biasRelevanceOther commentsTo 34 weeks gestationNot reported if any of the analyses were adjustedModerate risk of bias: not clear if analyses were adjusted for potential confoundersLikely to be relevant to Australian womenCereal119
Reference Mitchell 2004Dietary patterns Cereal (carbohydrate rich food such as rice, noodles, pasta, bread, breakfast cereals – <strong>and</strong> potatoes)Study typeCase-control studyLevel of evidence III-3 (aetiology)SettingWaitemata <strong>Health</strong> or Auckl<strong>and</strong> <strong>Health</strong>care regions, New Zeal<strong>and</strong>Funding<strong>Health</strong> Research Council of New Zeal<strong>and</strong>, Foundation for the Newborn, Child <strong>Health</strong> Research FoundationParticipants Mothers of 1138 children born between October 1995 <strong>and</strong> November 1997 (844 born SGA <strong>and</strong> 870 born appropriate for GA); only term infants (> 37weeks);Exclusions: preterm births (< 37 weeks), multiple births <strong>and</strong> those with congenital anomaliesBaseline comparisons See confounding belowDietary assessment FFQTimingFFQ administered after birth (to cover the periconception period <strong>and</strong> the last month of pregnancy)Comparison0-1. 5 v > 1. 5-2.25 v > 2.25-2.75 v > 2.75-3.5 v > 3.5 serves of cereal per dayOutcomesSGA (≤ 10 th centile for GA <strong>and</strong> gender)ResultsSGA (cereal consumption at time of concepionSGA AGA aOR (95%) p value for trend0-1.5 154/538 (28.6%) 127/598 (21.2%) 1.31 (0.88 to 1.97)>1.5-2.25 114/538 (21.2%) 109/598 (18.2%) 1.22 (0.80 to 1.86)>2.25-2.75 105/538 (19.5%) 147/598 (24.6%) 0.81 (0.54 to 1.23)>2.75-3.5 70/538 (13.0%) 108/598 (18.1%) 0.77 (0.49 to 1.21)>3.5 96/538 (17.8%) 107/598 (17.9%) 1 0.04SGA (cereal in last month of pregnancy)0-1.5 123/539 (22.8%) 101/598 (16.9%) 1.52 (0.99 to 2.33)>1.5-2.25 96/539 (17.8%) 100/598 (16.7%) 1.36 (0.87 to 2.13)>2.25-2.75 114/539 (21.2%) 125/598 (20.9%) 1.08 (0.71 to 1.65)>2.75-3.5 118/539 (21.9%) 170/598 (28.4%) 1.00 (0.67 to 1.51)>3.5 89/539 (16.5%) 102/598 (17.1%) 0.17FollowupConfoundingRisk of biasRelevanceOther commentsNAAdjusted for socio-economic status, ethnicity, maternal height, maternal weight before pregnancy, maternal hypertension <strong>and</strong> maternal smoking; butfolate supplementation was not controlled for (periconception folate was significantly associated with reduced SGA risk).Low-moderate risk of bias: Of the 2182 eligible infants, parents of 1714 (78.6%) completed the FFQ; 1138 (67%) of women completed the FFQ; missingitems in completed FFQ treated as woman not consuming any cereal.Likely to be relevant to Australian womenOnly term infants included;Not clear if potatoes are also included in the vegetable categoryDietary guidelines for pregnant <strong>and</strong> <strong>breastfeeding</strong> women: evidence report120
Reference Nwaru 2010Food typeCereal (rye, wheat, oats, barley, rice, pasta, macaroni, starches <strong>and</strong> other grains)Study typeProspective cohort studyLevel of evidence II (aetiology)SettingTampere, Finl<strong>and</strong>FundingAcademy of Finl<strong>and</strong>, Finnish Pediatric Research Foundation, the Juho Vainio Foundation, the Yrjo Jahnsson Foundation, Turku, Oulu <strong>and</strong> TampereUniversity Hospitals, JDRF, Novo Nordisk Foundation, EU Biomed 2 ProgramParticipants931 mother-infant pairs (children with human leukocyte antigen-conferred susceptibility to type 1 diabetes) participating in the Finnish type 1 DiabetesPrediction <strong>and</strong> Prevention (DIPP) Nutrition Study between September 1996 <strong>and</strong> October 1997Baseline comparisons See confounding belowDietary assessment FFQTimingFFQ given to women after birth, for return at the three month visit (FFQ intended to cover maternal diet during pregnancy <strong>and</strong> lactation)ComparisonAmount of cereal intakeOutcomesAllergic sensitisation in offspring by 5 years: food allergens (egg, cow’s milk, fish, wheat); inhalant allergens (house dust mite, cat, timothy grass, birch)ResultsTotal cerealsFood allergensInhalant allergensOR 0.87 95% CI 0.50 to 1.52 OR 1.00 95% CI 0.61 to 1.64aOR 1.26 95% CI 0.66 to 2.43 aOR 0.94 95% CI 0.53 to 1.66WheatFood allergensInhalant allergensOR 0.98 95% CI 0.65 to 1.49 OR 1.12 95% CI 0.78 to 1.62aOR 1.20 95% CI 0.75 to 1.93 aOR 1.16 95% CI 0.77 to 1.74FollowupConfoundingRisk of biasRelevanceOther commentsTo 5 yearsAdjusted for energy intake, place of birth, season of birth, sex of the child, number of siblings, gestational age at birth, parental asthma, parental allergicrhinitis, maternal age at birth, maternal smoking during pregnancy, maternal educationLow risk of bias: data available for 931/1175 (79.2%) children recruited – 108 did not participate in survey, a further 49 did not have IgE measurements,a further 87 had no FFQ or an incomplete FFQLikely to be relevant to Australian women; some differences in individual types of vegetables between Finl<strong>and</strong> <strong>and</strong> Australia28% of women took vitamin D supplements, 73% took iron supplements;HLA genotype not likely to have any impact on the development of allergic diseases.Cereal121
Reference Petridou 2005Food typeCereals <strong>and</strong> starchy rootsStudy typeCase-control studyLevel of evidence III-3SettingGreeceFundingThe Childhood Hematology-Oncology Group: Athens University Medical School, Aristotle University of Thessaloniki, University Hospital of HeraklionParticipants Cases: 131 children with acute lymphoblastic leukemia, aged 12 to 59 months, gender <strong>and</strong> age matched toControls: 131 children hospitalised for minor conditions between 1999 <strong>and</strong> 2003Baseline comparisons See confounding belowDietary assessment FFQTimingDuring index pregnancyComparisonQuintiles of cereal/starchy root intake – median Q1; 52 g/day: median Q5 164 g/dayOutcomesAcute lymphoblastic leukemia (ALL)ResultsAcute lymphoblastic leukemia (ALL)Median g/day Cases Controls p for trendQ1: 52 21 33Q2: 74 27 25Q3: 95 27 24Q4: 113 27 26Q5: 164 29 23 0.13Logistic regression: one quintile more of cereals/starchy roots: aOR 1.23 95% CI 0.94 to 1.60FollowupConfoundingRisk of biasRelevanceOther commentsNATotal energy intake (but not mutually among food groups); matching variables; maternal age at birth; birthweight; maternal smoking during pregnancy;maternal years of schooling, maternal occupationModerate: moderate risk of recall bias for women being able to accurately remember their dietary intake during a pregnancy some time previously;Cases: 171 children with ALL were identified; 21 had missing data, consent was not given in 9 cases <strong>and</strong> 10 were unable to be matched, leaving 131(77%) of cases availableDiets of Greek women may differ from current diets of Australian womenDietary guidelines for pregnant <strong>and</strong> <strong>breastfeeding</strong> women: evidence report122
ReferenceFood typeStudy typeLevel of evidenceSettingFundingParticipantsBaseline comparisonsDietary assessmentTimingComparisonOutcomesResultsPetridou 1998aCereals <strong>and</strong> starchy roots (mostly bread – white bread, brown bread, traditional bread, pasta, various breakfast cereals, trahana, cheese pie (0.5), meatpie (0.5), vegetable pie (0.5), pizza (0.5), pastitsio (0.5), potatoes).Case-control studyIII-3Greater Athens area, GreeceGreek Ministry of <strong>Health</strong> <strong>and</strong> Welfare, <strong>and</strong> Foundation for Research in Childhood ‘S. Doxiadis’Cases: 109 children with cerebral palsy (CP), born between 1984 <strong>and</strong> 1988 (estimated to be two-thirds of the children with CP born during this period)Controls (1): 155 neighbouring children of similar sex <strong>and</strong> age (± 12 months)Controls (2): 99 healthy siblings of similar sex <strong>and</strong> age (± 12 months) of the first neurological patient seen by the attending physician after a visit by theCP patientSee confounding belowFFQDuring pregnancy≤ 1 versus 2 versus > 2 serves of cereals <strong>and</strong> starchy roots per day;regression analysis: risk of cerebral palsy with change in consumption by one unit ( = consumption of cereals <strong>and</strong> starchy roots 3 times per week)Cerebral palsy≤ 1 serve of cereals <strong>and</strong> starchy roots per day: 11/91 (12.1%) cases v 38/246 (15.4%) controls2 serves of cereals <strong>and</strong> starchy roots per day: 59/91 (64.8%) cases v 89/246 (36.2%) controls> 2 serves of cereals <strong>and</strong> starchy roots per day: 21/91 (23.1%) cases v 119/246 (48.4%) controlsRegression analysis for each unit of consumption of cereal 3 times per week:aOR 0.83 95% CI 0.72 to 0.96aOR 0.85 95% CI 0.72 to 1.00 (additionally adjusted for all food groups)FollowupConfoundingRisk of biasRelevanceOther comments8 yearsAge <strong>and</strong> sex of child, maternal age at birth, maternal age at menarche, maternal chronic disease, previous spontaneous abortions, persistent vomitingduring index pregnancy, multiple pregnancy, number of obstetric visits; timing of membrane rupture in index birth, use of general anaesthesia in theindex birth, mode of birth, abnormal placenta, infant head circumference at birth, congenital malformation, place of index birth, use of supplementaryiron during index pregnancy, physical exercise during index pregnancy, painless childbirth classes.The following were not included in the model:- Smoking or consumption of coffee or alcohol during pregnancy (stated to be “unrelated to CP <strong>and</strong> had no confounding influence”);- Gestational age, birthweight <strong>and</strong> maternal weight gain (stated to be “strong predictors of CP, but were not included in the model, since they areprobably intermediate stages in a possible link between diet <strong>and</strong> CP (mediators) rather than genuine confounders”Moderate-high: High risk of recall bias for women being able to accurately remember their dietary intake during a pregnancy 8 years previously;Cases: 109 children with CP were identified; for 6 children either collaboration with their guardian or a diagnosis of CP was not confirmed; <strong>and</strong> reliablematernal dietary intakes were not available for 12 women, leaving 91 cases available for analysis.Controls: 278 mother-child pairs were approached; 16 refused to participate; matching controls were not available in 8 instances, <strong>and</strong> reliable maternaldietary intakes were not available for 8 women, leaving 246 controls available for analysis.Diets of Greek women in 1998 may differ from current diets of Australian womenCereal123
ReferencePetridou 1998bFood type Cereals <strong>and</strong> starchy roots (white bread, brown bread, traditional bread, pasta, various breakfast cereals, trahana, cheese pie (0.5), meat pie (0.5),vegetable pie (0.5), pizza (0.5), pastitsio (0.5), potatoes).Study typeRetrospective cohort studyLevel of evidence III-2SettingTwo cities (Athens <strong>and</strong> Larissa) in GreeceFundingNot reportedParticipants 368 nondiabetic women giving birth to healthy singleton babies from March to October 1995Baseline comparisons See confounding belowDietary assessment FFQTimingImmediately after birthComparison≤ 2 versus 3 versus 4 versus > 4 serves of cereals <strong>and</strong> starchy roots per day;≤ 2 serves per day: 69/268 (18.8%)3 serves per day: 123/268 (33.4%)4 serves per day: 106/268 (28.8%)>4 serves per day: 70/268 (19.0%)OutcomesResultsFollowupConfoundingRisk of biasRelevanceOther commentsRegression analysis: mean change in birthweight (g) for each unit change in consumption ( = consumption of cereals <strong>and</strong> starchy roots once daily)BirthweightBirthweightRegression analysis for each unit of consumption of cereals <strong>and</strong> starchy roots (once daily):31 g [SE37], p = 0.4018 g [SE38], p = 0.63 without controlling for total energy intakeTo birthGender of child, birth order, maternal age, maternal education, maternal height, history of miscarriages, history of abortions, bleeding, smoking duringpregnancy, coffee drinking, alcohol drinking, maternal weight gain, total energy intake, folic acid supplementsLow-moderate risk of bias: of the 400 eligible women, 368 (92%) were available for analysis – 32 were unwilling or unable to participate; women wouldhave been aware of the birthweight of their baby before completing the FFQDiets of Greek women in 1995 may differ from current diets of Australian womenDietary guidelines for pregnant <strong>and</strong> <strong>breastfeeding</strong> women: evidence report124
Reference Radesky 2008Food typeCereal (whole grains)Study typeProspective cohort studyLevel of evidence II (aetiology)SettingBoston, MA, USAFundingNIH, March of Dimes Birth Defects Foundation, Harvard Medical School Division of Nutrition, Harvard Pilgrim <strong>Health</strong> Care FoundationParticipants1773 women with singleton pregnancies enrolled in Project Viva (initial antenatal visit before 22 weeks gestation, able to complete study forms inEnglish, did not plan to move out of the study area before birthBaseline comparisons Included women had lower pregnancy BMIs than excluded women, were less likely to be African-American or Hispanic, to have low SESDietary assessmentTimingComparisonOutcomesResultsFollowupConfoundingRisk of biasRelevanceOther commentsSee confounding belowFFQFFQ completed at first antenatal visit at a mean 11.8 weeks GA (range 5-25.6 weeks) - to assess diet during first trimesterServes of whole grainsGlucose tolerance testing at 26-28 weeks gestation – GDM; impaired glucose tolerance (IGT)Normal glucose tolerance defined as: < 140 mg/dL 1 hour after a 50 g glucose load (non-fasting oral glucose challenge test);IGT defined as ≥ 140 mg/dL on non-fasting oral glucose challenge test but 0 or 1 abnormal result for a fasting glucose tolerance test (100g oral glucoseload where normal = < 95 mg/dL at baseline, < 180 mg/dL at 1 h, < 155 mg/dL at 2 h <strong>and</strong> < 140 mg/dL at 3 h;GDM defined as ≥ 140 mg/dL on non-fasting oral glucose challenge test with 2 or more abnormal GTT results(<strong>For</strong> the 39 women with incomplete glucose testing data, medical records were used to assign them to normal glucose tolerance (n = 7), IGT (n = 10), orGDM (n = 22).Impaired glucose tolerance (per serve of whole grains):aOR 1.05 95% CI 0.92 to 1.19GDM (per serve of whole grains):aOR 0.90 95% CI 0.73 to 1.13To birthAdjusted for maternal age, pre-pregnancy BMI, ethnicity, family history of diabetes, history of GDM in a prior pregnancy, smoking in index pregnancy;Used energy partition models <strong>and</strong> nutrient density substitution models to study the simultaneous effects of different macronutrients on GDM <strong>and</strong> IGTrisk;Other studies have not adjusted for different types of fats (which may have opposing effects on risk of GDM)Low risk of bias: Of 2128 women who gave birth to a live infant, 24 were excluded for missing or incomplete glucose tolerance testing records; 18 with ahistory of previous type 1 or 2 DM or PCOS with glucose intolerance, 342 missing or implausible first trimester diet information; 11 completion of FFQafter 26 weeks GA (i.e. after glucose tolerance screening) or on an unknown date; leaving 1773 (83.3%) available for analysisLikely to be relevant to Australian womenPaper concludes that “nutritional status entering pregnancy, as reflected by pre-pregnancy BMI, is probably more important than pregnancy diet indevelopment of GDM”Cereal125
Reference Stuebe 2009Dietary patterns Cereals: whole grainsStudy typeProspective cohort study (Project Viva)Level of evidence II (aetiology)Setting8 urban <strong>and</strong> suburban obstetric offices of a multispecialty group practice in eastern Massachusetts, USAFundingUS NIH, Harvard Medical School, Harvard Pilgrim <strong>Health</strong> Care FoundationParticipants1338 women giving birth to a live singleton infant, < 22 weeks gestation at study entry; 379 (27%) were overweight (BMI ≥ 26); 703 (51%) experiencedexcessive weight gainExclusions: not fluent in EnglishBaseline comparisons See confounding belowDietary assessment FFQTimingAdministered in first <strong>and</strong> second trimesters of pregnancyComparisonWhole grains (serves per day)Outcomes Excessive gestational weight gain (IOM 1990)ResultsExcessive gestational weight gain: whole grainsServes per day, medianaOR (95% CI)Inadequate/adequate GWG excessive GWGWhole grains 1.25 [SD1.03] 1.27 [SD1.04] 1.06 (0.95 to 1.19)FollowupConfoundingRisk of biasRelevanceOther commentsTo birthAdjusted for pre-pregnancy BMI, maternal age, race/ethnicity, smoking status, gestational age at birth, nausea in first trimester in pregnancyLow risk of bias: Of 2083 eligible women, 1388 (67%) of women had data available for analysis (31 had missing information on pre-pregnancy BMI <strong>and</strong>gestational weight gain; 226 had missing covariate information <strong>and</strong> 438 had missing data on either first or second-trimester diet <strong>and</strong> mid-pregnancyphysical activity); included women were less likely to be African-American or Hispanic, to be younger, multiparous <strong>and</strong> obeseLikely to be relevant to Australian womenDietary guidelines for pregnant <strong>and</strong> <strong>breastfeeding</strong> women: evidence report126
Reference Venter 2009Food groupsCereal: wheatStudy typeProspective cohortLevel of evidence II (aetiology)SettingPortsmouth, UKFundingFood St<strong>and</strong>ards AgencyParticipants 696 pregnant women at 12 weeks gestation (with estimated birth date between 1 September 2001 <strong>and</strong> 31 August 2002)Baseline comparisons <strong>Pregnant</strong> women with a maternal history of atopic disease were more likely to smokeDietary assessment FFQTimingFFQ at 36 weeks gestationComparisonNo (< 1% of women) versus moderate (8%) versus frequent (92%) versus uncertain (< 1%) consumption of wheat during pregnancyOutcomesFood hypersensitivity (FHS) in infants up to three years of ageResultsInfant FHS at one year:4/933 infants showed FHS to milk in the first year (4 where mothers reported frequent consumption of milk during pregnancy)Infant FHS at three years:4/933 infants showed FHS to milk in the first three years (4 where mothers reported frequent consumption of milk during pregnancy)“Statistical inferences could not be measured due to the small numbers”Length of followupConfoundingRisk of biasRelevanceOther commentsUp to three yearsAnalyses do not appear to have been adjustedModerate-high risk of bias: Data were obtained from 91% (n = 969) of the birth cohort; at 1 year follow-up data were available for 77.6% (752/969) <strong>and</strong>for 65.2% (632/969) at 3 years; analyses probably not adjusted for confoundersLikely to be relevant to Australian womenCereal127
Reference Willers 2007Food typeCereals (whole grain products)Study typeProspective cohort (longitudinal)Level of evidence II (aetiology)SettingAntenatal clinics at Aberdeen Maternity Hospital, Aberdeen, Scotl<strong>and</strong>FundingAsthma UK, GA 2 LEN European Network of Excellence on Global Allergy <strong>and</strong> AsthmaParticipants1212 children (singleton births) whose mothers were recruited between October 1997 <strong>and</strong> April 1999 at a median gestational age of 12 weeksBaseline comparisonsWomen were representative of the local obstetric populationSee confounding belowDietary assessment FFQTimingFFQ mailed at 32 weeks gestation to cover dietary intake over the previous 2-3 monthsComparisonTertiles:OutcomesWheeze, asthma, allergic rhinitis, atopic eczema, hay fever at 5 yearsResultsFollowupConfoundingRisk of biasRelevanceOther commentsWhole grain products – no consistent linear associations with respiratory <strong>and</strong> atopic outcomes in 5 year old children (exact numbers not reported inthe paper).5 yearsAdjusted for maternal age, paternal social class, maternal education, maternal smoking during pregnancy, smoking in the child’s home at 5 years,energy intake, maternal asthma, maternal atopy, child’s birthweight, child’s sex, presence of older siblings, <strong>and</strong> <strong>breastfeeding</strong>Low risk of bias: Initial study population of 1924 children dropped to 1212 participants with complete data (63.0%) (questionnaire, at least one of theoutcome time points).Likely to be reasonably relevant to Australian womenInclusion of maternal supplement use during pregnancy did not materially change the resultsDietary guidelines for pregnant <strong>and</strong> <strong>breastfeeding</strong> women: evidence report128
Reference Zhang 2006Food typeCereal fibreStudy typeProspective cohort studyLevel of evidence II (aetiology)SettingUSA (Nurses’ <strong>Health</strong> Study II)FundingNIHParticipants 13,110 women who reported having at least one singleton pregnancy lasting ≥ 6 months, between 1992 <strong>and</strong> 1998Exclusions: implausible total energy intake (< 500 kcal/day or > 3,500 kcal/day); multiple gestation; history of diabetes, cancer, cardiovascular disease,or GDM on the 1989 or 1991 questionnaire.Baseline comparisons See resultsDietary assessment FFQTimingFFQs administered in 1991 or 1995 to reflect dietary intake over the past yearComparisonQuintiles of cereal fibre intake (lowest quintile = reference)OutcomesSelf-reported diagnosis of gestational diabetes mellitus (GDM)ResultsGDM (adjusted for age, parity, BMI)g/day Cases/person-years RR (95% CI) p-value for trendQ1 (7.2) 118/20,688 0.69 (0.54 to 0.87)
Q3 (4.6 to 5.6) 136/20,229 0.83 (0.65 to 1.04)Q4 (5.7 to 7.2) 140/18,826 0.89 (0.71 to 1.15)Q5 (>7.2) 126/19,280 0.76 (0.59 to 0.98) 0.02Each 5 g/day increment 0.77 (0.64 to 0.91)FollowupVariableConfoundingSee resultsRisk of bias Low risk of bias: actual attrition figures for this substudy not reported but overall attrition reported to be 10%RelevanceLikely to be relevant to Australian womenOther comments Dietary assessment periods will differ in relation to timing of pregnancies – need to assume a woman’s diet will remain similar over time <strong>and</strong> whether orshe is pregnant or planning to become pregnant. This assumption may not apply to alcohol intake, for exampleDietary guidelines for pregnant <strong>and</strong> <strong>breastfeeding</strong> women: evidence report130
ReferencesChatzi L, Torrent M, Romieu I, Garcia-Esteban R, Ferrer C, Vioque J, KogevinasM <strong>and</strong> Sunyer J. "Mediterranean diet in pregnancy is protective for wheeze<strong>and</strong> atopy in childhood." Thorax 2008: 63(6): 507-13.George GC, Hanss-Nuss H, Milani TJ <strong>and</strong> Freel<strong>and</strong>-Graves JH. "Food choices oflow-income women during pregnancy <strong>and</strong> postpartum." J Am Diet Assoc2005: 105(6): 899-907.Godfrey K, Robinson S, Barker DJ, Osmond C <strong>and</strong> Cox V. "Maternal nutritionin early <strong>and</strong> late pregnancy in relation to placental <strong>and</strong> fetal growth." BMJ1996: 312(7028): 410-4.Herrick K, Phillips DI, Haselden S, Shiell AW, Campbell-Brown M <strong>and</strong> GodfreyKM. "Maternal consumption of a high-meat, low-carbohydrate diet in latepregnancy: relation to adult cortisol concentrations in the offspring." J ClinEndocrinol Metab 2003: 88(8): 3554-60.Jensen CD, Block G, Buffler P, Ma X, Selvin S <strong>and</strong> Month S. "Maternal dietaryrisk factors in childhood acute lymphoblastic leukemia (United States)."Cancer Causes Control 2004: 15(6): 559-70.Knox EG. "Anencephalus <strong>and</strong> dietary intakes." Br J Prev Soc Med 1972: 26(4):219-23.Kwan ML, Jensen CD, Block G, Hudes ML, Chu LW <strong>and</strong> Buffler PA. "Maternaldiet <strong>and</strong> risk of childhood acute lymphoblastic leukemia." Public <strong>Health</strong> Rep2009: 124(4): 503-14.Lamb MM, Myers MA, Barriga K, Zimmet PZ, Rewers M <strong>and</strong> Norris JM."Maternal diet during pregnancy <strong>and</strong> islet autoimmunity in offspring."Pediatr Diabetes 2008: 9(2): 135-41.CerealLaraia BA, Bodnar LM <strong>and</strong> Siega-Riz AM. "Pregravid body mass index isnegatively associated with diet quality during pregnancy." Public <strong>Health</strong> Nutr2007: 10(9): 920-6.Latva-Pukkila U, Isolauri E <strong>and</strong> Laitinen K. "Dietary <strong>and</strong> clinical impacts ofnausea <strong>and</strong> vomiting during pregnancy." J Hum Nutr Diet 2010: 23(1): 69-77.Mitchell EA, Robinson E, Clark PM, Becroft DM, Glavish N, Pattison NS, PryorJE, Thompson JM <strong>and</strong> Wild CJ. "Maternal nutritional risk factors for small forgestational age babies in a developed country: a case-control study." ArchDis Child Fetal Neonatal Ed 2004: 89(5): F431-5.Nwaru BI, Ahonen S, Kaila M, Erkkola M, Haapala AM, Kronberg-Kippila C,Veijola R, Ilonen J, Simell O, Knip M <strong>and</strong> Virtanen SM. "Maternal diet duringpregnancy <strong>and</strong> allergic sensitization in the offspring by 5 yrs of age: aprospective cohort study." Pediatr Allergy Immunol 2010: 21(1 Pt 1): 29-37.Petridou E, Koussouri M, Toupadaki N, Youroukos S, Papavassiliou A,Pantelakis S, Olsen J <strong>and</strong> Trichopoulos D. "Diet during pregnancy <strong>and</strong> the riskof cerebral palsy." Br J Nutr 1998a: 79(5): 407-12.Petridou E, Ntouvelis E, Dessypris N, Terzidis A <strong>and</strong> Trichopoulos D."Maternal diet <strong>and</strong> acute lymphoblastic leukemia in young children." CancerEpidemiol Biomarkers Prev 2005: 14(8): 1935-9.Petridou E, Stoikidou M, Diamantopoulou M, Mera E, Dessypris N <strong>and</strong>Trichopoulos D. "Diet during pregnancy in relation to birthweight in healthysingletons." Child Care <strong>Health</strong> Dev 1998b: 24(3): 229-42.Radesky JS, Oken E, Rifas-Shiman SL, Kleinman KP, Rich-Edwards JW <strong>and</strong>Gillman MW. "Diet during early pregnancy <strong>and</strong> development of gestationaldiabetes." Paediatr Perinat Epidemiol 2008: 22(1): 47-59.131
Stuebe AM, Oken E <strong>and</strong> Gillman MW. "Associations of diet <strong>and</strong> physicalactivity during pregnancy with risk for excessive gestational weight gain." AmJ Obstet Gynecol 2009: 201(1): 58 e1-8.Venter C, Pereira B, Voigt K, Grundy J, Clayton CB, Higgins B, Arshad SH <strong>and</strong>Dean T. "Factors associated with maternal dietary intake, feeding <strong>and</strong>weaning practices, <strong>and</strong> the development of food hypersensitivity in theinfant." Pediatr Allergy Immunol 2009: 20(4): 320-7.Willers SM, Devereux G, Craig LC, McNeill G, Wijga AH, Abou El-Magd W,Turner SW, Helms PJ <strong>and</strong> Seaton A. "Maternal food consumption duringpregnancy <strong>and</strong> asthma, respiratory <strong>and</strong> atopic symptoms in 5-year-oldchildren." Thorax 2007: 62(9): 773-9.Zhang C, Liu S, Solomon CG <strong>and</strong> Hu FB. "Dietary fiber intake, dietary glycemicload, <strong>and</strong> the risk for gestational diabetes mellitus." Diabetes Care 2006a:29(10): 2223-30.Dietary guidelines for pregnant <strong>and</strong> <strong>breastfeeding</strong> women: evidence report132
Included studiesDairy FoodsDairy FoodsStudyOutcomes1. Bunin 2005 Childhood brain tumours2. Campbell-Brown 1983 Preterm birth, birthweight, birth length, head circumference at birth, gestational weight gain3. Chan 2006 Birthweight4. Chang 2003 Fetal femur length5. Chatzi 2008 Child persistent wheeze, atopic wheeze, atopy (all at 6.5 years)6. Duvekot 2002 Pre-eclampsia7. Elwood 1981 Gestational age, preterm birth, birthweight, SGA, birth length, head circumference at birth, milk consumption, weight, height,head circumference <strong>and</strong> skin fold of children at 5 years of age8. Evans 1981 Colic9. George 2005 Breastfeeding10. Giordano 2010 Child hypospadias11. Giordano 2008 Child hypospadias <strong>and</strong> cryptorchidism12. Godfrey 1996 Birthweight, placental weight13. Haggarty 2009 Deprivation14. Herrick 2003 Cortisol concentrations in offspring at 30 years of age15. Jakobbson 1983 Colic16. Javaid 2005 Maternal bone mass during pregnancy17. Jensen 2004 Childhood acute lymphoblastic leukemia18. Jones 2000 Bone mass at 8 years19. Knox 1972 Anencephalus20. Kwan 2009 Childhood acute lymphoblastic leukemia21. Lagiou 2006 Maternal sex hormone binding globulin (SHBG), progesterone22. Lamb 2008 Islet autoimmunity23. Latva-Pukkila 2009 Nausea <strong>and</strong> vomiting in pregnancy24. Lovegrove 1994/1996 Clinically diagnosed atopic eczema in the infants at 18 months25. Maconochie 2007 Miscarriage26. Mannion 2006 Infant birth weight, crown-heel length <strong>and</strong> head circumference27. Marcoux 1991 Pre-eclampsia, gestational hypertension28. Mitchell 2004 SGA133
29. Miyake 2006 Postpartum depression30. Moore 2004 Birthweight, ponderal index31. Nwaru 2010 Allergic sensitisation in offspring by 5 years32. Oken 2007 Pre-eclampsia, gestational hypertension33. Olafsdottir 2006 GWG34. Olsen 2007 GWG, SGA, LGA, birthweight, birth length, head circumference, abdominal circumference, <strong>and</strong> placental weight35. Petridou 2005 Childhood acute lymphoblastic leukemia36. Petridou 1998 Cerebral palsy at 8 years37. Richardson 1995 Pre-eclampsia38. Saito 2010 Suspected atopic eczema39. Sausenthaler 2007 Allergic sensitisation, eczema at 2 years of age40. Stuebe 2009 GWG41. Tennekoon 1996 Breastfeeding, resumption of regular menstruation <strong>and</strong> ovulation42. Venter 2009 Infant food hypersensitivity up to three years43. Willers 2007 Asthma44. Willers 2008 Wheeze, dyspnoea, prescription of inhaled steroids for respiratory problems, composite variable ‘asthma symptoms’ in the last12 months (measured longitudinally from 1 to 8 years age)45. Yin 2010 Bone mass at 16 yearsDietary guidelines for pregnant <strong>and</strong> <strong>breastfeeding</strong> women: evidence report134
Evidence SummaryMaternal Outcomes/Associations1. In a case-control study from the Netherl<strong>and</strong>s, drinking 5 or more units of milk a day duringpregnancy was associated with a reduced risk of pre-eclampsia; OR 0.1 95% CI 0.03 to 0.382. In a Canadian case-control study, while there was no clear relationship between dietaryintake of calcium during pregnancy, a high dietary intake of calcium was associated with areduced risk of gestational hypertension (p = 0.02)3. In a cohort study from the USA, increased consumption of milk during pregnancy wasassociated with a borderline increased risk of pre-eclampsia (aOR 1.25 95% CI 1.00 to 1.57)but not for gestational hypertension (aOR 0.93 95% CI 0.76 to 1.12)4. In a cohort study from the USA, both low (< 1 glass a day) <strong>and</strong> high (≥ 3 glasses a day) of milkduring pregnancy were associated with an increased risk of pre-eclampsia5. In a UK cohort study, pre-pregnancy milk intake of more than 1 pint of milk a day wasassociated with significantly less maternal bone resorption at 11 <strong>and</strong> 34 weeks gestation6. In a Scottish quasi-RCT, no significant differences were seen between women supplementedwith milk or cheese compared with women with a normal (unsupplemented) diet duringpregnancy for gestational weight gain: MD 44.0 g/week 95% CI -8.55 to 96.557. In a cohort study from Icel<strong>and</strong>, increased milk consumption in late pregnancy was associatedwith increased gestational weight gain: At least optimal weight gain: aOR 3.10 95% CI 1.57 to 6.13 (700 g/day versus 500 g/day) Excessive weight gain: aOR 1.82 95% CI 1.08 to 3.06 (200 g/day more)8. In a Danish cohort study, increased milk consumption during pregnancy was associated withgestational weight gain: p < 0.001 for eight categories spanning zero to > 6 glasses of milk aday (adjusted analyses)9. In a US cohort study, maternal dairy food consumption during pregnancy was significantlyassociated with excessive gestational weight gain: aOR 1.08 95% CI 1.00 to 1.17 (3compared with 2.9 serves a day)10. In a Scottish cohort study, intake of milk <strong>and</strong> cream during pregnancy was positivelyassociated with deprivation, intake of cheese was negatively associated with deprivation<strong>and</strong> no significant associations were seen for intake of icecream or yoghurt11. In a US cohort study, dairy food intake during pregnancy was not associated with thefollowing possible breast cancer precursors (maternal sex hormone binding globulin (SHBG)<strong>and</strong> progesterone)N Level References163 III-3 Duvekot 2002928 III-3 Marcoux 19911718 II Oken 20079291 II Richardson 1995307 II Javaid 2005180 III-3 Campbell-Brown 1983495 II Olafsdottir 200650,117 II Olsen 20071338 II Stuebe 20091277 II Haggarty 2009277 II Lagiou 2006Dairy Foods135
12. In a UK case-control study, there was a borderline association between at least dailymaternal intake of dairy foods during pregnancy <strong>and</strong> preventing miscarriage: aOR 0.75 95%CI 0.56 to 1.0113. In a Finnish cohort study, nausea <strong>and</strong> vomiting during pregnancy was not associated withconsumption of either milk products or cheese during pregnancyFetal Outcomes14. In a US retrospective cohort study of pregnant adolescent women, fetal femur lengthbetween 20 to 34 weeks gestation was significantly higher for women with a high antenataldairy food consumption (≥ 3 serves per day) – p = 0.001 compared with lower dairy foodintake groupsCongenital Anomalies15. In a UK case-control study, cases of anencephalus were negatively associated with maternalintake of cheese during pregnancy, <strong>and</strong> positively associated with maternal intake oficecream during pregnancy Cheese: r = -0.55 after a lag interval of eight months Icecream: r = +0.60 after a lag interval of five months16. In a Sicilian case-control study, no significant associations were seen between cases ofhypospadias <strong>and</strong> maternal intake of milk or yoghurt17. In a Sicilian case-control study, no significant associations were seen between cases ofhypospadias <strong>and</strong>/or cryptorchidism <strong>and</strong> maternal intake of milk or yoghurtBirth Outcomes18. In a Scottish quasi-RCT, no significant differences were seen between women supplementedwith milk or cheese compared with women with a normal (unsupplemented) diet duringpregnancy for: Preterm birth: RR 0.88 95% CI 0.33 to 2.34 Birthweight: MD 37 g 95% -75.10 to 149.10 Birth length: MD 0.30 cm 95% CI -0.24 to 0.84 Head circumference at birth: MD 0.20 cm 95% CI -0.18 to 0.5819. In a Welsh RCT, no significant differences were seen between women eligible for free milktokens (during pregnancy <strong>and</strong> postnatally) compared with women in a control group for: Preterm birth: RR 0.87 95% CI 0.36 to 2.13 SGA : RR 0.88 95% CI 0.52 to 1.50 Gestational age (weeks): MD -0.10 95% CI -0.27 to 0.07 Birthweight (g): MD 53.00 95% CI -5.70 to 111.70603 cases;6116controlsIII-3 Maconochie 2007256 II Latva-Pukkila 2009350 III-2 Chang 2003NS III-3 Knox 197280 cases; 80controls90 cases;202 controlsIII-3 Giordano 2010III-3 Giordano 2008180 III-3 Campbell-Brown 1983951 children II Elwood 1981Dietary guidelines for pregnant <strong>and</strong> <strong>breastfeeding</strong> women: evidence report136
Birth length (cm): MD 0.10 95% CI -0.15 to 0.35 Birth head circumference (cm): MD 0.0 95% CI -0.16 to 0.1620. In a New Zeal<strong>and</strong> case-control study, no significant differences in SGA were seen foramounts of daily serves of dairy foods: Time of conception: p value for trend = 0.21 Last month of pregnancy: p value for trend = 0.3821. In a Danish cohort study, there was a decreased rate of SGA <strong>and</strong> an increased rate of LGAwith increasing milk intake e.g.: aOR for SGA for > 0-1 glasses per day compared with no milk: 0.67 95% CI 0.54 to 0.85 aOR for SGA for > 6 glasses per day compared with no milk: 0.51 95% CI 0.39 to 0.65 aOR for LGA for > 0-1 glasses per day compared with no milk: 1.37 95% CI 1.01 to 1.84 aOR for LGA for > 6 glasses per day compared with no milk: 1.59 95% CI 1.16 to 2.16In this study, birthweight (adjusted p value for trend = 0.001), abdominal circumference,placental weight, birth length, <strong>and</strong> head circumference (adjusted for gestational age at birth)were all significantly increased as dairy food intake in pregnancy increased.22. In a UK cohort study, decreased placental weight was associated with low dairy protein intake in late pregnancy(p = 0.02); attributed to dairy protein as no significant association seen with meat protein; No significant association seen between birthweight <strong>and</strong> dairy protein intake in latepregnancy (p = 0.2)23. In a Canadian case-control study, birthweight (but not birth length or head circumference)was associated with maternal milk intake during pregnancy each 250 mL increase in daily milk intake was associated with an increase in birth weight of41.2 g (95% CI 13-75 g)24. A cohort study from Australia found an association between birthweight <strong>and</strong> ponderal index<strong>and</strong> intake of dairy protein during pregnancy: Each isoenergetic 1% increase in dairy protein consumption was associated with a 25 gincrease in birthweight (p = 0.02) an 0.12 kg/m3 increase in ponderal index (p = 0.05)1138childrenIII-3 Mitchell 200450,117 II Olsen 2007538 II Godfrey 1996279 III-3 Mannion 2006557 II Moore 2004Dairy Foods137
25. In a US RCT, adolescent women r<strong>and</strong>omised to four serves of dairy foods a day duringpregnancy gave birth to babies with significantly higher birthweights compared withadolescent women who consumed their usual diet during pregnancyBreastfeeding <strong>and</strong> Maternal Postpartum Followup26. In a US cohort study, <strong>breastfeeding</strong> <strong>and</strong> non-<strong>breastfeeding</strong> women consumed similaramounts of dairy products up to six months postpartum27. In a RCT from Sri Lanka, powdered milk supplementation in postpartum <strong>breastfeeding</strong>women did not affect the contraceptive benefit of lactation <strong>and</strong> lengthened the duration ofnearly full <strong>breastfeeding</strong> (e.g. higher number of total breastfeeds at 48 weeks comparedwith women in the control group, p < 0.05)28. In a Japanese cohort study, there was no significant association seen between postpartumdepression <strong>and</strong> maternal intake of dairy foods during pregnancyChildhood Asthma, Eczema <strong>and</strong> Allergy Symptoms29. In a Scottish cohort study, no significant association was seen between asthma in children at5 years of age <strong>and</strong> maternal dairy food intake30. In one German cohort study of children aged 2 years, there were no significant differences inhigh compared with low maternal consumption of dairy foods in late pregnancy, specifically: Eczema: aOR for milk 1.04 95% CI 0.80 to 1.34 Allergen sensitisation: aOR for milk 0.93 95% CI 0.67 to 1.2831. In a UK RCT, the RR for eczema in first 18 months was 0.73 95% 0.32 to 1.64 in the maternalmilk-free group compared with the control group, in 26 children of atopic mothers32. In a Japanese cohort study, no association was seen between dairy food intake duringpregnancy <strong>and</strong> suspected atopic eczema in infants at 3-4 months of age; p value for trend(adjusted) = 0.1333. In a cohort study from Spain, no significant associations were seen in adjusted analysesbetween dairy food intake during pregnancy <strong>and</strong> persistent wheeze, atopic wheeze <strong>and</strong>atopy in children at 6.5 years34. In a cohort study from Finl<strong>and</strong>, no significant associations were seen between dairy foodintake in pregnancy <strong>and</strong> allergic sensitisation of children by 5 years of age: Food allergens aOR 0.88 95% CI 0.57 to 1.35 Inhalant allergens aOR 0.76 95% CI 0.54 to 1.0635. In a cohort study from the Netherl<strong>and</strong>s, no significant associations were seen between dairyfood intake in pregnancy <strong>and</strong> asthma symptoms in children from 1 to 8 years of age: aOR0.92 95% CI 0.74 to 1.15Dietary guidelines for pregnant <strong>and</strong> <strong>breastfeeding</strong> women: evidence report48 II Chang 2006149 II George 200560 II Tennekoon 1996865 II Miyake 20061212children2,641childrenII Willers 2007II Sausenthaler 200726 children II Lovegrove 1994/1996771 children II Saito 2010482 children II Chatzi 2008931 children II Nwaru 20102832childrenII Willers 2008138
36. In a cohort study from the UK, it was not clear if maternal milk consumption duringpregnancy was associated with infant food hypersensitivity at one or three years of age37. In a crossover RCT from New Zeal<strong>and</strong>, no significant differences in rates of colic were seen inbreastfed infants whether or not their mothers consumed cows milk38. In a crossover RCT from Sweden, 9 out of 16 infants showed signs of colic after their mothershad ingested cows milkChild Growth <strong>and</strong> Development Outcomes39. In a Welsh RCT, no significant differences were seen between women eligible for free milktokens (during pregnancy <strong>and</strong> postnatally) compared with women in a control group forinfant growth at 5 years (weight, height, head circumference <strong>and</strong> skin fold)40. In one Australian cohort study, bone mineral density of children at 8 years was notassociated with maternal dairy food intake during pregnancy: Total body bone mineral density – p = 0.38 for adjusted regression of portions per week41. In an Australian cohort study (follow-up of Jones 2000) bone mass in 16 year-oldadolescents was not associated with maternal dairy food intake during pregnancy: Total body bone mineral density (pns) for adjusted regression of portions per weekOther Childhood Outcomes42. In a Greek case-control study, cerebral palsy in children at 8 years was not associated withmaternal dairy food intake during pregnancy: Regression analysis for each unit of consumption of dairy foods once per day:aOR 1.12 95% CI 0.66 to 1.88 (additionally adjusted for all food groups)43. In a US case-control study, childhood acute lymphoblastic leukemia was not associatedwith maternal dairy food intake during pregnancy: aOR 1.16 95% CI 0.78 to 1.72; mean consumption of dairy products 2.17 [SD 1.33] serves perday44. In a US case-control study (phase 1 reported in Jensen 2004), childhood acute lymphoblasticleukemia was not associated with maternal dairy food intake during pregnancy: aOR 1.06 95% CI 0.83 to 1.35: median consumption 2.1 (25 th 75 th percentiles 1.3, 3.0) servesper day45. In a Greek case-control study, childhood acute lymphoblastic leukemia was not associatedwith maternal dairy food intake: logistic regression: one quintile more of milk/dairy products: aOR 0.82 95% CI 0.66 to 1.0246. In a case-control study from North America: maternal intake of dairy foods in the year before pregnancy was not associated with696 II Venter 200920 infants II Evans 198116 infants II Jakobbson 1983951 children II Elwood 1981173 children II Jones 2000216 children II Yin 2010109 children III-3 Petridou 1998138 cases;138 controls866 (282cases)131 cases;131 controls315 cases;315 controlsIII-3 Jensen 2004III-3 Kwan 2009III-3 Petridou 2005III-3 Bunin 2005Dairy Foods139
childhood brain tumours (medulloblastoma/PNET): aOR 1.1 95% CI 0.6 to 1.9; maternal intake of hard cheese in the year before pregnancy was not associated withchildhood brain tumours (medulloblastoma/PNET): aOR 1.3 95% CI 0.8 to 2.047. In a cohort study from the US, islet autoimmunity in children up to 15 years of age was notassociated with maternal dairy food intake during pregnancy: aHR 1.18 95% CI 0.75 to 1.87Outcomes <strong>For</strong> Child As An Adult48. In a Scottish cohort study, no significant associations were seen between cortisolconcentrations in offspring at 30 years of age <strong>and</strong> maternal consumption of cheese or millkduring pregnancy642 children II Lamb 2008251 II Herrick 2003Dietary guidelines for pregnant <strong>and</strong> <strong>breastfeeding</strong> women: evidence report140
Evidence TablesReference Bunin 2005Food typeDairy foods: dairy foods in total; hard cheeseStudy type Case-control studyLevel of evidence III-3 (aetiology)SettingUnited States <strong>and</strong> CanadaFundingNational Cancer Institute, USAParticipants 315 cases diagnosed with medulloblastoma/PNET tumours from 0 to 5 years, between 1991 to 1997 (without a previous or recurrent cancer)315 controls (r<strong>and</strong>om digit dialling, matched on area code, race <strong>and</strong> data of birth)BaselineSee confounding belowcomparisonsDietaryFFQassessmentTimingTo reflect diet in the year before pregnancy; <strong>and</strong> the second trimester of pregnancyComparison Dairy foods < 2/day to ≥ 4/day: Hard cheese < 1 serve/week ≥ 5 serves/week; data on portion size were not collectedOutcomes Childhood brain tumours (medulloblastoma/primitive neuroectodermal (PNET) tumours)ResultsMedulloblastoma/PNETPericonceptionMidpregnancyN aOR* (95% CI) N aOR* (95% CI)Dairy foods
Reference Campbell-Brown 1983Food typeDairy foods (milk or cheese)Study typeQuasi-RCT (allocation by alternation)Level of evidence III-1 (intervention)SettingAberdeen, Scotl<strong>and</strong>FundingNot reportedParticipants180 primiparous women at high risk of giving birth to a low birthweight baby (because of low maternal height, weight or weight-for-height at 20 weeks, orweight gain between 20 <strong>and</strong> 30 weeks)Baseline comparisons NADietary assessment NATimingIntervention from 29 weeks gestationComparison 0.5 pint of flavoured milk drink or 1 pint fresh milk, or 75 g cheddar cheese (with additional supplement of 300 kcal energy <strong>and</strong> 15-20 g protein) from 29weeks GA v normal (unsupplemented diet)OutcomesPreterm birth, birthweight, birth length, head circumference at birth, gestational weight gainResultsPreterm birth:Milk/cheese + supplement v normal diet: RR 0.88 95% CI 0.33 to 2.34Birthweight:Milk/cheese + supplement v normal diet: mean difference 37 g 95% CI -75.10 to 149.10Birth lengthMilk/cheese + supplement v normal diet: mean difference 0.30 cm 95% CI -0.24 to 0.84Head circumference at birth:Milk/cheese + supplement v normal diet: mean difference 0.20 cm 95% CI -0.18 to 0.58Gestational weight gain:Milk/cheese + supplement v normal diet: mean difference 44.0 g/week 95% CI -8.55 to 96.55FollowupConfoundingRisk of biasRelevanceOther commentsTo birthNAModerate-high risk of bias: inadequate allocation concealmentStudy restricted to women at high risk of low birthweightData extracted from Kramer 2003 (Cochrane <strong>Review</strong>);not a ‘pure’ comparison of dairy since women in the intervention group also received a protein/energy supplementDietary guidelines for pregnant <strong>and</strong> <strong>breastfeeding</strong> women: evidence report142
Reference Chan 2006Food typeDairy foods (milk, yoghurt or cheese)Study typeRCT (control <strong>and</strong> dairy foods arms only)Level of evidence II (intervention)SettingUniversity of Utah, Salt Lake City, Utah, USAFundingNational Dairy Council, USAParticipants48 pregnant adolescent women 15-17 years of age, enrolled before 20 weeks gestationExclusions: women with hypertension, diabetes, renal or liver diseases, <strong>and</strong> those who used alcohol, tobacco or medications that would affect calciummetabolism during the pregnancyBaseline comparisons NADietary assessment NATimingIntervention from 20 weeks gestationComparisonCounselled to consume at least four serves of dairy products (more than 1200 mg Ca) daily (25 women) versus usual diet (23 women)OutcomesBirthweight, birth length, head circumference at birthResultsBirthweight:Dairy foods group: 3517 [SD 273] gUsual diet group: 3277 [SD 165] g; p < 0.001Birth length, head circumference at birth, blood pressure at birthNo significant difference between the two groupsFollowupConfoundingRisk of biasRelevanceOther commentsTo birthNAModerate risk of bias: allocation concealment by sealed envelopes; moderate losses to follow-ipStudy restricted to adolescent womenThree arm RCT – calcium fortified orange juice arm not included hereDairy Foods143
Reference Chang 2003Food typeDairy foodsStudy typeRetrospective cohort studyLevel of evidence III-2 (aetiology)SettingAdolescents who had received prenatal care between 1990 <strong>and</strong> 2000 at an inner-city maternity clinic affiliated with Johns Hopkins Hospital, Baltimore,USAFundingSupported by National Institutes of <strong>Health</strong> grant HD035191Participants350 pregnant African-American adolescents (of a possible 1120 women identified as giving birth during this time frame)Dietary assessment 24-h dietary recall <strong>and</strong> a food-frequency questionnaire collected by a registered dietitianDietary dairy food intake was estimated on the basis of the number of servings of dairy products.The registered dietitian initially rated each adolescent’s calcium intake as “adequate” (4 servings/d), “fair” (2–3 servings/d), or “poor” (0–1 serving/d) onthe basis of the 24-h dietary recall by using the number of dairy products consumed daily. Each serving size of dairy products contributed ~300 mg Ca.The food frequency questionnaire was then administered to determine how representative the recall data were of the adolescents’ usual intake, <strong>and</strong> 2intermediate categories (“fair plus” <strong>and</strong> “poor plus”) were then added if the data from the food-frequency questionnaire were slightly higher than thosedetermined from the 24-h dietary recall. Dairy food intake was classified into 1 of the 5 categories for each adolescent. The high dairy food intake groupwas defined as those adolescents with an “adequate” or “fair plus” intake, the medium dairy food intake group as those with a “fair” intake, <strong>and</strong> the lowdairy food intake group as those with a “poor plus” or “poor” intakeBaseline comparisons See confounding belowTimingComparisonOutcomesResultsDairy intake at entry into prenatal care <strong>and</strong> relationship to femur length assessed at ultrasound between 20 <strong>and</strong> 34 weeksDietary <strong>and</strong> other predictors of fetal femur lengthFetal femur length (between 20 <strong>and</strong> 34 weeks gestation)Summary: Amongst pregnant adolescents, high (≥ 3 servings/d) maternal dairy food intake at entry into prenatal care was associated withsignificantly greater fetal femur length between 20-34 weeks.Generalised multiple linear regression of dairy intake on fetal femur length, adjusting for maternal age, height, BMI, gestational age <strong>and</strong> fetalBPD.β SE 95% CI P valueDairy intakeMedium 0.041 ±0.024 (-0.006, 0.089) 0.089High 0.077 ±0.024 (0.030, 0.125) 0.001Maternal age (y) -0.002 ± 0.009 (-0.020, 0.015) 0.783Maternal height (cm) 0.0044 ±0.0014 (0.0017,0.0072) 0.002Prepregnancy BMI (kg/m2) 0.005 ±0.002 (0.001, 0.009) 0.018Gestational age (wk) 0.141 ±0.011 (0.119, 0.162) 0.001Fetal biparietal diameter (cm) 0.373 ±0.039 (0.297, 0.449) 0.001Women in the high dairy food intake group had significantly higher protein (P = 0.001), vitamin A (P = 0.001), <strong>and</strong> iron (P = 0.002) intakes than did thosein the lower intake groups. Similar trends were also evident for total energy <strong>and</strong> vitamin C intakes, although these results were not significant (P = 0.096<strong>and</strong> 0.061, respectively).When the effect of each nutrient intake on fetal femur length was examined controlling for gestational age, maternal age, maternal height, prepregnancyBMI, <strong>and</strong> fetal biparietal diameter, no significant relations of fetal femur length with intakes of protein, vitamin A, iron, energy, <strong>and</strong> vitamin C wereevident, suggesting a solely dairy food effect.Dietary guidelines for pregnant <strong>and</strong> <strong>breastfeeding</strong> women: evidence report144
FollowupConfoundingRisk of biasRelevanceOther commentsNil (retrospective cohort)Factors considered included: maternal age, height, weight, prepregnancy BMI, birth weight, duration of pregnancy, <strong>and</strong> Apgar score, cesarean delivery,preterm birth <strong>and</strong> intakes of other nutrients, including energy, protein, vitamin A, iron, <strong>and</strong> vitamin C. In final model, figures were adjusted for:gestational age, maternal age, maternal height, prepregnancy BMI, <strong>and</strong> fetal biparietal diameter.Low-moderate risk of bias: possible selection bias - 770 women were excluded for a variety of reasons (ultrasounds not performed in the timeframe,history of smoking <strong>and</strong> other drug use, stillbirth, no dietary data, other missing variables), but there appeared to be no significant differences indemographic, dairy food intake distribution, <strong>and</strong> birth outcomes between this subset <strong>and</strong> the excluded womenThe study group represents a low dairy food intake population, as the majority of women in the study consumed < 2 serves of dairy foods/day. Fetalfemur lengths in this population were similar to that reported in a UK study, suggesting that they are broadly comparable to a white adult populationDairy Foods145
Reference Chatzi 2008Food typeDairy foodsStudy typeProspective cohort studyLevel of evidence II (aetiology)Setting Women presenting antenatal care at general practices in Menorca, a Mediterranean isl<strong>and</strong> in Spain (mid 1997 to mid 1998)FundingInstituto de Salud Carlos III red de Grupos Infancia y Media Ambiente, the Fundacio “La Caixa” , Instituto de Salud Carlos III, red de Centros deInvestigacion en Epidemiologica y Salud Publica, EU, National Center for Environmental <strong>Health</strong>, USA, the GA2LEN project, Ministry of Education <strong>and</strong>Science, Spain, Oficina de Ciencia y Tecnologia, Generalitat Valenciana.Participants482 children of 507 women who had attended antenatal care in MenorcaBaseline comparisons See confounding belowDietary assessment FFQTimingnot clear when women did FFQ <strong>and</strong> period of pregnancy it was intended to coverComparison≤ 23 v > 23 serves of dairy per weekOutcomesPersistent wheeze, atopic wheeze <strong>and</strong> atopy at 6.5 yearsResultsPersistent wheeze at 6.5 yearsLow 18 (14.06%) v high 19 (12.50%); pns (also adjusted for firstborn <strong>and</strong> lower respiratory tract infections at age 1)Atopic wheeze at 6.5 yearsLow 12 (6.90%) v high 8(4.73%); pns (also adjusted for birthweight <strong>and</strong> maternal atopy)Atopy at 6.5 yearsLow 34 (16.83%) v high 36 (17.22%) pns (also adjusted for birthweight <strong>and</strong> maternal atopy)Followup6.5 yearsConfounding Analyses adjusted for gender, maternal <strong>and</strong> paternal asthma, maternal social class <strong>and</strong> education, BMI at age 6.5 years <strong>and</strong> total energy intake at 6.5yearsRisk of biasLow risk of bias: results from 468/482 children (97%) able to be analysed (4 incomplete data <strong>and</strong> 8 implausible values);RelevanceDiets in Menorca may differ from diets of Australian women, particularly urban womenOther commentsDietary guidelines for pregnant <strong>and</strong> <strong>breastfeeding</strong> women: evidence report146
Reference Duvekot 2002Food typeDairy foods (milk intake)Study typeCase controlLevel of evidence III-3 (aetiology)Setting <strong>Pregnant</strong> women with pre-eclampsia <strong>and</strong> matched controls in the Netherl<strong>and</strong>s, 1991-1996FundingNot statedParticipants163 primiparous women with a singleton pregnancy who developed pre-eclampsia <strong>and</strong> primiparous, singleton controls (n=??) matched on maternal age<strong>and</strong> delivery date.Women with multiple pregnancy, chronic hypertension, renal disease <strong>and</strong> other chronic conditions in pregnancy were excluded.Dietary assessment Unclear, states a st<strong>and</strong>ard questionnaire was completed containing questions about milk consumption, use of calcium supplements in pregnancy <strong>and</strong>other health informationBaseline comparisons Cases <strong>and</strong> controls were matched on maternal age <strong>and</strong> date of birth. See also confounding below.TimingRetrospective assessment of milk intake but unclear about which time period in pregnancy milk intake was assessedComparisonMilk intake (units per day) in women who developed pre-eclampsia vs controlsOutcomesDevelopment of pre-eclampsiaResultsSummary: higher milk consumption (≥ 5 units per day, predominantly skim milk) appears to be protective against pre-eclampsia.Mean milk consumption was lower amongst women who developed pre-eclampsia (2.4 +/- 0.1 units per day) compared with controls (3.0 +/- 0.1 unitsper day); p
Reference Elwood 1981Food typeDairy foods (milk)Study typeRCTLevel of evidence II (intervention)Setting Wales (1972)FundingNot reportedParticipants1251 pregnant Welsh women recruited soon after first antenatal visit (data available for 951 children)Baseline comparisons More smokers in control groupDietary assessment Amount of milk consumed (via questionnaire)TimingAntenatal <strong>and</strong> postnatalComparisonFree tokens worth 0.5 pint from mid-pregnancy until child was 5 years of age v no interventionOutcomesGestational age, preterm birth, birthweight, SGA, birth length, head circumference at birth, milk consumption, weight, height, head circumference <strong>and</strong>skin fold of children at 5 years of ageResultsSGA (extracted from Kramer Cochrane review (Kramer 2003)): RR 0.88 95% CI 0.52 to 1.50Preterm birth (extracted from Kramer Cochrane review (Kramer 2003)): RR 0.87 95% CI 0.36 to 2.13Gestational age (weeks): (extracted from Kramer Cochrane review (Kramer 2003)): MD -0.10 95% CI -0.27 to 0.07Birthweight (g): (extracted from Kramer Cochrane review (Kramer 2003)): MD 53.00 95% CI -5.70 to 111.70Birth length (cm) (extracted from Kramer Cochrane review (Kramer 2003)): MD 0.10 95% CI -0.15 to 0.35Birth head circumference (cm) (extracted from Kramer Cochrane review (Kramer 2003)): MD 0.0 95% CI -0.16 to 0.16Children in the milk token group consumed slightly more milk at 4.5 years (about 71 ml per day) than the control groupChildren’s growth at 5 years of age was not significantly different between the intervention <strong>and</strong> control groups (weight, height, head circumference<strong>and</strong> skin fold)FollowupConfoundingRisk of biasRelevanceOther comments5 yearsSee risk of bias belowModerate risk of bias: unclear method of allocation (envelopes); not blinded; 24% loss to followup (with more losses in the control group); no adjustmentfor more smokers in the control groupUse of tokens for milk may not be very feasible in Australia (this study was done in a period when most milk was delivered to the home)Intervention was entitlement to milk rather than milk (only 40% on average of entitlement taken up);Child outcomes after birth result from milk entitlement for both mothers <strong>and</strong> children (i.e. not a pure maternal intervention)Dietary guidelines for pregnant <strong>and</strong> <strong>breastfeeding</strong> women: evidence report148
Nuts 67.3% (33/49) 66.4% (127/191) > 0.05Fruit 68.1% (150/220) 50.0% (10/20) < 0.05Chocolate 80.4% (34/42) 63.6% (126/198) < 0.05(4) Rate of colic versus number of types of foods consumed by mother.Number of “types” of foods consumed by mother0 1 2 3+ Total% Colic 28.6% 60.4% 63.9% 74.7% 240 days*days (2/7days) (29/48) (55/86) (55/86)*There were 20 women <strong>and</strong> 12 days of intervention (240 days total).2 (trend) = 5.75; p < 0.05.FollowupConfoundingRisk of biasRelevanceOther comments12 days duration of interventionNo evidence.Moderate risk of bias. The methods of r<strong>and</strong>omisation <strong>and</strong> r<strong>and</strong>omisation concealment were not reported. The trial was reported as being double-blind.The outcomes were determined based on mother’s diaries of timing <strong>and</strong> duration of colic <strong>and</strong> other symptoms <strong>and</strong> diet, <strong>and</strong> is therefore subject to bias.Two mothers did not provided specimens of breast-milk, <strong>and</strong> it was not reported why they did not.Limited relevance; shows increased rates of colic when chocolate <strong>and</strong> fruit were consumed, <strong>and</strong> a trend towards colic when more food types areconsumed in one day.Dietary guidelines for pregnant <strong>and</strong> <strong>breastfeeding</strong> women: evidence report150
Reference George 2005Food typeDairy foods (milk <strong>and</strong> cheese)Study typeProspective cohort studyLevel of evidence II (aetiology)SettingTexas, USFundingNot reportedParticipants149 Medicaid-qualified women (30% white, 24% African American, 46% Hispanic) – recruited from a larger study on postpartum weight retentionInclusion criteria: 18 years or older; non-Hispanic white, African American or Hispanic ethnicity; birth of a health term infant, fluency <strong>and</strong> literacy inEnglish; absence of pregnancy-related abnormalities <strong>and</strong> disease conditions.Baseline comparisons Significant differences between lactating <strong>and</strong> non-lactating women – higher parity, BMI <strong>and</strong> lower education levels in non-lactating women.Dietary assessment Semiquantitative FFQ to cover pregnancy <strong>and</strong> first six months postpartumTimingFFQ administered at 6 weeks <strong>and</strong> 6 months postpartumComparisonNumber of serves of dairy productsOutcomesBreastfeeding (exclusive or partial at 6 months postpartum)Results Lactating women <strong>and</strong> non-lactating women consumed similar amounts of dairy products in the postpartum period (p > 0.05)Followup6 months postpartumConfoundingNo adjustment for potential confoundingRisk of biasModerate-to-high risk of bias; no attempt to control for confounding despite significant baseline differences between lactating <strong>and</strong> non-lactating women.RelevancePossibly relevant to low-income women in AustraliaOther comments Minimal reporting of resultsDairy Foods151
Reference Giordano 2010Food typeDairy foodsStudy typeCase-control studyLevel of evidence III-3 (aetiology)SettingRome, ItalyFundingNot reportedParticipants80 cases of hypospadias requiring surgical treatment in children aged 0 to 24 months (mean age 57.62 weeks)80 controls: healthy males without any congenital defect, aged 0 to 24 months (mean age 36.52 weeks);Births between September 2005 <strong>and</strong> May 2007Baseline comparisons See confounding belowDietary assessment Interview on ‘typical’ maternal diet habits in relation to the index pregnancy <strong>and</strong> food frequenciesTimingFFQ administered on recruitment for mothers of cases <strong>and</strong> during vaccination visits for mothers of controlsComparisonRare versus frequent consumption of milk <strong>and</strong> dairy productsOutcomesHypospadiasResultsMilk <strong>and</strong> dairyproductsCases Controls OR aORRare 61 (73.3%) 67 (83.8%) 1.00 1.00Frequent 19 (23.8%) 13 (16.3%) 1.61 95% CI 0.73 to 3.52 1.73 95% CI 0.77 to 3.90FollowupConfoundingRisk of biasRelevanceOther commentsn/aAdjusted for mother’s BMI at conception <strong>and</strong> education of the father;Gestational age, birthweight <strong>and</strong> SGA were not included among the covariates in the regression models, as they may share a common aetiology withhypospadiasModerate risk of bias: Participation rate of parents of cases was higher than that of controls (85% versus 70%); very few potential confounders used inadjusted analysesLikely to be reasonably relevant for Australian womenLikely to be underpoweredDietary guidelines for pregnant <strong>and</strong> <strong>breastfeeding</strong> women: evidence report152
Reference Giordano 2008Food typeDairy foods (milk, yoghurt)Study typeCase-control studyLevel of evidence III-3 (aetiology)SettingSicily, ItalyFundingSicilian Congenital Malformation RegistryParticipants90 cases: 43 cases of hypospadias <strong>and</strong> 48 cases of cryptorchidism (both in one infant)202 controls: r<strong>and</strong>omly selected controls born in the same year <strong>and</strong> the same regionBirths between 1998 to 2003Baseline comparisons Low birthweight, low maternal education, mother’s history of gynaecological disease <strong>and</strong> father’s history of urogenital diseases differed significantlybetween cases <strong>and</strong> controlsSee confounding belowDietary assessment Interview on maternal diet <strong>and</strong> food frequenciesTimingFFQComparisonConsumption of dairy products once a week or less/more than once a weekOutcomesHypospadias <strong>and</strong> cryptorchidismResultsMilk <strong>and</strong> yoghurtHypospadiasCases Controls OR≤ 1/week 14 (32.6%) 60 (29.7%) 1.00> 1/week 29 (67.4%) 142 (70.3%) 0.88 95% CI 0.43 to 1.77Cryptorchidism≤ 1/week 13 (27.1%) 60 (29.7%) 1.00> 1/week 35 (72.9%) 142 (70.3%) 1.14 95% CI 0.56 to 2.30Hypospadias <strong>and</strong> cryptorchidism≤ 1/week 26 (28.9%) 60 (29.7%) 1.00> 1/week 64 (71.1%) 142 (70.3%) 1.04 95% CI 0.60 to 1.80FollowupConfoundingRisk of biasRelevanceOther commentsn/aResults for this food group were not presented as adjusted analysesModerate risk of bias: Participation rate of parents <strong>and</strong> data collection rate of cases was lower than that of controls (76% versus 91%); no adjustedresults presented for this food groupLikely to be reasonably relevant for Australian women, although hypospadias rates very high <strong>and</strong> unlikely that most Australian women will have suchhigh pesticide exposureRagusa region in Sicily is a region of intensive agriculture (involving high rates of pesticide <strong>and</strong> other chemical use) with high rates of hypospadias <strong>and</strong>cryptorchidismDairy Foods153
Reference Godfrey 1996Food typeDairy foodsStudy typeProspective cohort studyLevel of evidence II (aetiology)SettingSouthampton, UKFundingDunhill Trust <strong>and</strong> Medical Research CouncilParticipants538 women who gave birth to a singleton term infantBaseline comparisons See confounding belowDietary assessment FFQTimingFFQ administered in early <strong>and</strong> late pregnancy, to reflect diet in the previous three monthsComparison≤ 18.5 v 18.5 to 26.5 v > 26.5 g/day dairy protein; mean daily intake 22.3 g IQR 16.4, 28.9 late pregnancyOutcomesBirthweight, placental weightResultsPlacental weightLow protein intake in late pregnancy associated with decreased placental weight (p = 0.02); attributed to dairy protein as no significantassociation seen with meat protein;Placental weight fell by 1.4 g (95% CI 0.4 g to 2.4 g); p = 0.005 for each g decrease in dairy protein intake in late pregnancyBirthweightNo significant association seen between dairy protein intake in late pregnancy <strong>and</strong> birthweight (p = 0.2)FollowupConfoundingRisk of biasRelevanceOther commentsTo birthAdjusted for baby’s sex <strong>and</strong> gender <strong>and</strong> duration of gestation; <strong>and</strong> nutrient intakesLow risk of bias: of 636 women recruited, 596 (94%) agreed to participate; 39 gave birth before 37 weeks, 3 were not visited in late pregnancy <strong>and</strong>placental weight was not recorded for 16, leaving 538 term pregnancies with complete birth <strong>and</strong> nutrition data (85% of the 636 women recruited)Likely to be relevant for Australian womenDietary guidelines for pregnant <strong>and</strong> <strong>breastfeeding</strong> women: evidence report154
Reference Haggarty 2009Dietary patterns Dairy foods (milk <strong>and</strong> cream; cheese; yoghurt; icecream)Study typeProspective cohort studyLevel of evidence II (aetiology)SettingAberdeen, Scotl<strong>and</strong>FundingUK Food St<strong>and</strong>ards AgencyParticipants1277 sequentially enrolled pregnant women attending Aberdeen Maternity Hospital for ultrasound (a further 184 women were recruited later inpregnancy).Exclusions: diabetic women, women with multiple pregnancies, women who conceived as a result of fertility treatment, or clinical data not availableBaseline comparisons See confounding belowAssessmentFFQTimingAssessed at 19 weeks gestationComparisonIntake of milk <strong>and</strong> cream; cheese; yoghurt; icecream milk <strong>and</strong> cream; cheese; yoghurt; icecream by deciles of deprivationOutcomesDeprivation (assessed using the Scottish Index of Multiple Deprivation);Low birthweight (defined as < 2500 g or lowest decile for birthweight z score adjusted for gestational age, sex <strong>and</strong> parity)Preterm birth (< 37 weeks)Admission to neonatal unitResultsDeprivationMilk <strong>and</strong> cream: significantly higher intake with higher levels of deprivation (p < 0.01)Cheese: significantly lower intake with higher levels of deprivation (p < 0.05)Yoghurt: no significant association with deprivationIcecream: no significant association with deprivationFollowupConfoundingRisk of biasRelevanceOther commentsTo neonatal period(Some?) analyses adjusted for energy intakeLow to moderate risk of bias: low attrition, some lack of detail in reporting of outcomesLikely to be relevant to Australian womenAbout 40-50% of the least deprived women reported taking folic acid supplements compared with about 20% for the most deprived women;Most birth outcome associations were reported by nutrient rather than food group;Not easy to deduce quantities of intake of foods (main graphs reported as change in intake by deprivation decile)Dairy Foods155
Reference Herrick 2003Food groupsDairy foods (cheese, milk)Study typeProspective cohortLevel of evidence II (aetiology)SettingMotherwell, Scotl<strong>and</strong>FundingDunhill Medical Trust, NIHParticipants251 men <strong>and</strong> women whose mothers’ food intakes had been recorded during pregnancy during 1967 to 1968. These women had been advised to eat0.45 kg of red meat a day <strong>and</strong> to avoid carbohydrate-rich foods during pregnancyBaseline comparisons See confounding belowDietary assessment Mothers asked about consumption of 10 foodsTimingEarly pregnancy (≤ 20 weeks); late pregnancy (> 20 weeks)ComparisonCheese (ounces per week); Milk (pints/day)OutcomesCortisol concentrations in offspring aged 30 yearsResultsCortisol (change per unit change in maternal cheese consumption during pregnancy)No significant associationCortisol (change per unit change in maternal milk consumption during pregnancy)No significant association, but trend to lower plasma cortisol with high maternal milk consumption in late pregnancy (p = 0.06)Length of followupConfoundingRisk of biasRelevanceOther comments30 yearsAnalyses adjusted for offspring’s gender, social class at birth, BMI, alcohol consumption, <strong>and</strong> activity levelModerate risk of bias: <strong>For</strong> the 1432 records from 1967-8 recorded liveborn, singleton births with complete names, birth measurements <strong>and</strong> ≥ 1 dietrecord. 965 offspring were alive <strong>and</strong> living locally; <strong>and</strong> after attrition or declining to participate, 251 (17.5%) were available for analysis.Very high intake of meat <strong>and</strong> very low carbohydrate intake limits the relevance to current dietary intakes of Australian womenAuthors state that “in the setting of advice to follow a pregnancy diet high in protein <strong>and</strong> low in carbohydrate, an unbalanced pattern of higher meat/fish<strong>and</strong> lower green vegetable consumption in late pregnancy leads to elevated cortisol concentrations in the offspring"Dietary guidelines for pregnant <strong>and</strong> <strong>breastfeeding</strong> women: evidence report156
Reference Jakobbson 1983Dietary patterns This study was conducted in two stages:Stage 1:a) All mothers (66 in total) - 1 week free of cow’s milkb) “then the mothers reintroduced cow’s milk in their diets” (duration not reported)It was reported that “this challenge was done twice”, although “this challenge” was not defined.Stage 2:Active capsules: 200 mg of cow’s milk whey proteinsPlacebo capsules: 200 mg of potato starchAll 16 women who participated in the challenge received both types of capsules.Capsules were taken on day 1 <strong>and</strong> day 3. Women were “r<strong>and</strong>omised” as to which of these days they received active <strong>and</strong> which they received placebocapsules.On day 6, the 16 mothers were asked to drink ½ to 1 glass of milk, three times daily. The infant’s behaviour during the study (e.g. time <strong>and</strong> duration ofcrying, vomiting, abnormal stools, disturbed sleep) was recorded on a “st<strong>and</strong>ardised protocol”.The mothers maintained a strict cow’s milk free diet during the study.Study type R<strong>and</strong>omised cross-over trialLevel of evidence II (intervention)SettingDepartment of Paediatrics, University of Lund, Malmo General Hospital, Malmo, Sweden.FundingAlbert Pahlson Foundation, Alfred Osterlund Foundation, the Swedish Baby Food Industry Fund for Nutritional Research, <strong>and</strong> the Swedish NutritionFoundation.Participants This study was conducted in two stages:Stage 1: 66 breast-fed infants with infantile colic, but otherwise healthy. The colic was confirmed by a paediatrician.Stage 2: 23 of the infants with relapse of colic after the mothers drank cow’s milk in the first stage.BaselineBaseline characteristics of participants not reported.comparisonsDietaryNAassessmentTiming The “double blind challenge” was done at a mean age of 8.9 weeks in the 16 patients (16/23).Comparison See Dietary patterns sectionOutcomes The infant’s behaviour (e.g. time <strong>and</strong> duration of crying, vomiting, abnormal stools, disturbed sleep) in relation to the mother’s diet was recorded on a“st<strong>and</strong>ardised protocol”. Who recorded this information <strong>and</strong> the exact timing of the reporting was not reported.ResultsStage 1 results:When the colic disappeared on elimination of cow’s milk <strong>and</strong> reappeared on the mother’s milk challenges, the mothers were asked to participate in adouble-blind crossover trial.Dairy FoodsStage 2 results:16 mothers underwent the challenge:-5 infants had no symptoms after either the placebo, whey capsules, or milk drinking challenge.-1 infant had no reaction after intake of either placebo or whey capsules but did react after the milk drinking challenge.-9 infants reacted with colic after their mothers ingested the capsules containing cow’s milk whey protein <strong>and</strong> after the milk drinking challenge but did notreact after placebo capsules.157
Follow-upConfoundingRisk of biasRelevanceOther comments- 1 had colic on placebo capsules, no colic on whey protein capsules, but had cold after milk drinking challenge.UnclearUnclearHigh risk of bias. The method of r<strong>and</strong>omisation was not reported. There were 7 (out of 23 total) post-r<strong>and</strong>omisation drop-out/exclusions (1 due to allergy,4 refused to participate, 2 mothers had inadequate breast milk). Thus, 16 mothers/infants participated in the challenge, except that 6 “had to be taken outof the study”, all due to lack of symptoms of colic.Poor design <strong>and</strong> reporting limits the relvance of the study findings.Dietary guidelines for pregnant <strong>and</strong> <strong>breastfeeding</strong> women: evidence report158
Reference Javaid 2005Food typeDairy foods (milk)Study typeProspective cohort studyLevel of evidence II (aetiology)SettingWomen living in Southampton, United Kingdom who became pregnancy during oct 1999 to January 2002, recruited through GP clinics. These womenwere a subset of the Southampton Women’s Study (n=12,500 women not pregnant at enrolment)FundingMedical Research Council, UKParticipants307 pregnant women assessed pre-pregnancy <strong>and</strong> in early <strong>and</strong> late pregnancyDietary assessment Unclear – women were interviewed in person <strong>and</strong> asked about sociodemographic characteristics, lifestyle, milk intake, previous obstetric history, <strong>and</strong>recalled birthweight. During pregnancy, women were also asked about lifestyle characteristics, smoking habit, alcohol consumption, <strong>and</strong> the level ofphysical activity were obtainedBaseline comparisons See confounding belowTimingDiet <strong>and</strong> lifestyle assessed pre-pregnancy as well as weeks 11 <strong>and</strong> 34 of pregnancy. Maternal bone resorption measured during these times inpregnancyComparisonPredictors of the decline in calcaneal bone measurements in pregnancy, as assessed by ultrasoundOutcomesChange (decline) in maternal bone resorption in pregnancyResultsSummary: pre-pregnancy milk intake of more than 1 pint milk/day was protective against loss of maternal bone mass in pregnancy.During pregnancy, there was a significant (P < 0.001) decline in calcaneal SOS <strong>and</strong> BUA.Maternal milk intake during pregnancy was not associated with change in calcaneal quantitative ultrasound. However, those mothers drinking morethan 1 pint milk/d before pregnancy tended to preserve calcaneal SOS during pregnancy (+0.32 SD, P < 0.01)Multiple linear regression of change in SOS <strong>and</strong> BUA (quantitative ultrasound measures)The changes in both SOS <strong>and</strong> BUA were influenced by season at the time of the early pregnancy visit. Change in calcaneal SOS during pregnancy wasalso independently predicted by parity <strong>and</strong> milk intake (>1 pint/d) before pregnancy. Maternal adiposity (MUAC) also predicted changed in BUA.Determinant β 95% CI p valueChange in SOSParity (per child) 0.1 0.05 to 0.2 0.001Milk intake (>1 pint) 0.3 0.07 to 0.6 0.01Season* (summer) 0.2 -0.01 to 0.4 0.07Change in BUA Season (summer) 0.2 0.05 to 0.5 0.02MUAC (cm) 0.8 0.2 to 1.3 0.007SOS = calcaneal speed of soundBUA = calcaneal broadb<strong>and</strong> ultrasound attenuationMUAC = mid upper arm circumference*season at the time of the early pregnancy visitFollowupConfoundingDairy FoodsPre-pregnancy until birthChange in SOS <strong>and</strong> BUA measurements during pregnancy were found to be associated with changes in heel width; hence, both SOS <strong>and</strong> BUA wereadjusted for mean heel width during early <strong>and</strong> late pregnancy where appropriate. Other confounders considered included: maternal age, parity,159
Risk of biasRelevanceOther commentseducational level, maternal body size (height, weight, adiposity), maternal birthweight, physical activity, maternal occupational status, maternal smoking,<strong>and</strong> maternal use of nutritional supplementsLow-moderate risk of bias: possible ascertainment bias as unclear how information from questionnaire was categorised into milk intake. Also othersources of dietary calcium were not collected, nor was total energy intake30% of women reported consuming less than ¼ pint milk/d either before or during pregnancy, unclear if this is similar to dietary dairy consumption inAustralia. Given the time frame, we could assume that the majority of milk intake in the cohort is skim milk, however this is not explicitly stated by theauthors.As data on other dietary sources of calcium or vitamin D were not collected the authors stated that they are unable to estimate an adequate calciumintake needed to maintain maternal bone mass during pregnancyDietary guidelines for pregnant <strong>and</strong> <strong>breastfeeding</strong> women: evidence report160
Reference Jensen 2004Food typeDairy productsStudy typeCase controlLevel of evidence III-3 (aetiology)SettingCalifornia, USA (part of the Northern California Childhood Leukemia Study)FundingPHSParticipants138 matched cases <strong>and</strong> controls:Cases: Children under 15 years of age, with a parent who spoke English or Spanish, were resident in the study area at the time of diagnosis of acutelymphoblastic leukemia (ALL), with no prior diagnosis of cancerControls: identified from birth certificates matched to the case on date of birth, sex, maternal race, Hispanic ethnicity of mother or father, <strong>and</strong> county ofresidence at birthBaseline comparisons A priori potential confounders were identified as birthweight, <strong>breastfeeding</strong>, maternal age <strong>and</strong> education, parental occupation <strong>and</strong> smoking duringpregnancy – no evidence of confounding was seen for these variables. Also see Confounding below.Dietary assessment FFQTimingDietary intake to reflect the year before the index pregnancy (to indicate dietary status at the start of pregnancy)ComparisonServes of dairy productsOutcomesChildhood acute lymphoblastic leukemiaResultsChildhood acute lymphoblastic leukemiaaOR 1.16 95% CI 0.78 to 1.72; mean consumption of dairy products 2.17 [SD 1.33] serves per dayAnalysis restricted to 66 pairs where mother did not use vitamin supplements:aOR 1.68 95% CI 0.92 to 3.07 (p = 0.09; trend to significance)FollowupConfoundingRisk of biasRelevanceOther commentsn/aAnalyses were adjusted for variables previously shown to be significantly associated with ALL in the overall study – income, prior fetal loss, child’sexposure to other children under age five, <strong>and</strong> maternal exposure to indoor insecticides during pregnancy; along with portion size <strong>and</strong> energyconsumptionLow-moderate risk of bias: Of eligible cases identified from January 1995 to November 1999, 83% consented to participate; 69% of the eligible controlsagreed to participate. Of the 161 matched pairs, seven pairs were excluded as the respondent was not the biological mother, 16 pairs were excludeddue to questionable dietary questionnaire data, leaving 138 matched pairs (86%); some recall bias likelyLikely to be relevant for Australian women, though some diet components may differ e.g. high bean consumptionDairy Foods161
Reference Jones 2000 (see also Yin 2010)Food typeDairy foods (milk)Study typeProspective cohortLevel of evidence II (aetiology)SettingSouthern Tasmania, AustraliaFundingNHMRC, Tasmanian Government, Royal Hobart Hospital Acute Care ProgramParticipants173 mothers; <strong>and</strong> their infants born in 1988 (part of a larger infant health study of babies at high risk of SIDS)Exclusions: multiple pregnanciesBaseline comparisons Mothers with no tertiary education more likely to have been excluded due to missing dataDietary assessment FFQTimingDietary intake during third trimester of pregnancyComparisonLinear regression of density (ml per kJ)OutcomesBone mass (bone mineral density (BMD) <strong>and</strong> bone mineral content*) in 8 year old childrenResultsBMD at 8 years;Total body (g/cm 2 )r 2 0% 0.000 (p = 0.76)adjusted r 2 23% 0.001 (p = 0.38)Femoral neck (g/cm 2 )r 2 2% 0.003 (p = 0.12)adjusted r 2 35% 0.004 (p = 0.03)Lumbar spine (g/cm 2 )r 2 1% 0.002 (p = 0.35)adjusted r 2 32% 0.002 (p = 0.35)Followup8 yearsConfounding Analyses were adjusted for method of dietary assessment, maternal education, parental unemployment, sex, weight at age 8 years, height at age 8years, weekend sunlight exposure in winter at age 8 years, smoking during pregnancy, sports participation, ever breast-fed <strong>and</strong> current calcium intake.Risk of biasModerate-high: 330 (215 males, 115 females) representing a 60% response rate from those available in 1996; 47% of the original 1988 cohort, Thisdropped to 173 (dietary information missing or unreliable for 115 mothers, 32 multiple births, 10 participants had missing data for confounders)representing 52% of participants from 1996 <strong>and</strong> 25% of those in the original cohort.72% of the 173 participants were male. Gender imbalance suggests potential selection bias (due to original selection of infants at high risk of SIDS)RelevanceInfants at high risk of SIDS represent a selected group (more males, preterm births, teenage mothers, smoking during pregnancy)Other comments *Bone mineral content not reported – stated to be similar to bone mineral density resultsDietary guidelines for pregnant <strong>and</strong> <strong>breastfeeding</strong> women: evidence report162
Reference Knox 1972Food typeDairy foods (cheese)Study typeCase control (cases matched to food consumption at population level for a particular period) – numbers not reportedLevel of evidence III-3 (aetiology)SettingBirmingham, UKFundingNot reportedCases Stillbirths <strong>and</strong> infant deaths due to anencephalus between 1961 <strong>and</strong> 1967Baseline comparisons n/aDietary assessment Population surveysTimingEach quarterComparisonMonthly stillbirths <strong>and</strong> infant deaths due to anencephalus matched to quarterly consumption of main food stuffs (in previous five to nine months)OutcomesAnencephalusResultsCheese negatively associated with cases of anencephalus: r = -0.55 after a lag interval of eight monthsIcecream positively associated with cases of anencephalus: r = +0.60 after a lag interval of five months (icecream also included in fats <strong>and</strong> oils)FollowupConfoundingRisk of biasRelevanceOther commentsn/aAnalyses were not adjustedHigh risk of bias: links between population consumption of foods <strong>and</strong> anencephalus very distal <strong>and</strong> no control for potential confoundersLikely to differ from a modern Australian dietFood consumption of total population not likely to reflect food consumption of pregnant women; <strong>and</strong> will not be able to reflect differences between dietsof individual or specific groupsDairy Foods163
Reference Kwan 2009Food typeDairy foods (cheese, milk, yoghurt)Study typeCase controlLevel of evidence III-3 (aetiology)Setting California, USA (part of the Northern California Childhood Leukemia Study – phase 1 <strong>and</strong> 2 (phase 1 reported in Jensen 2004)FundingPHS; Paul O’Gorman Foundation for Children with LeukemiaParticipants866 individuals - 282 matched cases <strong>and</strong> controls (205 pairs <strong>and</strong> 77 trios):Cases: Children under 15 years of age, with a parent who spoke English or Spanish, were resident in the study area at the time of diagnosis of acutelymphoblastic leukemia (ALL), with no prior diagnosis of cancerControls: identified from birth certificates matched to the case on date of birth, sex, maternal race, Hispanic ethnicity of mother or father, <strong>and</strong> county ofresidence at birth (in phase 1 (1995-99) only due to concerns about overmatching on potential environmental exposures linked to leukemia risk)Data collected from August 1995 to November 2002Baseline comparisons A priori potential confounders were identified as birthweight, <strong>breastfeeding</strong>, maternal age <strong>and</strong> education, <strong>and</strong> smoking during pregnancy.Also see Confounding below.Dietary assessment FFQTimingDietary intake to reflect the year before the index pregnancy (to indicate dietary status at the start of pregnancy)ComparisonServes of dairy foodsOutcomesChildhood acute lymphoblastic leukemiaResultsChildhood acute lymphoblastic leukemiaaOR 1.06 95% CI 0.83 to 1.35: median consumption 2.1 (25 th 75 th percentiles 1.3, 3.0) serves of dairy foods per dayFollowupConfoundingRisk of biasRelevanceOther commentsn/aAnalyses were adjusted for total energy intake, household income, indoor insecticide exposure during pregnancy; <strong>and</strong> proportion of foods reported aslarge or extra-large portion sizeAlso adjusted for child’s diet, with little effect seen on resultsLow-moderate risk of bias: Of eligible cases identified from January 1995 to November 2002, 86% consented to participate; 56% of the eligible controlsagreed to participate. 190 participants excluded: leukemia diagnosis was not ALL (n = 127); no dietary data (n = 4); a case or a control respondent wasnot the biological mother (n = 14), questionable dietary questionnaire data (n = 45), leaving 282 matched sets (86%).Likely to be relevant for Australian women, though some diet components may differ e.g. high bean consumptionRegular use of any dietary supplement was not associated with risk of ALL;Authors did not report on meat overall (was grouped with overall protein) or some specific meats such as liverDietary guidelines for pregnant <strong>and</strong> <strong>breastfeeding</strong> women: evidence report164
Reference Lagiou 2006Food typeDairy foodsStudy typeProspective cohort studyLevel of evidence II (aetiology)SettingBoston, USAFundingNIHParticipants 277 pregnant women who were Caucasian, < 40 years old <strong>and</strong> having a parity of no more than two (recruited between March 1994 <strong>and</strong> October 1995).Exclusions: women who had taken any kind of hormonal medication during the index pregnancy, with a prior diagnosis of diabetes mellitus or thyroiddisease, or if the fetus had a known major anomaly.Dietary assessment FFQTimingMailed to women prior to a routine antenatal visit around 27 weeks GA, to reflect women’s dietary intake during the second trimester of pregnancyBaseline comparisons Women in the study likely to be older, better educated, primiparae, lower BMI <strong>and</strong> less likely to smoke than pregnant women in the general USpopulationComparison Frequency of dairy food consumption (mean 102.8 times per month; increment 51.7)OutcomesMaternal sex hormone binding globulin (SHBG), progesterone – women’s blood was taken at 16 <strong>and</strong> 27 completed weeks GA.ResultsMaternal SHBG16 completed weeks GA: -3.1% change 95% CI -6.6 to 0.627 completed weeks GA: -3.3% change 95% CI -6.9 to 0.3Maternal progesterone16 completed weeks GA: -2.9% change 95% CI -6.0 to 0.427 completed weeks GA: -2.2% change 95% CI -5.4 to 1.1FollowupConfoundingRisk of biasRelevanceOther comments27 completed weeks GAAdjusted for age, parity, gender of offspring, smoking <strong>and</strong> GA at blood measurementLow to moderate risk of bias: 277 of 402 (68.9%) eligible women were included – 77 refused to participate, 9 were subsequently excluded because theindex pregnancy was terminated through a spontaneous or induced abortion, 2 were excluded because of twin birth <strong>and</strong> 10 were lost to follow-up afterthe initial meeting.Indirect outcomes for (risk of) breast cancerStudy authors postulate that the associations between breast cancer risk <strong>and</strong> increased birthweight are mediated through endocrine hormonesDairy Foods165
Reference Lamb 2008Dietary patterns Dairy foods: cow’s milk products (cream cheese, other cheese, chowders <strong>and</strong> cream soups, yoghurt, sherbet, sour cream, icecream, cream skim, lowfator whole milk)Study typePart of a longitudinal prospective birth cohort studyLevel of evidence II (aetiology)SettingDenver, Colorado, US (part of the Diabetes Autoimmunity Study in the Young (the DAISY))FundingNational Institutes of <strong>Health</strong>, Diabetes Endocrine Research CenterParticipants642 newborns at increased risk for type 1 diabetes (based on HLA genotype <strong>and</strong> family history), enrolled in the study from 1993 to 2004; 27 casesdefined as testing positive for islet autoantibodies at two consecutive blood draws <strong>and</strong> still positive (diabetic) at last follow-upBaseline comparisons See confounding belowDietary assessment FFQTimingFrom 1997 to 2004, mothers of infants enrolled in DAISY completed FFQ soon after birth, reflecting diet in the last trimester of pregnancy (but couldsubmit FFQ before child reached one year of age)ComparisonMonthly servings of cow’s milk productsOutcomes Islet autoimmunity in children (a precursor of type 1 diabetes) at 9 months, 15 months, 2 years <strong>and</strong> annually thereafter up to the age of 15ResultsIslet autoimmunity:aHR (for one st<strong>and</strong>ard deviation change in reported consumption of cow’s milk products) 1.18 95% CI 0.75 to 1.87 (95.63 mean monthly servings)FollowupUp to 15 yearsConfoundingSize for gestational age, ethnicity, maternal education, household income, exposure to type 1 diabetes or GDM in utero, gender of child, maternal ageat birth, total calories of maternal dietRisk of biasModerate risk of bias: subset of DAISY only (later enrolments); <strong>and</strong> women were not reminded to submit FFQ, leading to possible selection bias; of the661 FFQs returned, 5 were excluded because incomplete, <strong>and</strong> 14 for implausible dietary intakes, leaving 642 FFQs for analysis; child’s diet notcontrolled forRelevanceLikely to be relevant to some Australian women, although women in this study may have been at higher risk of diabetesOther commentsDietary guidelines for pregnant <strong>and</strong> <strong>breastfeeding</strong> women: evidence report166
Reference Latva-Pukkila 2009Dietary patterns Dairy foods: milk, cheeseStudy typeProspective cohort studyLevel of evidence II (aetiology)Setting Turku, Finl<strong>and</strong> (cohort from Piirainen 2006)FundingSocial Insurance Institution of Finl<strong>and</strong>, the Sigrid Juselius Foundation <strong>and</strong> the Academy of Finl<strong>and</strong>Participants256 pregnant womenBaseline comparisons Women with NVP were older <strong>and</strong> tended to be primiparous compared to those withoutDietary assessment 3 day food diariesTimingThree times during pregnancy (mean 14, 24 <strong>and</strong> 34 weeks gestation)ComparisonWith nausea <strong>and</strong> vomiting in pregnancy (NVP) versus no NVP;134 (72%) women reporting experiencing nausea; with 40 (30%) vomiting (9 (4.8%) more than once a day) during the first trimesterOutcomesInfluence of nausea <strong>and</strong> vomiting in pregnancy on dietary intake;Severity of NVP assessed as having no nausea <strong>and</strong> vomiting, only nausea, vomiting once a day or vomiting more than once a day, with the primaryoutcome being presence or absence of nauseaResultsWith NVP (n = 134) Without NVP (n = 53) pMilk products (g), median (IQR) daily 500 (302 to 677) 475 (306 to 787) 0.651Cheese (g), median (IQR) daily 43 (33 to 66) 56 (31 to 87) 0.139FollowupConfoundingRisk of biasRelevanceOther commentsTo 34 weeks gestationNot reported if any of the analyses were adjustedModerate risk of bias: not clear if analyses were adjusted for potential confoundersLikely to be relevant to Australian womenDairy Foods167
Reference Lovegrove 1994, Lovegrove 1996Food typeDairy foods (dairy food restriction)Study typeRCTLevel of evidence IISetting <strong>Pregnant</strong> women attending the antenatal clinic at St Luke’s Hospital, Surrey at 30 weeks with atopy <strong>and</strong> without atopy. Conducted between May 1988<strong>and</strong> Nov 1989FundingCow & Gate, Trowbridge, Wilts’ (support <strong>and</strong> provision of Peptijunior)Participants38 women at 30 weeks gestation identified as atopic or non-atopic according to an allergy <strong>and</strong> environmental questionnaire which had previously beenvalidated. Women were classed as atopic if they had an allergy themselves or their partner had an allergy.Dietary assessmentAtopic women were r<strong>and</strong>omly assigned to the intervention (atopic/restricted diet) or an unrestricted diet, non-atopic women served as an additionalcontrol group who followed an unrestricted dietWomen allocated to the intervention group were instructed to totally avoid all milk <strong>and</strong> dairy products from approximately 36 weeks gestation <strong>and</strong> during<strong>breastfeeding</strong>. As a milk alternative, they were given a hypoallergenic, complete infant formula, (whey hydrolysate) Peptijunior (Cow & Gate) toconsume as required, <strong>and</strong> their infants were offered this if <strong>breastfeeding</strong> was supplemented or stopped. Women were also given a 1000 mg calciumsupplement. Women were given information on recipes, product sources <strong>and</strong> food lists <strong>and</strong> contacted by the investigator to help with compliance.Women were asked to complete a 7 day weighed food inventory to quantify any milk protein inadvertently consumed <strong>and</strong> to record times of noncompliance.Women in the control group were encouraged to follow st<strong>and</strong>ard diets (all women in the control group consumed a minimum of 500 ml cows milk a day).Baseline comparisonsTimingComparisonOutcomesResultsAll women were encouraged to practice exclusive <strong>breastfeeding</strong> for as long as possible, preferable for 6 months. Feeding of solids before 3 months, <strong>and</strong>provision of cows milk at < 6 months were discouragedGroups were similar with regard to maternal age, parity, initial allergy incidence <strong>and</strong> initial period of symptoms.However, 50% of the infants of mothers on the atopic diet (restricted diet) were male, compared with 71% of atopic mothers on an unrestricted diet <strong>and</strong>46% of non-atopic mothersChildren followed up at 6, 12 <strong>and</strong> 18 monthsMaternal milk-free diet versus controlClinically diagnosed atopic eczema in the infants at each time point (clinician blinded to treatment allocation).The mean duration of breast-feeding in the atopic-diet group was slightly longer (12 months), than the other two groups both 9 months, but differencenot statistically significant)Summary: There was a trend towards a beneficial effect of a maternal milk-free diet during late pregnancy <strong>and</strong> lactation on the allergyincidence in at-risk infants (infants of atopic mothers).Women on the atopic diet had a significantly higher (p
difference between total allergy incidence at 18 months, between atopic mothers on the atopic diet compared with atopic mothers on the unrestricteddiet, with a reduced incidence in the atopic diet group (p < 0.04).Allergy incidence at 18 monthsAtopic – unrestricted diet 7/14 (50%)Atopic - restricted diet 4/12 (30%)Non-atopic: 2/13 (15%)The mean duration of breast-feeding in the atopic-diet group was longer (12 (SD 3) months) although not significantly different from the other twogroups (9 (SD 4) months <strong>and</strong> 9 (SD 3) months for the atopic <strong>and</strong> non-atopic groups respectively).The time of introduction of cows’ milk formula, cows’ milk <strong>and</strong> yoghurt was significantly later for the women in atopic diet group compared with the nonatopicgroup (P < 0.05). The introduction of the other foods was not significantly different between the three groups.In women on the atopic diet, serum antibody levels were reduced (β -Lg-IgG <strong>and</strong> α-cas-IgG), significantly for β-Lg-IgG, after a period of 7 weeks dietarycompliance, <strong>and</strong> continued to fall if the mother remained on the restricted diet. In the breast milk samples, the atopic diet prevented theappearance of cows’ milk protein β -LG antigens. However, the atopic diet did not influence the levels of cows’ milk protein specific IgA antibody levelsafter the first 5 days post-partum. The specific antibody levels against β -LG <strong>and</strong> α -cas in the three groups showed a significant variation with time.FollowupConfoundingRisk of biasRelevanceOther commentsThe whey-hydrolysate infant formula, Peptijunior, was used <strong>and</strong> well tolerated by 37% of the women in the intervention group <strong>and</strong> the same proportionof infants. None of the infants who routinely ingested Peptijunior had developed allergies by 18 monthsFrom 30 weeks gestation until 18 months postpartumNo adjustment reportedHigh risk of bias: More males in the atopic control group, which was not accounted for in the analyses. Males may be more likely to have atopy.Also, analyses were not intention to treat, they excluded 3 infants in the atopic diet group who were given cows milk formula postpartum <strong>and</strong> who werediagnosed with allergies.45% participation rate, 6/44 (14%) women dropped out.Atopy figures are different in each publication.Just over a third of participant s in the atopic diet group consumed a milk-free infant formula as an alternative to cows’ milk. Unclear if this would betolerated in Australian women, who might be more likely to consume other dairy-free products i.e. soy or rice milk.Dairy Foods169
Reference Maconochie 2007Food groupsDairy foodsStudy typeCase-control study (postal survey sampled from the electoral roll – National Women’s <strong>Health</strong> Study)Level of evidence III-3 (aetiology)SettingUK general populationFundingNational Lottery Community Fund, Miscarriage AssociationParticipantsCases: 603 women aged 18 to 55 years whose most recent pregnancy had ended in first trimester miscarriage (< 13 weeks gestation);Controls: 6116 women aged 18 to 55 years whose most recent pregnancy had progressed beyond 12 weeksBaselineComparisonsBMI < 18.5 was significantly associated with odds of miscarriageAlso see Confounding belowDietary Assessment questionnaireTimingDiet in the three months prior to conception <strong>and</strong> the first 12 weeks of pregnancyComparisonDaily or most daysOutcomesFirst trimester miscarriageResultsDairy products daily or most daysCases Controls aOR (95% CI) aOR further adjusted for nauseaNo 58 (10%) 5783 (95%) 1.00 1.00Yes 528 (90%) 175 (3%) 0.75 (0.56 to 1.01) 0.67 (0.49 to 0.91)Length of followup n/aConfoundingAdjusted for year of conception, maternal age, previous miscarriage <strong>and</strong> previous live birth; <strong>and</strong> further adjusted for nausea in the first 12 weeks ofpregnancyRisk of bias Low risk of bias: 88% of eligible women responding to stage 1 agreed to participate in the second stage of the study; <strong>and</strong> 71% responded to the stage 2questionnaire. 1071/7790 records (7508 women) were excluded (mostly due to index pregnancy being conceived prior to 1980), leaving 6719 records(86%) available for analysisRelevanceL ikely to be relevant to Australian womenOther comments Women who suffered from nausea in the first 12 weeks of pregnancy were almost 70% less likely to miscarryDietary guidelines for pregnant <strong>and</strong> <strong>breastfeeding</strong> women: evidence report170
Reference Mannion 2006Food typeDairy foodsStudy typeCase-control (aetiology)Level of evidence III-3 (aetiology)Setting Antenatal classes in 3 hospitals in Calgary, Alberta May 1997-June 1999FundingDairy farmers of Canada <strong>and</strong> FRSQ (Fonds de recherché en Sante du Quebec)Participants279 (72 restrictors <strong>and</strong> 207 non-restrictors) healthy pregnant women (singleton pregnancy) who were well educated, mainly non-smoking, within 75% ofrecommended pregravid weight range. Please see note in other comments section.Baseline comparisons See confounding belowDietary Assessment 24 hour recall via telephone with nutritional interviewer repeated 3 or 4 timesNote: said “day-to-day variability removed” to estimate nutritional inadequacies compared with dietary reference intakes - not sure how they did this orwhat it involved (p. 2, last paragraph, second sentence)TimingDuring pregnancy (exact times not given)ComparisonAnalysed data with 2 models; 1=milk intake, 2=nutrient (cups of milk, vitamin D, calcium, riboflavin, protein)1=milk intake: Non-restriction vs restrictions on milk consumption (restriction =≤250 mL per day)2=nutrient: separate analyses for intake of vitamin D, calcium, riboflavin <strong>and</strong> proteinOutcomesInfant birth weight, crown-heel length <strong>and</strong> head circumferenceResultsEvery 250 mL increase in daily milk intake associated with a significant increase in birth weight of 41.2 g (95% CI 13 to 75g).Milk intake not significantly related to infant length or head circumference.Follow-upConfoundingRisk of biasRelevanceOther commentsEvery 1 µg increase in vitamin D intake associated with an increase in infant birth weight of 11 g (95% CI 1.2 to 20.7g).Vitamin D not significantly related to infant length or head circumference.No association with protein, riboflavin or calcium.BirthMaternal education, height, gestational weight gain, body mass index, gestational age at deliverySmoking not included as very few in sample smokedModerate risk of bias (see other comments)Similar to AustraliaSmall sample size. Of 2091 screened 307 (14.7%) indicated they restricted milk consumption <strong>and</strong> only 72 of them agreed to participate (24% agreed toparticipate)Lower use of vitamin/mineral supplements reported by milk restrictors (p 3 in results)More milk restrictors had protein intakes below estimated average requirement (p 3 in results)Restrictors had significantly lower Vitamin D intake (table 2)Note: not sure exactly how many included in actual analysis - reported included 216 non-restrictors, then in table 2 only 207 non-restrictors, then in table3 have a total of 279 participants (so if 72 restrictors still included only 197 non-restrictors) <strong>and</strong> no mention of why others excluded from various stagesof analysisDairy Foods171
Reference Marcoux 1991Food typeDairy foods (calcium intake from dairy <strong>and</strong> from supplements)Study typeCase-controlLevel of evidence III-3Setting Primiparous women who delivered in Quebec City or Montreal, Quebec, Canada, between April 1984 <strong>and</strong> December 1986.FundingNational <strong>Health</strong> <strong>and</strong> Research Development Program of <strong>Health</strong> <strong>and</strong> Welfare Canada <strong>and</strong> the Fonds de la Recherche en Sante du Quebec.Participants928 primiparae in total (mainly Caucasian) including 172 women with preeclampsia, 251 women with gestational hypertension, <strong>and</strong> 505 controls.(all women had no history of high blood pressure before pregnancy <strong>and</strong> no sign of hypertension during the first 20 weeks of pregnancy)Dietary assessment FFQ administered within a few days of birthBaseline comparisons Maternal age did not differ among the three groups. The mean level of education <strong>and</strong> the proportion of smokers were lower among cases than amongcontrols.Cases also had higher baseline blood pressure, a higher BMI <strong>and</strong> reported being less physically active during leisure time than controlsTimingCalcium intake in the first 20 weeks of pregnancyComparisonCalcium intake was categorized into quartiles on the basis of its distribution among controls. Risk of PE <strong>and</strong> gestational hypertension then calculatedaccording to quartile of intakeOutcomesPreeclampsia <strong>and</strong> gestational hypertension according the quartile of intake of dietary calciumResultsSummary: no clear relationship between dietary intake of calcium <strong>and</strong> risk of PE, but a high dietary calcium intake in the first 20 weeks ofpregnancy appears to be associated with a reduced risk of gestational hypertension.Average calcium intake from dairy products among preeclamptics was lower but not statistically different from that among controls (p = 0.22), whereas,for gestational hypertension, the average intake was lower <strong>and</strong> this was statistically significant (p = 0.01).In logistic regression, dietary calcium intake from dairy products showed no consistent relation with preeclampsia (p value for trend not significant,p=0.49). However, for gestational hypertension there was a statistically significant decrease in adjusted odds ratios as dietary calcium intake increased(test for trend, p = 0.02) (see table below).In all groups, women who took supplements commenced them on average at 11 weeks gestation. No statistically significant different in the odds of PEor gestational hypertension between those who took calcium supplements <strong>and</strong> those who didn’t.Table 2. Odds ratios for preeclampsia <strong>and</strong> gestational hypertension according to quartile* of average dailycalcium intake from dairy products <strong>and</strong> supplements in the first 20 weeks of pregnancy, Quebec, Canada,1984-1986PreeclampsiaGestational hypertensionNo. Oddsratio95% confidenceintervalNo. Oddsratio95% confidenceintervalCalcium intake from dairy products (mg/day)†Quartile 1 (lowest)ŧ 42 1.00 82 1.00 126Quartile 2 55 1.34 (0.83-2.17) 65 0.81 (0.53-1.23) 126Quartile 3 40 100 (0.60-1.67) 54 0.66 (0.42-1.03) 127Quartile 4 (highest) 35 0.89 (0.53-1.52) 50 0.60 0.38-0.95) 126Chi-trend 0.70 2.42p value 0.49 0.02No. ofcontrolsDietary guidelines for pregnant <strong>and</strong> <strong>breastfeeding</strong> women: evidence report172
Calcium supplementationNo ŧ 77 1.00 104 1.00 194Yes 95 0.77 (0.54-1.09) 147 0.88 (0.65-1.20) 311* Limits of quartiles 1 – 4 (mg/day) are: >1,089, 1,089-1,576, 1,577-1,958, <strong>and</strong> > 1,958.† odds ratios are adjusted by polychotomous logistic regression for body mass index <strong>and</strong> energy expenditurein leisure-time physical activityŧ Reference categoryCalcium provided by supplementation accounted only for a small proportion of the average total calcium ingested daily in the first 20 weeks ofpregnancy. The odds ratios according to total calcium intake were very similar to those estimated for dietary calcium only.Total calcium intake (diet <strong>and</strong> supplements)Adjusted ORs for preeclampsiaQuartile 1: 1.00Quartile 2: 1.36 (95% CI 0.84-2.20)Quartile 3: 1.07 (95% CI 0.64-1.77)Quartile 4: 0.85 (95% CI 0.49-1.46)FollowupConfoundingRisk of biasRelevanceOther commentsAdjusted ORs for gestational hypertensionQuartile 1: 1.00Quartile 2: 0.83 (95% CI 0.54-1.26)Quartile 3: 0.67 (95% CI 0.43-1.05)Quartile 4: 0.57 (95% CI 0.36-0.90)NilORs adjusted for body mass index <strong>and</strong> energy expenditure in leisure-time physical activity. The models also considered the impact of age, educationlevel, number of cigarettes smoked daily at the onset of pregnancy, <strong>and</strong> maximal diastolic blood pressure in the first 20 weeks of pregnancy (howeveradjustment for these did not change the results)Low-moderate risk of bias: adjustment for energy intake was not possible however they adjusted for two factors (BMI <strong>and</strong> physical activity) known to beassociated with energy intake; 96% response rate (controls <strong>and</strong> cases)Undertaken in a population with a high dietary calcium intake, which may be similar to Australia [Average dietary calcium intake in this study (1575 mg)was higher than the Canadian RDA for pregnant women].Due to the time frame it was conducted in, the majority of intake from dairy in this study was likely to be from skim milk, which would be similar toAustralia.Dairy Foods173
Reference Mitchell 2004Dietary patterns Dairy foods (milk, cheese <strong>and</strong> yoghurt)Study typeCase-control studyLevel of evidence III-3 (aetiology)SettingWaitemata <strong>Health</strong> or Auckl<strong>and</strong> <strong>Health</strong>care regions, New Zeal<strong>and</strong>Funding<strong>Health</strong> Research Council of New Zeal<strong>and</strong>, Foundation for the Newborn, Child <strong>Health</strong> Research FoundationParticipants Mothers of 1138 children born between October 1995 <strong>and</strong> November 1997 (844 born SGA <strong>and</strong> 870 born appropriate for GA); only term infants (> 37weeks);Exclusions: preterm births (< 37 weeks), multiple births <strong>and</strong> those with congenital anomaliesBaseline comparisons See confounding belowDietary assessment FFQTimingFFQ administered after birth (to cover the periconception period <strong>and</strong> the last month of pregnancy)Comparison0-1.25 v > 1.25-2.0 v > 2.0-3.0 v > 3.0-4.0 v > 4 serves of dairy per dayOutcomesSGA (≤ 10 th centile for GA <strong>and</strong> gender)ResultsSGA (Dairy consumption at time of conception)SGA AGA aOR (95% CI) p value for trend0-1.25 108/533 (20.3%) 92/597 (15.4%) 1.13 (0.75 to 1.72)> 1.25-2.0 115/533 (21.6%) 121/597 (20.3%) 1.09 (0.73 to 1.62)> 2.0-3.0 114/533 (21.4%) 152/597 (25.5%) 0.81 (0.55 to 1.19)> 3.0-4.0 70/533 (13.1%) 103/597 (17.3%) 0.74 (0.48 to 1.14)> 4 117/533 (22.0%) 125/597 (20.9%) 1 0.21SGA (Dairy consumption in last month of pregnancy)SGA AGA aOR (95% CI) p value for trend0-1.25 77/536 (14.4%) 64/596 (10.7%) 1.21 (0.78 to 1.87)> 1.25-2.0 81/536 (15.1%) 85/596 (14.3%) 1.08 (0.72 to 1.63)> 2.0-3.0 130/536 (24.3%) 144/596 (22.7%) 0.98 (0.69 to 1.40)> 3.0-4.0 158/536 (29.5%) 124/596 (20.8%) 0.76 (0.52 to 1.19)> 4 102/536 (19.0%) 175/596 (29.3%) 1 0.38FollowupConfoundingRisk of biasRelevanceOther commentsNAAdjusted for socio-economic status, ethnicity, maternal height, maternal weight before pregnancy, maternal hypertension <strong>and</strong> maternal smoking; butfolate supplementation was not controlled for (periconception folate was significantly associated with reduced SGA risk).Low-moderate risk of bias: Of the 2182 eligible infants, parents of 1714 (78.6%) completed the FFQ; 1138 (67%) of women completed the FFQ; missingitems in completed FFQ treated as woman not consuming any dairy.Likely to be relevant to Australian womenOnly term infants includedDietary guidelines for pregnant <strong>and</strong> <strong>breastfeeding</strong> women: evidence report174
Reference Miyake 2006Food groupsDairy foodsStudy typeProspective cohortLevel of evidence II (aetiology)SettingWomen who became pregnant in November 2001-March 2003 Neyagawa City, Osaka Prefecture <strong>and</strong> several surrounding municipalities (OsakaMaternal <strong>and</strong> Child <strong>Health</strong> Study, Japan)FundingGrant-in-Aid for Scientific Research (Government grant)Participants865 pregnant Japanese womenBaseline comparisons See Confounding belowDietary Assessment Dietary history questionnaire-self administeredTimingDiet survey for previous month at baseline (period of baseline not stated), EPDS at 2-9 months post partumComparisonDaily intake of dairy foodsNote: other dietary intakes analysed: meat, fish, eggs, total fat, saturated fatty acids, cholesterol, LA, ALA <strong>and</strong> AAOutcomes Postpartum depression (EPDS with postpartum depression when score ≥ 9)ResultsNo significant association between dairy food intake <strong>and</strong> postpartum depression on adjusted analysisLength of follow upConfoundingRisk of biasRelevanceOther comments2-9 months postpartumAge, gestation, parity, smoking, family structure, occupation, family income, education, changes in diet in previous month, season when baseline datacollected, BMI, time of delivery, medical problems in pregnancy, baby’s sex, baby’s birthweightLow risk of bias: data for 865/1002 (86.5%) women available for analysisAustralian diets very different to Japanese - much less seafood intake in Australia <strong>and</strong> more white fish rather than fatty fishOriginally 1002 women enrolled only 865 completed (note: depressed persons less likely to participate), low rate of enrolment into study (17.2% of thoseeligible in Neyagawa)Dairy Foods175
Reference Moore 2004Food groupsDairy foodsStudy typeProspective cohortLevel of evidence II (aetiology)SettingAdelaide, South AustraliaFundingFaculty of <strong>Health</strong> Sciences, The University of Adelaide; Channel 7 Children’s Research Foundation of South Australia, Dairy Research <strong>and</strong>Development CorporationParticipants557 pregnant women aged 18 to 41 years; Caucasian, in the first 16 weeks of a singleton pregnancy (without treatment for infertility), not diabetic, fluentin English; giving birth between October 1998 <strong>and</strong> April 2000Baseline comparisons See Confounding belowDietary Assessment FFQTimingComparisonOutcomesResultsLength of follow upConfoundingRisk of biasRelevanceOther commentsWomen were interviewed before 16 weeks gestation <strong>and</strong> between 30 <strong>and</strong> 34 weeksAmount of dairy protein consumedBirthweight, ponderal indexEach isoenergetic 1% increase in dairy protein consumption was associated with a 25 g increase in birthweight (p = 0.02) an 0.12 kg/m3increase in ponderal index (p = 0.05)To birthMaternal height, prepregnancy weight, primiparity, alcohol consumption <strong>and</strong> use of marijuana or cocaine, energy intakeLow risk of bias: 65% of women invited agreed to participate (women declining were slightly younger); 557 of these 605 (92%) women completed thestudy (most common reason for withdrawal was miscarriage or termination of pregnancy); sensitivity analysis showed similar results for complete <strong>and</strong>incomplete data;Study conducted in AustraliaDietary guidelines for pregnant <strong>and</strong> <strong>breastfeeding</strong> women: evidence report176
Reference Nwaru 2010Food typeDairy foods (milks, cheese, yoghurt, sour milk, curd, creams <strong>and</strong> icecreams)Study typeProspective cohort studyLevel of evidence II (aetiology)SettingTampere, Finl<strong>and</strong>FundingAcademy of Finl<strong>and</strong>, Finnish Pediatric Research Foundation, the Juho Vainio Foundation, the Yrjo Jahnsson Foundation, Turku, Oulu <strong>and</strong> TampereUniversity Hospitals, JDRF, Novo Nordisk Foundation, EU Biomed 2 ProgramParticipants931 mother-infant pairs (children with human leukocyte antigen-conferred susceptibility to type 1 diabetes) participating in the Finnish type 1 DiabetesPrediction <strong>and</strong> Prevention (DIPP) Nutrition Study between September 1996 <strong>and</strong> October 1997Baseline comparisons See confounding belowDietary assessment FFQTimingFFQ given to women after birth, for return at the three month visit (FFQ intended to cover maternal diet during pregnancy <strong>and</strong> lactation)ComparisonAmount of dairy intakeOutcomesAllergic sensitisation in offspring by 5 years: food allergens (egg, cow’s milk, fish, wheat); inhalant allergens (house dust mite, cat, timothy grass, birch)ResultsTotal milk <strong>and</strong> milk productsFood allergensInhalant allergensOR 0.81 95% CI 0.56 to 1.19 OR 0.76 95% CI 0.54 to 1.06aOR 0.88 95% CI 0.57 to 1.35 aOR 0.76 95% CI 0.54 to 1.06- MilkFood allergensInhalant allergensOR 0.92 95% CI 0.75 to 1.14 OR 0.87 95% CI 0.73 to 1.04aOR 0.95 95% CI 0.76 to 1.20 aOR 0.91 95% CI 0.75 to 1.12- Fermented milk products (yoghurt, sour milk <strong>and</strong> curd)Food allergensInhalant allergensOR 0.97 95% CI 0.83 to 1.15 OR 1.10 95% CI 0.94 to 1.28aOR 1.00 95% CI 0.83 to 1.21 aOR 1.04 95% CI 0.88 to 1.23- CheeseFood allergensInhalant allergensOR 0.96 95% CI 0.78 to 1.18 OR 1.09 95% CI 0.91 to 1.31aOR 0.96 95% CI 0.77 to 1.19 aOR 1.05 95% CI 0.86 to 1.29FollowupConfoundingRisk of biasRelevanceOther commentsTo 5 yearsAdjusted for energy intake, place of birth, season of birth, sex of the child, number of siblings, gestational age at birth, parental asthma, parental allergicrhinitis, maternal age at birth, maternal smoking during pregnancy, maternal educationLow risk of bias: data available for 931/1175 (79.2%) children recruited – 108 did not participate in survey, a further 49 did not have IgE measurements,a further 87 had no FFQ or an incomplete FFQLikely to be relevant to Australian women28% of women took vitamin D supplements, 73% took iron supplements;HLA genotype not likely to have any impact on the development of allergic diseases.Dairy Foods177
Reference Oken 2007Food typeDairy foods (milk)Study typeProspective cohort studyLevel of evidence II (aetiology)SettingObstetric offices in Massachusetts, USAFundingNIH, Robert H. Ebert Fellowship, March of Dimes Birth Defects Foundation,Participants 1718 women in Project Viva recruited from 1999 to 2002Baseline comparisons Study participants more likely to be white, <strong>and</strong> to be college graduates than non-participantsSee confounding belowDietary assessment FFQTimingFFQ at study enrolment (median 10.4 weeks gestation) to cover diet since last menstrual periodComparisonNumber of serves of milk/dayOutcomesPre-eclampsia, gestational hypertensionResultsPre-eclampsiaaOR 1.25 95% CI 1.00 to 1.57(1.3 [SD 1.4] serves of milk/day for women with pre-eclampsia v 1.2 [1.0] for women with normal blood pressure)Gestational hypertensionaOR 0.93 95% CI 0.76 to 1.12(1.1 [SD 1.0] serves of milk/day for women with gestational hypertension v 1.2 [1.0] for women with normal blood pressure)FollowupTo birthConfoundingEnergy adjusted <strong>and</strong> also adjusted for maternal age, prepregnancy BMI, first trimester systolic blood pressure, ethnicity, education, parityRisk of bias Low risk of bias: Of the 2128 live births, 410 were excluded (45 women with unavailable medical records, 339 incomplete dietary questionnaire, 24women with pre-existing chronic hypertension who did not develop pre-eclampsia, 2 women with missing covariate information) leaving 1718participants (81%) available for analysisRelevanceLikely to be relevant to Australian womenOther comments 92% of women took supplements (multivitamins) in the first trimester of pregnancy;Mean calcium intake in the study population was high (> 900 mg/day) <strong>and</strong> intakes of vitamins D, E, C <strong>and</strong> folate were also relatively highDietary guidelines for pregnant <strong>and</strong> <strong>breastfeeding</strong> women: evidence report178
Reference Olafsdottir 2006Dietary patterns Dairy foods: drinking more milk in late pregnancyStudy typeProspective cohort studyLevel of evidence II (aetiology)SettingIcel<strong>and</strong>FundingIcel<strong>and</strong>ic Research Council, University of Icel<strong>and</strong> Research FundParticipants495 r<strong>and</strong>omly selected healthy pregnant women attending a routine first antenatal visitBaseline comparisons See confounding belowDietary assessment FFQTimingAt 11-15 weeks gestation; <strong>and</strong> 34-37 weeks gestation (to reflect food intake for the last 3 months)ComparisonDrinking more milk versus not drinking more milk than usual (in early pregnancy)OutcomesGestational weight gain (optimal weight gain defined as 12.1 to 18.0 kg for women with normal pre-pregnancy weight; <strong>and</strong> 7.1 to 12.0 kg for overweightwomen)Results20% of the 301 women with BMI < 25 at first visit had excessive gestational weight gain;55% of the 194 women with BMI ≥ 25 at first visit had excessive gestational weight gainDrinking more milk in early pregnancyAt least optimal weight gain: aOR 3.10 95% 1.57 to 6.13Excessive weight gain: aOR 1.82 95% CI 1.08 to 3.06Women who consumed more milk had an intake of about 700 g/day (compared with 500 g/day for other women); women with excessive gestationalweight gain drank about 200 g/day more (compared with only 100 g/day for other women who increased their milk intake)FollowupConfoundingRisk of biasRelevanceOther commentsTo birthAdjusted for maternal age, gestational length <strong>and</strong> smokingLow to moderate risk of bias: of the 549 women enrolled, 495 (90%) completed the study; 54 women were excluded (17 miscarriage/stillbirths, 5 sets oftwins or triplets, 17 preterm births, 15 missing data); 89 women did not complete FFQ at the second timepoint <strong>and</strong> so only 406 women could beincluded for measures relating to late pregnancy; limited number of confounders used in adjusted analysesLikely to be reasonably relevant to Australian womenDairy Foods179
Reference Olsen 2007Food typeDairy foods (milk intake)Study typeProspective cohortLevel of evidence II (aetiology)Setting Women participating in the Danish National Birth Cohort, 1996-2002FundingThe March of Dimes Birth Defects Foundation, Danish National Research Foundation, Pharmacy Foundation, Egmont Foundation, AugustinusFoundation, the <strong>Health</strong> Foundation, the European Union (QLK1-2000-00083), The Danish Medical Research Foundation, <strong>and</strong> the Heart FoundationParticipants50,117 mother-infant pairs (singleton <strong>and</strong> term births only). [Original cohort was 70187, women with abnormally low or high energy intakes were alsoexcluded]Dietary assessment FFQ: milk consumption was recorded in 8 questions in the FFQ; 2 of these referred to consumption of yoghurt, in portions per day (including thepercentage of fat) <strong>and</strong> 6 to the consumption of milk (whole milk, 1.5% milk, 0.5% milk, skim milk, churn buttermilk, <strong>and</strong> chocolate milk), in glasses/d.Milk <strong>and</strong> yogurt variables were aggregated to obtain frequency measures; according to a Nordic st<strong>and</strong>ard, one glass of milk estimated to be 200 mL <strong>and</strong>one portion of yoghurt to be 150 mL.Baseline comparisons See confounding belowTimingMid pregnancy (~25 weeks) dietary assessment, referring to intake in the previous 4 weeksComparisonAmount of milk intakeOutcomesBirthweight, birth length, head circumference, abdominal circumference, <strong>and</strong> placental weightResultsSummary: increasing maternal milk intake during mid-pregnancy was associated with a reduced risk of SGA, an increased risk of LGA, <strong>and</strong>an increased mean birth weight, abdominal circumference, placental weight, birth length, <strong>and</strong> head circumference adjusted for gestationalage at birth.Gestational weight gain was significantly associated with increased milk consumptionBirthweightIncreasing birthweight increment was seen with increasing intake of milk (adjusted p value for trend 5 glasses compared with no milk (see table 2 below).Birthweight showed no association with fat from dairy products, but was associated with protein from dairy. Birthweight was consistent across quintilesof non-dairy protein, suggesting the association between BW <strong>and</strong> dairy protein is unlikely to reflect a general protein effect.Table 2Unadjusted <strong>and</strong> adjusted differences in mean birth weight increment according to frequency of milk consumption in the Danish National BirthCohort (n = 50 117) 1Milk intake (glasses/d)Difference in birthweight, unadjusted 95% CI p 2 Difference in birthweight, adjusted 3 95% CI p 2gg0 (n=709) Referent – – Referent – –>0-1 (n=6503) 44.8 (7.0, 82.6) 0.020 48.2 (15.5, 80.9) 0.004>1-2 (n=7943) 66.2 (28.8, 103.7) 0.001 57.2 (24.7,89.6) 0.001>2-3 (n=12721) 79.0 (42.1, 115.8)
P for trend 4 6 glasses of milk/d had a59% (95% CI: 16%, 116%) higher odds of having an LGA infantTable 3Unadjusted <strong>and</strong> adjusted odds ratio for the risk of small-for-gestational (SGA) birth according tofrequency of milk intake in the Danish National Birth Cohort (n= 50 117) 1Dairy FoodsUnadjusted odds ratios(95% CI)Adjusted odds ratios(95% CI) 2Milk intake (glasses/d) No. of casesn (%)SGA 10 th percentile0(n=709) 104 (14.7) 1.00 1.00>0-1 (n=6503) 700 (10.7) 0.70 (0.56; 0.88) 0.67 (0.54; 0.85)>1-2 (n=7944) 766 (9.6) 0.62 (0.50; 0.77) 0.62 (0.49; 0.78)>2-3 (n=12721) 1204 (9.5) 0.61 (0.49; 0.76) 0.62 (0.49; 0.77)>3-4 (n=9181) 832 (9.1) 0.58 (0.47; 0.72) 0.59 (0.47; 0.74)>4-5 (n=5551) 469 (8.5) 0.54 (0.43; 0.68) 0.53 (0.42; 0.67)>5-6 (n=3789) 313 (8.3) 0.52 (0.41; 0.67) 0.51 (0.40; 0.65)>6 (n=3721) 324 (8.7) 0.56 (0.44; 0.70) 0.51 (0.39; 0.65)P for trend 3 1-2 (n=7944) 670 (8.4) 1.14 (0.85; 1.52) 1.24 (0.92; 1.68)>2-3 (n=12721) 1234 (9.7) 1.33 (1.00; 1.77) 1.42 (1.06; 1.91)>3-4 (n=9181) 939 (10.2) 1.41 (1.06; 1.88) 1.54 (1.15; 2.07)>4-5 (n=5551) 573 (10.3) 1.42 (1.06; 1.91) 1.54 (1.14; 2.08)>5-6 (n=3789) 390 (10.3) 1.42 (1.05; 1.91) 1.4 (1.13; 2.10)>6 (n=3721) 392 (10.5) 1.46 (1.08; 1.96) 1.59 (1.16; 2.16)P for trend 3
2 Adjusted for mother’s parity, age, height, prepregnant BMI, gestational weight gain, smoking status, <strong>and</strong>total energy intake; Father’s height; <strong>and</strong> family’s socioeconomic status.3 Chi-square test for regression coefficient (continuous variable).Other anthropometric measuresMean abdominal circumference, placental weight, head circumference, <strong>and</strong> birth length all showed increases across the whole range of milk intake (Pfor trend 0 to 1 (0.5) > 1 to 2 (1.4) >2 to 3 (2.7) >3 to 4 (3.4) > 4 to 5 (4.7) > 5 to 6 (5.4) > 6 (7.2)N 709 6503 7943 12721 9181 5550 3789 3721GWG (g/week) 431 [263] 455 [231] 467 [222] 463 [291] 473 [218] 480 [225] 476 [232] 484 [235] p
Reference Petridou 2005Food typeMilk <strong>and</strong> dairy productsStudy typeCase-control studyLevel of evidence III-3SettingGreeceFundingThe Childhood Hematology-Oncology Group: Athens University Medical School, Aristotle University of Thessaloniki, University Hospital of HeraklionParticipants Cases: 131 children with acute lymphoblastic leukemia, aged 12 to 59 months, gender <strong>and</strong> age matched toControls: 131 children hospitalised for minor conditions between 1999 <strong>and</strong> 2003Baseline comparisons See confounding belowDietary assessment FFQTimingDuring index pregnancyComparisonQuintiles of milk/dairy products – median Q1; 39 g/day: median Q5 127 g/dayOutcomesAcute lymphoblastic leukemia (ALL)ResultsMedian g/day Cases Controls p for trendQ1: 39 31 21Q2: 60 24 27Q3: 76 25 25Q4: 93 20 35Q5: 127 31 23 0.49Logistic regression: one quintile more of milk/dairy products: aOR 0.82 95% CI 0.66 to 1.02FollowupConfoundingRisk of biasRelevanceOther commentsNAAdjusted for: total energy intake (but not mutually among food groups); matching variables; maternal age at birth; birthweight; maternal smoking duringpregnancy; maternal years of schooling, maternal occupationModerate: moderate risk of recall bias for women being able to accurately remember their dietary intake during a pregnancy some time previously;Cases: 171 children with ALL were identified; 21 had missing data, consent was not given in 9 cases <strong>and</strong> 10 were unable to be matched, leaving 131(77%) of cases availableDiets of Greek women may differ from current diets of Australian womenDairy Foods183
ReferenceFood typeStudy typeLevel of evidenceSettingFundingParticipantsBaseline comparisonsDietary assessmentTimingComparisonOutcomesResultsFollowupConfoundingRisk of biasRelevanceOther commentsPetridou 1998aDairy foods: feta cheese, kaseri cheese, other cheese, whole milk, skimmed milk, full-fat yoghurt, reduced-fat yoghurt, milk pudding, rice milk pudding,ice-cream, cheese pie (0.5), pizza (0.5).Case-control studyIII-3Greater Athens area, GreeceGreek Ministry of <strong>Health</strong> <strong>and</strong> Welfare, <strong>and</strong> Foundation for Research in Childhood ‘S. Doxiadis’Cases: 109 children with cerebral palsy (CP), born between 1984 <strong>and</strong> 1988 (estimated to be two-thirds of the children with CP born during this period)Controls (1): 155 neighbouring children of similar sex <strong>and</strong> age (± 12 months)Controls (2): 99 healthy siblings of similar sex <strong>and</strong> age (± 12 months) of the first neurological patient seen by the attending physician after a visit by theCP patientSee confounding belowFFQDuring pregnancy≤ 1 versus 2 versus > 2 serves of dairy foods per day;regression analysis: risk of cerebral palsy with change in consumption by one unit ( = consumption of dairy once per day)Cerebral palsy≤ 1 serve of dairy foods per day: 8/91 (8.8%) cases v 13/246 (5.3%) controls2 serves of dairy foods per day: 25/91 (27.5%) cases v 68/246 (27.6%) controls> 2 serves of dairy foods per day: 58/91 (63.7%) cases v 165/246 (67.1%)Regression analysis for each unit of consumption of dairy foods once per week:aOR 1.12 95% CI 0.75 to 1.69aOR 1.12 95% CI 0.66 to 1.88 (additionally adjusted for all food groups)8 yearsAge <strong>and</strong> sex of child, maternal age at birth, maternal age at menarche, maternal chronic disease, previous spontaneous abortions, persistent vomitingduring index pregnancy, multiple pregnancy, number of obstetric visits; timing of membrane rupture in index birth, use of general anaesthesia in theindex birth, mode of birth, abnormal placenta, infant head circumference at birth, congenital malformation, place of index birth, use of supplementaryiron during index pregnancy, physical exercise during index pregnancy, painless childbirth classes.The following were not included in the model:- Smoking or consumption of coffee or alcohol during pregnancy (stated to be “unrelated to CP <strong>and</strong> had no confounding influence”);- Gestational age, birthweight <strong>and</strong> maternal weight gain (stated to be “strong predictors of CP, but were not included in the model, since they areprobably intermediate stages in a possible link between diet <strong>and</strong> CP (mediators) rather than genuine confounders”Moderate-high: High risk of recall bias for women being able to accurately remember their dietary intake during a pregnancy 8 years previously;Cases: 109 children with CP were identified; for 6 children either collaboration with their guardian or a diagnosis of CP was not confirmed; <strong>and</strong> reliablematernal dietary intakes were not available for 12 women, leaving 91 cases available for analysis.Controls: 278 mother-child pairs were approached; 16 refused to participate; matching controls were not available in 8 instances, <strong>and</strong> reliable maternaldietary intakes were not available for 8 women, leaving 246 controls available for analysis.Diets of Greek women in 1998 may differ from current diets of Australian womenDietary guidelines for pregnant <strong>and</strong> <strong>breastfeeding</strong> women: evidence report184
Reference Richardson 1995Food typeMilk intake (<strong>and</strong> milk + supplements)Study typeProspective cohort studyLevel of evidence II (aetiology)Setting <strong>Pregnant</strong> women in the Child <strong>Health</strong> <strong>and</strong> Development Study population, California, Berkeley, 1959-1966FundingCollege of Veterinary Medicine, Texas A&M University, College Station, TXParticipants9,291 pregnant women (7,104 white women <strong>and</strong> 2,187 black women) (original cohort was 12,606) who met the following criteria: delivered a single live or stillborn infant at a gestational age of > 140 days not diagnosed with pre-existing hypertension had provided information on milk intake <strong>and</strong> the presence or absence of preeclampsia in the immediately preceding pregnancy had completed an in-depth interview about health history <strong>and</strong> sociodemographic informationDietary assessmentBaseline comparisonsTimingComparisonOutcomesResultsUnclear – most likely a FFQ, states info was obtained from a ‘detailed questionnaire’.See confoundingUnclear of timing of detailed interview, but looks like it was spread across each trimester (i.e. some women interview in first, some in second <strong>and</strong> somein third trimester).Pre-eclampsia incidence based on no. of glasses of milk consumed per day stratified by use of calcium supplements, ethnicity <strong>and</strong> parity.Reference category – 2 glasses of milk per dayPre-eclampsiaSummary: both low (
in the first <strong>and</strong> second trimester only (e.g. before the onset of PE) the results were essentially unchanged.FollowupConfoundingRisk of biasRelevanceOther commentsDuring pregnancy until birthConfounders considered in the analysis included PE risk factors such as: preeclampsia in the previous pregnancy; prepregnancy body mass index;number of previous pregnancies; abortion, which was defined as fetal death with gestation of less than 20 weeks; therapeutic or induced abortion(including missed abortions); excess weight gain, which was defined as weight gain of more than 30 pounds during pregnancy; as well as ethnicity, useof supplements, smoking status, educational level, marital status, year of interview, trimester of interview, or number of abortions.Low-moderate risk of bias: No adjustment for other dietary factors, including energy intake.This study was undertaken in the early 1960s when whole milk was the predominant form of milk being drunk by women in the US – which is likely to bedifferent to contemporary Australian women.The biological plausibility for the association between high milk intake <strong>and</strong> pre-eclampsia is unclear, it may be confounded by other dietary factors whichwere not accounted for, such as fat (given the majority of dairy intake was whole milk not skim).Dietary guidelines for pregnant <strong>and</strong> <strong>breastfeeding</strong> women: evidence report186
Reference Saito 2010Food typeDairy foods (also meat, eggs, fish)Study typeProspective cohort studyLevel of evidence II (aetiology)SettingNeyagawa City, JapanFundingMinistry of Education, Culture, Sports, Science <strong>and</strong> Technology <strong>and</strong> <strong>Health</strong> <strong>and</strong> Labour Sciences, Ministry of <strong>Health</strong>, Labour <strong>and</strong> Welfare, JapanParticipants771 mother-child pairs recruited from November 2001 to March 2003 at any stage of pregnancy – mean GA 18 weeks (part of the Osaka Maternal <strong>and</strong>Child <strong>Health</strong> Study)Baseline comparisons See confounding belowDietary assessment Diet history questionnaire (DHQ)TimingDHQ to assess dietary habits during the preceding monthComparisonQuartiles of dairy food consumptionOutcomesSuspected atopic eczemaResultsSuspected atopic eczeman/N OR (95% CI) aOR (95% CI)Q1 (52.7 g/day) 13/192 1.00 1.00Q2 (126.0 g/day) 16/193 1.24 (0.58 to 2.71) 1.39 (0.62 to 3.20)Q3 (191.0 g/day) 18/193 1.42 (0.68 to 3.04) 1.63 (0.73 to 3.72)Q4 (288.3 g/day) 18/193 1.42 (0.68 to 3.04 1.84 (0.82 to 4.27)p value for trend (unadjusted): 0.33p value for trend (adjusted): 0.13FollowupConfoundingRisk of biasRelevanceOther comments3-4 monthsAdjusted for maternal age, gestation at baseline, family income, maternal <strong>and</strong> paternal education, maternal <strong>and</strong> paternal history of asthma, atopiceczema <strong>and</strong> allergic rhinitis, mite allergen level from maternal bedclothes, vacuuming living room, mould in kitchen, changes in maternal diet in previousmonth, season when baseline data collected, baby’s older siblings, baby’s sex, baby’s birthweight, <strong>breastfeeding</strong> <strong>and</strong> bathing or showering infantLow risk of bias: Of 1002 eligible women, a final sample of 771 (77%) was available for analysisFish intake in Japan likely to be higher than in AustraliaDairy Foods187
Reference Sausenthaler 2007Food groupsDairy foods (also fish, eggs, nuts <strong>and</strong> seeds, fats <strong>and</strong> oils, vegetables, fruit)Study typeProspective cohort study: from the LISA birth cohortLevel of evidence II (aetiology)Setting4 German cities (Munich, Leipzig, Wesel, Bad Honnef)FundingFederal Ministry for Education, Science, Research <strong>and</strong> Technology, GermanyParticipants3097 newborns recruitedBaseline comparisons See Confounding belowDietary assessment FFQTimingMaternal diet during the last 4 weeks of pregnancy (obtained shortly after birth, median 3 days)VariableLow intake group as reference group compared with high intake group: Milk high intake = “more than sometimes” Yoghurt high intake = “more than sometimes” Cheese high intake = ≥ 4 times/week Cream high intake = 3-4 times/weekOutcomesAllergic sensitisation, eczema at 2 yrsResultsDoctor-diagnosed eczema any allergen sensitisation food allergens inhalant allergensDAIRY FOODSAdjusted OR (95% CI)Milk 1.04 (0.80, 1.34) 0.93 (0.67, 1.28) 0.95 (0.66, 1.37) 0.95 (0.58, 1.57)Yoghurt 0.99 (0.78, 1.27) 0.81 (0.59, 1.10) 0.89 (0.62, 1.27) 0.69 (0.43, 1.12)Cheese 0.87 (0.68, 1.13) 0.99 (0.72, 1.36) 0.97 (0.68, 1.39) 0.93 (0.57,1.53)Cream 1.02 (0.78, 1.34) 1.20 (0.86, 1.67) 1.26 (0.87, 1.83) 1.26 (0.76, 2.08)Length of followupConfoundingRisk of biasRelevanceOther comments2 yearsCrude <strong>and</strong> adjusted results reported (adjusted for study area, sex, maternal age, maternal smoking, level of parental education, exclusive <strong>breastfeeding</strong>≥ 4 months, parental history of atopic diseases, season of birth <strong>and</strong> all dietary variablesLow risk of bias: Two year data available for 2641/3097 children (85%): 433 lost to follow-up, 9 excluded due to chronic disease, 14 missing maternalFFQLikely to be reasonably similar to dietary intakes of Australian women in AustraliaDietary guidelines for pregnant <strong>and</strong> <strong>breastfeeding</strong> women: evidence report188
Reference Stuebe 2009Dietary patterns Dairy foodsStudy typeProspective cohort study (Project Viva)Level of evidence II (aetiology)Setting8 urban <strong>and</strong> suburban obstetric offices of a multispecialty group practice in eastern Massachusetts, USAFundingUS NIH, Harvard Medical School, Harvard Pilgrim <strong>Health</strong> Care FoundationParticipants1338 women giving birth to a live singleton infant, < 22 weeks gestation at study entry; 379 (27%) were overweight (BMI ≥ 26); 703 (51%) experiencedexcessive weight gainExclusions: not fluent in EnglishBaseline comparisons See confounding belowDietary assessment FFQTimingAdministered in first <strong>and</strong> second trimesters of pregnancyComparisonTotal dairy food consumption - serves per dayOutcomes Excessive gestational weight gain (IOM 1990)ResultsExcessive gestation weight gain: dairy food consumptionServes per day, meanaOR (95% CI)Inadequate/adequate GWG Excessive GWGTotal dairy food 2.90 [SD1.52] 3.04 [SD1.49] 1.08 (1.00 to 1.17)Low fat dairy food 1.49 [SD1.31] 1.59 [1.34] 1.08 (0.98 to 1.18)Whole milk 1.41 [SD1.01] 1.46 [0.97] 1.06 (0.94 to 1.20)Dairy food, per serving per day: multivariate logistic regression model:aOR 1.09 95% CI 1.01 to 1.190.23 kg 95% CI 0.05 to 0.41FollowupConfoundingRisk of biasRelevanceOther commentsTo birthAdjusted for pre-pregnancy BMI, maternal age, race/ethnicity, smoking status, gestational age at birth, nausea in first trimester in pregnancyLow risk of bias: Of 2083 eligible women, 1388 (67%) of women had data available for analysis (31 had missing information on pre-pregnancy BMI <strong>and</strong>gestational weight gain; 226 had missing covariate information <strong>and</strong> 438 had missing data on either first or second-trimester diet <strong>and</strong> mid-pregnancyphysical activity); included women were less likely to be African-American or Hispanic, to be younger, multiparous <strong>and</strong> obeseLikely to be relevant to Australian womenDairy Foods189
Reference Tennekoon 1996Food typeDairy foods (powdered skim milk)Study typeRCTLevel of evidence IISettingWomen recruited from postpartum wards of the De Soysa Hospital for Women, Sri LankaFundingUnclear, no informationParticipants60 ‘normal, healthy lactating (exclusively <strong>breastfeeding</strong>) women matched for parity <strong>and</strong> BMI, <strong>and</strong> with previous experience of lactational amenorrhea.’Women were aged between 20-35, <strong>breastfeeding</strong> a second or third baby, had a BMI between 18-27, <strong>and</strong> had uncomplicated pregnancies. Women whowere planning to use hormonal contraceptives or who had introduced other feeds to the infant by 4 weeks postpartum were excluded. All women werenot in paid employment for the duration of the studyDietary assessment Supplemented women were given ~50g powdered skim milk/d (49.8% carbohydrates, 37.6% protein, 0.8% fatm 7.8% mineral salts, <strong>and</strong> 3.8%moisture). 100g provided 1523 kjm 600 microgram vitamin A <strong>and</strong> 10 micrograms of vitamin D.States that 24 hr home dietary records were obtained at 4 weekly intervals to determine if supplemented women consumed skim milk in addition to theirnormal diet. But no attempt to calculated energy intake was made because accurate information could not be obtained about the quantities of foodconsumed.Baseline comparisons No significant differences between groups in terms of maternal age, BMI, infant birth weight, frequency of breast feeds (day <strong>and</strong> night) or prolactinvalues.TimingComparisonOutcomesResultsSee also confoundingWomen commenced the study at 4 weeks postpartum <strong>and</strong> continued supplementation until they had two to three regular menstrual periodsTime to resumption of regular menstruation <strong>and</strong> ovulation in supplemented <strong>and</strong> control groups. Women were also categorised according to whetherthey had resumed regular menstruation <strong>and</strong> ovulation before 24 wks postpartum <strong>and</strong> after 24 weeks postpartumResumption of regular menstruation <strong>and</strong> ovulation. Urinary pregnanediol glucuronide concentration ≥ 0.1 mmol/mol creatinine during the luteal phasewas considered to be evidence of ovulationNo significant difference between groups in the number of women with regular menstruation before <strong>and</strong> after 24 weeks, <strong>and</strong> the number of women withfirst regular bleeds that were ovulatory either before or after 24 weeks (Table 2 below)Table 2Characteristics of the first menstrual bleed in 20 matched pairs of lactating women inwhich the supplemented group received skim milkSupplementedgroupControlgroupn (%)Regular menstruation before 24 wk postpartum 17 (57) 15 (50)Regular menstruation after 24 wk postpartum 13 (43) 15 (50)Ovulatory first menstrual bleed 17 (57) 12 (40)Ovulatory first menstrual bleed before24 wk postpartum9 (30) 5 (17)Ovulatory first menstrual bleed after24 wk postpartum 8 (27) 7 (23)Not ovulated before completing the study 0 5 (17)The number of women giving other (e.g. formula) feeds at each follow up was significantly lower in the supplemented group compared withcontrol at 8 (p
Women in the supplemented group introduced other feeds ~5 weeks later than the control group (p
Reference Venter 2009Food groupsDairy foods: milkStudy typeProspective cohortLevel of evidence II (aetiology)SettingPortsmouth, UKFundingFood St<strong>and</strong>ards AgencyParticipants 696 pregnant women at 12 weeks gestation (with estimated birth date between 1 September 2001 <strong>and</strong> 31 August 2002)Baseline comparisons <strong>Pregnant</strong> women with a maternal history of atopic disease were more likely to smokeDietary assessment FFQTimingFFQ at 36 weeks gestationComparisonNo (< 1% of women) versus moderate (10%) versus frequent (89%) versus uncertain (1%) consumption of milk during pregnancyOutcomesFood hypersensitivity (FHS) in infants up to three years of ageResultsInfant FHS at one year:22/914 infants showed FHS to milk in the first year (1 where mothers never consumed milk during pregnancy, 0 where mothers reported moderateconsumption of milk during pregnancy, 18 where mothers reported frequent consumption of milk during pregnancy <strong>and</strong> 3 where mother’s milkconsumption during pregnancy was uncertain)Infant FHS at three years:25/911 infants showed FHS to milk in the first three years (1 where mothers never consumed milk during pregnancy, 2 where mothers reportedmoderate consumption of milk during pregnancy, 20 where mothers reported frequent consumption of milk during pregnancy <strong>and</strong> 2 where mother’s milkconsumption during pregnancy was uncertain)“Statistical inferences could not be measured due to the small numbers”Length of followupConfoundingRisk of biasRelevanceOther commentsUp to three yearsAnalyses do not appear to have been adjustedModerate-high risk of bias: Data were obtained from 91% (n = 969) of the birth cohort; at 1 year follow-up data were available for 77.6% (752/969) <strong>and</strong>for 65.2% (632/969) at 3 years; analyses probably not adjusted for confoundersLikely to be relevant to Australian womenDietary guidelines for pregnant <strong>and</strong> <strong>breastfeeding</strong> women: evidence report192
Reference Willers 2007Food typeDairy foods (fat from dairy products)Study typeProspective cohort (longitudinal)Level of evidence II (aetiology)SettingAntenatal clinics at Aberdeen Maternity Hospital, Aberdeen, Scotl<strong>and</strong>FundingAsthma UK, GA 2 LEN European Network of Excellence on Global Allergy <strong>and</strong> AsthmaParticipants1212 children (singleton births) whose mothers were recruited between October 1997 <strong>and</strong> April 1999 at a median gestational age of 12 weeksBaseline comparisons Women were representative of the local obstetric populationSee confounding belowDietary assessment FFQTimingFFQ mailed at 32 weeks gestation to cover dietary intake over the previous 2-3 monthsComparisonTertiles:OutcomesWheeze, asthma, allergic rhinitis, atopic eczema, hay fever at 5 yearsResultsFat from dairy products – no consistent linear associations with respiratory <strong>and</strong> atopic outcomes in 5 year old children (exact numbers not reported inthe paper)Ever had asthma – no significant association with dairy intake (exact numbers not reported)FollowupConfoundingRisk of biasRelevanceOther comments5 yearsAdjusted for maternal age, paternal social class, maternal education, maternal smoking during pregnancy, smoking in the child’s home at 5 years,energy intake, maternal asthma, maternal atopy, child’s birthweight, child’s sex, presence of older siblings, <strong>and</strong> <strong>breastfeeding</strong>Low risk of bias: Initial study population of 1924 children dropped to 1212 participants with complete data (63.0%) (questionnaire, at least one of theoutcome time points).Likely to be reasonably relevant to Australian womenInclusion of maternal supplement use during pregnancy did not materially change the resultsDairy Foods193
Reference Willers 2008Food typeDairy foods (milk <strong>and</strong> milk products)Study typeProspective cohort (longitudinal)Level of evidence II (aetiology)SettingNetherl<strong>and</strong>sFundingNetherl<strong>and</strong>s Organization for <strong>Health</strong> Research <strong>and</strong> Development, Netherl<strong>and</strong>s Organization for Scientific Research; Netherl<strong>and</strong>s Asthma Fund;Netherl<strong>and</strong>s Ministry of Spatial Planning, Housing, <strong>and</strong> the Environment; Netherl<strong>and</strong>s Ministry of <strong>Health</strong>, Welfare <strong>and</strong> Sport, GlaxoSmithKlineParticipants2,832 children (part of the Prevention <strong>and</strong> Incidence of Asthma <strong>and</strong> Mite Allergy (PIAMA) birth cohort studyBaseline comparisons See confounding belowDietary assessment FFQTimingFFQ administered at antenatal recruitment (mean gestational ages not reported) to cover dietary intake over the previous monthComparisonDaily (once per day or more) consumption of milk or milk products v 1-4 times a week or fewerOutcomesWheeze, dyspnoea, prescription of inhaled steroids for respiratory problems, composite variable ‘asthma symptoms’ in the last 12 months (measuredlongitudinally from 1 to 8 years age)Results Wheeze from 1 to 8 years age (n = 2788)OR 0.84 95% CI 0.68 to 1.03aOR 0.88 95% CI 0.71 to 1.19Dyspnoea from 1 to 8 years age (n = 2788)OR 0.90 95% CI 0.71 to 1.16aOR 0.92 95% CI 0.72 to 1.19Steroid use from 1 to 8 years age (n = 2788)OR 0.99 95% CI 0.72 to 1.36aOR 1.03 95% CI 0.74 to 1.43FollowupConfoundingRisk of biasRelevanceOther commentsAsthma symptoms (composite of previous three outcomes) from 1 to 8 years age (n = 2788)OR 0.89 95% CI 0.72 to 1.10aOR 0.92 95% CI 0.74 to 1.158 yearsThe child’s dietary data on fruit, vegetables, fish, eggs, full cream milk, butter <strong>and</strong> peanut butter consumption at 2 years of age were used to check forpotential confounding by the child’s diet.Results were adjusted for by sex, maternal education, parental allergy, maternal smoking during pregnancy, smoking in the home at 8 years of age,<strong>breastfeeding</strong>, presence of older siblings, birthweight, maternal overweight 1 year after pregnancy, maternal supplement use during pregnancy, region<strong>and</strong> study arm (intervention or natural history arm).Moderate risk of bias: Initial study population of 4,146 mothers dropped to 2,832 participants with complete data (68.3%) (pregnancy questionnaire, atleast one of the outcome time points <strong>and</strong> all confounders). Participants with complete data were more likely to have a high education level, to have dailydairy food <strong>and</strong> fruit intake during pregnancy <strong>and</strong> to have breastfed <strong>and</strong> less likely to have maternal asthma or maternal atopy, smoked duringpregnancy, be from a south western region compared with participants who did not have complete data.Dietary intakes likely to be different from Australian e.g. low fish consumption in study participantsNot clear when women assessed their diet during pregnancy;83% of pregnant women used supplements (50% used folic acid/iron)Dietary guidelines for pregnant <strong>and</strong> <strong>breastfeeding</strong> women: evidence report194
Reference Yin 2010 (see also Jones 2000)Food typeDairy foods (milk)Study typeProspective cohortLevel of evidence II (aetiology)SettingSouthern Tasmania, AustraliaFundingNHMRC, Tasmanian Government, Royal Hobart Hospital Acute Care ProgramParticipants216 adolescents born in 1988 (part of a larger infant health study of babies at high risk of SIDS)Exclusions: multiple pregnanciesBaseline comparisons Children with unemployed fathers more likely to have been excluded due to missing dataDietary assessment FFQTimingDietary intake during third trimester of pregnancyComparisonLinear regression of density (portions per kJ)OutcomesBone mass (bone mineral density (BMD) <strong>and</strong> bone mineral content*) in 16 year old adolescentsResultsBMD at 16 years;Total body (g/cm 2 )r 2 -0.002; ß +0.14 (pns)adjusted r 2 0.326; ß +0.17 (pns)Femoral neck (g/cm 2 )r 2 0.000 ß +0.25 (pns)adjusted r 2 0.353; ß +0.28 (pns)FollowupConfoundingRisk of biasRelevanceOther commentsLumbar spine (g/cm 2 )r 2 0.010; ß +0.40 (pns)adjusted r 2 0.213; ß +0.41 (p < 0.05)16 yearsAnalyses were adjusted for sex, weight at age 16 years, sunlight exposure in winter at age 16 years, smoking during pregnancy, sports participation,ever breast-fed, current calcium intake, Tanner stage, maternal age at the time of childbirth <strong>and</strong> “other factors” [these other factors were not listed in thepaper]Moderate-high: 415 children were followed from birth to age 16, dropped to 216 (dietary information missing or unreliable for 138 mothers, 47 multiplebirths, 14 participants had missing data for confounders) representing 52% of participants followed from birth to age 16. 70% of the 216 participantswere male. Gender imbalance suggests potential selection bias (due to original selection of infants at high risk of SIDS)Infants at high risk of SIDS represent a selected group (more males, preterm births, teenage mothers, smoking during pregnancy)*Bone mineral content results not reported; Study flow figures differ between 2000 <strong>and</strong> 2010 reports (e.g. numbers of multiple births)Dairy Foods195
ReferencesBunin GR, Kushi LH, Gallagher PR, Rorke-Adams LB, McBride ML <strong>and</strong> Cnaan A."Maternal diet during pregnancy <strong>and</strong> its association with medulloblastoma inchildren: a children's oncology group study (United States)." Cancer CausesControl 2005: 16(7): 877-91.Campbell-Brown M (1983). Protein energy supplements in primigravidwomen at risk of low birthweight. Nutrition in pregnancy. Proceedings of the10th Study Group of the Royal College of Obstetrics <strong>and</strong> Gynaecology,London Royal College of Obstetrics <strong>and</strong> Gynaecology:85-98.Chan GM, McElligott K, McNaught T <strong>and</strong> Gill G. "Effects of dietary calciumintervention on adolescent mothers <strong>and</strong> newborns: A r<strong>and</strong>omized controlledtrial." Obstet Gynecol 2006: 108(3 Pt 1): 565-71.Chang SC, O'Brien KO, Nathanson MS, Caulfield LE, Mancini J <strong>and</strong> Witter FR."Fetal femur length is influenced by maternal dairy intake in pregnant AfricanAmerican adolescents." Am J Clin Nutr 2003: 77(5): 1248-54.Chatzi L, Torrent M, Romieu I, Garcia-Esteban R, Ferrer C, Vioque J, KogevinasM <strong>and</strong> Sunyer J. "Mediterranean diet in pregnancy is protective for wheeze<strong>and</strong> atopy in childhood." Thorax 2008: 63(6): 507-13.Duvekot EJ, de Groot CJ, Bloemenkamp KW <strong>and</strong> Oei SG. "<strong>Pregnant</strong> womenwith a low milk intake have an increased risk of developing preeclampsia."Eur J Obstet Gynecol Reprod Biol 2002: 105(1): 11-4.Elwood PC, Haley TJ, Hughes SJ, Sweetnam PM, Gray OP <strong>and</strong> Davies DP."Child growth (0-5 years), <strong>and</strong> the effect of entitlement to a milksupplement." Arch Dis Child 1981: 56(11): 831-5.Evans RW, Fergusson DM, Allardyce RA <strong>and</strong> Taylor B. "Maternal diet <strong>and</strong>infantile colic in breast-fed infants." Lancet 1981: 1(8234): 1340-2.Dietary guidelines for pregnant <strong>and</strong> <strong>breastfeeding</strong> women: evidence reportGeorge GC, Hanss-Nuss H, Milani TJ <strong>and</strong> Freel<strong>and</strong>-Graves JH. "Food choices oflow-income women during pregnancy <strong>and</strong> postpartum." J Am Diet Assoc2005: 105(6): 899-907.Giordano F, Abballe A, De Felip E, di Domenico A, Ferro F, Grammatico P,Ingelido AM, Marra V, Marrocco G, Vallasciani S <strong>and</strong> Figa-Talamanca I."Maternal exposures to endocrine disrupting chemicals <strong>and</strong> hypospadias inoffspring." Birth Defects Res A Clin Mol Teratol 2010: 88(4): 241-50.Giordano F, Carbone P, Nori F, Mantovani A, Taruscio D <strong>and</strong> Figa-Talamanca I."Maternal diet <strong>and</strong> the risk of hypospadias <strong>and</strong> cryptorchidism in theoffspring." Paediatr Perinat Epidemiol 2008: 22(3): 249-60.Godfrey K, Robinson S, Barker DJ, Osmond C <strong>and</strong> Cox V. "Maternal nutritionin early <strong>and</strong> late pregnancy in relation to placental <strong>and</strong> fetal growth." BMJ1996: 312(7028): 410-4.Haggarty P, Campbell DM, Duthie S, Andrews K, Hoad G, Piyathilake C <strong>and</strong>McNeill G. "Diet <strong>and</strong> deprivation in pregnancy." Br J Nutr 2009: 102(10):1487-97.Herrick K, Phillips DI, Haselden S, Shiell AW, Campbell-Brown M <strong>and</strong> GodfreyKM. "Maternal consumption of a high-meat, low-carbohydrate diet in latepregnancy: relation to adult cortisol concentrations in the offspring." J ClinEndocrinol Metab 2003: 88(8): 3554-60.Javaid MK, Crozier SR, Harvey NC, Taylor P, Inskip HM, Godfrey KM <strong>and</strong>Cooper C. "Maternal <strong>and</strong> seasonal predictors of change in calcanealquantitative ultrasound during pregnancy." J Clin Endocrinol Metab 2005:90(9): 5182-7.196
Jensen CD, Block G, Buffler P, Ma X, Selvin S <strong>and</strong> Month S. "Maternal dietaryrisk factors in childhood acute lymphoblastic leukemia (United States)."Cancer Causes Control 2004: 15(6): 559-70.Jones G, Riley MD <strong>and</strong> Dwyer T. "Maternal diet during pregnancy isassociated with bone mineral density in children: a longitudinal study." Eur JClin Nutr 2000: 54(10): 749-56.Knox EG. "Anencephalus <strong>and</strong> dietary intakes." Br J Prev Soc Med 1972: 26(4):219-23.Kwan ML, Jensen CD, Block G, Hudes ML, Chu LW <strong>and</strong> Buffler PA. "Maternaldiet <strong>and</strong> risk of childhood acute lymphoblastic leukemia." Public <strong>Health</strong> Rep2009: 124(4): 503-14.Lagiou P, Lagiou A, Samoli E, Hsieh CC, Adami HO <strong>and</strong> Trichopoulos D. "Dietduring pregnancy <strong>and</strong> levels of maternal pregnancy hormones in relation tothe risk of breast cancer in the offspring." Eur J Cancer Prev 2006: 15(1): 20-6.Lamb MM, Myers MA, Barriga K, Zimmet PZ, Rewers M <strong>and</strong> Norris JM."Maternal diet during pregnancy <strong>and</strong> islet autoimmunity in offspring."Pediatr Diabetes 2008: 9(2): 135-41.Latva-Pukkila U, Isolauri E <strong>and</strong> Laitinen K. "Dietary <strong>and</strong> clinical impacts ofnausea <strong>and</strong> vomiting during pregnancy." J Hum Nutr Diet 2010: 23(1): 69-77.Lovegrove JA, Hampton SM <strong>and</strong> Morgan JB. "The immunological <strong>and</strong> longtermatopic outcome of infants born to women following a milk-free dietduring late pregnancy <strong>and</strong> lactation: a pilot study." Br J Nutr 1994: 71(2):223-38.Lovegrove JA, Morgan JB <strong>and</strong> Hamptom SM. "Dietary factors influencinglevels of food antibodies <strong>and</strong> antigens in breast milk." Acta Paediatr 1996:85(7): 778-84.Dairy FoodsMaconochie N, Doyle P, Prior S <strong>and</strong> Simmons R. "Risk factors for firsttrimester miscarriage--results from a UK-population-based case-controlstudy." BJOG 2007: 114(2): 170-86.Mannion CA, Gray-Donald K <strong>and</strong> Koski KG. "Association of low intake of milk<strong>and</strong> vitamin D during pregnancy with decreased birth weight." CMAJ 2006:174(9): 1273-7.Marcoux S, Brisson J <strong>and</strong> Fabia J. "Calcium intake from dairy products <strong>and</strong>supplements <strong>and</strong> the risks of preeclampsia <strong>and</strong> gestational hypertension."Am J Epidemiol 1991: 133(12): 1266-72.Mitchell EA, Robinson E, Clark PM, Becroft DM, Glavish N, Pattison NS, PryorJE, Thompson JM <strong>and</strong> Wild CJ. "Maternal nutritional risk factors for small forgestational age babies in a developed country: a case-control study." ArchDis Child Fetal Neonatal Ed 2004: 89(5): F431-5.Miyake Y, Sasaki S, Yokoyama T, Tanaka K, Ohya Y, Fukushima W, Saito K,Ohfuji S, Kiyohara C <strong>and</strong> Hirota Y. "Risk of postpartum depression in relationto dietary fish <strong>and</strong> fat intake in Japan: the Osaka Maternal <strong>and</strong> Child <strong>Health</strong>Study." Psychol Med 2006: 36(12): 1727-35.Moore VM, Davies MJ, Willson KJ, Worsley A <strong>and</strong> Robinson JS. "Dietarycomposition of pregnant women is related to size of the baby at birth." JNutr 2004: 134(7): 1820-6.Nwaru BI, Ahonen S, Kaila M, Erkkola M, Haapala AM, Kronberg-Kippila C,Veijola R, Ilonen J, Simell O, Knip M <strong>and</strong> Virtanen SM. "Maternal diet duringpregnancy <strong>and</strong> allergic sensitization in the offspring by 5 yrs of age: aprospective cohort study." Pediatr Allergy Immunol 2010: 21(1 Pt 1): 29-37.Oken E, Ning Y, Rifas-Shiman SL, Rich-Edwards JW, Olsen SF <strong>and</strong> Gillman MW."Diet during pregnancy <strong>and</strong> risk of preeclampsia or gestationalhypertension." Ann Epidemiol 2007: 17(9): 663-8.197
Olafsdottir AS, Skuladottir GV, Thorsdottir I, Hauksson A <strong>and</strong> SteingrimsdottirL. "Maternal diet in early <strong>and</strong> late pregnancy in relation to weight gain." Int JObes (Lond) 2006: 30(3): 492-9.Olsen SF, Halldorsson TI, Willett WC, Knudsen VK, Gillman MW, Mikkelsen TB<strong>and</strong> Olsen J. "Milk consumption during pregnancy is associated withincreased infant size at birth: prospective cohort study." Am J Clin Nutr 2007:86(4): 1104-10.Petridou E, Ntouvelis E, Dessypris N, Terzidis A <strong>and</strong> Trichopoulos D."Maternal diet <strong>and</strong> acute lymphoblastic leukemia in young children." CancerEpidemiol Biomarkers Prev 2005: 14(8): 1935-9.Petridou E, Stoikidou M, Diamantopoulou M, Mera E, Dessypris N <strong>and</strong>Trichopoulos D. "Diet during pregnancy in relation to birthweight in healthysingletons." Child Care <strong>Health</strong> Dev 1998b: 24(3): 229-42.Richardson BE <strong>and</strong> Baird DD. "A study of milk <strong>and</strong> calcium supplement intake<strong>and</strong> subsequent preeclampsia in a cohort of pregnant women." Am JEpidemiol 1995: 141(7): 667-73.Saito K, Yokoyama T, Miyake Y, Sasaki S, Tanaka K, Ohya Y <strong>and</strong> Hirota Y."Maternal meat <strong>and</strong> fat consumption during pregnancy <strong>and</strong> suspected atopiceczema in Japanese infants aged 3-4 months: the Osaka Maternal <strong>and</strong> Child<strong>Health</strong> Study." Pediatr Allergy Immunol 2010: 21(1 Pt 1): 38-46.Tennekoon KH, Karunanayake EH <strong>and</strong> Seneviratne HR. "Effect of skim milksupplementation of the maternal diet on lactational amenorrhea, maternalprolactin, <strong>and</strong> lactational behavior." Am J Clin Nutr 1996: 64(3): 283-90.Venter C, Pereira B, Voigt K, Grundy J, Clayton CB, Higgins B, Arshad SH <strong>and</strong>Dean T. "Factors associated with maternal dietary intake, feeding <strong>and</strong>weaning practices, <strong>and</strong> the development of food hypersensitivity in theinfant." Pediatr Allergy Immunol 2009: 20(4): 320-7.Willers SM, Devereux G, Craig LC, McNeill G, Wijga AH, Abou El-Magd W,Turner SW, Helms PJ <strong>and</strong> Seaton A. "Maternal food consumption duringpregnancy <strong>and</strong> asthma, respiratory <strong>and</strong> atopic symptoms in 5-year-oldchildren." Thorax 2007: 62(9): 773-9.Willers SM, Wijga AH, Brunekreef B, Kerkhof M, Gerritsen J, Hoekstra MO, deJongste JC <strong>and</strong> Smit HA. "Maternal food consumption during pregnancy <strong>and</strong>the longitudinal development of childhood asthma." Am J Respir Crit CareMed 2008: 178(2): 124-31.Yin J, Dwyer T, Riley M, Cochrane J <strong>and</strong> Jones G. "The association betweenmaternal diet during pregnancy <strong>and</strong> bone mass of the children at age 16."Eur J Clin Nutr 2010: 64(2): 131-7.3Sausenthaler S, Koletzko S, Schaaf B, Lehmann I, Borte M, Herbarth O, vonBerg A, Wichmann HE <strong>and</strong> Heinrich J. "Maternal diet during pregnancy inrelation to eczema <strong>and</strong> allergic sensitization in the offspring at 2 y of age."Am J Clin Nutr 2007: 85(2): 530-7.Stuebe AM, Oken E <strong>and</strong> Gillman MW. "Associations of diet <strong>and</strong> physicalactivity during pregnancy with risk for excessive gestational weight gain." AmJ Obstet Gynecol 2009: 201(1): 58 e1-8.Dietary guidelines for pregnant <strong>and</strong> <strong>breastfeeding</strong> women: evidence report198
Included StudiesDairy foods <strong>and</strong> eggsStudyOutcomes1. Cant 1986 eczema2. Falth-Magnusson 1987a maternal weight gain, low birthweight, preterm birth, eczema, allergic rhinoconjunctivitis, asthma<strong>and</strong> b, 19923. Lilja 1988, 1989, 1991 cord blood IgE; eczema; asthma4. Pogoda 2009 childhood brain tumoursDairy Foods <strong>and</strong> Eggs199
Evidence summariesMaternal Outcomes1. In a Swedish RCT, women in the dietary restriction group (no cow’s milk or egg in latepregnancy) had a mean 19.3% increase in weight during the pregnancy compared with22.3% in the non-diet group (p < 0.005)Birth Outcomes2. In a Swedish RCT, no significant differences in low birthweight or preterm birth were seenfor women in the dietary restriction group (no cow’s milk or egg in late pregnancy)compared with women in the non-diet groupChildhood Outcomes3. In an UK RCT plus a nonr<strong>and</strong>omised study, there were no significant differences in eczemascores in infants up to 12 weeks of age whether their mothers consumed a diet excludingdairy foods <strong>and</strong> eggs, or not4. In a Swedish RCT, no significant differences in numbers of children with asthma or eczemawere seen for women in the dietary restriction group (no cow’s milk or egg in latepregnancy) compared with women in the non-diet group5. In a Swedish RCT, no significant differences in numbers of children with asthma or eczemawere seen for women in the dietary restriction groups (no or reduced cow’s milk or egg inlate pregnancy) compared with women in the non-diet groups6. In an international multicentre case control study, maternal consumption of dairy foods <strong>and</strong>eggs during pregnancy was associated with increased risk of childhood brain tumours,particularly PNETN Level References212women212women19 (<strong>and</strong>18)212womenII Falth-Magnusson 1987a, b, 1992II Falth-Magnusson 1987a, b, 1992II Cant 1986(<strong>and</strong>III-2)II Falth-Magnusson 1987a, b, 1992165 II Lilja 1988, 1989, 19911281cases;2223controlsIII-3 Pogoda 2009Dietary guidelines for pregnant <strong>and</strong> <strong>breastfeeding</strong> women: evidence report200
Evidence TablesReference Cant 1986Food typeDairy foods (cow’s milk) <strong>and</strong> eggStudy typeRCT (crossover trial) [plus non-r<strong>and</strong>omised crossover trial designed to see if the soy substitute might have provoked symptoms in the RCT]Level of evidence II [plus III-2] (intervention)SettingLondon, UKFundingSouth West Thames Regional <strong>Health</strong> Authority, UK <strong>and</strong> Wyeth LaboratoriesParticipantsMother of 37 breastfed infants wih eczema, aged 6 weeks to 6 months:RCT – 19 mothersnonRCT – 18 took part in in open exclusion of 11 foods followed by a double blind challenge in mothers whose infants seemed to respondBaseline comparisons Not reportedDietary assessment NATiming2 or 4 week crossoversComparisonMaternal exclusion of cow milk, egg, chocolate, wheat, nuts, fish, beef, chicken, citrus fruits, colourings, <strong>and</strong> preservatives, with use of soya-based milksubstitute for 4 weeksversusSame dietary exclusions for same duration (4 weeks) but substitute contained cow milk <strong>and</strong> eggOutcomeseczemaResults RCT (n = 17):nonsignificant reduction in eczema activity score – mean 10.8 in exclusion period; 12.2 in control periodnonsignificant reduction in eczema area score – mean 8.6 in exclusion period; 9.4 in control periodnonRCT (n = 18):In 2 children the eczema activity score decreased by > 20% when their mothers took the exclusion diet <strong>and</strong> then increased but > 20% when theirmothers returned to a normal diet;In 2 children the eczema activity scores remained unchanged when their mothers took the exclusion diet but then deteriorated when the mothers took anormal dietFollowup12 weeksConfoundingNA (for RCT)Risk of biasModerate risk of bias (RCT): method of allocation concealment not reported, two women excluded due to poor adherence to diet; no data reported onadherence for the other 17 womenRelevanceA diet excluding milk <strong>and</strong> eggs <strong>and</strong> other foods likely to be difficult for many Australian women to adhere to during pregnancyOther commentsDairy Foods <strong>and</strong> Eggs201
Reference Falth-Magnusson 1987 (1987a, 1987b, 1992)Food typeDairy foods (cow’s milk) <strong>and</strong> eggStudy typeRCTLevel of evidence II (intervention)SettingLinkoping area, SwedenFundingTore Nilson Fund for Medical Research <strong>and</strong> Medical Research Fund of the County of Ostergotl<strong>and</strong>Participants 212 women from families with at least one allergic family member (213 children) recruited from 1983Baseline comparisons Family allergy scores similar between groups at baseline; children’s exposure to smoke was significantly less in the diet group than the non-diet groupDietary assessment NATimingIntervention period: 28 weeks to birthComparisonCow’s milk <strong>and</strong> egg elimination from 28 weeks gestation to birth (<strong>and</strong> partially during early lactation) (n = 104 r<strong>and</strong>omised) v usual diet (typically 0.5 Lmilk/day <strong>and</strong> 3-5 eggs/week) n = 108 r<strong>and</strong>omised; (elimination group also had extra calcium <strong>and</strong> casein hydrolysate)OutcomesCord blood IgE, maternal weight gain, low birthweight, preterm birth, eczema, allergic rhinoconjunctivitis, asthmaResultsMaternal weight gain during pregnancy (mean %)Diet group (n=79): mean gain of 19.3% v 22.3% in the non-diet group (n=85) (P < 0.005)Low birthweight <strong>and</strong> preterm birthNo significant differences between groups – 3 babies born before 36 weeks <strong>and</strong> all < 2500 g (all in the diet group)Cord blood IgENo sig. differences between groups (but babies of atopic mothers had higher IgG levels than babies of non-atopic mothers regardless of diet)Positive skin prick tests for egg <strong>and</strong> milk in infants at 6 <strong>and</strong> 18 months: pnsEczema (up to five years?); 29 in the diet group <strong>and</strong> 24 in the non-diet group (pns)Asthma in first 18 months: 3/76 in diet group <strong>and</strong> 1/95 in the non-diet group (pns)Allergic rhinoconjunctivitis (up to five years?); 13 in the diet group <strong>and</strong> 14 in the non-diet group (pns)Bronchial obstruction (up to five years?); 29 in the diet group <strong>and</strong> 25 in the non-diet group (pns)Intolerance to any food item (up to five years?): 16/84 in the diet group <strong>and</strong> 20/114 non-diet (pns)Allergic disease (up to five years?) – probable or definite; 35 in the diet group <strong>and</strong> 37 in the non-diet group (pns)FollowupConfoundingRisk of biasRelevanceOther commentsChildren at five years of ageNot controlled for infant’s diet (some food avoidance was suggested)Medium risk of bias: method of r<strong>and</strong>omisation described only as “r<strong>and</strong>omly allocated”; blinding of intervention not feasible; 10 post-r<strong>and</strong>omisationexclusions (7 in non-diet group <strong>and</strong> 3 in diet group); 22 women in the elimination diet group interrupted their diet but completed the study; five yearresults available for 195/213 (92%) children (leaving 84 in the diet group <strong>and</strong> 114 in the non-diet group)A diet excluding milk <strong>and</strong> eggs likely to be difficult for many Australian women to adhere to during pregnancyDietary guidelines for pregnant <strong>and</strong> <strong>breastfeeding</strong> women: evidence report202
Reference Lilja 1988 (1989, 1991) – some data also extracted from the Kramer Cochrane review (Kramer 2006)Food typeDairy foods (cow’s milk); <strong>and</strong> eggStudy typeRCTLevel of evidence II (intervention)SettingAntenatal clinics in Stockholm-Uppsala <strong>and</strong> Linkoping, SwedenFundingSwedish Medical Research Council, Riksforbundet mot Allergi, Mjolkdroppen, Konsul Th.C.Berghs Foundation, King Gustaf V 80 th Birthday Fund,Bristol MyersParticipants165 pregnant women with atopic respiratory disease with an allergy to pollen <strong>and</strong>/or animal d<strong>and</strong>er (giving birth to 170 infants; 5 sets of twins)Baseline comparisons The almost double number of women (n = 57) allocated to the high dairy <strong>and</strong> egg diet is not explainedDietary assessment n/aTimingAllergens ingested during third trimester of pregnancyComparisonFour diets:1) ‘normal’; about 0.5 L cows’ milk daily <strong>and</strong> three hens’ eggs weekly (n = 39)2) ‘free’; no milk or eggs during the last three months of pregnancy (n = 37)3) ‘reduced’; no apparent intake, but diet not completely free of milk <strong>and</strong> eggs (n = 32)4) ‘high’; about one L milk daily <strong>and</strong> one egg daily (n = 57)OutcomesCord blood IgE; eczema; asthma;ResultsCord blood IgENo significant differences between the four different maternal diet groupsEczema in first 12-18 monthsNo significant differencesAsthma in first 18 months1 case in restricted diet, 1 in unrestricted diet groupsFollowupTo 18 monthsConfoundingn/aRisk of biasModerate risk of bias: 18/183 (10%) postr<strong>and</strong>omisation exclusions at birth because of contamination of cord blood by maternal blood; allocationdescribed only as “r<strong>and</strong>omly assigned”; no explanation given for imbalance on size of groupsRelevanceBoth the ‘free/reduced’ diet <strong>and</strong> the ‘high’ diet not likely to be representative of diets of Australian womenOther commentsDairy Foods <strong>and</strong> Eggs203
Reference Pogoda 2009Food typeEggs <strong>and</strong> dairy foods (including cheese)Study typeCase-control studySeparate centre reports: Preston-Martin 1996 (Los Angeles); Lubin 2000 (Israel); Cordier 1994 (France); McCredie 1994 (Australia)Level of evidence III-3 (aetiology)SettingInternational (seven countries – USA, Israel, Italy, Spain, Australia, France <strong>and</strong> Canada (International Collaborative Study of Childhood Brain Tumors)FundingNIH, California Department of <strong>Health</strong>, Southern California Environmental <strong>Health</strong> Sciences Center, National Cancer Institutes, Cancer SurveillanceSystem of Western Washington, Fred Hutchinson Cancer Research Center, Fondo de Investigaciones Sanitarias of Spain, Conselleria de Sanitat iConsum of Valencian Autonomous Community for the Childhood Cancer Registry of the Province of Valencia, Spanish Society of Paediatric Oncologywith the National Childhood Cancer Registry, ISCIII-RTIC, Villavecchia Foundation <strong>and</strong> Scientific Foundation of the AECCParticipants Cases: 1281Controls: 2223Years of diagnosis varied between centres, ranging from 1976 to 1992 (with most diagnosed between 1982 <strong>and</strong> 1992)Controls were frequency matched to cases in US centres <strong>and</strong> in France; otherwise they were individually matched (by region of residence, age, sex,<strong>and</strong> geographic area (except for Sydney <strong>and</strong> Los Angeles))Baseline comparisons See confounding belowDietary assessment St<strong>and</strong>ardised study questionnaire using detailed dietary recall methods <strong>and</strong> abstract food models to gauge portion sizeTimingDiet during the past year <strong>and</strong> during the index pregnancyComparisonQuartilesOutcomesChildhood brain tumoursResultsAll tumours (n = 1203 cases)Controls Cases aOR 95% CIEggs/dairy foodsQ1 554 (26%) 280 (24%) 1.0Q2 556 (26%) 274 (24%) 1.0 (0.8 to 1.3)Q3 533 (25%) 296 (26%) 1.1 (0.8 to 1.5)Q4 525 (24%) 301 (26%) 1.2 (1.0 to 1.5)P for trend = 0.04Astroglials (n = 621 cases)Eggs/dairy foodsQ1 554 (26%) 142 (24%) 1.0Q2 556 (26%) 139 (24%) 1.0 (0.7 to 1.4)Q3 533 (25%) 151 (26%) 1.2 (0.9 to 1.5)Q4 525 (24%) 154 (26%) 1.3 (1.0 to 1.7)P for trend = 0.01Primitive neural ectodermal tumours (PNETs) (n = 257 cases)Eggs/dairy foodsQ1 554 (26%) 49 (20%) 1.0Q2 556 (26%) 55 (23%) 1.3 (1.0 to 1.6)Q3 533 (25%) 70 (29%) 1.6 (1.0 to 2.7)Q4 525 (24%) 68 (28%) 1.6 (1.0 to 2.4)P for trend = 0.049Dietary guidelines for pregnant <strong>and</strong> <strong>breastfeeding</strong> women: evidence report204
Tumour SubtypesAstrocytomasPilocytic (142 cases) Anaplastic (96 cases) Other (199 cases)Eggs/dairy foods 2.1 (1.0 to 4.1) 1.1 (0.8 to 1.5) 1.4 (1.0 to 1.8)P for trend 0.02 0.11 0.001FollowupConfoundingRisk of biasRelevanceOther commentsOther typesMalignant gliomas (122 cases) Medulloblastomas (193 cases) PNET (64 cases) Ependymomas (104 cases)Eggs/dairy foods 1.0 (0.4 to 2.3) 1.4 (1.0 to 1.9) 2.0 (0.6 to 6.1) 0.8 (0.4 to 1.6)P for trend 0.83 0.14 (?) 0.06 0.66n/aAnalyses adjusted for age <strong>and</strong> sex of child, study centre <strong>and</strong> each food group;Adjustment for total intake of foods had little effect on estimatesLow-moderate risk of bias: 75% of eligible cases <strong>and</strong> 71% of eligible controls participated (based on centres for which these data were available); somelack of st<strong>and</strong>ardisation in dietary assessments between study centres; potentially high risk of recall bias for women whose pregnancies may have beenat least 10 years previously.Likely to be relevant to Australian womenDairy Foods <strong>and</strong> Eggs205
ReferencesCant AJ, Bailes JA, Marsden RA <strong>and</strong> Hewitt D. "Effect of maternal dietaryexclusion on breast fed infants with eczema: two controlled studies." Br MedJ (Clin Res Ed) 1986: 293(6541): 231-3.Falth-Magnusson K, Oman H <strong>and</strong> Kjellman N. "Maternal abstention from cowmilk <strong>and</strong> egg in allergy risk pregnancies. Effect on antibody production in themother <strong>and</strong> the newborn." Allergy 1987a: 42(1): 64-73.Falth-Magnusson K <strong>and</strong> Kjellman NI. "Development of atopic disease inbabies whose mothers were receiving exclusion diet during pregnancy--ar<strong>and</strong>omized study." J Allergy Clin Immunol 1987b: 80(6): 868-75.Falth-Magnusson K <strong>and</strong> Kjellman NI. "Allergy prevention by maternalelimination diet during late pregnancy--a 5-year follow-up of a r<strong>and</strong>omizedstudy." J Allergy Clin Immunol 1992: 89(3): 709-13.Kramer MS <strong>and</strong> Kakuma R. "Maternal dietary antigen avoidance duringpregnancy or lactation, or both, for preventing or treating atopic disease inthe child." Cochrane Database Syst Rev 2006: 3: CD000133.Lilja G, Dannaeus A, Falth-Magnusson K, Graff-Lonnevig V, Johansson SG,Kjellman NI <strong>and</strong> Oman H. "Immune response of the atopic woman <strong>and</strong>foetus: effects of high- <strong>and</strong> low-dose food allergen intake during latepregnancy." Clin Allergy 1988: 18(2): 131-42.Lilja G, Dannaeus A, Foucard T, Graff-Lonnevig V, Johansson SG <strong>and</strong> Oman H."Effects of maternal diet during late pregnancy <strong>and</strong> lactation on thedevelopment of atopic diseases in infants up to 18 months of age--in-vivoresults." Clin Exp Allergy 1989: 19(4): 473-9.Lilja G, Dannaeus A, Foucard T, Graff-Lonnevig V, Johansson SG <strong>and</strong> Oman H."Effects of maternal diet during late pregnancy <strong>and</strong> lactation on thedevelopment of IgE <strong>and</strong> egg- <strong>and</strong> milk-specific IgE <strong>and</strong> IgG antibodies ininfants." Clin Exp Allergy 1991: 21(2): 195-202.Pogoda JM, Preston-Martin S, Howe G, Lubin F, Mueller BA, Holly EA, FilippiniG, Peris-Bonet R, McCredie MR, Cordier S <strong>and</strong> Choi W. "An international casecontrolstudy of maternal diet during pregnancy <strong>and</strong> childhood brain tumorrisk: a histology-specific analysis by food group." Ann Epidemiol 2009: 19(3):148-60.Dietary guidelines for pregnant <strong>and</strong> <strong>breastfeeding</strong> women: evidence report206
Included StudiesEggsStudyOutcomes1. Cant 1985 Eczema in infants up to 6 months2. George 2005 “Breastfeeding”3. Giordano 2008 Cryptorchidism <strong>and</strong> hypospadias4. Haggarty 2009 Deprivation5. Herrick 2003 Cortisol concentrations in offspring aged 30 years6. Jensen 2004 Childhood acute lymphoblastic leukemia7. Lagiou 2006 Maternal pregnancy oestradiol, unconjugated oestriol, sex hormone binding globulin (SHBG), progesterone, prolactin8. Maconochie 2007 Miscarriage9. Miyake 2006 Postpartum depression10. Nwaru 2010 Allergic sensitisation in offspring by 5 years11. Saito 2010 Suspected atopic eczema in infants at 3-4 months12. Sausenthaler 2007 Allergic sensitisation, eczema at 2 yrs13. Vance 2004 Infant atopy up to 18 months14. Willers 2008 Wheeze, dyspnoea, prescription of inhaled steroids for respiratory problems, composite variable ‘asthma symptoms’ in the last12 months (measured longitudinally from 1 to 8 years age)Eggs207
Evidence SummariesMaternal Outcomes1. In a Scottish cohort study, no significant differences were seen between maternal intake ofeggs during pregnancy <strong>and</strong> deciles of deprivation2. In a US cohort study, maternal intake of eggs during pregnancy was associated with areduction in progesterone at 16 completed weeks GA: -4.4% change 95% CI -8.1 to -0.6 butnot at 27 completed weeks GA: -3.1% change 95% CI -6.8 to 0.83. In a UK case-control study, no significant associations were seen between maternal intake ofeggs during pregnancy <strong>and</strong> miscarriage: aOR 1.04 95% CI 0.87 to 1.24Congenital Anomalies4. In a Sicilian case-control study, no significant associations were seen between cases ofhypospadias <strong>and</strong>/or cryptorchidism <strong>and</strong> maternal intake of eggsN Level References1277 II Haggarty 2009277 II Lagiou 2006603cases;6116controls90 cases;202controlsIII-3 Maconochie 2007III-3 Giordano 2008Postnatal Outcomes5. In a US cohort study, lactating <strong>and</strong> nonlactating women consumed similar amounts of eggs 149 II George 20056. In a Japanese cohort study, postpartum depression was not significantly associated with eggintake during pregnancyChildhood – Asthma, Eczema <strong>and</strong> Other Allergy Outcomes7. In a subset of cohort study from the UK, there was no significant association betweenovalbumin concentrations in breastmilk <strong>and</strong> eczema in infant offspring at 15 weeks of age8. In a cohort study from Japan, there was no significant association between maternal eggconsumption during pregnancy <strong>and</strong> suspected atopic eczema in infants at 3-4 months ofage: adjusted p for trend = 0.749. In a German cohort study, there was no significant association between maternal eggconsumption during pregnancy <strong>and</strong>: eczema in infants at 2 years of age: aOR 0.81 95% CI 0.62 to 1.06; allergen sensitisation at 2 years of age: aOR 0.91 95% CI 0.56 to 1.2810. In a RCT from the UK, there were no significant differences between an egg avoidance or anormal diet during pregnancy for infant atopy at 18 months of age (p = 0.869)865 II Miyake 200619 II Cant 1985771infants3097infants136infantsII Saito 2010II Sausenthaler 2007II Vance 2004Dietary guidelines for pregnant <strong>and</strong> <strong>breastfeeding</strong> women: evidence report208
11. In a cohort study from the Netherl<strong>and</strong>s no significant associations were seen betweenamount of egg consumption during pregnancy <strong>and</strong> the following allergy outcomes in infantsfrom 1 to 8 years of age: Wheeze: aOR 0.96 95% CI 0.84 to 1.12 Dyspnoea: aOR 1.12 95% CI 0.80 to 1.25 Steroid use: aOR 1.01 95% CI 0.80 to 1.28 Asthma symptoms (composite of above): aOR 1.03 95% 0.88 to 1.2012. In a Finnish cohort study, there were no significant associations between egg consumptionduring pregnancy <strong>and</strong> allergic sensitisation in infants by 5 years of age for: Food allergens aOR 0.75% 95% CI 0.50 to 1.13 Inhalant allergens aOR 0.91 95% CI 0.64 to 1.29Other Childhood Outcomes13. In a US case-control study, childhood acute lymphoblastic leukemia was not associatedwith maternal egg intake during pregnancy: aOR 0.99 95% CI 0.83 to 1.18: mean consumption 3.99 [SD 1.67] serves per day14. In a cohort study from Scotl<strong>and</strong>, there was no significant association between eggconsumption during pregnancy <strong>and</strong> cortisol concentrations in offspring at 30 years of age2832children931children138cases;138controls251offspringII Willers 2008II Nwaru 2010III-3 Jensen 2004II Herrick 2003Eggs209
Evidence TablesReference Cant 1985Food typeEggsStudy typeProspective cohort study with concurrent comparison groupsLevel of evidence II (aetiology)SettingUKFundingAFRC/MRCParticipants19 exclusively breastfed infants less than 6 months old (most were 3 to 4 months old) – with eczema <strong>and</strong> without eczemaBaseline comparisons Differences in infant eczema diagnosis part of study designDietary assessment Detection of ovalbumin in breastmilkTimingMean 15 weeks postpartumComparisonOvalbumin present or absent in breastmilk; ovalbumin concentrationsOutcomesEczema in infantResults8/11 infants (72%) with eczema <strong>and</strong> a positive skin test reaction to egg had mothers with breastmilk containing ovalbumin;compared with 6/8 (75%) infants with normal skin <strong>and</strong> a negative skin test reaction to egg (pns)FollowupConfoundingRisk of biasRelevanceOther commentsMean ovalbumin concentrations in breastmilk :Infants with eczema (n = 11): 1.6 µg/LInfants without eczema (n = 8): 2.4 µg/L, pns13-17 weeks postpartumNo adjustment for potential confoundingModerate risk of bias; of 105 mother-infant pairs, 22 were found to have consumed complementary formula milk <strong>and</strong> were therefore excluded from thestudy; only 19/83 mothers given egg challenge test (not reported these women were selected)Possibly relevant to women in AustraliaDietary guidelines for pregnant <strong>and</strong> <strong>breastfeeding</strong> women: evidence report210
Reference George 2005Food typeEggsStudy typeProspective cohort studyLevel of evidence II (aetiology)SettingTexas, USFundingNot reportedParticipants149 Medicaid-qualified women (30% white, 24% African American, 46% Hispanic) – recruited from a larger study on postpartum weight retentionInclusion criteria: 18 years or older; non-Hispanic white, African American or Hispanic ethnicity; birth of a health term infant, fluency <strong>and</strong> literacy inEnglish; absence of pregnancy-related abnormalities <strong>and</strong> disease conditions.Baseline comparisons Significant differences between lactating <strong>and</strong> non-lactating women – higher parity, BMI <strong>and</strong> lower education levels in non-lactating women.Dietary assessment Semiquantitative FFQ to cover pregnancy <strong>and</strong> first six months postpartumTimingFFQ administered at 6 weeks <strong>and</strong> 6 months postpartumComparisonProportion of consumption of eggsOutcomesBreastfeeding (exclusive or partial at 6 months postpartum)Results Lactating women <strong>and</strong> nonlactating women consumed similar amount of eggs (p > 0.05)FollowupConfoundingRisk of biasRelevanceOther comments<strong>For</strong> both groups there was a significant decrease in egg consumption between pregnancy <strong>and</strong> the postpartum period (p < 0.05)6 months postpartumNo adjustment for potential confoundingModerate-to-high risk of bias; no attempt to control for confounding despite significant baseline differences between lactating <strong>and</strong> non-lactating women.Possibly relevant to low-income women in AustraliaMinimal reporting of resultsEggs211
Reference Giordano 2008Food typeEggsStudy typeCase-control studyLevel of evidence III-3 (aetiology)SettingSicily, ItalyFundingSicilian Congenital Malformation RegistryParticipants90 cases: 43 cases of hypospadias <strong>and</strong> 48 cases of cryptorchidism (both in one infant)202 controls: r<strong>and</strong>omly selected controls born in the same year <strong>and</strong> the same regionBirths between 1998 to 2003Baseline comparisons Low birthweight, low maternal education, mother’s history of gynaecological disease <strong>and</strong> father’s history of urogenital diseases differed significantlybetween cases <strong>and</strong> controlsSee confounding belowDietary assessment Interview on maternal diet <strong>and</strong> food frequenciesTimingFFQComparisonConsumption of eggs once a week or less/more than once a weekOutcomesHypospadias <strong>and</strong> cryptorchidismResultsEggsHypospadiascases controls OR≤ 1/week 17 (39.5%%) 67 (33.2%) 1.00>1/week 26 (60.5%) 135 (66.8%) 0.76 95% CI 0.39 to 1.50Cryptorchidismcases controls OR≤ 1/week 10 (20.8%) 67 (33.2%) 1.00>1/week 38 (79.2%) 135 (66.8%) 1.89 95% CI 0.89 to 4.02FollowupConfoundingRisk of biasRelevanceOther commentsHypospadias <strong>and</strong> cryptorchidismcases controls OR≤ 1/week 27 (30.0%) 67 (33.2%) 1.00>1/week 63 (70.0%) 135 (66.8%) 1.16 95% CI 0.68 to 1.98n/aResults for this food group were not presented as adjusted analysesModerate risk of bias: Participation rate of parents <strong>and</strong> data collection rate of cases was lower than that of controls (76% versus 91%); no adjustedresults presented for this food groupLikely to be reasonably relevant for Australian women, although hypospadias rates very high <strong>and</strong> unlikely that most Australian women will have suchhigh pesticide exposureRagusa region in Sicily is a region of intensive agriculture (involving high rates of pesticide <strong>and</strong> other chemical use) with high rates of hypospadias <strong>and</strong>cryptorchidismDietary guidelines for pregnant <strong>and</strong> <strong>breastfeeding</strong> women: evidence report212
Reference Haggarty 2009Dietary patterns EggsStudy typeProspective cohort studyLevel of evidence II (aetiology)SettingAberdeen, Scotl<strong>and</strong>FundingUK Food St<strong>and</strong>ards AgencyParticipants1277 sequentially enrolled pregnant women attending Aberdeen Maternity Hospital for ultrasound (a further 184 women were recruited later inpregnancy).Exclusions: diabetic women, women with multiple pregnancies, women who conceived as a result of fertility treatment, or clinical data not availableBaseline comparisons See confounding belowAssessmentFFQTimingAssessed at 19 weeks gestationComparisonIntake of eggs by deciles of deprivationOutcomesDeprivation (assessed using the Scottish Index of Multiple Deprivation)ResultsFollowupConfoundingRisk of biasRelevanceOther commentsDeprivationEggs: no significant differences seen between intake of eggs <strong>and</strong> deciles of deprivationTo neonatal period(Some?) analyses adjusted for energy intakeLow to moderate risk of bias: low attrition, some lack of detail in reporting of outcomesLikely to be relevant to Australian womenAbout 40-50% of the least deprived women reported taking folic acid supplements compared with about 20% for the most deprived women;Most birth outcome associations were reported by nutrient rather than food group;Not easy to deduce quantities of intake of foods (main graphs reported as change in intake by deprivation decile)Eggs213
Reference Herrick 2003Food groupsEggsStudy typeProspective cohortLevel of evidence II (aetiology)SettingMotherwell, Scotl<strong>and</strong>FundingDunhill Medical Trust, NIHParticipants251 men <strong>and</strong> women) whose mothers’ food intakes had been recorded during pregnancy during 1967 to 1968. These women had been advised to eat0.45 kg of red meat a day <strong>and</strong> to avoid carbohydrate-rich foods during pregnancyBaseline comparisons See confounding belowDietary assessment Mothers asked about consumption of 10 foodsTimingEarly pregnancy (≤ 20 weeks); late pregnancy (> 20 weeks)ComparisonNumber of eggs per weekOutcomesCortisol concentrations in offspring aged 30 yearsResultsCortisol (change per unit change in maternal egg consumption during pregnancy)No significant associationLength of followup 30 yearsConfoundingAnalyses adjusted for offspring’s gender, social class at birth, BMI, alcohol consumption, <strong>and</strong> activity levelRisk of biasModerate risk of bias: <strong>For</strong> the 1432 records from 1967-8 recorded liveborn, singleton births with complete names, birth measurements <strong>and</strong> ≥ 1 dietrecord. 965 offspring were alive <strong>and</strong> living locally; <strong>and</strong> after attrition or declining to participate, 251 (17.5%) were available for analysis.RelevanceVery high intake of meat <strong>and</strong> very low carbohydrate intake limits the relevance to current dietary intakes of Australian womenOther comments Authors state that “in the setting of advice to follow a pregnancy diet high in protein <strong>and</strong> low in carbohydrate, an unbalanced pattern of higher meat/fish<strong>and</strong> lower green vegetable consumption in late pregnancy leads to elevated cortisol concentrations in the offspring"Dietary guidelines for pregnant <strong>and</strong> <strong>breastfeeding</strong> women: evidence report214
Reference Jensen 2004Food typeEggsStudy typeCase controlLevel of evidence III-3 (aetiology)SettingCalifornia, USA (part of the Northern California Childhood Leukemia Study)FundingPHSParticipants138 matched cases <strong>and</strong> controls:Cases: Children under 15 years of age, with a parent who spoke English or Spanish, were resident in the study area at the time of diagnosis of acutelymphoblastic leukemia (ALL), with no prior diagnosis of cancerControls: identified from birth certificates matched to the case on date of birth, sex, maternal race, Hispanic ethnicity of mother or father, <strong>and</strong> county ofresidence at birthBaseline comparisons A priori potential confounders were identified as birthweight, <strong>breastfeeding</strong>, maternal age <strong>and</strong> education, parental occupation <strong>and</strong> smoking duringpregnancy – no evidence of confounding was seen for these variables. Also see Confounding below.Dietary assessment FFQTimingDietary intake to reflect the year before the index pregnancy (to indicate dietary status at the start of pregnancy)ComparisonServes of eggsOutcomesChildhood acute lymphoblastic leukemiaResultsEggs: aOR 0.99 95% CI 0.83 to 1.18: mean consumption 3.99 [SD 1.67] serves per day*Followupn/aConfoundingAnalyses were adjusted for variables previously shown to be significantly associated with ALL in the overall study – income, prior fetal loss, child’sexposure to other children under age five, <strong>and</strong> maternal exposure to indoor insecticides during pregnancy; along with portion size <strong>and</strong> energyconsumptionRisk of biasLow-moderate risk of bias: Of eligible cases identified from January 1995 to November 1999, 83% consented to participate; 69% of the eligible controlsagreed to participate. Of the 161 matched pairs, seven pairs were excluded as the respondent was not the biological mother, 16 pairs were excludeddue to questionable dietary questionnaire data, leaving 138 matched pairs (86%); some recall bias likelyRelevanceLikely to be relevant for Australian women, though some diet components may differ e.g. high bean consumptionOther comments *Some consumption levels seem high – possibly per week rather than per day?Eggs215
Reference Lagiou 2006Food typeEggsStudy typeProspective cohort studyLevel of evidence II (aetiology)SettingBoston, USAFundingNIHParticipants 277 pregnant women who were Caucasian, < 40 years old <strong>and</strong> having a parity of no more than two (recruited between March 1994 <strong>and</strong> October 1995).Exclusions: women who had taken any kind of hormonal medication during the index pregnancy, with a prior diagnosis of diabetes mellitus or thyroiddisease, or if the fetus had a known major anomaly.Dietary assessment FFQTimingMailed to women prior to a routine antenatal visit around 27 weeks GA, to reflect women’s dietary intake during the second trimester of pregnancyBaseline comparisons Women in the study likely to be older, better educated, primiparae, lower BMI <strong>and</strong> less likely to smoke than pregnant women in the general USpopulationComparison Frequency of egg consumption (mean 6.5 times per month; increment 7.4)OutcomesMaternal progesterone – women’s blood was taken at 16 <strong>and</strong> 27 completed weeks GA.ResultsMaternal progesterone16 completed weeks GA: -4.4% change 95% CI -8.1 to -0.627 completed weeks GA: -3.1% change 95% CI -6.8 to 0.8FollowupConfoundingRisk of biasRelevanceOther comments27 completed weeks GAAdjusted for age, parity, gender of offspring, smoking <strong>and</strong> GA at blood measurementLow to moderate risk of bias: 277 of 402 (68.9%) eligible women were included – 77 refused to participate, 9 were subsequently excluded because theindex pregnancy was terminated through a spontaneous or induced abortion, 2 were excluded because of twin birth <strong>and</strong> 10 were lost to follow-up afterthe initial meeting.Indirect outcomes for (risk of) breast cancerStudy authors postulate that the associations between breast cancer risk <strong>and</strong> increased birthweight are mediated through endocrine hormonesDietary guidelines for pregnant <strong>and</strong> <strong>breastfeeding</strong> women: evidence report216
Reference Maconochie 2007Food groupsEggsStudy typeCase-control study (postal survey sampled from the electoral roll – National Women’s <strong>Health</strong> Study)Level of evidence III-3 (aetiology)SettingUK general populationFundingNational Lottery Community Fund, Miscarriage AssociationParticipantsCases: 603 women aged 18 to 55 years whose most recent pregnancy had ended in first trimester miscarriage (< 13 weeks gestation);Controls: 6116 women aged 18 to 55 years whose most recent pregnancy had progressed beyond 12 weeksBaseline comparisons BMI < 18.5 was significantly associated with odds of miscarriageAlso see Confounding belowDietary Assessment questionnaireTimingDiet in the three months prior to conception <strong>and</strong> the first 12 weeks of pregnancyComparisonAt least twice weeklyOutcomesFirst trimester miscarriageResultsEggs twice weekly or moreCases Controls aOR (95% CI) aOR further adjusted for nauseaNo 323 (58%) 2888 (50%) 1.00 1.00Yes 238 (42%) 2871 (50%) 1.04 (0.87 to 1.24) 1.02 (0.85 to 1.24)Length of followup n/aConfoundingAdjusted for year of conception, maternal age, previous miscarriage <strong>and</strong> previous live birth; <strong>and</strong> further adjusted for nausea in the first 12 weeks ofpregnancyRisk of bias Low risk of bias: 88% of eligible women responding to stage 1 agreed to participate in the second stage of the study; <strong>and</strong> 71% responded to the stage 2questionnaire. 1071/7790 records (7508 women) were excluded (mostly due to index pregnancy being conceived prior to 1980), leaving 6719 records(86%) available for analysisRelevanceLikely to be relevant to Australian womenOther comments Women who suffered from nausea in the first 12 weeks of pregnancy were almost 70% less likely to miscarryEggs217
Reference Miyake 2006Food groupsEggsStudy typeProspective cohortLevel of evidence II (aetiology)SettingWomen who became pregnant in November 2001-March 2003 Neyagawa City, Osaka Prefecture <strong>and</strong> several surrounding municipalities (OsakaMaternal <strong>and</strong> Child <strong>Health</strong> Study, Japan)FundingGrant-in-Aid for Scientific Research (Government grant)Participants865 pregnant Japanese womenBaseline comparisons See Confounding belowDietary Assessment Dietary history questionnaire-self administeredTimingDiet survey for previous month at baseline (period of baseline not stated), EPDS at 2-9 months post partumComparisonDaily intake of eggsNote: other dietary intakes analysed: meat, fish, dairy products, total fat, saturated fatty acids, cholesterol, LA, ALA <strong>and</strong> AAOutcomes Postpartum depression (EPDS with postpartum depression when score ≥ 9)ResultsNo significant association between egg intake <strong>and</strong> postpartum depression on adjusted analysisLength of follow upConfoundingRisk of biasRelevanceOther comments2-9 months postpartumAdjusted for: age, gestation, parity, smoking, family structure, occupation, family income, education, changes in diet in previous month, season whenbaseline data collected, BMI, time of delivery, medical problems in pregnancy, baby’s sex, baby’s birthweightLow risk of bias: data for 865/1002 (86.5%) women available for analysisAustralian diets very different to Japanese - much less seafood intake in Australia <strong>and</strong> more white fish rather than fatty fishOriginally 1002 women enrolled only 865 completed (note: depressed persons less likely to participate), low rate of enrolment into study (17.2% of thoseeligible in Neyagawa)Dietary guidelines for pregnant <strong>and</strong> <strong>breastfeeding</strong> women: evidence report218
Reference Nwaru 2010Food typeEggsStudy typeProspective cohort studyLevel of evidence II (aetiology)SettingTampere, Finl<strong>and</strong>FundingAcademy of Finl<strong>and</strong>, Finnish Pediatric Research Foundation, the Juho Vainio Foundation, the Yrjo Jahnsson Foundation, Turku, Oulu <strong>and</strong> TampereUniversity Hospitals, JDRF, Novo Nordisk Foundation, EU Biomed 2 ProgramParticipants931 mother-infant pairs (children with human leukocyte antigen-conferred susceptibility to type 1 diabetes) participating in the Finnish type 1 DiabetesPrediction <strong>and</strong> Prevention (DIPP) Nutrition Study between September 1996 <strong>and</strong> October 1997Baseline comparisons See confounding belowDietary assessment FFQTimingFFQ given to women after birth, for return at the three month visit (FFQ intended to cover maternal diet during pregnancy <strong>and</strong> lactation)ComparisonAmount of egg consumptionOutcomesAllergic sensitisation in offspring by 5 years: food allergens (egg, cow’s milk, fish, wheat); inhalant allergens (house dust mite, cat, timothy grass, birch)ResultsEggFood allergensInhalant allergensOR 0.80 95% CI 0.55 to 1.16 OR 0.92 95% CI 0.66 to 1.27aOR 0.75 95% CI 0.50 to 1.13 aOR 0.91 95% CI 0.64 to 1.29FollowupConfoundingRisk of biasRelevanceOther commentsTo 5 yearsAdjusted for energy intake, place of birth, season of birth, sex of the child, number of siblings, gestational age at birth, parental asthma, parental allergicrhinitis, maternal age at birth, maternal smoking during pregnancy, maternal educationLow risk of bias: data available for 931/1175 (79.2%) children recruited – 108 did not participate in survey, a further 49 did not have IgE measurements,a further 87 had no FFQ or an incomplete FFQLikely to be relevant to Australian women; some differences in individual types of vegetables between Finl<strong>and</strong> <strong>and</strong> Australia28% of women took vitamin D supplements, 73% took iron supplements;HLA genotype not likely to have any impact on the development of allergic diseases.Eggs219
Reference Saito 2010Food typeEggsStudy typeProspective cohort studyLevel of evidence II (aetiology)SettingNeyagawa City, JapanFundingMinistry of Education, Culture, Sports, Science <strong>and</strong> Technology <strong>and</strong> <strong>Health</strong> <strong>and</strong> Labour Sciences, Ministry of <strong>Health</strong>, Labour <strong>and</strong> Welfare, JapanParticipants771 mother-child pairs recruited from November 2001 to March 2003 at any stage of pregnancy – mean GA 18 weeks (part of the Osaka Maternal <strong>and</strong>Child <strong>Health</strong> Study)Baseline comparisons See confounding belowDietary assessment Diet history questionnaire (DHQ)TimingDHQ to assess dietary habits during the preceding monthComparisonQuartiles of egg consumptionOutcomesSuspected atopic eczemaResultsSuspected atopic eczeman/N OR (95% CI) aOR (95% CI)Q1 (9.7 g/day) 17/192 1.00 1.00Q2 (22.9 g/day) 15/193 0.87 (0.42 to 1.79) 0.87 (0.40 to 1.89)Q3 (40.7 g/day) 19/193 1.12 (0.57 to 2.25) 1.37 (0.66 to 2.86)Q4 (61.3 g/day) 14/193 0.81 (0.38 to 1.68) 0.73 (0.33 to 1.61)FollowupConfoundingRisk of biasRelevanceOther commentsp value for trend (unadjusted): 0.76p value for trend (adjusted): 0.743-4 monthsAdjusted for maternal age, gestation at baseline, family income, maternal <strong>and</strong> paternal education, maternal <strong>and</strong> paternal history of asthma, atopiceczema <strong>and</strong> allergic rhinitis, mite allergen level from maternal bedclothes, vacuuming living room, mould in kitchen, changes in maternal diet in previousmonth, season when baseline data collected, baby’s older siblings, baby’s sex, baby’s birthweight, <strong>breastfeeding</strong> <strong>and</strong> bathing or showering infantLow risk of bias: Of 1002 eligible women, a final sample of 771 (77%) was available for analysisFish intake in Japan likely to be higher than in AustraliaDietary guidelines for pregnant <strong>and</strong> <strong>breastfeeding</strong> women: evidence report220
Reference Sausenthaler 2007Food groupsEggsStudy typeProspective cohort study: from the LISA birth cohortLevel of evidence II (aetiology)Setting4 German cities (Munich, Leipzig, Wesel, Bad Honnef)FundingFederal Ministry for Education, Science, Research <strong>and</strong> Technology, GermanyParticipants3097 newborns recruitedBaseline comparisons See Confounding belowDietary assessment FFQTimingMaternal diet during the last 4 weeks of pregnancy (obtained shortly after birth, median 3 days)ComparisonLow intake group as reference group compared with high intake of eggs (= 1-2 times a week)OutcomesAllergic sensitisation, eczema at 2 yrsResultsDoctor-diagnosed eczema any allergen sensitisation food allergens inhalant allergensAdjusted OR (95% CI)Eggs 0.81 (0.62, 1.06) 0.91 (0.56, 1.28) 0.93 (0.63, 1.38) 0.90 (0.53, 1.53)Length of followupConfoundingRisk of biasRelevanceOther comments2 yearsCrude <strong>and</strong> adjusted results reported (adjusted for study area, sex, maternal age, maternal smoking, level of parental education, exclusive <strong>breastfeeding</strong>≥ 4 months, parental history of atopic diseases, season of birth <strong>and</strong> all dietary variablesLow risk of bias: Two year data available for 2641/3097 children (85%): 433 lost to follow-up, 9 excluded due to chronic disease, 14 missing maternalFFQLikely to be reasonably similar to dietary intakes of Australian women in AustraliaEggs221
Reference Vance 2004Food groupsEggsStudy typeRCTLevel of evidence II (intervention)SettingSouthampton, UKFundingFood St<strong>and</strong>ards AgencyParticipants229 women with a personal or partner history of allergy (<strong>and</strong> 231 infants – 2 sets of twins);Exclusions: pregnancy complications, birds in the home, were egg allergic, had ongoing dietary restrictionsBaseline comparisons Not reportedDietary assessment FFQ <strong>and</strong> food diariesTimingFFQ detailing egg intake over the month prior to recruitment; food dairy kept during the week prior to recruitment to assess general nutrition adequacy(repeated at 24 <strong>and</strong> 32 weeks gestation); 7 day food diary for preceding week also repeated at 24 <strong>and</strong> 32 weeks gestationComparison Egg avoidance from second trimester of pregnancy (17 to 20 weeks gestation) until end of lactation (n = 115) versus unmodified health diet (n = 114)OutcomesInfant atopy at 6, 12 <strong>and</strong> 18 months of age – in a subgroup of 136 infants with IgG measurements at birthResultsAllergic phenotype in infant (egg avoidance v normal diet group)6 months: p = 0.79412 months: p = 0.45718 months: p = 0.126Atopy in infant (egg avoidance v normal diet group)6 months: p = 0.93812 months: p = 0.58218 months: p = 0.869Length of followupConfoundingRisk of biasRelevanceOther comments18 monthsn/aUnclear-moderate risk of bias: no details reported on method of allocation concealment, assessment of allergy outcomes was blinded; reason for IgGmeasurements in only 136/231 (58.9%) of infants not reportedLikely to be reasonably similar to dietary intakes of Australian women in AustraliaDietary guidelines for pregnant <strong>and</strong> <strong>breastfeeding</strong> women: evidence report222
Reference Willers 2008Food typeEggsStudy typeProspective cohort (longitudinal)Level of evidence II (aetiology)SettingNetherl<strong>and</strong>sFundingNetherl<strong>and</strong>s Organization for <strong>Health</strong> Research <strong>and</strong> Development, Netherl<strong>and</strong>s Organization for Scientific Research; Netherl<strong>and</strong>s Asthma Fund;Netherl<strong>and</strong>s Ministry of Spatial Planning, Housing, <strong>and</strong> the Environment; Netherl<strong>and</strong>s Ministry of <strong>Health</strong>, Welfare <strong>and</strong> Sport, GlaxoSmithKlineParticipants2,832 children (part of the Prevention <strong>and</strong> Incidence of Asthma <strong>and</strong> Mite Allergy (PIAMA) birth cohort studyBaseline comparisons See confounding belowDietary assessment FFQTimingFFQ administered at antenatal recruitment (mean gestational ages not reported) to cover dietary intake over the previous monthComparisonDaily (once per day or more) v 1-4 times a week or fewerOutcomesWheeze, dyspnoea, prescription of inhaled steroids for respiratory problems, composite variable ‘asthma symptoms’ in the last 12 months (measuredlongitudinally from 1 to 8 years age)Results Wheeze from 1 to 8 years age (n = 2818)OR 0.97 95% CI 0.84 to 1.12aOR 0.96 95% CI 0.84 to 1.12Dyspnoea from 1 to 8 years age (n = 2818)OR 1.10 95% CI 0.92 to 1.31aOR 1.12 95% CI 0.94 to 1.34Steroid use from 1 to 8 years age (n = 2818)OR 0.99 95% CI 0.79 to 1.25aOR 1.01 95% CI 0.80 to 1.28FollowupConfoundingRisk of biasRelevanceOther commentsAsthma symptoms (composite of previous three outcomes) from 1 to 8 years age (n = 2818)OR 1.02 95% CI 0.87 to 1.19aOR 1.03 95% CI 0.88 to 1.208 yearsThe child’s dietary data on fruit, vegetables, fish, eggs, full cream milk, butter <strong>and</strong> peanut butter consumption at 2 years of age were used to check forpotential confounding by the child’s diet. Results were adjusted by sex, maternal education, parental allergy, maternal smoking during pregnancy,smoking in the home at 8 years of age, <strong>breastfeeding</strong>, presence of older siblings, birthweight, maternal overweight 1 year after pregnancy, maternalsupplement use during pregnancy, region <strong>and</strong> study arm (intervention or natural history arm).Moderate risk of bias: Initial study population of 4,146 mothers dropped to 2,832 participants with complete data (68.3%) (pregnancy questionnaire, atleast one of the outcome time points <strong>and</strong> all confounders). Participants with complete data were more likely to have a high education level, to have dailydairy <strong>and</strong> fruit intake during pregnancy <strong>and</strong> to have breastfed <strong>and</strong> less likely to have maternal asthma or maternal atopy, smoked during pregnancy, befrom a south western region compared with participants who did not have complete data.Dietary intakes likely to be different from Australian e.g. low fish consumption in study participantsNot clear when women assessed their diet during pregnancy;83% of pregnant women used supplements (50% used folic acid/iron)Eggs223
ReferencesCant A, Marsden RA <strong>and</strong> Kilshaw PJ. "Egg <strong>and</strong> cows' milk hypersensitivity inexclusively breast fed infants with eczema, <strong>and</strong> detection of egg protein inbreast milk." Br Med J (Clin Res Ed) 1985: 291(6500): 932-35.George GC, Hanss-Nuss H, Milani TJ <strong>and</strong> Freel<strong>and</strong>-Graves J H. "Food choicesof low-income women during pregnancy <strong>and</strong> postpartum." J Am Diet Assoc2005: 105(6): 899-907.Giordano F, Carbone P, Nori F, Mantovani A, Taruscio D <strong>and</strong> Figa-Talamanca I."Maternal diet <strong>and</strong> the risk of hypospadias <strong>and</strong> cryptorchidism in theoffspring." Paediatr Perinat Epidemiol 2008: 22(3): 249-60.Haggarty P, Campbell DM, Duthie S, Andrews K, Hoad G, Piyathilake C <strong>and</strong>McNeill G. "Diet <strong>and</strong> deprivation in pregnancy." Br J Nutr 2009: 102(10):1487-97.Herrick K, Phillips DI, Haselden S, Shiell AW, Campbell-Brown M <strong>and</strong> GodfreyK M. "Maternal consumption of a high-meat, low-carbohydrate diet in latepregnancy: relation to adult cortisol concentrations in the offspring." J ClinEndocrinol Metab 2003: 88(8): 3554-60.Jensen CD, Block G, Buffler P, Ma X, Selvin S <strong>and</strong> Month S. "Maternal dietaryrisk factors in childhood acute lymphoblastic leukemia (United States)."Cancer Causes Control 2004: 15(6): 559-70.Lagiou P, Lagiou A, Samoli E, Hsieh CC, Adami HO <strong>and</strong> Trichopoulos D. "Dietduring pregnancy <strong>and</strong> levels of maternal pregnancy hormones in relation tothe risk of breast cancer in the offspring." Eur J Cancer Prev 2006: 15(1): 20-6.Maconochie N, Doyle P, Prior S <strong>and</strong> Simmons R. "Risk factors for firsttrimester miscarriage--results from a UK-population-based case-controlstudy." BJOG 2007: 114(2): 170-86.Dietary guidelines for pregnant <strong>and</strong> <strong>breastfeeding</strong> women: evidence reportMiyake Y, Sasaki S, Yokoyama T, Tanaka K, Ohya Y, Fukushima W, Saito K,Ohfuji S, Kiyohara C <strong>and</strong> Hirota Y. "Risk of postpartum depression in relationto dietary fish <strong>and</strong> fat intake in Japan: the Osaka Maternal <strong>and</strong> Child <strong>Health</strong>Study." Psychol Med 2006: 36(12): 1727-1735.Nwaru B I, Ahonen S, Kaila M, Erkkola M, Haapala AM, Kronberg-Kippila C,Veijola R, Ilonen J, Simell O, Knip M <strong>and</strong> Virtanen SM. "Maternal diet duringpregnancy <strong>and</strong> allergic sensitization in the offspring by 5 yrs of age: aprospective cohort study." Pediatr Allergy Immunol 2010: 21(1 Pt 1): 29-37.Saito K, Yokoyama T, Miyake Y, Sasaki S, Tanaka K, Ohya Y <strong>and</strong> Hirota Y."Maternal meat <strong>and</strong> fat consumption during pregnancy <strong>and</strong> suspected atopiceczema in Japanese infants aged 3-4 months: the Osaka Maternal <strong>and</strong> Child<strong>Health</strong> Study." Pediatr Allergy Immunol 2010: 21(1 Pt 1): 38-46.Sausenthaler S, Koletzko S, Schaaf B, Lehmann I, Borte M, Herbarth O, vonBerg A, Wichmann HE <strong>and</strong> Heinrich J. "Maternal diet during pregnancy inrelation to eczema <strong>and</strong> allergic sensitization in the offspring at 2 y of age."Am J Clin Nutr 2007: 85(2): 530-537.Vance GH, Grimshaw KE, Briggs R, Lewis SA, Mullee MA, Thornton CA <strong>and</strong>Warner JO. "Serum ovalbumin-specific immunoglobulin G responses duringpregnancy reflect maternal intake of dietary egg <strong>and</strong> relate to thedevelopment of allergy in early infancy." Clin Exp Allergy 2004: 34(12): 1855-61.Willers SM, Wijga AH, Brunekreef B, Kerkhof M, Gerritsen J, Hoekstra MO, deJongste JC <strong>and</strong> Smit HA. "Maternal food consumption during pregnancy <strong>and</strong>the longitudinal development of childhood asthma." Am J Respir Crit CareMed 2008: 178(2): 124-31.224
Included StudiesFats <strong>and</strong> OilsStudyOutcomes1. Calvani 2006 Allergy; food sensitisation2. Fard 2004 (RCT) Maternal fat intake at childbirth <strong>and</strong> during lactation; birthweight <strong>and</strong> height; weight <strong>and</strong> height at one year, infant cholesterol3. George 2005 “Breastfeeding”4. Giordano 2008 Hypospadias <strong>and</strong> cryptorchidism5. Gonzalez-Clemente GDM20076. Haggarty 2009 Deprivation, preterm birth7. Haugen 2008 Preterm birth8. Khoury 2005 Preterm birth9. Knox 1972 Anencephalus10. Mellies 1978; 1979 Cholesterol <strong>and</strong> phytosterol in maternal plasma, breast milk <strong>and</strong> infant plasma(RCT)11. Mikkelsen 2008 Preterm birth12. Nwaru 2010 Allergic sensitisation by 5 years13. Petridou 2005 Childhood acute lymphoblastic leukemia14. Petridou 1998 Cerebral palsy at 8 years15. Sausenthaler 2007 Allergic sensitisation, eczema at 2 years of age16. Signorello 1998 Hyperemesis gravidarum17. Stuebe 2009 GWG18. Willers 2007 Allergy symptomsFats <strong>and</strong> Oils225
Evidence SummariesMaternal Outcomes1. In a Scottish cohort study, total maternal fat consumption during pregnancy did not differsignificantly between deciles of deprivation on regression analysis2. In a Norwegian RCT, women in the “cholesterol-lowering” diet group gained less weight inmid-late pregnancy than women keeping to their usual diets (MD 0.6 kg 95% CI 0.05 to 1.1)3. In a US cohort study, maternal consumption of fried foods (mean serve/day of 0.11) wasassociated with excessive gestational weight gain: aOR 4.24 95% CI 1.04 to 17.18 per servingper day: multivariate logistic regression model4. In a cross-sectional study from Spain, cholesterol intake at time of diagnosis was associatedwith a significantly increased risk of GDM, but this association was not apparent formonounsaturated, polyunsaturated or saturated fats: aOR 1.88 95% CI 1.09 to 3.23 of GDM for each 50 mg/1000 kcal increase of cholesterolintake5. In a US case-control study, hyperemesis gravidarum was associated with a maternal diet inthe year before pregnancy which was high in total fat (> 72 g/dayZ; aOR 2.9 95% CI 1.4 to 6.0per 25 g/day increase) <strong>and</strong> saturated fat (> 28 g/day; aOR 5.4 95% CI 2.0 to 14.8 per 15g/day increase)Birth Outcomes6. In a Scottish cohort study, increased rates of preterm birth were significantly associated withmaternal diets during pregnancy which were rich in fat: aOR 1.51 95% CI 1.10 to 2.017. In a cohort study from Norway, no association was seen between preterm birth <strong>and</strong>maternal intake of olive or canola oil: aOR 1.00 95% CI 0.86 to 1.16 (≥ 5 versus < 5 times aday)8. In a Danish cohort study, no association was seen between preterm birth <strong>and</strong> maternalintake of olive or canola oil: aOR 0.93 95% CI 0.84 to 1.04 (use versus no use of oil)9. In a Norwegian RCT, a “cholesterol-lowering” diet during pregnancy, compared with usualdiet, significantly reduced the risk of preterm birth: RR 0.10 95% CI 0.01 to 0.7710. In a RCT from Iran, no evidence of effect of a fat modified diet for women during pregnancy<strong>and</strong> lactation was seen on birthweight, length at birth, weight or height of infant at oneyearCongenital AnomaliesN Level References1277 II Haggarty 2009290 II Khoury 2005(RCT)1338 II Stuebe 2009335 IV Gonzalez-Clemente 200744 cases; 87controlsIII-3 Signorello 19981277 II Haggarty 200925,256 II Haugen 200835,350 II Mikkelsen 2008290 II(RCT)180 II(RCT)Khoury 2005Fard 2004Dietary guidelines for pregnant <strong>and</strong> <strong>breastfeeding</strong> women: evidence report226
11. In an Italian case-control study: hypospadias or cryptorchidism was not associated with maternal consumption of dressingswith animal fat during pregnancy; cryptorchidism (but not hypospadias) was associated with frequent maternal consumptionof fried foods during pregnancy (aOR 1.94 95% CI 1.00 to 3.75 – often versus rarely or never)12. In a Scottish case-control study, maternal intake of icecream during pregnancy was positivelyassociated with cases of anencephalus: r = +0.60 after a lag interval of five monthsBreastfeeding13. In a US cohort study, no significant differences were seen between lactating <strong>and</strong>nonlactating women on their postpartum consumption of foods with added fats (potato <strong>and</strong>corn chips; butter; margarine; <strong>and</strong> French fries, hash browns)Asthma <strong>and</strong> Allergy Outcomes14. In a retrospective cohort study from Italy, food or inhalant sensitisations in children(median age of 5) were not associated with maternal intake of either butter or margarineduring pregnancy (≤ 1 serve/month versus ≥ 2-3 serves/week)15. In a Finnish cohort study, no significant associations were seen between food or inhalantallergen sensitisation in infants up to 5 years of age <strong>and</strong> dietary fats overall or butter <strong>and</strong>butter spreads, margarine or low fat spreads, <strong>and</strong> oils16. In a German cohort study, increased rates of eczema were associated with the following high maternal intakes duringpregnancy: margarine (aOR 1.49 95% CI 1.08 to 2.04; ≥ 4 times a week) <strong>and</strong> vegetable oils(aOR 1.48 95% CI 1.14 to 1.91; 3-4 times a week) but not with butter (aOR 1.08 95% 0.79 to1.46) or deep frying vegetable fat (aOR 1.10 95% CI 0.87 to 1.41) allergen sensitisation was not associated with maternal fat <strong>and</strong> oil intake during pregnancyexcept for inhalant allergen sensitisation <strong>and</strong> deep frying vegetable fat (aOR 1.61 95% CI 1.02to 2.54; ≥ 2-3 times/month)17. In a Scottish cohort study, respiratory <strong>and</strong> atopic outcomes in children up to 5 years of agewere not associated with maternal intake of either butter or margarine/low fat spreadduring pregnancyOther Childhood Outcomes18. In a RCT from Iran, infant lipid profiles at one year of age were improved (significantly lesstotal cholesterol, triglyceride <strong>and</strong> significantly more LDL-cholesterol) for children of womenon a fat-modified (reduced) diet during pregnancy <strong>and</strong> lactation90 cases; 202controlsIII-3 Giordano 2008Not reported III-3 Knox 1972149 II George 2005988 children III-2 Calvani 2006931 children II Nwaru 20093097children1212children180 II(RCT)II Sausenthaler 2007II Willers 2007Fard 2004Fats <strong>and</strong> Oils227
19. In a US RCT, there was no evidence of an effect on infant cholesterol concentrations twomonths after birth for a low cholesterol diet compared with a high cholesterol diet20. In a Greek case-control study, no association was seen between acute lymphoblasticleukemia in children up to five years of age <strong>and</strong> maternal intake of butter or margarine (pfor trend = 0.07; highest tertile median 21 g/day)21. In a Greek case-control study, cerebral palsy in children up to eight years of age was notassociated with maternal consumption of fats <strong>and</strong> oils during pregnancy; regression analysisfor each unit (once a week) aOR 1.08 95% CI 0.84 to 1.4014 II(RCT)131 cases<strong>and</strong> 131controls138 cases;138 controlsMellies 1978/9III-3 Petridou 2005III-3 Petridou 1998Dietary guidelines for pregnant <strong>and</strong> <strong>breastfeeding</strong> women: evidence report228
Evidence TablesReference Calvani 2006Food typeButter; margarineStudy typeRetrospective cohort studyLevel of evidence III-2 (aetiology)SettingRome, ItalyFundingNot reportedParticipants988 offspring of allergic (n = 295) <strong>and</strong> non-allergic (n = 693) mothers; recruited from outpatient allergy clinics between September 2001 <strong>and</strong> March2002; with a median age of 5 years (range of 17 years); part of the APAL study744/988 children were affected by atopic diseases (asthma, rhinitis, eczema) <strong>and</strong> the remaining 244 were attending due to respiratory, gastrointestinalsymptoms, or skin disease;Exclusions: immunodeficiency, connective tissue disease, or chronic respiratory tract disease other than asthmaBaseline comparisons See Confounding belowDietary assessment QuestionnaireTimingAt recruitment, women were asked to recall their intake of fish, butter <strong>and</strong> margarine during pregnancyComparison≤ 1 serve/month (reference) v 1 serve/week v ≥ 2-3 serves/weekOutcomesAllergic sensitisationsResultsButterFood sensitisation (positive skin prick test mainly for raw cow’s milk <strong>and</strong> egg-white)n/N (%) OR (95% CI) aOR (95% CI)* p-value for trendAllergic mothers≤ 1 serve/month 19/156 (12.2%) 1 1 0.801 serve/week 6/72 (8.3) 0.65 (0.25 to 1.71) 0.49 (0.16 to 1.43)≥2-3 serves/week 6/49 (12.2%) 1.00 (0.37 to 2.67) 0.84 (0.26 to 2.71)*adjusted for age, occupation <strong>and</strong> eczemaNon-allergic mothers≤ 1 serve/month 29/373 (7.8) 1 1 0.461 serve/week 11/168 (6.5%) 0.83 (0.40 to 1.70) 0.91 (0.37 to 2.25)≥2-3 serves/week 5/86 (5.8%) 0.73 (0.27 to 1.95) 0.92 (0.27 to 3.13)*adjusted for age, gestation age, maternal occupation, oculorhinitis <strong>and</strong> eczemaInhalant sensitation (positive skin prick test for a range of allergens)n/N OR (95% CI) aOR (95% CI)* p-value for trendAllergic mothers≤ 1 serve/month 76/156 (48.7%) 1 1 0.771 serve/week 25/72 (34.7% 0.55 (0.31 to 0.99) 0.27 (0.10 to 0.73)≥2-3 serves/week 28/49 (57.1%) 1.40 (0.73 to 2.68) 1.59 (0.51 to 4.97)*adjusted for age, allergy clinics, maternal age, preterm labour, occupation, asthma, oculorhinitis <strong>and</strong> eczemaNon-allergic mothers≤ 1 serve/month 150/373 (40.2%) 1 1 0.151 serve/week 88/168 (52.4%) 1.6(1.13 to 2.35) 1.73 (1.00 to 2.99)≥2-3 serves/week 37/86 (43%) 1.12 (0.69 to 1.80) 0.81 (0.38 to 1.70)Fats <strong>and</strong> Oils229
*adjusted for age, gender, number of older siblings, allergy clinics, maternal age, number of pregnancies, maternal occupation,paternal atopy, asthma, oculorhinitisMargarineFood sensitisation (positive skin prick test mainly for raw cow’s milk <strong>and</strong> egg-white)n/N (%) OR (95% CI) aOR (95% CI)* p-value for trendAllergic mothers≤ 1 serve/month 24/214 (11.2%) 1 1 0.671 serve/week 2/34 (5.9%) 0.49 (0.11 to 2.19) 0.26 (0.02 to 2.54)≥2-3 serves/week 4/22 (18.2%) 1.75 (0.54 to 5.63) 2.24 (0.59 to 8.49)*adjusted for age, occupation <strong>and</strong> eczemaNon-allergic mothers≤ 1 serve/month 39/528 (7.4%) 1 0.451 serve/week 3/43 (7.0%) 0.94 (0.27 to 3.17) 1.63 (0.38 to 6.87)≥2-3 serves/week 2/47 (4.3%) 0.55 (0.13 to 2.38) 0.51 (0.06 to 4.32)*adjusted for age, gestation age, maternal occupation, oculorhinitis <strong>and</strong>eczemaInhalant sensitisation (positive skin prick test for a range of allergens)n/N OR (95% CI) aOR (95% CI)* p-value for trendAllergic mothers≤ 1 serve/month 100/214 (46.7%) 1 1 0.851 serve/week 13/34 (38.2%) 0.70 (0.33 to 1.48) 0.39 (0.10 to 1.48)≥2-3 serves/ week 12/22 (54.5%) 1.36 (0.56 to 3.30) 3.02 (0.52 to 17.2)*adjusted for age, allergy clinics, maternal age, preterm labour, occupation, asthma, oculorhinitis <strong>and</strong> eczemaNon-allergic mothers≤ 1 serve/month 229/58 (43.4%) 1 1 0.541 serve/week 25/43(58.1%) 1.81 (0.96 to 3.40) 1.28 (0.53 to 3.07)≥2-3 serves/ week 20/47 (42.6%) 0.69 (0.52 to 1.76) 0.52 (0.19 to 1.43)*adjusted for age, gender, number of older siblings, allergy clinics, maternal age, number of pregnancies, maternaloccupation,paternal atopy, asthma, oculorhinitisFollowupNAConfoundingAnalyses only adjusted for a limited number of factors; different factors were used for the analyses of allergic <strong>and</strong> non-allergic mothers; <strong>and</strong> for food <strong>and</strong>inhalant sensitisations.Risk of bias Moderate risk of bias: recall bias likely for women remembering diet during a pregnancy up to 17 years earlier; data for maternal atopy available for 988of the 1044 consecutively recruited children (94.6%); children attending allergy clinics likely to be different for a general population of children.RelevanceDiets of pregnant Italian women may differ from those of Australian women e.g. lower levels of maternal margarine <strong>and</strong> butter consumption in this studyOther comments Clinical significance of skin prick tests?; Wide age range (1 to 18?) makes interpretation of allergic sensitisations difficultDietary guidelines for pregnant <strong>and</strong> <strong>breastfeeding</strong> women: evidence report230
Reference Fard 2004Dietary patterns See comparison belowStudy typeRCTLevel of evidence II (intervention)SettingIsfahan Cardiovascular Research Center, IranFundingNot reportedParticipants180 pregnant women, aged 18-35 years, at 4 month’s gestation with atherogenic diets (total fat ≥ 30% or saturated fat intake ≥ 10% of daily energyintake or whose daily cholesterol intake was > 300 mg)Exclusions: diabetic women, history of heart disease, hypothyroidism, hyperthyroidism, severe obesity (≥ 40) or having twinsBaseline comparisons n/aAssessmentn/aTimingIntervention during pregnancy <strong>and</strong> lactation (up to one year of birth)ComparisonFat modified diet (saturated fatty acid < 10%; monosaturated fatty acids 10-15%; polyunsaturated fat up to 10%; cholesterol < 300 mg/day) <strong>and</strong> dietaryadvice during pregnancy versus dietary advice aloneOutcomesMaternal fat intake, serum lipids of infants at birth; <strong>and</strong> one year of ageResults Fat intake of women at childbirth (mean, SD) Intervention (n = 90) Control (n = 90) PTotal fat (% energy) 27.5 [2.4] 28.5 [2.2] 0.004Saturated fatty acid (% energy) 5.7 [3.6] 14.7 [6.1] 0.000Monounsaturated fatty acid (% energy) 13.6 [4.1] 6.9 [3.2] 0.000Polyunsaturated fatty acid (% energy) 9.2 [3.6] 5.3 [3.9] 0.000Cholesterol (mg) 261 [112] 289 [149] 0.15Fat intake of women during lactation (mean, SD)Total fat (% energy) 27.3 [5.8] 25.8 [10.4] pnsSaturated fatty acid (% energy) 5.8 [3.4] 14.8 [7.6] 0.000Monounsaturated fatty acid (% energy) 12.6 [4.7] 7.1 [4.4] 0.000Polyunsaturated fatty acid (% energy) 8.9 [3.1] 3.9 1.6] 0.000Cholesterol (mg) 272 [143] 279 [151] pnsPlacental lipid profile (mg/dl (mean, SD))Total cholesterol 70.3 [15.9] 81.4 [17.2] 0.009Triglyceride 85.3 [16.7] 97.5 [18.2] 0.00LDL-cholesterol 27.8 [15.2] 34.8 [17.1] 0.04HDL-cholesterol 25.8 [4.3] 27 [5.7] 0.35Non-HDL-cholesterol 44.5 [7.2] 54.5 [8.1] 0.02Infant lipid profile (at one year) (mg/dl, (mean, SD))Total cholesterol 145.7 [51.4] 161.4 [56.2] 0.03Triglyceride 90.1 [13.8] 98.3 [33.1] 0.02LDL-cholesterol 85.6 [20.4] 92.3 [19.6] 0.05HDL-cholesterol 32.1 [8.7] 32.6 [8.5] 0.43Non-HDL-cholesterol 113.6 [30.2] 128.8 [34.7] 0.04Birthweight (kg) 3.5 [2.7] 3.6 [3.2] pnsFats <strong>and</strong> Oils231
Height at birth (cm) 50.4 [10.8] 51.2 [12.2] pnsWeight at one year (kg) 11.4 [3.5] 12.1 [4.8] pnsFollowupConfoundingRisk of biasRelevanceOther commentsHeight at one year (cm) 77.3 [18.7] 80.9 [20.1] pnsUntil children reached one year of agen/aUnclear risk of bias: r<strong>and</strong>omisation method described only as “divided into two groups r<strong>and</strong>omly”Likely to be reasonably relevant, though Iranian diet may differ from that of Australian womenDietary guidelines for pregnant <strong>and</strong> <strong>breastfeeding</strong> women: evidence report232
Reference George 2005Food typeFoods with added fats: potato <strong>and</strong> corn chips; butter; margarine; French fries, hash brownsStudy typeProspective cohort studyLevel of evidence II (aetiology)SettingTexas, USFundingNot reportedParticipants149 Medicaid-qualified women (30% white, 24% African American, 46% Hispanic) – recruited from a larger study on postpartum weight retentionInclusion criteria: 18 years or older; non-Hispanic white, African American or Hispanic ethnicity; birth of a healthy term infant, fluency <strong>and</strong> literacy inEnglish; absence of pregnancy-related abnormalities <strong>and</strong> disease conditions.Baseline comparisons Significant differences between lactating <strong>and</strong> non-lactating women – higher parity, BMI <strong>and</strong> lower education levels in non-lactating women.Dietary assessment Semiquantitative FFQ to cover pregnancy <strong>and</strong> first six months postpartumTimingFFQ administered at 6 weeks <strong>and</strong> 6 months postpartumComparisonProportion of consumption of different types of foods with added fatsOutcomesBreastfeeding (exclusive or partial at 6 months postpartum)ResultsNo significant differences seen between lactating <strong>and</strong> lactating women on their postpartum consumption of potato <strong>and</strong> corn chips; butter; margarine;French fries, hash brownsFollowup6 months postpartumConfoundingNo adjustment for potential confoundingRisk of biasModerate-to-high risk of bias; no attempt to control for confounding despite significant baseline differences between lactating <strong>and</strong> non-lactating women.RelevancePossibly relevant to low-income women in AustraliaOther comments Minimal reporting of resultsFats <strong>and</strong> Oils233
Reference Giordano 2008Food typeFats <strong>and</strong> oils: dressings with animal fat (lard, butter etc), fried foodsStudy typeCase-control studyLevel of evidence III-3 (aetiology)SettingSicily, ItalyFundingSicilian Congenital Malformation RegistryParticipants90 cases: 43 cases of hypospadias <strong>and</strong> 48 cases of cryptorchidism (both in one infant)202 controls: r<strong>and</strong>omly selected controls born in the same year <strong>and</strong> the same regionBirths between 1998 to 2003Baseline comparisons Low birthweight, low maternal education, mother’s history of gynaecological disease <strong>and</strong> father’s history of urogenital diseases differed significantlybetween cases <strong>and</strong> controlsSee confounding belowDietary assessment Interview on maternal diet <strong>and</strong> food frequenciesTimingFFQComparisonConsumption of dressings with animal fat once a week or less vs more than once a week;Consumption of fried foods never or rarely vs oftenOutcomesHypospadias <strong>and</strong> cryptorchidismResultsDressings with animal fatHypospadiasCases Controls ORNo 40 (93.0%) 178 (88.1%) 1.00Yes 3 (7.0%) 24 (11.9%) 0.56 95% CI 0.16 to 1.94CryptorchidismNo 44 (91.7%) 178 (88.1%) 1.00Yes 4 (8.3%) 24 (11.9%) 0.67 95% CI 0.22 to 2.04Hypospadias <strong>and</strong> cryptorchidismNo 83 (92.2%) 178 (88.1%) 1.00Yes 7 (7.8%) 24 (11.9%) 0.63 95% CI 0.26 to 1.51Fried food: adjusted analysis*aORHypospadiasOften 0.78 95% CI 0.35 to 1.74CryptorchidismOften 1.94 95% CI 1.00 to 3.75Hypospadias <strong>and</strong>cryptorchidismOften 1.27 95% CI 95% CI 0.73 to 2.20FollowupConfoundingn/a*Fried food was were additionally adjusted for mother’s age, parity, education, gynaecological diseases; paternal urogenital diseases, <strong>and</strong> use ofpesticides; birthweightDietary guidelines for pregnant <strong>and</strong> <strong>breastfeeding</strong> women: evidence report234
Risk of bias Moderate risk of bias: Participation rate of parents <strong>and</strong> data collection rate of cases was lower than that of controls (76% versus 91%)RelevanceLikely to be reasonably relevant for Australian women, although hypospadias rates very high <strong>and</strong> unlikely that most Australian women will have suchhigh pesticide exposureOther comments Ragusa region in Sicily is a region of intensive agriculture (involving high rates of pesticide <strong>and</strong> other chemical use) with high rates of hypospadias <strong>and</strong>cryptorchidismFats <strong>and</strong> Oils235
Reference Gonzalez-Clemente 2007Dietary patterns Total fat, saturated fat, monounsaturated fat, polyunsaturated fat; cholesterolStudy typeCross-sectional studyLevel of evidence IV (aetiology)SettingBarcelona, SpainFundingInstitut Universitari Parc Tauli; Instituto de Salud Carlos III, Ministerio de Sanidad y Consumo, SpainParticipants335 pregnant women, consecutively referred for gestational diabetes mellitus screening (93 between 14 to 18 weeks gestation <strong>and</strong> the remainderbetween 18 <strong>and</strong> 28 weeks gestation)Exclusions: pregnant women known to have diabetes mellitus or a disease affecting glucose metabolismBaseline comparisons See confounding belowAssessmentFFQTimingAssessed at screening for gestational diabetes mellitus, to reflect dietary intake in the previous yearComparisonIntake of saturated, polyunsaturated <strong>and</strong> monounsaturated fat; <strong>and</strong> cholesterolOutcomesGDMResults GDM no GDM pSaturated fat (% total kcal) 11.2 [SEM 0.1] 11.2 [SEM 0.2] 0.99Polyunsaturated fat (% total kcal) 5.7 [SEM 0.1] 5.7 [SEM 0.2] 0.84Monounsaturated fat (% total kcal) 20.0 [SEM 0.2] 20.1 [SEM 0.5] 0.89Cholesterol (mg/100 kcal) 134.5 [SEM 1.6] 145.3 [SEM 4.5] 0.03FollowupConfoundingRisk of biasRelevanceOther commentsCholesterol intake (multiple logistic regression analysis)*aOR 1.88 95% CI 1.09 to 3.23 of GDM for each 50 mg/1000 kcal increase of cholesterol intakeTo 28 weeks gestation*adjusted for age, BMI before pregnancy, family history of type 2 diabetes, previous GDM, protein intake, carbohydrate intake, fat intake, saturated,polyunsaturated <strong>and</strong> monounsaturated fat intake, fibre intake <strong>and</strong> trans unsaturated fat intakeLow risk of bias: women were consecutively recruitedOf some relevance to Australian women, although diet composition of Spanish women likely to have some differencesA high cholesterol intake was the only dietary factor associated with a diagnosis of GDM in this group of pregnant women on a Mediterranean diet (richin monosaturated fat)Dietary guidelines for pregnant <strong>and</strong> <strong>breastfeeding</strong> women: evidence report236
Reference Haggarty 2009Dietary patterns Total fat, saturated fat, monounsaturated fat, polyunsaturated fat; fried potatoesStudy typeProspective cohort studyLevel of evidence II (aetiology)SettingAberdeen, Scotl<strong>and</strong>FundingUK Food St<strong>and</strong>ards AgencyParticipants1277 sequentially enrolled pregnant women attending Aberdeen Maternity Hospital for ultrasound (a further 184 women were recruited later inpregnancy).Exclusions: diabetic women, women with multiple pregnancies, women who conceived as a result of fertility treatment, or clinical dat not availableBaseline comparisons See confounding belowAssessmentFFQTimingAssessed at 19 weeks gestationComparisonDeciles of deprivationOutcomesDeprivation (assessed using the Scottish Index of Multiple Deprivation);Low birthweight (defined as < 2500 g or lowest decile for birthweight z score adjusted for gestational age, sex <strong>and</strong> parity)Preterm birth (< 37 weeks)Admission to neonatal unitResultsDeprivationPattern for dietary fat was complicated, with total fat, saturated, monounsaturated, <strong>and</strong> polyunsaturated fat following a biphasic relationship with“deprivation decile” i.e. higher for both low <strong>and</strong> high deprivation compared with the mid ranges of deprivationTotal fat consumption did not differ significantly between deciles of deprivation on regression analysisFried potatoes: significantly higher intake with higher levels of deprivation (p < 0.001)FollowupConfoundingRisk of biasRelevanceOther commentsPreterm birth: aOR for diets rich in fat: 1.51 95% CI 1.10 to 2.01To neonatal period(Some?) analyses adjusted for energy intakeLow to moderate risk of bias: low attrition, some lack of detail in reporting of outcomesLikely to be relevant to Australian womenAbout 40-50% of the least deprived women reported taking folic acid supplements compared with about 20% for the most deprived women;Most birth outcome associations were reported by nutrient rather than food group;Not easy to deduce quantities of intake of foods (main graphs reported as change in intake by deprivation decile)Fats <strong>and</strong> Oils237
Reference Haugen 2008Dietary patterns Olive/canola oil as part of Mediterranean-type diet (2 or more serves of fish per week)Study typeProspective cohort studyLevel of evidence II (aetiology)SettingNorway (part of the Norwegian Mother <strong>and</strong> Child Cohort Study (MoBa))FundingNorwegian Ministry of <strong>Health</strong>, NIH/NINDS, Norwegian Research Council/FUGE, EU FP& consortium, Metabolic Programming (EARNEST).Participants40,817 pregnancies of women recruited for MoBa from February 2002 to February 2005 of whom 26,563 (65%) met the following criteria: women had tobe non-smoking, BMI between 19 <strong>and</strong> 32, aged between 21 <strong>and</strong> 38 years when giving birth, with a singleton birth.Exclusions: more than 3 spontaneous abortions, energy intake less than 4,200 kJ <strong>and</strong> more than 16,700 kJ.Baseline comparisons See confounding belowAssessmentFFQTimingat 17-24 weeks gestationComparisonOlive/canola oil ≥ 5 times per day v < 5 times a dayOutcomesPreterm birth (after week 21 <strong>and</strong> before week 37); late preterm birth (week 35-36) <strong>and</strong> early preterm birth (< 35 weeks)ResultsPreterm birth (< 37 weeks): (n = 25,966; 1174 cases)OR 0.92 95% CI 0.80 to 1.06aOR 1.00 95% CI 0.86 to 1.16Early preterm birth (< 35 weeks): (n = 25,256; 474 cases)OR 0.93 95% CI 0.74 to 1.16aOR 1.02 95% CI 0.81 to 1.28FollowupConfoundingRisk of biasRelevanceOther commentsLate preterm birth (35-36 weeks): (n = 25,492; 710 cases)OR 0.91 95% CI 0.76 to 1.10aOR 0.98 95% CI 0.82 to 1.19To birthAnalyses were adjusted for remaining Mediterranean diet criteria, mother’s BMI <strong>and</strong> height, educational level, parity <strong>and</strong> marital statusModerate risk of bias: some dietary intakes were different between groups <strong>and</strong> were not controlled forModerate: low red meat consumption not typical for many Australian womenPreterm birth rates were lower than expected, likely due to exclusion of smokersDietary guidelines for pregnant <strong>and</strong> <strong>breastfeeding</strong> women: evidence report238
Reference Khoury 2007Food type“Cholesterol-lowering” diet (promoting fish, low-fat meats <strong>and</strong> dairy products, oils, wholegrains, fruits, vegetables <strong>and</strong> legumes)Study typeRCT – CARDIPP (Cardiovascular Risk Reduction Diet in Pregnancy) studyLevel of evidence II (intervention)SettingOslo, NorwayFundingNorwegian Council on Cardiovascular DiseaseParticipants290 nonsmoking white women with singleton pregnancies, aged between 21 <strong>and</strong> 38 years, with no previous pregnancy-related complications (who werenot vegetarian or following a Mediterranean-type diet)Baseline comparisons n/aDietary assessment n/aTimingDiet commencing from 17 to 20 weeks gestationComparison“Cholesterol-lowering” diet (141 women r<strong>and</strong>omised) versus usual diet (149 women r<strong>and</strong>omised)OutcomesGestational weight gain; maternal cholesterol concentrations; neonatal lipid profiles; preterm birth < 37 weeksResults Gestational weight gain (week 17-20 to week 30):Diet group: mean 5.4 kg [SD 2.3]Control group: mean 6.0 kg [SD 2.2]MD 0.6 kg 95% CI 0.05 to 1.1Total maternal cholesterol at week 36 (mg/dL)Diet group (n=127): mean 257 [SD 45.9]Control group (n=132): mean 259 [SD 43.8]pnsTotal neonatal cholesterol (mg/dL)Diet group (n=125): mean 113 [SD 25]Control group (n=134): mean 107 [SD 23]pnsPreterm birthDiet group: 1/141 vs Control group: 11/149: RR 0.10 95% CI 0.01 to 0.77FollowupConfoundingRisk of biasRelevanceOther commentsTo birthn/aLow-moderate risk of bias; method of allocation concealment not reported; 21/290 (7%) losses to follow-up (results also presented with all 290 womenincluded)Likely to be reasonably similar to Australian womenFats <strong>and</strong> Oils239
Reference Knox 1972Food typeFats <strong>and</strong> oils (icecream)Study typeCase control (cases matched to food consumption at population level for a particular period)Level of evidence III-3 (aetiology)SettingBirmingham, UKFundingNot reportedCases Stillbirths <strong>and</strong> infant deaths due to anencephalus between 1961 <strong>and</strong> 1967Baseline comparisons n/aDietary assessment Population surveysTimingEach quarterComparisonMonthly stillbirths <strong>and</strong> infant deaths due to anencephalus matched to quarterly consumption of main food stuffs (in previous five to nine months)OutcomesAnencephalusResultsIcecream positively associated with cases of anencephalus: r = +0.60 after a lag interval of five months (icecream also included in dairy foods)Followupn/aConfoundingAnalyses were not adjustedRisk of biasHigh risk of bias: links between population consumption of foods <strong>and</strong> anencephalus very distal <strong>and</strong> no control for potential confoundersRelevanceLikely to differ from a modern Australian dietOther comments Food consumption of total population not likely to reflect food consumption of pregnant women; <strong>and</strong> will not be able to reflect differences between dietsof individual or specific groupsDietary guidelines for pregnant <strong>and</strong> <strong>breastfeeding</strong> women: evidence report240
Reference Mellies 1978; 1979Dietary patterns See comparisons belowStudy typeRCT (cross-over)Level of evidence II (intervention)SettingCincinnati, USAFundingGeneral Clinical Research Center, Mead Johnson Company, Ross LaboratoriesParticipants14 lactating mothers <strong>and</strong> their healthy term infantsExclusions: women with thyroid, hepatic, renal or diabetic disordersBaseline comparisons n/aDietary assessment n/aTimingWomen were r<strong>and</strong>omised 30 days after birth;After 4 weeks on either diet, mothers crossed over to the other diet for a second 4 week periodComparison Diet containing 190 mg cholesterol <strong>and</strong> 1200 mg phytosterol per day <strong>and</strong> a polyunsaturated/saturated fat ratio of 1.8VersusHigh cholesterol diet (520 mg cholesterol <strong>and</strong> 50 mg phytosterol per day <strong>and</strong> a polyunsaturated/saturated fat ratio of 0.12OutcomesCholesterol <strong>and</strong> phytosterol in maternal plasma, breast milk <strong>and</strong> infant plasmaResultsNo significant correlations were observed between maternal plasma <strong>and</strong> milk cholesterol levels, or between maternal milk <strong>and</strong> infant plasma cholesterollevelsFollowup2 months after birthConfoundingn/aRisk of biasUnclear risk of bias: details about r<strong>and</strong>omisation <strong>and</strong> losses to follow-up not full reportedRelevanceLow cholesterol diet may be difficult to adhere toOther commentsFats <strong>and</strong> Oils241
Reference Mikkelsen 2008Dietary patterns Mediterranean diet (consumption of fish twice a week or more, intake of olive or canola oil, high consumption of fruits <strong>and</strong> vegetables (5 a day ormore), meat (other than poultry or fish) at most twice a week, <strong>and</strong> at most 2 cups of coffee a day)Study typeProspective cohort studyLevel of evidence IISettingDenmark (part of the Danish National Birth Cohort (DBNC))FundingMarch of Dimes Birth Defects Foundation, Danish National Research Foundation, Danish Medical Research Foundation, Danish <strong>Health</strong> Foundation,Danish Heart Foundation, EU FP7 consortium (EARNEST), Pharmacy Foundation, Egmont Foundation, Augustinus Foundation.Participants 35,530 pregnant women recruited from 1996 to 2002Exclusions: women who smoked, women aged < 21 <strong>and</strong> > 38 years, BMI < 19 <strong>and</strong> > 32, a history of more than 3 abortions, twin pregnancies, chronichypertension, women with a calculated energy intake < 4,200 kJ <strong>and</strong> > 16,700 kJBaseline comparisons BMIs were significantly lower in the MD <strong>and</strong> no use of oil groups.Dietary assessment FFQTimingFFQ mailed to all DBNC participants in 25 th week of gestationComparisonAssumed to be use of olive oil or canola oil v no useOutcomesPreterm birthResultsPreterm birth < 37 weeksOR 0.95 95% CI 0.86 to 1.06aOR 0.93 95% CI 0.84 to 1.04Early preterm birth < 35 weeksOR 1.03 95% CI 0.87 to 1.22aOR 1.02 95% CI 0.86 to 1.23Late preterm birth 35-36 weeksOR 0.91 95% CI 0.80 to 1.04aOR 0.89 95% CI 0.78 to 1.02FollowupTo birthConfoundingAdjusted for parity, BMI, maternal height, socioeconomic status <strong>and</strong> cohabitant statusRisk of bias Low risk of bias; GA based mostly on ultrasound; 0.36% missing data (127/35657)RelevanceRelevance limited by exclusion of smokers <strong>and</strong> obese womenOther commentsDietary guidelines for pregnant <strong>and</strong> <strong>breastfeeding</strong> women: evidence report242
Reference Nwaru 2010Food typeFats <strong>and</strong> oils: total; butter <strong>and</strong> butter spreads; margarine <strong>and</strong> low fat spreads; oilsStudy typeProspective cohort studyLevel of evidence II (aetiology)SettingTampere, Finl<strong>and</strong>FundingAcademy of Finl<strong>and</strong>, Finnish Pediatric Research Foundation, the Juho Vainio Foundation, the Yrjo Jahnsson Foundation, Turku, Oulu <strong>and</strong> TampereUniversity Hospitals, JDRF, Novo Nordisk Foundation, EU Biomed 2 ProgramParticipants931 mother-infant pairs (children with human leukocyte antigen-conferred susceptibility to type 1 diabetes) participating in the Finnish type 1 DiabetesPrediction <strong>and</strong> Prevention (DIPP) Nutrition Study between September 1996 <strong>and</strong> October 1997Baseline comparisons See confounding belowDietary assessment FFQTimingFFQ given to women after birth, for return at the three month visit (FFQ intended to cover maternal diet during pregnancy <strong>and</strong> lactation)ComparisonAmount <strong>and</strong> type of fat intakeOutcomesAllergic sensitisation in offspring by 5 years: food allergens (egg, cow’s milk, fish, wheat); inhalant allergens (house dust mite, cat, timothy grass, birch)ResultsDietary fatsFood allergensInhalant allergensOR 0.79 95% CI 0.49 to 1.29 OR 0.91 95% CI 0.60 to 1.41aOR 0.86 95% CI 0.50 to 1.48 aOR 1.07 95% CI 0.66 to 1.73- Butter <strong>and</strong> butter spreadsFood allergensInhalant allergensOR 1.05 95% CI 0.81 to 1.35 OR 1.15 95% CI 0.92 to 1.43aOR 1.08 95% CI 0.81 to 1.43 aOR 1.20 95% CI 0.94 to 1.54- Margarine <strong>and</strong> low fat spreadsFood allergensInhalant allergensOR 0.96 95% CI 0.78 to 1.17 OR 0.93 95% CI 0.79 to 1.10aOR 0.95 95% CI 0.76 to 1.20 aOR 0.96 95% CI 0.79 to 1.17- OilsFood allergensInhalant allergensOR 0.86 95% CI 0.55 to 1.36 OR 1.19 95% CI 0.75 to 1.67aOR 0.83 95% CI 0.51 to 1.36 aOR 0.97 95% CI 0.62 to 1.49FollowupConfoundingRisk of biasRelevanceOther commentsTo 5 yearsAdjusted for energy intake, place of birth, season of birth, sex of the child, number of siblings, gestational age at birth, parental asthma, parental allergicrhinitis, maternal age at birth, maternal smoking during pregnancy, maternal educationLow risk of bias: data available for 931/1175 (79.2%) children recruited – 108 did not participate in survey, a further 49 did not have IgE measurements,a further 87 had no FFQ or an incomplete FFQLikely to be relevant to Australian women28% of women took vitamin D supplements, 73% took iron supplements;HLA genotype not likely to have any impact on the development of allergic diseases.Fats <strong>and</strong> Oils243
Reference Petridou 2005Food typeButter/margarineStudy typeCase-control studyLevel of evidence III-3SettingGreeceFundingThe Childhood Hematology-Oncology Group: Athens University Medical School, Aristotle University of Thessaloniki, University Hospital of HeraklionParticipants Cases: 131 children with acute lymphoblastic leukemia, aged 12 to 59 months, gender <strong>and</strong> age matched toControls: 131 children hospitalised for minor conditions between 1999 <strong>and</strong> 2003Baseline comparisons See confounding belowDietary assessment FFQTimingDuring index pregnancyComparisonTertiles of butter/margarine – median Q1; 0 g/day: median Q3 21 g/dayOutcomesAcute lymphoblastic leukemia (ALL)ResultsAcute lymphoblastic leukemia (ALL)Median g/day Cases Controls p for trendQ1: 0 42 51Q2: 6 45 50Q3: 21 44 30 0.07Logistic regression: one tertile more of butter/margarine: aOR 1.41 95% CI 0.97 to 2.06FollowupConfoundingRisk of biasRelevanceOther commentsNATotal energy intake (but not mutually among food groups); matching variables; maternal age at birth; birthweight; maternal smoking during pregnancy;maternal years of schooling, maternal occupationModerate: moderate risk of recall bias for women being able to accurately remember their dietary intake during a pregnancy some time previously;Cases: 171 children with ALL were identified; 21 had missing data, consent was not given in 9 cases <strong>and</strong> 10 were unable to be matched, leaving 131(77%) of cases availableDiets of Greek women may differ from current diets of Australian womenDietary guidelines for pregnant <strong>and</strong> <strong>breastfeeding</strong> women: evidence report244
Reference Petridou 1998Food typeFats <strong>and</strong> oils: butter on bread, butter for cooking, margarine on bread, margarine for cooking, seed oils, olive oils, olives.Study typeCase-control studyLevel of evidence III-3 (aetiology)SettingGreater Athens area, GreeceFundingGreek Ministry of <strong>Health</strong> <strong>and</strong> Welfare, <strong>and</strong> Foundation for Research in Childhood ‘S. Doxiadis’ParticipantsCases: 109 children with cerebral palsy (CP), born between 1984 <strong>and</strong> 1988 (estimated to be two-thirds of the children with CP born during this period)Controls (1): 155 neighbouring children of similar sex <strong>and</strong> age (± 12 months)Controls (2): 99 healthy siblings of similar sex <strong>and</strong> age (± 12 months) of the first neurological patient seen by the attending physician after a visit by theCP patientBaseline comparisons See confounding belowDietary assessment FFQTimingDuring pregnancyComparison≤ 8 versus 9 v 10 v > 10 serves of fats <strong>and</strong> oils per week;regression analysis: risk of cerebral palsy with change in consumption by one unit ( = consumption of fats <strong>and</strong> oils once per week)OutcomesCerebral palsyResults≤ 8 serves of fats <strong>and</strong> oils per week: 10/91 (11.0%) cases v 32/246 (13.0%) controls9 serves of fats <strong>and</strong> oils per week: 25/91 (27.4%) cases v 67/246 (27.2%) controls10 serves of fats <strong>and</strong> oils per week: 23/91 (25.3%) cases v 64/246 (26.0%) controls> 10 serves of fats <strong>and</strong> oils per week: 33/91 (36.3%) cases v 83/246 (33.8%)FollowupConfoundingRisk of biasRelevanceOther commentsRegression analysis for each unit of consumption of fats <strong>and</strong> oils (once per week):aOR 1.09 95% CI 0.85 to 1.39aOR 1.08 95% CI 0.84 to 1.40 (additionally adjusted for all food groups)8 yearsAge <strong>and</strong> sex of child, maternal age at birth, maternal age at menarche, maternal chronic disease, previous spontaneous abortions, persistent vomitingduring index pregnancy, multiple pregnancy, number of obstetric visits; timing of membrane rupture in index birth, use of general anaesthesia in theindex birth, mode of birth, abnormal placenta, infant head circumference at birth, congenital malformation, place of index birth, use of supplementaryiron during index pregnancy, physical exercise during index pregnancy, painless childbirth classes.The following were not included in the model:- Smoking or consumption of coffee or alcohol during pregnancy (stated to be “unrelated to CP <strong>and</strong> had no confounding influence”);- Gestational age, birthweight <strong>and</strong> maternal weight gain (stated to be “strong predictors of CP, but were not included in the model, since they areprobably intermediate stages in a possible link between diet <strong>and</strong> CP (mediators) rather than genuine confounders”Moderate-high: High risk of recall bias for women being able to accurately remember their dietary intake during a pregnancy 8 years previously;Cases: 109 children with CP were identified; for 6 children either collaboration with their guardian or a diagnosis of CP was not confirmed; <strong>and</strong> reliablematernal dietary intakes were not available for 12 women, leaving 91 cases available for analysis.Controls: 278 mother-child pairs were approached; 16 refused to participate; matching controls were not available in 8 instances, <strong>and</strong> reliable maternaldietary intakes were not available for 8 women, leaving 246 controls available for analysis.Diets of Greek women in 1998 may differ from current diets of Australian womenFats <strong>and</strong> Oils245
Reference Sausenthaler 2007Food groupsFats <strong>and</strong> oilsStudy typeProspective cohort study: from the LISA birth cohortLevel of evidence II (aetiology)Setting4 German cities (Munich, Leipzig, Wesel, Bad Honnef)FundingFederal Ministry for Education, Science, Research <strong>and</strong> Technology, GermanyParticipants3097 newborns recruitedBaseline comparisons See Confounding belowDietary assessment FFQTimingMaternal diet during the last 4 weeks of pregnancy (obtained shortly after birth, median 3 days)VariableLow intake group as reference group compared with high intake group: Butter high intake = 3-4 times/week Margarine high intake = ≥ 4 times/week Vegetable oils high intake = 3-4 times/week Deep frying vegetable fat high intake = ≥ 2-3 times/monthOutcomesAllergic sensitisation, eczema at 2 yrsResultsDoctor-diagnosed eczema Any allergen sensitisation Food allergens Inhalant allergensFats <strong>and</strong> oilsAdjusted OR (95% CI)Butter 1.08 (0.79, 1.46) 0.97 (0.66, 1.42) 0.93(0.60, 1.43) 0.86 (0.48, 1.53)Margarine 1.49 (1.08, 2.04) 0.85 (0.56, 1.27) 0.80 (0.50, 1.27) 0.93 (0.50, 1.73)Vegetable oils 1.48 (1.14, 1.91) 0.88 (0.63, 1.25) 0.91 (0.61, 1.34) 0.89 (0.53, 1.51)Deep frying veg. fat 1.10 (0.87, 1.41) 1.25 (0.92, 1.70) 1.12 (0.79, 1.58) 1.61 (1.02, 2.54)Length of followupConfoundingRisk of biasRelevanceOther comments2 yearsCrude <strong>and</strong> adjusted results reported (adjusted for study area, sex, maternal age, maternal smoking, level of parental education, exclusive <strong>breastfeeding</strong>≥ 4 months, parental history of atopic diseases, season of birth <strong>and</strong> all dietary variablesLow risk of bias: Two year data available for 2641/3097 children (85%): 433 lost to follow-up, 9 excluded due to chronic disease, 14 missing maternalFFQLikely to be reasonably similar to dietary intakes of Australian women in AustraliaDietary guidelines for pregnant <strong>and</strong> <strong>breastfeeding</strong> women: evidence report246
Reference Signorello 1998Food groupsFatsStudy typeCase-control studyLevel of evidence III-3 (aetiology)SettingBoston, MA, USAFundingMilton Fund, Harvard Medical School, Boston, MAParticipants Cases: 44 women previously hospitalised for severe hyperemesis gravidarum with a singleton birth between January 1, 1993 <strong>and</strong> Decemeber 31, 1995Controls: 87 women at the same hospital with a singleton birth during the same period who experienced less than 20 hours of nausea <strong>and</strong> fewer thanthre episodes of vomiting over the duration of their pregnanciesBaseline comparisons Controls had higher education levels <strong>and</strong> were more likely to be employedDietary assessment FFQTimingTo reflect average diet in the year before pregnancyVariableTotal fat <strong>and</strong> saturated fat intakeOutcomesSevere hyperemesis gravidarumResultsCases Controls (a)OR (95% CI)Total fat intake (g/day)72 27 29 4.3 (1.6 to 12.1)Total fat intake (per 25 g increase) aOR 2.9 (1.4 to 6.0)Saturated fat intake (g/day)28 21 27 3.8 (1.3 to 10.7)Total saturated fat intake (per 15gincrease)(Equivalent to 70 g cheddar cheese)aOR 5.4 (2.0 to 14.8)Length of followup NAConfoundingAdjusted for age, year of infant’s birth, total energy intake, vitamin C intake, education, employment statusRisk of bias Low risk of bias: Cases: 44/70 (63%) of women approached participated; controls: 87/131 (66%) of women approached participated; 40 cases <strong>and</strong> 80controls were appropriately matchedRelevanceLikely to be reasonably similar to dietary intakes of Australian women in AustraliaOther comments Also assessed other food groups; these data were presented as nutrient intakes only (only fat intake showed a significant relationship with hyperemesisgravidarum); there was not a significant association with total energy intakeFats <strong>and</strong> Oils247
Reference Stuebe 2009Dietary patterns Fats <strong>and</strong> oils: Fried foodsStudy typeProspective cohort study (Project Viva)Level of evidence II (aetiology)Setting8 urban <strong>and</strong> suburban obstetric offices of a multispecialty group practice in eastern Massachusetts, USAFundingUS NIH, Harvard Medical School, Harvard Pilgrim <strong>Health</strong> Care FoundationParticipants1338 women giving birth to a live singleton infant, < 22 weeks gestation at study entry; 379 (27%) were overweight (BMI ≥ 26); 703 (51%) experiencedexcessive weight gainExclusions: not fluent in EnglishBaseline comparisons See confounding belowDietary assessment FFQTimingAdministered in first <strong>and</strong> second trimesters of pregnancyComparisonFried foods: serves per dayOutcomes Excessive gestational weight gain (IOM 1990)ResultsExcessive gestational weight gain: fried food consumptionServes per day, median (0.11 IQR 0.07 to 0.14)Excessive GWG versus adequate/inadequateFried foods aOR 3.68 95% CI 0.96 to 14.13Fried foods, per serving per day: multivariate logistic regression model:aOR GWG: 4.24 95% CI 1.04 to 17.18FollowupConfoundingRisk of biasRelevanceOther commentsTotal weight gain1.21 kg 95% CI -1.93 to 4.34To birthAdjusted for pre-pregnancy BMI, maternal age, race/ethnicity, smoking status, gestational age at birth, nausea in first trimester in pregnancyLow risk of bias: Of 2083 eligible women, 1388 (67%) of women had data available for analysis (31 had missing information on pre-pregnancy BMI <strong>and</strong>gestational weight gain; 226 had missing covariate information <strong>and</strong> 438 had missing data on either first or second-trimester diet <strong>and</strong> mid-pregnancyphysical activity); included women were less likely to be African-American or Hispanic, to be younger, multiparous <strong>and</strong> obeseLikely to be relevant to Australian womenDietary guidelines for pregnant <strong>and</strong> <strong>breastfeeding</strong> women: evidence report248
Reference Willers 2007Food typeFats <strong>and</strong> oilsStudy typeProspective cohort (longitudinal)Level of evidence II (aetiology)SettingAntenatal clinics at Aberdeen Maternity Hospital, Aberdeen, Scotl<strong>and</strong>FundingAsthma UK, GA 2 LEN European Network of Excellence on Global Allergy <strong>and</strong> AsthmaParticipants1212 children (singleton births) whose mothers were recruited between October 1997 <strong>and</strong> April 1999 at a median gestational age of 12 weeksBaseline comparisons Women were representative of the local obstetric populationSee confounding belowDietary assessment FFQTimingFFQ mailed at 32 weeks gestation to cover dietary intake over the previous 2-3 monthsComparisonTertiles: Butter versus margarine/low fat spreadOutcomesWheeze, allergic rhinitis, atopic eczema, hay fever at 5 yearsResultsButter or margarine/low fat spread – no consistent linear associations with respiratory <strong>and</strong> atopic outcomes in 5 year old children (exact numbers notreported in the paper).FollowupConfoundingRisk of biasRelevanceOther comments5 yearsAdjusted for maternal age, paternal social class, maternal education, maternal asthma (for wheeze, asthma <strong>and</strong> hay fever outcomes), maternal atopy,child’s birthweight, child’s sex, presence of older siblings, <strong>breastfeeding</strong> <strong>and</strong> smoking in the child’s home at 5 yearsLow risk of bias: Initial study population of 1924 children dropped to 1212 participants with complete data (63.0%) (questionnaire, at least one of theoutcome time points).Likely to be reasonably relevant to Australian womenInclusion of maternal supplement use during pregnancy did not materially change the resultsFats <strong>and</strong> Oils249
ReferencesCalvani M, Aless<strong>and</strong>ri C, Sopo SM, Panetta V, Pingitore G, Tripodi S, Zappala D<strong>and</strong> Zicari AM. "Consumption of fish, butter <strong>and</strong> margarine during pregnancy<strong>and</strong> development of allergic sensitizations in the offspring: role of maternalatopy." Pediatr Allergy Immunol 2006: 17(2): 94-102.Fard NM, Mehrabian F, Sarraf-Zadegan N <strong>and</strong> Sajadi F. "Fat-modified dietsduring pregnancy <strong>and</strong> lactation <strong>and</strong> serum lipids after birth." Indian J Pediatr2004: 71(8): 683-7.George GC, Hanss-Nuss H, Milani TJ <strong>and</strong> Freel<strong>and</strong>-Graves JH. "Food choices oflow-income women during pregnancy <strong>and</strong> postpartum." J Am Diet Assoc2005: 105(6): 899-907.Giordano F, Carbone P, Nori F, Mantovani A, Taruscio D <strong>and</strong> Figa-Talamanca I."Maternal diet <strong>and</strong> the risk of hypospadias <strong>and</strong> cryptorchidism in theoffspring." Paediatr Perinat Epidemiol 2008: 22(3): 249-60.Gonzalez-Clemente JM, Carro O, Gallach I, Vioque J, Humanes A, Sauret C,Abella M, Gimenez-Perez G <strong>and</strong> Mauricio D. "Increased cholesterol intake inwomen with gestational diabetes mellitus." Diabetes Metab 2007: 33(1): 25-9.Haggarty P, Campbell DM, Duthie S, Andrews K, Hoad G, Piyathilake C <strong>and</strong>McNeill G. "Diet <strong>and</strong> deprivation in pregnancy." Br J Nutr 2009: 102(10):1487-97.Haugen M, Meltzer HM, Brantsaeter AL, Mikkelsen T, Osterdal ML, Alex<strong>and</strong>erJ, Olsen SF <strong>and</strong> Bakketeig L. "Mediterranean-type diet <strong>and</strong> risk of pretermbirth among women in the Norwegian Mother <strong>and</strong> Child Cohort Study(MoBa): a prospective cohort study." Acta Obstet Gynecol Sc<strong>and</strong> 2008: 87(3):319-24.Khoury J, Henriksen T, Christophersen B <strong>and</strong> Tonstad S. "Effect of acholesterol-lowering diet on maternal, cord, <strong>and</strong> neonatal lipids, <strong>and</strong>pregnancy outcome: a r<strong>and</strong>omized clinical trial." Am J Obstet Gynecol 2005:193(4): 1292-301.Knox EG. "Anencephalus <strong>and</strong> dietary intakes." Br J Prev Soc Med 1972: 26(4):219-23.Mellies M, Ishikawa T, Gartside P, Burton K, MacGee J, Allen K, Steiner P,Brady D <strong>and</strong> Glueck C. "Effects of varying dietary cholesterol <strong>and</strong> phytosterolin lactating women <strong>and</strong> their infants." American Journal of Clinical Nutrition1978: 31: 1347-54.Mellies MJ, Ishikawa TT, Gartside PS, Burton K, MacGee J, Allen K, SteinerPM, Brady D <strong>and</strong> Glueck CJ. "Effects of varying maternal dietary fatty acids inlactating women <strong>and</strong> their infants." Am J Clin Nutr 1979: 32(2): 299-303.Mikkelsen TB, Osterdal ML, Knudsen VK, Haugen M, Meltzer HM, Bakketeig L<strong>and</strong> Olsen SF. "Association between a Mediterranean-type diet <strong>and</strong> risk ofpreterm birth among Danish women: a prospective cohort study." ActaObstet Gynecol Sc<strong>and</strong> 2008: 87(3): 325-30.Nwaru BI, Ahonen S, Kaila M, Erkkola M, Haapala AM, Kronberg-Kippila C,Veijola R, Ilonen J, Simell O, Knip M <strong>and</strong> Virtanen SM. "Maternal diet duringpregnancy <strong>and</strong> allergic sensitization in the offspring by 5 yrs of age: aprospective cohort study." Pediatr Allergy Immunol 2010: 21(1 Pt 1): 29-37.Petridou E, Ntouvelis E, Dessypris N, Terzidis A <strong>and</strong> Trichopoulos D."Maternal diet <strong>and</strong> acute lymphoblastic leukemia in young children." CancerEpidemiol Biomarkers Prev 2005: 14(8): 1935-9.Dietary guidelines for pregnant <strong>and</strong> <strong>breastfeeding</strong> women: evidence report250
Petridou E, Koussouri M, Toupadaki N, Youroukos S, Papavassiliou A,Pantelakis S, Olsen J <strong>and</strong> Trichopoulos D. "Diet during pregnancy <strong>and</strong> the riskof cerebral palsy." Br J Nutr 1998a: 79(5): 407-12.Sausenthaler S, Koletzko S, Schaaf B, Lehmann I, Borte M, Herbarth O, vonBerg A, Wichmann HE <strong>and</strong> Heinrich J. "Maternal diet during pregnancy inrelation to eczema <strong>and</strong> allergic sensitization in the offspring at 2 y of age."Am J Clin Nutr 2007: 85(2): 530-7.Stuebe AM, Oken E <strong>and</strong> Gillman MW. "Associations of diet <strong>and</strong> physicalactivity during pregnancy with risk for excessive gestational weight gain." AmJ Obstet Gynecol 2009: 201(1): 58 e1-8.Willers SM, Devereux G, Craig LC, McNeill G, Wijga AH, Abou El-Magd W,Turner SW, Helms PJ <strong>and</strong> Seaton A. "Maternal food consumption duringpregnancy <strong>and</strong> asthma, respiratory <strong>and</strong> atopic symptoms in 5-year-oldchildren." Thorax 2007: 62(9): 773-9.Signorello LB, Harlow BL, Wang S <strong>and</strong> Erick MA. "Saturated fat intake <strong>and</strong> therisk of severe hyperemesis gravidarum." Epidemiology 1998: 9(6): 636-40.Fats <strong>and</strong> Oils251
FishIncluded StudiesStudyOutcomes1. Akre 2008 Child hypospadias2. Browne 2006 Postnatal depression within 6 months of birth3. Buck 2003 Birth size (weight, length, head circumference <strong>and</strong> chest circumference)4. Bunin 2006; 2005 Childhood brain tumours5. Calvani 2006 Allergy sensitisation (median age of child 5 y)6. Chatzi 2008 Child persistent wheeze, atopic wheeze, atopy (all at 6.5 years)7. Daniels 2004 Child development at 18 months8. Gale 2008 Child cognition <strong>and</strong> behaviour9. Giordano 2010 Child hypospadias10. Giordano 2008 Child hypospadias <strong>and</strong> cryptorchidism11. Golding 2009 Antenatal <strong>and</strong> postnatal depressive symptoms12. Guldner 2007 SGA; preterm birth; gestational age, birthweight13. Haggarty 2009 Deprivation14. Halldorsson 2007 Birthweight, birth length, head circumference, SGA15. Halldorsson 2008 Maternal PCB concentration, birthweight, birth length, head circumference, placental weight16. Haugen 2008 Preterm birth17. Hibbeln 2007 Child development up to 8 years18. Jedrychowski 2010 Birthweight19. Jedrychowski 2008 Child respiratory symptoms up to 2 years (cough, wheezing, difficult breathing)20. Jensen 2004 Childhood acute lymphoblastic leukemia21. Jones 2000 Bone mass at 8 years22. Lamb 2008 Islet autoimmunity23. Latva-Pukkila 2009 Nausea, vomiting24. Lauritzen 2004-2009 Child development, cognition <strong>and</strong> growth25. Maconochie 2007 Miscarriage26. Mendez 2010 SGA27. Mendez 2009 Child cognition at 4 y28. Mikkelsen 2008 Preterm birth29. Mitchell 2004 SGADietary guidelines for pregnant <strong>and</strong> <strong>breastfeeding</strong> women: evidence report252
30. Miyake 2006 Postpartum depression31. Miyake 2009 Infant wheeze <strong>and</strong> eczema up to 24 months32. Nwaru 2010 Allergic sensitisation by 5 y33. Oien 2010 Childhood asthma <strong>and</strong> eczema at 2 years34. Oken 2008a Child cognition at 3 years35. Oken 2008b Child development at 18 months; child development (motor <strong>and</strong> social/cognitive) also assessed at 6 months36. Oken 2007 Pre-eclampsia, gestational hypertension37. Oken 2005 Infant cognition at 6 months38. Oken 2004 Preterm birth, low birthweight, SGA39. Olsen 2002 Preterm birth, low birthweight, IUGR40. Olsen 1993 Birthweight, fetal growth, length of gestation41. Olsen 1990 Placental weight, infant size42. Petridou 2005 Childhood acute lymphoblastic leukemia43. Petridou 1998a Cerebral palsy at 8 years44. Pogoda 2009 Childhood brain tumours45. Ramon 2009 Birthweight, birth length, SGA46. Rogers 2004 Low birthweight, preterm birth, IUGR47. Romieu 2007 Atopy, eczema48. Saito 2010 Eczema at 24 months49. Salam 2005 Asthma50. Sausenthaler 2007 Allergic sensitisation, eczema at 2 years of age51. Schoeman 2010 Hair mercury concentrations in women planning a pregnancy52. Shiell 2001 Offspring blood pressure at 27-30 years53. Sontrop 2008 Antenatal depressive symptoms54. Strain 2008 Child development at nine <strong>and</strong> 30 months55. Strom 2009 Postpartum depression56. Thorsdottir 2004 Infant size (birthweight, length, ponderal index <strong>and</strong> head circumference)57. Thurston 2007; Myers Child development at 9 years, blood pressure at 12 <strong>and</strong> 15 years200358. Venter 2009 Food hypersensitivity (FHS) in infants up to three years of age59. Willers 2007 Eczema, atopic symptoms at 5 years60. Willers 2008 Wheeze, dyspnoea, prescription of inhaled steroids for respiratory problems, composite variable ‘asthma symptoms’ in the last12 months (measured longitudinally from 1 to 8 years age)61. Williams 2001 Child stereoacuity at 3.5 yearsFish253
62. Xue 2007 Preterm birth, very preterm birth63. Yin 2010 Bone mass at 16 yearsDietary guidelines for pregnant <strong>and</strong> <strong>breastfeeding</strong> women: evidence report254
Evidence SummaryPre-Pregnancy1. In a Canadian cohort study, women planning a pregnancy <strong>and</strong> concerned about the safetyof consuming fish during pregnancy had a median hair mercury concentration of less than0.5 µg/gMaternal (Antenatal) Outcomes2. In a cohort study from the UK, mothers who consumed no seafood were 50% more likelyto have high levels of depressive symptoms at 32 weeks gestation compared with thosewho consumed substantial amounts of seafood (aOR 1.54 95% CI 1.25 to 1.89); with only aweak association seen at 18 weeks gestation3. In a Canadian cohort study, antenatal depressive symptoms were not significantlyassociated with maternal fish intake during pregnancy: multiple linear regression ofdepressive symptoms β -0.2 95% CI -0.9 to 0.4 from no fish intake to > 1 serve per week4. In a cohort study from Finl<strong>and</strong>, no association was seen between maternal fishconsumption during pregnancy <strong>and</strong> nausea <strong>and</strong> vomiting in pregnancy5. In a cohort study from the US, maternal fish intake during pregnancy was not associatedwith risk of pre-eclampsia (aOR 0.91 95% CI 0.75 to 1.09) or gestational hypertension (aOR1.4 95% CI 0.94 to 1.15)6. In a Scottish cohort study, while overall intake of fish during pregnancy was not associatedwith deprivation, lower levels of oily fish intake during pregnancy were significantlyassociated with higher levels of deprivation (p < 0.01)7. In a UK case-control study, maternal consumption of fish twice weekly or more in thethree months before conception <strong>and</strong> the first 12 weeks of pregnancy were significantlyless likely to have a miscarriage (aOR 0.83 95% CI 0.69 to 1.00) which become slightlymore borderline when adjusted for nausea (aOR 0.86 95% CI 0.71 to 1.03)Congenital Anomalies8. In a Sc<strong>and</strong>inavian case-control study, low maternal fish consumption during pregnancy(less than once a week) was associated with an increased risk of hypospadias: aOR 2.795% CI 1.3 to 5.5Fish9. In an Italian cohort study, frequent maternal fish consumption during pregnancy wasassociated with an increased risk of hypospadias: aOR 2.73 95% CI 1.09 to 6.82N LoE Study22 IV Schoeman 20109960 II Golding 20092061 II Sontrop 2008256 II Latva-Pukkila 20091718 II Oken 20071277 II Haggarty603cases;6116controls292cases;427controls80cases;80III-3 Maconochie 2007III-3 Akre 2008III-3 Giordano 2010255
10. In an Italian case-control study, frequent maternal fish consumption during pregnancy wasassociated with an increased risk of hypospadias: aOR 2.33 95% CI 1.03 to 5.31, but notcryptorchidism: aOR 1.33 95% CI 0.61 to 2.90Birth – Preterm Birth, SGA, IUGR11. In a Danish cohort study, there was no evidence of an overall association between fishintake during pregnancy <strong>and</strong> small for gestational age, although a significantly higher ratefor small for gestational age was seen for the highest intake of fish category: aOR 1.2495% CI 1.01 to 1.43) <strong>and</strong> for fatty fish aOR 1.18 95% CI 1.03 to 1.3512. In a cohort study from Norway , the risk of preterm birth was significantly reduced withhigher maternal fish intake during pregnancy: aOR 0.84 95% CI 0.74 to 0.95 for ≥ 2 v < 2serves of fish per week13. In a Spanish cohort study, overall fish <strong>and</strong> seafood intake during pregnancy ( > 6serves/week) was not associated with small for gestational age (aOR 3.89 95% CI 0.82 to18.59), although > 1 serve of crustaceans per week (aOR 3.24 95% CI 1.34 to 7.83) <strong>and</strong>canned tuna > 1 per week (aOR 2.61 95% CI 1.12 to 6.07) showed significantly higher SGArates, with the latter significant result disappearing when adjusted for persistent organicpollutants14. In a Danish cohort study, preterm birth was not significantly associated with maternal fishintake during pregnancy: aOR 0.95 95% CI 0.84 to 1.08; ≥ 2 v < 2 serves of fish per week15. In a New Zeal<strong>and</strong> case-control study, the risk of small for gestational age was increasedwhen mothers consumed no fish at the time of conception compared with > 1 serve perweek: aOR 1.69 95% CI 1.07 to 2.6916. In a US cohort study, no differences were seen for risk of preterm birth or small forgestational age <strong>and</strong> maternal fish intake during pregnancy (only reported as p-value notsignificant).17. In a Danish cohort study, the risk of: preterm birth was significantly higher when no maternal fish consumption was compared withdaily fish consumption during pregnancy: aOR 2.69 95% CI 1.49 to 4.84; no significant differences between no, <strong>and</strong> daily, fish consumption were seen for IUGR: aOR1.01 95% CI 0.45 to 2.2618. In a Spanish cohort study, fish intake of ≥ 2 serves per week compared with less than oneserve a month was associated with significantly less risk of small for gestational age forcontrols90cases;202controlsIII-3 Giordano 200844,824 II Halldorsson 200740,817 II Haugen 2005657 II Mendez 201035,530 II Mikkelsen 20081138 III-3 Mitchell 20041797 II Oken 20048729 II Olsen 2002554 II Ramon 2009Dietary guidelines for pregnant <strong>and</strong> <strong>breastfeeding</strong> women: evidence report256
canned tuna (p = 0.01 for weight) but this was not the case for oily fish or lean fish19. In a UK cohort study10,040 II Rogers 2004 no differences were detected in the risk of preterm birth when the lowest <strong>and</strong> highest fishintake in pregnancy categories were compared : aOR 0.76 95% CI 0.52 to 1.13 for no fishintake compared with a mean of 4.4 serves a week; there was a higher risk of IUGR with no fish intake in pregnancy compared with a mean of 4.4serves a week: aOR 1.37 95% CI 1.02 to 1.84)20. In a US cohort study, while the risk of any preterm birth did not differ significantly 1226 II Xue 2007between high mercury levels in mothers’ hair (in turn significantly related to high fishintake) aOR 1.55 95% CI 0.79 to 2.90, very preterm birth (< 35 weeks) was significantlyassociated with high maternal mercury levels aOR 3.0 95% CI 1.3 to 6.721. In a US cohort study, maternal lifetime fish consumption was not associated with any 2716 II Buck 2003measures of birth size (weight, length, head circumference <strong>and</strong> chest circumference) oftheir infants22. In a Danish cohort study, maternal fish consumption during pregnancy was not11,980 II Olsen 1990significantly associated with gestational age or birth length but there was a significantpositive association for placental weight <strong>and</strong> head circumference at birth. There was noan overall association between maternal fish intake during pregnancy <strong>and</strong> birthweightalthough in non-smokers, birthweight did show a positive association with increasedmaternal fish consumption23. In a cohort study from France2398 II Guldner 2007 maternal consumption of fish (not including shellfish) before pregnancy was significantlyassociated with reduced risk of small for gestational age babies <strong>and</strong> low birthweight babies,but not preterm birth; with a significant increase in length of gestation shown with multiplelinear regression (p = 0.03) maternal consumption of shellfish before pregnancy did not show these associations inadjusted analyses, instead indicating an increased risk of small for gestational age babies withconsumption ≥ 2 serves of shellfish a weekBirth Outcomes – Birthweight <strong>and</strong> Other Measures of Size At Birth24. In a Danish cohort study, maternal PCB concentrations were significantly with higher fish 100 II Halldorsson 2008intake during pregnancy <strong>and</strong> in turn, higher maternal PCB was correlated with lowerbirthweight (p = 0.03) <strong>and</strong> lower placental weight (p = 0.004) but not significantly so withbirth length (p = 0.08) or head circumference at birth (p = 0.2)25. In a Danish cohort study, higher fish intake was not significantly correlated with 44,824 II Halldorsson 2007Fish257
irthweight (p = 0.09), but there was a significant correlation with lower birth length (p =0.04) <strong>and</strong> reduced head circumference at birth (p = 0.005). <strong>For</strong> lean fish, there were nosignificant associations <strong>and</strong> for fatty fish, high intake was significantly associated withhigher birthweight (p = 0.04) <strong>and</strong> with reduced head circumference (p = 0.003) with nosignificant association seen for birth length (p = 012).26. In a cohort study from Pol<strong>and</strong> <strong>and</strong> the US, low fish intake (< 91 g/week) during pregnancy<strong>and</strong> high antenatal fine particulate matter concentrations (> 46.3 µg/m 3 ) were significantlyassociated with lower birthweight: regression coefficient: -133.26 g birthweight (p =0.052)27. In a retrospective cohort study from the Faroe Isl<strong>and</strong>s, higher maternal fish intake duringpregnancy was associated with increased birthweight (p = 0.02) <strong>and</strong> increased birthlength (p = 0.002) for variability of means between groups, with placental weight <strong>and</strong>gestational age not showing significant associations28. In a Spanish cohort study, maternal fish intake of ≥ 2 serves per week compared with lessthan one serve a month during pregnancy was associated with significantly higherbirthweight for canned tuna (p = 0.03) but not for lean or oily fish, <strong>and</strong> there were nosignificant associations for birth length with any type of fish29. In a cohort study from Icel<strong>and</strong>, maternal fish intake during pregnancy of > 6 servescompared with < 4 serves per month was significantly associated with increased birthlength (p = 0.007) <strong>and</strong> head circumference at birth (p = 0.005), but this did not apply forbirthweight <strong>and</strong> ponderal index30. In a cohort study from France, maternal intake of either fish or shellfish before pregnancywas not associated with birthweight (p = 0.8 <strong>and</strong> 1.0 respectively for multiple linearregression)Childhood – Asthma, Eczema And Other Allergy Outcomes31. In a case-control study from Spain, increased intake of fish sticks during pregnancy wasassociated with increased childhood asthma (p = 0.01), but this was not seen with oily fishconsumption32. In a cohort study from Norway, no association was seen between maternal consumptionof fish once a week or more during pregnancy <strong>and</strong> childhood asthma at two years; OR0.99 95% CI 0.72 to 1.3733. In a Japanese cohort study, fish intake during pregnancy was not associated withchildhood eczema at 3-4 months34. In a cohort study from Norway, no association was seen between maternal consumptionof fish once a week or more during pregnancy <strong>and</strong> childhood eczema at two years; ORDietary guidelines for pregnant <strong>and</strong> <strong>breastfeeding</strong> women: evidence report481 II Jedrychowski 20101012 III-2 Olsen 1993554 II Ramon 2009491 II Thorsdottir 20042398 II Guldner 2007891 III-3 Salam 20053086 III-2 Oien 2010771 II Saito 20103086 III-2 Oien 2010258
1.02 95% CI 0.82 to 1.2635. In a Japanese cohort study, fish intake during pregnancy was not associated withchildhood eczema, or infant wheeze at 16-24 months36. In a cohort study from Pol<strong>and</strong>, fish intake during pregnancy did not significantly modifythe effect of fine particulate matter on coughing in infants up to 2 years of age (aIRR 1.3695% CI 0.79 to 1.43); but significant reductions in wheezing <strong>and</strong> difficult breathing ininfants up to 2 years of age were seen (aIRR 0.80 95% CI 0.72 to 0.89 <strong>and</strong> 0.81 95% CI 0.72to 0.91 respectively)37. In a Spanish cohort study, each unit increase of fish intake during pregnancy wasassociated with a reduction in childhood eczema at 1 year of age: p = 0.036;<strong>and</strong> for atopic wheeze at 6 years (aOR 0.55 95% CI 0.31 to 0.96), but not for IgE at 4 years,or allergen sensitisation at 6 years of age38. In a German cohort study, high fish intake in pregnancy was associated with a reductionrisk of childhood eczema at 2 years of age (aOR 0.75 95% CI 0.57 to 0.98), but nosignificant effect was seen for allergen sensitisation at 2 years of age39. In a Scottish cohort study, high fish intake during pregnancy (≥ once per week) wasassociated with a reduction in childhood eczema at 5 years of age (aOR 0.57 95% CI 0.35to 0.92;A significant reduction in hay fever at 5 years of age was also seen40. In a cohort study from the Netherl<strong>and</strong>s, no associations were found between fish intake inpregnancy <strong>and</strong> asthma symptoms (e.g. wheeze) in children aged from 1 to 8 years41. In an Italian cohort study, reduced food allergen sensitisation in infants (median age 5years) was significantly associated with one serve or more of fish per week in theirmothers during pregnancy in non-allergenic mothers (p for trend = 0.002, adjusted) butnot for allergenic mothers (p for trend = 0.72, adjusted); No effect was seen on inhalant allergen sensitisation42. In a Spanish cohort study, high fish intake during pregnancy was associated with areduction in persistent wheeze in children at 6.5 years of age: aOR 0.34 95% CI 0.13 to0.84Childhood – Child Development Outcomes43. In a UK cohort study, high fish intake during pregnancy was associated with significantlyincreased vocabulary comprehension (p = 0.03), social activity (p = 0.002), <strong>and</strong> language(p = 0.004) at 18 months but no significant association was seen with the socialcomponent of the assessment763 II Miyake 2009465infantsII Jedrychowski 2008458 II Romieu 20073097 II Sausenthaler 20071212 II Willers 20072832 II Willers 2008988 III-2 Calvani 2006487 II Chatzi 200810,092childrenII Daniels 2004Fish259
44. In a UK cohort study, increased fish intake during pregnancy was associated with asignificant increase in IQ (p = 0.0389) but no significant associations were seen for childbehaviour or child development at 8 years45. In a Spanish cohort study, some measures (but not all) of child cognition at 4 years weresignificantly higher with higher fish intake during pregnancy46. In a US cohort study, higher fish intake during pregnancy was associated with significantlyincreased infant cognition at six months (adjusted change in visual recognition memoryscore 4.0 95% CI 1.3 to 6.7 for effect per weekly fish serving)47. In a US cohort study, higher fish intake during pregnancy was associated with better childcognitive test performance at 3 years of age48. In a US cohort study, higher fish intake during pregnancy was associated with increasedgeneral child development at 18 months (aOR 1.29 95% CI 1.20 to 1.38)49. In a UK cohort study, higher fish intake pregnancy (three or more times a week) was notsignificantly associated with: child behaviour score (aOR for high total difficulties score 0.23 95% CI 0.04 to 1.24 comparedwith mothers who never ate fish); or overall IQ (although children of mothers who ate fish had a verbal IQ (adjusted) that was 7.55points higher (95% CI 0.75 to 14.4) than children of mothers who did not eat fish50. In a UK cohort study, higher fish intake during pregnancy was significantly associated withincreased stereoacuity in children at 3.5 years of age (p = 0.046)51. In a Danish non-r<strong>and</strong>omised study, there were no significant differences seen between alow <strong>and</strong> high fish maternal intake group during lactation for problem solving at ninemonths; <strong>and</strong> linguistic development at one <strong>and</strong> two years; head circumference, weight,length/height, ponderal index or BMI from birth to 7 years of age; <strong>and</strong> blood pressure at2.5 years in their children52. In a cohort study from the Seychelles, maternal hair mercury concentrations (reflectingantenatal fish intake) were not associated with mental development index scores of theinfant at nine months or 30 months of age, or with psychomotor development indexscores at 9 months of age; however there was a significant association with lowerpsychomotor development index scores at 30 months of age53. In a cohort study from the Seychelles, maternal hair mercury concentrations (reflectingantenatal fish intake) were not generally associated with child development at 9 years, orblood pressure of offspring at 12 <strong>and</strong> 15 years8801childrenII Hibbeln 2007482childrenII Mendez 2009135 II Oken 2005motherinfantpairs480 II Oken 2008achildren25,446 II Oken 2008bchildren217 II Gale 2008641 II Williams 2001110 III-3 Lauritzen 2005a <strong>and</strong> b; Ulbak 2004;Asserhoj 2009229 II Strain 2008779mothers<strong>and</strong>II Thurston 2007; Myers 2003Dietary guidelines for pregnant <strong>and</strong> <strong>breastfeeding</strong> women: evidence report260
Maternal Outcomes – Postnatal54. In a New Zeal<strong>and</strong> case-control study, depression in the postnatal period was notassociated with maternal fish consumption during pregnancy: p > 0.29 (adjusted)55. In a Japanese cohort study, depression in the postnatal period was not associated withmaternal fish consumption during pregnancy: p > 0.37 for trend (adjusted)56. In a cohort study from the UK, a weak association was seen between no maternal seafoodintake during pregnancy <strong>and</strong> depressive symptoms at 8 months postnatal compared withthose who consumed substantial amounts of seafood; with no significant association seenat 2 months postnatal57. In a Danish study, fish intake during pregnancy was not associated with depression in thepostnatal period requiring admission (p= 0.5 for trend from 0-3 g/day to > 30 g/day) but,intake of 0-3 g/day was associated with depression in the postnatal period requiring aprescription compared with > 30 g/day (aOR 1.46 95% CI 1.12 to 1.9), with p for a trendacross categories of fish intakeChildhood <strong>and</strong> Adult Outcomes – Other58. In an international multi-centre case-control study, maternal fresh fish consumptionduring pregnancy was associated with a reduced risk of childhood brain tumours (aOR 0.795% CI 0.6 to 0.9)59. In a North American case-control study, maternal intake of smoked fish or lox in the yearbefore pregnancy was not associated with risk of childhood brain tumours(medulloblastoma/PNET); aOR 1.3 95% CI 0.6 to 2.660. In a Greek case-control study, cerebral palsy in children at 8 years was not associatedwith maternal fish intake during pregnancy:Regression analysis for each unit of consumption of fish once per week:aOR 0.63 95% CI 0.37 to 1.08 (additionally adjusted for all food groups)61. In a Greek case-control study, maternal fish <strong>and</strong> seafood intake during pregnancy wasassociated with a significant decrease in the risk of childhood acute lymphoblasticleukemia: aOR 0.72 95% CI 0.59 to 0.89 for each quintile more of fish/seafood62. In a US case-control study, childhood acute lymphoblastic leukemia was not generallyassociated with maternal intake of fish during pregnancychildren80 III-3 Browne 2006865 II Miyake 20069960 II Golding 200954,502 II Strom 20091281cases;2223controls315cases;315controls109children(cases)131cases;131controls138cases;III-3 Pogoda 2009III-3 Bunin 2006; 2005III-3 Petridou 1998III-3 Petridou 2005III-3 Jensen 2004Fish261
63. In a US cohort study, no significant association was seen between maternal fish intakeduring pregnancy <strong>and</strong> islet autoimmunity in children up to 15 years of age: aHR (for onest<strong>and</strong>ard deviation change in reported consumption) 0.90 95% CI 0.54 to 1.51 (5.10 meanmonthly servings)64. In one Australian cohort study, bone mineral density of children at 8 years was notassociated with maternal fish intake during pregnancy:Total body bone mineral density – p = 0.153 for adjusted regression of portions per week65. In an Australian cohort study (follow-up of Jones 2000) bone mass in 16 year-oldadolescents was not associated with maternal vegetable intake during pregnancy:Total body bone mineral density r 2 0.323; ß +14.9 (pns) for adjusted regression of portions per week66. In a cohort study from Scotl<strong>and</strong>, diastolic (but not systolic) blood pressure wassignificantly increased in offspring aged 27 to 30 years with increased fish consumption inpregnancy; regression coefficient for amount of maternal fish consumption; ß 1.00 95% CI0.18 to 1.82, p = 0.02138controls642children173children216children626adultoffspringII LambII Jones 2000II Yin 2010II Shiell 2001Dietary guidelines for pregnant <strong>and</strong> <strong>breastfeeding</strong> women: evidence report262
Evidence TablesReference Akre 2008Food typeFishStudy typeCase-control studyLevel of evidence III-3 (aetiology)Setting Sweden <strong>and</strong> Denmark from 2000 to 2005FundingEuropean Chemical Industry CouncilParticipants292 cases427 controlsBaseline comparisons See confounding belowDietary assessment QuestionnaireTimingQuestionnaire completed by mother when son was 2 months old in Sweden <strong>and</strong> when 6 months old in DenmarkComparisonNone, less than once, once or twice, more than twice a week consumption of fish during pregnancyOutcomesHypospadiasResultsHypospadiasWeekly fish consumptionNone aOR 1.4 95% CI 0.84 to 2.2< once aOR 2.7 95% CI 1.3 to 5.5Once or twice 1More than twice aOR 0.88 95% CI 0.31 to 2.5P value for trend = 0.02FollowupConfoundingRisk of biasRelevanceOther commentsn/aAnalyses adjusted for maternal age, maternal pre-pregnancy BMI, maternal education, contraceptive use at conception, proteinuria, maternal nausea inthe index pregnancy, passive maternal exposure to tobacco smoke during index pregnancy, fish consumption; weight for gestational age, gestationalage at birth; neonatal jaundiceLow risk of bias: response rate was 88% for cases <strong>and</strong> 81% for controls; ascertainment of cases of hypospadias likely to be high.Likely to be reasonably similar for the relatively small number of Australian women who do not consume fish during pregnancyDifferent recruitment methods were used in Sweden <strong>and</strong> DenmarkFish263
Reference Browne 2006Food typeFishStudy typeCase- control study (aetiology)Level of evidence III-3 (aetiology)SettingSouth Isl<strong>and</strong>, New Zeal<strong>and</strong>FundingFoundation for Research, Science <strong>and</strong> Technology, New Zeal<strong>and</strong>.ParticipantsFirst-time mothers who had previously taken part in studies conducted by Victoria University <strong>and</strong> the Uni of Otago, NZ, <strong>and</strong> were within 6 months ofhaving given birth. Caseness determined on study entry.Cases: n=41 (on or over cut off on one or both screening instruments ≥ 10 on BDI-II, &/or ≥ 9 EPDSl; those meeting CIDI criteria for Dx depression‘diagnosis group’, n=21, those that did not ‘screened high’ group, n = 20)Controls: n=39 (
Reference Buck 2003Food typeFishStudy typeProspective cohortLevel of evidence II (aetiology)SettingNew York State Angler Cohort Study (NYSACS) 1986-1991 with residents from Lake Ontario <strong>and</strong> its tributariesFundingGreat Lakes Protection Fund, Agency for Toxic Substances <strong>and</strong> Disease RegistryParticipants2,716 infants born as most recent singleton births in NYSACS (70% of infants)Excluded infants with birth defects from most analyses (n=469), <strong>and</strong> excluded infants with missing data from various analyses.Baseline comparisons See confounding belowDietary Assessment Lifetime fish consumption-self administered questionnaire (referred to number of years consuming fish from Lake Ontario)TimingUnclearComparisonDuration of fish consumption in years-none, 1-2, 3-7, ≥8 (number of years between 1955 <strong>and</strong> birth of infant)OutcomesBirth size (weight, length, head circumference <strong>and</strong> chest circumference)ResultsDuration fish consumption in years β (95% CI) 1-2 3-7 ≥8Including infants with birth defects 6.37 (-46.75, 59.49) -20.46 (-75.93, 35.02) -37.62 (-94.25, 19.02)Weight 0.06 (-.23, 0.36) 0.03 (-0.27, 0.33) 0.06 (-0.25, 0.36)Length -0.04 (-0.22, 0.14) -0.05 (-0.24, 0.14) -0.18 (-0.38, 0.01)Head circumference -0.23 (-0.54, 0.08) -0.24 (-0.57, 0.09) -0.29 (-0.65, 0.06)Chest circumferenceIncluding infants without birth defectsWeight 13.49 (-41.42, 68.41) -14.45 (-72.7, 43.8) -37.03 (-96.66, 22.6)Length 0.09 (-0.21, 0.39) 0.12 (-0.2, 0.44) 0.06 (-0.27, 0.38)Head circumference 0.04 (-0.15, 0.22) -0.03 (-0.23, 0.16) -0.15 (-0.35, 0.05)Chest circumference -0.16 (-0.48, 0.16) -0.29 (-0.64, 0.06) -0.49 (-0.87, -0.11)Follow-upConfoundingRisk of biasRelevanceOther commentsDuration fish consumption in years (%) 0 1-2 3-7 ≥8Gestational age (weeks)
Reference Bunin 2006 (<strong>and</strong> Bunin 2005)Food typeSmoked fish or loxStudy typeCase-control studyLevel of evidence III-3 (aetiology)SettingUnited States <strong>and</strong> CanadaFundingNational Cancer Institute, USAParticipants315 cases diagnosed with medulloblastoma/PNET tumours from 0 to 5 years, between 1991 to 1997 (without a previous or recurrent cancer)315 controls (r<strong>and</strong>om digit dialling, matched on area code, race <strong>and</strong> data of birth)Baseline comparisons See confounding belowDietary assessment FFQTimingTo reflect diet in the year before pregnancy; <strong>and</strong> the second trimester of pregnancyComparison1 serve/week;data on portion size were not collectedOutcomesChildhood brain tumours (medulloblastoma/primitive neuroectodermal (PNET) tumours)ResultsMedulloblastoma/PNETPericonceptionMidpregnancyN aOR* (95% CI) N aOR* (95% CI)
Reference Calvani 2006Food typeFishStudy typeRetrospective cohort studyLevel of evidence III-2 (aetiology)SettingRome, ItalyFundingNot reportedParticipants988 offspring of allergic (n = 295) <strong>and</strong> non-allergic (n = 693) mothers; recruited from outpatient allergy clinics between September 2001 <strong>and</strong> March2002; with a median age of 5 years (range of 17 years); part of the APAL study744/988 children were affected by atopic diseases (asthma, rhinitis, eczema) <strong>and</strong> the remaining 244 were attending due to respiratory, gastrointestinalsymptoms, or skin disease;Exclusions: immunodeficiency, connective tissue disease, or chronic respiratory tract disease other than asthmaBaseline comparisons See Confounding belowDietary assessment QuestionnaireTimingAt recruitment, women were asked to recall their intake of fish, butter <strong>and</strong> margarine during pregnancyComparison≤ 1 serve/month (reference) v 1 serve/week v ≥ 2-3 serves/weekOutcomesAllergic sensitisationsResultsFood sensitisation (positive skin prick test mainly for raw cow’s milk <strong>and</strong> egg-white)n/N (%) OR (95% CI) aOR (95% CI) p-value for trendAllergic mothers≤ 1 serve/month 7/62 (11.3%) 1 1 0.721 serve/week 16/138 (11.6%) 1.03 (0.40 to 2.64) 1.15 (0.38 to 3.47)≥2-3 serves/week 8/38 (9.6%) 0.83 (0.28 to 2.44) 1.13 (0.31 to 4.1)*adjusted for age, occupation <strong>and</strong> eczemaNon-allergic mothers≤ 1 serve/month 20/136 (14.7%) 1 1 0.0021 serve/week 16/330 (4.8%) 0.29 (0.14 to 0.58) 0.22 (0.08 to 0.55)≥2-3 serves/week 10/197 (5.1%) 0.31 (0.14 to 0.68) 0.23 (0.08 to 0.69)*adjusted for age, gestational age, maternal occupation, oculorhinitis <strong>and</strong>eczemaaOR in non-allergic mothers for 1 serve/week: 0.13 95% CI 0.04 to 0.38; aOR for ≥2-3 serves/week 0.14 95% CI 0.04 to 0.47(additionally adjusted for maternal butter <strong>and</strong> margarine intake <strong>and</strong> hyperemesis)aOR in non-allergic mothers for milk sensitisation: 1 serve per week 0.15 95% CI 0.04 to 0.59 <strong>and</strong> ≥2-3 serves/week 0.05 95% CI0.00 to 0.54aOR in non-allergenic mothers for egg sensitisation: 1 serve per week 0.26 95% CI 0.09 to 0.76 <strong>and</strong> ≥2-3 serves/week 0.33 95% CI0.10 to 1.07FishFood sensitisation in whole population: p value for trend 0.0081 serve per week: aOR* 0.34 95% CI 0.15 to 0.75≥ 2-3 serves/week: aOR* 0.42 95% CI 0.17 to 1.02*adjusted for age, number of older siblings, allergy clinics, maternal age, gestation age, gender, maternal education, paternal atopy,267
maternal atopyInhalant sensitisation (positive skin prick test for a range of allergens)n/N OR (95%) aOR (95% CI) p-value for trendAllergic mothers≤ 1 serve/month 27/62 (43.5%) 1 1 0.761 serve/week 63/138 (50.7%) 1.33 (0.73 to 2.43) 0.89 (0.30 to 2.60)≥2-3 serves/week 48/83 (42.2%) 0.94 (0.48 to 1.83) 0.74 (0.23 to 2.37)*adjusted for age, number of older siblings, allergy clinics, maternal age, gestation age, gender, maternal education, paternal atopy,maternal atopyNon-allergic mothers≤ 1 serve/month 69/136 (50.7%) 1 1 0.621 serve/week 137/330 (41.5%) 0.68 (0.46 to 1.02) 0.70 (0.38 to 1.30)≥2-3 serves/week 92/197 (46.7%) 0.85 (0.54 to 1.31) 0.55 (0.28 to 1.08)*adjusted for age, gender, number of older siblings, allergy clinics, maternal age, number of pregnancies, maternal occupation, paternalatopy, asthma, oculorhinitisInhalant sensitisation in whole population:≥2-3 serves/week: aOR* 0.57 95% CI 0.32 to 1.03*adjusted for age, gender, oculorhinitis, asthma, number of older siblings, allergy clinics, maternal age, number of pregnancies, maternaleducation, preterm labour, paternal atopy, maternal atopy: did not vary significantly with amount of butter intakeFollowupNAConfoundingAnalyses only adjusted for a limited number of factors; different factors were used for the analyses of allergic <strong>and</strong> non-allergic mothers; <strong>and</strong> for food <strong>and</strong>inhalant sensitisations (included if significant in univariate analyses).Risk of bias Moderate risk of bias: recall bias likely for women remembering diet during a pregnancy up to 17 years earlier; data for maternal atopy available for 988of the 1044 consecutively recruited children (94.6%); data for maternal fish intake during pregnancy available for 946/988 (95.7%); children attendingallergy clinics likely to be different for a general population of children.RelevanceDiets of pregnant Italian women may differ from those of Australian women e.g. there were low levels of maternal margarine <strong>and</strong> butter consumption inthis studyOther comments Clinical significance of skin prick tests?Wide age range (1 to 18?) makes interpretation of allergic sensitisations difficultDietary guidelines for pregnant <strong>and</strong> <strong>breastfeeding</strong> women: evidence report268
Reference Chatzi 2008Food typeFishStudy typeProspective cohort studyLevel of evidence II (aetiology)Setting Women presenting for antenatal care at general practices in Menorca, a Mediterranean isl<strong>and</strong> in Spain (mid 1997 to mid 1998)FundingInstituto de Salud Carlos III red de Grupos Infancia y Media Ambiente, the Fundacio “La Caixa” , Instituto de Salud Carlos III, red de Centros deInvestigacion en Epidemiologica y Salud Publica, EU, National Center for Environmental <strong>Health</strong>, USA, the GA2LEN project, Ministry of Education <strong>and</strong>Science, Spain, Oficina de Ciencia y Tecnologia, Generalitat Valenciana.Participants482 children of 507 women who had attended antenatal care in MenorcaBaseline comparisons See confounding belowDietary assessment FFQTimingnot clear when women did FFQ <strong>and</strong> period of pregnancy it was intended to coverComparison≤ 2.5 versus > 2.5 serves of fish per weekOutcomesPersistent wheeze, atopic wheeze <strong>and</strong> atopy at 6.5 yearsResultsPersistent wheeze at 6.5 yearsLow 24 (17.02%) v high 13 (9.35%); OR 0.34 95% CI 0.13 to 0.84 (also adjusted for firstborn <strong>and</strong> lower respiratory tract infections at age 1)Atopic wheeze at 6.5 yearsLow 13 (7.10%) v high 7 (4.38%); pns (also adjusted for birthweight <strong>and</strong> maternal atopy)Atopy at 6.5 yearsLow 36 (16.59%) v high 34 (17.53%) pns (also adjusted for birthweight <strong>and</strong> maternal atopy)Followup6.5 yearsConfounding Analyses adjusted for gender, maternal <strong>and</strong> paternal asthma, maternal social class <strong>and</strong> education, BMI at age 6.5 years <strong>and</strong> total energy intake at 6.5yearsRisk of biasLow risk of bias: Results from 468/482 children (97%) able to be analysed (6 incomplete data <strong>and</strong> 8 implausible values);RelevanceDiets in Menorca may differ from diets of Australian women, particularly urban womenOther commentsFish269
Reference Daniels 2004Food typeFishStudy typeProspective cohortLevel of evidence II (aetiology)SettingSouth West Engl<strong>and</strong>, Avon Longitudinal Study of Parents <strong>and</strong> Children (ALSPAC), recruited during prenatal health visits. Eligible for ALSPAC - allchildren born to mothers residing in Bristol <strong>and</strong> surrounding areas between April 1991 <strong>and</strong> December 1992. An estimated 85% participated.FundingMedical Research Council, the Wellcome Trust, The Department of <strong>Health</strong>, The Department of the Environment, the DfEE, Nutricia <strong>and</strong> othercompaniesParticipants10,092 singleton-term infants – 7421 included in analysis (74%) as completed the developmental assessments within target time frame <strong>and</strong> mothersprovided questionnaires throughout pregnancy <strong>and</strong> who had no missing data. Children were excluded if both developmental tests took place more than4 months after the target test date (n = 47) or if there were missing data on maternal dental history (n = 1833), <strong>breastfeeding</strong> (n = 258), parity (n = 254),infant fish intake (n = 209), HOME score (n = 145), or alcohol use (n = 25).Baseline comparisons Mothers in this analysis older than other ALSPAC population (mean age, 29 vs. 27 years), more likely to have had a university degree (16% vs. 6%),<strong>and</strong> to have breastfed their child (67% vs. 55%), <strong>and</strong> less likely to have smoked during pregnancy (15% vs. 28%).See Confounding belowDietary Assessment Mother- Food frequency questionnaire-self administered. Mothers reported the frequency with which they ate white fish (cod, haddock, plaice, fishfingers etc) <strong>and</strong> oily fish (pilchards, sardines, mackerel, tuna, herring, kippers, trout, salmon, etc).Child-Not reported how.TimingMother - FFQ at 32 weeks gestationChild - 6 & 15 monthsComparisonMaternal fish meals (combined oily <strong>and</strong> white): never-rarely, once per 2 weeks, 1-3 times per week, ≥4 times per week. Assumed that each fish mealaveraged 4.5 ounces to estimate the median ounces of fish eaten per week; this resulted in a corresponding ordinal variable with the values 0, 2.25, 9,<strong>and</strong> 18 ounces of fish per week.Child fish meals: at least once per week at 6 months <strong>and</strong> at least once per week at 12 months =yes/noOutcomes Vocabulary comprehension, Social Activity, Language <strong>and</strong> Social development (adaptation of MacArthur Communicative Development Inventory at 15months, adaptation of Denver Developmental Screening Test at 18 months-both completed by parents at home)Results88% ate fish during pregnancyAdjusted mean score: mean (95% CI) <strong>and</strong> trendestimatesMaternal fish meals Never-rarely 1 per 2 weeks 1-3 per week ≥4 per weekβ±SE *= (P)Vocabulary comprehension 68.2 (66.3-70.5) 70.9 (69-72.9) 73 (71.3-74.8) 71.9 (70.5-73.8)0.11 ±0.05 (0.03)Social Activity 16.4 (16-16.7) 17 (16.6-17.3) 17.1 (16.8-17.4) 17.2 (16.9-17.5)0.03 ±0.009 (0.002)Languag 7.1 (6.9-7.3) 7.4 (7.2-7.5) 7.4 (7.3-7.5) 7.4 (7.3-7.6)0.01 ±0.004 (0.004)Social 8.1 (7.9-8.2) 8.1 (8-8.2) 8.2 (8.1-8.3) 8.2 (8-8.3)0.002 ±0.004 (0.5)*change in developmental score points per ounce increase of maternal fish intake per weekAdjusted association of maternal fish intake <strong>and</strong> LOW developmental assessment scores: OR (95% CI)Maternal fish meals Never-rarely 1 per 2 weeks 1-3 per week ≥4 per weekβ±SE= (P)Dietary guidelines for pregnant <strong>and</strong> <strong>breastfeeding</strong> women: evidence report270
Vocabulary comprehension 1 0.8 (0.6-1.1) 0.8 (0.6-1) 0.9 (0.7-1.2)0.0003 ±0.0006 (0.9)Social Activity 1 0.8 (0.6-1.1) 0.6 (0.5-0.8) 0.7 (0.5-0.9)-0.02 ±0.007 (0.02)Language 1 0.8 (0.6-1.2) 0.7 (0.5-0.9) 0.7 (0.5-0.9)-0.02 ±0.007 (0.04)Social 1 1.2 (0.8-1.8) 1 (0.7-1.4) 1.1 (0.7-1.5)0.002 ±0.008 (0.7)= change in odds of low developmental score points per ounce increase of maternal fish intake per week.Note: above associations not influenced by child fish intake, but infant fish intake was independently associated with an increasein most neurodevelopmental assessment scoresFollow-upConfoundingRisk of biasRelevanceOther comments15 <strong>and</strong> 18 months of ageAll analyses adjusted for child sex, age at testing (weeks), <strong>breastfeeding</strong> (reported at 15 months, ever/never [duration found to be not important]),maternal dental treatment (reported at 33 months), age (years), prenatal smoking, prenatal alcohol use, birth order (1 st born, non-first born), maternaleducation, quality of parent/home environment.Low-moderate: see attrition comments above; not adjusted for maternal IQEnglish diet similar to AustralianDevelopmental assessments completed by mother at homeDevelopmental assessment only done within 4 months of target test date for 7421/10,092 childrenOnly 10,092 out of original 14,150 <strong>and</strong> group analysed here slightly older mothers, more likely to have had a university degree <strong>and</strong> to have breastfedinfant, <strong>and</strong> less likely to have smoked whilst pregnant.Women who ate white fish more likely to have breastfed infant, women who had oily fish more likely to have higher education <strong>and</strong> have breastfed infant(compared to women who did not eat fish)Fish271
Reference Gale 2008Food typeFishStudy typeProspective cohort studyLevel of evidenceII (aetiology)Setting1991-2, Midwives antenatal booking clinic at the Princess Anna Maternity Hospital, Southhampton, UKFundingMedical Research Council, WellChildParticipants217 Caucasian women aged ≥ 16 years with singleton pregnancies of < 17 weeks gestation <strong>and</strong> their infantsExcluded diabetics <strong>and</strong> those who undertook hormonal treatments in order to conceive.Only children with complete data for all outcomes <strong>and</strong> potential confounding factors.Baseline comparisons See confounding belowDietary Assessment Food frequency questionnaire (self administered)MethodTiming15 <strong>and</strong> 32 weeks gestation for questionnaire which related to previous 3 monthsComparisonConsumption of various types of fish <strong>and</strong> shellfish in 8 categories: Never, once every 2-3 months, once a month, once a fortnight, 1-2 times per week, 3-6 times perweek, once a day, more than once a day.Note for analysis of Overall Fish intake: combined 8 categories into 4 (never,
Oily fish consumption Never
Reference Giordano 2010Food typeFish <strong>and</strong> shellfishStudy typeCase-control studyLevel of evidence III-3 (aetiology)SettingRome, ItalyFundingNot reportedParticipants80 cases of hypospadias requiring surgical treatment in children aged 0 to 24 months (mean age 57.62 weeks)80 controls: healthy males without any congenital defect, aged 0 to 24 months (mean age 36.52 weeks);recruited between September 2005 <strong>and</strong> May 2007Baseline comparisons See confounding belowDietary assessment Interview on ‘typical’ maternal diet habits in relation to the index pregnancy <strong>and</strong> food frequenciesTimingFFQ administered on recruitment for mothers of cases <strong>and</strong> during vaccination visits for mothers of controlsComparisonRare versus frequent consumption of fish <strong>and</strong> shellfishOutcomesHypospadiasResultsFish or shellfishCases Controls OR aORRare 58 (72.5%) 72 (90.0%) 1.00 1.00Frequent 22 (27.5%) 8 (10.0%) 3.41 95% CI 1.42 to 8.23 2.73 95% CI 1.09 to 6.82FollowupConfoundingRisk of biasRelevanceOther commentsn/aAdjusted for mother’s BMI at conception <strong>and</strong> education of the father;Gestational age, birthweight <strong>and</strong> SGA were not included among the covariates in the regression models, as they may share a common aetiology withhypospadiasModerate risk of bias: Participation rate of parents of cases was higher than that of controls (85% versus 70%); very few potential confounders used inadjusted analysesLikely to be reasonably relevant for Australian women, although risk of pollution less likely in AustraliaLikely to be underpowered;Authors postulate the positive finding may be due to the presence of persistent organic pollutants in fishDietary guidelines for pregnant <strong>and</strong> <strong>breastfeeding</strong> women: evidence report274
Reference Giordano 2008Food typeFish <strong>and</strong> shellfishStudy typeCase-control studyLevel of evidence III-3 (aetiology)SettingSicily, ItalyFundingSicilian Congenital Malformation RegistryParticipants90 cases: 43 cases of hypospadias <strong>and</strong> 48 cases of cryptorchidism (both in one infant)202 controls: r<strong>and</strong>omly selected controls born in the same year <strong>and</strong> the same regionBirths between 1998 to 2003Baseline comparisons Low birthweight, low maternal education, mother’s history of gynaecological disease <strong>and</strong> father’s history of urogenital diseases differed significantlybetween cases <strong>and</strong> controlsSee confounding belowDietary assessment Interview on maternal diet <strong>and</strong> food frequenciesTimingFFQComparisonConsumption of fish once a week or less vs more than once a week;Consumption of shellfish once a week or less vs more than once a weekOutcomesHypospadias <strong>and</strong> cryptorchidismResultsFishHypospadiasCases Controls OR≤ 1/week 25 (58.1%) 140 (69.3%) 1.00>1/week 18 (41.9%) 62 (30.7%) 1.63 95% CI 0.83 to 3.20Cryptorchidism≤ 1/week 29 (60.4%) 140 (69.3%) 1.00>1/week 19 (39.6%) 62 (30.7%) 1.48 95% CI 0.77 to 2.84Hypospadias <strong>and</strong>cryptorchidism≤ 1/week 53 (58.9%) 140 (69.3%) 1.00>1/week 37 (41.1%) 62 (30.7%) 1.58 95% CI 0.94 to 2.64ShellfishHypospadias≤ 1/week 40 (93.0%) 197 (97.5%) 1.00>1/week 3 (7.0%) 5 (2.5%) 2.96 95% CI 0.68 to 12.87Cryptorchidism≤ 1/week 43 (93.8%) 197 (97.5%) 1.00>1/week 3 (6.2%) 5 (2.5%) 2.63 95% CI 0.61 to 11.40FishHypospadias <strong>and</strong>cryptorchidism≤ 1/week 84 (93.3%) 197 (97.5%) 1.00275
1/week 6 (6.7%) 5 (2.5%) 2.81 95% CI 0.84 TO 9.48Fish: adjusted analysis*aORHypospadias>1/week 2.33 95% CI 1.03 to 5.31Cryptorchidism>1/week 1.33 95% CI 0.61 to 2.90Hypospadias <strong>and</strong>cryptorchidism>1/week 1.75 95% CI 0.95 to 3.24Followupn/aConfounding*Fish were additionally adjusted for mother’s age, parity, education, gynaecological diseases; paternal urogenital diseases, <strong>and</strong> use of pesticides;birthweightRisk of bias Moderate risk of bias: Participation rate of parents <strong>and</strong> data collection rate of cases was lower than that of controls (76% versus 91%)RelevanceLikely to be reasonably relevant for Australian women, although hypospadias rates very high <strong>and</strong> unlikely that most Australian women will have suchhigh pesticide exposureOther comments Ragusa region in Sicily is a region of intensive agriculture (involving high rates of pesticide <strong>and</strong> other chemical use) with high rates of hypospadias <strong>and</strong>cryptorchidismDietary guidelines for pregnant <strong>and</strong> <strong>breastfeeding</strong> women: evidence report276
Reference Golding 2009Food typeFishStudy typeProspective cohort studyLevel of evidence II (aetiology)SettingSouth West Engl<strong>and</strong>, Avon Longitudinal Study of Parents <strong>and</strong> Children (ALSPAC), recruited during prenatal health visits. Eligible for ALSPAC - allchildren born to mothers residing in Bristol <strong>and</strong> surrounding areas between April 1991 <strong>and</strong> December 1992.FundingThe UK Medical Research Council, the Wellcome Trust, <strong>and</strong> the University of Bristol currently provide core support for ALSPAC; a variety of sourcesincluding UK Department of the Environment <strong>and</strong> the Ministry of Agriculture, Fisheries, <strong>and</strong> Food; <strong>and</strong> supported in part by the Intramural ResearchProgram of the NIH, NIAAA, <strong>and</strong> by a personal gift of John M. Davis.Participants 9,960 singleton pregnancies, (from initial cohort =14,541) expected birth April 1991-December 1992Baseline comparisons See confoundingDietary Assessment Food frequency questionnaireTimingFFQ <strong>and</strong> Edinburgh Postnatal Depression Scale (EPDS) at 32 weeks gestationComparisonSeafood exposure:a) Noneb) Between 1 <strong>and</strong> 340 g/week (equates to 340 g/week (equates to 3 or more average portions fish per week)Further grouped to: Omega-3 grams/week None, 0.1-0.4; 0.4-1.5; >1.5OutcomesHigh levels depressive symptoms (self report at 32 weeks gestation, using EPDS score > 12) ) at 18 <strong>and</strong> 32 weeks gestation <strong>and</strong> at 2 <strong>and</strong> 8 monthsafter birthResultsMothers who consumed no seafood were 50% more likely to have high levels of depressive symptoms compared to those who consumedsubstantial amounts of seafood at 32 weeks gestationOmega-3 Intake(g/wk)Adjusted OR (95%CI)None 1.54 (1.25–1.89)0.1–0.4 1.37 (1.13–1.66)0.4–1.5 1.20 (1.03–1.41)>1.5 (ref category) 1.00P for trend
Reference Guldner 2007Dietary patterns Fish <strong>and</strong> shellfish: salt-water fish (including salmon); molluscs (oysters, mussels, etc.); crustaceans (crabs, shrimp etc.)Study typeProspective cohort study (PELAGIE)Level of evidence II (aetiology)SettingBrittany, FranceFundingRegional Council of Brittany, National Institute for Public <strong>Health</strong> Surveillance (inVS), Ministry of LaborParticipants2398 pregnant women enrolled from April 2002 to February in the first trimester of their pregnancyBaseline comparisonsAssessmentTimingComparisonOutcomesResultsSee confounding belowFFQDuring first trimester of pregnancy, to reflect pre-pregnancy consumption‘never or less than once a month’ versus ‘every day’: 0.5, 3, 10, 20 <strong>and</strong> 30 meals of the specific foods a monthSGA < 10 th percentile of gestational age <strong>and</strong> sex, according to French reference curves); preterm birth < 37 weeks; gestational age, birthweight; lowbirthweightPTB LBW SGA aOR (95% CI)Fish PTB LBW SGA< 1/month (n=406) 4.5% 4.4% 7.1% 1.00 1.00 1.001-4/month (n=1266) 4.6% 3.3% 5.1% 1.06 (0.60 to 1.87) 0.59 (0.23 to 1.55) 0.72 (0.44 to 1.19)≥2/week (n=606) 3.0% 1.8% 4.5% 0.71 (0.35 to 1.46) 0.59 (0.18 to 1.91) 0.57 (0.31 to 1.05)P (linear trend) 1.0 0.0008 0.04 0.3 0.4 0.07Multiple linear regression for length of gestation (weeks): β 0.018 95% CI 0.002 to 0.035; p = 0.03Multiple linear regression for birthweight (g): β -1.556 95% CI -5.587 to 2.476; p = 0.8Shellfish< 1/month (n=1548) 4.6% 3.4% 4.8% 1.00 1.00 1.001-4/month (n=548) 3.3% 2.4% 5.7% 0.81 (0.47 to 1.39) 1.09 (0.45 to 2.62) 1.33 (0.83 to 2.11)≥2/week (n=182) 2.8% 3.3% 7.7% 0.66 (0.26 to 1.70) 2.24 (0.70 to 7.15) 2.14 (1.13 to4.07)P (linear trend) 0.06 0.3 0.05 0.3 0.2 0.02Multiple linear regression for length of gestation (weeks): β -0.018 95% CI -0.041 to 0.005; p = 0.1Multiple regression for birthweight (g): β 1.50 95% CI -4.017 to 7.016; p = 1.0FollowupConfoundingRisk of biasRelevanceOther commentsTo birthAnalyses adjusted for maternal age, marital status, education level, parity, BMI, maternal height, smoking status, alcohol consumption, diabetes, genderof child (low birthweight was additionally adjusted for duration of gestation)Low risk of bias: 80% return of questionnaire (n = 2398 returned); birth outcomes available for 2353 (89%) of womenHigh fish consumption in this populationAverage of 7.6 seafood meals a month (4.6 fish <strong>and</strong> 3.0 shellfish) equates to mean daily intake of 20.4 g/day of fish <strong>and</strong> 19.7 g/day of shellfish’;Differences in findings may be due to higher levels of contaminants in shellfish (due to their filter feeding)Dietary guidelines for pregnant <strong>and</strong> <strong>breastfeeding</strong> women: evidence report278
Reference Haggarty 2009Dietary patterns Fish: oily fish, other fishStudy typeProspective cohort studyLevel of evidence II (aetiology)SettingAberdeen, Scotl<strong>and</strong>FundingUK Food St<strong>and</strong>ards AgencyParticipants1277 sequentially enrolled pregnant women attending Aberdeen Maternity Hospital for ultrasound (a further 184 women were recruited later inpregnancy).Exclusions: diabetic women, women with multiple pregnancies, women who conceived as a result of fertility treatment, or clinical data not availableBaseline comparisons See confounding belowAssessmentFFQTimingAssessed at 19 weeks gestationComparisonIntake of fish <strong>and</strong> oily fish by deciles of deprivationOutcomesDeprivation (assessed using the Scottish Index of Multiple Deprivation)Low birthweight (defined as < 2500 g or lowest decile for birthweight z score adjusted for gestational age, sex <strong>and</strong> parity)Preterm birth (< 37 weeks)Admission to neonatal unitResultsDeprivationFish overall: no significant differences seen between intake of fish <strong>and</strong> deciles of deprivationOily fish: significantly lower intake with higher levels of deprivation (p < 0.01)FollowupConfoundingRisk of biasRelevanceOther commentsTo neonatal period(Some?) analyses adjusted for energy intakeLow to moderate risk of bias: low attrition, some lack of detail in reporting of outcomesLikely to be relevant to Australian womenAbout 40-50% of the least deprived women reported taking folic acid supplements compared with about 20% for the most deprived women;Most birth outcome associations were reported by nutrient rather than food group;Not easy to deduce quantities of intake of foods (main graphs reported as change in intake by deprivation decile)Fish279
Reference Halldorsson 2007Food typeFishStudy typeProspective cohort from the Danish National Birth CohortLevel of evidence II (aetiology)SettingDenmarkFundingNordic Academy for Advanced Study, Nordic Working Group on Fishery Research, EARNEST, March of Dimes, Danish National Research Foundation,Danish Pharmacy Foundation, Egmont Foundation, Augustinus Foundation, <strong>Health</strong> Foundation, European Union, Danish Medical ResearchFoundation, Heart FoundationParticipants 44,824 pregnant women (6-10 weeks gestation) attending first antenatal visit at the general practitioner between 1996 <strong>and</strong> 2002Baseline comparisons See confounding belowDietary assessment FFQ on type & frequency of fish consumedTiming~25 weeks GAComparison Total fish intake (g/d): 5-20, >20-40, >40-60, >60;Frequency of intake (meal/month): 0, 1, 2-3, adjusted OR for SGA 1.18, 95% CI: 1.03, 1.35; ≥ 4 for both fatty & lean fishOutcomesBirth weight, length, head circumference <strong>and</strong> small for gestational ageResultsTotal intake with birthweight:Unadjusted: +ve association, p
Reference Halldorsson 2008Food groupsFishStudy typeProspective cohort studyLevel of evidence II (aetiology)SettingDanish National Birth Cohort, Denmark 1996-2002, recruited during first antenatal visit with GPFundingNordic Academy for Advanced Study, Nordic Working Group on Fishery Research, EARNEST, NewGeneris, March of Dimes, Danish NationalResearch Foundation, Danish Pharmaceutical Foundation, Danish Medical Research Foundation, Danish Heart Association, Ministry of <strong>Health</strong>(Denmark), National Board of <strong>Health</strong> (Denmark), Sygekasserenes Helsefond, Statens Serum InstitutParticipants 100 nulliparous women aged 25-35 years with normal pre-pregnancy BMI <strong>and</strong> consistent fish intake <strong>and</strong> recruited between 1998 <strong>and</strong> 2002Baseline comparisons See confounding belowDietary Assessment FFQ assessing fish consumption at 25 weeks gestation-self administered, 10-15 min phone interview at 12 <strong>and</strong> 30 weeks gestationTimingFFQ assessing fish consumption at 25 weeks gestation <strong>and</strong> frequency of fish (species not specified) intake asked at 12 <strong>and</strong> 30 weeks gestation overthe phone, cord blood <strong>and</strong> 2 maternal blood samples collected at routine GP visits (8 <strong>and</strong> 25 weeks gestation)ComparisonAverage fish intake: low (0), medium (1-3) or high (≥4) meals per month of fatty fishOutcomesPlasma concentrations of PCBs, association between maternal PCB concentration <strong>and</strong> birth weight, height, head circumference <strong>and</strong> placental weightResultsSpearmans r=0.54, P
Reference Haugen 2008Dietary patterns Fish as part of Mediterranean-type diet (2 or more serves of fish per week)Study typeProspective cohort studyLevel of evidence II (aetiology)SettingNorway (part of the Norwegian Mother <strong>and</strong> Child Cohort Study (MoBa))FundingNorwegian Ministry of <strong>Health</strong>, NIH/NINDS, Norwegian Research Council/FUGE, EU FP& consortium, Metabolic Programming (EARNEST).Participants40,817 pregnancies of women recruited for MoBa from February 2002 to February 2005 of whom 26,563 (65%) met the following criteria: women had tobe non-smoking, BMI between 19 <strong>and</strong> 32, aged between 21 <strong>and</strong> 38 years when giving birth, with a singleton birth.Exclusions: more than 3 spontaneous abortions, energy intake less than 4,200 kJ <strong>and</strong> more than 16,700 kJ.Baseline comparisons See confounding belowTimingFFQ at 17-24 weeks gestationComparisonFish ≥ 2 times a week v < 2 times a weekOutcomesPreterm birth (after week 21 <strong>and</strong> before week 37); late preterm birth (week 35-36) <strong>and</strong> early preterm birth (< 35 weeks)ResultsPreterm birth (< 37 weeks): (n = 25,966; 1174 cases)OR 0.81 95% CI 0.72 to 0.92aOR 0.84 95% CI 0.74 to 0.95Early preterm birth (< 35 weeks): (n = 25,256; 474 cases)OR 0.81 95% CI 0.67 to 0.97aOR 0.84 95% CI 0.70 to 1.02Late preterm birth (35-36 weeks): (n = 25,492; 710 cases)OR 0.83 95% CI 0.71 to 0.96aOR 0.84 95% CI 0.72 to 0.98FollowupConfoundingRisk of biasRelevanceOther commentsTo birthAnalyses were adjusted for remaining Mediterranean diet criteria, mother’s BMI <strong>and</strong> height, educational level, parity <strong>and</strong> marital statusModerate: some dietary intakes were different between groups <strong>and</strong> were not controlled forModerate: low red meat consumption not typical for many Australian womenPreterm birth rates were lower than expected, likely due to exclusion of smokersDietary guidelines for pregnant <strong>and</strong> <strong>breastfeeding</strong> women: evidence report282
Reference Hibbeln 2007Food groupsSeafood (white fish, oily fish, shellfish)Study typeProspective cohortLevel of evidence II (aetiology)SettingBristol region, UK (ALSPAC)FundingMedical Research Council, Wellcome Trust, University of Bristol, UK government departments, “medical charities <strong>and</strong> other sources”, NIH.Participants 8801 pregnant women with an expected due date between April 1, 1991 <strong>and</strong> Dec 31, 1992Baseline comparisons See Confounding belowDietary assessment FFQTimingFFQ assessing seafood consumption at 32 weeks’ gestationComparisons> 340 g seafood per week v 1-340 g seafood per week v none; three serves of seafood a week equates to about 347 g per weekOutcomesChild: Cognition at 8 years (verbal, performance, total IQ); Behaviour at 7 years (prosocial, peer problems, hyperactivity, emotional, conduct, total);Gross motor skills (6, 18, 30, 42 months); Fine motor skills (6, 18, 30, 42 months); Social skills (6, 18, 30, 42 months); Communication skills (6, 18months)ResultsChild cognition at 8 years (aOR 95% CI)N None v > 340 g/wk 1-340 g/wk v > 340 g/wk p for trendVerbal IQ 5047 1.48 (1.16 to 1.90) 1.09 (0.92 to 1.29) 0.0041Performance IQ 5042 0.98 (0.76 to 1.27) 0.99 (0.84 to 1.18) 0.9015Full scale IQ 5000 1.29 (0.99 to 1.69) 1.19 (0.99 to 1.42) 0.0389Child behaviour at 7 years (aOR 95% CI)N None v > 340 g/wk 1-340 g/wk v > 340 g/wk p for trendProsocial 6582 1.44 (1.05 to 1.97) 1.16 (0.93 to 1.44) 0.0249Hyperactivity 6575 1.13 (0.84 to 1.53 0.91 (0.73 to 1.12) 0.6293Emotional 6582 1.09 (0.83 to 1.44) 0.96 (0.80 to 1.17) 0.6810Conduct 6586 1.21 (0.89 to 1.64) 1.01 (0.81 to 1.25) 0.2869Peer problems 6581 1.25 (0.96 to 1.62) 0.97 (0.80 to 1.16) 0.1753Total score 6570 1.17 (0.86 to 1.60) 0.98 (0.79 to 1.22) 0.3832FishChild development at 6 to 42 months (aOR 95% CI)N None v > 340 g/wk 1-340 g/wk v > 340 g/wk p for trendGross motor skills6 months 8764 1.10 (0.90 to 1.34 1.06 (0.92 to 1.21) 0.326218 months 8227 1.02 (0.85 to 1.22) 1.10 (0.89 to 1.13) 0.842030 months 7720 0.97 (0.80 to 1.18) 1.03 (0.90 to 1.17) 0.940242 months 7603 0.96 (0.78 to 1.18) 0.99 (0.87 to 1.13) 0.7159Fine motor skills6 months 8746 1.01 (0.83 to 1.23) 1.12 (0.99 to 1.28) 0.519118 months 8228 1.25 (1.04 to 1.51) 1.09 (0.96 to 1.23) 0.022230 months 7728 1.04 (0.85 to 1.27) 1.04 (0.91 to 1.19) 0.616342 months 7596 1.35 (1.09 to 1.66) 1.14 (0.98 to 1.31) 0.0053Social development6 months 8743 1.15 (0.95 to 1.40) 1.01 (0.89 to 1.16) 0.217318 months 8226 1.01 (0.83 to 1.24) 1.01 (0.88 to 1.15) 0.893730 months 7711 1.24 (1.01 to 1.53) 1.12 (0.98 to 1.29) 0.0326283
Length of followupConfoundingRisk of biasRelevanceOther comments42 months 7592 1.21 (0.98 to 1.50) 1.17 (1.01 to 1.35) 0.0377Communication6 months 8745 1.30 (1.04 to 1.63) 1.15 (0.98 to 1.35) 0.018418 months 8237 1.26 (1.03 to 1.53) 1.02 (0.90 to 1.17) 0.04856 months to 8 years (depending on outcome – see above)Analyses adjusted for maternal education, housing, crowding at home, life events, partner, maternal age, maternal smoking in pregnancy, maternalalcohol use in pregnancy, parity, <strong>breastfeeding</strong>, gender of child, ethnic origin, birthweight, preterm birth, 12 non-fish food groupsLow-moderate risk of bias: not adjusted for maternal IQ or home environment; attrition was disproportionately high in families with social disadvantage<strong>and</strong> lower seafood intake; however this may have acted to underestimate any association with child development - 8801/11,875 (74.1%) women haddata available for confounding variables <strong>and</strong> had completed at least one valid response on the questionnaire. This dropped to 5,000 (42.1%) at 8 yearfollow-up.Likely to be relevant to Australian womenOnly 1.7% of women in the study took fish oil supplements;ALSPAC is reasonably representative of the British population which has a mean mercury consumption (0.05 µg/kg bodyweight); higher than US (0.02)Dietary guidelines for pregnant <strong>and</strong> <strong>breastfeeding</strong> women: evidence report284
Reference Jedrychowski 2010Dietary patterns FishStudy typeProspective cohort studyLevel of evidence II (aetiology)SettingNew York City, USA <strong>and</strong> Krakow, Pol<strong>and</strong>FundingNIEHS, Gladys <strong>and</strong> Rol<strong>and</strong> Harriman Foundation, New YorkParticipants 481 nonsmoking women with singleton pregnancies, 18-35 years of age, giving birth at term (> 36 weeks) between January 2001 <strong>and</strong> February 2004;eligible if attending antenatal care in 1 st <strong>and</strong> 2 nd trimesters <strong>and</strong> free from chronic diseases such as diabetes <strong>and</strong> hypertensionBaseline comparisons See confounding belowDietary assessment FFQTimingFFQ twice (in 2 nd <strong>and</strong> 3 rd trimester)ComparisonFish intake: never, < once per month, once a week, 1-2 times a week, 3-4 times a week, every day (assumed each meal = 150 g of fish)OutcomesFine particulate matter (from personal monitoring during 2 nd trimester); birthweightResultsBIRTHWEIGHTLow fish intake (< 91 g/week) <strong>and</strong> high antenatal fine particulate matter concentrations (> 46.3 µg/m 3 )Regression coefficient: -133.26 g birthweight (p = 0.052)Medium fish intake (91 to 205 g/week) <strong>and</strong> high antenatal fine particulate matter concentrations (> 46.3 µg/m 3 )Regression coefficient: -93.38 g birthweight (p = 0.247)High fish intake (> 205 g/week) <strong>and</strong> high antenatal fine particulate matter concentrations (> 46.3 µg/m 3 )Regression coefficient: -23.69 g birthweight (p = 0.811)FollowupConfoundingRisk of biasRelevanceOther commentsTo birthMaternal age, maternal size (height, prepregnancy weight), maternal education, parity, gestational age, gender of child, season of birthModerate risk of bias: selection bias from excluding smokers <strong>and</strong> women with conditions that may affect fetal growthUnclear if exposures to fine particulate matter are similar in AustraliaNeither birthweight or amount of fine particulate matter alone were significantly associated with amount of fish intakeFish285
Reference Jedrychowski 2008Dietary patterns Fish (smoked, fried, roasted, grilled)Study typeProspective cohort studyLevel of evidence II (aetiology)SettingKrakow, Pol<strong>and</strong>FundingNIEHS, Gladys <strong>and</strong> Rol<strong>and</strong> Harriman FoundationParticipants465 nonsmoking women aged 18-35 years who gave birth between 29 <strong>and</strong> 43 weeks gestation between January 2001 <strong>and</strong> February 2004; eligible ifattending antenatal care in 1 st <strong>and</strong> 2 nd trimesters; with singleton pregnancies <strong>and</strong> free from chronic diseases such as diabetes <strong>and</strong> hypertensionBaseline comparisons See confounding belowDietary assessment FFQTimingFFQ twice (in 2 nd <strong>and</strong> 3 rd trimester)Comparison Fish intake: range 0 to 1050 g/week; median 150 g/week (95% CI 145 to 150)OutcomesFine particulate matter (from personal monitoring during 2 nd trimester); respiratory symptoms in 2 year infantsResultsCoughing in infants up to 2 years of ageInteraction term (PM 2.5 category X fish consumption level): aIRR 1.36 95% CI 0.79 to 1.43Wheezing in infants up to 2 years of ageInteraction term (PM 2.5 category X fish consumption level): aIRR 0.80 95% CI 0.72 to 0.89Difficult breathing in infants up to 2 years of ageInteraction term (PM 2.5 category X fish consumption level): aIRR 0.81 95% CI 0.72 to 0.91FollowupUntil infants reached 2 years of ageConfoundingMaternal education, maternal atopy, <strong>breastfeeding</strong>, postnatal environmental tobacco smoke, parity, gestational age, gender of child, moulds in thehouseholdRisk of biasLow-moderate risk of bias: not stated if any participants were lost to follow up; smokers were excludedRelevanceUnclear if exposures to fine particulate matter are similar in AustraliaOther comments Likely to be the same population as Jedrychowski 2010Dietary guidelines for pregnant <strong>and</strong> <strong>breastfeeding</strong> women: evidence report286
Reference Jensen 2004Food typeFish: Oysters, fried fish, fish (broiled or baked)Study typeCase controlLevel of evidence III-3 (aetiology)SettingCalifornia, USA (part of the Northern California Childhood Leukemia Study)FundingPHSParticipants138 matched cases <strong>and</strong> controls:Cases: Children under 15 years of age, with a parent who spoke English or Spanish, were resident in the study area at the time of diagnosis of acutelymphoblastic leukemia (ALL), with no prior diagnosis of cancerControls: identified from birth certificates matched to the case on date of birth, sex, maternal race, Hispanic ethnicity of mother or father, <strong>and</strong> county ofresidence at birthBaseline comparisons A priori potential confounders were identified as birthweight, <strong>breastfeeding</strong>, maternal age <strong>and</strong> education, parental occupation <strong>and</strong> smoking duringpregnancy – no evidence of confounding was seen for these variables. Also see Confounding below.Dietary assessment FFQTimingDietary intake to reflect the year before the index pregnancy (to indicate dietary status at the start of pregnancy)ComparisonServes of fishOutcomesChildhood acute lymphoblastic leukemiaResults Oysters: aOR 1.00 95% CI 0.52 to 1.94: mean consumption 1.11 [SD 0.44] serves per day*Fried fish: aOR 0.97 95% CI 0.82 to 1.30: mean consumption 1.64 [SD 1.13] serves per dayFish (broiled or baked): aOR 1.03 95% CI 0.71 to 1.08: mean consumption 2.11 [SD 1.40] serves per dayFollowupConfoundingRisk of biasRelevanceOther commentsn/aAnalyses were adjusted for variables previously shown to be significantly associated with ALL in the overall study – income, prior fetal loss, child’sexposure to other children under age five, <strong>and</strong> maternal exposure to indoor insecticides during pregnancy; along with portion size <strong>and</strong> energyconsumptionLow-moderate risk of bias: Of eligible cases identified from January 1995 to November 1999, 83% consented to participate; 69% of the eligible controlsagreed to participate. Of the 161 matched pairs, seven pairs were excluded as the respondent was not the biological mother, 16 pairs were excluded dueto questionable dietary questionnaire data, leaving 138 matched pairs (86%); some recall bias likelyLikely to be relevant for Australian women, though some diet components may differ e.g. high bean consumption*Some consumption levels seem high – possibly per week rather than per day?Fish as a group not reported (included under a protein group)Fish287
Reference Jones 2000 (see also Yin 2010)Food typeFishStudy typeProspective cohortLevel of evidence II (aetiology)SettingSouthern Tasmania, AustraliaFundingNHMRC, Tasmanian Government, Royal Hobart Hospital Acute Care ProgramParticipants173 mothers; <strong>and</strong> their infants born in 1988 (part of a larger infant health study of babies at high risk of SIDS)Exclusions: multiple pregnanciesBaseline comparisons Mothers with no tertiary education more likely to have been excluded due to missing dataDietary assessment FFQTimingDietary intake during third trimester of pregnancyComparisonLinear regression of density (portions per kJ)OutcomesBone mass (bone mineral density (BMD) <strong>and</strong> bone mineral content*) in 8 year old childrenResultsBMD at 8 years;Total body (g/cm 2 )r 2 2% 0.049 (p = 0.05)adjusted r 2 24% 0.034 (p = 0.15)Femoral neck (g/cm 2 )r 2 1% 0.035 (p = 0.43)adjusted r 2 33% 0.020 (p = 0.57)Lumbar spine (g/cm 2 )r 2 0% 0.010 (p = 0.86)adjusted r 2 32% -0.010 (p = 0.75)Followup8 yearsConfounding Analyses were adjusted for method of dietary assessment, maternal education, parental unemployment, sex, weight at age 8 years, height at age 8years, weekend sunlight exposure in winter at age 8 years, smoking during pregnancy, sports participation, ever breast-fed <strong>and</strong> current calcium intake.Risk of biasModerate-high: 330 (215 males, 115 females) representing a 60% response rate from those available in 1996; 47% of the original 1988 cohort, Thisdropped to 173 (dietary information missing or unreliable for 115 mothers, 32 multiple births, 10 participants had missing data for confounders)representing 52% of participants from 1996 <strong>and</strong> 25% of those in the original cohort.72% of the 173 participants were male. Gender imbalance suggests potential selection bias (due to original selection of infants at high risk of SIDS)RelevanceInfants at high risk of SIDS represent a selected group (more males, preterm births, teenage mothers, smoking during pregnancy)Other comments *Bone mineral content not reported – stated to be similar to bone mineral density resultsDietary guidelines for pregnant <strong>and</strong> <strong>breastfeeding</strong> women: evidence report288
Reference Lamb 2008Dietary patterns Fish: canned tuna, dark-meat fish (mackerel, salmon, sardines, bluefish, swordfish etc), other fish, <strong>and</strong> shrimp, lobster or scallops as a main dishStudy typePart of a longitudinal prospective birth cohort studyLevel of evidence II (aetiology)SettingDenver, Colorado, US (part of the Diabetes Autoimmunity Study in the Young (the DAISY))FundingNational Institutes of <strong>Health</strong>, Diabetes Endocrine Research CenterParticipants642 newborns at increased risk for type 1 diabetes (based on HLA genotype <strong>and</strong> family history), enrolled in the study from 1993 to 2004; 27 casesdefined as testing positive for islet autoantibodies at two consecutive blood draws <strong>and</strong> still positive (diabetic) at last follow-upBaseline comparisons See confounding belowDietary assessment FFQTimingFrom 1997 to 2004, mothers of infants enrolled in DAISY completed FFQ soon after birth, reflecting diet in the last trimester of pregnancy (but couldsubmit FFQ before child reached one year of age)ComparisonMonthly servings of fishOutcomes Islet autoimmunity in children (a precursor of type 1 diabetes) at 9 months, 15 months, 2 years <strong>and</strong> annually thereafter up to the age of 15ResultsFish:aHR (for one st<strong>and</strong>ard deviation change in reported consumption) 0.90 95% CI 0.54 to 1.51 (5.10 mean monthly servings)FollowupConfoundingRisk of biasRelevanceOther commentsUp to 15 yearsSize for gestational age, ethnicity, maternal education, household income, exposure to type 1 diabetes or GDM in utero, gender of child, maternal ageat birth, total calories of maternal dietModerate risk of bias: subset of DAISY only (later enrolments); <strong>and</strong> women were not reminded to submit FFQ, leading to possible selection bias; of the661 FFQs returned, 5 were excluded because incomplete, <strong>and</strong> 14 for implausible dietary intakes, leaving 642 FFQs for analysis; child’s diet notcontrolled forLikely to be relevant to some Australian women, although women in this study may have been at higher risk of diabetesFish289
Reference Latva-Pukkila 2009Dietary patterns FishStudy typeProspective cohort studyLevel of evidence II (aetiology)Setting Turku, Finl<strong>and</strong> (cohort from Piirainen 2006)FundingSocial Insurance Institution of Finl<strong>and</strong>, the Sigrid Juselius Foundation <strong>and</strong> the Academy of Finl<strong>and</strong>Participants256 pregnant womenBaseline comparisons Women with NVP were older <strong>and</strong> tended to be primiparous compared to those withoutDietary assessment 3 day food diariesTimingThree times during pregnancy (mean 14, 24 <strong>and</strong> 34 weeks gestation)ComparisonWith nausea <strong>and</strong> vomiting in pregnancy (NVP) versus no NVP;134 (72%) women reported experiencing nausea; with 40 (30%) vomiting (9 (4.8%) more than once a day) during the first trimesterOutcomesInfluence of nausea <strong>and</strong> vomiting in pregnancy on dietary intake;Severity of NVP assessed as having no nausea <strong>and</strong> vomiting, only nausea, vomiting once a day or vomiting more than once a day, with the primaryoutcome being presence or absence of nauseaResults With NVP (n = 134 Without NVP (n = 53) pFish products (g), median (IQR) daily 18 (0 to 40) 20 (0 to 55) 0.446FollowupConfoundingRisk of biasRelevanceOther commentsTo 34 weeks gestationNot reported if any of the analyses were adjustedModerate risk of bias: not clear if analyses were adjusted for potential confoundersLikely to be relevant to Australian womenDietary guidelines for pregnant <strong>and</strong> <strong>breastfeeding</strong> women: evidence report290
Reference Lauritzen 2005a; Lauritzen 2005b; Lauritzen 2005c; Lauritzen 2004a; Ulbak 2004; Asserhoj 2009Dietary patterns FishStudy typeNon-r<strong>and</strong>omised comparative study (control arm of RCT compared with a reference group)Level of evidence III-2 (intervention)Setting Denmark (women recruited from the Danish National Birth Cohort during 1999)FundingFOTEK (Danish Research <strong>and</strong> Development Program for Food <strong>and</strong> Technology) <strong>and</strong> BASF AktiengesellschaftParticipants110 pregnant women (60 with a low fish intake; < 0.4 g n-3 LCPUFA.d -1 <strong>and</strong> 50 with a high fish intake > 0.8 g n-3 LCPUFA. d-1 ) with an uncomplicatedpregnancy, normal pre-pregnancy BMI, no metabolic disorders, an intention to breastfeed for at least four months, with healthy singleton term infantswith normal weight for gestation <strong>and</strong> an Apgar score > 7 at 5 minutes.Baseline comparisons n/aDietary assessment Low fish intake ascertained by FFQ at 25 weeks gestation to reflect diet in previous four weeksTimingSee aboveComparisonLow fish intake; below population median (without fish oil supplementation) versus high fish intake (upper quartile of the population) during first fourmonths of maternal lactationOutcomesInfant problem solving ability at nine months (The Infant Planning Test); infant linguistic development at one <strong>and</strong> two years of age (MacarthurCommunicative Development Inventory); overall motor function; sitting without support; children’s blood pressure at 2.5 years of ageResultsVisual acuity at 4 monthsNo significant differences between the low <strong>and</strong> high fish intake groups were seen for visual acuity at 4 monthsProblem solving at nine months (intention score entire problem)Low fish intake: 4.3 [SD3.6] (n = 38); High fish intake: 4.5 [SD3.3] (n = 42)Linguistic development at one year:Starting to talk (%)Low fish intake: 16/37 (43.2%); High fish intake: 17/42 (40.5%)Vocabulary comprehension (no. of words)Low fish intake: 71 [SD45] (n = 37); High fish intake: 65 [SD40] (n = 42)Linguistic development at two years:Vocabulary production (no. of words)Low fish intake: 297 [SD147] (n = 31); High fish intake: 312 [SD146] (n = 40)Sitting without supportLow fish intake: 6.5 [SD0.8]; High fish intake: 6.4 [SD1.0]Overall motor functionNo significant differences between the low <strong>and</strong> high fish intake groups (numeric results not reported)2.5 year followupBlood pressure at 2.5 yearsNo significant differences seen between the low (n=22) <strong>and</strong> high fish intake groups (n=25)No significant differences seen between the low <strong>and</strong> high fish intake groups for head circumference, weight, length/height, ponderal index or BMI frombirth to 2.5 years of ageFish291
Seven year follow-upAmount of time very active was significantly higher in the high fish intake group than the low fish intake group (p = 0.039)No significant differences between the two groups at 7 years were seen in body composition measures (such as head circumference, BMI or beingoverweight) or blood pressureFollowupTo seven years of ageConfoundingn/aRisk of bias Low to moderate risk of bias: 13/60 (21.7%) from the low fish intake group <strong>and</strong> 2/50 (4%) from the high fish intake group were lost to followup; at 2.5years follow-up, 22/60 <strong>and</strong> 21/50 respectively were available for analysis; at seven years, 28/60 <strong>and</strong> 34/50 respectively; not all analyses controlled forconfoundersRelevanceLikely to be relevant to Australian womenOther comments Likely to be underpowered, particularly with losses to follow-up over timeDietary guidelines for pregnant <strong>and</strong> <strong>breastfeeding</strong> women: evidence report292
Reference Maconochie 2007Food groupsFishStudy typeCase-control study (postal survey sampled from the electoral roll – National Women’s <strong>Health</strong> Study)Level of evidence III-3 (aetiology)SettingUK general populationFundingNational Lottery Community Fund, Miscarriage AssociationParticipantsCases: 603 women aged 18 to 55 years whose most recent pregnancy had ended in first trimester miscarriage (< 13 weeks gestation);Controls: 6116 women aged 18 to 55 years whose most recent pregnancy had progressed beyond 12 weeksBaselineComparisonsBMI < 18.5 was significantly associated with odds of miscarriageAlso see Confounding belowDietary Assessment questionnaireTimingDiet in the three months prior to conception <strong>and</strong> the first 12 weeks of pregnancyComparisonAt least twice weeklyOutcomesFirst trimester miscarriageResultsFish twice weekly or moreCases Controls aOR (95% CI) aOR further adjusted for nauseaNo 372 (66%) 3552 (62%) 1.00 1.00Yes 189 (34%) 2207 (38%) 0.83 (0.69 to 1.00) 0.86 (0.71 to 1.03)Length of followup n/aConfoundingAdjusted for year of conception, maternal age, previous miscarriage <strong>and</strong> previous live birth; <strong>and</strong> further adjusted for nausea in the first 12 weeks ofpregnancyRisk of bias Low risk of bias: 88% of eligible women responding to stage 1 agreed to participate in the second stage of the study; <strong>and</strong> 71% responded to the stage 2questionnaire. 1071/7790 records (7508 women) were excluded (mostly due to index pregnancy being conceived prior to 1980), leaving 6719 records(86%) available for analysisRelevanceLikely to be relevant to Australian womenOther comments Women who suffered from nausea in the first 12 weeks of pregnancy were almost 70% less likely to miscarryFish293
Reference Mendez 2010Food typeFish (fatty fish, lean fish, canned tuna, crustaceans <strong>and</strong> other shellfish)Study typeProspective cohort studyLevel of evidence II (aetiology)SettingMediterranean coast of SpainFundingSpanish Ministry of <strong>Health</strong>, Instituto de Salud Carlos III, Generalitat de Catalunya-CIRIT, European Union sixth framework project EARNESTParticipants657 women recruited in first trimester of pregnancy between July 2004 <strong>and</strong> July 2006 in a Mediterranean area with high seafood intake (Sabadell cohortof the Childhood <strong>and</strong> Environment study ‘INMA’)Baseline comparisons See confounding belowDietary assessment FFQTimingFFQ at recruitment (to cover intake since the start of pregnancy)ComparisonSee Results belowOutcomesSGA (< 10 th centile of a Spanish reference population)ResultsMaternal consumption of crustaceans (at least once per week) <strong>and</strong> canned tuna (at least once per week) but not fatty fish,lean fish or other shellfish, was consistently <strong>and</strong> significantly associated with increased risk of SGA (with little effect fromadjusted for several persistent organic pollutants – such as PCBs, HCB <strong>and</strong> DDE)Adjusted OR (95% CI)Additionally adjusted for contaminantsSGA SGA adj* SGA SGA adj*All seafood≤ 3/week 1.00 1.00 1.00 1.00More than 3-6/week 1.63 (0.50 to 5.27) 1.41 (0.37 to 5.41) 1.95 (0.52 to 7.31) 1.91 (0.38 to 9.58)More than 6/week 2.41 (0.76 to 7.69) 2.77 (0.77 to 9.89) 2.91 (0.78 to 10.87) 3.89 (0.82 to 18.59)Crustaceans > 1/week 2.45 (1.11 to 5.41) 3.05 (1.34 to 6.99) 2.56 (1.11 to 5.89) 3.24 (1.34 to 7.83)Other Shellfish > 1/week 0.85 (0.41 to 1.80) 1.10 (0.50 to 2.43) 0.93 (0.43 to 2.00) 1.27 (0.56 to 2.89)Fatty fish > 1/week 1.58 (0.82 to 3.04) 1.13 (0.55 to 2.34) 2.03 (1.01 to 4.07) 1.52 (0.70 to 3.30)Lean fish > 1/week 0.94 (0.48 to 1.82) 0.99 (0.48 to 2.03) 0.77 (0.38 to 1.55) 0.76 (0.35 to 1.65)Canned Tuna > 1/week 2.80 (1.23 to 6.40) 2.49 (1.04 to 5.97) 2.61 (1.12 to 6.07) 2.39 (0.96 to 5.96)FollowupConfoundingRisk of biasRelevanceOther comments*SGA adj excludes infants whose actual birth weights exceeded the 10 th percentileTo birthAdjusted for energy intake, child sex, maternal age, nulliparity, paternal BMI, maternal BMI, education, under-reporting <strong>and</strong> smoking during pregnancy(models for seafood subtypes also adjusted for other types)(Omitted variables for maternal intakes of meats, eggs, vegetables, fruits, legumes, dairy products, dietary fat, alcohol <strong>and</strong> coffee as associations werevirtually unchanged)Low risk of bias: birth outcomes were available for 616/657 women (94%), including 596 term births; maternal characteristics <strong>and</strong> dietary data wereavailable for 610 <strong>and</strong> 592 women respectivelySeafood consumption higher in this study than in Australia (mean 40-80 g/day)Study focussed on term births as there were only 20 preterm births;Maternal seafood consumption in this study was not strongly related to sociodemographic or other parental characteristics including BMIDietary guidelines for pregnant <strong>and</strong> <strong>breastfeeding</strong> women: evidence report294
Reference Mendez 2009Food groupsFish, octopus/squid <strong>and</strong> shellfishStudy typeProspective cohortLevel of evidence II (aetiology)Setting General practices in Menorca, a Mediterranean isl<strong>and</strong> in Spain (mid 1997 to mid 1998)FundingInstituto de Salud Carlos III red de Grupos Infancia y Media Ambiente, the Fundacio “La Caixa” , Instituto de Salud Carlos III, red de Centros deInvestigacion en Epidemiologica y Salud Publica, EU, National Center for Environmental <strong>Health</strong>, USA, the GA2LEN project, Ministry of Education <strong>and</strong>Science, Spain, Oficina de Ciencia y Tecnologia, Generalitat Valenciana.Participants482 women presenting to antenatal careBaselineBaseline difference in age – women who had fish >3 times per week older. See Confounding belowComparisonsDietary Assessment FFQ (semi-quantitative)TimingPregnancy: FFQ of fish intake during pregnancy interviewer administered conducted 3 months after birthComparisonFish intake ≤1, >1 to 2, >2-3 or >3 times per weekShellfish <strong>and</strong> squid analysed separately (low DHA): ≤0.5, >0.5 to 1, >1 times per weekOutcomesCognitive performance at 4 years (McCarthy Scales of Children’s Abilities)ResultsFish consumption not related to duration of <strong>breastfeeding</strong> or any maternal characteristicsMore frequent fish consumption associated with higher parity <strong>and</strong> BF ≥ 6/12 monthsAdjusted multivariate association between general cognitive performance <strong>and</strong> maternal fish intake (95% CI) with ≤1 times/week asreferent categoryMaternal weekly fish intake≤1 >1-2 >2-3 >3 Pfrequency:n = 129 (33%) n = 50 (13%) n = 20 (5%)Breastfed
Reference Mikkelsen 2008Dietary patterns Mediterranean diet (consumption of fish twice a week or more, intake of olive or canola oil, high consumption of fruits <strong>and</strong> vegetables (5 a day ormore), meat (other than poultry or fish) at most twice a week, <strong>and</strong> at most 2 cups of coffee a day)Study typeProspective cohort studyLevel of evidence IISettingDenmark (part of the Danish National Birth Cohort (DBNC))FundingMarch of Dimes Birth Defects Foundation, Danish National Research Foundation, Danish Medical Research Foundation, Danish <strong>Health</strong> Foundation,Danish Heart Foundation, EU FP7 consortium (EARNEST), Pharmacy Foundation, Egmont Foundation, Augustinus Foundation.Participants 35,530 pregnant women recruited from 1996 to 2002Exclusions: women who smoked, women aged < 21 <strong>and</strong> > 38 years, BMI < 19 <strong>and</strong> > 32, a history of more than 3 abortions, twin pregnancies, chronichypertension, women with a calculated energy intake < 4,200 kJ <strong>and</strong> > 16,700 kJBaseline comparisons BMIs were significantly lower in the MD <strong>and</strong> none groups.Dietary assessment FFQTimingFFQ mailed to all DBNC participants in 25 th week of gestationComparison ≥ 2 serves a fish per week v < 2OutcomesPreterm birthResultsPreterm birth < 37 weeksOR 0.90 95% CI 0.79 to 1.02aOR 0.95 95% CI 0.84 to 1.08Early preterm birth < 35 weeksOR 0.91 95% CI 0.74 to 1.12aOR 0.96 95% CI 0.78 to 1.19Late preterm birth 35-36 weeksOR 0.89 95% CI 0.76 to 1.04aOR 0.94 95% CI 0.81 to 1.10FollowupTo birthConfoundingAdjusted for parity, BMI, maternal height, socioeconomic status <strong>and</strong> cohabitant statusRisk of bias Low risk of bias; GA based mostly on ultrasound; 0.36% missing data (127/35657)RelevanceRelevance limited by exclusion of smokers <strong>and</strong> obese womenOther commentsDietary guidelines for pregnant <strong>and</strong> <strong>breastfeeding</strong> women: evidence report296
Reference Mitchell 2004Dietary patterns Fish (including shellfish)Study typeCase-control studyLevel of evidence III-3 (aetiology)SettingWaitemata <strong>Health</strong> or Auckl<strong>and</strong> <strong>Health</strong>care regions, New Zeal<strong>and</strong>Funding<strong>Health</strong> Research Council of New Zeal<strong>and</strong>, Foundation for the Newborn, Child <strong>Health</strong> Research FoundationParticipants Mothers of 1138 children born between October 1995 <strong>and</strong> November 1997 (844 born SGA <strong>and</strong> 870 born appropriate for GA); only term infants (> 37weeks);Exclusions: preterm births (< 37 weeks), multiple births <strong>and</strong> those with congenital anomaliesBaseline comparisons See confounding belowDietary assessment FFQTimingFFQ administered after birth (to cover the periconception period <strong>and</strong> the last month of pregnancy)ComparisonNone v ≤ 1 v > 1 serves of fish per weekOutcomesSGA (≤ 10 th centile for GA <strong>and</strong> gender)ResultsSGA (fish consumption at time of conception)SGA AGA aOR (95% CI) p value for trendNone 110/529 (20.8%) 84/592 (14.2%) 1.69 (1.07 to 2.69)≤ 1 312/529 (59.0%) 8/592 (64.5%) 1.09 (0.75 to 1.58)> 1 107/529 (20.2%) 126/592 (21.3%) 1 0.04SGA (fish consumption in last month of pregnancy)None 138/529 (26.0%) 137/593 (23.1%) 1.29 (0.83 to 1.99)≤ 1 284/529 (53.7%) 344/593 (58.0%) 1.07 (0.73 to 1.57) 1 144/529 (27.2%) 112/593 (18.9%) 1 0.39FollowupConfoundingRisk of biasRelevanceOther commentsNAAdjusted for socio-economic status, ethnicity, maternal height, maternal weight before pregnancy, maternal hypertension <strong>and</strong> maternal smoking; butfolate supplementation was not controlled for (periconception folate was significantly associated with reduced SGA risk).Low-moderate risk of bias: Of the 2182 eligible infants, parents of 1714 (78.6%) completed the FFQ; 1138 (67%) of women completed the FFQ; missingitems in completed FFQ treated as woman not consuming any fish)Likely to be relevant to Australian women, although fish consumption in New Zeal<strong>and</strong> low (less than one serve a week)Only term infants includedFish297
Reference Miyake 2009Dietary patterns FishStudy typeProspective cohort studyLevel of evidence II (aetiology)ettingOsaka, JapanFundingMinistry of Education, Culture, Sports, Science, <strong>and</strong> Technology <strong>and</strong> <strong>Health</strong> <strong>and</strong> Labour Sciences Research Grants, Ministry of <strong>Health</strong>, Labour <strong>and</strong>Welfare, JapanParticipants 763 mother-child pairs (part of the Osaka Maternal <strong>and</strong> Child <strong>Health</strong> Study). <strong>Pregnant</strong> women recruited between November 2001 <strong>and</strong> March 2003Baseline comparisons See belowDietary assessment Diet history questionnaire (DHQ)TimingDHQ at mean 17.7 [SD 6.7] weeks gestation to reflect dietary intake for the previous monthComparison Quartiles of maternal fish consumption during pregnancy (medians in g/day adjusted energy intake; Q1 23.4; Q2 38.7; Q3 51.7; Q4 73.2OutcomesWheeze <strong>and</strong> eczema in infants aged 16-24 months (ISAAC definitions)ResultsInfant wheeze at 16-24 months (n = 763)OR (95% CI)aOR (95% CI)Q1 1.00 1.00Q2 0.79 (0.49 to 1.26) 0.88 (0.49 to 1.58)Q3 0.74 (0.46 to 1.19) 0.68 (0.34 to 1.36)Q4 0.76 (0.47 to 1.23) 0.67 (0.30 to 1.48)P for trend 0.25 0.28Infant eczema at 16-24 months (n = 763)Q1 1.00 1.00Q2 0.87 (0.52 to 1.44) 1.10 (0.59 to 2.05)Q3 1.03 (0.62 to 1.69) 1.33 (0.65 to 2.72)Q4 0.67 (0.39 to 1.13) 0.73 (0.30 to 1.75)P for trend 0.24 0.68FollowupConfoundingRisk of biasRelevanceOther comments16-24 months after birthAdjusted for maternal age, gestation at baseline, place of residence at baseline, family income, maternal <strong>and</strong> paternal income, maternal <strong>and</strong> paternalhistory of asthma, atopic eczema <strong>and</strong> allergic rhinitis, maternal intake of vitamin D <strong>and</strong> E during pregnancy, changes in maternal diet during theprevious month, season when baseline data were collected, maternal smoking during pregnancy, baby’s older siblings, baby’s sex, baby’s birthweight,household smoking, <strong>breastfeeding</strong> duration <strong>and</strong> time of birth before third follow-up surveyLow risk of bias; of the 1002 women initially recruited, 763 mother-child pairs (76.3%) completed all three surveys (compared with non-participants,participants had higher incomes, higher education levels <strong>and</strong> were more likely higher intakes of fat, cholesterol, <strong>and</strong> vitamin D <strong>and</strong> EFish intake in Japan likely to be higher than in Australia75% of infants were breastfed for 6 months or longerDietary guidelines for pregnant <strong>and</strong> <strong>breastfeeding</strong> women: evidence report298
Reference Miyake 2006Food groupsFishStudy typeProspective cohortLevel of evidence II (aetiology)SettingWomen who became pregnant in November 2001-March 2003 Neyagawa City, Osaka Prefecture <strong>and</strong> several surrounding municipalities (OsakaMaternal <strong>and</strong> Child <strong>Health</strong> Study, Japan)FundingGrant-in-Aid for Scientific Research (Government grant)Participants865 pregnant Japanese womenBaseline comparisons See Confounding belowDietary Assessment Dietary history questionnaire-self administered[<strong>For</strong> fatty fish (eel, red-meat fish, dried fish, tuna), white fish (codfish, shellfish, octopus) <strong>and</strong> other fish (boiled fish in soy sauce, salted gut, fish eggs)]TimingDiet survey for previous month at baseline (period of baseline not stated), EPDS at 2-9 months post partumComparisonQuartile of intake of fish (grams per day): 1 (23.1), 2 (37.9), 3 (51.4) <strong>and</strong> 4 (72.9), adjusted for energyNote: other dietary intakes analysed: meat, eggs, dairy products, total fat, saturated fatty acids, cholesterol, LA, ALA <strong>and</strong> AAOutcomes Postpartum depression (EPDS with postpartum depression when score ≥ 9)ResultsEPDS with postpartum depression when score ≥ 9Fish intake (g per day) 23.1 37.9 51.4 72.9No of depression cases 32 37 24 28Crude OR (95% CI) 1 1.19 (0.71-2) 0.72 (0.4-1.26) 0.85 (0.49-1.47)p for trend 0.27Multivariate OR (95% CI) 1 1.25 (0.73-2.12) 0.74 (0.41-1.33) 0.89 (0.5-1.59)p for trend 0.37Also reported OR forn-3, DHA, DPA intake, all no difference.No significant dose-response associations between intake of fish, meat, eggs, dairy products, total fat, saturated fatty acids,cholesterol. LA, ALA <strong>and</strong> AA with risk of postpartum depressionLength of follow upConfoundingRisk of biasRelevanceOther comments2-9 months postpartumAge, gestation, parity, smoking, family structure, occupation, family income, education, changes in diet in previous month, season when baseline datacollected, BMI, time of delivery, medical problems in pregnancy, baby’s sex, baby’s birthweightLow risk of bias: data for 865/1002 (86.5%) women available for analysisAustralian diets very different to Japanese - much less seafood intake in Australia <strong>and</strong> more white fish rather than fatty fishOriginally 1002 women enrolled only 865 completed (note: depressed persons less likely to participate), low rate of enrolment into study (17.2% of thoseeligible in Neyagawa)Fish299
Reference Nwaru 2010Food typeFish <strong>and</strong> fish productsStudy typeProspective cohort studyLevel of evidence II (aetiology)SettingTampere, Finl<strong>and</strong>FundingAcademy of Finl<strong>and</strong>, Finnish Pediatric Research Foundation, the Juho Vainio Foundation, the Yrjo Jahnsson Foundation, Turku, Oulu <strong>and</strong> TampereUniversity Hospitals, JDRF, Novo Nordisk Foundation, EU Biomed 2 ProgramParticipants931 mother-infant pairs (children with human leukocyte antigen-conferred susceptibility to type 1 diabetes) participating in the Finnish type 1 DiabetesPrediction <strong>and</strong> Prevention (DIPP) Nutrition Study between September 1996 <strong>and</strong> October 1997Baseline comparisons See confounding belowDietary assessment FFQTimingFFQ given to women after birth, for return at the three month visit (FFQ intended to cover maternal diet during pregnancy <strong>and</strong> lactation)ComparisonAmount of fish intakeOutcomesAllergic sensitisation in offspring by 5 years: food allergens (egg, cow’s milk, fish, wheat); inhalant allergens (house dust mite, cat, timothy grass, birch)ResultsTotal fish <strong>and</strong> fish productsFood allergensInhalant allergensOR 0.96 95% CI 0.87 to 1.05 OR 0.98 95% CI 0.90 to 1.07aOR 0.98 95% CI 0.88 to 1.09 aOR 1.00 95% CI 0.91 to 1.10- FishFood allergensInhalant allergensOR 0.97 95% CI 0.89 to 1.06 OR 0.99 95% CI 0.91 to 1.07aOR 0.99 95% CI 0.89 to 1.09 aOR 1.02 95% CI 0.93 to 1.12FollowupConfoundingRisk of biasRelevanceOther commentsTo 5 yearsAdjusted for energy intake, place of birth, season of birth, sex of the child, number of siblings, gestational age at birth, parental asthma, parental allergicrhinitis, maternal age at birth, maternal smoking during pregnancy, maternal educationLow risk of bias: data available for 931/1175 (79.2%) children recruited – 108 did not participate in survey, a further 49 did not have IgE measurements,a further 87 had no FFQ or an incomplete FFQLikely to be relevant to Australian women28% of women took vitamin D supplements, 73% took iron supplements;HLA genotype not likely to have any impact on the development of allergic diseases.Dietary guidelines for pregnant <strong>and</strong> <strong>breastfeeding</strong> women: evidence report300
Reference Oien 2010Food typeFish:Study typeRetrospective* cohort study (Prevention of Allergy among Children in Trondheim (PACT) study)Level of evidence III-2 (aetiology)SettingTrondheim, NorwayFunding Norwegian Department of <strong>Health</strong> <strong>and</strong> Social Affairs, Astra Zeneca Norway, Norwegian Medical Association, SINTEF Unimed 1999Participants3086 childrenBaseline comparisons See confounding belowDietary assessment FFQTimingAdministered when child was one year of ageComparisonAmount of fish intake; 68% of mothers reported eating fish once a week or more (<strong>and</strong> 46% took cod liver oil four or more times a week duringpregnancy)OutcomesChildhood eczema, asthma at two yearsResultsEczema at 2 yearsNever or < once a week (n = 961) versus ≥ once per week (n = 2052): OR 1.02 95% CI 0.82 to 1.26Asthma at 2 yearsNever or < once a week (n = 964) versus ≥ once per week (n = 2061): OR 0.99 95% CI 0.72 to 1.37FollowupConfoundingRisk of biasRelevanceOther commentsTo two yearsMaternal intake during pregnancy analyses were not adjustedModerate to high risk of bias: of the 5171 eligible children, questionnaires were completed for 3086 children (59.7%); analyses were not adjusted;mothers needed to recall their diet more than a year previouslyLikely to be relevant to Australian womenChildren were followed prospectively from one year of age to approximately two years of age; *information on exposure was assessed retrospectivelywhen the child was one year of age;Mothers’ consumption of fish <strong>and</strong> vegetables <strong>and</strong> children’s consumption of fish <strong>and</strong> vegetables were highly correlated;Children’s fish consumption more important than maternal consumption during pregnancy.Fish301
ReferenceOken 2008aFood typeFishStudy typeProspective cohortLevel of evidence II (aetiology)Setting Project Viva (Pre-birth cohort study), Massachusetts, USA 1999-2002FundingNational <strong>Health</strong> Institute (Bethesda, Maryl<strong>and</strong>), Harvard Medical School, Harvard Pilgrim <strong>Health</strong> Care FoundationParticipants341 mother-infant pairsBaseline comparisons Comparison with 1238 excluded: similar fish intakes (1.5 vs. 1.7 servings/week) slightly older (32.6 vs 31.9 years), more likely to be white (82 vs. 65%),better educated (41 vs. 30% with a graduate degree), less likely to smoke (8 vs. 13%), had higher Peabody Picture Vocabulary Test (PPVT) scores(108.8 vs. 104.6). <strong>For</strong> included children compared <strong>breastfeeding</strong> duration longer (7.0 vs. 6.0 months).Dietary AssessmentTimingComparisonOutcomesResultsSee confoundingSelf-administered semi-quantitative food frequency questionnaire of previous 3 months-self administered[note: included canned tuna fish, shrimp, lobster, scallops, clams, dark-meat fish (mackerel, salmon, sardines, bluefish, swordfish), other fish (cod,haddock, halibut)]Second trimester study visit for FFQ (for previous 3 months)Fish intake of never, > never <strong>and</strong> ≤ 2 or > 2 times per week(Note: also looked at red blood cell mercury, EPA <strong>and</strong> DHA at second trimester)Child cognition at 3 years (PPVT-Peabody Picture Vocabulary Test <strong>and</strong> WRAVMA-Wide Range Assessment of Visual Motor Abilities)(<strong>For</strong> fish intake <strong>and</strong> mercury levels)Higher fish intake associated with better child cognitive test performanceFish intake (servings per week) Never ≤2 >2PPVT unadjusted 107.5 105.2 106.3Adjusted (95% CI) 0 -2.1 (-5.1, 1.4) 1.2 (-3.5, 6)Adjusted [erythrocyte mercury (95% CI)] 0 -1.8 (-5.4, 1.8) 2.2 (-2.6, 7)WRAVMA total unadjusted 100.1 102.8 106.4Adjusted (95% CI) 0 1.1 (-2.2, 4.4) 5.3 (0.9, 9.6)Adjusted [erythrocyte mercury (95% CI)] 0 1.5 (-1.8, 4.7) 6.4 (2.0, 10.8)Higher mercury levels associated with poorer cognitive performanceErythrocyte mercury levels
Risk of biasRelevanceOther commentsrace/ethnicity, marital status, education, birth order, child sex, fetal growth, gestation length, duration of breast feeding, primary language, age atcognitive test, maternal education <strong>and</strong> paternal educationChecked co-variability of: household income, maternal Western or prudent dietary pattern, depression at 6 months postpartum, child BMI, testadministratorModerate risk of bias: Selection bias - differences between original cohort <strong>and</strong> this sample.Of 2,128 women who delivered singleton infant, 1,579 (74%) eligible for 3 year visit (had completed prenatal dietary questionnaire <strong>and</strong> had notwithdrawn). 896 (42%) women-child pairs had maternal fish intake data, blood samples <strong>and</strong> cognitive test results. 341 (16%) included in study (due toavailable funding to measure RBC mercury). 341 selected due to experiencing preterm or small for gestational age birth (n=45), mothers had availablehair samples (n=98) <strong>and</strong> remaining 198 were selected at r<strong>and</strong>om.Maternal erythrocyte proxy for fetal methylmercury exposure. Home environment not assessed. Other fish contaminants not measured e.g.polychlorinated biphenylsAustralian diet reasonably similar to AmericanFish303
ReferenceFood typeStudy typeLevel of evidenceSettingFundingParticipantsBaseline comparisonsDietary AssessmentTimingComparisonOutcomesResultsOken 2008bFishProspective cohortII (aetiology)Danish National Birth Cohort 1997-2002, recruited during first antenatal visit with GP (6-12 weeks gestation)Danish National Research Foundation, the Danish Pharmaceutical Association, the Danish Ministry of <strong>Health</strong>, the Danish National Board of <strong>Health</strong>,Statens Serum Institut, BIOMED, the March of Dimes Birth Defects Foundation, the Danish Heart Association, the Danish Medical Research Council,<strong>and</strong> Sygekassernes Helsefond (to the Danish National Birth Cohort); by the Early Nutrition Programming Project [(EARNEST) Project No. FOOD-CT-2005-007036]; <strong>and</strong> by grant no. HD44807 from the National Institutes of <strong>Health</strong> <strong>and</strong> a fellowship from the American Sc<strong>and</strong>inavian Foundation, Inger <strong>and</strong>Jens Bruun Foundation (both to EO). In addition, the March of Dimes Birth Defects Foundation supported collaboration between the Maternal NutritionGroup at the Statens Serum Institut <strong>and</strong> Harvard Medical School.25,446 live born singleton children born to mothers in the Danish National Birth Cohort who responded to 18 month outcome between 18.0-20.9 months<strong>and</strong> had no missing data for covariates. Total cohort enrolled 92 676 liveborn singleton = 27% of original cohort.See Confounding belowFood frequency questionnaire for previous month diet - self administeredFFQ in mid-pregnancy (approximately 25 weeks gestation) for month preceding questionnaire completionMaternal fish intake (grams per week): 0, 1-340 (1-2 servings/week), > 340 (≥ 3 servings/week)Median fish intake in quintiles (grams per day): 5.9, 14.5, 22.2, 32.2, 50.8Primary outcome total development at 18 months; child development (motor <strong>and</strong> social/cognitive) also assessed at 6 months. Assessment by interviewwith parentMedian fish intake (g/day) aOR (95% CI)5.9 14.5 22.2 32.2 50.8Motor Development at 6 mo Referent 0.98 (0.92-1.05) 1.03 (0.97-1.11) 1.05 (0.98-1.12) 1.17 (1.09-1.25)Social or cognitive at 6 mo Referent 1 (0.93-1.07) 1.07 (0.99-1.15) 1.18 (0.09-1.27) 1.33 (1.23-1.44)Total development at 6 mo Referent 0.99 (0.92-1.05) 1.05 (0.99-1.13) 1.09 (1.02-1.17) 1.25 (1.17-1.34)Motor Development at 18 mo Referent 1 (0.93-1.07) 1.08 (1-1.16) 1.11 (1.03-1.19) 1.24 (1.15-1.33)Social or cognitive at 18 mo Referent 1 (0.94-1.08) 1.11 (1.04-1.19) 1.15 (1.07-1.24) 1.28 (1.19-1.37)Total Development at 18 mo Referent 0.99 (0.93-1.07) 1.09 (1.01-1.17) 1.14 (1.06-1.22) 1.29 (1.20-1.38)Associations of fish intake with child development did not differ by <strong>breastfeeding</strong> duration.Follow-upConfoundingRisk of biasRelevanceOther comments6 <strong>and</strong> 18 monthsCovariates: maternal age, social status, marital status, parity, smoking <strong>and</strong> alcohol use during pregnancy, maternal <strong>and</strong> paternal education, childgestational age, child birth weight (z score), child sex, <strong>breastfeeding</strong>, child age at questionnaire completion, occurrence or non-occurrence of postpartum depression , parental social class <strong>and</strong> learning difficulties: Also measured: pre-pregnancy BMI, history of parental school problems, child birthlength <strong>and</strong> head circumference at birth <strong>and</strong> at routine GP visits at 5 <strong>and</strong> 12 months (5 & 12 months measures not included due to much missing data,however a check with provided data found no relationship difference)Moderate (attrition bias; not adjusted for maternal IQ or home environment)Australian diet likely to be slightly different from Danish diet (average 27g fish intake per day?). Particularly high intake of oily fish –salmon, herring &mackerel)Enrolled 101,042 pregnant women - women included in this study less likely to be single or smoked cigarettes during pregnancy <strong>and</strong> breastfed forlonger than women not included <strong>and</strong> included children had greater gestation length <strong>and</strong> birth weight than non-included childrenDietary guidelines for pregnant <strong>and</strong> <strong>breastfeeding</strong> women: evidence report304
Reference Oken 2007Food typeFishStudy typeProspective cohort studyLevel of evidence II (aetiology)SettingObstetric offices in Massachusetts, USAFundingNIH, Robert H. Ebert Fellowship, March of Dimes Birth Defects Foundation,Participants 1718 women in Project Viva recruited from 1999 to 2002Baseline comparisons Study participants more likely to be white, <strong>and</strong> to be college graduates than non-participantsSee confounding belowDietary assessment FFQTimingFFQ at study enrolment (median 10.4 weeks gestation) to cover diet since last menstrual periodComparisonNumber of serves of fish per dayOutcomesPre-eclampsia, gestational hypertensionResultsPre-eclampsiaaOR 0.91 95% CI 0.75 to 1.09 (per weekly serving)(0.22 [SD 0.19] serves of fish/day for women with pre-eclampsia v 0.25 [0.24] for women with normal blood pressure)Gestational hypertensionaOR 1.04 95% CI 0.94 to 1.15 (per weekly serving)(0.27 [SD 0.29] serves of fish/day for women with gestational hypertension v 0.25 [0.24] for women with normal blood pressure)FollowupTo birthConfoundingEnergy adjusted <strong>and</strong> also adjusted for maternal age, prepregnancy BMI, first trimester systolic blood pressure, ethnicity, education, parityRisk of bias Low risk of bias: Of the 2128 live births, 410 were excluded (45 women with unavailable medical records, 339 incomplete dietary questionnaire, 24women with pre-existing chronic hypertension who did not develop pre-eclampsia, 2 women with missing covariate information) leaving 1718participants (81%) available for analysisRelevanceLikely to be relevant to Australian womenOther comments 92% of women took supplements (multivitamins) in the first trimester of pregnancy;Mean calcium intake in the study population was high (> 900 mg/day) <strong>and</strong> intakes of vitamins D, E, C <strong>and</strong> folate were also relatively highFish305
Reference Oken 2005Food typeFishStudy typeProspective Cohort StudyLevel of evidence II (aetiology)SettingProject Viva, Eastern Massachusetts April 1999-February 2003; women recruited at initial clinical obstetric appointmentFundingNational Institutes of <strong>Health</strong>, Harvard Medical School, Harvard Pilgrim <strong>Health</strong> Care FoundationParticipants135 mother-infant pairs enrolled in Project Viva where maternal hair sample was taken <strong>and</strong> complete data for 2 nd trimester diet <strong>and</strong> infant’s cognitiveassessmentEligible if
Reference Oken 2004Food typeFish (canned tuna fish, shrimp, lobster, scallops, clams, dark meat fish (mackerel, salmon, sardines, bluefish, swordfish), other fish (cod, haddock,halibut)Study typeProspective cohort studyLevel of evidence II (aetiology)SettingMassachusetts, USAFundingNIH, Agency for <strong>Health</strong> Care Research <strong>and</strong> Quality, March of Dimes Birth Defects Foundation, Harvard Medical School, Harvard Pilgrim <strong>Health</strong> CareFoundationParticipants 1797 children of women enrolled in Project Viva from 1999 to 2002Baseline comparisons Women who consumed more seafood more likely to be older, not white, more educated <strong>and</strong> less likely to be experiencing their first pregnancyDietary assessment FFQTimingFFQ at study enrolment (to cover the period from beginning of pregnancy), at 26 to 28 weeks gestation (to cover the past three months), <strong>and</strong> just afterbirth (to cover the month before birth)ComparisonNo intake of fish <strong>and</strong> tertiles of fish intakeOutcomesBirthweight, fetal growth (birthweight for gestational age), length of gestationResults Birthweight difference (g) Fetal growth (z value) Length of gestation (days)First trimester (n = 1797) aMD (95%CI) aMD (95%CI) aMD (95%CI)No intake (n = 233) 70 (-18 to 158) 0.13 (-0.01 to 0.28) -0.8 (-2.7 to 1.1)Tertile 1 (n = 597) 48 (-21 to 117) 0.08 (-0.03 to 0.20) 0.2 (-1.3 to 1.7)Tertile 2 (n = 568) 7 (-62 to 77) -0.01 (-0.12 to 0.10) -0.4 (-2.0 to 1.1)Tertile 3 (n = 399)P for trend 0.05Second trimester (n = 1663)No intake (n= 215) 21 (-64 to 1.05) 0.09 (-0.06 to 0.24) 0.5 (-1.3 to 2.3)Tertile 1 (n = 564) 39 (-27 to 105) 0.06 (-0.05 to 0.18) 0.1 (-1.3 to 1.4)Tertile 2 (n = 493) -29 (096 to 38) -0.05 (-0.17 to 0.07) -0.8 (-2.2 to 0.6)Tertile 3 (n = 391)P for trend 0.19No association of seafood intake with low birthweight, SGA <strong>and</strong> preterm birth as dichotomous measures (actual numbers not reportedin paper)FollowupConfoundingRisk of biasRelevanceOther commentsTo birthAdjusted for enrolment site, infant sex, maternal age, height, intrapartum weight gain, prepregnancy BMI, ethnicity, smoking during pregnancy,education, gravidityLow-moderate risk of bias: 2109/2128 (99%) of women who gave birth to a live infant completed at least one dietary questionnaireLikely to be reasonably relevant for Australian women (e.g. lower seafood intakes than Sc<strong>and</strong>inavian <strong>and</strong> Japanese studies)6 women reported taking cod liver oil or fish oil supplements (their exclusion did not change results)Fish307
Reference Olsen 2002Food typeFishStudy typeProspective cohortLevel of evidence II (aetiology)Setting Routine antenatal care in Aarhus, Denmark 1992-1996FundingNovo Nordisk <strong>For</strong>skningsfond, Aage-Louis Hansens Fond, Danish National Research Foundation, March of Dimes Birth Defects Foundation, Danish<strong>Health</strong> Research Foundation, Egmont FondenParticipants8729 pregnant women (with singleton, live born babies without detected malformations), who had not consumed fish oil supplementsBaseline comparisons See Confounding belowDietary Assessment Fish (roe, prawn, crab <strong>and</strong> mussels) <strong>and</strong> fish oil questionnaireTimingFish <strong>and</strong> fish oil intake at 16 weeks during period from when they knew of pregnancy until completion of questionnaireComparisonFish intake per 28 days: 0, 0.5, 2, 4, 29 <strong>and</strong> 28 servings (1 serving =144g fish)Fish as a hot meal or in open s<strong>and</strong>wiches per month: 0, > 0-< 1, 1-3, ≥ 1 (per week)OutcomesPreterm birth (
Reference Olsen 1993Food typeFishStudy typeRetrospective cohort studyLevel of evidence III-2 (aetiology)SettingFaroe Isl<strong>and</strong>sFundingDanish Medical Research Council, Danish <strong>Health</strong> Foundation, the Hojgaard Foundation, the Vestnorden Foundation, the Danish Agency forEnvironmental Protection, the Director Jacob Madsens Foundation <strong>and</strong> Michaelesen FondenParticipants 1012 women giving birth in the Faroe Isl<strong>and</strong>s from 1986-7Baseline comparisons Study participants had a longer gestation than the women who did not participateDietary assessment St<strong>and</strong>ard questionsTimingQuestionnaire administered after birth to assess diet during pregnancyComparison Number of seafood dinners per week (0, 1, 2, 3, 4, 5, 6+)OutcomesGestational age, birthweight, birth length, placental weightResultsGestational age (days): p = 0.4 for variability of means between groupsBirthweight (g): p = 0.02 for variability of means between groups(additionally adjusted for gestational age): p = 0.026 for variability of means between groupsBirth length (cm) p = 0.002 for variability of means between groups(additionally adjusted for gestational age): p = 0.006 for variability of means between groupsPlacental weight (g)*: p = 0.10 for variability of means between groups(additionally adjusted for gestational age): p = 0.13 for variability of means between groupsFollowupConfoundingRisk of biasRelevanceOther comments*n = 767To birthAdjusted for maternal height, weight, parity, age, marital status, smokingLow risk of bias: study group comprised 75% of all births taking place during the study periodOf some relevance to Australian women (more <strong>and</strong> different types of fish (e.g. whale) consumed by women in the Faroe Isl<strong>and</strong>s)The association does not appear to be a strict dose response one – positive effect plateaus at about 3 fish dinners per weekFish309
Reference Olsen 1990Food typeFishStudy typeProspective cohort study (<strong>Health</strong>y Habits for Two community trial)Level of evidence II (aetiology)SettingOdense <strong>and</strong> Aalborg, DenmarkFundingHelsefondet, Egmont Fondet, The National Board of <strong>Health</strong>, <strong>and</strong> the County of FunenParticipants 11,980 pregnant Danish women giving birth to a singleton baby; study ran from 1984 to 1987Baseline comparisons See confounding belowDietary assessmentTimingComparisonOutcomesResultsQuestionnaire36 weeks GA; to reflect fish consumption in the previous monthNo versus 1-2 versus 3-4 versus 5+ fish meals during the previous monthPlacental weight, head circumference at birth, birthweight, birth length, gestational ageNon SmokersFish meals past NTest of linearitymonthBirthweight, g (mean [SD])0 932 3544 [486] p=0.041-2 3165 3570 [497]3-4 1858 3582 [499]5+ 588 3590 [490]All 6543 3572 [490]Birth length, cm (mean [SD])0 9298 52.52 [2.28] p=0.71-2 3157 52.61 [2.38]3-4 1854 52.66 [2.37]5+ 587 52.50 [2.46]All 6526 52.60 [2.73]Head circumference, cm (mean [SD])0 861 35.23 [1.63] p=0.00071-2 2862 35.42 [1.54]3-4 1689 35.47 [1.58]5+ 540 35.49 [1.47]All 5952 35.41 [1.56]Placental weight, g (mean [SD])0 929 548.7 [134] p=0.00021-2 3154 559.4 [134]3-4 1855 560.1 [134]5+ 585 579.5 [145]All 6523 559.9 [135]Gestational age, days {mean [SD])0 933 282.0 [10.3] P=0.11-2 3150 282.2 [10.4]3-4 1850 282.1 [10.4]5+ 584 281.0 [10.2]Dietary guidelines for pregnant <strong>and</strong> <strong>breastfeeding</strong> women: evidence report310
All 6517 282.1 [10.4]Multiple regression (smokers <strong>and</strong> nonsmokers)BirthweightSmoking N Regression coefficient, g (mean, 95% CI)0 6569 15.8 (-2.3 to 33.9)1+ 4594 -16.0 (-37.7 to 5.7)Birth lengthSmoking N Regression coefficient, cm (mean, 95% CI)0 6569 0.02 (-0.07 to 0.11)1+ 4594 -0.01 (-0.12 to 0.10)Head circumferenceSmoking N Regression coefficient, cm (mean, 95% CI)0 6569 0.080 (0.016 to 0.144)1+ 4594 -0.041 (-0.122 to 0.041)Placental weightSmoking N Regression coefficient, g (mean, 95% CI)0 6569 10.8 (5.1 to 16.50)1+ 4594 -0.6 (-6.2 to 7.30)Gestational ageSmoking N Regression coefficient, days (mean, 95% CI)0 6569 -0.38 (-0.82 to 0.05)1+ 4594 -0.08 (-0.63 to 0.47)FollowupConfoundingRisk of biasRelevanceOther commentsTo birthAdjusted for maternal age, weight, height, intrapartum weight gain, age, parity, sex of child, maternal <strong>and</strong> paternal education, maternal employmentduring 1 st to 16 th week of gestation, certainty of gestational age assessment, cohabitation, frequency of intake of vegetables, raw vegetables, fruit, offal,poultry, cake, alcohol, smoking – <strong>and</strong> gestational age when assessing effects on size of the newborn <strong>and</strong> placental weightLow risk of bias: 83% of all eligible women in the two areas were recruited;Likely to be reasonably relevant for Australian womenFish311
Reference Petridou 2005Food typeFish <strong>and</strong> seafoodStudy typeCase-control studyLevel of evidence III-3SettingGreeceFundingThe Childhood Hematology-Oncology Group: Athens University Medical School, Aristotle University of Thessaloniki, University Hospital of HeraklionParticipants Cases: 131 children with acute lymphoblastic leukemia, aged 12 to 59 months, gender <strong>and</strong> age matched toControls: 131 children hospitalised for minor conditions between 1999 <strong>and</strong> 2003Baseline comparisons See confounding belowDietary assessment FFQTimingDuring index pregnancyComparisonQuintiles of fish/seafood – median Q1; 3 g/day: median Q5 14 g/dayOutcomesAcute lymphoblastic leukemia (ALL)ResultsMedian g/day Cases Controls P for trendQ1: 3 36 20Q2: 6 28 25Q3: 7 16 24Q4: 9 23 41Q5: 14 28 21 0.09Logistic regression: one quintile more of fish/seafood: aOR 0.72 95% CI0.59 to 0.89FollowupConfoundingRisk of biasRelevanceOther commentsNATotal energy intake (but not mutually among food groups); matching variables; maternal age at birth; birthweight; maternal smoking during pregnancy;maternal years of schooling, maternal occupationModerate: moderate risk of recall bias for women being able to accurately remember their dietary intake during a pregnancy some time previously;Cases: 171 children with ALL were identified; 21 had missing data, consent was not given in 9 cases <strong>and</strong> 10 were unable to be matched, leaving 131(77%) of cases availableDiets of Greek women may differ from current diets of Australian womenDietary guidelines for pregnant <strong>and</strong> <strong>breastfeeding</strong> women: evidence report312
ReferenceFood typeStudy typeLevel of evidenceSettingFundingParticipantsBaseline comparisonsDietary assessmentTimingComparisonOutcomesResultsFollowupConfoundingRisk of biasRelevanceOther commentsPetridou 1998aFish, shellfishCase-control studyIII-3Greater Athens area, GreeceGreek Ministry of <strong>Health</strong> <strong>and</strong> Welfare, <strong>and</strong> Foundation for Research in Childhood ‘S. Doxiadis’Cases: 109 children with cerebral palsy (CP), born between 1984 <strong>and</strong> 1988 (estimated to be two-thirds of the children with CP born during this period)Controls (1): 155 neighbouring children of similar sex <strong>and</strong> age (± 12 months)Controls (2): 99 healthy siblings of similar sex <strong>and</strong> age (± 12 months) of the first neurological patient seen by the attending physician after a visit by theCP patientSee confounding belowFFQDuring pregnancy< 1 versus 1 versus > 1 serves of fish per week;regression analysis: risk of cerebral palsy with change in consumption by one unit ( = consumption of fish once a week)Cerebral palsy< 1 serve of fish per week: 33/91 (36.3%) cases v 80/246 (32.5%) controls1 serve of fish per week: 42/91 (46.1%) cases v 124/246 (50.4%) controlsMore than 1 serve of fish per week: 16 (17.6%) cases v 42/246 (17.1%) controlsRegression analysis for each unit of consumption of fish once a week:aOR 0.77 95% CI 0.48 to 1.24aOR 0.63 95% CI 0.37 to 1.08 (additionally adjusted for all food groups)8 yearsAge <strong>and</strong> sex of child, maternal age at birth, maternal age at menarche, maternal chronic disease, previous spontaneous abortions, persistent vomitingduring index pregnancy, multiple pregnancy, number of obstetric visits; timing of membrane rupture in index birth, use of general anaesthesia in theindex birth, mode of birth, abnormal placenta, infant head circumference at birth, congenital malformation, place of index birth, use of supplementaryiron during index pregnancy, physical exercise during index pregnancy, painless childbirth classes.The following were not included in the model:- Smoking or consumption of coffee or alcohol during pregnancy (stated to be “unrelated to CP <strong>and</strong> had no confounding influence”);- Gestational age, birthweight <strong>and</strong> maternal weight gain (stated to be “strong predictors of CP, but were not included in the model, since they areprobably intermediate stages in a possible link between diet <strong>and</strong> CP (mediators) rather than genuine confounders”Moderate-high: High risk of recall bias for women being able to accurately remember their dietary intake during a pregnancy 8 years previously;Cases: 109 children with CP were identified; for 6 children either collaboration with their guardian or a diagnosis of CP was not confirmed; <strong>and</strong> reliablematernal dietary intakes were not available for 12 women, leaving 91 cases available for analysis.Controls: 278 mother-child pairs were approached; 16 refused to participate; matching controls were not available in 8 instances, <strong>and</strong> reliable maternaldietary intakes were not available for 8 women, leaving 246 controls available for analysis.Diets of Greek women in 1998 may differ from current diets of Australian womenFish313
Reference Pogoda 2009Food typeFish (fresh)Study typeCase-control studySeparate centre reports: Preston-Martin 1996 (Los Angeles); Lubin 2000 (Israel); Cordier 1994 (France); McCredie 1994 (Australia)Level of evidence III-3 (aetiology)SettingInternational (seven countries – USA, Israel, Italy, Spain, Australia, France <strong>and</strong> Canada (International Collaborative Study of Childhood Brain Tumors)FundingNIH, California Department of <strong>Health</strong>, Southern California Environmental <strong>Health</strong> Sciences Center, National Cancer Institutes, Cancer SurveillanceSystem of Western Washington, Fred Hutchinson Cancer Research Center, Fondo de Investigaciones Sanitarias of Spain, Conselleria de Sanitat iConsum of Valencian Autonomous Community for the Childhood Cancer Registry of the Province of Valencia, Spanish Society of Paediatric Oncologywith the National Childhood Cancer Registry, ISCIII-RTIC, Villavecchia Foundation <strong>and</strong> Scientific Foundation of the AECCParticipants Cases: 1281Controls: 2223Years of diagnosis varied between centres, ranging from 1976 to 1992 (with most diagnosed between 1982 <strong>and</strong> 1992)Controls were frequency matched to cases in US centres <strong>and</strong> in France; otherwise they were individually matched (by region of residence, age, sex,<strong>and</strong> geographic area (except for Sydney <strong>and</strong> Los Angeles))Baseline comparisons See confounding belowDietary assessment St<strong>and</strong>ardised study questionnaire using detailed dietary recall methods <strong>and</strong> abstract food models to gauge portion sizeTimingDiet during the past year <strong>and</strong> during the index pregnancyComparisonQuartilesOutcomesChildhood brain tumoursResultsAll tumours (n = 1203cases)Controls Cases aOR% CIFresh fishQ1 654 (30%) 410 (35%) 1.0Q2 427 (20%) 242 (21%) 1.2 (0.9 to 1.6)Q3 535 (25%) 289 (25%) 1.0 (0.9 to 1.2)Q4 566 (26%) 237 (20%) 0.7 (0.6 to 0.9)P for trend = 0.01Astroglials (n = 621cases)Fresh fishQ1 654 (30%) 219 (36%) 1.0Q2 427 (20%) 115 (19%) 1.1 (0.8 to 1.4)Q3 535 (25%) 157 (26%) 1.0 (0.9 to 1.2)Q4 566 (26%) 112 (19%) 0.6 (0.5 to 0.9)P for trend = 0.005TUMOUR SUBTYPESAstrocytomasPilocytic (142 cases) Anaplastic (96 cases) Other (199 cases)Fresh fish 0.7 (0.4 to 1.2) 1.6 (1.1 to 2.4) 0.7 (0.4 to 1.0)P for trend 0.19 0.02 0.054Dietary guidelines for pregnant <strong>and</strong> <strong>breastfeeding</strong> women: evidence report314
Other typesMalignant gliomas(122 cases)Medulloblastomas(193 cases)PNET (64 cases) Ependymomas(104 cases)Fresh fish 0.5 (0.3 to 0.6) 1.0 (0.6 to 1.7) 0.8 (0.5 to 1.7) 0.9 (0.5 to 1.5)P for trend 0.001 0.71 0.29 0.24FollowupConfoundingRisk of biasRelevanceOther commentsn/aAnalyses adjusted for age <strong>and</strong> sex of child, study centre <strong>and</strong> each food group;Adjustment for total intake of foods had little effect on estimatesLow-moderate risk of bias: 75% of eligible cases <strong>and</strong> 71% of eligible controls participated (based on centres for which these data were available); somelack of st<strong>and</strong>ardisation in dietary assessments between study centres; potentially high risk of recall bias for women whose pregnancies may have beenat least 10 years previously.Likely to be relevant to Australian womenFish315
Reference Ramón 2009Food typeStudy typeLevel of evidenceSettingFundingParticipantsBaseline comparisonsDietary AssessmentTimingComparisonOutcomesResultsFishProspective cohortII (aetiology)2004-2006 INMA Valencia cohort, SpainInstituto de Salud Carlos III, Ministerio S<strong>and</strong>idad y Consumo <strong>and</strong> Ministerio Educacion y Ciencia554/787 singleton live born infants of mother enrolled in INMA Valencia cohort <strong>and</strong> born Hospital La Fe of Valencia May 2004-February 2006 withavailable cord blood samplesSee Confounding belowSemi-quantitative food frequency questionnaire-interview (about fish intake, not other forms of seafood)FFQ at 28-32 weeks gestation (covered time from last FFQ-at 10-13 weeks- till current questionnaire completion), blood sample before placenta wasdeliveredFish consumption of canned tuna, lean fish <strong>and</strong> oily fish separately: < 1 portion/mo, 1-3 portions/mo, 1 portion/wk <strong>and</strong> ≥ 2 portions/wkBirth weight, birth length <strong>and</strong> SGAPortions of fish:
Follow-upConfoundingRisk of biasRelevanceOther commentsBirthBirth weight <strong>and</strong> length analyses adjusted for gestational age <strong>and</strong> sexOther covariates: age, pregnancy weight, gestational weight gain (according to Institute of Medicine Guidelines), parity, education, employment status,socio-occupational status, country of origin, residence, season of conception, smoking at 28-32 weeks gestation, mean vegetable intake, mean energyintake, mean caffeine intake, mean alcohol intake <strong>and</strong> parental heightLowSpanish diet may be different from Australian dietFFQ at 10-13 weeks gestation (not included in analyses)Fish317
Reference Rogers 2004Food typeFishStudy typeProspective cohortLevel of evidence II (aetiology)SettingSouth west Engl<strong>and</strong>, ALSPAC (Avon Longitudinal Study of Parents <strong>and</strong> Children)FundingUniversity of Bristol, MRC, Wellcome Trust, the Department of the Environment, MAFF, various medical charities <strong>and</strong> commercial companiesParticipants10, 040 pregnant women with live born singleton babies, expected delivery date April 1991-December 1992 <strong>and</strong> not taking fish oil supplements at anypoint in pregnancyBaseline comparisons See Confounding belowDietary Assessment Food frequency questionnaire- self administeredTimingFFQ at 32 weeks gestationComparison Mean daily fish intake (grams per day): 0, 9.7, 15.6, 33.8, 45.4, 77.4Mean frequency of fish consumption per week (portions per week): 0.74, 2.29, 4.44OutcomesLow birthweight, preterm birth <strong>and</strong> intrauterine growth retardation (IUGR) - defined as birth weight for gestational age <strong>and</strong> sex below the 10 th centile)ResultsMean Daily fish intake (grams per day) aOR (95% CI):0 9.7 15.6 33.8 45.4 77.4TrendpPreterm birth all 0.85 (0.59-1.22) 0.95 (0.68-1.31) 1.2 (0.88-1.63) 1.1 (0.8-1.51) 0.93 (0.68-1.28) Referent 0.684Non-Smokers 1 (0.67-1.49) 1.03 (0.72-1.49) 1.19 (0.85-1.67) 1.13 (0.79-1.62) 0.93 (0.65-1.33) Referent 0.649Low birthweight all 1.08 (0.73-1.59) 1.2 (0.84-1.72) 1.33 (0.94-1.88) 1.32 (0.93-1.89) 0.96 (0.66-1.39) Referent 0.311Non-Smokers 1.11 (0.7-1.75) 1.25 (0.82-1.89) 1.29 (0.87-1.91) 1.27 (0.84-1.91) 0.86 (0.56-1.32) Referent 0.186IUGR all 1.2 (0.93-1.55) 1.06 (0.83-1.35) 1.05 (0.83-1.34) 0.93 (0.72-1.19) 0.94 (0.73-1.2) Referent 0.083Non-smokers 1.24 (0.91-1.69) 1.13 (0.85-1.51) 1.13 (0.85-1.49) 1.01 (0.75-1.36) 0.96 (0.73-1.28) Referent 0.083Mean frequency of fish consumption per week (portions per week) aOR (95% CI):0 0.74 2.29 4.4 Linear trend PFollow-upConfoundingRisk of biasRelevanceOther commentsPreterm birth all 0.76 (0.52-1.13) 1.01 (0.74-1.38) 0.91 (0.66-1.27) Referent 0.418Non-Smokers 0.95 (0.61-1.46) 1.08 (0.76-1.52) 0.96 (0.66-1.37) Referent 0.872Low birthweight all 1.07 (0.69-1.65) 1.25 (0.86-1.8) 1.07 (0.73-1.58) Referent 0.492Non-Smokers 1.18 (0.71-1.97) 1.32(0.87-2) 0.98 (0.69-1.2) Referent 0.179IUGR all 1.37 (1.02-1.84) 1.17 (0.91-1.51) 1.05 (0.81-1.38) Referent 0.017Non-smokers 1.4 (1-1.98) 1.25 (0.93-1.67) 1.09 (0.8-1.48) Referent 0.027BirthMaternal age, height, weight, education, parity, smoking <strong>and</strong> drinking in pregnancy, <strong>and</strong> whether mothers living with a partnerLow to moderate (attrition bias); Originally 14,150 pregnancies reaching 32 weeks gestation, 12,441 returned questionnaire, 12, 200 completed FFQ,then excluded still births, multiple births <strong>and</strong> women who took fish oil supplements leaving 11, 585 but information on confounders only for 10, 040 (71%of original cohort). The proportion of smokers, less educated mothers, primiparas, single women, short women, teenage mothers <strong>and</strong> non drinkers wereall lower with higher n-3 FA intake. Low pre-pregnant weight, also non-linear relationship with fish intake.UK diet similar to AustralianDietary guidelines for pregnant <strong>and</strong> <strong>breastfeeding</strong> women: evidence report318
Reference Romieu 2007Food typeFishStudy typeProspective cohortLevel of evidence II (aetiology)Setting All women presenting for antenatal care in Menorca, Spain from mid 1997-mid 1998FundingInstituto de Salud Carlos III red de Grupos Infancia y Media Ambiente <strong>and</strong> Fundacio ‘La Caixa’ <strong>and</strong> Instituto de Salud Carlos III red de Centros deInvestigacion en Epidemiologia y Salud Publica. National Center for Environmental <strong>Health</strong> <strong>and</strong> Ministry of Education <strong>and</strong> Science, Spain.Participants458 mothers <strong>and</strong> their childrenBaseline comparisons See Confounding belowDietary Assessment Food frequency questionnaire - InterviewTimingFFQ-3 months after delivery (referring to pregnancy)Same FFQ for child at 4 yearsComparisonFish intake as portions per week: 0, 1/52 (once per 52 weeks), ¼ (once per month), 1 (once per week) <strong>and</strong> 7 (once per day)(note: fish intake score was log transformed to normalise its distribution)Outcomes Incidence of atopy <strong>and</strong> eczema at 1 year, IgE to any/house dust mite (HDM) at 4 years, SPT to any/HDM at 6 years, persistent <strong>and</strong> atopic wheeze at 6years)Results Adjusted OR (95% CI) per unit increase of log transformed weekly fish consumption OR (95% CI) PEczema at 1 year 0.73 (0.55-0.98) 0.036Specific IgE to any at 4 years 0.93 (0.59-1.47) 0.768Specific IgE to HDM at 4 years 1 (0.62-1.62) 0.984Specific SPT to any at 6 years 0.74 (0.5-1.09) 0.123Specific SPT to HDM at 6 years 0.68 (0.46-1.01) 0.058Persistent wheeze at 6 years 0.87 (0.51-1.49) 0.615Atopic wheeze at 6 years 0.55 (0.31-0.96) 0.034Follow-up6. 5 yearsConfoundingVariables all tested for covariability (only those significant were adjusted for): Gender, maternal age, maternal <strong>and</strong> paternal atopy, maternal <strong>and</strong> paternalasthma, maternal <strong>and</strong> paternal social class, maternal smoking during pregnancy, maternal BMI before pregnancy, gender, gestational age, birth weight,type of fish, parity, <strong>breastfeeding</strong>, ownership of pets, BMI at 6.5 years, dichlorodiphenyldichloroethylene in cord blood, child fish consumption at 4 yearsRisk of biasLow risk of bias: 507 pregnant women originally recruited, then 482 children subsequently enrolled <strong>and</strong> 462 of them completed until 6.5 years follow up.RelevanceSpanish diet differs from Australian dietOther comments Excluded women (21) who reported never eating fish as likely that their disease (high prevalence of atopy <strong>and</strong> asthma) modified their fish intake.Women medically diagnosed with asthma ate significantly less fishWomen who didn’t breastfeed more likely to be from lower social class <strong>and</strong> have a low-birth weight baby - taken into account in regression models.Fish319
Reference Saito 2010Food typeFish (also meat, eggs, dairy)Study typeProspective cohort studyLevel of evidence II (aetiology)SettingNeyagawa City, JapanFundingMinistry of Education, Culture, Sports, Science <strong>and</strong> Technology <strong>and</strong> <strong>Health</strong> <strong>and</strong> Labour Sciences, Ministry of <strong>Health</strong>, Labour <strong>and</strong> Welfare, JapanParticipants771 mother-child pairs recruited from November 2001 to March 2003 at any stage of pregnancy – mean GA 18 weeks (part of the Osaka Maternal <strong>and</strong>Child <strong>Health</strong> Study)Baseline comparisons See confounding belowDietary assessment Diet history questionnaire (DHQ)TimingDHQ to assess dietary habits during the preceding monthComparisonQuartiles of fish consumptionOutcomesSuspected atopic eczemaResultsSuspected atopic eczeman/N OR (95% CI) aOR (95% CI)Q1 (23.0 g/day) 14/192 1.00 1.00Q2 (37.8 g/day) 15/193 1.07 (0.50 to 2.31) 0.93 (0.41 to 2.13)Q3 (51.4 g/day) 21/193 1.55 (0.77 to 3.21) 1.60 (0.75 to 3.51)Q4 (73.1 g/day) 15/193 1.07 (0.50 to 2.31) 1.15 (0.51 to 2.62)FollowupConfoundingRisk of biasRelevanceOther commentsp value for trend (unadjusted): 0.61p value for trend (adjusted): 0.443-4 monthsAdjusted for maternal age, gestation at baseline, family income, maternal <strong>and</strong> paternal education, maternal <strong>and</strong> paternal history of asthma, atopiceczema <strong>and</strong> allergic rhinitis, mite allergen level from maternal bedclothes, vacuuming living room, mould in kitchen, changes in maternal diet inprevious month, season when baseline data collected, baby’s older siblings, baby’s sex, baby’s birthweight, <strong>breastfeeding</strong> <strong>and</strong> bathing or showeringinfantLow risk of bias: Of 1002 eligible women, a final sample of 771 (77%) was available for analysisFish intake in Japan likely to be higher than in AustraliaDietary guidelines for pregnant <strong>and</strong> <strong>breastfeeding</strong> women: evidence report320
Reference Salam 2005Food typeFishStudy typeNested case-control studyLevel of evidence III-3 (aetiology)Setting Children’s <strong>Health</strong> Study (CHS) in California: 4 th , 7 th <strong>and</strong> 10 th grade students in 1993 <strong>and</strong> 4 th grade students in 1995 who attending public school in 12Southern California communitiesFundingCalifornia Air Resources Board, the National Institute of Environmental <strong>Health</strong> Services, U.S. Environmental Protection Agency, National Heart, Lung<strong>and</strong> Blood Institute <strong>and</strong> Hastings FoundationParticipants891 CHS children with asthma diagnosis by age 5 years (n=338) + r<strong>and</strong>omly selected asthma free controls matched on in utero exposure to maternalsmokingRecruited Dec 1999-Dec 2001 n=279 (82.5%) cases <strong>and</strong> n=412 (72.3%) controls with parents/guardians able to be contacted <strong>and</strong> interviewedBaseline comparisons Case n (%) Control n (%) OR (95% CI)n 279 412Born ≥4 weeks preterm 26 (9.4) 13 (23) 2.71 (1.2-6.15In utero exposure to maternal smoking –YES68 (24.4) 263 (18.4) 1.56 (1.14-2.14)See confounding belowDietary Assessment Self completed Questionnaire on frequency of fish intake during the pregnancy, appears that this was collected retrospectivelyTiming Not clear - seems to be when child was recruited (in grade 4, 7 or 10)ComparisonMaternal fish intake during pregnancy (for fish sticks <strong>and</strong> oily fish): never, rarely, at least monthlyOutcomesEarly transient asthma (diagnosed before 3 years old but no symptoms/medication after first grade or previous 12 months to study entry), Earlypersistent asthma (diagnosis before 3 years old <strong>and</strong> ≥1 asthma episode or medication use since grade 1 0r within 12 months of study entry), Late-onsetasthma (diagnosed after age 3 years). Parental report of physician-diagnosed asthma.ResultsFish intake OR (95% CI): Never Rarely ≥ monthly P trendOily fishAny asthma 1 1.01 (0.54-1.89) 0.80 (0.47-1.36) 0.40Early transient asthma 1 0.68 (0.17-2.67) 0.99 (0.34-2.87) 0.92Early persistent asthma 1 1.07 (0.53-2.17) 0.45 (0.23-0.91) 0.04Late-onset asthma 1 0.8 (0.26-3.09) 0.84 (0.33-2.12) 0.66Fish StickAny asthma 1 1.15 (0.66-2.01) 2.04 (1.18-3.51) 0.01Early transient asthma 1 0.74 (0.24-2.27) 2.26 (0.67-7.58) 0.3Early persistent asthma 1 1.51 (0.75-3.04) 2.46 (1.26-4.8) 0.01Late-onset asthma 1 0.98 (0.34-2.89) 3.05 (1.04-8.93) 0.07Oily Fish intake OR (95% CI):Any asthma 1 1.31 (0.65-2.67) 1.09 (0.61-1.94) 0.70Early transient asthma 1 0.7 (0.16-3.11) 1.38 (0.42-4.61) 0.67Early persistent asthma 1 1.55 (0.68-3.52) 0.62 (0.29-1.31) 0.35Late-onset asthma 1 0.84 (0.19-3.71) 1.43 (0.51-3.99) 0.42Fish321
Maternal asthma- YES(reference: no)Any asthma 3.97 (2.07-7.63 1.78 (0.54-5.90) 0.81 (0.29-2.28) 0.006Early transient asthma 3.89 (0.83-18.18) 1.95 (0.1-40.01) 0.98 (0.12-7.82) 0.31Early persistent asthma 5.58 (2.52-12.33) 2.13 (0.57-7.99) 0.63 (0.16-2.56) 0.006Late-onset asthma 6.47 (1.92-21.81) 8.11 (0.47-14.71) 0.33 (0.04-2.76) 0.01Note also looked at relationship for non-oily fish <strong>and</strong> canned fish <strong>and</strong> found no association with asthmaFollow-up 3 years-study entry (grade 4, 7 or 10)ConfoundingAdjusted for maternal asthma, race/ethnicity, maternal age, maternal education, gestational age, number of siblings, exclusive <strong>breastfeeding</strong>, number ofsiblings, other fish variable in table (oily fish, fish stick)Other measured variables not found to be covariates: paternal history of asthma, maternal smoking during pregnancy, second-h<strong>and</strong> tobacco exposure,yearly family incomeRisk of biasLow to moderate risk of bias: Not very detailed estimation of fish intake - debatable accuracy of measure if done years after pregnancyRelevanceFew women reported eating fish daily or weekly basis, only monthly - seems less fish than Australian dietOther comments Fish intake categories broad.Dietary guidelines for pregnant <strong>and</strong> <strong>breastfeeding</strong> women: evidence report322
Reference Sausenthaler 2007Food groupsFishStudy typeProspective cohort study: from the LISA birth cohortLevel of evidence II (aetiology)Setting4 German cities (Munich, Leipzig, Wesel, Bad Honnef)FundingFederal Ministry for Education, Science, Research <strong>and</strong> Technology, GermanyParticipants3097 newborns recruitedBaseline comparisons See Confounding belowDietary assessment FFQTimingVariableMaternal diet during the last 4 weeks of pregnancy (obtained shortly after birth, median 3 days)Low intake group as reference group compared with high intake group: High fish intake = 1-2 times/weekOutcomesResultsLength of followupConfoundingRisk of biasRelevanceOther commentsAllergic sensitisation, eczema at 2 yrsDoctor-diagnosed eczema any allergen sensitisation food allergens inhalant allergensAdjusted OR (95% CI)Fish intake 0.75 (0.57, 0.98) 1.02 (0.73, 1.43) 1.01 (0.69, 1.48) 0.94 (0.56, 1.57)2 yearsCrude <strong>and</strong> adjusted results reported (adjusted for study area, sex, maternal age, maternal smoking, level of parental education, exclusive <strong>breastfeeding</strong>≥ 4 months, parental history of atopic diseases, season of birth <strong>and</strong> all dietary variablesLow risk of bias: Two year data available for 2641/3097 children (85%): 433 lost to follow-up, 9 excluded due to chronic disease, 14 missing maternalFFQLikely to be reasonably similar to dietary intakes of Australian women in AustraliaFish323
Reference Schoeman 2010Food typeFishStudy typeCross-sectional studyLevel of evidence IV (aetiology)SettingCanadaFundingGrants from the First Nation <strong>and</strong> Inuit Branch, Government of Canada <strong>and</strong> <strong>Health</strong> Canada.Participants 1) 22 Canadian women aged 22-42 years old who called the Motherisk program whilst planning pregnancy in 2006-07 for information on the safety ofconsuming fish during pregnancy. Women ineligible if declined, could not be reached by telephone, not fluent in English, had not called Motheriskabout Mercury in fish or had other exposures to mercury.2) 20 Canadian (Southwestern Ontario) women aged 22-29 years old who did not consult the Motherisk program <strong>and</strong> were not concerned about fishconsumption <strong>and</strong> who were acquaintances of the researcher. This group was matched to group 1 on completion of post-secondary education.Women were contacted over the phone or email between July-November 2008.3) 23 Japanese men <strong>and</strong> women aged 21-44 years old in Toronto who frequently consumed large amounts of seafood as part of their diet.Participants approached through a group of Japanese researchers <strong>and</strong> their families in Toronto, a Japanese restaurant <strong>and</strong> a Japanese fish market(where 5 workers agreed to participate).Baseline comparisons See confounding belowDietary Assessment Food frequency questionnaireMethodTimingNot statedComparisonMonthly fish consumption (analysed with correlation)OutcomesHair mercury level in women of reproductive age (not pregnant) <strong>and</strong> some similarly aged Japanese menResultsFollow-upNot statedConfoundingNone statedRisk of bias Medium risk of bias: Participation rate not given; possibly very biased sample; significant differences between women in group 1 <strong>and</strong> group 3RelevanceJapanese diet not similar to Australian; Canadian diet is.Other comments Group 2 were acquaintances of researcher as were some of group 3; Japanese would have very different diet to Canadian women in more areas thanjust seafood.Dietary guidelines for pregnant <strong>and</strong> <strong>breastfeeding</strong> women: evidence report324
Reference Shiell 2001Food groupsFishStudy typeProspective cohortLevel of evidence II (aetiology)SettingMotherwell, Scotl<strong>and</strong>FundingDunhill Medical TrustParticipants626 (274 men <strong>and</strong> 352 women) whose mothers’ food intakes had been recorded during pregnancy during 1967 to 1968. These women had beenadvised to eat 0.45 kg of red meat a day <strong>and</strong> to avoid carbohydrate-rich foods during pregnancyBaseline comparisons See confounding belowDietary assessment Mothers asked about consumption of 10 foodsTimingEarly pregnancy (≤ 20 weeks); late pregnancy (> 20 weeks)ComparisonMaternal consumption of fish (mean consumption in late pregnancy was 1.4 [SD 0.8] serves per weekOutcomesSystolic <strong>and</strong> diastolic blood pressure at in offspring aged 27 to 30 yearsResultsSystolic blood pressure at 27 to 30 yearsRegression coefficient for amount of maternal fish consumption; ß 0.97 95% CI -0.11 to 2.05, p = 0.08Diastolic blood pressure at 27 to 30 yearsRegression coefficient for amount of maternal fish consumption; ß 1.00 95% CI 0.18 to 1.82, p = 0.02Length of followupConfoundingRisk of biasRelevanceOther comments27 to 30 yearsAnalyses adjusted for offspring’s gender, BMI, alcohol consumption, <strong>and</strong> cuff size used for blood pressureModerate risk of bias: <strong>For</strong> the 1432 records from 1967-8 recorded liveborn, singleton births with complete names, birth measurements <strong>and</strong> ≥ 1 dietrecord. 965 offspring were alive <strong>and</strong> living locally; <strong>and</strong> after attrition or declining to participate, 626 (43.7%) were available for analysis.Very high intake of meat <strong>and</strong> very low carbohydrate intake limits the relevance to current dietary intakes of Australian womenAuthors state that “low intake of green vegetables, a source of folate, accentuated the effect of high meat <strong>and</strong> fish consumption on systolic bloodpressure"Fish325
Reference Sontrop 2008Food typeFishStudy typeProspective cohort (Perinatal <strong>Health</strong> Project)Level of evidence II (aetiology)SettingLondon, Ontario, Canada 2002-2005 from 10 ultrasound clinicsFundingCanadian Institute of <strong>Health</strong> ResearchParticipants2061 English speaking women experiencing normal, singleton pregnancies (GA 10-20 weeks) over the age of 16 <strong>and</strong> residing in Middlesex County.Excluded from analysis if taking antidepressants or n-3 PUFA supplements or if energy intake >± 2SD from the meanBaseline comparisons See Confounding below for otherDietary Assessment Food frequency questionnaire-phone interviewTimingFFQ at 12-24 weeks gestationComparison Fish consumption per week: 0, 1, >1EPA + DHA intake in mg per day: 1)Β (95% CI)-0.2 (-0.9 to 0.4)Adjusted EPA + DHA intake in mg per day (
Reference Strain 2008; Davidson 2008a; Davidson 2008b;Food typeFishStudy typeProspective cohort (Seychelles Child Development Nutrition Study)Level of evidence II (aetiology)SettingSeychellesFundingUS National Institute of Environmental <strong>Health</strong> Sciences, NIH, Government of SeychellesParticipants229 women at their first antenatal visit, aged over 16 years, native born Seychellois;Mean maternal mercury concentration was 5.7 ppm [SD3.7]; range 0.2 to 18.5; mean consumption was 9 fish meals per week estimated 537 g of fishper week)Exclusions: 4 infants with major congenital anomalies, 1 set of twinsBaseline comparisons See Confounding belowDietary Assessment Maternal hair methylmercury concentrationsTimingMeasured antenatally at 28 weeks gestation; <strong>and</strong> 1 day after birthComparisonMercury concentrations in mothers’ hairOutcomesBayley Scales of Infant Development (BSID-II); (MDI) <strong>and</strong> Psychomotor Developmental Index (PDI) at 9 <strong>and</strong> 30 months; Bender Visual Motor GestaltTest at 66 months <strong>and</strong> 10.7 years of ageResultsAt infant age of 9 months, maternal hair mercury concentrations were not associated with MDI or PDI scoresFollow-upConfoundingRisk of biasRelevanceOther commentsAt infant age of 30 months, maternal hair mercury concentrations were associated with a significantly lower PDI score (p = 0.05) but not a lower MDIscoreTo 30 months of ageAdjusted for DHA <strong>and</strong> AALow to moderate risk of bias: 300 women recruited with 229 (76.3%) analysed (reasons for losses not reported); insufficient consideration ofconfounders?Of some relevance to Australian women but fish consumption in the Seychelles is much higher as are mercury concentrations in fishFish327
Reference Strom 2009Food typeFishStudy typeProspective cohortLevel of evidence II (aetiology)SettingDanish National Birth Cohort 1996-2002, recruited during first antenatal visit with GP (6-10 weeks gestation)FundingFaroese Research Council, the Fisheries Research Fund of the Faroe Isl<strong>and</strong>s, the European Union 6th framework programme Integrated ResearchProject SEAFOODplus (FOOD-CT-2004-506359), <strong>and</strong> the European Union 6th framework programme EARNEST (FOOD-CT-2005-007036). Fundingfor the Danish National Birth Cohort was provided by the March of Dimes Birth Defects Foundation, the Danish Heart Association, the Danish MedicalResearch Council, Sygekassernes Helsefond, the Danish National Research Foundation, the Danish Pharmaceutical Association, the Ministry of<strong>Health</strong>, the National Board of <strong>Health</strong>, <strong>and</strong> Statens Serum Institut.Participants54,202 Danish women living in Denmark <strong>and</strong> fluent in DanishData analysed for first singleton pregnancies (n=86453) who had not taken fish oil supplements during pregnancy <strong>and</strong> had no missing dataBaseline comparisons See Confounding belowDietary Assessment Food frequency questionnaire - self administeredTimingFFQ in mid-pregnancy (approximately 25 weeks gestation) for month preceding questionnaire completionTelephone interview (not diet related) at 12 & 30 weeks gestation <strong>and</strong> at 6 & 18 months after birthComparison Average fish consumption (grams per day): 0-3, >3-10, >10-20, >20-30 , >30Average intake of n-3 PUFA’s derived from fish consumption (mg per day): 9.1, 14.1, 18.1, 22.2, 27, 32.7, 39.6, 48.4, 72.8OutcomesHospital admission for postpartum depression (PPD), prescription for antidepressants due to postpartum depressionResultsAdjusted PPD-admission <strong>and</strong> PPD-antidepressant prescription aOR (95% CI)Average fish consumption (g/day):0-3 >3-10 >10-20 >20-30 >30 PPPD admission 0.82 (0.42-1.64) 1.09 (0.64-1.84) 1.34 (0.84-2.15) 1.11 (0.64-1.92) Reference 0.5PPD prescription 1.46 (1.12-1.9 1.1 (0.87-1.38) 1.18 (0.95-1.45) 1.03 (0.81-1.32) Reference 0.04Average intake n-3 PUFA’s (mg/day):PPD admission PPD prescription9.1 mg/day 0.96 (0.51-1.78) 1.24 (0.96-1.61)14.1 1.03 (0.55-1.92) 1.17 (0.9-1.53)18.1 0.73 (0.36-1.48) 0.99 (0.75-1.31)22.2 1.33 (0.74-2.39) 1.29 (0.99-1.68)27 1.21 (0.66-2.21) 1.09 (0.83-1.44)32.7 1.65 (0.95-2.88) 1.11 (0.84-1.46)39.9 1.3 (0.72-2.36) 1.04 (0.79-1.38)48.4 0.79 (0.39-1.59) 0.89 (0.67-1.2)72.8 Reference ReferenceP 0.38 0.33Follow-up6 <strong>and</strong> 18 months after birthConfoundingCovariates defined a priori: age, parity, pre-pregnancy BMI, total energy intake, alcohol intake during pregnancy, smoking during pregnancy,occupation, education, homeownership, marital status, social support, history of depression.Risk of bias Low-moderate risk of bias: high attrition - Danish National Birth cohort covered >100,000 pregnancies with >90,000 women enrolled, but only 60%participation rate <strong>and</strong> only 35% of eligible women entered the cohort; however not biased from normal population in terms of in vitro fertilisation, pretermbirth, smoking during pregnancy, small-for-gestational age, pre-pregnancy BMI <strong>and</strong> antepartum stillbirth-but could be biased for post partum depressionDietary guidelines for pregnant <strong>and</strong> <strong>breastfeeding</strong> women: evidence report328
RelevanceOther commentsoutcomes.Those in low fish intake groups more likely to be 4 years post secondary education or be homeowners.Danish diet differs from Australian dietFish329
Reference Thorsdottir 2004Food typeFishStudy typeRetrospective cohortLevel of evidence II (aetiology)SettingIcel<strong>and</strong>ic (Reykjavik) fishing community women selected r<strong>and</strong>omly by computer if they fulfilled the 1-year inclusion criteria according to birth records,1998FundingNil stated in paperParticipants491 (of 614) women aged 20-40 years who were healthy <strong>and</strong> of normal weight (BMI 19.5-25.5) before pregnancy, without a history of hypertension,diabetes, cardiovascular disease or thyroid problems. Only singleton term infants included whose mothers agreed to their maternity records viewed afterthe birth of their infantBaseline comparisons See Confounding belowDietary Assessment Food frequency questionnaire-self administeredTimingNot reported (after birth - around 1 year?)Comparison Frequency of fish consumption as main meal (monthly): < 4, 4-6, > 6OutcomesInfant size (birthweight, length, ponderal index <strong>and</strong> head circumference)Results Only 1% never consumed any fish. Fish liver oil was used as a supplement by 44.8 percent (n = 218) of the women during pregnancy <strong>and</strong> by 38.7percent throughout the whole pregnancy.Adjusted mean*Frequency of fish consumption as main meal (monthly):6 β p valueBirth weight (g) 3725 3780 3810 50 0.098Birth length (cm) 51.8 52.1 52.3 0.35 0.007Head circumference (cm) 3.6 36 36.1 0.24 0.005Ponderal index 26.6 26.7 26.5 -0.43 0.340*Adjusted for weight gain in pregnancy, maternal height, parity, smoking, infant’s gender, gestational length, <strong>and</strong> fish liver oil supplementationInfants of women in the lowest quartile of fish consumption (0–20 g/day) weighed less (p =0.036), were shorter (p = 0.003), <strong>and</strong> had asmaller head circumference (p < 0.001) at birth than those of women eating more fish per day.Adjusted mean**Fish liver oil intake quartile group:1 2 3 4 β p valueBirth weight (g) 3805 3795 3800 3695 -8 0.184Birth length (cm) 52.3 52.1 52.2 51.8 -0.04 0.036Head circumference (cm) 36.1 36 35.9 35.5 -0.04 0.003Ponderal index 26.6 26.8 26.6 26.6 0.02 0.598**Adjusted for weight gain in pregnancy, maernal height, parity, smoking, infant’s gender, gestational length, <strong>and</strong> fish consumption.Follow-upConfoundingResults indicate that constituents of fish <strong>and</strong> fish liver oil affect birth size differently, depending on the amount consumed, <strong>and</strong> that moderateconsumption should be recommended.BirthPre-pregnant weight, weight gain in pregnancy, maternal height, age, parity, smoking , marital status, pregnancy complications, infant’s gender,gestational lengthDietary guidelines for pregnant <strong>and</strong> <strong>breastfeeding</strong> women: evidence report330
Risk of biasRelevanceOther commentsLow risk of biasFishing community likely to have much higher fish intake (average 47 g/d) than general Australian diet <strong>and</strong> very high use of fish liver oil supplementsduring pregnancy (44.8%, <strong>and</strong> 38.7% throughout entire pregnancy).The sample population is already known as having higher than average birth size.614 eligible <strong>and</strong> agreed to maternity records accessed but only 491 completed FFQ (80%)Fish331
Reference Thurston 2007; Myers 2003Food typeFishStudy typeProspective cohort studyLevel of evidence II (aetiology)SettingSeychelles Child Development Study on the Isl<strong>and</strong> of Màhe.FundingGrant from the National Institutes of Environmental <strong>Health</strong> Sciences <strong>and</strong> the National Institute of <strong>Health</strong> <strong>and</strong> the National Centre for ResearchResourcesParticipants 779 mother-child pairs enrolled in 1989-1990 when children were 6 months old (approximately 50% of live-births during that period). Excluded 44mothers <strong>and</strong> children with disorders highly associated with traumatic brain injury, meningitis, epilepsy or severe neonatal illness. 18 children excludedfor closed head trauma <strong>and</strong> meningitisBaseline comparisons See confounding belowDietary Assessment Food frequency questionnaire, (weighed) food record, 24 hour recall, diet historyMethodTimingUnclearComparisonPrenatal methyl mercury exposure (indicative of ocean fish consumption); this population of women consumed about 12 fish meals a weekOutcomesChild development; blood pressure (available from routine school <strong>and</strong> kindergarten examinations-not part of original study design), height <strong>and</strong> weightResultsNeurodevelopment (cognition <strong>and</strong> achievement) at 9 yearsNo significant differences seenNeurodevelopment (motor, perceptual motor <strong>and</strong> memory) at 9 yearsNo significant differences seen, except for decreased performance in the grooved pegboard test for males using the nondominant h<strong>and</strong> associated withincreased exposure to methyl mercuryNeurodevelopment (attention <strong>and</strong> behaviour) at 9 yearsNo significant differences seen, except for improve scores in hyperactivity indexBlood pressure at 15 yearsNo association between antenatal MeHg exposure <strong>and</strong> blood pressure in girls at either 12 or 15 years, or boys at 12 years of age; at age 15 years,diastolic BP in boys increased with increasing antenatal MeHg exposure, while systolic BP was unaffected.Table 2Pearson correlations between average blood pressure measurements (mmHg) at a single age <strong>and</strong> between two ages, <strong>and</strong> correlations betweenaverage BP <strong>and</strong> prenatal MeHg exposure.NSystolic BP <strong>and</strong>diastolic BPDiastolic BP(2 ages)Systolic BP(2 ages)Diastolic BP<strong>and</strong> MeHgBoth sexes12 years 644 0.64 0.02 0.0215 years 559 0.50 0.10 0.03Across years 524 0.32 0.34 Boys12 years 313 0.59 0.03 0.0315 years 267 0.55 0.17 0.06Across years 244 0.22 0.34 Systolic BP<strong>and</strong> MeHgGirlsDietary guidelines for pregnant <strong>and</strong> <strong>breastfeeding</strong> women: evidence report332
12 years 331 0.69 0.03 015 years 292 0.55 0.04 0.04Across years 280 0.39 0.40 BP measurements are the average of duplicate readings. BP = blood pressure, MeHg = methylmercury. Column 3 of this table gives the correlationsbetween average diastolic <strong>and</strong> average systolic BP at a single are (12 years or 15 years, as indicated in column 1). Correlations betweenmeasurements at two different ages are given in columns 4 <strong>and</strong> 5. <strong>For</strong> example, column 4 gives the correlation between diastolic BP at age 12 <strong>and</strong>diastolic BP at age 15.Follow-up Child cognitive development at 9 years (Myers 2003)Children’s blood pressure - 7 (10 years old) <strong>and</strong> 10 (15 years old) (Thurston 2007)ConfoundingAdjusted for gender, prenatal mercury exposure, maternal hypertension during pregnancy that required medical treatment, birth weight, age at testing,BMI <strong>and</strong> heightRisk of biasLow risk of bias: Was done double blind; 7 participants excluded due to missing covariates, one with implausible weight <strong>and</strong> one over 18 years old.86% participation in 2001 <strong>and</strong> 80% participation in 2002; SES was missing in over 10% of the sample (pp 926)650 children participated at 12 years, Complete data available for 644 (313 boys, 331 girls)568 children participated at 15 years, Complete data available for 559 (267 boys, 292 girls)RelevanceNot similar to Australia, the authors report the Màhe isl<strong>and</strong> has high fish consumption.Other comments Note: outcome not analysed in relation to dietary intake of fish or other food (only to mercury); mercury concentration in Seychelles not excessively highFish333
Reference Venter 2009Food groupsFish: white fish, shellfish, oily fishStudy typeProspective cohortLevel of evidence II (aetiology)SettingPortsmouth, UKFundingFood St<strong>and</strong>ards AgencyParticipants 969 pregnant women at 12 weeks gestation (with estimated birth date between 1 September 2001 <strong>and</strong> 31 August 2002)Baseline comparisons <strong>Pregnant</strong> women with a maternal history of atopic disease were more likely to smokeDietary assessment FFQTimingFFQ at 36 weeks gestationComparisonNo versus moderate versus frequent versus uncertain consumption of fish during pregnancyNone Moderate Frequent UncertainWhite fish: 11% 84% 5% < 1%Shellfish: 60% 40% < 1% < 1%Oily fish: 53% 45% 1% < 1%OutcomesResultsLength of followupConfoundingRisk of biasRelevanceOther commentsFood hypersensitivity (FHS) in infants up to three years of ageInfant FHS at three years:1/936 infants showed FHS to milk in the first three years (mother reported moderate consumption of fish during pregnancy)“Statistical inferences could not be measured due to the small numbers”Up to three yearsAnalyses do not appear to have been adjustedModerate-high risk of bias: Data were obtained from 91% (n = 969) of the birth cohort; at 1 year follow-up data were available for 77.6% (752/969) <strong>and</strong>for 65.2% (632/969) at 3 years; analyses probably not adjusted for confoundersLikely to be relevant to Australian womenDietary guidelines for pregnant <strong>and</strong> <strong>breastfeeding</strong> women: evidence report334
Reference Willers 2007Food typeFishStudy typeProspective cohort (longitudinal)Level of evidence II (aetiology)SettingAntenatal clinics at Aberdeen Maternity Hospital, Aberdeen, Scotl<strong>and</strong>FundingAsthma UK, GA 2 LEN European Network of Excellence on Global Allergy <strong>and</strong> AsthmaParticipants1212 children (singleton births) whose mothers were recruited between October 1997 <strong>and</strong> April 1999 at a median gestational age of 12 weeksBaseline comparisons Women were representative of the local obstetric populationSee confounding belowDietary assessment FFQTimingFFQ mailed at 32 weeks gestation to cover dietary intake over the previous 2-3 monthsComparisonTertiles:OutcomesEczema, hay fever at 5 yearsResultsTotal fish consumptionN T1 (never) T2 (< 1/week) T1 (≥ 1/week) P trendn = 107 n = 255 n = 831Doctor confirmed eczema 979OR (95% CI) 1 0.77 (0.46 to 1.28) 0.60 (0.38 to 0.96) 0.016aOR (95% CI) 1 0.79 (0.47 to 1.32) 0.57 (0.35 to 0.92) 0.008Current eczema medication 982OR (95% CI) 1 0.85 (0.45 to 1.61) 0.67 (0.38 to 1.19) 0.111aOR (95% CI) 1 0.88 (0.46 to 1.67) 0.58 (0.32 to 1.06) 0.028Ever had eczema 983OR (95% CI) 1 0.88 (0.53 to 1.47) 0.73 (0.47 to 1.16) 0.111aOR (95% CI) 1 0.91 (0.54 to 1.53) 0.68 (0.43 to 1.10) 0.050Total oily fish consumptionn = 629 n = 414 n = 161Doctor confirmed hay fever 990OR (95% CI) 1 0.57 (0.31 to 1.08) 0.20 (0.05 to 0.85) 0.006aOR (95% CI) 1 0.66 (0.34 to 1.28) 0.28 (0.06 to 1.19) 0.043Current hay fever medication 988OR (95% CI) 1 1.08 (0.53 to 2.22) 0.20 (0.03 to 1.53) 0.226aOR (95% CI) 1 1.02 (0.48 to 2.20) 0.19 (0.02 to 1.48) 0.194Ever had hay feverOR (95% CI) 1 1.11 (0.70 to 1.75) 0.38 (0.15 to 0.98) 0.155aOR (95% CI) 1 1.11 (0.68 to 1.82) 0.37 (0.14 to 0.98) 0.159Fish335
FollowupConfoundingRisk of biasRelevanceOther comments5 yearsAdjusted for maternal age, paternal social class, maternal education, maternal smoking during pregnancy, smoking in the child’s home at 5 years,energy intake, maternal asthma, maternal atopy, child’s birthweight, child’s sex, presence of older siblings, <strong>and</strong> <strong>breastfeeding</strong>Low risk of bias: Initial study population of 1924 children dropped to 1212 participants with complete data (63.0%) (questionnaire, at least one of theoutcome time points).Likely to be reasonably relevant to Australian womenInclusion of maternal supplement use during pregnancy did not materially change the results;Only eczema <strong>and</strong> hay fever outcomes reported for fish consumption – assume that no association was found for other outcomes such as asthma?Dietary guidelines for pregnant <strong>and</strong> <strong>breastfeeding</strong> women: evidence report336
Reference Willers 2008Food typeFishStudy typeProspective cohort (longitudinal)Level of evidence II (aetiology)SettingNetherl<strong>and</strong>sFundingNetherl<strong>and</strong>s Organization for <strong>Health</strong> Research <strong>and</strong> Development, Netherl<strong>and</strong>s Organization for Scientific Research; Netherl<strong>and</strong>s Asthma Fund;Netherl<strong>and</strong>s Ministry of Spatial Planning, Housing, <strong>and</strong> the Environment; Netherl<strong>and</strong>s Ministry of <strong>Health</strong>, Welfare <strong>and</strong> Sport, GlaxoSmithKlineParticipants2,832 children (part of the Prevention <strong>and</strong> Incidence of Asthma <strong>and</strong> Mite Allergy (PIAMA) birth cohort studyBaseline comparisons See confounding belowDietary assessment FFQTimingFFQ administered at antenatal recruitment (mean gestational ages not reported) to cover dietary intake over the previous monthComparisonDaily (once per day or more) v 1-4 times a week or fewerOutcomesWheeze, dyspnoea, prescription of inhaled steroids for respiratory problems, composite variable ‘asthma symptoms’ in the last 12 months (measuredlongitudinally from 1 to 8 years age)Results Wheeze from 1 to 8 years age (n = 2811)OR 1.15 95% CI 0.99 to 1.35aOR 1.10 95% CI 0.94 to 1.29Dyspnoea from 1 to 8 years age (n = 2811)OR 1.11 95% CI 0.92 to 1.33aOR 1.07 95% CI 0.89 to 1.29Steroid use from 1 to 8 years age (n = 2811)OR 0.86 95% CI 0.67 to 1.12aOR 0.85 95% CI 0.66 to 1.10FollowupConfoundingRisk of biasRelevanceOther commentsAsthma symptoms (composite of previous three outcomes) from 1 to 8 years age (n = 2811)OR 1.03 95% CI 0.88 to 1.23aOR 1.01 95% CI 0.85 to 1.208 yearsThe child’s dietary data on fruit, vegetables, fish, eggs, full cream milk, butter <strong>and</strong> peanut butter consumption at 2 years of age were used to check forpotential confounding by the child’s diet.Results were adjusted for by sex, maternal education, parental allergy, maternal smoking during pregnancy, smoking in the home at 8 years of age,<strong>breastfeeding</strong>, presence of older siblings, birthweight, maternal overweight 1 year after pregnancy, maternal supplement use during pregnancy, region<strong>and</strong> study arm (intervention or natural history arm).Moderate risk of bias: Initial study population of 4,146 mothers dropped to 2,832 participants with complete data (68.3%) (pregnancy questionnaire, atleast one of the outcome time points <strong>and</strong> all confounders). Participants with complete data were more likely to have a high education level, to have dailydairy <strong>and</strong> fruit intake during pregnancy <strong>and</strong> to have breastfed <strong>and</strong> less likely to have maternal asthma or maternal atopy, smoked during pregnancy, befrom a south western region compared with participants who did not have complete data.Dietary intakes likely to be different from Australian e.g. low fish consumption in study participantsNot clear when women assessed their diet during pregnancy;83% of pregnant women used supplements (50% used folic acid/iron)Fish337
Reference Williams 2001Food typeFishStudy typeProspective cohort studyLevel of evidence II (aetiology)Setting Southwest Engl<strong>and</strong>, ALSPAC (Avon Longitudinal Study of Parents <strong>and</strong> Children) 1 st April 1991- 31 st December 1992FundingSupported by The Medical Research Council; the Wellcome Trust; The Ministry of Agriculture, Foods <strong>and</strong> Fisheries; the Departments of <strong>Health</strong> <strong>and</strong> theEnvironment; The South West Regional <strong>Health</strong> Authority; the National Eye Research Centre; Cow <strong>and</strong> Gate; <strong>and</strong> Milupa, all in the United Kingdom. Thedocosahexaenoic acid assays of maternal blood were carried out by Scotia Pharmaceuticals, Stirling, United Kingdom, at the instigation of DF HorrobinParticipantsR<strong>and</strong>om subset (n=641) of full term children born in the last 6 months of ALSPAC assessed, excluded if strabismus, reduced vision, high refractive error(n=55, 9%), preterm (n=16, 2.5%) missing dietary data or non-compliance with visual assessment (n=135, 21%). 435 (68%) included in analyses.Foveal stereoacuity n=150, macular stereoacuity n=229, peripheral stereoacuity n=56Baseline comparisons See Confounding belowDietary Assessment Food frequency questionnaire-self administeredTimingFFQ at 32 weeks gestationComparisonMaternal intake of any fish (white, oily, shellfish) during pregnancy: yes, noOutcomesStereoacuity (foveal stereoacuity, macular stereoacuity, peripheral stereoacuity)ResultsUnivariate chi-square analysisMother ate any fish yes noFoveal stereoacuity 33.9 36.4Macular stereoacuity 52.1 54.5Peripheral stereoacuity 14 9.1P= 0.046Mother ate any white fishFoveal stereoacuity 36.7 29.6Macular stereoacuity 51.2 53.5Peripheral stereoacuity 12.1 16.9p = 0.274Mother ate any shellfishFoveal stereoacuity 36 34.8Macular stereoacuity 54.6 51Peripheral stereoacuity 7.3 16.3P = 0.582Mother ate any oily fishFoveal stereoacuity 40.1 27.5Macular stereoacuity 48 57.5Peripheral stereoacuity 11.9 15.6P = 0.012maternal oily fish aOR (95% CI) No yesReferent 1.57 (1-2.45)Dietary guidelines for pregnant <strong>and</strong> <strong>breastfeeding</strong> women: evidence report338
Follow-upConfoundingRisk of biasRelevanceOther comments3.5 years<strong>For</strong> adjusted analysis: <strong>breastfeeding</strong>, child’s sex, maternal education, maternal age, housing tenure, financial difficulties, maternal smoking, oldersiblings, paid child care, mother’s paid employment since child birth, mother is vegetarian, maternal consumption of any fish/white fish/shell fish, childconsumption of oily fish at 36 monthsLow-moderate risk of bias: not adjusted for maternal IQ, home environmentUK diet similar to Australian641 children out of 14,541 women assessed - not stated how these were selected/excluded. Only 2/3rd of those r<strong>and</strong>omly selected who attended wereactually tested – reasons not given as to why not the other 1/3rd were not.Children who did not comply with the test were significantly more likely to live in public housing <strong>and</strong> have older siblings than those who complied withthe test.Mothers who children were assessed had higher red blood cell DHA concentrations than the general population of the ALSPAC study (2.71 vs. 2.36%respectively, p
Reference Xue 2007Food typeFishStudy typeProspective cohort studyLevel of evidence II (aetiology)SettingPregnancy Outcomes <strong>and</strong> Community <strong>Health</strong> (POUCH) study, women enrolled from 52 prenatal clinics in Michigan between 15 <strong>and</strong> 27 weeksFundingThe National Institute of Child <strong>Health</strong> <strong>and</strong> Human Development, the National Institute of Nursing Research, the March of Dimes Perinatal EpidemiologyResearch Initiative, the Agency for Toxic Substances <strong>and</strong> Disease Registry.Participants1226 women with a singleton pregnancy over 14 years old who spoke English <strong>and</strong> were screened for maternal serum alpha-fetoprotein levels between15 <strong>and</strong> 22 weeks gestation. Women were not eligible if there were any known congenital or chromosomal anomalies at the time of recruitment, ordiabetes mellitus.Baseline comparisons See Confounding belowDietary Assessment Food frequency interviewTimingAt enrolment (between 15 <strong>and</strong> 27 weeks) for the time of the pregnancy thus farComparisonMaternal fish consumption (no. of meals per 6 months): 0, 1-5, 6-23, ≥24OutcomesFish intake <strong>and</strong> mercury level in maternal hair sample.Maternal mercury level <strong>and</strong> gestational age at birthNOTE: outcome is not directly related to maternal fish intakeResultsTotal maternal fish consumption (no. of meals per 6 months):0 (ref) 1-5 6-23 ≥24Mean mercury (µg/g) 0.11 (0.1-0.13) 0.17 (0.16-0.18) 0.21 (0.2-0.23) 0.25 (0.23-0.27)Adjusted association between high mercury hair levels <strong>and</strong> risk of preterm birth OR (95% CI)Term (≥ 37 weeks)All preterm (< 37 weeks) 1.55 (0.79-2.9)Moderately preterm (35-36 weeks) 0.4(0.1-1.9)Vry preterm (< 35 weeks) 3.0 (1.3-6.7)Follow-upConfoundingRisk of biasRelevanceOther commentsBirthAdjusted for total fish consumption, maternal age, ethnicity, Medicaid status <strong>and</strong> community.Low risk of bias: 1,226 of enrolled women were excluded from analysis 16% loss to follow up (n=5) or no available hair sample (n=197).American diet similar to Australian diet1226 women enrolled in POUCH, fewer African American over 30 years old enrolled in the study than in the general population.Interview <strong>and</strong> questions about diet (specifically about fish) may have influenced participants’ subsequent diet for the remainder of the pregnancyDietary guidelines for pregnant <strong>and</strong> <strong>breastfeeding</strong> women: evidence report340
Reference Yin 2010 (see also Jones 2000)Food typeFishStudy typeProspective cohortLevel of evidence II (aetiology)SettingSouthern Tasmania, AustraliaFundingNHMRC, Tasmanian Government, Royal Hobart Hospital Acute Care ProgramParticipants216 adolescents born in 1988 (part of a larger infant health study of babies at high risk of SIDS)Exclusions: multiple pregnanciesBaseline comparisons Children with unemployed fathers more likely to have been excluded due to missing dataDietary assessment FFQTimingDietary intake during third trimester of pregnancyComparisonLinear regression of density (portions per kJ)OutcomesBone mass (bone mineral density (BMD) <strong>and</strong> bone mineral content*) in 16 year old adolescentsResultsBMD at 16 years;Total body (g/cm 2 )r 2 0.010; ß +70.5 (pns)adjusted r 2 0.323; ß +14.9 (pns)Femoral neck (g/cm 2 )r 2 0.009 ß +92.2 (pns)adjusted r 2 0.349; ß +32.7 (pns)Lumbar spine (g/cm 2 )r 2 -0.004; ß +12.6 (pns)adjusted r 2 0.198; ß -27.0 (pns)Followup16 yearsConfoundingAnalyses were adjusted for sex, weight at age 16 years, sunlight exposure in winter at age 16 years, smoking during pregnancy, sports participation,ever breast-fed, current calcium intake, Tanner stage, maternal age at the time of childbirth <strong>and</strong> “other factors” [these other factors were not listed in thepaper]Risk of bias Moderate to high risk of bias: 415 children were followed from birth to age 16. This dropped to 216 (dietary information missing or unreliable for 138mothers, 47 multiple births, 14 participants had missing data for confounders) representing 52% of participants followed from birth to age 16; 70% of the216 participants male; suggests potential selection bias (due to original selection of infants at high risk of SIDS)RelevanceInfants at high risk of SIDS represent a selected group (more males, preterm births, teenage mothers, smoking during pregnancy)Other comments *Bone mineral content results not reported;Study flow figures differ between 2000 <strong>and</strong> 2010 reports (e.g. numbers of multiple births)Fish341
ReferencesAkre O, Boyd HA, Ahlgren M, Wilbr<strong>and</strong> K, Westergaard T, Hjalgrim H,Nordenskjold A, Ekbom A <strong>and</strong> Melbye M. "Maternal <strong>and</strong> gestational riskfactors for hypospadias." Environ <strong>Health</strong> Perspect 2008: 116(8): 1071-6.Asserhoj M, Nehammer S, Matthiessen J, Michaelsen KF <strong>and</strong> Lauritzen L."Maternal fish oil supplementation during lactation may adversely affectlong-term blood pressure, energy intake, <strong>and</strong> physical activity of 7-year-oldboys." J Nutr 2009: 139(2): 298-304.Browne JC, Scott KM <strong>and</strong> Silvers KM. "Fish consumption in pregnancy <strong>and</strong>omega-3 status after birth are not associated with postnatal depression." JAffect Disord 2006: 90(2-3): 131-9.Buck GM, Tee GP, Fitzgerald EF, Vena JE, Weiner JM, Swanson M <strong>and</strong> MsallME. "Maternal fish consumption <strong>and</strong> infant birth size <strong>and</strong> gestation: NewYork State Angler Cohort Study." Environ <strong>Health</strong> 2003: 2(1): 7.Bunin GR, Gallagher PR, Rorke-Adams LB, Robison LL <strong>and</strong> Cnaan A. "Maternalsupplement, micronutrient, <strong>and</strong> cured meat intake during pregnancy <strong>and</strong> riskof medulloblastoma during childhood: a children's oncology group study."Cancer Epidemiol Biomarkers Prev 2006: 15(9): 1660-7.Bunin GR, Kushi LH, Gallagher PR, Rorke-Adams LB, McBride ML <strong>and</strong> Cnaan A."Maternal diet during pregnancy <strong>and</strong> its association with medulloblastoma inchildren: a children's oncology group study (United States)." Cancer CausesControl 2005: 16(7): 877-91.Calvani M, Aless<strong>and</strong>ri C, Sopo SM, Panetta V, Pingitore G, Tripodi S, Zappala D<strong>and</strong> Zicari AM. "Consumption of fish, butter <strong>and</strong> margarine during pregnancy<strong>and</strong> development of allergic sensitizations in the offspring: role of maternalatopy." Pediatr Allergy Immunol 2006: 17(2): 94-102.Chatzi L, Torrent M, Romieu I, Garcia-Esteban R, Ferrer C, Vioque J, KogevinasM, <strong>and</strong> Sunyer J. "Mediterranean diet in pregnancy is protective for wheeze<strong>and</strong> atopy in childhood." Thorax 2008: 63(6): 507-13.Daniels JL, Longnecker MP, Rowl<strong>and</strong> AS <strong>and</strong> Golding J. "Fish intake duringpregnancy <strong>and</strong> early cognitive development of offspring." Epidemiology2004: 15(4): 394-402.Gale CR, Robinson SM, Godfrey KM, Law CM, Schlotz W <strong>and</strong> O'Callaghan FJ."Oily fish intake during pregnancy--association with lower hyperactivity butnot with higher full-scale IQ in offspring." J Child Psychol Psychiatry 2008:49(10): 1061-8.Giordano F, Abballe A, De Felip E, di Domenico A, Ferro F, Grammatico P,Ingelido AM, Marra V, Marrocco G, Vallasciani S <strong>and</strong> Figa-Talamanca I."Maternal exposures to endocrine disrupting chemicals <strong>and</strong> hypospadias inoffspring." Birth Defects Res A Clin Mol Teratol 2010: 88(4): 241-50.Giordano F, Carbone P, Nori F, Mantovani A, Taruscio D <strong>and</strong> Figa-Talamanca I."Maternal diet <strong>and</strong> the risk of hypospadias <strong>and</strong> cryptorchidism in theoffspring." Paediatr Perinat Epidemiol 2008: 22(3): 249-60.Golding J, Steer C, Emmett P, Davis JM <strong>and</strong> Hibbeln JR. "High levels ofdepressive symptoms in pregnancy with low omega-3 fatty acid intake fromfish." Epidemiology 2009: 20(4): 598-603.Guldner L, Monfort C, Rouget F, Garlantezec R <strong>and</strong> Cordier S. "Maternal fish<strong>and</strong> shellfish intake <strong>and</strong> pregnancy outcomes: a prospective cohort study inBrittany, France." Environ <strong>Health</strong> 2007: 6: 33.Dietary guidelines for pregnant <strong>and</strong> <strong>breastfeeding</strong> women: evidence report342
Haggarty P, Campbell DM, Duthie S, Andrews K, Hoad G, Piyathilake C <strong>and</strong>McNeill G. "Diet <strong>and</strong> deprivation in pregnancy." Br J Nutr 2009: 102(10):1487-97.Halldorsson TI, Meltzer HM, Thorsdottir I, Knudsen V <strong>and</strong> Olsen SF. "Is highconsumption of fatty fish during pregnancy a risk factor for fetal growthretardation? A study of 44,824 Danish pregnant women." Am J Epidemiol2007: 166(6): 687-96.Halldorsson TI, Thorsdottir I, Meltzer HM, Nielsen F <strong>and</strong> Olsen SF. "Linkingexposure to polychlorinated biphenyls with fatty fish consumption <strong>and</strong>reduced fetal growth among Danish pregnant women: a cause for concern?"Am J Epidemiol 2008: 168(8): 958-65.Haugen M, Meltzer HM, Brantsaeter AL, Mikkelsen T, Osterdal ML, Alex<strong>and</strong>erJ, Olsen SF <strong>and</strong> Bakketeig L. "Mediterranean-type diet <strong>and</strong> risk of pretermbirth among women in the Norwegian Mother <strong>and</strong> Child Cohort Study(MoBa): a prospective cohort study." Acta Obstet Gynecol Sc<strong>and</strong> 2008: 87(3):319-24.Hibbeln JR, Davis JM, Steer C, Emmett P, Rogers I, Williams C <strong>and</strong> Golding J."Maternal seafood consumption in pregnancy <strong>and</strong> neurodevelopmentaloutcomes in childhood (ALSPAC study): an observational cohort study."Lancet 2007: 369(9561): 578-85.Jedrychowski W, Flak E, Mroz E, Pac A, Jacek R, Sochacka-Tatara E, Spengler J,Rauh V <strong>and</strong> Perera F. "Modulating effects of maternal fish consumption onthe occurrence of respiratory symptoms in early infancy attributed toprenatal exposure to fine particles." Ann Nutr Metab 2008: 52(1): 8-16.Jedrychowski W, Perera F, Mrozek-Budzyn D, Flak E, Mroz E, Sochacka-TataraE, Jacek R, Kaim I, Skolicki Z <strong>and</strong> Spengler JD. "Higher fish consumption inpregnancy may confer protection against the harmful effect of prenatalexposure to fine particulate matter." Ann Nutr Metab 2010: 56(2): 119-26.FishJensen CD, Block G, Buffler P, Ma X, Selvin S <strong>and</strong> Month S. "Maternal dietaryrisk factors in childhood acute lymphoblastic leukemia (United States)."Cancer Causes Control 2004: 15(6): 559-70.Jones G, Riley MD <strong>and</strong> Dwyer T. "Maternal diet during pregnancy isassociated with bone mineral density in children: a longitudinal study." Eur JClin Nutr 2000: 54(10): 749-56.Lamb MM, Myers MA, Barriga K, Zimmet PZ, Rewers M <strong>and</strong> Norris JM."Maternal diet during pregnancy <strong>and</strong> islet autoimmunity in offspring."Pediatr Diabetes 2008: 9(2): 135-41.Latva-Pukkila U, Isolauri E <strong>and</strong> Laitinen K. "Dietary <strong>and</strong> clinical impacts ofnausea <strong>and</strong> vomiting during pregnancy." J Hum Nutr Diet 2010: 23(1): 69-77.Lauritzen L, Jorgensen MH, Mikkelsen TB, Skovgaard M, Straarup EM, OlsenSF, Hoy CE <strong>and</strong> Michaelsen KF. "Maternal fish oil supplementation inlactation: effect on visual acuity <strong>and</strong> n-3 fatty acid content of infanterythrocytes." Lipids 2004: 39(3): 195-206.Lauritzen L, Jorgensen MH, Olsen SF, Straarup EM <strong>and</strong> Michaelsen KF."Maternal fish oil supplementation in lactation: effect on developmentaloutcome in breast-fed infants." Reprod Nutr Dev 2005a: 45(5): 535-47.Lauritzen L, Hoppe C, Straarup EM <strong>and</strong> Michaelsen KF. "Maternal fish oilsupplementation in lactation <strong>and</strong> growth during the first 2.5 years of life."Pediatr Res 2005b: 58(2): 235-42.Lauritzen L, Kjaer TM, Fruekilde MB, Michaelsen KF <strong>and</strong> Frokiaer H. "Fish oilsupplementation of lactating mothers affects cytokine production in 2 1/2-year-old children." Lipids 2005c: 40(7): 669-76.Maconochie N, Doyle P, Prior S <strong>and</strong> Simmons R. "Risk factors for firsttrimester miscarriage--results from a UK-population-based case-controlstudy." BJOG 2007: 114(2): 170-86.343
Mendez MA, Torrent M, Julvez J, Ribas-Fito N, Kogevinas M <strong>and</strong> Sunyer J."Maternal fish <strong>and</strong> other seafood intakes during pregnancy <strong>and</strong> childneurodevelopment at age 4 years." Public <strong>Health</strong> Nutr 2009: 12(10): 1702-10.Mendez MA, Plana E, Guxens M, <strong>For</strong>adada Morillo CM, Albareda RM, Garcia-Esteban R, Goni F, Kogevinas M <strong>and</strong> Sunyer J. "Seafood consumption inpregnancy <strong>and</strong> infant size at birth: results from a prospective Spanishcohort." J Epidemiol Community <strong>Health</strong> 2010: 64(3): 216-22.Mikkelsen TB, Osterdal ML, Knudsen VK, Haugen M, Meltzer HM, Bakketeig L<strong>and</strong> Olsen SF. "Association between a Mediterranean-type diet <strong>and</strong> risk ofpreterm birth among Danish women: a prospective cohort study." ActaObstet Gynecol Sc<strong>and</strong> 2008: 87(3): 325-30.Mitchell EA, Robinson E, Clark PM, Becroft DM, Glavish N, Pattison NS, PryorJE, Thompson JM <strong>and</strong> Wild CJ. "Maternal nutritional risk factors for small forgestational age babies in a developed country: a case-control study." ArchDis Child Fetal Neonatal Ed 2004: 89(5): F431-5.Miyake Y, Sasaki S, Yokoyama T, Tanaka K, Ohya Y, Fukushima W, Saito K,Ohfuji S, Kiyohara C, Hirota Y <strong>and</strong> Study. atOMaCH. "Risk of postpartumdepression in relation to dietary fish <strong>and</strong> fat intake in Japan: the OsakaMaternal <strong>and</strong> Child <strong>Health</strong> Study " Psychological Medicine 2006: 36: 1727-35.Miyake Y, Sasaki S, Tanaka K, Ohfuji S <strong>and</strong> Hirota Y. "Maternal fatconsumption during pregnancy <strong>and</strong> risk of wheeze <strong>and</strong> eczema in Japaneseinfants aged 16-24 months: the Osaka Maternal <strong>and</strong> Child <strong>Health</strong> Study."Thorax 2009: 64(9): 815-21.Myers GJ, Davidson PW, Cox C, Shamlaye CF, Palumbo D, Cernichiari E,Sloane-Reeves J, Wilding GE, Kost J, Huang LS <strong>and</strong> Clarkson TW. "Prenatalmethylmercury exposure from ocean fish consumption in the Seychelles childdevelopment study." Lancet 2003: 361(9370): 1686-92.Nwaru BI, Ahonen S, Kaila M, Erkkola M, Haapala AM, Kronberg-Kippila C,Veijola R, Ilonen J, Simell O, Knip M <strong>and</strong> Virtanen SM. "Maternal diet duringpregnancy <strong>and</strong> allergic sensitization in the offspring by 5 yrs of age: aprospective cohort study." Pediatr Allergy Immunol 2010: 21(1 Pt 1): 29-37.Oien T, Storro O <strong>and</strong> Johnsen R. "Do early intake of fish <strong>and</strong> fish oil protectagainst eczema <strong>and</strong> doctor-diagnosed asthma at 2 years of age? A cohortstudy." J Epidemiol Community <strong>Health</strong> 2010: 64(2): 124-9.Oken E, Kleinman KP, Olsen SF, Rich-Edwards JW <strong>and</strong> Gillman MW."Associations of seafood <strong>and</strong> elongated n-3 fatty acid intake with fetalgrowth <strong>and</strong> length of gestation: results from a US pregnancy cohort." Am JEpidemiol 2004: 160(8): 774-83.Oken E, Wright RO, Kleinman KP, Bellinger D, Amarasiriwardena CJ, Hu H,Rich-Edwards JW <strong>and</strong> Gillman MW. "Maternal fish consumption, hairmercury, <strong>and</strong> infant cognition in a U.S. Cohort." Environ <strong>Health</strong> Perspect2005: 113(10): 1376-80.Oken E, Ning Y, Rifas-Shiman SL, Rich-Edwards JW, Olsen SF <strong>and</strong> Gillman MW."Diet during pregnancy <strong>and</strong> risk of preeclampsia or gestationalhypertension." Ann Epidemiol 2007: 17(9): 663-8.Oken E, Osterdal ML, Gillman MW, Knudsen VK, Halldorsson TI, Strom M,Bellinger DC, Hadders-Algra M, Michaelsen KF <strong>and</strong> Olsen SF. "Associations ofmaternal fish intake during pregnancy <strong>and</strong> <strong>breastfeeding</strong> duration withattainment of developmental milestones in early childhood: a study from theDanish National Birth Cohort." Am J Clin Nutr 2008b: 88(3): 789-96.Dietary guidelines for pregnant <strong>and</strong> <strong>breastfeeding</strong> women: evidence report344
Oken E, Radesky JS, Wright RO, Bellinger DC, Amarasiriwardena CJ, KleinmanKP, Hu H <strong>and</strong> Gillman MW. "Maternal fish intake during pregnancy, bloodmercury levels, <strong>and</strong> child cognition at age 3 years in a US cohort." Am JEpidemiol 2008a: 167(10): 1171-81.Olsen SF, Olsen J <strong>and</strong> Frische G. "Does fish consumption during pregnancyincrease fetal growth? A study of the size of the newborn, placental weight<strong>and</strong> gestational age in relation to fish consumption during pregnancy." Int JEpidemiol 1990: 19(4): 971-7.Olsen SF, Gr<strong>and</strong>jean P, Weihe P <strong>and</strong> Videro T. "Frequency of seafood intakein pregnancy as a determinant of birth weight: evidence for a dosedependent relationship." J Epidemiol Community <strong>Health</strong> 1993: 47(6): 436-40.Olsen SF <strong>and</strong> Secher NJ. "Low consumption of seafood in early pregnancy as arisk factor for preterm delivery: prospective cohort study." BMJ 2002:324(7335): 447.Petridou E, Koussouri M, Toupadaki N, Youroukos S, Papavassiliou A,Pantelakis S, Olsen J <strong>and</strong> Trichopoulos D. "Diet during pregnancy <strong>and</strong> the riskof cerebral palsy." Br J Nutr 1998: 79(5): 407-12.Petridou E, Ntouvelis E, Dessypris N, Terzidis A <strong>and</strong> Trichopoulos D."Maternal diet <strong>and</strong> acute lymphoblastic leukemia in young children." CancerEpidemiol Biomarkers Prev 2005: 14(8): 1935-9.Pogoda JM, Preston-Martin S, Howe G, Lubin F, Mueller BA, Holly EA, FilippiniG, Peris-Bonet R, McCredie MR, Cordier S <strong>and</strong> Choi W. "An international casecontrolstudy of maternal diet during pregnancy <strong>and</strong> childhood brain tumorrisk: a histology-specific analysis by food group." Ann Epidemiol 2009: 19(3):148-60.Ramon R, Ballester F, Aguinagalde X, Amurrio A, Vioque J, Lacasana M,Rebagliato M, Murcia M <strong>and</strong> Iniguez C. "Fish consumption during pregnancy,prenatal mercury exposure, <strong>and</strong> anthropometric measures at birth in aprospective mother-infant cohort study in Spain." Am J Clin Nutr 2009: 90(4):1047-55.Rogers I, Emmett P, Ness A <strong>and</strong> Golding J. "Maternal fish intake in latepregnancy <strong>and</strong> the frequency of low birth weight <strong>and</strong> intrauterine growthretardation in a cohort of British infants." J Epidemiol Community <strong>Health</strong>2004: 58(6): 486-92.Romieu I, Torrent M, Garcia-Esteban R, Ferrer C, Ribas-Fito N, Anto JM <strong>and</strong>Sunyer J. "Maternal fish intake during pregnancy <strong>and</strong> atopy <strong>and</strong> asthma ininfancy." Clin Exp Allergy 2007: 37(4): 518-25.Saito K, Yokoyama T, Miyake Y, Sasaki S, Tanaka K, Ohya Y <strong>and</strong> Hirota Y."Maternal meat <strong>and</strong> fat consumption during pregnancy <strong>and</strong> suspected atopiceczema in Japanese infants aged 3-4 months: the Osaka Maternal <strong>and</strong> Child<strong>Health</strong> Study." Pediatr Allergy Immunol 2010: 21(1 Pt 1): 38-46.Salam MT, Li YF, Langholz B <strong>and</strong> Gillil<strong>and</strong> FD. "Maternal fish consumptionduring pregnancy <strong>and</strong> risk of early childhood asthma." J Asthma 2005: 42(6):513-8.Sausenthaler S, Koletzko S, Schaaf B, Lehmann I, Borte M, Herbarth O, vonBerg A, Wichmann HE <strong>and</strong> Heinrich J. "Maternal diet during pregnancy inrelation to eczema <strong>and</strong> allergic sensitization in the offspring at 2 y of age."Am J Clin Nutr 2007: 85(2): 530-7.Schoeman K, Tanaka T, Bend JR <strong>and</strong> Koren G. "Hair mercury levels of womenof reproductive age in Ontario, Canada: implications to fetal safety <strong>and</strong> fishconsumption." J Pediatr 2010: 157(1): 127-31.Fish345
Shiell AW, Campbell-Brown M, Haselden S, Robinson S, Godfrey KM <strong>and</strong>Barker DJ. "High-meat, low-carbohydrate diet in pregnancy: relation to adultblood pressure in the offspring." Hypertension 2001: 38(6): 1282-8.Sontrop J, Avison WR, Evers SE, Speechley KN <strong>and</strong> Campbell MK. "Depressivesymptoms during pregnancy in relation to fish consumption <strong>and</strong> intake of n-3polyunsaturated fatty acids." Paediatr Perinat Epidemiol 2008: 22(4): 389-99.Strain JJ, Davidson PW, Bonham MP, Duffy EM, Stokes-Riner A, Thurston SW,Wallace JM, Robson PJ, Shamlaye CF, Georger LA, Sloane-Reeves J,Cernichiari E, Canfield RL, Cox C, Huang LS, Janciuras J, Myers GJ <strong>and</strong> ClarksonTW. "Associations of maternal long-chain polyunsaturated fatty acids, methylmercury, <strong>and</strong> infant development in the Seychelles Child DevelopmentNutrition Study." Neurotoxicology 2008: 29(5): 776-82.Strom M, Mortensen EL, Halldorsson TI, Thorsdottir I <strong>and</strong> Olsen SF. "Fish <strong>and</strong>long-chain n-3 polyunsaturated fatty acid intakes during pregnancy <strong>and</strong> riskof postpartum depression: a prospective study based on a large nationalbirth cohort." Am J Clin Nutr 2009: 90(1): 149-55.Thorsdottir I, Birgisdottir BE, Halldorsdottir S <strong>and</strong> Geirsson RT. "Association offish <strong>and</strong> fish liver oil intake in pregnancy with infant size at birth amongwomen of normal weight before pregnancy in a fishing community." Am JEpidemiol 2004: 160(5): 460-5.Thurston SW, Bovet P, Myers GJ, Davidson PW, Georger LA, Shamlaye C <strong>and</strong>Clarkson TW. "Does prenatal methylmercury exposure from fishconsumption affect blood pressure in childhood?" Neurotoxicology 2007:28(5): 924-30.Venter C, Pereira B, Voigt K, Grundy J, Clayton CB, Higgins B, Arshad SH <strong>and</strong>Dean T. "Factors associated with maternal dietary intake, feeding <strong>and</strong>weaning practices, <strong>and</strong> the development of food hypersensitivity in theinfant." Pediatr Allergy Immunol 2009: 20(4): 320-7.Willers SM, Devereux G, Craig LC, McNeill G, Wijga AH, Abou El-Magd W,Turner SW, Helms PJ <strong>and</strong> Seaton A. "Maternal food consumption duringpregnancy <strong>and</strong> asthma, respiratory <strong>and</strong> atopic symptoms in 5-year-oldchildren." Thorax 2007: 62(9): 773-9.Willers SM, Wijga AH, Brunekreef B, Kerkhof M, Gerritsen J, Hoekstra MO, deJongste JC <strong>and</strong> Smit HA. "Maternal food consumption during pregnancy <strong>and</strong>the longitudinal development of childhood asthma." Am J Respir Crit CareMed 2008: 178(2): 124-31.Williams C, Birch EE, Emmett PM <strong>and</strong> Northstone K. "Stereoacuity at age 3.5y in children born full-term is associated with prenatal <strong>and</strong> postnatal dietaryfactors: a report from a population-based cohort study." Am J Clin Nutr 2001:73(2): 316-22.Xue F, Holzman C, Rahbar MH, Trosko K <strong>and</strong> Fischer L. "Maternal fishconsumption, mercury levels, <strong>and</strong> risk of preterm delivery." Environ <strong>Health</strong>Perspect 2007: 115(1): 42-7.Yin J, Dwyer T, Riley M, Cochrane J <strong>and</strong> Jones G. "The association betweenmaternal diet during pregnancy <strong>and</strong> bone mass of the children at age 16."Eur J Clin Nutr 2010: 64(2): 131-7.Ulbak J, Lauritzen L, Hansen HS <strong>and</strong> Michaelsen KF. "Diet <strong>and</strong> blood pressurein 2.5-y-old Danish children." Am J Clin Nutr 2004: 79(6): 1095-102.Dietary guidelines for pregnant <strong>and</strong> <strong>breastfeeding</strong> women: evidence report346
Included StudiesFruitFruitStudyOutcomes1. Bunin 2005 Childhood brain tumours (medulloblastoma/PNET)2. Bunin 1993 Childhood brain tumours (PNET)3. Chatzi 2008 Child persistent wheeze, atopic wheeze, atopy (all at 6.5 years)4. George 2005 “Breastfeeding”5. Giordano 2010 Child hypospadias6. Giordano 2008 Child hypospadias <strong>and</strong> cryptorchidism7. Haggarty 2009 Deprivation8. Jensen 2004 Childhood acute lymphoblastic leukemia9. Jones 2000 Bone mass at 8 years10. Klemmensen 2009 Pre-eclampsia11. Knox 1972 Anencephalus12. Kwan 2009 Childhood acute lymphoblastic leukemia13. Lamb 2008 Islet autoimmunity14. Laraia 2007 “Pre-pregnancy BMI”15. Li 2009 Maternal URTI16. Martindale 2005 Wheeze <strong>and</strong> eczema in 2 nd year of child’s life17. Mikkelsen 2006 Birthweight18. Mitchell 2004 SGA19. Miyake 2010 Infant wheeze <strong>and</strong> eczema up to 24 months20. Nwaru 2010 Allergen sensitisation by 5 years21. Petridou 2005 Acute lymphoblastic leukemia22. Petridou 1998 Cerebral palsy at 8 years23. Ramon 2009 Birthweight, SGA24. Sausenthaler 2007 Allergic sensitisation, eczema at 2 years of age25. Willers 2007 Asthma, wheeze, respiratory <strong>and</strong> atopic symptoms at 5 y26. Willers 2008 Wheeze, dyspnoea, prescription of inhaled steroids for respiratory problems, composite variable ‘asthma symptoms’ in the last12 months (measured longitudinally from 1 to 8 years age)27. Yin 2010 Bone mass at 16 years28. Zhang 2006 GDM347
Evidence SummariesMaternal Outcomes1. In a US cohort study, women who were obese prior to their pregnancy had a lowermaternal intake of fruit during pregnancy than did overweight women (p < 0.05)2. In a Scottish cohort study, lower maternal intakes of fruit (p < 0.001) <strong>and</strong> fruit juice (p
<strong>and</strong> canned peaches, pears, pineapple; oranges; <strong>and</strong> bananas were positively associatedwith cases of anencephalus10. In a case-control study from Rome in Italy, maternal intake of fruit (including fruit juice)during pregnancy was not associated with hypospadias in male offspring (aOR 0.64 95% CI0.20 to 2.07)11. In a case-control study from Sicily in Italy, maternal intake of market fruit was associatedwith hypospadias (OR 3.50 95% CI 1.03 to 11.87) but not cryptorchidism (OR 0.79 95% CI0.38 to 1.64) in male offspringBreastfeeding12. In a US study, lactating women consumed significantly more fruit (5.0 v 3.1 serves perday) during pregnancy (p < 0.016) <strong>and</strong> the postpartum period (2.2 v 1.6 serves per day (p
years of age was associated with increased apple consumption during pregnancy (> 1apple v 1 or less per week: aOR 0.47 95% CI 0.27 to 0.82 (p for trend = 0.008)17. In a Spanish cohort study, persistent wheeze <strong>and</strong> atopy or atopic wheeze) in children at6.5 years were not associated with maternal fruit intake during pregnancy18. In a cohort study from the Netherl<strong>and</strong>s, wheeze, dyspnoea, steroid use or asthmasymptoms (composite of previous three) in children longitudinally over 1 to 8 years ofage were not associated with maternal fruit intake during pregnancy (once per day ormore v 1-4 times a week or fewer): Wheeze aOR 0.89 95% CI 0.75 to 1.04 Dyspnoea aOR 0.90 95% CI 0.74 to 1.10 Steroid use aOR 0.89 95% CI 0.68 to 1.16 Asthma symptoms aOR 0.91 95% CI 0.77 to 1.0919. In a Scottish cohort study, maternal intake of more than one portion of fruit a day waspositively associated with eczema in children at two years of age (aOR 1.67 95% 1.16 to2.40) but there were no significant associations for fruit juice <strong>and</strong> eczema; <strong>and</strong> for fruitjuice <strong>and</strong> wheeze in children at two years of ageOther Childhood Outcomes20. In a case-control study from USA, maternal consumption of fruit during pregnancy was notassociated with childhood acute lymphoblastic leukemia; aOR 0.71 95% CI 0.49 to 1.0421. In a case-control study for USA, maternal fruit consumption during pregnancy wasassociated with fewer cases of childhood acute lymphoblastic leukemia: Fruit (excluding fruit juice); aOR 0.81 95% CI 0.65 to 1.00 (more than half to one serve a day) Oranges; aOR 0.87 95% CI 0.77 to 0.99; Cantaloupes; aOR 0.87 95% CI 0.76 to 0.9822. In a Greek case-control study, maternal fruit consumption during pregnancy (over 51 g perday) was associated with fewer cases of childhood acute lymphoblastic leukemia; aOR0.72 95% CI 0.57 to 0.91 for an extra quintile of fruit under logistic regression analysis23. In a North American case control study, no significant associations between maternalconsumption of specific fruits <strong>and</strong> cases of primitive neuroectodermal brain tumours(PNET) in their children, except for a protective effect with oranges <strong>and</strong> grapefruit (OR0.49 95% CI 0.29 to 0.82) <strong>and</strong> canned, dried, or fozen peaches or apricots (OR 0.39 95% CI482children2830childrenII Chatzi 2008II Willers 20081300 II Martindale 2005138cases;138controls282cases;641controls131cases;131controls166cases;166controlsIII-3 Jensen 2004III-3 Kwan 2009III-3 Petridou 2005III-3 Bunin 1993Dietary guidelines for pregnant <strong>and</strong> <strong>breastfeeding</strong> women: evidence report350
0.22 to 0.70)24. In a North American case-control study, no significant associations between maternalconsumption of fruits <strong>and</strong> cases of medulloblastoma/primitive neuroectodermal braintumours (PNET) in their children were seen (p trend 0.26 for preconception consumption<strong>and</strong> p trend 0.39 for midpregnancy consumption (< 0.6 verssu > 2 serves a day)25. In a US cohort study, no significant association was seen between maternal consumptionof fruit during pregnancy (mean three daily serves) <strong>and</strong> islet immunity in children up to15 years of age: aHR 0.86 95% CI 0.52 to 1.42 for each SD change in consumption)26. In one Australian cohort study:Bone mineral density of children at 8 years was not associated with maternal fruit intake duringpregnancy: Total body bone mineral density: p = 0.17 for adjusted regression of portions per week27. In one Greek case-control study, cerebral palsy in children at 8 years was not associatedwith maternal fruit intake during pregnancy: Regression analysis for each unit of consumption of vegetables once per day:aOR 1.11 95% CI 0.98 to 1.27 (additionally adjusted for all food groups)28. In an Australian cohort study (follow-up of Jones 2000) bone mass in 16 year-oldadolescents was not associated with maternal vegetable intake during pregnancy: Total body bone mineral density r 2 0.333; ß +12.0 (pns) for adjusted regression of portions perweek315cases;315controls642children173children109children216childrenIII-3 Bunin 2005II Lamb 2008II Jones 2000III-3 Petridou 1998aII Yin 2010Fruit351
Evidence TablesReference Bunin 2005Food typeFruit: fruit overall; fruit <strong>and</strong> fruit juice; citrus fruit <strong>and</strong> juice; fruit juice not citrus; apricots or peaches (canned, frozen or dried)Study typeCase-control studyLevel of evidence III-3 (aetiology)SettingUnited States <strong>and</strong> CanadaFundingNational Cancer Institute, USAParticipants315 cases diagnosed with medulloblastoma/PNET tumours from 0 to 5 years, between 1991 to 1997 (without a previous or recurrent cancer)315 controls (r<strong>and</strong>om digit dialling, matched on area code, race <strong>and</strong> data of birth)Baseline comparisons See confounding belowDietary assessment FFQTimingTo reflect diet in the year before pregnancy; <strong>and</strong> the second trimester of pregnancyComparison Fruit overall: < 0.6 serves/day to > 2/day; fruit <strong>and</strong> fruit juice: ≤ 1/day to > 3/day; citrus fruit <strong>and</strong> juice: ≤ 1/day to > 7/week; fruit juice (not citrus): 1-≤3.5/wk 121 1.0 (0.6 to 1.8) 111 1.1 (0.6 to 2.0)> 3.5-≤7wk 212 1.2 (0.7 to 1.9) 196 1.3 (0.8 to 2.0)> 7/wk 152 0.9 (0.5 to 1.5) 182 0.8 (0.5 to 1.4)P trend 0.79 0.44Fruit juice, not citrus
2-4/wk 133 0.8 (0.5 to 1.2) 124 0.7 (0.4 to 1.2)≥5/wk 97 0.5 (0.3 to 0.9) 136 0.6 (0.3 to 0.9)P trend 0.02 0.03Apricots or peaches, canned, frozen or dried< 1/mo 415 1.0 416 1.01-3/mo 171 0.9 (0.6 tp 1.4) 168 0.9 (0.6 to 1.4)≥ 1/wk 43 0.4 (0.2 to 0.9) 45 0.4 (0.2 to 0.9)P trend 0.02 0.03FollowupConfoundingRisk of biasRelevanceOther commentsn/a*adjusted for income level, mother’s race, age of child at interview, date of interview, gained weight because of nausea/vomiting, number cigarettes perday, total calories**adjusted for mother’s race, age of child at interview, income, number of cigarettes per day, maternal weight gain (yes/no) because of pregnancynausea/vomitingLow-moderate risk of bias: 315/558 (57%) potentially eligible cases able to be included (missing cases mostly due to lack of consent from physician orparents); control resonse rates were 67% for r<strong>and</strong>om digit dialling <strong>and</strong> 73% for questionnaireLikely to be reasonably similarMedulloblastomas <strong>and</strong> PNETs account for about 20% of brain tumours in children;Supplement use was also assessed in this studyFruit353
Reference Bunin 1993Food typeFruit: fruits <strong>and</strong> fruit juice; bananas; oranges <strong>and</strong> grapefruit; fresh peaches, apricots, nectarines; canned, dried or frozen peaches, apricots; cantaloupe;watermelon; mango, papaya; fruit juiceStudy typeCase control study (Children’s Cancer Group)Level of evidence III-3 (aetiology)SettingNorth AmericaFundingNIH, Japan National Committee of the International Union against Cancer, Olympus Optical Company, International Agency for Research on Cancer,WHO.Participants 166 cases (children diagnosed with primitive neuroectodermal brain tumours (PNET) before the age of six years from 1986 to 1989);166 matched controlsBaseline comparisons See confounding belowDietary assessment FFQTimingDuring pregnancyComparisonConsumption at least once per week versus less than once a week; <strong>and</strong> quartiles of consumptionOutcomesPNETResultsBananas: OR 0.90 95% CI 0.55 to 1.48Oranges <strong>and</strong> grapefruit: OR 0.49 95% CI 0.29 to 0.82Fresh peaches, apricots, nectarines: OR 0.56 95% CI 0.26 to 1.18Canned, dried, or frozen peaches, apricots: OR 0.39 95% CI 0.22 to 0.70Cantaloupe: OR 1.00 95% CI 0.41 to 2.43Watermelon: OR 0.89 95% CI 0.56 to 1.42Mango, papaya: OR 2.25 95% CI 0.63 to 10.0Fruit juice: OR 0.56 95% CI 0.26 to 1.18FollowupConfoundingRisk of biasRelevanceOther commentsn/aAnalyses for individual food groups were not adjusted for potential confoundersModerate risk of bias: 116 cases (41%) included from 281 potentially eligible childrenLikely to be reasonably similar to diets of Australian womenNearly all case <strong>and</strong> control mothers took multivitamins during their pregnancies;Diet <strong>and</strong> supplemental vitamin use in child’s first year of life was also recordedDietary guidelines for pregnant <strong>and</strong> <strong>breastfeeding</strong> women: evidence report354
Reference Chatzi 2008Food typeFruitStudy typeProspective cohort studyLevel of evidence II (aetiology)Setting Women presenting antenatal care at general practices in Menorca, a Mediterranean isl<strong>and</strong> in Spain (mid 1997 to mid 1998)FundingInstituto de Salud Carlos III red de Grupos Infancia y Media Ambiente, the Fundacio “La Caixa” , Instituto de Salud Carlos III, red de Centros deInvestigacion en Epidemiologica y Salud Publica, EU, National Center for Environmental <strong>Health</strong>, USA, the GA2LEN project, Ministry of Education <strong>and</strong>Science, Spain, Oficina de Ciencia y Tecnologia, Generalitata Valenciana.Participants482 children of 507 women who had attended antenatal care in MenorcaBaselineSee confounding belowcomparisonsDietary assessment FFQTimingnot clear when women did FFQ <strong>and</strong> period of pregnancy it was intended to coverComparison≤ 14 v > 14 serves per weekOutcomesPersistent wheeze, atopic wheeze <strong>and</strong> atopy at 6.5 yearsResultsPersistent wheeze at 6.5 yearsLow 22 (13.58%) v high 19 (12.50%); pns (also adjusted for firstborn <strong>and</strong> lower respiratory tract infections at age 1)Atopic wheeze at 6.5 yearsLow 13 (6.13%) v high 7 (5.43%); pns (also adjusted for birthweight <strong>and</strong> maternal atopy)Atopy at 6.5 yearsLow 45 (17.65%) v high 25 (16.23%) pns (also adjusted for birthweight <strong>and</strong> maternal atopy)Followup6.5 yearsConfounding Analyses adjusted for gender, maternal <strong>and</strong> paternal asthma, maternal social class <strong>and</strong> education, BMI at age 6.5 years <strong>and</strong> total energy intake at 6.5yearsRisk of biasResults from 468/482 children (97%) able to be analysed (4 incomplete data <strong>and</strong> 8 implausible values);RelevanceDiets in Menorca may differ from diets of Australian women, particularly urban womenOther commentsFruit355
Reference George 2005Food typeFruit (orange <strong>and</strong> apple juice, bananas)Study typeProspective cohort studyLevel of evidence II (aetiology)SettingTexas, USFundingNot reportedParticipants149 Medicaid-qualified women (30% white, 24% African American, 46% Hispanic) – recruited from a larger study on postpartum weight retentionInclusion criteria: 18 years or older; non-Hispanic white, African American or Hispanic ethnicity; birth of a health term infant, fluency <strong>and</strong> literacy inEnglish; absence of pregnancy-related abnormalities <strong>and</strong> disease conditions.Baseline comparisons Significant differences between lactating <strong>and</strong> non-lactating women – higher parity, BMI <strong>and</strong> lower education levels in non-lactating women.Dietary assessment Semiquantitative FFQ to cover pregnancy <strong>and</strong> first six months postpartumTimingFFQ administered at 6 weeks <strong>and</strong> 6 months postpartumComparisonNumber of serves of fruitsOutcomesBreastfeeding (exclusive or partial at 6 months postpartum)ResultsLactating women consumed significantly more fruit (5.0 v 3.1 serves per day) during pregnancy (p < 0.016) <strong>and</strong> the postpartum period (2.2 v1.6 serves per day (p < 0.05) than non-lactating womenThere was a significant decrease overall in fruit consumption from pregnancy to the postpartum periodFollowupConfoundingRisk of biasRelevanceOther comments6 months postpartumNo adjustment for potential confoundingModerate-to-high risk of bias; no attempt to control for confounding despite significant baseline differences between lactating <strong>and</strong> non-lactating women.Possibly relevant to low-income women in AustraliaMinimal reporting of resultsDietary guidelines for pregnant <strong>and</strong> <strong>breastfeeding</strong> women: evidence report356
Reference Giordano 2010Food typeFruit (including fruit juice)Study typeCase-control studyLevel of evidence III-3 (aetiology)SettingRome, ItalyFundingNot reportedParticipants80 cases of hypospadias requiring surgical treatment in children aged 0 to 24 months (mean age 57.62 weeks)80 controls: healthy males without any congenital defect, aged 0 to 24 months (mean age 36.52 weeks);recruited between September 2005 <strong>and</strong> May 2007Baseline comparisons See confounding belowDietary assessment Interview on ‘typical’ maternal diet habits in relation to the index pregnancy <strong>and</strong> food frequenciesTimingFFQ administered on recruitment for mothers of cases <strong>and</strong> during vaccination visits for mothers of controlsComparisonRare versus frequent consumption of fruitOutcomesHypospadiasResultsFruit (including fruit juice)Cases Controls OR aORRare 74 (92.5%) 72 (90.0%) 1.00 1.00Frequent 6 (7.5%) 8 (10.0%) 0.73 95% CI 0.24 to 2.21 0.64 95% CI 0.20 to 2.07FollowupConfoundingRisk of biasRelevanceOther commentsn/aAdjusted for mother’s BMI at conception <strong>and</strong> education of the father;Gestational age, birthweight <strong>and</strong> SGA were not included among the covariates in the regression models, as they may share a common aetiology withhypospadiasModerate risk of bias: Participation rate of parents of cases was higher than that of controls (85% versus 70%); very few potential confounders used inadjusted analysesLikely to be reasonably relevant for Australian womenLikely to be underpoweredFruit357
Reference Giordano 2008Food typeFruit: mostly market fruitStudy typeCase-control studyLevel of evidence III-3 (aetiology)SettingSicily, ItalyFundingSicilian Congenital Malformation RegistryParticipants90 cases: 43 cases of hypospadias <strong>and</strong> 48 cases of cryptorchidism (both in one infant)202 controls: r<strong>and</strong>omly selected controls born in the same year <strong>and</strong> the same regionBirths between 1998 to 2003Baseline comparisons Low birthweight, low maternal education, mother’s history of gynaecological disease <strong>and</strong> father’s history of urogenital diseases differed significantlybetween cases <strong>and</strong> controlsSee confounding belowDietary assessment Interview on maternal diet <strong>and</strong> food frequenciesTimingFFQComparisonConsumption of market fruit versus no consumption of market fruitOutcomesHypospadias <strong>and</strong> cryptorchidismResultsMarket fruitCases Controls ORHypospadiasNo 3 (7.0%) 42 (20.8%) 1.00Yes 40 (93.0%) 160 (79.2%) 3.50 95% CI 1.03 to 11.87CryptorchidismNo 12 (25.0%) 42 (20.8%) 1.00Yes 36 (75.0%) 160 (79.2%) 0.79 95% CI 0.38 to 1.64Hypospadias <strong>and</strong> cryptorchidismNo 15 (16.7%) 42 (20.8%) 1.00Yes 75 (83.3%) 160 (79.2%) 1.31 95% CI 0.69 to 2.51FollowupConfoundingRisk of biasRelevanceOther commentsn/aResults for this food group were not presented as adjusted analyses*Adjusted for mother’s age, parity, education, gynaecological diseases; paternal urogenital diseases, <strong>and</strong> use of pesticides; birthweightModerate risk of bias: Participation rate of parents <strong>and</strong> data collection rate of cases was lower than that of controls (76% versus 91%); no adjustedresults presented for this food groupLikely to be reasonably relevant for Australian women, although hypospadias rates very high <strong>and</strong> unlikely that most Australian women will have suchhigh pesticide exposureRagusa region in Sicily is a region of intensive agriculture (involving high rates of pesticide <strong>and</strong> other chemical use) with high rates of hypospadias <strong>and</strong>cryptorchidismDietary guidelines for pregnant <strong>and</strong> <strong>breastfeeding</strong> women: evidence report358
Reference Haggarty 2009Dietary patterns Fruit: fruit <strong>and</strong> fruit juiceStudy typeProspective cohort studyLevel of evidence II (aetiology)SettingAberdeen, Scotl<strong>and</strong>FundingUK Food St<strong>and</strong>ards AgencyParticipants1277 sequentially enrolled pregnant women attending Aberdeen Maternity Hospital for ultrasound (a further 184 women were recruited later inpregnancy).Exclusions: diabetic women, women with multiple pregnancies, women who conceived as a result of fertility treatment, or clinical data not availableBaseline comparisons See confounding belowAssessmentFFQTimingAssessed at 19 weeks gestationComparisonIntake of fruit <strong>and</strong> fruit juice by deciles of deprivationOutcomesDeprivation (assessed using the Scottish Index of Multiple Deprivation)Low birthweight (defined as < 2500 g or lowest decile for birthweight z score adjusted for gestational age, sex <strong>and</strong> parity)Preterm birth (< 37 weeks)Admission to neonatal unitResultsDeprivationFruit: significantly lower intake with higher levels of deprivation (p < 0.001)Fruit juice: significantly lower intake with higher levels of deprivation (p < 0.05)FollowupConfoundingRisk of biasRelevanceOther commentsTo neonatal period(Some?) analyses adjusted for energy intakeLow to moderate risk of bias: low attrition, some lack of detail in reporting of outcomesLikely to be relevant to Australian womenAbout 40-50% of the least deprived women reported taking folic acid supplements compared with about 20% for the most deprived women;Most birth outcome associations were reported by nutrient rather than food group;Not easy to deduce quantities of intake of foods (main graphs reported as change in intake by deprivation decile)Fruit359
Reference Jensen 2004Food typeFruit: peaches, apricots, oranges or grapefruit, mangoes or papayas, cantaloupe, bananas, apples/apple sauceStudy typeCase controlLevel of evidence III-3 (aetiology)SettingCalifornia, USA (part of the Northern California Childhood Leukemia Study)FundingPHSParticipants138 matched cases <strong>and</strong> controls:Cases: Children under 15 years of age, with a parent who spoke English or Spanish, were resident in the study area at the time of diagnosis of acutelymphoblastic leukemia (ALL), with no prior diagnosis of cancerControls: identified from birth certificates matched to the case on date of birth, sex, maternal race, Hispanic ethnicity of mother or father, <strong>and</strong> county ofresidence at birthBaseline comparisons A priori potential confounders were identified as birthweight, <strong>breastfeeding</strong>, maternal age <strong>and</strong> education, parental occupation <strong>and</strong> smoking duringpregnancy – no evidence of confounding was seen for these variables. Also see Confounding below.Dietary assessment FFQTimingDietary intake to reflect the year before the index pregnancy (to indicate dietary status at the start of pregnancy)ComparisonServes of fruitOutcomesChildhood acute lymphoblastic leukemiaResultsOVERALLaOR 0.71 95% CI 0.49 to 1.04; mean consumption of fruit 0.78 [SD 0.58] serves per dayINDIVIDUAL FRUITSaOR 1.03 95% CI 0.86 to 1.23; mean consumption of peaches, apricots (canned, dried) 2.11 [SD 1.58] serves per day*aOR 0.98 95% CI 0.86 to 1.12; mean consumption of peaches, apricots, fresh 3.68 [SD 2.19] serves per day*aOR 0.91 95% CI 0.79 to 1.04; mean consumption of oranges or grapefruit 4.30 [SD 2.16] serves per day*aOR 0.90 95% CI 0.77 to 1.06; mean consumption of mangoes or papaya 2.20 [SD 2.03] serves per day*aOR 0.87 95% CI 0.75 to 1.02; mean consumption of cantaloupe 3.30 [SD 1.89] serves per day*aOR 0.99 95% CI 0.85 to 1.16; mean consumption of bananas 4.57 [SD 1.81] serves per day*aOR 0.99 95% CI 0.87 to 1.12; mean consumption of fruit 4.13 [SD 2.01] serves per day*FollowupConfoundingRisk of biasRelevanceOther commentsn/aAnalyses were adjusted for variables previously shown to be significantly associated with ALL in the overall study – income, prior fetal loss, child’sexposure to other children under age five, <strong>and</strong> maternal exposure to indoor insecticides during pregnancy; along with portion size <strong>and</strong> energyconsumptionLow-moderate risk of bias: Of eligible cases identified from January 1995 to November 1999, 83% consented to participate; 69% of the eligible controlsagreed to participate. Of the 161 matched pairs, seven pairs were excluded as the respondent was not the biological mother, 16 pairs were excludeddue to questionable dietary questionnaire data, leaving 138 matched pairs (86%); some recall bias likelyLikely to be relevant for Australian women, though some diet components may differ e.g. high bean consumption*Some consumption levels seem high – possibly per week rather than per day?Dietary guidelines for pregnant <strong>and</strong> <strong>breastfeeding</strong> women: evidence report360
Reference Jones 2000 (see also Yin 2010)Food typeFruitStudy typeProspective cohortLevel of evidence II (aetiology)SettingSouthern Tasmania, AustraliaFundingNHMRC, Tasmanian Government, Royal Hobart Hospital Acute Care ProgramParticipants173 mothers; <strong>and</strong> their infants born in 1988 (part of a larger infant health study of babies at high risk of SIDS)Exclusions: multiple pregnanciesBaseline comparisons Mothers with no tertiary education more likely to have been excluded due to missing dataDietary assessment FFQTimingDietary intake during third trimester of pregnancyComparisonLinear regression of density (portions per kJ)OutcomesBone mass (bone mineral density (BMD) <strong>and</strong> bone mineral content*) in 8 year old childrenResultsBMD at 8 years;Total body (g/cm 2 )r 2 3% 0.007 (p = 0.03)adjusted r 2 24% 0.004 (p = 0.17)Femoral neck (g/cm 2 )r 2 2% 0.009 (p = 0.09)adjusted r 2 32% 0.005 (p = 0.23)Lumbar spine (g/cm 2 )r 2 2% 0.008 (p = 0.16)adjusted r 2 33% 0.003 (p = 0.47)Followup8 yearsConfounding Analyses were adjusted for method of dietary assessment, maternal education, parental unemployment, sex, weight at age 8 years, height at age 8years, weekend sunlight exposure in winter at age 8 years, smoking during pregnancy, sports participation, ever breast-fed <strong>and</strong> current calcium intake.Risk of biasModerate-high: 330 (215 males, 115 females) representing a 60% response rate from those available in 1996; 47% of the original 1988 cohort, Thisdropped to 173 (dietary information missing or unreliable for 115 mothers, 32 multiple births, 10 participants had missing data for confounders)representing 52% of participants from 1996 <strong>and</strong> 25% of those in the original cohort.72% of the 173 participants were male. Gender imbalance suggests potential selection bias (due to original selection of infants at high risk of SIDS)RelevanceInfants at high risk of SIDS represent a selected group (more males, preterm births, teenage mothers, smoking during pregnancy)Other comments *Bone mineral content not reported – stated to be similar to bone mineral density resultsFruit361
Reference Klemmensen 2009Food typeFruitStudy typeProspective cohort studyLevel of evidence II (aetiology)SettingWomen participating in the Danish National Birth Cohort, e.g. became pregnant during January 1997-October 2002 <strong>and</strong> recruited through generalpractitioners at approximately 6-10 weeks gestation.FundingDanish Foundation for Hospital Research, the Copenhagen Medical Society, University of Copenhagen, March of Dimes Birth Defects Foundation,Danish National Research Foundation, Danish Medical Research Council, Danish <strong>Health</strong> Foundation, Danish Heart Foundation, Pharmacy Foundation,Egmont Foundation, Augustinus Foundation.Participants57346 singleton pregnancies where the mother participated in the first telephone interview <strong>and</strong> filled in the FFQ.Dietary assessment FFQ compared mid-pregnancy, asking about food consumption <strong>and</strong> dietary supplements in the previous month; validated in Danish women.Baseline comparisons See confounding below.TimingFFQ mailed to women at 25 weeks gestation, asking about intake in the previous 4 weeks.ComparisonQuintiles of intake of fruit <strong>and</strong> fruit (minus citrus) <strong>and</strong> the risk of pre-eclampsia <strong>and</strong> severe PE.OutcomesPreeclampsia (all types) <strong>and</strong> severe pre-eclampsia/eclampsia/HELLPResultsRisk of PE <strong>and</strong> severe PE according to fruit intake**PESevere PEFruit intake Adjusted OR (95% CI) Adjusted OR (95% CI)Q1 1.19 (0.99-1.42) 1.28 (0.86-1.90)Q2 0.95 (0.79-1.14) 0.96 (0.64-1.44)Q3 1.07 (0.89-1.28) 1.12 (0.75-1.65)Q4 1.15 (0.97-1.36) 1.41 (1.00-2.00)Q5 (ref) 1.0 1.0Fruit intake (minus citrus) Adjusted OR (95% CI) Adjusted OR (95% CI)Q1 1.07 (0.90-1.27) 1.02 (0.71-1.46)Q2 1.06 (0.89-1.26) 1.06 (0.75-1.50)Q3 0.93 (0.78-1.10) 0.82 (0.56-1.18)Q4 1.11 (0.94-1.31) 1.09 (0.79-1.52)Q5 (ref) 1.0 1.0**adjusted for confounders listed below <strong>and</strong> vitamin C <strong>and</strong> E intakeFollowupConfoundingRisk of biasRelevanceCommentsIn this analysis until the end of the pregnancy.Analyses adjusted for total energy intake using the residual method.Adjustments also made for: maternal age, pre-pregnancy BMI, smoking, height, parity, socio-economic position, ownership of residence, marital status,physical activity <strong>and</strong> for fruit analyses – dietary intake of vitamin C <strong>and</strong> E.Low risk of bias: Large population based cohort. Prospective ascertainment of outcomes.Only 2.6% <strong>and</strong> 9.6% of women had an intake of vitamin C <strong>and</strong> E below the recommended Danish levels, likely to be similar to Australian women.Dietary guidelines for pregnant <strong>and</strong> <strong>breastfeeding</strong> women: evidence report362
Reference Knox 1972Food typeFruit: apples, canned peaches, pears, pineapple, oranges, bananasStudy typeCase control (cases matched to food consumption at population level for a particular period) – numbers not reportedLevel of evidence III-3 (aetiology)SettingBirmingham, UKFundingNot reportedCases Stillbirths <strong>and</strong> infant deaths due to anencephalus between 1961 <strong>and</strong> 1967Baseline comparisons n/aDietary assessment Population surveysTimingEach quarterComparisonMonthly stillbirths <strong>and</strong> infant deaths due to anencephalus matched to quarterly consumption of main food stuffs (in previous five to nine months)OutcomesAnencephalusResultsApples negatively associated with cases of anencephalus: r = -0.53 after a lag interval of eight monthsCanned peaches, pears, pineapple positively associated with cases of anencephalus: r = +0.60 after a lag interval of five monthsOranges positively associated with cases of anencephalus: r = +0.56 after a lag interval of nine monthsBananas positively associated with cases of anencephalus: r = +0.54 after a lag interval of five monthsFollowupConfoundingRisk of biasRelevanceOther commentsn/aAnalyses were not adjustedHigh risk of bias: links between population consumption of foods <strong>and</strong> anencephalus very distal <strong>and</strong> no control for potential confoundersLikely to differ from a modern Australian dietFood consumption of total population not likely to reflect food consumption of pregnant women; <strong>and</strong> will not be able to reflect differences between dietsof individual or specific groupsFruit363
Reference Kwan 2009Food typeFruit: bananas, apples, apple sauce, peaches, apricots (canned or dried), peaches, apricots (fresh), cantaloupe, mangoes or papayas, oranges orgrapefruit (not including juice)Study typeCase controlLevel of evidence III-3 (aetiology)Setting California, USA (part of the Northern California Childhood Leukemia Study – phase 1 <strong>and</strong> 2 (phase 1 reported in Jensen 2004)FundingPHS; Paul O’Gorman Foundation for Children with LeukemiaParticipants866 individuals - 282 matched cases <strong>and</strong> controls (205 pairs <strong>and</strong> 77 trios):Cases: Children under 15 years of age, with a parent who spoke English or Spanish, were resident in the study area at the time of diagnosis of acutelymphoblastic leukemia (ALL), with no prior diagnosis of cancerControls: identified from birth certificates matched to the case on date of birth, sex, maternal race, Hispanic ethnicity of mother or father, <strong>and</strong> county ofresidence at birth (in phase 1 (1995-99) only due to concerns about overmatching on potential environmental exposures linked to leukemia risk)Data collected from August 1995 to November 2002Baseline comparisons A priori potential confounders were identified as birthweight, <strong>breastfeeding</strong>, maternal age <strong>and</strong> education, <strong>and</strong> smoking during pregnancy.Also see Confounding below.Dietary assessment FFQTimingDietary intake to reflect the year before the index pregnancy (to indicate dietary status at the start of pregnancy)ComparisonServes of fruitOutcomesChildhood acute lymphoblastic leukemiaResultsFruit (excludes fruit juice): aOR 0.81 95% CI 0.65 to 1.00 (median daily intake 0.6 (25 th , 75 th percentile 0.3 to 1.0)Oranges:Cantaloupe:aOR 0.87 95% CI 0.77 to 0.99 (median daily serves not reported)aOR 0.87 95% CI 0.76 to 0.98 (median daily serves not reported)FollowupConfoundingRisk of biasRelevanceOther commentsn/aAnalyses were adjusted for total energy intake, household income, indoor insecticide exposure during pregnancy; <strong>and</strong> proportion of foods reported aslarge or extra-large portion sizeAlso adjusted for child’s diet, with little effect seen on resultsLow-moderate risk of bias: Of eligible cases identified from January 1995 to November 2002, 86% consented to participate; 56% of the eligible controlsagreed to participate. 190 participants excluded: leukemia diagnosis was not ALL (n = 127); no dietary data (n = 4); a case or a control respondent wasnot the biological mother (n = 14), questionable dietary questionnaire data (n = 45), leaving 282 matched sets (86%).Likely to be relevant for Australian women, though some diet components may differ e.g. high bean consumptionRegular use of any dietary supplement was not associated with risk of ALL.Dietary guidelines for pregnant <strong>and</strong> <strong>breastfeeding</strong> women: evidence report364
Reference Lamb 2008Dietary patterns Fruits: raisins, prunes, bananas, cantaloupes, watermelon, apples, apple juice, oranges, orange juice, grapefruit, grapefruit juice, other fruit juices,strawberries, blueberries, peaches, jams <strong>and</strong> jellies, tomatoes, tomato juice <strong>and</strong> tomato sauceStudy typePart of a longitudinal prospective birth cohort studyLevel of evidence II (aetiology)SettingDenver, Colorado, US (part of the Diabetes Autoimmunity Study in the Young (the DAISY))FundingNational Institutes of <strong>Health</strong>, Diabetes Endocrine Research CenterParticipants642 newborns at increased risk for type 1 diabetes (based on HLA genotype <strong>and</strong> family history), enrolled in the study from 1993 to 2004; 27 casesdefined as testing positive for islet autoantibodies at two consecutive blood draws <strong>and</strong> still positive (diabetic) at last follow-upBaseline comparisons See confounding belowDietary assessment FFQTimingFrom 1997 to 2004, mothers of infants enrolled in DAISY completed FFQ soon after birth, reflecting diet in the last trimester of pregnancy (but couldsubmit FFQ before child reached one year of age)ComparisonMonthly servings of fruitsOutcomes Islet autoimmunity in children (a precursor of type 1 diabetes) at 9 months, 15 months, 2 years <strong>and</strong> annually thereafter up to the age of 15ResultsFruits:aHR (for one st<strong>and</strong>ard deviation change in reported consumption) 0.86 95% CI 0.52 to 1.42 (91.82 mean monthly servings)FollowupUp to 15 yearsConfoundingSize for gestational age, ethnicity, maternal education, household income, exposure to type 1 diabetes or GDM in utero, gender of child, maternal ageat birth, total calories of maternal dietRisk of biasModerate risk of bias: subset of DAISY only (later enrolments); <strong>and</strong> women were not reminded to submit FFQ, leading to possible selection bias; of the661 FFQs returned, 5 were excluded because incomplete, <strong>and</strong> 14 for implausible dietary intakes, leaving 642 FFQs for analysis; child’s diet notcontrolled forRelevanceLikely to be relevant to some Australian women, although women in this study may have been at higher risk of diabetesOther commentsFruit365
Reference Laraia 2007Dietary patterns % of fruit serving recommendationStudy typeProspective cohort studyLevel of evidence II (aetiology)SettingNorth Carolina, US (part of the Pregnancy, Infection <strong>and</strong> Nutrition (PIN) cohort)FundingNational Institute of Child <strong>Health</strong> <strong>and</strong> Human Development; NIHParticipants 2394 predominantly lower to middle income women, recruited between 24 <strong>and</strong> 29 weeks gestation (1995-2000)Baseline comparisons Mean DQI-P score varied significantly by socio-demographic characteristics; there were higher mean DQI-scores for women who engaged in prepregnancyvigorous exercise <strong>and</strong> pre-pregnancy vitamin useDietary assessment Modified block FFQTimingSelf-report at 26-28 weeks gestation covering previous 3 months (corresponding to the 2 nd trimester)ComparisonBMI categoriesOutcomesPregravid weight status (not an outcome but there is an association)ResultsAverage % of fruit serving recommendation [SD]Underweight 118.9 [10.2.3]Normal weight 107.9 [104.7]Overweight 111.9 [106.3]Obese 103.8 [95.9]P value for trend
Reference Li 2009Dietary patterns FruitStudy typeRetrospective cohort studyLevel of evidence III-2 (aetiology)SettingNorth AmericaFundingNational Institute of Dental <strong>and</strong> Craniofacial ResearchParticipants1034 mothers who had participated in a case-control study of children with congenital craniofacial malformationsBaseline comparisons See confounding belowDietary assessment FFQTimingFruit <strong>and</strong> vegetable intake in the six months before pregnancyComparisonQuartiles of fruit consumption (never to four or more times a day)Serves per day, median (range)1 st quartile 1.68 (0 to 1.30)2 nd quartile 1.80 (1.31 to 2.32)3 rd quartile 3.02 (2.33 to 3.86)4 th quartile 5.09 (3.87 to 22.51)OutcomesUpper respiratory infection in women during the first half of pregnancy (not including asthma or allergy) [44 URTI episodes without a known start datewere excluded from hazards analysis]ResultsURTI (five month risk)HR (95% CI) aHR (95% CI) p-value for trendQ1 1.00 1.00Q2 1.02 (0.77 to 1.36) 1.03 (0.77 to 1.38)Q3 0.82 (0.61 to 1.11) 0.83 (0.61 to 1.13)Q4 0.80 (0.60 to 1.09) 0.85 (0.60 to 1.20) 0.18URTI (three month risk)HR (95% CI) aHR (95% CI) p-value for trendQ1 1.00 1.00Q2 0.93 (0.64 to 1.37) 0.97 (0.66 to 1.44)Q3 0.71 (0.47 to 1.07) 0.76 (0.49 to 1.17)Q4 0.77 (0.52 to 1.15) 0.84 (0.53 to 1.33) 0.27FollowupConfoundingRisk of biasRelevanceOther comments5 months since last menstrual periodAdjusted for age, race, energy intake, vegetable intakeLow-moderate risk of bias: 1034/1163 (88.9%) women included in analysis – 88 with an incomplete FFQ, 41 with implausible energy intakes); womenwere interviewed at an average of 8 months after birth, but up to 36 months, so some risk of recall bias; some evidence of increased fruit <strong>and</strong> vegetableconsumption once pregnancy was known (misclassification bias)Likely to be relevant to Australian womenURTI during pregnancy may be associated with preterm birth <strong>and</strong> congenital abnormalitiesFruit367
Reference Martindale 2005Dietary patterns FruitStudy typeProspective cohort studyLevel of evidence II (aetiology)SettingAberdeen, Scotl<strong>and</strong>FundingAsthma UKParticipants1300 singleton children born to women recruited between October 1997 <strong>and</strong> April 1999 (at a median gestational age of 12 weeks)BaselinecomparisonsStudy population were slightly older, more likely to be primiparous, less likely to be current smokers, <strong>and</strong> more likely to be from nonmanual socialclasses than the corresponding general populationDietary assessment FFQ at 34 weeks gestation (also enquired about use of vitamin <strong>and</strong> mineral supplements during the previous 3 monthsTimingTiming of FFQ at 34 weeks was chosen to “avoid the dietary disruption of early pregnancy <strong>and</strong> to provide an indication of the habitual dietary intake inmiddle <strong>and</strong> late pregnancy”ComparisonNot clearly statedOutcomesSymptoms of wheeze, doctor-diagnosed eczemaResultsEczema in 2 nd year of life:Fruit: more than one portion a day was positively associated with eczema in the 2 nd year of life:OR 1.72 95% CI 1.22 to 2.43aOR 1.67 95% CI 1.16 to 2.40Fruit juice: no significant associationWheeze in 2 nd year of life:Fruit juices: no significant associationFollowup6, 12 <strong>and</strong> 24 monthsConfoundingAnalyses adjusted for gender, maternal age, paternal social class, maternal smoking, other children in the home <strong>and</strong> antibiotic useRisk of bias Low-moderate risk of bias: 1924 singletons were born to the 2000 women recruited (34 twins, 42 miscarriage, stillbirth or neonatal death), 1751 (87.6%)of women completed the FFQ, with complete data sets from all three questionnaires available at 24 months for 1300 children (67.6%)RelevanceReasonably relevant, probably lower fruit <strong>and</strong> vegetable intake than in AustraliaOther comments Most results reported as intake of vitamin C <strong>and</strong> E, not by number of serves of fruit <strong>and</strong> vegetablesDietary guidelines for pregnant <strong>and</strong> <strong>breastfeeding</strong> women: evidence report368
Reference Mikkelsen 2006Food typeFruit <strong>and</strong> vegetablesStudy typeProspective cohort studyLevel of evidence II (aetiology)SettingWomen participating in the Danish National Birth Cohort, e.g. became pregnant during January 1997-October 2002 <strong>and</strong> recruited through generalpractitioners.FundingDanish National Research Foundation, March of Dimes Birth Defects Foundation, European Union, Novonordic Foundation, ISMF, the <strong>Health</strong>Foundation, Danish National Medical Research Foundation, Danish Heart Association.Participants43,585 pregnant women with singleton pregnancies for whom complete dietary info <strong>and</strong> birth records were available.Dietary assessment FFQ compared mid-pregnancy, validated in Danish men <strong>and</strong> women. Timeframe for food consumption unclear (i.e. consumption in last week, monthetc).Baseline comparisons See Confounding below.TimingFFQ completed at 25 weeks gestational age.ComparisonBirth weights in quintiles of intake of fruitSubgroup analyses performed on a group of thin women (BMI
Reference Mitchell 2004Dietary patterns Fruit (including bananas, apples, pears, citrus fruits, stone fruits, berries, melon <strong>and</strong> avocados)Study typeCase-control studyLevel of evidence III-3 (aetiology)SettingWaitemata <strong>Health</strong> or Auckl<strong>and</strong> <strong>Health</strong>care regions, New Zeal<strong>and</strong>Funding<strong>Health</strong> Research Council of New Zeal<strong>and</strong>, Foundation for the Newborn, Child <strong>Health</strong> Research FoundationParticipantsMothers of 1138 children born between October 1995 <strong>and</strong> November 1997 (844 cases (SGA) <strong>and</strong> 870 controls (born appropriate for GA)); only terminfants (> 37 weeks);Exclusions: preterm births (< 37 weeks), multiple births <strong>and</strong> those with congenital anomaliesBaseline comparisons See confounding belowDietary assessment FFQTimingFFQ administered after birth (to cover the periconception period <strong>and</strong> the last month of pregnancy)Comparison0-0.75 v > 0.75-1.25 v > 1.25-2.0 v > 2.0-3.0 v > 3 serves of fruit per dayOutcomesSGA (≤ 10 th centile for GA <strong>and</strong> gender)ResultsSGA (Fruit consumption at time of conception)SGA AGA aOR (95% CI) p value for trend0-0.75 132/542 (24.4%) 104/600 (17.3%) 1.49 (1.00 to 2.24)>0.75-1.25 107/542 (19.7%) 144/600 (24.0%) 0.99 (0.67 to 1.47)>1.25-2.0 115/542 (21.2%) 117/600 (19.5%) 1.44 (0.96 to 2.17)>2.0-3.0 84/542 (15.5%) 96/600 (16.0%) 1.23 (0.80 to 1.90)>3 104/542 (19.2%) 139/600 (23.2%) 1 0.12FollowupConfoundingRisk of biasRelevanceOther commentsSGA (fruit consumption in last month of pregnancy)0-0.75 95/540 (17.6%) 62/598 (10.3%) 1.53 (0.99 to 2.35)>0.75-1.25 82/540 (15.2%) 83/598 (13.9%) 1.08 (0.72 to 1.63)>1.25-2.0 111/540 (20.5%) 136/598 (22.7%) 0.93 (0.61 to 1.40)>2.0-3.0 89/540 (16.5%) 123/598 (20.6%) 1.04 (0.69 to 1.57)>3 163/540 (30.2%) 194/598 (32.4%) 1 0.19NAAdjusted for socio-economic status, ethnicity, maternal height, maternal weight before pregnancy, maternal hypertension <strong>and</strong> maternal smoking; butfolate supplementation was not controlled for (periconception folate was significantly associated with reduced SGA risk).Low-moderate risk of bias: Of the 2182 eligible infants, parents of 1714 (78.6%) completed the FFQ; 1138 (67%) of women completed the FFQ; missingitems in completed FFQ treated as woman not consuming any fruitLikely to be relevant to Australian womenOnly term infants includedDietary guidelines for pregnant <strong>and</strong> <strong>breastfeeding</strong> women: evidence report370
Reference Miyake 2010Food typeFruitStudy typeProspective cohort studyLevel of evidence II (aetiology)SettingWomen recruited antenatally from hospital obstetric clinics in Neyagawa city <strong>and</strong> surrounding municipalities, Osaka Prefecture, Japan, from November2001 to March 2003.FundingMinistry of Education, Culture, Sports, Science <strong>and</strong> Technology; <strong>and</strong> <strong>Health</strong> <strong>and</strong> Labour Sciences Research Grants, Research on Allergic Disease <strong>and</strong>Immunology, Ministry of <strong>Health</strong>, Labour <strong>and</strong> Welfare, Japan.Participants763 mother-infant pairs follow up until 24 months postpartum.Dietary assessment Self-administered FFQ undertaken during pregnancy. FFQ validated amongst 92 women against weighed dietary records.Baseline comparisons See confounding belowVitamin C supplements or multivitamin supplements were only used by 5.6% <strong>and</strong> 4.2% of participants at least once a week, therefore contribution ofmicronutrients from supplements was not considered in the analysis.Timing FFQ undertaken at baseline recruitment relating to diet in the month prior, but varying time of diet assessment as women were recruited from between 5<strong>and</strong> 39 weeks gestation.ComparisonQuartile of dietary intakes <strong>and</strong> infant wheeze <strong>and</strong> eczema at 16-24 months.OutcomesInfantile wheeze <strong>and</strong> eczema, based on symptoms defined according to ISAAC criteria.ResultsPrevalence of wheeze <strong>and</strong> asthma at 16-24 months was 22.1% <strong>and</strong> 18.6% respectively.75% of infants were breastfed for at least 6 months.No significant association between maternal intake of total fruit intake, apples, or citrus fruits - <strong>and</strong> wheeze.Similar for eczema with the exception of citrus fruit:FollowupConfoundingRisk of biasRelevanceOther commentsEczemaCrude OR (95% CI) Adjusted OR (95% CI)Citrus fruitQ1 1.00 1.00Q2 0.62 (0.38-1.02) 0.61 (0.36-1.02)Q3 0.56 (0.33-0.92) 0.57 (0.33-0.98)Q4 0.49 (0.29-0.82) 0.53 (0.30-0.93)P 0.006 0.03Until 24 months postpartumQuartile median adjusted for energy intake. Analyses adjusted for maternal age, gestation at baseline, residence, income, maternal <strong>and</strong> parentaleducation, maternal <strong>and</strong> parental history of asthma, atopic eczema <strong>and</strong> allergic rhinitis, changes in maternal diet in the previous month, season,maternal smoking, baby’s older siblings, baby’s birthweight, household smoking in the same room as infant, <strong>breastfeeding</strong> duration, <strong>and</strong> age of infant atthird survey.Moderate risk of bias (selection, ascertainment <strong>and</strong> attrition):- low participation rate, women participating had higher education levels- close to 25% losses to follow up at 24 month assessment- wheeze was assessed at varying ages between 16 <strong>and</strong> 24 months.High prevalence of wheeze <strong>and</strong> eczema (22.1% <strong>and</strong> 18.6%) in this population aged 16-24 months - ?higher than that reported in Australia. Wheeze ininfancy is not a reliable predictor of asthma in older ages.Fruit371
Reference Nwaru 2010Food typeFruit (apple, peach, plum, brune, orange, lemon, grapefruit, m<strong>and</strong>arin, canned fruits, melons, pineapple, grapes, banana, kiwi-fruit, avocado, dried fruits,berries) <strong>and</strong> fruit <strong>and</strong> berry juicesStudy typeProspective cohort studyLevel of evidence II (aetiology)SettingTampere, Finl<strong>and</strong>FundingAcademy of Finl<strong>and</strong>, Finnish Pediatric Research Foundation, the Juho Vainio Foundation, the Yrjo Jahnsson Foundation, Turku, Oulu <strong>and</strong> TampereUniversity Hospitals, JDRF, Novo Nordisk Foundation, EU Biomed 2 ProgramParticipants931 mother-infant pairs (children with human leukocyte antigen-conferred susceptibility to type 1 diabetes) participating in the Finnish type 1 DiabetesPrediction <strong>and</strong> Prevention (DIPP) Nutrition Study between September 1996 <strong>and</strong> October 1997Baseline comparisons See confounding belowDietary assessment FFQTimingFFQ given to women after birth, for return at the three month visit (FFQ intended to cover maternal diet during pregnancy <strong>and</strong> lactation)ComparisonAmount of fruit intakeOutcomesAllergic sensitisation in offspring by 5 years: food allergens (egg, cow’s milk, fish, wheat); inhalant allergens (house dust mite, cat, timothy grass, birch)ResultsTotal fruitsFood allergensInhalant allergensOR 0.97 95% CI 0.78 to 1.20 OR 1.32 95% CI 1.08 to 1.62aOR 0.97 95% CI 0.77 to 1.23 aOR 1.36 95% CI 1.09 to 1.70- Malaceous fruitsFood allergensInhalant allergensOR 0.95 95% CI 0.83 to 1.09 OR 0.98 95% CI 0.87 to 1.11aOR 0.97 95% CI 0.84 to 1.13 aOR 1.00 95% CI 0.87 to 1.14- Citrus fruitsFood allergensInhalant allergensOR 0.98 95% CI 0.91 to 1.06 OR 1.11 95% CI 1.03 to 1.11aOR 1.00 95% CI 0.92 to 1.09 aOR 1.14 95% CI 1.05 to 1.25FollowupConfoundingBerriesFood allergensInhalant allergensOR 1.05 95% CI 0.92 to 1.19 OR 1.06 95% CI 0.94 to 1.19aOR 1.07 95% CI 0.92 to 1.25 aOR 1.12 95% CI 0.88 to 1.28JuicesFood allergensInhalant allergensOR 0.98 95% CI 0.91 to 1.07 OR 0.99 95% CI 0.92 to 1.06aOR 0.99 95% CI 0.90 to 1.08 aOR 0.98 95% CI 0.90 to 1.06To 5 yearsAdjusted for energy intake, place of birth, season of birth, sex of the child, number of siblings, gestational age at birth, parental asthma, parental allergicrhinitis, maternal age at birth, maternal smoking during pregnancy, maternal educationDietary guidelines for pregnant <strong>and</strong> <strong>breastfeeding</strong> women: evidence report372
Risk of biasRelevanceOther commentsLow risk of bias: data available for 931/1175 (79.2%) children recruited – 108 did not participate in survey, a further 49 did not have IgE measurements,a further 87 had no FFQ or an incomplete FFQLikely to be relevant to Australian women28% of women took vitamin D supplements, 73% took iron supplements;HLA genotype not likely to have any impact on the development of allergic diseases.Fruit373
Reference Petridou 2005Food typeFruitStudy typeCase-control studyLevel of evidence III-3SettingGreeceFundingThe Childhood Hematology-Oncology Group: Athens University Medical School, Aristotle University of Thessaloniki, University Hospital of HeraklionParticipants Cases: 131 children with acute lymphoblastic leukemia, aged 12 to 59 months, gender <strong>and</strong> age matched toControls: 131 children hospitalised for minor conditions between 1999 <strong>and</strong> 2003Baseline comparisons See confounding belowDietary assessment FFQTimingDuring index pregnancyComparisonQuintiles of fruit intake – median Q1; 51 g/day: median Q5 228 g/dayOutcomesAcute lymphoblastic leukemia (ALL)ResultsMedian g/day Cases Controls p for trendQ1 51 28 24Q2 84 34 18Q3 122 24 30Q4 157 23 29Q5 228 22 30 0.04FollowupConfoundingRisk of biasRelevanceOther commentsLogistic regression: one quintile more of fruit: aOR 0.72 95% CI 0.57 to 0.91NATotal energy intake (but not mutually among food groups); matching variables; maternal age at birth; birthweight; maternal smoking during pregnancy;maternal years of schooling, maternal occupationModerate: moderate risk of recall bias for women being able to accurately remember their dietary intake during a pregnancy some time previously;Cases: 171 children with ALL were identified; 21 had missing data, consent was not given in 9 cases <strong>and</strong> 10 were unable to be matched, leaving 131(77%) of cases availableDiets of Greek women may differ from current diets of Australian womenDietary guidelines for pregnant <strong>and</strong> <strong>breastfeeding</strong> women: evidence report374
Reference Petridou 1998Food typeFruit: watermelon, melon, m<strong>and</strong>arins, oranges, apples, peaches, pears, grapes, apricots, cherries, strawberries, bananas, figs, pineapple, grapefruit,fresh fruit juice, dried fruits compote (0.5).Study typeCase-control studyLevel of evidence III-3SettingGreater Athens area, GreeceFundingGreek Ministry of <strong>Health</strong> <strong>and</strong> Welfare, <strong>and</strong> Foundation for Research in Childhood ‘S. Doxiadis’ParticipantsCases: 109 children with cerebral palsy (CP), born between 1984 <strong>and</strong> 1988 (estimated to be two-thirds of the children with CP born during this period)Controls (1): 155 neighbouring children of similar sex <strong>and</strong> age (± 12 months)Controls (2): 99 healthy siblings of similar sex <strong>and</strong> age (± 12 months) of the first neurological patient seen by the attending physician after a visit by theCP patientBaseline comparisons See confounding belowDietary assessment FFQTimingDuring pregnancyComparison≤ 2 versus 3-4 versus > 4 serves of fruit per day;regression analysis: risk of cerebral palsy with change in consumption by one unit ( = consumption of fruit once per day)OutcomesCerebral palsyResults≤ 2 serves of fruit per day: 12/91 (13.2%) cases v 21/246 (8.5%) controls3-4 serves of fruit per day: 16/91 (17.6%) cases v 64/246 (26.0%) controls> 4 serves of fruit per day: 63/91 (69.2%) cases v 161/246 (65.5%)FollowupConfoundingRisk of biasRelevanceOther commentsRegression analysis for each unit of consumption of fruit once per day:aOR 1.15 95% CI 1.03 to 1.29aOR 1.11 95% CI 0.98 to 1.27 (additionally adjusted for all food groups)8 yearsAge <strong>and</strong> sex of child, maternal age at birth, maternal age at menarche, maternal chronic disease, previous spontaneous abortions, persistent vomitingduring index pregnancy, multiple pregnancy, number of obstetric visits; timing of membrane rupture in index birth, use of general anaesthesia in theindex birth, mode of birth, abnormal placenta, infant head circumference at birth, congenital malformation, place of index birth, use of supplementaryiron during index pregnancy, physical exercise during index pregnancy, painless childbirth classes.The following were not included in the model:- Smoking or consumption of coffee or alcohol during pregnancy (stated to be “unrelated to CP <strong>and</strong> had no confounding influence”);- Gestational age, birthweight <strong>and</strong> maternal weight gain (stated to be “strong predictors of CP, but were not included in the model, since they areprobably intermediate stages in a possible link between diet <strong>and</strong> CP (mediators) rather than genuine confounders”Moderate-high: High risk of recall bias for women being able to accurately remember their dietary intake during a pregnancy 8 years previously;Cases: 109 children with CP were identified; for 6 children either collaboration with their guardian or a diagnosis of CP was not confirmed; <strong>and</strong> reliablematernal dietary intakes were not available for 12 women, leaving 91 cases available for analysis.Controls: 278 mother-child pairs were approached; 16 refused to participate; matching controls were not available in 8 instances, <strong>and</strong> reliable maternaldietary intakes were not available for 8 women, leaving 246 controls available for analysis.Diets of Greek women in 1998 may differ from current diets of Australian womenFruit375
Reference Ramon 2009Food typeFruitStudy typeProspective cohort studyLevel of evidence II (aetiology)SettingWomen attending hospital for fetal anomaly screening in Valencia, Spain between February 2004 <strong>and</strong> June 2005 (INMA-Valencia cohort)FundingInstituto de Salud Carlos III, Ministerio Sanidad y Consumo, Ministerio Educacion y Ciencia.Participants787 infants born between May 2004 <strong>and</strong> February 2006 to women at least 16 y, singleton pregnancy, antenatal visit at 10-13 weeks, no assistedconception, no chronic hypertensionMean age 30 y (range 16 to 43); 55% primiparous, 67% completed secondary education; 62% employed; 24% overweight or obeseDaily intake fruit 293.0 [216.1] g/dayDaily intake veg. 213.3 [121.0] g/dayDietary assessment FFQ to assess diet in the first trimester (administered at 10-13 weeks) <strong>and</strong> then diet since the first assessment (administered at 28-32 weeks). FFQvalidated for Spanish population.Baseline comparisons See Confounding belowTimingFFQ administered at 10-13 wks <strong>and</strong> then again at 28-32 weeks gestation.ComparisonQuintiles of fruit intake in first <strong>and</strong> third trimester <strong>and</strong> birthweight, birth length, SGA (weight), SGA (length).First trimester fruit intake was 85.0 g/day (range 3.4 to 137.9) for quintile 1 <strong>and</strong> 622.4 g/day (range 421.5 to 2456.9) in quintile 5OutcomesBirthweight st<strong>and</strong>ardised for gender <strong>and</strong> GA;SGA (weight or length) defined as below 10 th percentile based on growth reference charts st<strong>and</strong>ardised for both gender <strong>and</strong> GA for the SpanishpopulationResultsSummary: Fruit intake not associated with risk of SGA or birthweight.FollowupConfoundingRisk of biasAdjusted OR of the dietary exposures <strong>and</strong> SGA for weight <strong>and</strong> length (crude OR not reported)SGA for weight (95% CI) SGA for length (95% CI)Fruit – first trimesterQ1 1.0 (0.5-2.2) 2.6 (0.8-8.1)Q2 0.5 (0.2-1.2) 1.2 (0.3-4.4)Q3 1.2 (0.6-2.5) 2.0 (0.6-6.6)Q4 0.5 (0.2-1.1) 1.9 (0.5-6.5)Q5 1 1P 0.08 0.41Fruit – 3rd trimesterQ1 0.5 (0.2-1.1) 0.3 (0.1-1.0)Q2 0.8 (0.4-1.8) 0.9 (0.3-2.5)Q3 0.8 (0.4-1.7) 0.5 (0.2-1.5)Q4 0.7 (0.3-1.5) 0.8 (0.3-2.4)Q5 1 1p 0.44 0.20Fruit consumption had no clear pattern with birthweight.Until birth.Analyses adjusted for energy intake, maternal age, maternal pre-pregnancy weight, maternal height, paternal height, weight gain, parity, smoking duringpregnancy, caffeine intake, working, country of origin, infant sex, socioeconomic status.Low/moderate risk of selection bias due to 54% participation rate. (Women who worked were more likely to participate).Dietary guidelines for pregnant <strong>and</strong> <strong>breastfeeding</strong> women: evidence report376
RelevanceOther commentsMore generalisable to Australian women than other studies of fruit. Undertaken in a ‘horticultural area’ where fruit <strong>and</strong> vegetables are widely available.Fruit377
Reference Sausenthaler 2007Food groupsFruitsStudy typeProspective cohort study: from the LISA birth cohortLevel of evidence II (aetiology)Setting4 German cities (Munich, Leipzig, Wesel, Bad Honnef)FundingFederal Ministry for Education, Science, Research <strong>and</strong> Technology, GermanyParticipants2641 children at 2 years of ageBaseline comparisons See Confounding belowDietary assessment FFQTimingMaternal diet during the last 4 weeks of pregnancy (obtained shortly after birth, median 3 days)VariableLow intake group as reference group compared with high intake group: Citrus high intake = 3-4 times/week Apples high intake = ≥ 4 times/week Exotic fruit high intake = 3-4 times/week Bananas high intake = ≥ 4 times/week Strawberries high intake = 1-2 times/week Fruit juice high intake = 3-4 times/weekOutcomesResultsLength of followupConfoundingRisk of biasRelevanceOther commentsAllergic sensitisation, eczema at 2 yrsDoctor-diagnosed Any allergenInhalantFood allergenseczemasensitisationallergensFruitAdjusted OR (95% CI)Citrus 1.03 (0.78, 1.35) 1.82 (1.29, 2.56) 1.73 (1.18, 2.53) 1.72 (1.02, 2.92)Apples 0.92 (0.72, 1.21) 1.07 (0.77, 1.49) 1.01 (0.70, 1.46) 0.87 (0.52, 1.47)Exotic fruit 0.85 (0.66, 1.11) 0.77 (0.55, 1.07) 0.84 (0.58, 1.23) 0.64 (0.39, 1.07)Bananas 1.03 (0.77, 1.38) 1.08 (0.75, 1.55) 1.14 (0.75, 1.72) 1.10 (0.63, 1.93)Strawberries 1.02 (0.77, 1.35) 1.06 (0.75, 1.51) 0.90 (0.60, 1.34) 1.46 (0.87, 2.47)Fruit juice 1.18 (0.90, 1.54) 1.03 (0.73, 1.46) 1.12 (0.76, 1.65) 0.78 (0.47, 1.30)2 yearsCrude <strong>and</strong> adjusted results reported (adjusted for study area, sex, maternal age, maternal smoking, level of parental education, exclusive <strong>breastfeeding</strong>≥ 4 months, parental history of atopic diseases, season of birth <strong>and</strong> all dietary variablesTwo year data available for 2641/3097 children (85%): 433 lost to follow-up, 9 excluded due to chronic disease, 14 missing maternal FFQLikely to be reasonably similar to dietary intakes of Australian women in AustraliaDietary guidelines for pregnant <strong>and</strong> <strong>breastfeeding</strong> women: evidence report378
Reference Willers 2007Food typeFruit (apples, bananas, oranges, pears, peaches, nectarines, kiwi fruit, all other fruit (grapes, strawberries, melon, plums, etc))Study typeProspective cohort (longitudinal)Level of evidence II (aetiology)SettingAntenatal clinics at Aberdeen Maternity Hospital, Aberdeen, Scotl<strong>and</strong>FundingAsthma UK, GA 2 LEN European Network of Excellence on Global Allergy <strong>and</strong> AsthmaParticipants1212 children (singleton births) whose mothers were recruited between October 1997 <strong>and</strong> April 1999 at a median gestational age of 12 weeksBaseline comparisons Women were representative of the local obstetric populationSee confounding belowDietary assessment FFQTimingFFQ mailed at 32 weeks gestation to cover dietary intake over the previous 2-3 monthsComparisonTertiles: 0-1 v 1-4 v > 4 apples per weekOutcomesWheeze, asthma at 5 yearsResultsTotal fruit, citrus/kiwi fruit or fruit juice – no consistent linear associations with respiratory <strong>and</strong> atopic outcomes in 5 year old children (exact numbersnot reported in the paper).Maternal apple consumptionN T1 (0-1/week) T2 (1-4/week) T3 (> 4/week) p trendn = 398 n = 427 n = 384Wheeze in last 12 months 1003OR (95% CI) 1 1.09 (0.69 to 1.67) 0.61 (0.37 to 1.10) 0.066aOR (95% CI) 1 1.08 (0.68 to 1.71) 0.67 (0.40 to 1.13) 0.156Wheeze without cold in last 121003monthsOR (95% CI) 1 1.32 (0.72 to 2.43) 0.64 (0.31 to 1.35) 0.286aOR (95% CI) 1 1.27 (0.67 to 2.43) 0.70 (0.32 to 1.51) 0.411Ever wheezed 999OR (95% CI) 1 0.86 (0.60 to 1.23) 0.59 (0.40 to 0.88) 0.009aOR (95% CI) 1 0.85 (0.58 to 1.24) 0.63 (0.42 to 0.95) 0.029Asthma <strong>and</strong> wheeze in last 12 months 998OR (95% CI) 1 1.02 (0.60 to 1.73) 0.55 (0.29 to 1.03) 0.072aOR (95% CI) 1 1.03 (0.59 to 1.80) 0.60 (0.31 to 1.16) 0.148Doctor confirmed asthma 998OR (95% CI) 1 0.87 (0.56 to 1.36) 0.46 (0.27 to 0.78) 0.005aOR (95% CI) 1 0.83 (0.52 to 1.32) 0.47 (0.27 to 0.82) 0.008FollowupConfoundingFruitEver had asthmaOR (95% CI) 1 0.90 (0.58 to 1.38) 0.52 (0.31 to 0.86) 0.013aOR (95% CI) 1 0.86 (0.54 to 1.36) 0.54 (0.32 to 0.92) 0.0265 yearsAdjusted for maternal age, paternal social class, maternal education, maternal smoking during pregnancy, smoking in the child’s home at 5 years,379
Risk of biasRelevanceOther commentsenergy intake, maternal asthma, maternal atopy, child’s birthweight, child’s sex, presence of older siblings, <strong>and</strong> <strong>breastfeeding</strong>Low risk of bias: Initial study population of 1924 children dropped to 1212 participants with complete data (63.0%) (questionnaire, at least one of theoutcome time points).Likely to be reasonably relevant to Australian womenInclusion of maternal supplement use during pregnancy did not materially change the resultsDietary guidelines for pregnant <strong>and</strong> <strong>breastfeeding</strong> women: evidence report380
Reference Willers 2008Food typeFruitStudy typeProspective cohort (longitudinal)Level of evidence II (aetiology)SettingNetherl<strong>and</strong>sFundingNetherl<strong>and</strong>s Organization for <strong>Health</strong> Research <strong>and</strong> Development, Netherl<strong>and</strong>s Organization for Scientific Research; Netherl<strong>and</strong>s Asthma Fund;Netherl<strong>and</strong>s Ministry of Spatial Planning, Housing, <strong>and</strong> the Environment; Netherl<strong>and</strong>s Ministry of <strong>Health</strong>, Welfare <strong>and</strong> Sport, GlaxoSmithKlineParticipants2,832 children (part of the Prevention <strong>and</strong> Incidence of Asthma <strong>and</strong> Mite Allergy (PIAMA) birth cohort studyBaseline comparisons See confounding belowDietary assessment FFQTimingFFQ administered at antenatal recruitment (mean gestational ages not reported) to cover dietary intake over the previous monthComparisonDaily (once per day or more) v 1-4 times a week or fewerOutcomesWheeze, dyspnoea, prescription of inhaled steroids for respiratory problems, composite variable ‘asthma symptoms’ in the last 12 months (measuredlongitudinally from 1 to 8 years age)Results Wheeze from 1 to 8 years age (n = 2828)OR 0.82 95% CI 0.70 to 0.96aOR 0.89 95% CI 0.75 to 1.04Dyspnoea from 1 to 8 years age (n = 2828)OR 0.87 95% CI 0.72 to 1.06aOR 0.90 95% CI 0.74 to 1.10Steroid use from 1 to 8 years age (n = 2828)OR 0.84 95% CI 0.65 to 1.09aOR 0.89 95% CI 0.68 to 1.16FollowupConfoundingRisk of biasRelevanceOther commentsAsthma symptoms (composite of previous three outcomes) from 1 to 8 years age (n = 2828)OR 0.87 95% CI 0.73 to 1.04aOR 0.91 95% CI 0.77 to 1.098 yearsThe child’s dietary data on fruit, vegetables, fish, eggs, full cream milk, butter <strong>and</strong> peanut butter consumption at 2 years of age were used to check forpotential confounding by the child’s diet.Results were adjusted for by sex, maternal education, parental allergy, maternal smoking during pregnancy, smoking in the home at 8 years of age,<strong>breastfeeding</strong>, presence of older siblings, birthweight, maternal overweight 1 year after pregnancy, maternal supplement use during pregnancy, region<strong>and</strong> study arm (intervention or natural history arm).Moderate risk of bias: Initial study population of 4,146 mothers dropped to 2,832 participants with complete data (68.3%) (pregnancy questionnaire, atleast one of the outcome time points <strong>and</strong> all confounders). Participants with complete data were more likely to have a high education level, to have dailydairy <strong>and</strong> fruit intake during pregnancy <strong>and</strong> to have breastfed <strong>and</strong> less likely to have maternal asthma or maternal atopy, smoked during pregnancy, befrom a south western region compared with participants who did not have complete data.Dietary intakes likely to be different from Australian e.g. low fish consumption in study participantsNot clear when women assessed their diet during pregnancy;83% of pregnant women used supplements (50% used folic acid/iron)Fruit381
Reference Yin 2010 (see also Jones 2000)Food typeFruitStudy typeProspective cohortLevel of evidence II (aetiology)SettingSouthern Tasmania, AustraliaFundingNHMRC, Tasmanian Government, Royal Hobart Hospital Acute Care ProgramParticipants216 adolescents born in 1988 (part of a larger infant health study of babies at high risk of SIDS)Exclusions: multiple pregnanciesBaseline comparisons Children with unemployed fathers more likely to have been excluded due to missing dataDietary assessment FFQTimingDietary intake during third trimester of pregnancyComparisonLinear regression of density (portions per kJ)OutcomesBone mass (bone mineral density (BMD) <strong>and</strong> bone mineral content*) in 16 year old adolescentsResultsBMD at 16 years;Total body (g/cm 2 )r 2 -0.006; ß +11.7 (pns)adjusted r 2 0.333; ß +12.0 (pns)Femoral neck (g/cm 2 )r 2 -0.005 ß -2.1 (pns)adjusted r 2 0.347; ß -0.6 (pns)Lumbar spine (g/cm 2 )r 2 -0.003; ß +5.3 (pns)adjusted r 2 0.201; ß +9.5 (pns)Followup16 yearsConfoundingAnalyses were adjusted for sex, weight at age 16 years, sunlight exposure in winter at age 16 years, smoking during pregnancy, sports participation,ever breast-fed, current calcium intake, Tanner stage, maternal age at the time of childbirth <strong>and</strong> “other factors” [these other factors were not listed in thepaper]Risk of bias Moderate-high: 415 children were followed from birth to age 16. This dropped to 216 (dietary information missing or unreliable for 138 mothers, 47multiple births, 14 participants had missing data for confounders) representing 52% of participants followed from birth to age 16.70% of the 216 participants were male. Gender imbalance suggests potential selection bias (due to original selection of infants at high risk of SIDS)RelevanceInfants at high risk of SIDS represent a selected group (more males, preterm births, teenage mothers, smoking during pregnancy)Other comments *Bone mineral content results not reported;Study flow figures differ between 2000 <strong>and</strong> 2010 reports (e.g. numbers of multiple births)Dietary guidelines for pregnant <strong>and</strong> <strong>breastfeeding</strong> women: evidence report382
Reference Zhang 2006Food typeFruit fibreStudy typeProspective cohort studyLevel of evidence II (aetiology)SettingUSA (Nurses’ <strong>Health</strong> Study II)FundingNIHParticipants 13,110 women who reported having at least one singleton pregnancy lasting ≥ 6 months, between 1992 <strong>and</strong> 1998Exclusions: implausible total energy intake (< 500 kcal/day or > 3,500 kcal/day); multiple gestation; history of diabetes, cancer, cardiovascular disease,or GDM on the 1989 or 1991 questionnaire.Baseline comparisons See resultsDietary assessment FFQTimingFFQs administered in 1991 or 1995 to reflect dietary intake over the past yearComparisonQuintiles of fruit fibre intake (lowest quintile = reference)OutcomesSelf-reported diagnosis of gestational diabetes mellitus (GDM)ResultsGDM (adjusted for age, parity, BMI)g/day Cases/person-years RR (95% CI) p-value for trendQ1 (< 1.5) 200/19,749 1.00Q2 (1.6 to 2.3) 137/19,360 0.73 (0.59 to 0.91)Q3 (2.4 to 3.4) 160/20,343 0.81 (0.66 to 0.99)Q4 (3.5 to 4.8) 150/20,922 0.75 (0.61 to 0.93)Q5 (> 4.8) 111/19,258 0.57 (0.45 to 0.72) < 0.001Each 5 g/day increment 0.63 (0.51 to 0.78)GDM (adjusted for age, parity, BMI, race/ethnicity, smoking, family history of diabetes, alcohol intake, physical activity,total energy, protein intake, saturated fat, <strong>and</strong> polyunsaturated, monounsaturated <strong>and</strong> trans fatty acids)g/day Cases/person-years RR (95% CI) p-value for trendQ1 (< 1.5) 200/19,749 1.00Q2 (1.6 to 2.3) 137/19,360 0.74 (0.60 to 0.93)Q3 (2.4 to 3.4) 160/20,343 0.85 (0.69 to 1.05)Q4 (3.5 to 4.8) 150/20,922 0.81 (0.65 to 1.02)Q5 (> 4.8) 111/19,258 0.66 (0.51 to 0.86) 0.01Each 5 g/day increment 0.73 (0.58 to 0.93)GDM (adjusted for age, parity, BMI, physical activity, race/ethnicity, smoking, family history of diabetes, alcohol intake,total energy, protein intake, saturated fat, <strong>and</strong> polyunsaturated, monounsaturated <strong>and</strong> trans fatty acids, <strong>and</strong> cereal <strong>and</strong>vegetable fibre)g/day Cases/person-years RR (95% CI) p-value for trendQ1 (< 1.5) 200/19,749 1.00Q2 (1.6 to 2.3) 137/19,360 0.75 (0.60 to 0.94)Q3 (2.4 to 3.4) 160/20,243 0.86 (0.69 to 1.07)Q4 (3.5 to 4.8) 150/20,922 0.82 (0.65 to 1.04)Q5 (> 4.8) 111/19,258 0.67 (0.51 to 1.87) 0.02Each 5 g/day increment 0.74 (0.58 to 0.95)Fruit383
FollowupVariableConfoundingSee resultsRisk of bias Low risk of bias: actual attrition figures for this substudy not reported but overall attrition reported to be 10%RelevanceLikely to be relevant to Australian womenOther comments Dietary assessment periods will differ in relation to timing of pregnancies – need to assume a woman’s diet will remain similar over time <strong>and</strong> whether orshe is pregnant or planning to become pregnant. This assumption may not apply to alcohol intake, for exampleDietary guidelines for pregnant <strong>and</strong> <strong>breastfeeding</strong> women: evidence report384
ReferencesBunin GR, Kushi LH, Gallagher PR, Rorke-Adams LB, McBride ML <strong>and</strong> Cnaan A."Maternal diet during pregnancy <strong>and</strong> its association with medulloblastoma inchildren: a children's oncology group study (United States)." Cancer CausesControl 2005: 16(7): 877-91.Bunin GR, Kuijten RR, Buckley JD, Rorke LB <strong>and</strong> Meadows AT. "Relationbetween maternal diet <strong>and</strong> subsequent primitive neuroectodermal braintumors in young children." N Engl J Med 1993: 329(8): 536-41.Chatzi L, Torrent M, Romieu I, Garcia-Esteban R, Ferrer C, Vioque J, KogevinasM <strong>and</strong> Sunyer J. "Mediterranean diet in pregnancy is protective for wheeze<strong>and</strong> atopy in childhood." Thorax 2008: 63(6): 507-13.George GC, Hanss-Nuss H, Milani TJ <strong>and</strong> Freel<strong>and</strong>-Graves JH. "Food choices oflow-income women during pregnancy <strong>and</strong> postpartum." J Am Diet Assoc2005: 105(6): 899-907.Giordano F, Abballe A, De Felip E, di Domenico A, Ferro F, Grammatico P,Ingelido AM, Marra V, Marrocco G, Vallasciani S <strong>and</strong> Figa-Talamanca I."Maternal exposures to endocrine disrupting chemicals <strong>and</strong> hypospadias inoffspring." Birth Defects Res A Clin Mol Teratol 2010: 88(4): 241-50.Giordano F, Carbone P, Nori F, Mantovani A, Taruscio D <strong>and</strong> Figa-Talamanca I."Maternal diet <strong>and</strong> the risk of hypospadias <strong>and</strong> cryptorchidism in theoffspring." Paediatr Perinat Epidemiol 2008: 22(3): 249-60.Haggarty P, Campbell DM, Duthie S, Andrews K, Hoad G, Piyathilake C <strong>and</strong>McNeill G. "Diet <strong>and</strong> deprivation in pregnancy." Br J Nutr 2009: 102(10):1487-97.Jensen CD, Block G, Buffler P, Ma X, Selvin S <strong>and</strong> Month S. "Maternal dietaryrisk factors in childhood acute lymphoblastic leukemia (United States)."Cancer Causes Control 2004: 15(6): 559-70.FruitJones G, Riley MD <strong>and</strong> Dwyer T. "Maternal diet during pregnancy isassociated with bone mineral density in children: a longitudinal study." Eur JClin Nutr 2000: 54(10): 749-56.Klemmensen A, Tabor A, Osterdal ML, Knudsen VK, Halldorsson TI, MikkelsenTB <strong>and</strong> Olsen SF. "Intake of vitamin C <strong>and</strong> E in pregnancy <strong>and</strong> risk of preeclampsia:prospective study among 57 346 women." BJOG 2009: 116(7):964-74.Knox EG. "Anencephalus <strong>and</strong> dietary intakes." Br J Prev Soc Med 1972: 26(4):219-23.Kwan ML, Jensen CD, Block G, Hudes ML, Chu LW <strong>and</strong> Buffler PA. "Maternaldiet <strong>and</strong> risk of childhood acute lymphoblastic leukemia." Public <strong>Health</strong> Rep2009: 124(4): 503-14.Lamb MM, Myers MA, Barriga K, Zimmet PZ, Rewers M <strong>and</strong> Norris JM."Maternal diet during pregnancy <strong>and</strong> islet autoimmunity in offspring."Pediatr Diabetes 2008: 9(2): 135-41.Laraia BA, Bodnar LM <strong>and</strong> Siega-Riz AM. "Pregravid body mass index isnegatively associated with diet quality during pregnancy." Public <strong>Health</strong> Nutr2007: 10(9): 920-6.Li L <strong>and</strong> Werler MM. "Fruit <strong>and</strong> vegetable intake <strong>and</strong> risk of upper respiratorytract infection in pregnant women." Public <strong>Health</strong> Nutr 2010: 13(2): 276-82.Martindale S, McNeill G, Devereux G, Campbell D, Russell G <strong>and</strong> Seaton A."Antioxidant intake in pregnancy in relation to wheeze <strong>and</strong> eczema in thefirst two years of life." Am J Respir Crit Care Med 2005: 171(2): 121-8.385
Mikkelsen TB, Osler M, Orozova-Bekkevold I, Knudsen VK <strong>and</strong> Olsen SF."Association between fruit <strong>and</strong> vegetable consumption <strong>and</strong> birth weight: aprospective study among 43,585 Danish women." Sc<strong>and</strong> J Public <strong>Health</strong>2006: 34(6): 616-22.Mitchell EA, Robinson E, Clark PM, Becroft DM, Glavish N, Pattison NS, PryorJE, Thompson JM <strong>and</strong> Wild CJ. "Maternal nutritional risk factors for small forgestational age babies in a developed country: a case-control study." ArchDis Child Fetal Neonatal Ed 2004: 89(5): F431-5.Miyake Y, Sasaki S, Tanaka K <strong>and</strong> Hirota Y. "Consumption of vegetables, fruit,<strong>and</strong> antioxidants during pregnancy <strong>and</strong> wheeze <strong>and</strong> eczema in infants."Allergy 2010: 65(6): 758-65.Nwaru BI, Ahonen S, Kaila M, Erkkola M, Haapala AM, Kronberg-Kippila C,Veijola R, Ilonen J, Simell O, Knip M <strong>and</strong> Virtanen SM. "Maternal diet duringpregnancy <strong>and</strong> allergic sensitization in the offspring by 5 yrs of age: aprospective cohort study." Pediatr Allergy Immunol 2010: 21(1 Pt 1): 29-37.Petridou E, Ntouvelis E, Dessypris N, Terzidis A <strong>and</strong> Trichopoulos D."Maternal diet <strong>and</strong> acute lymphoblastic leukemia in young children." CancerEpidemiol Biomarkers Prev 2005: 14(8): 1935-9.Sausenthaler S, Koletzko S, Schaaf B, Lehmann I, Borte M, Herbarth O, vonBerg A, Wichmann HE <strong>and</strong> Heinrich J. "Maternal diet during pregnancy inrelation to eczema <strong>and</strong> allergic sensitization in the offspring at 2 y of age."Am J Clin Nutr 2007: 85(2): 530-7.Willers SM, Devereux G, Craig LC, McNeill G, Wijga AH, Abou El-Magd W,Turner SW, Helms PJ <strong>and</strong> Seaton A. "Maternal food consumption duringpregnancy <strong>and</strong> asthma, respiratory <strong>and</strong> atopic symptoms in 5-year-oldchildren." Thorax 2007: 62(9): 773-9.Willers SM, Wijga AH, Brunekreef B, Kerkhof M, Gerritsen J, Hoekstra MO, deJongste JC <strong>and</strong> Smit HA. "Maternal food consumption during pregnancy <strong>and</strong>the longitudinal development of childhood asthma." Am J Respir Crit CareMed 2008: 178(2): 124-31.Yin J, Dwyer T, Riley M, Cochrane J <strong>and</strong> Jones G. "The association betweenmaternal diet during pregnancy <strong>and</strong> bone mass of the children at age 16."Eur J Clin Nutr 2010: 64(2): 131-7.Zhang C, Liu S, Solomon CG <strong>and</strong> Hu FB. "Dietary fiber intake, dietary glycemicload, <strong>and</strong> the risk for gestational diabetes mellitus." Diabetes Care 2006a:29(10): 2223-30.Petridou E, Stoikidou M, Diamantopoulou M, Mera E, Dessypris N <strong>and</strong>Trichopoulos D. "Diet during pregnancy in relation to birthweight in healthysingletons." Child Care <strong>Health</strong> Dev 1998b: 24(3): 229-42.Ramon R, Ballester F, Iniguez C, Rebagliato M, Murcia M, Esplugues A, MarcoA, Garcia de la Hera M <strong>and</strong> Vioque J. "Vegetable but not fruit intake duringpregnancy is associated with newborn anthropometric measures." J Nutr2009: 139(3): 561-7.Dietary guidelines for pregnant <strong>and</strong> <strong>breastfeeding</strong> women: evidence report386
Included StudiesFruit & VegetablesStudyOutcomes1. Fitzsimon 2007 Child asthma at 3 years2. Haugen 2008 Preterm birth3. Hoppu 2005 Atopy in infant at 12 months4. Kwan 2009 Childhood acute lymphoblastic leukemia5. Li 2009 Maternal URTI6. Maconochie 2007 Miscarriage7. Mikkelsen 2008 Preterm birth8. Mikkelsen 2006 Birthweight <strong>and</strong> z-scores9. Spector 2005 Infant acute leukemia (AML) <strong>and</strong> childhood acute lymphoblastic leukemia (ALL)10. Stuebe 2009 GWGFruit <strong>and</strong> Vegetables387
Evidence SummariesMaternal Outcomes1. In a North American retrospective cohort study, women with a higher fruit <strong>and</strong> vegetableintake (quartiles from never to > 4 a day) during the first half of pregnancy had fewer upperrespiratory infections in the first three months (aHR 0.61 95% 0.39 to 0.97; p = 0.03) but thisdid not remain significant at five months (aHR 0.74 95% CI 0.53 to 1.05; p = 0.11)2. In a US cohort study, maternal fruit <strong>and</strong> vegetable consumption during pregnancy was notassociated with excessive gestational weight gain: aOR 1.03 95% CI 0.98 to 1.073. In a case-control study from the UK, maternal daily consumption of fruit <strong>and</strong> vegetables duringpregnancy was associated with reduced odds of miscarriage: aOR 0.49 95% CI 0.36 to 0.66)Birth Outcomes4. In a cohort study from Norway, no significant difference was seen in the rate of preterm birthbetween ≤ 5 <strong>and</strong> > 5 daily serves of fruit <strong>and</strong> vegetables during pregnancy: aOR 0.99 95% CI0.86 to 1.155. In a Danish cohort study, no significant difference was seen in the rate of preterm birthbetween ≤ 5 <strong>and</strong> > 5 daily serves of fruit <strong>and</strong> vegetables during pregnancy: aOR 1.01 95% CI0.90 to 1.146. In a Danish cohort study, there were small but significant increases in birthweight as maternalintake of fruit, vegetables <strong>and</strong> juice increased: adjusted regression coefficient 7.7 95% CI 4.0 to11.3, p < 0.001;Mean birthweight <strong>and</strong> z-scores were consistently lowest in the lowest quintile for all fruit<strong>and</strong> vegetable groupingsChildhood – Asthma, Eczema <strong>and</strong> Other Allergy Outcomes7. In a Finnish cohort study, there was a significantly lower risk of atopy (specifically atopiceczema) in infants at 12 months of age whose mothers’ breastmilk was rich in vitamin C (froma diet high in fresh fruits, berries <strong>and</strong> vegetables during lactation): OR 0.30 95% CI 0.09 to 0.948. In a cohort study from Irel<strong>and</strong>, there was a significantly lower risk of asthma in infants at 3years of age whose mothers had a high fruit <strong>and</strong> vegetable intake during pregnancy; aOR 0.4295% CI 0.18 to 0.99Other Childhood OutcomesN Level References1034 III-2 Li 20061338 II Stuebe 2009603cases;6116controlsIII-3 Maconochie 20071138 II Haugen 200835,350 II Mikkelsen 200843,585 II Mikkelsen 200634 II Hoppu 2005631infantsIII-2 Fitzsimon 2007Dietary guidelines for pregnant <strong>and</strong> <strong>breastfeeding</strong> women: evidence report388
9. In a US case-control study, maternal consumption of 1-2 serves of fruit <strong>and</strong> vegetables perday during pregnancy was significantly associated with reduced odds of childhood acutelymphoblastic leukemia: aOR 0.64 95% CI 0.48 to 0.8510. In a US case-control study, maternal consumption of fruit <strong>and</strong> vegetables was not significantlyassociated with reduced odds of childhood acute lymphoblastic leukemia (p = 0.09) or infantacute leukemia (p = 0.18)282cases;641controls240cases;255controlsIII-3 Kwan 2009III-3 Spector 2005Fruit <strong>and</strong> Vegetables389
Evidence TablesReference Fitzsimon 2007Dietary patterns Fruit (apples, pears, oranges, satsumas <strong>and</strong> m<strong>and</strong>arins, grapefruit, bananas, grapes, melon, peaches, plums <strong>and</strong> apricots, strawberries, raspberries,kiwifruit);<strong>and</strong> vegetables (carrots, spinach, broccoli, spring greens<strong>and</strong> kale, brussel sprouts, cabbage, peas, green beans <strong>and</strong> runner beans, marrow <strong>and</strong>courgettes, cauliflower, parsnips, turnips, leeks, onions, garlic, mushrooms, sweet peppers, bean sprouts, green salad <strong>and</strong> lettuce, cucumber, celery,watercress, tomatoes, sweetcorn, beetroot, coleslaw, avocado)Study typeRetrospective cohort studyLevel of evidence III-2 (aetiology)SettingGalway, Irel<strong>and</strong> (part of the Life-ways Cross-Generation Cohort Study)FundingNot statedParticipants 631 children turning 3 in summer of 2005Baseline comparisons See ResultsDietary assessment FFQTimingFFQ “during pregnancy”ComparisonQuartiles of fruit <strong>and</strong> vegetable consumption during pregnancy (Q1 = 2.3 (range 0-3.4); Q2 = 4.1 (3.4-5.0); Q3 = 6.0 (5.0-7.1); Q4 = 8.9 (> 7.1) servesper day)OutcomesAsthma at 3 years (GP-diagnosed)ResultsSummary: women with a high fruit <strong>and</strong> vegetable <strong>and</strong> fish oil intake <strong>and</strong> relatively sparing fat intake were less likely to havechildren who developed asthmaAsthma (OR (95%CI))n/N Q1 Q2 Q3 Q4 P for trend (Q4 v Q1+2+3)aOR (univariate) 66/631 1 0.99 (0.51 to 1.9) 0.80 (0.39 to 1.6) 0.49 (0.22 to 1.1) 0.07aOR (+fat) 66/631 1 0.99 (0.50 to 2.0) 0.71 (0.33 to 1.5) 0.43 (0.19 to 0.97) 0.04aOR (+oily fish fat) 64/618 1 1.1 (0.55 to 2.3) 0.81 (0.37 to 1.7) 0.53 (0.23 to 1.2) 0.09aOR (+birthweight, 63/610 1 1.1 (0.53 to 2.3) 0.93 (0.42 to 2.0) 0.49 (0.20 to 1.2) 0.09sex, smoke expos,fat, oily fish)aOR (+birthweight, 62/605 1 1.1 (0.53 to 2.3) 0.89 (0.39 to 2.0) 0.50 (0.21 to 1.2) 0.07sex, smoke expos,fat, oily fish, GMS*)aOR (+birthweight,sex, smoke expos,fat, GMS*)64/618 1 1.0 (0.49 to 2.1) 0.76 (0.34 to 1.7) 0.42 (0.18 to 0.99) 0.04*GMS = medical card for low-income womenFollowupn/aConfoundingSee ResultsRisk of bias Moderate risk of bias: Of the 1001 singleton babies born, 631 had GP follow-up data at 3 years (63.1%)RelevanceLikely to be relevant to Australian womenDietary guidelines for pregnant <strong>and</strong> <strong>breastfeeding</strong> women: evidence report390
Other commentsFat consisted of pure fat products (added or spreadable fats including butter, margarine <strong>and</strong> other spreads, salad dressings <strong>and</strong> mayonnaise) but fatfrom foods with partial or hidden fats was not considered hereOily fish = fresh or canned e.g. mackerel, kippers, tuna, salmon, sardines, herringFruit <strong>and</strong> Vegetables391
Reference Haugen 2008Dietary patterns Fruit <strong>and</strong> vegetables as part of Mediterranean-type dietStudy typeProspective cohort studyLevel of evidence II (aetiology)SettingNorway (part of the Norwegian Mother <strong>and</strong> Child Cohort Study (MoBa))FundingNorwegian Ministry of <strong>Health</strong>, NIH/NINDS, Norwegian Research Council/FUGE, EU FP& consortium, Metabolic Programming (EARNEST).Participants40,817 pregnancies of women recruited for MoBa from February 2002 to February 2005 of whom 26,563 (65%) met the following criteria: women had tobe non-smoking, BMI between 19 <strong>and</strong> 32, aged between 21 <strong>and</strong> 38 years when giving birth, with a singleton birth.Exclusions: more than 3 spontaneous abortions, energy intake less than 4,200 kJ <strong>and</strong> more than 16,700 kJ.Baseline comparisons See confounding belowDietary assessment FFQTimingFFQ at 17-24 weeks gestationComparisonFish ≥ 5 times per day v < 5 times a dayOutcomesPreterm birth (after week 21 <strong>and</strong> before week 37); late preterm birth (week 35-36) <strong>and</strong> early preterm birth (< 35 weeks)ResultsPreterm birth (< 37 weeks): (n = 25,966; 1174 cases)OR 0.95 95% CI 0.82 to 1.10aOR 0.99 95% CI 0.86 to 1.15Early preterm birth (< 35 weeks): (n = 25,256; 474 cases)OR 0.88 95% CI 0.70 to 1.11aOR 0.91 95% CI 0.72 to 1.16FollowupConfoundingRisk of biasRelevanceOther commentsLate preterm birth (35-36 weeks): (n = 25,492; 710 cases)OR 1.0 95% CI 0.83 to 1.20aOR 1.05 95% CI 0.87 to 1.26To birthAnalyses were adjusted for remaining Mediterranean diet criteria, mother’s BMI <strong>and</strong> height, educational level, parity <strong>and</strong> marital statusModerate: some dietary intakes were different between groups <strong>and</strong> were not controlled forModerate: low red meat consumption not typical for many Australian womenPreterm birth rates were lower than expected, likely due to exclusion of smokersDietary guidelines for pregnant <strong>and</strong> <strong>breastfeeding</strong> women: evidence report392
Reference Hoppu 2005Dietary patterns Fruit <strong>and</strong> vegetables (specifically recommended an abundant intake of fresh fruits, berries <strong>and</strong> vegetables during <strong>breastfeeding</strong>)Study typeProspective cohort studyLevel of evidence II (aetiology)SettingTurku, Finl<strong>and</strong>FundingAcademy of Finl<strong>and</strong>, Juho Vainio Foundation, Finnish Cultural FoundationParticipants34 mothers with atopic disease (allergic rhinitis, atopic dermatitis, asthma) recruited at the end of gestation;Infants must have been exclusively or predominantly breastfed at one monthBaseline comparisons Similar between atopic <strong>and</strong> nonatopic infants except for positive maternal skin prick test <strong>and</strong> maternal food hypersensitivity (both adjusted for in results– see belowDietary assessment Questionnaire <strong>and</strong> personal interview; 4 day food recordsTimingQuestionnaire at 35-35 weeks gestation; 4 day food records checked at one month postnatal visit with mothers given individual dietary counsellingComparisonVitamin C concentrations in breastmilkOutcomesBreastmilk composition at one month, atopy (specifically atopic eczema) in infant at 12 months of ageResultsAtopic infants (n = 7) consumed breastmilk with a lower concentration of vitamin C (5.2 mg/day 95% CI 4.6 to 5.7) compared with nonatopic infants (n=27); 6.2 mg/day 95% CI 5.8 to 6.6; p = 0.02;Lower risk of atopy in infant with increased vitamin C in breastmilk: OR 0.30 95% CI 0.09 to 0.94This effect did not change when adjusted for maternal skin prick test <strong>and</strong> food hypersensitivityFollowupConfoundingRisk of biasRelevanceOther commentsAs a separate ANCOVA analysis indicated that only dietary intake of vitamin C increased the vitamin C concentration in breastmilk (p = 0.048), withsupplements having no apparent effect (p = 0.78), the significantly reduced risk of infant atopy at 12 months is attributed to dietary intake of vitamin CInfant to 12 months of ageSee resultsModerate risk of bias: Of the 65 mothers recruited, 34 (52.3%) fulfilled the <strong>breastfeeding</strong> inclusion criteria with a food record <strong>and</strong> a breastmilk sampleavailableRelevant to Australian women (although a wide range of berries less available in Australia)Apart from recommendation to take vitamin D during wintertime, women were not encouraged or discouraged to take vitamin or mineralsupplementation, but were asked to report any use of theseFruit <strong>and</strong> Vegetables393
Reference Kwan 2009Food typeFruit <strong>and</strong> vegetables:Study typeCase controlLevel of evidence III-3 (aetiology)Setting California, USA (part of the Northern California Childhood Leukemia Study – phase 1 <strong>and</strong> 2 (phase 1 reported in Jensen 2004)FundingPHS; Paul O’Gorman Foundation for Children with LeukemiaParticipants866 individuals - 282 matched cases <strong>and</strong> controls (205 pairs <strong>and</strong> 77 trios):Cases: Children under 15 years of age, with a parent who spoke English or Spanish, were resident in the study area at the time of diagnosis of acutelymphoblastic leukemia (ALL), with no prior diagnosis of cancerControls: identified from birth certificates matched to the case on date of birth, sex, maternal race, Hispanic ethnicity of mother or father, <strong>and</strong> county ofresidence at birth (in phase 1 (1995-99) only due to concerns about overmatching on potential environmental exposures linked to leukemia risk)Data collected from August 1995 to November 2002Baseline comparisons A priori potential confounders were identified as birthweight, <strong>breastfeeding</strong>, maternal age <strong>and</strong> education, <strong>and</strong> smoking during pregnancy.Also see Confounding below.Dietary assessment FFQTimingDietary intake to reflect the year before the index pregnancy (to indicate dietary status at the start of pregnancy)ComparisonServes of fruit <strong>and</strong> vegetablesOutcomesChildhood acute lymphoblastic leukemiaResultsFruit <strong>and</strong> vegetables: aOR 0.64 95% CI 0.48 to 0.85: median consumption 1.3 (25 th 75 th percentiles 0.8, 2.0) serves per dayFibre from fruits/vegetables (g):aOR 0.52 95% CI 0.31 to 0.88: median consumption 6.18 (25 th 75 th percentiles 0.97, 8.76) g per dayFollowupConfoundingRisk of biasRelevanceOther commentsn/aAnalyses were adjusted for total energy intake, household income, indoor insecticide exposure during pregnancy; <strong>and</strong> proportion of foods reported aslarge or extra-large portion sizeAlso adjusted for child’s diet, with little effect seen on resultsLow-moderate risk of bias: Of eligible cases identified from January 1995 to November 2002, 86% consented to participate; 56% of the eligible controlsagreed to participate. 190 participants excluded: leukemia diagnosis was not ALL (n = 127); no dietary data (n = 4); a case or a control respondent wasnot the biological mother (n = 14), questionable dietary questionnaire data (n = 45), leaving 282 matched sets (86%).Likely to be relevant for Australian women, though some diet components may differ e.g. high bean consumptionRegular use of any dietary supplement was not associated with risk of ALL;Authors did not comment on the positive association with fibre cerealsDietary guidelines for pregnant <strong>and</strong> <strong>breastfeeding</strong> women: evidence report394
Reference Li 2009Dietary patterns Fruit <strong>and</strong> vegetablesStudy typeRetrospective cohort studyLevel of evidence III-2 (aetiology)SettingNorth AmericaFundingNational Institute of Dental <strong>and</strong> Craniofacial ResearchParticipants1034 mothers who had participated in a case-control study of children with congenital craniofacial malformationsBaseline comparisons See confounding belowDietary assessment FFQTimingFruit <strong>and</strong> vegetable intake in the six months before pregnancyComparisonQuartiles of fruit <strong>and</strong> vegetable consumption (never to four or more times a day)Serves per day, median (range)1 st quartile 1.91 (0.07 to 2.89)2 nd quartile 3.71 (2.90 to 4.62)3 rd quartile 5.59 (4.63 to 6.70)4 th quartile 8.54 (6.71 to 29.04)OutcomesUpper respiratory infection in women during the first half of pregnancy (not including asthma or allergy) [44 URTI episodes without a known start datewere excluded from hazards analysis]ResultsURTI (5 month risk)HR (95% CI) aHR (95% CI) p-value for trendQ1 1.00 1.00Q2 0.91 (0.68 to 1.21) 0.90 (0.67 to 1.21)Q3 0.88 (0.66 to 1.18) 0.89 (0.65 to 1.21)Q4 0.73 (0.54 to 0.99) 0.74 (0.53 to 1.05) 0.11URTI (three month risk)HR (95% CI) aHR (95% CI) p-value for trendQ1 1.00 1.00Q2 0.77 (0.52 to 1.12) 0.76 (0.52 to 1.13)Q3 0.68 (0.46 to 1.01) 0.68 (0.44 to 1.03)Q4 0.62 (0.41 to 0.93) 0.61 (0.39 to 0.97) 0.03FollowupConfoundingRisk of biasRelevanceOther comments5 months since last menstrual periodAdjusted for age, race, energy intakeLow-moderate risk of bias: 1034/1163 (88.9%) women included in analysis – 88 with an incomplete FFQ, 41 with implausible energy intakes); womenwere interviewed at an average of 8 months after birth, but up to 36 months, so some risk of recall bias; some evidence of increased fruit <strong>and</strong> vegetableconsumption once pregnancy was known (misclassification bias)Likely to be relevant to Australian womenURTI during pregnancy may be associated with preterm birth <strong>and</strong> congenital abnormalitiesFruit <strong>and</strong> Vegetables395
Reference Maconochie 2007Food groupsFresh fruit <strong>and</strong> vegetablesStudy typeCase-control study (postal survey sampled from the electoral roll – National Women’s <strong>Health</strong> Study)Level of evidence III-3 (aetiology)SettingUK general populationFundingNational Lottery Community Fund, Miscarriage AssociationParticipantsCases: 603 women aged 18 to 55 years whose most recent pregnancy had ended in first trimester miscarriage (< 13 weeks gestation);Controls: 6116 women aged 18 to 55 years whose most recent pregnancy had progressed beyond 12 weeksBaselineComparisonsBMI < 18.5 was significantly associated with odds of miscarriageAlso see Confounding belowDietary Assessment QuestionnaireTimingDiet in the three months prior to conception <strong>and</strong> the first 12 weeks of pregnancyComparisonDaily or consumption most daysOutcomesFirst trimester miscarriageResultsFresh fruit <strong>and</strong> vegetablesdailyCases Controls aOR (95% CI) aOR further adjusted for nauseaNo 69 (12%) 402 (7%) 1.00 1.00Yes 517 (88%) 5563 (93%) 0.54 (0.41 to 0.72) 0.49 (0.36 to 0.66)Length of followup n/aConfoundingAdjusted for year of conception, maternal age, previous miscarriage <strong>and</strong> previous live birth; <strong>and</strong> further adjusted for nausea in the first 12 weeks ofpregnancyRisk of bias Low risk of bias: 88% of eligible women responding to stage 1 agreed to participate in the second stage of the study; <strong>and</strong> 71% responded to the stage 2questionnaire. 1071/7790 records (7508 women) were excluded (mostly due to index pregnancy being conceived prior to 1980), leaving 6719 records(86%) available for analysisRelevanceLikely to be relevant to Australian womenOther comments Women who suffered from nausea in the first 12 weeks of pregnancy were almost 70% less likely to miscarryDietary guidelines for pregnant <strong>and</strong> <strong>breastfeeding</strong> women: evidence report396
Reference Mikkelsen 2006Food typeFruit <strong>and</strong> vegetablesStudy typeProspective cohort studyLevel of evidence II (aetiology)SettingWomen participating in the Danish National Birth Cohort e.g. became pregnant during January 1997-October 2002 <strong>and</strong> recruited through generalpractitioners.FundingDanish National Research Foundation, March of Dimes Birth Defects Foundation, European Union, Novonordic Foundation, ISMF, the <strong>Health</strong>Foundation, Danish National Medical Research Foundation, Danish Heart Association.Participants43,585 pregnant women with singleton pregnancies for whom complete dietary info <strong>and</strong> birth records were available.Baseline comparisons See Confounding below.Dietary assessment FFQ compared mid-pregnancy, validated in Danish men <strong>and</strong> women. Timeframe for food consumption unclear (i.e. consumption in last week, monthetc).TimingFFQ completed at 25 weeks gestational age.ComparisonBirthweights in quintiles of intake of fruit <strong>and</strong> vegetable exposures,Subgroup analyses performed on a group of thin women (BMI < 20).OutcomesBirthweight <strong>and</strong> z-scores (in singletons only)ResultsMean birthweight <strong>and</strong> Z-scores were consistently lowest in the lowest quintile for all fruit <strong>and</strong> vegetable groupings.In the multivariate regression models, dietary exposures were associated with birth weight (i.e. as you move up in quintile, there were small butconsistent increases in birthweight).FollowupConfoundingRisk of biasRelevanceOther commentsRegression coefficients of the dietary exposures <strong>and</strong> birthweightCrude (95% CI)Adjusted (95% CI)F & V 9.7 (6.2-13.2)**** 8.8 (5.3-12)****F & V – Energy adjusted 9.2 (5.6-16.8)**** 8.4 (4.8-12.0)****F & V & J 5.9 (2.4-9.5)*** 8.1 (4.6-11.5)****F & V & J – Energy adjusted 5.1 (1.4-8.8)** 7.7 (4.0-11.3)*****p
Reference Mikkelsen 2008Dietary patterns Mediterranean diet (consumption of fish twice a week or more, intake of olive or canola oil, high consumption of fruits <strong>and</strong> vegetables (5 a day ormore), meat (other than poultry or fish) at most twice a week, <strong>and</strong> at most 2 cups of coffee a day)Study typeProspective cohort studyLevel of evidence IISettingDenmark (part of the Danish National Birth Cohort (DBNC))FundingMarch of Dimes Birth Defects Foundation, Danish National Research Foundation, Danish Medical Research Foundation, Danish <strong>Health</strong> Foundation,Danish Heart Foundation, EU FP7 consortium (EARNEST), Pharmacy Foundation, Egmont Foundation, Augustinus Foundation.Participants 35,530 pregnant women recruited from 1996 to 2002Exclusions: women who smoked, women aged < 21 <strong>and</strong> > 38 years, BMI < 19 <strong>and</strong> > 32, a history of more than 3 abortions, twin pregnancies, chronichypertension, women with a calculated energy intake < 4,200 kJ <strong>and</strong> > 16,700 kJBaseline comparisons BMIs were significantly lower in the MD <strong>and</strong> none groups.Dietary assessment FFQTimingFFQ mailed to all DBNC participants in 25 th week of gestationComparison≥ 5 fruit <strong>and</strong> vegetables/day v < 5 per dayOutcomesPreterm birthResultsPreterm birth < 37 weeksOR 1.01 95% CI 0.90 to 1.14aOR 1.02 95% CI 0.90 to 1.14Early preterm birth < 35 weeksOR 1.03 95% CI 0.85 to 1.24aOR 1.02 95% CI 0.84 to 1.24Late preterm birth 35-36 weeksOR 1.01 95% CI 0.87 to 1.16aOR 1.01 95% CI 0.88 to 1.17FollowupTo birthConfoundingAdjusted for parity, BMI, maternal height, socioeconomic status <strong>and</strong> cohabitant statusRisk of bias Low risk of bias; GA based mostly on ultrasound; 0.36% missing data (127/35657)RelevanceRelevance limited by exclusion of smokers <strong>and</strong> obese womenOther commentsDietary guidelines for pregnant <strong>and</strong> <strong>breastfeeding</strong> women: evidence report398
Reference Spector 2005Dietary patterns Fruit <strong>and</strong> vegetables: VF+ = DNAt2 inhibitor containing foods (fresh <strong>and</strong> canned fruit <strong>and</strong> vegetables, canned or dried legumes, soy (either soy sauce orother soy), coffee, black tea, green tea, cocoa, red wine, <strong>and</strong> other caffeinated beverages)Study typeCase-control studyLevel of evidence III-3 (aetiology)SettingUSA (126 Children’s Oncology Groups)FundingNational Cancer Institute, USA <strong>and</strong> Children’s Cancer Research FundParticipants240 cases diagnosed during 1996 <strong>and</strong> 2002 (149 ALL <strong>and</strong> 91 AML);255 controls selected by r<strong>and</strong>om digit diallingBaseline comparisons See confounding belowDietary assessment FFQTimingAdministered to reflect entirety of pregnancyComparisonVF+ (quartiles)OutcomesInfant acute leukemia (AML) <strong>and</strong> childhood acute lymphoblastic leukemia (ALL)ResultsControls ALL cases ALL aOR (95% CI) AML cases AML aOR (95% CI) Total aOR (95% CI)Q1 53 46 1 25 1 1Q2 67 37 0.7 (0.4 to 1.2) 20 0.6 (0.3 to 1.2) 0.6 (0.4 to 1.0)Q3 68 28 0.5 (0.3 to 0.9) 27 0.8 (0.4 to 1.6) 0.6 (0.4 to 1.0)Q4 27 37 0.7 (0.4 to 1.2) 19 0.6 (0.3 to 1.2) 0.6 (0.4 to 1.0)P trend 0.09 0.18 0.05FollowupConfoundingRisk of biasRelevanceOther commentsNAAdjusted for mother’s age at birth of index child, income <strong>and</strong> education, <strong>and</strong> infant’s race <strong>and</strong> sexLow-moderate risk of bias: Of the 348 potential cases identified, 240 (69%) maternal interviews were successfully completed (missing data includedmaternal refusal (17%), physician refusal (7%), <strong>and</strong> inability to locate mother (7%);67% response rate for controlsLikely to be relevant to Australian womenFresh fruits (r = 0.66), fresh vegetables (r = 0.69) <strong>and</strong> canned vegetables (r = 0.60) were the components most highly with the VF+ indexFruit <strong>and</strong> Vegetables399
Reference Stuebe 2009Dietary patterns Fruit <strong>and</strong> vegetablesStudy typeProspective cohort study (Project Viva)Level of evidence II (aetiology)Setting8 urban <strong>and</strong> suburban obstetric offices of a multispecialty group practice in eastern Massachusetts, USAFundingUS NIH, Harvard Medical School, Harvard Pilgrim <strong>Health</strong> Care FoundationParticipants1338 women giving birth to a live singleton infant, < 22 weeks gestation at study entry; 379 (27%) were overweight (BMI ≥ 26); 703 (51%) experiencedexcessive weight gainExclusions: not fluent in EnglishBaseline comparisons See confounding belowDietary assessment FFQTimingAdministered in first <strong>and</strong> second trimesters of pregnancyComparisonFruits <strong>and</strong> vegetables (serves per day)Outcomes Excessive gestational weight gain (IOM 1990)ResultsExcessive gestational weight gain: fruits <strong>and</strong> vegetablesServes per day, medianInadequate/adequate GWG Excessive GWG aOR (95% CI)Fruit & Veg 5.84 [SD2.60] 5.90 [SD2.71] 1.03 (0.98 to 1.07)FollowupConfoundingRisk of biasRelevanceOther commentsTo birthAdjusted for pre-pregnancy BMI, maternal age, race/ethnicity, smoking status, gestational age at birth, nausea in first trimester in pregnancyLow risk of bias: Of 2083 eligible women, 1388 (67%) of women had data available for analysis (31 had missing information on pre-pregnancy BMI <strong>and</strong>gestational weight gain; 226 had missing covariate information <strong>and</strong> 438 had missing data on either first or second-trimester diet <strong>and</strong> mid-pregnancyphysical activity); included women were less likely to be African-American or Hispanic, to be younger, multiparous <strong>and</strong> obeseLikely to be relevant to Australian womenDietary guidelines for pregnant <strong>and</strong> <strong>breastfeeding</strong> women: evidence report400
ReferencesFitzsimon N, Fallon U, O'Mahony D, Loftus BG, Bury G, Murphy AW <strong>and</strong>Kelleher CC. "Mothers' dietary patterns during pregnancy <strong>and</strong> risk of asthmasymptoms in children at 3 years." Ir Med J 2007: 100(8): suppl 27-32.Haugen M, Meltzer HM, Brantsaeter AL, Mikkelsen T, Osterdal ML, Alex<strong>and</strong>erJ, Olsen SF <strong>and</strong> Bakketeig L. "Mediterranean-type diet <strong>and</strong> risk of pretermbirth among women in the Norwegian Mother <strong>and</strong> Child Cohort Study(MoBa): a prospective cohort study." Acta Obstet Gynecol Sc<strong>and</strong> 2008: 87(3):319-24.Hoppu U, Rinne M, Salo-Vaananen P, Lampi AM, Piironen V <strong>and</strong> Isolauri E."Vitamin C in breast milk may reduce the risk of atopy in the infant." Eur JClin Nutr 2005: 59(1): 123-8.Kwan ML, Jensen CD, Block G, Hudes ML, Chu LW <strong>and</strong> Buffler PA. "Maternaldiet <strong>and</strong> risk of childhood acute lymphoblastic leukemia." Public <strong>Health</strong> Rep2009: 124(4): 503-14.Li L <strong>and</strong> Werler MM. "Fruit <strong>and</strong> vegetable intake <strong>and</strong> risk of upper respiratorytract infection in pregnant women." Public <strong>Health</strong> Nutr 2010: 13(2): 276-82.Maconochie N, Doyle P, Prior S <strong>and</strong> Simmons R. "Risk factors for firsttrimester miscarriage--results from a UK-population-based case-controlstudy." BJOG 2007: 114(2): 170-86.Maconochie N, Doyle P, Prior S <strong>and</strong> Simmons R. "Risk factors for firsttrimester miscarriage--results from a UK-population-based case-controlstudy." BJOG 2007: 114(2): 170-86.Mikkelsen TB, Osler M, Orozova-Bekkevold I, Knudsen VK <strong>and</strong> Olsen SF."Association between fruit <strong>and</strong> vegetable consumption <strong>and</strong> birth weight: aprospective study among 43,585 Danish women." Sc<strong>and</strong> J Public <strong>Health</strong>2006: 34(6): 616-22.Mikkelsen TB, Osterdal ML, Knudsen VK, Haugen M, Meltzer HM, Bakketeig L<strong>and</strong> Olsen SF. "Association between a Mediterranean-type diet <strong>and</strong> risk ofpreterm birth among Danish women: a prospective cohort study." ActaObstet Gynecol Sc<strong>and</strong> 2008: 87(3): 325-30.Spector LG, Xie Y, Robison LL, Heerema NA, Hilden JM, Lange B, Felix CA,Davies SM, Slavin J, Potter JD, Blair CK, Reaman GH <strong>and</strong> Ross JA. "Maternaldiet <strong>and</strong> infant leukemia: the DNA topoisomerase II inhibitor hypothesis: areport from the children's oncology group." Cancer Epidemiol BiomarkersPrev 2005: 14(3): 651-5.Stuebe AM, Oken E <strong>and</strong> Gillman MW. "Associations of diet <strong>and</strong> physicalactivity during pregnancy with risk for excessive gestational weight gain." AmJ Obstet Gynecol 2009: 201(1): 58 e1-8.Fruit <strong>and</strong> Vegetables401
Included StudiesLegumesStudyOutcomes1. Bunin 2005 Childhood brain tumours (medulloblastoma/PNET)2. Chatzi 2008 Child persistent wheeze, atopic wheeze, atopy (all at 6.5 years)3. Giordano 2008 Hypospadias <strong>and</strong> cryptorchidism4. Jensen 2004 Childhood acute lymphoblastic leukemia5. Knox 1972 Anencephalus6. Kwan 2009 Childhood acute lymphoblastic leukemia7. Maconochie 2007 Miscarriage8. North 2000 Hypospadias9. Pierik 2004 Hypospadias <strong>and</strong> cryptorchidismDietary guidelines for pregnant <strong>and</strong> <strong>breastfeeding</strong> women: evidence report402
Evidence StatementsMaternal Outcomes1. In a case-control study from the UK, maternal intake of soy products daily duringpregnancy was not associated with first trimester miscarriage: aOR 1.06 95% CI 0.66 to1.70Congenital Anomalies2. In a Sicilian case-control study, no significant associations were seen between cases ofhypospadias <strong>and</strong>/or cryptorchidism <strong>and</strong> maternal intake of legumes3. In a cohort study from the UK, there were no significant associations between cases ofhypospadias <strong>and</strong> maternal intake of soy milk or soya meat during pregnancy, but therewas a significant positive association with maternal intake of pulses during pregnancy: OR7.56 95% CI 2.25 to 25.42 (more than 4 times a week compared with never)4. In a case-control study from the Netherl<strong>and</strong>s, cases of hypospadias <strong>and</strong> cryptorchidismwere not significantly associated with maternal intake of soy protein ≥ 20 g/day comparedwith none (OR 1.0 95% 0.5 to 2.2 <strong>and</strong> 0.6 95% CI 0.3 to 1.3 respectively)5. In a case-control study from the UK, cases of anencephalus were positively associatedwith maternal intake of dried pulses (r = +0.65 after a lag interval of nine months)Childhood Outcomes6. In a Spanish cohort study, persistent wheeze in children at 6.5 years of age wereassociated with more than 1 serve of legumes per week in mothers during pregnancy (p
9. In a North American case-control study, no significant association was seen betweenchildhood brain tumours (medulloblastoma/PNET) <strong>and</strong> maternal consumption of eitherpeas or lima beans (aOR 0.7 95% CI 0.4 to 1.2) or peanut butter (aOR 0.9 95% CI 0.6 to 1.5)315cases;315controlsIII-3 Bunin 2005Dietary guidelines for pregnant <strong>and</strong> <strong>breastfeeding</strong> women: evidence report404
Evidence TablesReference Bunin 2005Food typeLegumes: peas or lima beans; peanut butterStudy typeCase-control studyLevel of evidence III-3 (aetiology)SettingUnited States <strong>and</strong> CanadaFundingNational Cancer Institute, USAParticipants315 cases diagnosed with medulloblastoma/PNET tumours from 0 to 5 years, between 1991 to 1997 (without a previous or recurrent cancer)315 controls (r<strong>and</strong>om digit dialling, matched on area code, race <strong>and</strong> data of birth)Baseline comparisons See confounding belowDietary assessment FFQTimingTo reflect diet in the year before pregnancy; <strong>and</strong> the second trimester of pregnancyComparisonPeas or lima beans: 2/week;Peanut butter:
Reference Chatzi 2008Food typeLegumesStudy typeProspective cohort studyLevel of evidence II (aetiology)Setting Women presenting antenatal care at general practices in Menorca, a Mediterranean isl<strong>and</strong> in Spain (mid 1997 to mid 1998)FundingInstituto de Salud Carlos III red de Grupos Infancia y Media Ambiente, the Fundacio “La Caixa” , Instituto de Salud Carlos III, red de Centros deInvestigacion en Epidemiologica y Salud Publica, EU, National Center for Environmental <strong>Health</strong>, USA, the GA 2 LEN project, Ministry of Education <strong>and</strong>Science, Spain, Oficina de Ciencia y Tecnologia, Generalitat Valenciana.Participants482 children of 507 women who had attended antenatal care in MenorcaBaseline comparisons See confounding belowDietary assessment FFQTimingnot clear when women did FFQ <strong>and</strong> period of pregnancy it was intended to coverComparison≤ v > 1 serves per weekOutcomesPersistent wheeze, atopic wheeze <strong>and</strong> atopy at 6.5 yearsResultsPersistent wheeze at 6.5 yearsLow 26 (14.69%) v high 11 (10.68%) consumption; p < 0.05 (also adjusted for firstborn <strong>and</strong> lower respiratory tract infections at age 1)Atopic wheeze at 6.5 yearsLow 15 (6.79%) v high 5 (4.10); pns (also adjusted for birthweight <strong>and</strong> maternal atopy)Atopy at 6.5 yearsLow 49 (18.35%) v high 21 (14.58%) pns (also adjusted for birthweight <strong>and</strong> maternal atopy)Followup6.5 yearsConfounding Analyses adjusted for gender, maternal <strong>and</strong> paternal asthma, maternal social class <strong>and</strong> education, BMI at age 6.5 years <strong>and</strong> total energy intake at 6.5yearsRisk of biasLow risk of bias: Results from 468/482 children (97%) able to be analysed (4 incomplete data <strong>and</strong> 8 implausible values);RelevanceDiets in Menorca may differ from diets of Australian women, particularly urban womenOther commentsDietary guidelines for pregnant <strong>and</strong> <strong>breastfeeding</strong> women: evidence report406
Reference Giordano 2008Food typeLegumesStudy typeCase-control studyLevel of evidence III-3 (aetiology)SettingSicily, ItalyFundingSicilian Congenital Malformation RegistryParticipants90 cases: 43 cases of hypospadias <strong>and</strong> 48 cases of cryptorchidism (both in one infant)202 controls: r<strong>and</strong>omly selected controls born in the same year <strong>and</strong> the same regionBirths between 1998 to 2003Baseline comparisons Low birthweight, low maternal education, mother’s history of gynaecological disease <strong>and</strong> father’s history of urogenital diseases differed significantlybetween cases <strong>and</strong> controlsSee confounding belowDietary assessment Interview on maternal diet <strong>and</strong> food frequenciesTimingFFQComparisonConsumption of legumes ≤ 1 versus more than once a weekOutcomesHypospadias <strong>and</strong> cryptorchidismResultsLegumesHypospadiasCases Controls OR≤1/week 21 (48.8%) 105 (52.0%) 1.00>1/week 22* (51.2%) 96 (48.0%) 1.15 95% CI 0.59 to 2.21Cryptorchidism≤1/week 31 (64.6%) 105 (52.0%) 1.00>1/week 17 (35.4%) 96 (48.0%) 0.60 95% CI 0.31 to 1.15Hypospadias <strong>and</strong>cryptorchidism≤1/week 52 (57.7%) 105 (52.0) 1.00>1/week 38 (42.2%) 96 (48.0%) 0.80 95% CI 0.48 to 1.32* reported as 2 in paperFollowupConfoundingRisk of biasRelevanceOther commentsn/aResults for this food group were not presented as adjusted analysesModerate risk of bias: Participation rate of parents <strong>and</strong> data collection rate of cases was lower than that of controls (76% versus 91%); no adjustedresults presented for this food groupLikely to be reasonably relevant for Australian women, although hypospadias rates very high <strong>and</strong> unlikely that most Australian women will have suchhigh pesticide exposureRagusa region in Sicily is a region of intensive agriculture (involving high rates of pesticide <strong>and</strong> other chemical use) with high rates of hypospadias <strong>and</strong>cryptorchidismLegumes407
Reference Jensen 2004Food typeLegumes: beans as a group (string beans or peas); baked beans, kidney beans, chilli beans, bean soup, tofu, bean curd, soy milk, peanuts; individualtypes (tofu, peanuts <strong>and</strong> peanut butter (also in nuts), string beans or peas (also in vegetables))Study typeCase controlLevel of evidence III-3 (aetiology)SettingCalifornia, USA (part of the Northern California Childhood Leukemia Study)FundingPHSParticipants138 matched cases <strong>and</strong> controls:Cases: Children under 15 years of age, with a parent who spoke English or Spanish, were resident in the study area at the time of diagnosis of acutelymphoblastic leukemia (ALL), with no prior diagnosis of cancerControls: identified from birth certificates matched to the case on date of birth, sex, maternal race, Hispanic ethnicity of mother or father, <strong>and</strong> county ofresidence at birthBaseline comparisons A priori potential confounders were identified as birthweight, <strong>breastfeeding</strong>, maternal age <strong>and</strong> education, parental occupation <strong>and</strong> smoking duringpregnancy – no evidence of confounding was seen for these variables. Also see Confounding below.Dietary assessment FFQTimingDietary intake to reflect the year before the index pregnancy (to indicate dietary status at the start of pregnancy)ComparisonServes of legumesOutcomesChildhood acute lymphoblastic leukemiaResultsBeans as a group: aOR 0.83 95% CI 0.70 to 0.99: mean consumption 4.14 [SD 2.07] serves per day*String beans or peas:Tofu:aOR 0.84 95% CI 0.71 to 1.00: mean consumption 3.40 [SD 1.81] serves per dayaOR 1.00 95% CI 0.76 to 1.31: mean consumption 1.36 [SD 1.05] serves per dayPeanuts, peanut butter: aOR 1.00 95% CI 0.86 to 1.18: mean consumption 2.99 [SD 1.89] serves per dayFollowupConfoundingRisk of biasRelevanceOther commentsn/aAnalyses were adjusted for variables previously shown to be significantly associated with ALL in the overall study – income, prior fetal loss, child’sexposure to other children under age five, <strong>and</strong> maternal exposure to indoor insecticides during pregnancy; along with portion size <strong>and</strong> energyconsumptionLow-moderate risk of bias: Of eligible cases identified from January 1995 to November 1999, 83% consented to participate; 69% of the eligible controlsagreed to participate. Of the 161 matched pairs, seven pairs were excluded as the respondent was not the biological mother, 16 pairs were excludeddue to questionable dietary questionnaire data, leaving 138 matched pairs (86%); some recall bias likelyLikely to be relevant for Australian women, though some diet components may differ e.g. high bean consumption*Some consumption levels seem high – possibly per week rather than per day?Dietary guidelines for pregnant <strong>and</strong> <strong>breastfeeding</strong> women: evidence report408
Reference Knox 1972Food typeLegumes: dried pulsesStudy typeCase control (cases matched to food consumption at population level for a particular period) – numbers not reportedLevel of evidence III-3 (aetiology)SettingBirmingham, UKFundingNot reportedCases Stillbirths <strong>and</strong> infant deaths due to anencephalus between 1961 <strong>and</strong> 1967Baseline comparisons n/aDietary assessment Population surveysTimingEach quarterComparisonMonthly stillbirths <strong>and</strong> infant deaths due to anencephalus matched to quarterly consumption of main food stuffs (in previous five to nine months)OutcomesAnencephalusResultsDried pulses positively associated with cases of anencephalus: r = +0.65 after a lag interval of nine monthsFollowupConfoundingRisk of biasRelevanceOther commentsn/aAnalyses were not adjustedHigh risk of bias: links between population consumption of foods <strong>and</strong> anencephalus very distal <strong>and</strong> no control for potential confoundersLikely to differ from a modern Australian dietFood consumption of total population not likely to reflect food consumption of pregnant women; <strong>and</strong> will not be able to reflect differences between dietsof individual or specific groupsLegumes409
Reference Kwan 2009Food typeLegumes: string beans or peas; beans (such as baked beans, kidney beans, beans in chilli, burritos or soup); tofu, bean curd, soy milk, peanuts, peanutbutterStudy typeCase controlLevel of evidence III-3 (aetiology)Setting California, USA (part of the Northern California Childhood Leukemia Study – phase 1 <strong>and</strong> 2 (phase 1 reported in Jensen 2004)FundingPHS; Paul O’Gorman Foundation for Children with LeukemiaParticipants866 individuals - 282 matched cases <strong>and</strong> controls (205 pairs <strong>and</strong> 77 trios):Cases: Children under 15 years of age, with a parent who spoke English or Spanish, were resident in the study area at the time of diagnosis of acutelymphoblastic leukemia (ALL), with no prior diagnosis of cancerControls: identified from birth certificates matched to the case on date of birth, sex, maternal race, Hispanic ethnicity of mother or father, <strong>and</strong> county ofresidence at birth (in phase 1 (1995-99) only due to concerns about overmatching on potential environmental exposures linked to leukemia risk)Data collected from August 1995 to November 2002Baseline comparisons A priori potential confounders were identified as birthweight, <strong>breastfeeding</strong>, maternal age <strong>and</strong> education, <strong>and</strong> smoking during pregnancy.Also see Confounding below.Dietary assessment FFQTimingDietary intake to reflect the year before the index pregnancy (to indicate dietary status at the start of pregnancy)ComparisonServes of beansOutcomesChildhood acute lymphoblastic leukemiaResultsLegumes: aOR 0.75 95% CI 0.59 to 0.95 (median daily intake 0.5 (25 th , 75 th percentile 0.3 to 0.8)Beans:aOR 0.86 95% CI 0.74 to 0.99 (median serves not reported)Fibre from beans (g): aOR 0.91 95% CI 0.73 to 1.13 (median daily intake 2.08 (25 th , 75 th percentile 0.87 to 4.37)FollowupConfoundingRisk of biasRelevanceOther commentsn/aAnalyses were adjusted for total energy intake, household income, indoor insecticide exposure during pregnancy; <strong>and</strong> proportion of foods reported aslarge or extra-large portion sizeAlso adjusted for child’s diet, with little effect seen on resultsLow-moderate risk of bias: Of eligible cases identified from January 1995 to November 2002, 86% consented to participate; 56% of the eligible controlsagreed to participate. 190 participants excluded: leukemia diagnosis was not ALL (n = 127); no dietary data (n = 4); a case or a control respondent wasnot the biological mother (n = 14), questionable dietary questionnaire data (n = 45), leaving 282 matched sets (86%).Likely to be relevant for Australian women, though some diet components may differ e.g. high bean consumptionRegular use of any dietary supplement was not associated with risk of ALL.Dietary guidelines for pregnant <strong>and</strong> <strong>breastfeeding</strong> women: evidence report410
Reference Maconochie 2007Food groupsLegumes (soy products)Study typeCase-control study (postal survey sampled from the electoral roll – National Women’s <strong>Health</strong> Study)Level of evidence III-3 (aetiology)SettingUK general populationFundingNational Lottery Community Fund, Miscarriage AssociationParticipantsCases: 603 women aged 18 to 55 years whose most recent pregnancy had ended in first trimester miscarriage (< 13 weeks gestation);Controls: 6116 women aged 18 to 55 years whose most recent pregnancy had progressed beyond 12 weeksBaselineComparisonsBMI < 18.5 was significantly associated with odds of miscarriageAlso see Confounding belowDietary Assessment questionnaireTimingDiet in the three months prior to conception <strong>and</strong> the first 12 weeks of pregnancyComparisonDaily or most daysOutcomesFirst trimester miscarriageResultsSoy products daily or most daysCases Controls aOR (95% CI) aOR further adjusted for nauseaNo 566 (97%) 5783 (97%) 1.00 1.00Yes 20 (3%) 175 (3%) 0.99 (0.61 to 1.59) 1.06 (0.66 to 1.70)Length of followup n/aConfoundingAdjusted for year of conception, maternal age, previous miscarriage <strong>and</strong> previous live birth; <strong>and</strong> further adjusted for nausea in the first 12 weeks ofpregnancyRisk of bias Low risk of bias: 88% of eligible women responding to stage 1 agreed to participate in the second stage of the study; <strong>and</strong> 71% responded to the stage 2questionnaire. 1071/7790 records (7508 women) were excluded (mostly due to index pregnancy being conceived prior to 1980), leaving 6719 records(86%) available for analysisRelevanceLikely to be relevant to Australian womenOther comments Women who suffered from nausea in the first 12 weeks of pregnancy were almost 70% less likely to miscarryLegumes411
Reference North 2000Dietary patterns Legumes (soy milk, pulses, soya ‘meat’)Study typeProspective cohort studyLevel of evidence II (aetiology)SettingBristol, UK (part of ALSPAC <strong>and</strong> the WHO initiated European Longitudinal Study of Pregnancy <strong>and</strong> Childhood)FundingMRC, Wellcome Trust, Department of <strong>Health</strong>, Department of the Environment, MAFF, Nutricia, Nestle <strong>and</strong> other companies, BBCParticipants7928 boys born to women between April 1991 <strong>and</strong> December 1992; with 51 cases of hypospadias (= 64 per 10,000 male births)Baseline comparisons Mothers who had influenza during pregnancy; <strong>and</strong> mothers who took codeine in the first trimester in pregnancy had high rates of hypospadias in theirmale offspringDietary assessment Whether currently vegetarian (i.e. during pregnancy) or had previously been soTimingQuestionnaires at 8, 18 <strong>and</strong> 32 weeks gestation (this assessed current dietary behaviour); <strong>and</strong> at various ages of the childComparisonSee Results belowOutcomesHypospadiasResultsCases (%)OR (95% CI)Soy milk (n = 6296)Yes (1.4%) 2 (2.2) 3.67 (0.87 to15.44)No (94.9%) 38 (0.6) ReferencePulses (n = 6251)Never (76.7%) 30 (0.6) ReferenceOnce/2 weeks (14.3%) 4 (0.4) 0.72 (0.25 to 2.041-3/weel (8.0%) 4 (0.8) 1.28 (0.45 to 3.64)4+/week (1.1%) 3 (4.5%) 7.56 (2.25 to 25.42)Soya meat (n = 6189)Never (92.3%) 36 (0.6) ReferenceOnce/2 weeks (5.1%) 2 (0.6) 1.01 (0.24 to 4.22)1+/week (2.7%) 3 (1.8) 2.95 (0.90 to 9.68)FollowupConfoundingRisk of biasRelevanceOther commentsTo diagnosis of hypospadiasAnalyses were not adjustedModerate risk of bias: analyses were not adjusted for potentially important confounders; numbers of missing cases differ by outcome (no explanationsgiven)Likely to be reasonably relevant to Australian womenAuthors hypothesise a possible link between phytoestrogens <strong>and</strong> hypospadias; could be pesticides, foods such as soyOmnivorous women who took iron supplements had increased risk of hypospadias in their male offspringDietary guidelines for pregnant <strong>and</strong> <strong>breastfeeding</strong> women: evidence report412
Reference Pierik 2004Food typeSoy proteinStudy type Case-control study (1999-2001)Level of evidence III-3SettingRotterdam, Netherl<strong>and</strong>sFundingEndocrine Modulators Study Group of the European Chemical Industry Council <strong>and</strong> Nutricia Research FoundationParticipantsCases: 78 cryptorchidism <strong>and</strong> 56 hypospadias cases (diagnosed at first child health visit)Controls: 313 controls= 443 mother-child pairs (including four boys with both abnormalities)Baseline comparisons See confounding belowDietary assessment Phyto-oestrogen specific food questionnaireTimingDuring index pregnancyComparison≥ 20 g/day versus > 0 to 20 g/day versus 0 g/day of soy proteinOutcomesCryptorchidism <strong>and</strong> hypospadiasResultsCryptorchidismCases Controls OR (95% CI)≥20 g/day 8 51 0.6 (0.3 to 1.3)>0 to 20 g/day 12 41 1.1 (0.6 to 2.3)0 g/day 58 221 1.0Hypospadias≥20 gday 9 51 1.0 (0.5 to 2.2)>0 to 20 g/day 8 41 1.1 (0.5 to 2.5)0 g/day 39 221 1.0FollowupConfoundingRisk of biasRelevanceOther commentsNAOnly univariate (unadjusted) analysis presentedModerate risk of bias: Participation rate was 85% for cases <strong>and</strong> 68% for controls; analyses were unadjusted for potential confoundersReasonably relevant to Australian women although likely to be different ethnic mixLegumes413
ReferencesBunin GR, Kushi LH, Gallagher PR, Rorke-Adams LB, McBride ML <strong>and</strong> Cnaan A."Maternal diet during pregnancy <strong>and</strong> its association with medulloblastoma inchildren: a children's oncology group study (United States)." Cancer CausesControl 2005: 16(7): 877-91.Chatzi L, Torrent M, Romieu I, Garcia-Esteban R, Ferrer C, Vioque J, KogevinasM <strong>and</strong> Sunyer J. "Mediterranean diet in pregnancy is protective for wheeze<strong>and</strong> atopy in childhood." Thorax 2008: 63(6): 507-13.Giordano F, Carbone P, Nori F, Mantovani A, Taruscio D <strong>and</strong> Figa-Talamanca I."Maternal diet <strong>and</strong> the risk of hypospadias <strong>and</strong> cryptorchidism in theoffspring." Paediatr Perinat Epidemiol 2008: 22(3): 249-60.Jensen CD, Block G, Buffler P, Ma X, Selvin S <strong>and</strong> Month S. "Maternal dietaryrisk factors in childhood acute lymphoblastic leukemia (United States)."Cancer Causes Control 2004: 15(6): 559-70.Kwan ML, Jensen CD, Block G, Hudes ML, Chu LW <strong>and</strong> Buffler PA. "Maternaldiet <strong>and</strong> risk of childhood acute lymphoblastic leukemia." Public <strong>Health</strong> Rep2009: 124(4): 503-14.Maconochie N, Doyle P, Prior S <strong>and</strong> Simmons R. "Risk factors for firsttrimester miscarriage--results from a UK-population-based case-controlstudy." BJOG 2007: 114(2): 170-86.North K <strong>and</strong> Golding J. "A maternal vegetarian diet in pregnancy is associatedwith hypospadias. The ALSPAC Study Team. Avon Longitudinal Study ofPregnancy <strong>and</strong> Childhood." BJU Int 2000: 85(1): 107-13.Pierik FH, Burdorf A, Deddens JA, Juttmann RE <strong>and</strong> Weber RF. "Maternal <strong>and</strong>paternal risk factors for cryptorchidism <strong>and</strong> hypospadias: a case-controlstudy in newborn boys." Environ <strong>Health</strong> Perspect 2004: 112(15): 1570-6.Knox EG. "Anencephalus <strong>and</strong> dietary intakes." Br J Prev Soc Med 1972: 26(4):219-23.Dietary guidelines for pregnant <strong>and</strong> <strong>breastfeeding</strong> women: evidence report414
MeatIncluded StudiesStudyOutcomes1. Akre 2008 Hypospadias2. Bunin 2006; 2005 Childhood brain tumours (medullobastomas <strong>and</strong> PNET)3. Bunin 1993 Childhood brain tumours (PNET)4. Chatzi 2008 Child persistent wheeze, atopic wheeze, atopy (all at 6.5 years)5. George 2005 “Breastfeeding”6. Giordano 2010 Child hypospadias7. Giordano 2008 Child hypospadias <strong>and</strong> cryptorchidism8. Godfrey 1996 Placental weight, birthweight9. Haugen 2008 Preterm birth10. Jensen 2004 Childhood acute lymphoblastic leukemia11. Jones 2000 Bone mass at 8 years12. Knox 1972 Anencephalus13. Kwan 2009 Childhood acute lymphoblastic leukemia14. Lamb 2008 Islet autoimmunity up to 15 years15. Latva-Pukkila 2009 Nausea <strong>and</strong> vomiting in pregnancy16. Maconochie 2007 Miscarriage17. Mikkelsen 2008 Preterm birth18. Mitchell 2004 SGA19. Miyake 2009 Infant wheeze <strong>and</strong> eczema up to 24 months20. Miyake 2006 Postpartum depression21. Peters 1994 Childhood leukemia22. Petridou 2005 Childhood acute lymphoblastic leukemia23. Petridou 1998 Cerebral palsy at 8 years24. Pogoda 2009 Childhood brain tumours25. Pogoda 2001 Childhood brain tumours (updated analysis of Preston-Martin 1996 which is part of Pogoda 2009)26. Radesky 2008 GDM, IGT27. Saito 2010 Suspected atopic eczema28. Sarasua 1994 Childhood brain tumours29. Shiell 2001 BP in offspring at 27-30 years of ageMeat415
30. Stuebe 2009 GWG31. Yin 2010 Bone mass at 16 years32. Zhang 2006 GDMDietary guidelines for pregnant <strong>and</strong> <strong>breastfeeding</strong> women: evidence report416
Evidence SummariesMaternal Outcomes1. In a US cohort study, maternal intake of meat during pregnancy was not associated withimpaired glucose tolerance (IGT) or gestational diabetes mellitus (GDM): Red meat (per weekly serving): aOR 1.01 95% 0.95 to 1.08 for IGT <strong>and</strong> aOR 1.01 95% CI 0.91 to1.12 Processed meat (per weekly serving): aOR 1.02 95% CI 0.94 to 1.10 for IGT <strong>and</strong> aOR 0.95 95%CI 0.85 to 1.062. In a US cohort study, maternal intake of meat in the previous year was significantlyassociated with GDM: Red meat: p for trend (adjusted) across 1 serve per week to 1 serve per day = 0.006 Processed meat: p for trend (adjusted) across 1 serve per week to 1 serve per day = 0.049 Bacon: p for trend (adjusted) across 1 serve per week to 1 serve per day = 0.002 Hot dogs: p for trend (adjusted) across 1 serve per week to 1 serve per day = 0.02 Sausages, salami, bologna: p for trend (adjusted) across 1 serve per week to 1 serve per day =< 0.00013. In a US cohort study, maternal intake of red <strong>and</strong> processed meats during pregnancy wasnot significantly associated with excessive gestational weight gain: aOR 1.00 95% CI 0.74to 1.344. In a UK case-control study, maternal intake of red meat twice weekly or more duringpregnancy was not significantly associated with miscarriage: aOR 1.03 95% CI 0.86 to 1.265. In a Finnish cohort study, nausea <strong>and</strong> vomiting during pregnancy was significantlyassociated with reduced subsequent daily maternal intake of meat products duringpregnancy (p = 0.004)Congenital Anomalies6. In a Sc<strong>and</strong>inavian case-control study, less than weekly maternal meat consumption duringpregnancy compared with weekly meat consumption was associated with an increasedrisk of hypospadias in baby boys: aOR 2.4 95% CI 1.1 to 4.97. In a case-control study from Rome, Italy, rare versus frequent (once a week) maternalconsumption of liver or offal during pregnancy was not associated with hypospadias: aOR1.69 95% CI 0.63 to 4.55MeatN Level References1773 II Radesky 200813,110 II Zhang 20061338 II Stuebe 2009603 cases;6116controlsIII-3 Maconochie 2007256 II Latva-Pukkila 2009292 cases;427 controls80 cases;80 controlsIII-3 Akre 2008III-3 Giordano 20108. In a case-control study from Sicily, Italy: 90 cases; III-3 Giordano 2008417
Maternal consumption of red meat once a week or less during pregnancy compared withmore than once a week was not significantly associated with hypospadias or cryptorchidism;OR 0.59 95% CI 0.29 to CI 1.17 Maternal consumption of liver <strong>and</strong> other offal more than once a week during pregnancycompared less than once a week was significantly associated with cryptorchidism (aOR 5.2195% CI 1.26 to 21.50) but not hypospadias (aOR 4.07 95% CI 0.92 to 17.99)9. In a UK case-control study total maternal meat consumption, pork, <strong>and</strong> meat (<strong>and</strong>vegetable) extracts during pregnancy were negatively associated with cases ofanencephalus, whereas maternal consumption of mutton <strong>and</strong> lamb, <strong>and</strong> corned meatduring pregnancy were positively associated with cases of anencephalusBirth Outcomes10. In a New Zeal<strong>and</strong> case-control study, no significant association was seen between SGA <strong>and</strong>meat intake at the time of conception (p = 0.79) or in the last month of pregnancy (p =0.66)11. In a Norwegian cohort study, no significant association was seen between preterm birth<strong>and</strong> meat intake during pregnancy (≤ 2 versus > 2 serves a week): aOR 1.09 95% CI 0.93 to1.2812. In a Danish cohort study, no significant association was seen between preterm birth <strong>and</strong>meat intake during pregnancy (≤ 2 versus > 2 serves a week): aOR 0.92 95% CI 0.81 to 1.0513. In a UK cohort study, no significant association was seen between placental weight <strong>and</strong>meat intake during pregnancy, but birthweight fell by 3.1 g (95% CI 0.3 g to 6.0 g; p = 0.03)for each g decrease in meat protein in late pregnancyBreastfeeding Associations/Outcomes14. In a US study, lactating women consumed significantly less beef <strong>and</strong> more chicken thannon-lactating women (14.8% v 4.1% of women, p < 0.035) <strong>and</strong> also less hamburgers <strong>and</strong>meatloafPostpartum Depressive Symptoms15. In a Japanese cohort study, no significant association was seen between maternal meatintake during pregnancy <strong>and</strong> postpartum depressionChildhood – Eczema And Other Allergy Outcomes16. In a Japanese cohort study, maternal meat intake during pregnancy was associated withsignificantly increased risk of suspected infant atopic eczema at 3-4 months: 63.6 versus 33.4 g/day of meat: aOR 2.41 95% CI 1.06 to 5.75 89.8 versus 33.4 g/day of meat: aOR 2.59 95% CI 1.15 to 6.17202 controlsNotreportedIII-3 Knox 19721138 III-3 Mitchell 200426,563 II Haugen 200835,350 II Mikkelsen 2008538 II Godfrey 1996149 II George 2005865 II Miyake 2006771 II Saito 2010Dietary guidelines for pregnant <strong>and</strong> <strong>breastfeeding</strong> women: evidence report418
17. In a follow-up study of Saito 2009, no associations were seen between meat intake during 763 II Miyake 2009pregnancy <strong>and</strong> either infant eczema or wheeze at 16-24 months (p for trend = 0.28 <strong>and</strong>0.22 respectively)18. In a Spanish cohort study, no associations were seen between meat intake in pregnancy 482 children II Chatzi 2008<strong>and</strong> persistent wheeze, atopic wheeze or atopy at 6.5 yearsOther Childhood/Adult Outcomes19. In a US case-control study, childhood acute lymphoblastic leukemia was not generally 276III-3 Jensen 2004associated with maternal intake of meat (cured or not cured) during pregnancy, except fora reduced risk with increased beef consumption: aOR 0.80 95% CI 0.66 to 0.99children(138 pairs)20. In a later US case-control study (which included Jensen 2004), childhood acute866 children III-3 Kwan 2009lymphoblastic leukemia was not generally associated with maternal intake of meat,except for a reduced risk with increased beef consumption:(205 pairs Cured meat: aOR 0.91 95% CI 0.78 to 1.05: median consumption 0.3 (25 th 75 th percentiles 0.1,0.5) serves per day<strong>and</strong> 77 trios) Beef: aOR 0.82 95% CI 0.69 to 0.98 (number serves per day not reported)21. In a Greek case-control study, maternal consumption of meat <strong>and</strong> meat products during 131 cases; III-3 Petridou 2005pregnancy was significantly associated with acute lymphoblastic leukemia in theirchildren: aOR 1.25 95% CI 1.09 to 1.57 for each more quintile of meat/meat products(median consumption of 61 g/day in the highest quintile)131 controls22. In a US case-control study, maternal meat intake (breakfast meats, luncheon meats, hot 232 cases; III-3 Peters 1994dogs, charcoal broiled meats) during pregnancy was not significantly associated with riskof childhood leukemia232 controls23. In an international case-control study, risk of childhood brain tumours were significantlyassociated with increased maternal intake of cured meat (aOR 1.51 95% CI 1.1 to 2.1) butno association was seen with noncured meat (p for trend 0.19)(in a subset of 540 cases <strong>and</strong> 801 controls, increased maternal intake of nitrite from cured1281 cases;2223controlsIII-3 Pogoda 2009(Pogoda 2001)meats was significantly associated with childhood brain tumours)24. In a North American case-control study, risk of medulloblastoma/PNET in children up to 6 630 children III-3 Bunin 2006years was not associated with maternal meat consumption during pregnancy:(315 pairs) Cured meat aOR 0.9 95% CI 0.6 to 1.5 periconception; aOR 0.6 95% CI 0.2 to 1.9midpregnancy : < 2 serves/week compared with > 5 serves/week(This result varied little if smoked fish was included; or whether vitamin supplements werebeing taken or not)25. In a North American case-control study, PNET in children up to the age of six years was 166 cases; III-3 Bunin 1993Meat419
not associated with maternal consumption of cured meats, with possible exception ofbacon: Cured meats overall; p trend over quartiles = 0.77 Bacon at least once a week versus less than once a week OR 1.71 95% CI 1.02 to 2.8926. In a US case-control study: no significant associations were seen between maternal intake of ham, bacon, sausage, hotdogs, hamburgers, lunch meats <strong>and</strong> charcoal-broiled foods during pregnancy <strong>and</strong> risk ofchildhood acute lymphoblastic leukemia; lymphomas or soft tissue sarcoma no significant associations were seen between maternal intake of ham, bacon, sausage,hamburgers <strong>and</strong> charcoal-broiled foods <strong>and</strong> risk of childhood brain tumours maternal intake of hot dogs (any versus none) during pregnancy was associated with anincreased risk of childhood brain tumours: aOR 2.3 95% CI 1.0 to 5.4 maternal intake of lunch meats during pregnancy was associated with a decreased risk ofchildhood brain tumours: aOR 0.4 95% CI 0.2 to 0.827. In a Greek case-control study, cerebral palsy in children at 8 years was associated withincreased maternal meat intake during pregnancy: Regression analysis for each unit of consumption of meat once per day:aOR 1.42 95% CI 1.07 to 1.88 (additionally adjusted for all food groups)28. In a US cohort study, no significant association was seen between maternal meat intakeduring pregnancy <strong>and</strong> islet autoimmunity in children up to 15 years of age: aHR 0.91 95%CI 0.54 to 1.5129. In one Australian cohort study, bone mineral density of children at 8 years was notassociated with maternal meat intake during pregnancy: Total body bone mineral density – p = 0.65 for adjusted regression of portions per week30. In an Australian cohort study (follow-up of Jones 2000) bone mass in 16 year-oldadolescents was not associated with maternal meat intake during pregnancy: Total body bone mineral density r 2 0.3324; ß +6.1.3 (pns) for adjusted regression of portionsper week31. In a cohort study from Scotl<strong>and</strong>, systolic blood pressure was significantly increased in 27to 30 year old offspring of women with high meat intake during pregnancy (in conjunctionwith a low carbohydrate diet): ß 0.21 95% CI 0.04 to 0.37, p = 0.01166 controls234 cases;206 controls109 cases;246 controlsIII-3 Sarasua 1994III-3 Petridou 1998642 children II Lamb 2008173 children II Jones 2000216 children II Yin 2010626 adultoff-springII Shiell 2001Dietary guidelines for pregnant <strong>and</strong> <strong>breastfeeding</strong> women: evidence report420
Evidence TablesReference Akre 2008Food typeMeatStudy typeCase-control studyLevel of evidence III-3 (aetiology)Setting Sweden <strong>and</strong> Denmark from 2000 to 2005FundingEuropean Chemical Industry CouncilParticipants292 cases427 controlsBaseline comparisons See confounding belowDietary assessment QuestionnaireTimingQuestionnaire completed by mother when son was 2 months old in Sweden <strong>and</strong> when 6 months old in DenmarkComparisonNo weekly meat consumption versus weekly meat consumptionOutcomesHypospadiasResultsHypospadiasNo weekly meat consumption versus weekly meat consumptionaOR 2.4 95% CI 1.1 to 4.9FollowupConfoundingRisk of biasRelevanceOther commentsn/aAnalyses adjusted for maternal age, maternal pre-pregnancy BMI, maternal education, contraceptive use at conception, proteinuria, maternal nausea inthe index pregnancy, passive maternal exposure to tobacco smoke during index pregnancy, fish consumption; weight for gestational age, gestationalage at birth; neonatal jaundiceLow risk of bias: response rate was 88% for cases <strong>and</strong> 81% for controls; ascertainment of cases of hypospadias likely to be high.Likely to be reasonably similar for the small number of Australian women who do not consume meat (or meat or fish) during pregnancyDifferent recruitment methods were used in Sweden <strong>and</strong> DenmarkMeat421
Reference Bunin 2006 (<strong>and</strong> Bunin 2005)Food typeMeatStudy typeCase-control studyLevel of evidence III-3 (aetiology)SettingUnited States <strong>and</strong> CanadaFundingNational Cancer Institute, USAParticipants315 cases diagnosed with medulloblastoma/PNET tumours from 0 to 5 years, between 1991 to 1997 (without a previous or recurrent cancer)315 controls (r<strong>and</strong>om digit dialling, matched on area code, race <strong>and</strong> data of birth)Baseline comparisons See confounding belowDietary assessment FFQTimingTo reflect diet in the year before pregnancy; <strong>and</strong> the second trimester of pregnancyComparison1 serve/week;data on portion size were not collectedOutcomesChildhood brain tumours (medulloblastoma/primitive neuroectodermal tumours (PNET)ResultsMedulloblastoma/PNETPericonceptionMidpregnancyN aOR* (95% CI) N aOR* (95% CI)Ham1/wk 84 0.9 (0.5 to 1.8) 86 0.9 (0.5 to 1.8)P trend 0.58 0.54Lunchmeat1/wk 74 1.0 (0.5 to 1.8) 74 0.9 (0.6 to 1.6)P trend 0.86 0.75Hot dogs
Reference Bunin 1993Food typeCured meats; bacon, sausage, hot dogs, ham, lunch meatStudy typeCase control study (Children’s Cancer Group)Level of evidence III-3 (aetiology)SettingNorth AmericaFundingNIH, Japan National Committee of the International Union against Cancer, Olympus Optical Company, International Agency for Research on Cancer,WHO.Participants 166 cases (children diagnosed with primitive neuroectodermal brain tumours (PNET) before the age of six years from 1986 to 1989);166 matched controlsBaseline comparisons See confounding belowDietary assessment FFQTimingDuring pregnancyComparisonConsumption at least once per week versus less than once a week; <strong>and</strong> quartiles of consumptionOutcomesPNETResultsCured meats overall (by quartile of consumption):1 st OR 1.002 nd OR 0.83 95% CI 0.47 to 1.483 rd OR 0.90 95% CI 0.50 to 1.604 th OR 1.10 95% CI 0.60 to 2.03P trend 0.77Consumption of cured meats at least once per week versus less than once a week:OR (95% CI)Bacon: 1.71 (1.02 to 2.89)Sausage: 1.44 (0.81 to 2.56)Hot dogs: 1.00 (0.59 to 1.70)Ham: 0.77 (0.41 to 1.41)Lunch meat: 0.92 (0.55 to 1.53)FollowupConfoundingRisk of biasRelevanceOther commentsn/aAnalyses for individual food groups were not adjusted for potential confoundersModerate risk of bias: 116 cases (41%) included from 281 potentially eligible childrenLikely to be reasonably similar to diets of Australian womenNearly all case <strong>and</strong> control mothers took multivitamins during their pregnancies;Diet <strong>and</strong> supplemental vitamin use in child’s first year of life was also recordedMeat425
Reference Chatzi 2008Food typeRed meatStudy typeProspective cohort studyLevel of evidence II (aetiology)Setting Women presenting antenatal care at general practices in Menorca, a Mediterranean isl<strong>and</strong> in Spain (mid 1997 to mid 1998)FundingInstituto de Salud Carlos III red de Grupos Infancia y Media Ambiente, the Fundacio “La Caixa” , Instituto de Salud Carlos III, red de Centros deInvestigacion en Epidemiologica y Salud Publica, EU, National Center for Environmental <strong>Health</strong>, USA, the GA 2 LEN project, Ministry of Education <strong>and</strong>Science, Spain, Oficina de Ciencia y Tecnologia, Generalitata Valenciana.Participants482 children of 507 women who had attended antenatal care in MenorcaBaseline comparisons See confounding belowDietary assessment FFQTimingnot clear when women did FFQ <strong>and</strong> period of pregnancy it was intended to coverComparison≥ 3.5 v < 3.25 serves of red meat a weekOutcomesPersistent wheeze, atopic wheeze <strong>and</strong> atopy at 6.5 yearsResultsPersistent wheeze at 6.5 yearsLow 17 (16.50%) v high 20 (11.30%); pns (also adjusted for firstborn <strong>and</strong> lower respiratory tract infections at age 1)Atopic wheeze at 6.5 yearsLow 9 (7.63%) v high 11 (4.89%); pns (also adjusted for birthweight <strong>and</strong> maternal atopy)Atopy at 6.5 yearsLow 23 (16.31%) v high 47 (17.41%) pns (also adjusted for birthweight <strong>and</strong> maternal atopy)Followup6.5 yearsConfounding Analyses adjusted for gender, maternal <strong>and</strong> paternal asthma, maternal social class <strong>and</strong> education, BMI at age 6.5 years <strong>and</strong> total energy intake at 6.5yearsRisk of biasLow risk of bias: Results from 468/482 children (97%) able to be analysed (4 incomplete data <strong>and</strong> 8 implausible values);RelevanceDiets in Menorca may differ from diets of Australian women, particularly urban womenOther commentsDietary guidelines for pregnant <strong>and</strong> <strong>breastfeeding</strong> women: evidence report426
Reference George 2005Food typeMeat (beef, chicken)Study typeProspective cohort studyLevel of evidence II (aetiology)SettingTexas, USFundingNot reportedParticipants149 Medicaid-qualified women (30% white, 24% African American, 46% Hispanic) – recruited from a larger study on postpartum weight retentionInclusion criteria: 18 years or older; non-Hispanic white, African American or Hispanic ethnicity; birth of a health term infant, fluency <strong>and</strong> literacy inEnglish; absence of pregnancy-related abnormalities <strong>and</strong> disease conditions.Baseline comparisons Significant differences between lactating <strong>and</strong> non-lactating women – higher parity, BMI <strong>and</strong> lower education levels in non-lactating women.Dietary assessment Semiquantitative FFQ to cover pregnancy <strong>and</strong> first six months postpartumTimingFFQ administered at 6 weeks <strong>and</strong> 6 months postpartumComparisonProportion of consumption of different types of meatsOutcomesBreastfeeding (exclusive or partial at 6 months postpartum)Results Lactating women consumed significantly more chicken <strong>and</strong> less beef than non-lactating women (14.8% v 4.1% of women; p < 0.035)FollowupConfoundingRisk of biasRelevanceOther commentsLactating women consumed significantly less hamburgers <strong>and</strong> meatloaf; beef steak <strong>and</strong> roasts than nonlacatating women6 months postpartumNo adjustment for potential confoundingModerate-to-high risk of bias; no attempt to control for confounding despite significant baseline differences between lactating <strong>and</strong> non-lactating women.Possibly relevant to low-income women in AustraliaMinimal reporting of resultsMeat427
Reference Giordano 2010Food typeMeatStudy typeCase-control studyLevel of evidence III-3 (aetiology)SettingRome, ItalyFundingNot reportedParticipants80 cases of hypospadias requiring surgical treatment in children aged 0 to 24 months (mean age 57.62 weeks)80 controls: healthy males without any congenital defect, aged 0 to 24 months (mean age 36.52 weeks);recruited between September 2005 <strong>and</strong> May 2007Baseline comparisons See confounding belowDietary assessment Interview on ‘typical’ maternal diet habits in relation to the index pregnancy <strong>and</strong> food frequenciesTimingFFQ administered on recruitment for mothers of cases <strong>and</strong> during vaccination visits for mothers of controlsComparisonRare versus frequent consumption of liver or offal (once a week)OutcomesHypospadiasResultsLiver, offalCases Controls OR aORRare 66 (82.5%) 72 (90.0%) 1.00 1.00Frequent 14 (17.5%) 8 (10.0%) 1.91 95% CI 0.75 to 4.84 1.69 95% CI 0.63 to 4.55FollowupConfoundingRisk of biasRelevanceOther commentsn/aAdjusted for mother’s BMI at conception <strong>and</strong> education of the father;Gestational age, birthweight <strong>and</strong> SGA were not included among the covariates in the regression models, as they may share a common aetiology withhypospadiasModerate risk of bias: Participation rate of parents of cases was higher than that of controls (85% versus 70%); very few potential confounders used inadjusted analysesLikely to be reasonably relevant for Australian womenLikely to be underpoweredDietary guidelines for pregnant <strong>and</strong> <strong>breastfeeding</strong> women: evidence report428
Reference Giordano 2008Food typeMeat: red meat (beef, pork, lamb, mutton); liver <strong>and</strong> other offalStudy typeCase-control studyLevel of evidence III-3 (aetiology)SettingSicily, ItalyFundingSicilian Congenital Malformation RegistryParticipants90 cases: 43 cases of hypospadias <strong>and</strong> 48 cases of cryptorchidism (both in one infant)202 controls: r<strong>and</strong>omly selected controls born in the same year <strong>and</strong> the same regionBirths between 1998 to 2003Baseline comparisons Low birthweight, low maternal education, mother’s history of gynaecological disease <strong>and</strong> father’s history of urogenital diseases differed significantlybetween cases <strong>and</strong> controlsSee confounding belowDietary assessment Interview on maternal diet <strong>and</strong> food frequenciesTimingFFQComparisonConsumption of red meat once a week or less vs more than once a week;Consumption of liver <strong>and</strong> other offal once a week or less vs more than once a week;OutcomesHypospadias <strong>and</strong> cryptorchidismResultsRed meatCases Controls ORHypospadias≤ 1/week 8 (19.1%) 23 (11.4%) 1.00> 1/week 34 (80.9%) 179 (88.6%) 0.55 95% CI 0.23 to 1.32Cryptorchidism≤ 1/week 8 (16.7%) 23 (11.4%) 1.00> 1/week 40 (83.3%) 179 (88.6%) 0.64 95% CI 0.27 to 1.54Hypospadias <strong>and</strong>cryptorchidism≤ 1/week 16 (17.8%) 23 (11.4%) 1.00> 1/week 73 (81.1%) 179 (88.6%) 0.59 95% CI 0.29 to 1.17Liver <strong>and</strong> other offalHypospadias≤ 1/week 39 (90.7%) 195 (96.5%) 1.00> 1/week 4 (9.3%) 7 (3.5%) 2.86 95% CI 0.80 to10.23Cryptorchidism≤ 1/week 43 (89.6%) 195 (96.5%) 1.00> 1/week 5 (10.4%) 7 (3.5%) 3.24 95% CI 0.98 to10.69MeatHypospadias <strong>and</strong>429
cryptorchidism≤ 1/week 81 (90%) 195 (96.5%) 1.00> 1/week 9 (10.0%) 7 (3.5%) 3.10 95% CI 1.11 to 8.59Liver <strong>and</strong> other offal: adjusted analysis*aORHypospadias> 1/week 4.07 95% CI 0.92 to 17.99Cryptorchidism> 1/week 5.21 95% CI 1.26 to 21.50Hypospadias <strong>and</strong> cryptorchidism> 1/week 4.38 95% CI 1.34 to 14.26Followupn/aConfoundingResults for red meat were not presented as adjusted analyses*Liver <strong>and</strong> other offal results were additionally adjusted for mother’s age, parity, education, gynaecological diseases; paternal urogenital diseases, <strong>and</strong>use of pesticides; birthweightRisk of bias Moderate risk of bias: Participation rate of parents <strong>and</strong> data collection rate of cases was lower than that of controls (76% versus 91%);RelevanceLikely to be reasonably relevant for Australian women, although hypospadias rates very high <strong>and</strong> unlikely that most Australian women will have suchhigh pesticide exposureOther comments Ragusa region in Sicily is a region of intensive agriculture (involving high rates of pesticide <strong>and</strong> other chemical use) with high rates of hypospadias <strong>and</strong>cryptorchidismDietary guidelines for pregnant <strong>and</strong> <strong>breastfeeding</strong> women: evidence report430
Reference Godfrey 1996Food typeMeatStudy typeProspective cohort studyLevel of evidence II (aetiology)SettingSouthampton, UKFundingDunhill Trust <strong>and</strong> Medical Research CouncilParticipants538 women who gave birth to a singleton term infantBaseline comparisons See confounding belowDietary assessment FFQTimingFFQ administered in early <strong>and</strong> late pregnancy, to reflect diet in the previous three monthsComparison ≤ 23.5 v 23.5 to 34.0 v > 34.0 g/day meat protein; mean daily intake 28.3 g IQR 20.5, 37.3OutcomesBirthweight, placental weightResultsPlacental weightNo significant association seen between meat protein intake in late pregnancy <strong>and</strong> placental weight (p = 0.5)FollowupConfoundingRisk of biasRelevanceOther commentsBirthweightBirthweight fell by 3.1 g (95% CI 0.3g to 6.0 g; p = 0.03) for each g decrease in meat protein in late pregnancyTo birthAdjusted for baby’s sex <strong>and</strong> gender <strong>and</strong> duration of gestation; <strong>and</strong> nutrient intakesLow risk of bias: of 636 women recruited, 596 (94%) agreed to participate; 39 gave birth before 37 weeks, 3 were not visited in late pregnancy <strong>and</strong>placental weight was not recorded for 16, leaving 538 term pregnancies with complete birth <strong>and</strong> nutrition data (85% of the 636 women recruited)Likely to be relevant for Australian womenMeat431
Reference Haugen 2008Dietary patterns Red meat as part of Mediterranean-type diet (2 or more serves of meat per week)Study typeProspective cohort studyLevel of evidence II (aetiology)SettingNorway (part of the Norwegian Mother <strong>and</strong> Child Cohort Study (MoBa))FundingNorwegian Ministry of <strong>Health</strong>, NIH/NINDS, Norwegian Research Council/FUGE, EU FP& consortium, Metabolic Programming (EARNEST).Participants26,563 (65%) of 40,817 pregnancies of women recruited for MoBa from February 2002 to February 2005 who met the following criteria: women had tobe non-smoking, BMI between 19 <strong>and</strong> 32, aged between 21 <strong>and</strong> 38 years when giving birth, with a singleton birth.Exclusions: more than 3 spontaneous abortions, energy intake less than 4,200 kJ <strong>and</strong> more than 16,700 kJ.Baseline comparisons See confounding belowAssessmentFFQTimingat 17-24 weeks gestationComparisonRed meat ≤ 2 versus > 2 times a weekOutcomesPreterm birth (after week 21 <strong>and</strong> before week 37); late preterm birth (week 35-36) <strong>and</strong> early preterm birth (< 35 weeks)ResultsPreterm birth (< 37 weeks): (n = 25,966; 1174 cases)OR 1.09 95% CI 0.93 to 1.28aOR 1.09 95% CI 0.93 to 1.28Early preterm birth (< 35 weeks): (n = 25,256; 474 cases)OR 1.13 95% CI 0.88 to 1.44aOR 1.14 95% CI 0.89 to 1.46FollowupConfoundingRisk of biasRelevanceOther commentsLate preterm birth (35-36 weeks): (n = 25,492; 710 cases)OR 1.06 95% CI 0.86 to 1.30aOR 1.05 95% CI 0.86 to 1.30To birthAnalyses were adjusted for remaining Mediterranean diet criteria, mother’s BMI <strong>and</strong> height, educational level, parity <strong>and</strong> marital statusModerate: some dietary intakes were different between groups <strong>and</strong> were not controlled forModerate: low red meat consumption not typical for many Australian womenPreterm birth rates were lower than expected, likely due to exclusion of smokersDietary guidelines for pregnant <strong>and</strong> <strong>breastfeeding</strong> women: evidence report432
Reference Jensen 2004Food typeMeat: cured meat (sausage or bacon, hot dogs, ham, bologna, other lunch meats); pork; hamburger (ground); beef; liverStudy typeCase controlLevel of evidence III-3 (aetiology)SettingCalifornia, USA (part of the Northern California Childhood Leukemia Study)FundingPHSParticipants138 matched cases <strong>and</strong> controls:Cases: Children under 15 years of age, with a parent who spoke English or Spanish, were resident in the study area at the time of diagnosis of acutelymphoblastic leukemia (ALL), with no prior diagnosis of cancerControls: identified from birth certificates matched to the case on date of birth, sex, maternal race, Hispanic ethnicity of mother or father, <strong>and</strong> county ofresidence at birthBaseline comparisons A priori potential confounders were identified as birthweight, <strong>breastfeeding</strong>, maternal age <strong>and</strong> education, parental occupation <strong>and</strong> smoking duringpregnancy – no evidence of confounding was seen for these variables. Also see Confounding below.Dietary assessment FFQTimingDietary intake to reflect the year before the index pregnancy (to indicate dietary status at the start of pregnancy)ComparisonServes of meat productsOutcomesChildhood acute lymphoblastic leukemiaResultsCured meat:ALLaOR 0.71 95% CI 0.44 to 1.15: mean consumption of cured meat 0.60 [SD 0.37] serves per day*Sausage or bacon aOR 0.87 95% CI 0.71 to 1.08: mean consumption 2.73 [SD 1.57] serves per dayHot dogsaOR 0.80 95% CI 0.60 to 1.07: mean consumption 1.93 [SD 1/15] serves per dayHam, bologna, etc. aOR 0.91 95% CI 0.78 to 1.07: mean consumption 3.29 [SD 2.03] serves per dayPorkHamburger (ground)BeefaOR 0.91 95% CI 0.74 to 1.11: mean consumption 2.83 [SD 1.47] serves per dayaOR 0.90 95% CI 0.75 to 1.09: mean consumption 3.96 [SD 1.78] serves per dayaOR 0.80 95% CI 0.66 to 0.99: mean consumption 3.85 [SD 1.63] serves per dayFollowupConfoundingRisk of biasRelevanceOther commentsLiveraOR0.83 95% CI 0.53 to 1.31: mean consumption 1.24 [SD 0.73] serves per dayn/aAnalyses were adjusted for variables previously shown to be significantly associated with ALL in the overall study – income, prior fetal loss, child’sexposure to other children under age five, <strong>and</strong> maternal exposure to indoor insecticides during pregnancy; along with portion size <strong>and</strong> energyconsumptionLow-moderate risk of bias: Of eligible cases identified from January 1995 to November 1999, 83% consented to participate; 69% of the eligible controlsagreed to participate. Of the 161 matched pairs, seven pairs were excluded as the respondent was not the biological mother, 16 pairs were excludeddue to questionable dietary questionnaire data, leaving 138 matched pairs (86%); some recall bias likelyLikely to be relevant for Australian women, though some diet components may differ e.g. high bean consumption*Some consumption levels seem high – possibly per week rather than per day?Meat433
Reference Jones 2000 (see also Yin 2010)Food typeMeatStudy typeProspective cohortLevel of evidence II (aetiology)SettingSouthern Tasmania, AustraliaFundingNHMRC, Tasmanian Government, Royal Hobart Hospital Acute Care ProgramParticipants173 mothers; <strong>and</strong> their infants born in 1988 (part of a larger infant health study of babies at high risk of SIDS)Exclusions: multiple pregnanciesBaseline comparisons Mothers with no tertiary education more likely to have been excluded due to missing dataDietary assessment FFQTimingDietary intake during third trimester of pregnancyComparisonLinear regression of density (portions per kJ)OutcomesBone mass (bone mineral density (BMD) <strong>and</strong> bone mineral content*) in 8 year old childrenResultsBMD at 8 years;Total body (g/cm 2 )r 2 0% 0.003 (p = 0.67)adjusted r 2 23% 0.003 (p = 0.65)Femoral neck (g/cm 2 )r 2 1% 0.005 (p = 0.55)adjusted r 2 33% 0.005 (p = 0.57)Lumbar spine (g/cm 2 )r 2 0% -0.001 (p = 0.54)adjusted r 2 32% -0.003 (p = 0.72)Followup8 yearsConfounding Analyses were adjusted for method of dietary assessment, maternal education, parental unemployment, sex, weight at age 8 years, height at age 8years, weekend sunlight exposure in winter at age 8 years, smoking during pregnancy, sports participation, ever breast-fed <strong>and</strong> current calcium intake.Risk of biasModerate-high: 330 (215 males, 115 females) representing a 60% response rate from those available in 1996; 47% of the original 1988 cohort, Thisdropped to 173 (dietary information missing or unreliable for 115 mothers, 32 multiple births, 10 participants had missing data for confounders)representing 52% of participants from 1996 <strong>and</strong> 25% of those in the original cohort.72% of the 173 participants were male. Gender imbalance suggests potential selection bias (due to original selection of infants at high risk of SIDS)RelevanceInfants at high risk of SIDS represent a selected group (more males, preterm births, teenage mothers, smoking during pregnancy)Other comments *Bone mineral content not reported – stated to be similar to bone mineral density resultsDietary guidelines for pregnant <strong>and</strong> <strong>breastfeeding</strong> women: evidence report434
Reference Knox 1972Food typeMeat (total meat, pork, meat <strong>and</strong> vegetable extracts, mutton <strong>and</strong> lamb, corned meat)Study typeCase control (cases matched to food consumption at population level for a particular period)Level of evidence III-3 (aetiology)SettingBirmingham, UKFundingNot reportedCases Stillbirths <strong>and</strong> infant deaths due to anencephalus between 1961 <strong>and</strong> 1967Baseline comparisons n/aDietary assessment Population surveysTimingEach quarterComparisonMonthly stillbirths <strong>and</strong> infant deaths due to anencephalus matched to quarterly consumption of main food stuffs (in previous five to nine months)OutcomesAnencephalusResultsTotal meat negatively associated with cases of anencephalus; r = -0.66 after a lag interval of five monthsPork negatively associated with cases of anencephalus; r = -0.75 after a lag interval of five monthsMeat <strong>and</strong> vegetable extracts negatively associated with cases of anencephalus; r = -0.69 after a lag interval of five monthsMutton <strong>and</strong> lamb positively associated with cases of anencephalus; r = +0.63 after a lag interval of five monthsCorned meat positively associated with cases of anencephalus; r = +0.55 after a lag interval of eight monthsFollowupConfoundingRisk of biasRelevanceOther commentsn/aAnalyses were not adjustedHigh risk of bias: links between population consumption of foods <strong>and</strong> anencephalus very distal <strong>and</strong> no control for potential confoundersLikely to differ from a modern Australian dietFood consumption of total population not likely to reflect food consumption of pregnant women; <strong>and</strong> will not be able to reflect differences between dietsof individual or specific groupsMeat435
Reference Kwan 2009Food typeMeat: cured meat (sausage or bacon, hot dogs, ham, bologna, other lunch meats); pork; hamburger (ground); beef; liverStudy typeCase controlLevel of evidence III-3 (aetiology)Setting California, USA (part of the Northern California Childhood Leukemia Study – phase 1 <strong>and</strong> 2 (phase 1 reported in Jensen 2004)FundingPHS; Paul O’Gorman Foundation for Children with LeukemiaParticipants866 individuals - 282 matched cases <strong>and</strong> controls (205 pairs <strong>and</strong> 77 trios):Cases: Children under 15 years of age, with a parent who spoke English or Spanish, were resident in the study area at the time of diagnosis of acutelymphoblastic leukemia (ALL), with no prior diagnosis of cancerControls: identified from birth certificates matched to the case on date of birth, sex, maternal race, Hispanic ethnicity of mother or father, <strong>and</strong> county ofresidence at birth (in phase 1 (1995-99) only due to concerns about overmatching on potential environmental exposures linked to leukemia risk)Data collected from August 1995 to November 2002Baseline comparisons A priori potential confounders were identified as birthweight, <strong>breastfeeding</strong>, maternal age <strong>and</strong> education, <strong>and</strong> smoking during pregnancy.Also see Confounding below.Dietary assessment FFQTimingDietary intake to reflect the year before the index pregnancy (to indicate dietary status at the start of pregnancy)ComparisonServes of meatOutcomesChildhood acute lymphoblastic leukemiaResultsCured meat: aOR 0.91 95% CI 0.78 to 1.05: median consumption 0.3 (25 th 75 th percentiles 0.1, 0.5) serves per dayFollowupConfoundingRisk of biasRelevanceOther commentsBeef: aOR 0.82 95% CI 0.69 to 0.98n/aAnalyses were adjusted for total energy intake, household income, indoor insecticide exposure during pregnancy; <strong>and</strong> proportion of foods reported aslarge or extra-large portion sizeAlso adjusted for child’s diet, with little effect seen on resultsLow-moderate risk of bias: Of eligible cases identified from January 1995 to November 2002, 86% consented to participate; 56% of the eligible controlsagreed to participate. 190 participants excluded: leukemia diagnosis was not ALL (n = 127); no dietary data (n = 4); a case or a control respondent wasnot the biological mother (n = 14), questionable dietary questionnaire data (n = 45), leaving 282 matched sets (86%).Likely to be relevant for Australian women, though some diet components may differ e.g. high bean consumptionRegular use of any dietary supplement was not associated with risk of ALL;Authors did not report on meat overall (ws grouped with overall protein) or some specific meats such as liverDietary guidelines for pregnant <strong>and</strong> <strong>breastfeeding</strong> women: evidence report436
Reference Lamb 2008Dietary patterns Meat: chicken or turkey (with or without skin), bacon, hot dogs, processed meats (sausage, salami, bologna etc.), liver, beef, pork or lamb as as<strong>and</strong>wich or mixed dish, or beef, pork or lamb as a main dishStudy typePart of a longitudinal prospective birth cohort studyLevel of evidence II (aetiology)SettingDenver, Colorado, US (part of the Diabetes Autoimmunity Study in the Young (the DAISY))FundingNational Institutes of <strong>Health</strong>, Diabetes Endocrine Research CenterParticipants642 newborns at increased risk for type 1 diabetes (based on HLA genotype <strong>and</strong> family history), enrolled in the study from 1993 to 2004; 27 casesdefined as testing positive for islet autoantibodies at two consecutive blood draws <strong>and</strong> still positive (diabetic) at last follow-upBaseline comparisons See confounding belowDietary assessment FFQTimingFrom 1997 to 2004, mothers of infants enrolled in DAISY completed FFQ soon after birth, reflecting diet in the last trimester of pregnancy (but couldsubmit FFQ before child reached one year of age)ComparisonMonthly servings of meatOutcomes Islet autoimmunity (a precursor of type 1 diabetes) at 9 months, 15 months, 2 years <strong>and</strong> annually thereafter up to the age of 15ResultsMeat:aHR (for one st<strong>and</strong>ard deviation change in reported consumption) 0.91 95% CI 0.54 to 1.51 (40 mean monthly servings)FollowupConfoundingRisk of biasRelevanceOther commentsUp to 15 yearsSize for gestational age, ethnicity, maternal education, household income, exposure to type 1 diabetes or GDM in utero, gender of child, maternal ageat birth, total calories of maternal dietModerate risk of bias: subset of DAISY only (later enrolments); <strong>and</strong> women were not reminded to submit FFQ, leading to possible selection bias; of the661 FFQs returned, 5 were excluded because incomplete, <strong>and</strong> 14 for implausible dietary intakes, leaving 642 FFQs for analysis; child’s diet notcontrolled for (except partially for first introduction to cereals in the maternal potato consumption analysis)Likely to be relevant to some Australian women, although women in this study may have been at higher risk of diabetesMeat437
Reference Latva-Pukkila 2009Dietary patterns MeatStudy typeProspective cohort studyLevel of evidence II (aetiology)Setting Turku, Finl<strong>and</strong> (cohort from Piirainen 2006)FundingSocial Insurance Institution of Finl<strong>and</strong>, the Sigrid Juselius Foundation <strong>and</strong> the Academy of Finl<strong>and</strong>Participants256 pregnant womenBaseline comparisons Women with NVP were older <strong>and</strong> tended to be primiparous compared to those withoutDietary assessment 3 day food diariesTimingThree times during pregnancy (mean 14, 24 <strong>and</strong> 34 weeks gestation)ComparisonWith nausea <strong>and</strong> vomiting in pregnancy (NVP) versus no NVP;134 (72%) women reporting experiencing nausea; with 40 (30%) vomiting (9 (4.8%) more than once a day) during the first trimesterOutcomesInfluence of nausea <strong>and</strong> vomiting in pregnancy on dietary intake;Severity of NVP assessed as having no nausea <strong>and</strong> vomiting, only nausea, vomiting once a day or vomiting more than once a day, with the primaryoutcome being presence or absence of nauseaResults With NVP (n = 134) Without NVP (n = 53) pMeat products (g), median (IQR) daily 98 (66 to 138) 121 (95 to 164) 0.004FollowupConfoundingRisk of biasRelevanceOther commentsTo 34 weeks gestationNot reported if any of the analyses were adjustedModerate risk of bias: not clear if analyses were adjusted for potential confoundersLikely to be relevant to Australian womenDietary guidelines for pregnant <strong>and</strong> <strong>breastfeeding</strong> women: evidence report438
Reference Maconochie 2007Food groupsMeat: red meatStudy typeCase-control study (postal survey sampled from the electoral roll – National Women’s <strong>Health</strong> Study)Level of evidence III-3 (aetiology)SettingUK general populationFundingNational Lottery Community Fund, Miscarriage AssociationParticipantsCases: 603 women aged 18 to 55 years whose most recent pregnancy had ended in first trimester miscarriage (< 13 weeks gestation);Controls: 6116 women aged 18 to 55 years whose most recent pregnancy had progressed beyond 12 weeksBaselineComparisonsBMI < 18.5 was significantly associated with odds of miscarriageAlso see Confounding belowDietary Assessment questionnaireTimingDiet in the three months prior to conception <strong>and</strong> the first 12 weeks of pregnancyComparisonAt least twice weeklyOutcomesFirst trimester miscarriageResultsMeat twice weekly or moreCases Controls aOR (95% CI) aOR further adjusted for nauseaNo 262 (47%) 2324 (40%) 1.00 1.00Yes 299 (53%) 3435 (60%) 1.03 (0.86 to 1.23) 0.98 (0.81 to 1.18)Length of followup n/aConfoundingAdjusted for year of conception, maternal age, previous miscarriage <strong>and</strong> previous live birth; <strong>and</strong> further adjusted for nausea in the first 12 weeks ofpregnancyRisk of bias Low risk of bias: 88% of eligible women responding to stage 1 agreed to participate in the second stage of the study; <strong>and</strong> 71% responded to the stage 2questionnaire. 1071/7790 records (7508 women) were excluded (mostly due to index pregnancy being conceived prior to 1980), leaving 6719 records(86%) available for analysisRelevanceL ikely to be relevant to Australian womenOther comments Women who suffered from nausea in the first 12 weeks of pregnancy were almost 70% less likely to miscarryMeat439
Reference Mikkelsen 2008Dietary patterns Mediterranean diet (consumption of fish twice a week or more, intake of olive or canola oil, high consumption of fruits <strong>and</strong> vegetables (5 a day or more),meat (other than poultry or fish) at most twice a week, <strong>and</strong> at most 2 cups of coffee a day)Study typeProspective cohort studyLevel of evidence IISettingDenmark (part of the Danish National Birth Cohort (DBNC))FundingMarch of Dimes Birth Defects Foundation, Danish National Research Foundation, Danish Medical Research Foundation, Danish <strong>Health</strong> Foundation,Danish Heart Foundation, EU FP7 consortium (EARNEST), Pharmacy Foundation, Egmont Foundation, Augustinus Foundation.Participants 35,530 pregnant women recruited from 1996 to 2002Exclusions: women who smoked, women aged < 21 <strong>and</strong> > 38 years, BMI < 19 <strong>and</strong> > 32, a history of more than 3 abortions, twin pregnancies, chronichypertension, women with a calculated energy intake < 4,200 kJ <strong>and</strong> > 16,700 kJBaseline comparisons BMIs were significantly lower in the MD <strong>and</strong> none groups.Dietary assessment FFQTimingFFQ mailed to all DBNC participants in 25 th week of gestationComparisonMeat ≤ 2 times a week v 3 or more times a weekOutcomesPreterm birthResultsPreterm birth < 37 weeksOR 0.97 95% CI 0.86 to 1.11aOR 0.92 95% CI 0.81 to 1.05Early preterm birth < 35 weeksOR 0.92 95% CI 0.74 to 1.14aOR 0.86 95% CI 0.68 to 1.07Late preterm birth 35-36 weeksOR 1.00 95% CI 0.86 to 1.17aOR 0.96 95% CI 0.82 to 1.13FollowupTo birthConfoundingAdjusted for parity, BMI, maternal height, socioeconomic status <strong>and</strong> cohabitant statusRisk of bias Low risk of bias; GA based mostly on ultrasound; 0.36% missing data (127/35657)RelevanceRelevance limited by exclusion of smokers <strong>and</strong> obese womenOther commentsDietary guidelines for pregnant <strong>and</strong> <strong>breastfeeding</strong> women: evidence report440
Reference Mitchell 2004Dietary patterns Meat (including meat products)Study typeCase-control studyLevel of evidence III-3 (aetiology)SettingWaitemata <strong>Health</strong> or Auckl<strong>and</strong> <strong>Health</strong>care regions, New Zeal<strong>and</strong>Funding<strong>Health</strong> Research Council of New Zeal<strong>and</strong>, Foundation for the Newborn, Child <strong>Health</strong> Research FoundationParticipants Mothers of 1138 children born between October 1995 <strong>and</strong> November 1997 (844 born SGA <strong>and</strong> 870 born appropriate for GA); only term infants (> 37weeks);Exclusions: preterm births (< 37 weeks), multiple births <strong>and</strong> those with congenital anomaliesBaseline comparisons See confounding belowDietary assessment FFQTimingFFQ administered after birth (to cover the periconception period <strong>and</strong> the last month of pregnancy)Comparison0-2 v > 2-4 v > 4-5 v > 5-6 v > 6 serves of meat per weekOutcomesSGA (≤ 10 th centile for GA <strong>and</strong> gender)ResultsSGA (Meat consumption at time of conception)SGA AGA aOR p value for trend0-2 60/533 (11.3%) 42/598 (7.0%) 1.36 (0.80 to 2.29)>2-4 180/533 (33.8%) 193/598 (32.3%) 1.07 (0.76 to 1.51)>4-5 85/533 (15.9%) 114/598 (19.1%) 0.97 (0.64 to 1.45)>5-6 71/533 (13.3%) 81/598 (13.6%) 1.01 (0.65 to 1.56)>6 137/533 (25.7%) 168/598 (28.1%) 1 0.79SGA (Meat consumption in last month of pregnancy)SGA AGA aOR (95% CI) p value for trend0-2 56/534 (10.5%) 57/597 (9.5%) 0.70 (0.43 to 1.16)>2-4 177/534 (33.1%) 202/597 (33.8%) 0.84 (0.59 to 1.19)>4-5 102/534 (19.1%) 123/597 (20.6%) 0.85 (0.57 to 1.26)>5-6 66/534 (12.4%) 72/597 (12.1%) 0.97 (0.62 to 1.53)>6 133/534 (24.9% 143/597 (24.0%) 1 0.66FollowupConfoundingRisk of biasRelevanceOther commentsNAAdjusted for socio-economic status, ethnicity, maternal height, maternal weight before pregnancy, maternal hypertension <strong>and</strong> maternal smoking; butfolate supplementation was not controlled for (periconception folate was significantly associated with reduced SGA risk).Low-moderate risk of bias: Of the 2182 eligible infants, parents of 1714 (78.6%) completed the FFQ; 1138 (67%) of women completed the FFQ; missingitems in completed FFQ treated as woman not consuming any meatLikely to be relevant to Australian womenOnly term infants includedMeat441
Reference Miyake 2009 (follow-up of Saito 2009)Dietary patterns MeatStudy typeProspective cohort studyLevel of evidence II (aetiology)SettingOsaka, JapanFundingMinistry of Education, Culture, Sports, Science, <strong>and</strong> Technology <strong>and</strong> <strong>Health</strong> <strong>and</strong> Labour Sciences Research Grants, Ministry of <strong>Health</strong>, Labour <strong>and</strong>Welfare, JapanParticipants 763 mother-child pairs (part of the Osaka Maternal <strong>and</strong> Child <strong>Health</strong> Study). <strong>Pregnant</strong> women recruited between November 2001 <strong>and</strong> March 2003Baseline comparisons See belowDietary assessment Diet history questionnaire (DHQ)TimingDHQ at mean 17.7 [SD 6.7] weeks gestation to reflect dietary intake for the previous monthComparison Quartiles of maternal meat consumption during pregnancy (medians in g/day adjusted energy intake; Q1 33.8; Q2 49.0; Q3 63.6; Q4 90.8OutcomesWheeze <strong>and</strong> eczema in infants aged 16-24 months (ISAAC definitions)ResultsInfant wheeze at 16-24 months (n=763)OR (95% CI)aOR (95% CI)Q1 1.00 1.00Q2 0.61 (0.37 to 0.97) 0.67 (0.40 to 1.11)Q3 0.57 (0.35 to 0.91) 0.57 (0.33 to 0.95)Q4 0.73 (0.46 to 1.16) 0.77 (0.47 to 1.27)p for trend: 0.16 0.22FollowupConfoundingRisk of biasRelevanceOther commentsInfant eczema at 16-24 months (n=763)Q1 1.00 1.00Q2 0.59 (0.34 to 1.01) 0.68 (0.38 to 1.21)Q3 0.76 (0.45 to 1.26) 0.80 (0.46 to 1.39)Q4 1.12 (0.69 to 1.83) 1.31 (0.78 to 2.22)p for trend: 0.47 0.2816-24 months after birthAdjusted for maternal age, gestation at baseline, place of residence at baseline, family income, maternal <strong>and</strong> paternal income, maternal <strong>and</strong> paternalhistory of asthma, atopic eczema <strong>and</strong> allergic rhinitis, maternal intake of vitamin D <strong>and</strong> E during pregnancy, changes in maternal diet during theprevious month, season when baseline data were collected, maternal smoking during pregnancy, baby’s older siblings, baby’s sex, baby’s birthweight,household smoking, <strong>breastfeeding</strong> duration <strong>and</strong> time of birth before third follow-up surveyLow risk of bias: of the 1002 women initially recruited, 763 mother-child pairs (76.3%) completed all three surveys (compared with non-participants,participants had higher incomes, higher education levels <strong>and</strong> were more likely higher intakes of fat, cholesterol, vitamin D & EFish intake in Japan likely to be higher than in Australia75% of infants were breastfed for 6 months or longer.Dietary guidelines for pregnant <strong>and</strong> <strong>breastfeeding</strong> women: evidence report442
Reference Miyake 2006Food groupsMeatStudy typeProspective cohortLevel of evidence II (aetiology)SettingWomen who became pregnant in November 2001-March 2003 Neyagawa City, Osaka Prefecture <strong>and</strong> several surrounding municipalities (OsakaMaternal <strong>and</strong> Child <strong>Health</strong> Study, Japan)FundingGrant-in-Aid for Scientific Research (Government grant)Participants865 pregnant Japanese womenBaseline comparisons See Confounding belowDietary Assessment Dietary history questionnaire-self administeredTimingDiet survey for previous month at baseline (period of baseline not stated), EPDS at 2-9 months post partumComparisonDaily intake of meatNote: other dietary intakes analysed: dairy, fish, eggs, total fat, saturated fatty acids, cholesterol, LA, ALA <strong>and</strong> AAOutcomes Postpartum depression (EPDS with postpartum depression when score ≥ 9)ResultsNo significant association between meat intake <strong>and</strong> postpartum depression on adjusted analysisLength of follow upConfoundingRisk of biasRelevanceOther comments2-9 months postpartumAge, gestation, parity, smoking, family structure, occupation, family income, education, changes in diet in previous month, season when baseline datacollected, BMI, time of delivery, medical problems in pregnancy, baby’s sex, baby’s birthweightLow risk of bias: data for 865/1002 (86.5%) women available for analysisAustralian diets very different to Japanese - much less seafood intake in Australia <strong>and</strong> more white fish rather than fatty fishOriginally 1002 women enrolled only 865 completed (note: depressed persons less likely to participate), low rate of enrolment into study (17.2% of thoseeligible in Neyagawa)Meat443
Reference Peters 1994Food groupsMeat: breakfast meats (bacon, sausage, ham); luncheon meats (salami, pastrami, lunch meat, corned beef, bologna); hot dogs; charcoal broiled meatsStudy typeCase control studyLevel of evidence III-3 (aetiology)SettingLos Angeles County, CA, USAFundingElectric Power Research Institute, National Institutes of Occupational Safety <strong>and</strong> <strong>Health</strong>Participants 232 cases from birth to 10 years of age, ascertained through a population-based tumour registry from 1980 to 1987232 controls (friends <strong>and</strong> r<strong>and</strong>om-digit dialling); matched on age, gender <strong>and</strong> ethnicityBaseline comparisons See Confounding belowDietary Assessment Dietary history questionnaire - interviewTimingn/aComparisonMonthly servings – see resultsOutcomesChildhood leukemiaResults Servings per month CI for highest P for trendcategoryNone (0) Low (1 to 3.9) Medium (4 to High (12+)11.9)Ham, bacon, sausageCase/control (N) 75/67 65/84 64/55 25/23OR 1.0 0.7 1.0 1.0 0.5 to 2.0 0.8Hot dogsCase/control (N) 106/110 79/92 30/18 37/29OR 1.0 0.9 1.8 2.4 0.7 to 8.1 0.1Bologna, pastrami, salami, corned beef, lunch meatCase/control (N) 103/107 49/48 41/46 37/29OR 1.0 1.0 1.0 1.3 0.8 to 2.4 0.5HamburgersCase/control (N) 53/56 82/71 73/83 23/21OR 1.0 1.2 0.9 1.2 0.5 to 2.5 0.9Charbroiled meatsCase/control (N) 66/72 91/83 44/42 25/29OR 1.0 1.2 1.1 0.9 0.5 to 1.8 1.0Length of followup n/aConfoundingAnalyses of mother’s diet were not adjustedRisk of bias Moderate risk of bias: interviews were completed for 252/331 (76.1%) of the cases identified (22 physician refusals, 24 parent refusals <strong>and</strong> 33untraceable cases); controls could not be found for 20 cases; adjusted analyses only presented for results that were significant on unadjusted analyses(therefore no there were no maternal diet analyses presented); not clear if mothers were asked to recall present diet or diet during pregnancyRelevanceLikely to be reasonably similar to Australian dietsOther comments Child’s <strong>and</strong> father’s diet assessed in addition to mother’s dietDietary guidelines for pregnant <strong>and</strong> <strong>breastfeeding</strong> women: evidence report444
Reference Petridou 2005Food typeMeat <strong>and</strong> meat productsStudy typeCase-control studyLevel of evidence III-3 (aetiology)SettingGreeceFundingThe Childhood Hematology-Oncology Group: Athens University Medical School, Aristotle University of Thessaloniki, University Hospital of HeraklionParticipants Cases: 131 children with acute lymphoblastic leukemia, aged 12 to 59 months, gender <strong>and</strong> age matched toControls: 131 children hospitalised for minor conditions between 1999 <strong>and</strong> 2003Baseline comparisons See confounding belowDietary assessment FFQTimingDuring index pregnancyComparisonQuintiles of meat <strong>and</strong> meat products – median Q1; 25 g/day: median Q5 61 g/dayOutcomesAcute lymphoblastic leukemia (ALL)ResultsMedian g/day Cases Controls P for trendQ1: 25 23 30Q2: 33 28 30Q3: 39 17 31Q4: 46 29 24Q5: 61 34 16 0.01Logistic regression: one quintile more of meat/meat products: aOR 1.25 95% CI 1.09 to 1.57FollowupConfoundingRisk of biasRelevanceOther commentsNATotal energy intake (but not mutually among food groups); matching variables; maternal age at birth; birthweight; maternal smoking during pregnancy;maternal years of schooling, maternal occupationModerate: moderate risk of recall bias for women being able to accurately remember their dietary intake during a pregnancy some time previously;Cases: 171 children with ALL were identified; 21 had missing data, consent was not given in 9 cases <strong>and</strong> 10 were unable to be matched, leaving 131(77%) of cases availableDiets of Greek women may differ from current diets of Australian womenMeat445
Reference Petridou 1998Food type Meat <strong>and</strong> meat products: pork, veal, lamb, goat,chicken, turkey, ham, salami <strong>and</strong> sauages, liver <strong>and</strong> other offal, eggs, meat pie (0.5), moussaka (0.5),pastitsio (0.5).Study typeCase-control studyLevel of evidence III-3SettingGreater Athens area, GreeceFundingParticipantsBaseline comparisonsDietary assessmentTimingComparisonOutcomesResultsGreek Ministry of <strong>Health</strong> <strong>and</strong> Welfare, <strong>and</strong> Foundation for Research in Childhood ‘S. Doxiadis’Cases: 109 children with cerebral palsy (CP), born between 1984 <strong>and</strong> 1988 (estimated to be two-thirds of the children with CP born during this period)Controls (1): 155 neighbouring children of similar sex <strong>and</strong> age (± 12 months)Controls (2): 99 healthy siblings of similar sex <strong>and</strong> age (± 12 months) of the first neurological patient seen by the attending physician after a visit by theCP patientSee confounding belowFFQDuring pregnancy≤ 4 versus 5-6 versus 7-8 versus > 8 serves of meat per week;regression analysis: risk of cerebral palsy with change in consumption by one unit ( = consumption of meat twice weekly)Cerebral palsy≤ 4 serves of meat per week: 7/91 (7.7%) cases v 35/246 (14.2%) controls5-6 serves of meat per week: 23/91 (25.3%) cases v 88/246 (35.8%) controls7-8 serves of meat a week: 24/91 (26.4%) cases v 72/246 (29.3%) controls> 8 serves of meat a week: 37/91 (40.6%) cases v 51 (20.7%) controlsFollowupConfoundingRisk of biasRelevanceOther commentsRegression analysis for each unit of consumption of meat 2 times per week:aOR 1.45 95% CI 1.11 to 1.89aOR 1.42 95% CI 1.07 to 1.88 (additionally adjusted for all food groups)8 yearsAge <strong>and</strong> sex of child, maternal age at birth, maternal age at menarche, maternal chronic disease, previous spontaneous abortions, persistent vomitingduring index pregnancy, multiple pregnancy, number of obstetric visits; timing of membrane rupture in index birth, use of general anaesthesia in theindex birth, mode of birth, abnormal placenta, infant head circumference at birth, congenital malformation, place of index birth, use of supplementaryiron during index pregnancy, physical exercise during index pregnancy, painless childbirth classes.The following were not included in the model:- Smoking or consumption of coffee or alcohol during pregnancy (stated to be “unrelated to CP <strong>and</strong> had no confounding influence”);- Gestational age, birthweight <strong>and</strong> maternal weight gain (stated to be “strong predictors of CP, but were not included in the model, since they areprobably intermediate stages in a possible link between diet <strong>and</strong> CP (mediators) rather than genuine confounders”Moderate-high: High risk of recall bias for women being able to accurately remember their dietary intake during a pregnancy 8 years previously;Cases: 109 children with CP were identified; for 6 children either collaboration with their guardian or a diagnosis of CP was not confirmed; <strong>and</strong> reliablematernal dietary intakes were not available for 12 women, leaving 91 cases available for analysis.Controls: 278 mother-child pairs were approached; 16 refused to participate; matching controls were not available in 8 instances, <strong>and</strong> reliable maternaldietary intakes were not available for 8 women, leaving 246 controls available for analysis.Regression analysis <strong>and</strong> use of consumption does not indicate any threshold effects e.g. benefit/harm differences at different levels of consumption.Diets of Greek women in 1998 may differ from current diets of Australian womenEggs included under ‘Meat’ categoryDietary guidelines for pregnant <strong>and</strong> <strong>breastfeeding</strong> women: evidence report446
Reference Pogoda 2009Food typeMeat: cured meat; noncured meatStudy typeCase-control studySeparate centre reports: Preston-Martin 1996 (Los Angeles); Lubin 2000 (Israel); Cordier 1994 (France); McCredie 1994 (Australia)Level of evidence III-3 (aetiology)SettingInternational (seven countries – USA, Israel, Italy, Spain, Australia, France <strong>and</strong> Canada (International Collaborative Study of Childhood Brain Tumors)FundingNIH, California Department of <strong>Health</strong>, Southern California Environmental <strong>Health</strong> Sciences Center, National Cancer Institutes, Cancer SurveillanceSystem of Western Washington, Fred Hutchinson Cancer Research Center, Fondo de Investigaciones Sanitarias of Spain, Conselleria de Sanitat iConsum of Valencian Autonomous Community for the Childhood Cancer Registry of the Province of Valencia, Spanish Society of Paediatric Oncologywith the National Childhood Cancer Registry, ISCIII-RTIC, Villavecchia Foundation <strong>and</strong> Scientific Foundation of the AECCParticipants Cases: 1281Controls: 2223Years of diagnosis varied between centres, ranging from 1976 to 1992 (with most diagnosed between 1982 <strong>and</strong> 1992)Controls were frequency matched to cases in US centres <strong>and</strong> in France; otherwise they were individually matched (by region of residence, age, sex,<strong>and</strong> geographic area (except for Sydney <strong>and</strong> Los Angeles))Baseline comparisons See confounding belowDietary assessment St<strong>and</strong>ardised study questionnaire using detailed dietary recall methods <strong>and</strong> abstract food models to gauge portion sizeTimingDiet during the past year <strong>and</strong> during the index pregnancyComparisonQuartilesOutcomesChildhood brain tumoursResultsAll tumours (n = 1204 cases)Controls Cases aOR 95% CICured meatQ1 873 (40%) 375 (32%) 1.0Q2 545 (21%) 236 (20%) 1.1 (0.9 to 1.2)Q3 430 (20%) 261 (23%) 1.2 (1.0 to 1.5)Q4 413 (19%) 284 (25%) 1.5 (1.1 to 2.1)P for trend = 0.03Noncured meatQ1 1187 (54%) 652 (55%) 1.0Q2 285 (13%) 145 (12%) 1.0 (0.9 to 1.2)Q3 274 (13%) 133 (11%) 1.0 (0.8 to 1.2)Q4 437 (20%) 247 (21%) 1.2 (1.0 to 1.3)P for trend = 0.19Astroglials (n = 621 cases)Cured meatQ1 873 (40%) 170 (29%) 1.0Q2 454 (21%) 128 (22%) 1.1 (1.0 to 1.3)Q3 430 (20%) 132 (22%) 1.3 (1.0 to 1.9)Q4 413 (19%) 161 (27%) 1.8 (1.2 to 2.6)P for trend = 0.01Noncured meatQ1 1187 (54%) 345 (57%) 1.0Q2 285 (13%) 73 (12%) 1.0 (0.9 to 1.1)Q3 274 (13%) 58 (10%) 0.9 (0.6 to 1.3)Meat447
Q4 437 (20%) 128 (21%) 1.2 (1.0 to 1.4)P for trend = 0.49Primitive neural ectodermal tumors (PNETs) (n = 257 cases)Cured meatQ1 873 (40%) 87 (36%) 1.0Q2 454 (21%) 43 (18%) 1.1 (0.8 to 1.4)Q3 430 (20%) 59 (24%) 1.1 (0.9 to 1.4)Q4 413 (19%) 52 (22%) 1.2 (0.9 to 1.6)P for trend = 0.15Noncured meatQ1 1187 (54%) 137 (55%) 1.0Q2 285 (13%) 27 (11%) 0.9 (0.6 to 1.5)Q3 274 (13%) 34 (14%) 1.2 (1.0 to 1.4)Q4 437 (20%) 49 (20%) 1.0 (0.8 to 1.3)P for trend = 0.45Tumour subtypesAstrocytomasPilocytic (142 cases) Anaplastic (96 cases) Other (199 cases)Cured meat 2.5 (1.1 to 5.8) 2.1 (1.1 to 4.3) 1.8 (1.2 to 2.7)P for trend 0.03 0.004 0.008Noncured meat 1.1 (0.5 to 2.8) 1.2 (0.3 to 4.6) 1.2 (1.1 to 1.3)P for trend 0.54 0.72 0.46FollowupConfoundingRisk of biasRelevanceOther commentsOther typesMalignant gliomas (122 cases) Medulloblastomas (193 cases) PNET (64 cases) Ependymomas (104 cases)Cured meat 1.9 (0.9 to 3.9) 1.1 (0.9 to 1.3) 1.5 (0.5 to 4.8) 2.0 (1.4 to 2.9)P for trend 0.13 0.43 0.38 0.03Noncured meat 0.9 (0.7 to 1.3) 1.0 (0.7 to 1.5) 1.1 (0.6 to 1.9) 1.3 (0.7 to 2.2)P for trend 0.74 0.41 0.65 0.70n/aAnalyses adjusted for age <strong>and</strong> sex of child, study centre <strong>and</strong> each food group;Adjustment for total intake of foods had little effect on estimatesLow-moderate risk of bias: 75% of eligible cases <strong>and</strong> 71% of eligible controls participated (based on centres for which these data were available); somelack of st<strong>and</strong>ardisation in dietary assessments between study centres; potentially high risk of recall bias for women whose pregnancies may have beenat least 10 years previously.Likely to be relevant to Australian womenDietary guidelines for pregnant <strong>and</strong> <strong>breastfeeding</strong> women: evidence report448
Reference Pogoda 2001Food typeCured meatStudy typeCase-controlLevel of evidenceIII-3 (aetiology)SettingFrom a study about childhood brain tumours in 19 counties on the U.S. West Coast (U.S. West Coast Childhood Brain Tumour Study)Cases: This study includes 3 U.S. centres (Los Angeles County, the five counties in the San Francisco-Oakl<strong>and</strong> metropolitan area, 13 counties in western Washingtonstate) <strong>and</strong> approximately half the total number of children with brain tumoursFundingGrants from National Cancer Institute <strong>and</strong> Cancer Research Foundation of AmericaParticipantsCases: 540 children aged 0-19 years old <strong>and</strong> diagnosed with a primary brain tumour between January 1984-December 1990 (Seattle <strong>and</strong> San Francisco) or 1991 (LosAngeles) identified from the cancer registry in each area. 813 cases were identified, physicians permission to contact family for 790 (97%) cases, 51 of theseineligible. Of the remaining 739 cases 106 (14%) family could not be located, 73 (10%) declined, 20 (3%) did not participate. 540/739 (73%) mothers eligible <strong>and</strong>interviewed.Controls: 801 children whose biological mothers had to be available for interview in English or Spanish, have a telephone, provide informed consent. Controls wereselected from the same geographic areas as cases using 2-step r<strong>and</strong>om digit dialling procedure <strong>and</strong> were similar in age <strong>and</strong> gender. A screening interview todetermine eligibility into study conducted on 88.3%(6170 of 6990) residents called, 67% (801) of those eligible (1196) agreed <strong>and</strong> were interviewedRatio= approximately 2 controls for every caseBaseline comparisons See Confounding belowDietary Assessment Detailed dietary recall in-person interview for the past year <strong>and</strong> during the pregnancyMethodTimingInterview after diagnosis <strong>and</strong> contact <strong>and</strong> consent with family (up to 19 years after pregnancy)ComparisonEstimated daily nitrate intake (using literature of nitrate content of meats <strong>and</strong> amounts reported in food recall interview) from cured meats: Ham, Bacon, Hot dogs,Sausage <strong>and</strong> other cured meats (Lunch meat, meatloaf, pork)OutcomesChildhood (0-19 years old) diagnosis of tumour of the brain, cranial nerves or cranial meningesResultsTable 2 Comparison of odds ratios (OR) <strong>and</strong> 95% confidence intervals (CI) at fixed categories of maternal nitrite exposure from consumption ofcured meats during pregnancy by source of nitrite estimation, US West Coast Childhood Brain Tumour case-control study, 1984-1991Average daily nitrite Time-specific nitrite estimates from literature review Nitrate estimates from dietary conversion softwarefrom cured meats (mg) No. of cases (%) No. of controls (%) OR (95%CI) No. of cases (%) No. of controls (%) OR (95%CI)0 102 (20) 161 (20) 1.0 102 (20) 161 (20) 1.00.01-0.49 293 (57) 499 (63) 1.1 (0.8, 1.5) 377 (73) 601 (75 ) 1.2 (0.9, 1.6)0.50-0.99 68 (13) 79 (9) 1.9 (1.2, 2.9) 27 (5) 24 (3) 2.3 (1.3, 4.41.00-1.99 28 (5) 43 (5) 1.3 (0.8, 2.3) 6 (1) 10 (1) 1.3 (0.5, 3.3)*2.00-2.99 12 (2) 13 (2) 1.8 (0.8, 4.1) 2 (0.4) 0 (0) -≥3.0 11 (2) 9 (1) 3.0 (1.2, 7.9 0 (0) 1 (0.1) -* Includes two cases <strong>and</strong> one control with exposure ≥2 mg day -1 .Meat449
Follow-up0-19 years (age of diagnosis)ConfoundingNone mentionedRisk of biasLowRelevanceNitrate levels in cured meats likely to be similar to Australian??Other comments Note this is an updated analysis (of nitrite) of the same sample/study in Preston-Martin 1996Note: no direct link between meat intake <strong>and</strong> brain tumour risk, only nitrite intake (via cured meat intake) <strong>and</strong> brain tumour riskDietary guidelines for pregnant <strong>and</strong> <strong>breastfeeding</strong> women: evidence report450
Reference Radesky 2008Food typeMeat: red meat (beef, lamb, pork or hamburger); processed meat (bacon, hot dogs, sausage, salami, bologna <strong>and</strong> other processed meats)Study typeProspective cohort studyLevel of evidence II (aetiology)SettingBoston, MA, USAFundingNIH, March of Dimes Birth Defects Foundation, Harvard Medical School Division of Nutrition, Harvard Pilgrim <strong>Health</strong> Care FoundationParticipants1773 women with singleton pregnancies enrolled in Project Viva (initial antenatal visit before 22 weeks gestation, able to complete study forms inEnglish, did not plan to move out of the study area before birthBaseline comparisons Included women had lower pregnancy BMIs than excluded women, were less likely to be African-American or Hispanic, to have low SESDietary assessmentTimingComparisonOutcomesResultsSee confounding belowFFQFFQ completed at first antenatal visit at a mean 11.8 weeks GA (range 5-25.6 weeks) - to assess diet during first trimesterDaily intake of red meat; <strong>and</strong> processed meatGlucose tolerance testing at 26-28 weeks gestation – GDM; impaired glucose tolerance (IGT)Normal glucose tolerance defined as: < 140 mg/dL 1 hour after a 50 g glucose load (non-fasting oral glucose challenge test);IGT defined as ≥ 140 mg/dL on non-fasting oral glucose challenge test but 0 or 1 abnormal result for a fasting glucose tolerance test (100g oral glucoseload where normal = < 95 mg/dL at baseline, < 180 mg/dL at 1 h, < 155 mg/dL at 2 h <strong>and</strong> < 140 mg/dL at 3 h;GDM defined as ≥ 140 mg/dL on non-fasting oral glucose challenge test with 2 or more abnormal GTT results(<strong>For</strong> the 39 women with incomplete glucose testing data, medical records were used to assign them to normal glucose tolerance (n = 7), IGT (n = 10), orGDM (n = 22).Impaired glucose tolerance (per weekly serving of red meat):aOR 1.01 95% CI 0.95 to 1.08GDM (per weekly serving of red meat):aOR 1.01 95% CI 0.91 to 1.12Impaired glucose tolerance (per weekly serving of processed meat):aOR 1.02 95% CI 0.94 to 1.10FollowupConfoundingRisk of biasRelevanceOther commentsGDM (per weekly serving of processed meat):aOR 0.95 95% CI 0.85 to 1.06To birthAdjusted for maternal age, pre-pregnancy BMI, ethnicity, family history of diabetes, history of GDM in a prior pregnancy, smoking in index pregnancy;Used energy partition models <strong>and</strong> nutrient density substitution models to study the simultaneous effects of different macronutrients on GDM <strong>and</strong> IGTrisk;Other studies have not adjusted for different types of fats – which may have opposing effects on risk of GDMLow risk of bias: Of 2128 women who gave birth to a live infant, 24 were excluded for missing or incomplete glucose tolerance testing records; 18 with ahistory of previous type 1 or 2 DM or PCOS with glucose intolerance, 342 missing or implausible first trimester diet information; 11 completion of FFQafter 26 weeks GA (i.e. after glucose tolerance screening) or on an unknown date; leaving 1773 (83.3%) available for analysisLikely to be relevant to Australian womenPaper concludes that “nutritional status entering pregnancy, as reflected by pre-pregnancy BMI, is probably more important than pregnancy diet indevelopment of GDM”Meat451
Reference Saito 2010Food typeMeatStudy typeProspective cohort studyLevel of evidence II (aetiology)SettingNeyagawa City, JapanFundingMinistry of Education, Culture, Sports, Science <strong>and</strong> Technology <strong>and</strong> <strong>Health</strong> <strong>and</strong> Labour Sciences, Ministry of <strong>Health</strong>, Labour <strong>and</strong> Welfare, JapanParticipants771 mother-child pairs recruited from November 2001 to March 2003 at any stage of pregnancy – mean GA 18 weeks (part of the Osaka Maternal <strong>and</strong>Child <strong>Health</strong> Study)Baseline comparisons See confounding belowDietary assessment Diet history questionnaire (DHQ)TimingDHQ to assess dietary habits during the preceding monthComparisonQuartiles of meat consumptionOutcomesSuspected atopic eczemaResultsSuspected atopic eczeman/N OR (95% CI) aOR (95% CI)Q1 (33.4 g/day) 10/192 1.00 1.00Q2 (49.1 g/day) 14/193 1.42 (0.62 to 3.38) 1.46 (0.61 to 3.62)Q3 (63.6 g/day) 19/193 1.99 (0.92 to 4.56) 2.41 (1.06 to 5.75)Q4 (89.8 g/day) 22/193 2.34 (1.10 to 5.30) 2.59 (1.15 to 6.17)FollowupConfoundingRisk of biasRelevanceOther commentsp value for trend (unadjusted): 0.02p value for trend (adjusted): 0.013-4 monthsAdjusted for maternal age, gestation at baseline, family income, maternal <strong>and</strong> paternal education, maternal <strong>and</strong> paternal history of asthma, atopiceczema <strong>and</strong> allergic rhinitis, mite allergen level from maternal bedclothes, vacuuming living room, mould in kitchen, changes in maternal diet in previousmonth, season when baseline data collected, baby’s older siblings, baby’s sex, baby’s birthweight, <strong>breastfeeding</strong> <strong>and</strong> bathing or showering infantLow risk of bias: Of 1002 eligible women, a final sample of 771 (77%) was available for analysisFish intake in Japan likely to be higher than in AustraliaDietary guidelines for pregnant <strong>and</strong> <strong>breastfeeding</strong> women: evidence report452
Reference Sarasua 1994Food typeMeat – cured or broiled [grilled] (ham, bacon or sausage; hot dogs, hamburgers; bologna, pastrami, corned beef, salami or lunch meat; charcoal broiledfoods)Study typeCase-controlLevel of evidence III-3 (aetiology)SettingDenver, Colorado, USFundingNot reportedParticipants 234 cancer cases (including 56 acute lymphoblastic leukemia, 45 brain tumour, 25 lymphoma, 24 soft tissue sarcoma) diagnosed between 1976 to 1983in children 0 to 14 years of age;206 controls, selected by r<strong>and</strong>om-digit diallingBaseline comparisons See confounding belowDietary assessment In-home interview with a parent (generally the mother)TimingTo assess how often each of the meat groups was eaten by the mother during pregnancyComparisonGenerally < once per week versus more than once a week;Hot dogs <strong>and</strong> charcoal broiled foods: never versus more than 0 times a weekOutcomesCancersResultsNo. of controls n (cases) aOR (95% CI)Acute lymphoblastic leukemiaHam, bacon, sausage< 1/week 82 17 1.01+/week 124 39 1.5 (0.7 to 3.0)Hot dogs0/week 81 21 1.0>0/week 125 35 0.9 (0.4 to 1.8)Hamburgers< 1/week 55 11 1.01+/week 151 45 1.2 (0.5 to 2.7)Lunch meats< 1/week 90 24 1.01+/week 116 32 1.0 (0.5 to 2.0)Charcoal-broiled foods0/week 84 25 1.0>0/week 122 31 1.0 (0.5 to 1.9)MeatBrain tumorsHam, bacon, sausage< 1/week 82 18 1.01+/week 124 27 1.0 (0.5 to 2.1)Hot dogs0/week 81 12 1.0>0/week 125 33 2.3 (1.0 to 5.4)Hamburgers< 1/week 55 14 1.01+/week 121 31 0.7 (0.3 to 1.6)453
Lunch meats< 1/week 90 26 1.01+/week 116 19 0.4 (0.2 to 0.8)Charcoal-broiled foods0/week 84 24 1.0>0/week 122 21 0.6 (0.3 to 1.2)Lymphomas – no significant association with lunch meat OR 2.3 95% CI 0.9 to 6.0; or with ham, bacon, sausage or hamburgers (OR 1.3 to 1.5) [CIsnot given]Soft tissue sarcoma - no significant associations with meats (exact numbers not reported)FollowupConfoundingRisk of biasRelevanceOther commentsn/aAdjusted for other types of meat, age at diagnosis, <strong>and</strong> per capita incomeLow to moderate risk of bias: Of the 356 eligible cases, 252 (708%) were interviewed; mothers asked to recall diet during a pregnancy up to 14 yearspreviouslyLikely to be relevant to Australian womenMothers in lower income households were more frequent consumers of hamburgers <strong>and</strong> ham, bacon or sausage (1.5 versus 1.1 serves per week);Maternal vitamin supplementation attenuated the adverse effects of meat consumption;Associations with children’s diets were stronger than those with maternal diets during pregnancyDietary guidelines for pregnant <strong>and</strong> <strong>breastfeeding</strong> women: evidence report454
Reference Shiell 2001Food groupsMeatStudy typeProspective cohortLevel of evidence II (aetiology)SettingMotherwell, Scotl<strong>and</strong>FundingDunhill Medical TrustParticipants626 (274 men <strong>and</strong> 352 women) whose mothers’ food intakes had been recorded during pregnancy during 1967 to 1968. These women had beenadvised to eat 0.45 kg of red meat a day <strong>and</strong> to avoid carbohydrate-rich foods during pregnancyBaseline comparisons See confounding belowDietary assessment Mothers asked about consumption of 10 foodsTimingEarly pregnancy (≤ 20 weeks); late pregnancy (> 20 weeks)ComparisonMaternal consumption of meat (mean consumption in late pregnancy was 13.3 [SD 5.8] serves per week – nearly double that of early pregnancy)OutcomesSystolic <strong>and</strong> diastolic blood pressure at in offspring aged 27 to 30 yearsResultsSystolic blood pressure at 27 to 30 yearsRegression coefficient for amount of maternal meat consumption; ß 0.21 95% CI 0.04 to 0.37, p = 0.01Length of followupConfoundingRisk of biasRelevanceOther commentsDiastolic blood pressure at 27 to 30 yearsRegression coefficient for amount of maternal meat consumption; ß 0.00 95% CI -0.12 to 0.13, p = 0.9627 to 30 yearsAnalyses adjusted for offspring’s gender, BMI, alcohol consumption, <strong>and</strong> cuff size used for blood pressureModerate risk of bias: <strong>For</strong> the 1432 records from 1967-8 recorded liveborn, singleton births with complete names, birth measurements <strong>and</strong> ≥ 1 dietrecord. 965 offspring were alive <strong>and</strong> living locally; <strong>and</strong> after attrition or declining to participate, 626 (43.7%) were available for analysis.Very high intake of meat <strong>and</strong> very low carbohydrate intake limits the relevance to current dietary intakes of Australian womenAuthors state that “low intake of green vegetables, a source of folate, accentuated the effect of high meat <strong>and</strong> fish consumption on systolic bloodpressure"Meat455
Reference Stuebe 2009Dietary patterns Meat: red <strong>and</strong> processed meatsStudy typeProspective cohort study (Project Viva)Level of evidence II (aetiology)Setting8 urban <strong>and</strong> suburban obstetric offices of a multispecialty group practice in eastern Massachusetts, USAFundingUS NIH, Harvard Medical School, Harvard Pilgrim <strong>Health</strong> Care FoundationParticipants1338 women giving birth to a live singleton infant, < 22 weeks gestation at study entry; 379 (27%) were overweight (BMI ≥ 26); 703 (51%) experiencedexcessive weight gainExclusions: not fluent in EnglishBaseline comparisons See confounding belowDietary assessment FFQTimingAdministered in first <strong>and</strong> second trimesters of pregnancyComparisonRed <strong>and</strong> processed meats (serves per day)Outcomes Excessive gestational weight gain (IOM 1990)ResultsExcessive gestational weight gain: red <strong>and</strong> processed meatServes per day, medianaOR (95% CI)Inadequate/adequate GWG excessive GWGMeat 0.53 [SD0.40] 0.56 [SD0.39] 1.00 (0.74 to 1.34)FollowupConfoundingRisk of biasRelevanceOther commentsTo birthAdjusted for pre-pregnancy BMI, maternal age, race/ethnicity, smoking status, gestational age at birth, nausea in first trimester in pregnancyLow risk of bias: Of 2083 eligible women, 1388 (67%) of women had data available for analysis (31 had missing information on pre-pregnancy BMI <strong>and</strong>gestational weight gain; 226 had missing covariate information <strong>and</strong> 438 had missing data on either first or second-trimester diet <strong>and</strong> mid-pregnancyphysical activity); included women were less likely to be African-American or Hispanic, to be younger, multiparous <strong>and</strong> obeseLikely to be relevant to Australian womenDietary guidelines for pregnant <strong>and</strong> <strong>breastfeeding</strong> women: evidence report456
Reference Yin 2010 (see also Jones 2000)Food typeMeatStudy typeProspective cohortLevel of evidence II (aetiology)SettingSouthern Tasmania, AustraliaFundingNHMRC, Tasmanian Government, Royal Hobart Hospital Acute Care ProgramParticipants216 adolescents born in 1988 (part of a larger infant health study of babies at high risk of SIDS)Exclusions: multiple pregnanciesBaseline comparisons Children with unemployed fathers more likely to have been excluded due to missing dataDietary assessment FFQTimingDietary intake during third trimester of pregnancyComparisonLinear regression of density (portions per kJ)OutcomesBone mass (bone mineral density (BMD) <strong>and</strong> bone mineral content*) in 16 year old adolescentsResultsBMD at 16 years;Total body (g/cm 2 )r 2 -0.002; ß +10.4 (pns)adjusted r 2 0.3324; ß +6.1 (pns)Femoral neck (g/cm 2 )r 2 0.000 ß +17.3 (pns)adjusted r 2 0.349; ß +11.1 (pns)Lumbar spine (g/cm 2 )r 2 -0.004; ß -8.4 (pns)adjusted r 2 0.200; ß -12.5 (pns)Followup16 yearsConfoundingAnalyses were adjusted for sex, weight at age 16 years, sunlight exposure in winter at age 16 years, smoking during pregnancy, sports participation,ever breast-fed, current calcium intake, Tanner stage, maternal age at the time of childbirth <strong>and</strong> “other factors” [these other factors were not listed in thepaper]Risk of bias Moderate-high: 415 children were followed from birth to age 16. This dropped to 216 (dietary information missing or unreliable for 138 mothers, 47multiple births, 14 participants had missing data for confounders) representing 52% of participants followed from birth to age 16.70% of the 216 participants were male. Gender imbalance suggests potential selection bias (due to original selection of infants at high risk of SIDS)RelevanceInfants at high risk of SIDS represent a selected group (more males, preterm births, teenage mothers, smoking during pregnancy)Other comments *Bone mineral content results not reported;Study flow figures differ between 2000 <strong>and</strong> 2010 reports (e.g. numbers of multiple births)Meat457
Reference Zhang 2006Food typeMeat: meat (beef, pork, lamb, hamburger); processed meat (bacon, hot dogs, sausage, salami, bologna <strong>and</strong> other processed meats)Study typeProspective cohortLevel of evidence II (aetiology)SettingUSAFundingNIHParticipants13,110 women who were free of cardiovascular disease, cancer, type 2 diabetes <strong>and</strong> history of GDM with at least one singleton pregnancy between1992 to 1998 (part of the Nurses’ <strong>Health</strong> Study II);Exclusions: incomplete FFQ, implausible dietary intakeBaseline comparisons See Confounding belowDietary assessmentTimingComparisonOutcomesResultsSensitivity analyses done for nulliparous women as they were over-represented (due to exclusion of women with a history of GDM)FFQDietary intake over previous year (i.e. at least some pre-pregnancy coverage)Quintiles of red meat <strong>and</strong> processed meat consumption; single meat item intakes were divided into none; < 0.14 serve per day (one serve per week); ≥0.14 serve per dayGDMGDM (RR 95% CI)Q1 Q Q3 Q4 5 P for trendRed meat (servings/day)Median (range) 0.14 (0-0.21) 0.35 (0.28-0.35) 0.49 (0.42-0.56) 0.71 (0.57-0.85) 1.07 (0.86-3.50)Number of cases of GDM 118 135 173 152 180Person-years 21,965 20,925 21,955 16,691 18,366aRR (age, parity) 1.00 1.37 (1.07 to 1.76) 1.78 (1.40 to 2.25) 2.16 (1.69 to 2.75) 2.36 (1.86 to 2.99)
Number of cases of GDM 328 333 97Person-years 48,102 41,701 9829aRR (age, parity) 1.00 1.43 (1.23 to 1.67) 1.51 (1.20 to 1.89)
ReferencesAkre O, Boyd HA, Ahlgren M, Wilbr<strong>and</strong> K, Westergaard T, Hjalgrim H,Nordenskjold A, Ekbom A <strong>and</strong> Melbye M. "Maternal <strong>and</strong> gestational riskfactors for hypospadias." Environ <strong>Health</strong> Perspect 2008: 116(8): 1071-6.Bunin GR, Gallagher PR, Rorke-Adams LB, Robison LL <strong>and</strong> Cnaan A. "Maternalsupplement, micronutrient, <strong>and</strong> cured meat intake during pregnancy <strong>and</strong> riskof medulloblastoma during childhood: a children's oncology group study."Cancer Epidemiol Biomarkers Prev 2006: 15(9): 1660-7.Bunin GR, Kushi LH, Gallagher PR, Rorke-Adams LB, McBride ML <strong>and</strong> Cnaan A."Maternal diet during pregnancy <strong>and</strong> its association with medulloblastoma inchildren: a children's oncology group study (United States)." Cancer CausesControl 2005: 16(7): 877-91.Bunin GR, Kuijten RR, Buckley JD, Rorke LB <strong>and</strong> Meadows AT. "Relationbetween maternal diet <strong>and</strong> subsequent primitive neuroectodermal braintumors in young children." N Engl J Med 1993: 329(8): 536-41.Chatzi L, Torrent M, Romieu I, Garcia-Esteban R, Ferrer C, Vioque J, KogevinasM <strong>and</strong> Sunyer J. "Mediterranean diet in pregnancy is protective for wheeze<strong>and</strong> atopy in childhood." Thorax 2008: 63(6): 507-13.George GC, Hanss-Nuss H, Milani TJ <strong>and</strong> Freel<strong>and</strong>-Graves JH. "Food choices oflow-income women during pregnancy <strong>and</strong> postpartum." J Am Diet Assoc2005: 105(6): 899-907.Giordano F, Abballe A, De Felip E, di Domenico A, Ferro F, Grammatico P,Ingelido AM, Marra V, Marrocco G, Vallasciani S <strong>and</strong> Figa-Talamanca I."Maternal exposures to endocrine disrupting chemicals <strong>and</strong> hypospadias inoffspring." Birth Defects Res A Clin Mol Teratol 2010: 88(4): 241-50.Dietary guidelines for pregnant <strong>and</strong> <strong>breastfeeding</strong> women: evidence reportGiordano F, Carbone P, Nori F, Mantovani A, Taruscio D <strong>and</strong> Figa-Talamanca I."Maternal diet <strong>and</strong> the risk of hypospadias <strong>and</strong> cryptorchidism in theoffspring." Paediatr Perinat Epidemiol 2008: 22(3): 249-60.Godfrey K, Robinson S, Barker DJ, Osmond C <strong>and</strong> Cox V. "Maternal nutritionin early <strong>and</strong> late pregnancy in relation to placental <strong>and</strong> fetal growth." BMJ1996: 312(7028): 410-4.Haugen M, Meltzer HM, Brantsaeter AL, Mikkelsen T, Osterdal ML, Alex<strong>and</strong>erJ, Olsen SF <strong>and</strong> Bakketeig L. "Mediterranean-type diet <strong>and</strong> risk of pretermbirth among women in the Norwegian Mother <strong>and</strong> Child Cohort Study(MoBa): a prospective cohort study." Acta Obstet Gynecol Sc<strong>and</strong> 2008: 87(3):319-24.Jensen CD, Block G, Buffler P, Ma X, Selvin S <strong>and</strong> Month S. "Maternal dietaryrisk factors in childhood acute lymphoblastic leukemia (United States)."Cancer Causes Control 2004: 15(6): 559-70.Jones G, Riley MD <strong>and</strong> Dwyer T. "Maternal diet during pregnancy isassociated with bone mineral density in children: a longitudinal study." Eur JClin Nutr 2000: 54(10): 749-56.Knox EG. "Anencephalus <strong>and</strong> dietary intakes." Br J Prev Soc Med 1972: 26(4):219-23.Kwan ML, Jensen CD, Block G, Hudes ML, Chu LW <strong>and</strong> Buffler PA. "Maternaldiet <strong>and</strong> risk of childhood acute lymphoblastic leukemia." Public <strong>Health</strong> Rep2009: 124(4): 503-14.Lamb MM, Myers MA, Barriga K, Zimmet PZ, Rewers M <strong>and</strong> Norris JM."Maternal diet during pregnancy <strong>and</strong> islet autoimmunity in offspring."Pediatr Diabetes 2008: 9(2): 135-41.460
Latva-Pukkila U, Isolauri E <strong>and</strong> Laitinen K. "Dietary <strong>and</strong> clinical impacts ofnausea <strong>and</strong> vomiting during pregnancy." J Hum Nutr Diet 2010: 23(1): 69-77.Maconochie N, Doyle P, Prior S <strong>and</strong> Simmons R. "Risk factors for firsttrimester miscarriage--results from a UK-population-based case-controlstudy." BJOG 2007: 114(2): 170-86.Mikkelsen TB, Osterdal ML, Knudsen VK, Haugen M, Meltzer HM, Bakketeig L<strong>and</strong> Olsen SF. "Association between a Mediterranean-type diet <strong>and</strong> risk ofpreterm birth among Danish women: a prospective cohort study." ActaObstet Gynecol Sc<strong>and</strong> 2008: 87(3): 325-30.Mitchell EA, Robinson E, Clark PM, Becroft DM, Glavish N, Pattison NS, PryorJE, Thompson JM <strong>and</strong> Wild CJ. "Maternal nutritional risk factors for small forgestational age babies in a developed country: a case-control study." ArchDis Child Fetal Neonatal Ed 2004: 89(5): F431-5.Miyake Y, Sasaki S, Tanaka K, Ohfuji S <strong>and</strong> Hirota Y. "Maternal fatconsumption during pregnancy <strong>and</strong> risk of wheeze <strong>and</strong> eczema in Japaneseinfants aged 16-24 months: the Osaka Maternal <strong>and</strong> Child <strong>Health</strong> Study."Thorax 2009: 64(9): 815-21.Miyake Y, Sasaki S, Yokoyama T, Tanaka K, Ohya Y, Fukushima W, Saito K,Ohfuji S, Kiyohara C <strong>and</strong> Hirota Y. "Risk of postpartum depression in relationto dietary fish <strong>and</strong> fat intake in Japan: the Osaka Maternal <strong>and</strong> Child <strong>Health</strong>Study." Psychol Med 2006: 36(12): 1727-35.Peters JM, Preston-Martin S, London SJ, Bowman JD, Buckley JD <strong>and</strong> ThomasDC. "Processed meats <strong>and</strong> risk of childhood leukemia (California, USA)."Cancer Causes Control 1994: 5(2): 195-202.Petridou E, Koussouri M, Toupadaki N, Youroukos S, Papavassiliou A,Pantelakis S, Olsen J <strong>and</strong> Trichopoulos D. "Diet during pregnancy <strong>and</strong> the riskof cerebral palsy." Br J Nutr 1998a: 79(5): 407-12.Petridou E, Ntouvelis E, Dessypris N, Terzidis A <strong>and</strong> Trichopoulos D."Maternal diet <strong>and</strong> acute lymphoblastic leukemia in young children." CancerEpidemiol Biomarkers Prev 2005: 14(8): 1935-9.Pogoda JM <strong>and</strong> Preston-Martin S. "Maternal cured meat consumption duringpregnancy <strong>and</strong> risk of paediatric brain tumour in offspring: potentiallyharmful levels of intake." Public <strong>Health</strong> Nutr 2001: 4(2): 183-9.Pogoda JM, Preston-Martin S, Howe G, Lubin F, Mueller BA, Holly EA, FilippiniG, Peris-Bonet R, McCredie MR, Cordier S <strong>and</strong> Choi W. "An international casecontrolstudy of maternal diet during pregnancy <strong>and</strong> childhood brain tumorrisk: a histology-specific analysis by food group." Ann Epidemiol 2009: 19(3):148-60.Radesky JS, Oken E, Rifas-Shiman SL, Kleinman KP, Rich-Edwards JW <strong>and</strong>Gillman MW. "Diet during early pregnancy <strong>and</strong> development of gestationaldiabetes." Paediatr Perinat Epidemiol 2008: 22(1): 47-59.Saito K, Yokoyama T, Miyake Y, Sasaki S, Tanaka K, Ohya Y <strong>and</strong> Hirota Y."Maternal meat <strong>and</strong> fat consumption during pregnancy <strong>and</strong> suspected atopiceczema in Japanese infants aged 3-4 months: the Osaka Maternal <strong>and</strong> Child<strong>Health</strong> Study." Pediatr Allergy Immunol 2010: 21(1 Pt 1): 38-46.Sarasua S <strong>and</strong> Savitz DA. "Cured <strong>and</strong> broiled meat consumption in relation tochildhood cancer: Denver, Colorado (United States)." Cancer Causes Control1994: 5(2): 141-8.Shiell AW, Campbell-Brown M, Haselden S, Robinson S, Godfrey KM <strong>and</strong>Barker DJ. "High-meat, low-carbohydrate diet in pregnancy: relation to adultblood pressure in the offspring." Hypertension 2001: 38(6): 1282-8.Stuebe AM, Oken E <strong>and</strong> Gillman MW. "Associations of diet <strong>and</strong> physicalactivity during pregnancy with risk for excessive gestational weight gain." AmJ Obstet Gynecol 2009: 201(1): 58 e1-8.Meat461
Yin J, Dwyer T, Riley M, Cochrane J <strong>and</strong> Jones G. "The association betweenmaternal diet during pregnancy <strong>and</strong> bone mass of the children at age 16."Eur J Clin Nutr 2010: 64(2): 131-7.Zhang C, Schulze MB, Solomon CG <strong>and</strong> Hu FB. "A prospective study of dietarypatterns, meat intake <strong>and</strong> the risk of gestational diabetes mellitus."Diabetologia 2006b: 49(11): 2604-13.Dietary guidelines for pregnant <strong>and</strong> <strong>breastfeeding</strong> women: evidence report462
Included StudiesNuts <strong>and</strong> SeedsStudyOutcomes1. Chatzi 2008 Child persistent wheeze, atopic wheeze, atopy (all at 6.5 years)2. Haggarty 2009 Deprivation3. Hourihane 1996 Childhood allergy4. Jensen 2004 Childhood acute lymphoblastic leukemia5. Sausenthaler 2007 Allergic sensitisation, eczema at 2 yrs6. Thompson 2010 (SR) Childhood allergy7. Vadas 2001 Peanut protein in breast milk8. Venter 2009 Infant food allergy sensitisation9. Willers 2008 Wheeze, dyspnoea, prescription of inhaled steroids for respiratory problems, composite variable ‘asthma symptoms’ in the last12 months (measured longitudinally from 1 to 8 years age)Nuts <strong>and</strong> Seeds463
Evidence SummariesMaternal Outcomes1. In a Scottish cohort study, maternal intake of nuts <strong>and</strong> seeds during pregnancy was notassociated with deprivationBreastfeeding Outcomes2. In a small before <strong>and</strong> after study from North America, peanut protein persisted longer than 6hours in the breastmilk of only one out of 23 womenChildhood – Asthma, Eczema <strong>and</strong> Other Allergy Outcomes3. In a German cohort study, maternal intake of nuts or seeds during pregnancy was notassociated with eczema or allergic sensitisation (food or inhalant) in children at two years ofage4. In a systematic review of two case-control studies, maternal peanut consumption duringpregnancy <strong>and</strong> <strong>breastfeeding</strong> was not associated with sensitisation <strong>and</strong> peanut allergy5. In a cross-sectional survey from the UK there was some indication that peanut allergypresents earlier in children of women consuming peanuts regularly (at least weekly) duringpregnancy <strong>and</strong> lactation6. In a cohort study from the UK, no association was seen between maternal consumption ofpeanuts during pregnancy <strong>and</strong> development of food hypersensitivity in infants up to threeyears of age7. In a Spanish cohort study, maternal intake under two serves of nuts a week compared withtwo or more serves a week did not show any significant differences in the rates of persistentwheeze, atopic wheeze or atopy in children at 6.5 years of age8. In a Dutch cohort study, maternal consumption of nut products (but not nuts) duringpregnancy was associated with a significant increase in asthma symptoms in children at eightyears of age: aOR 1.47 95% CI 1.08 to 1.99 for daily versus rare consumption of nut productsOther Childhood Outcomes9. In a US case-control study, maternal consumption of peanuts <strong>and</strong> peanut butter (mean of 3serves a day) during pregnancy was not associated with childhood acute lymphoblasticleukemiaN Level References1277 II Haggarty 200923 IV Vadas 20013097 II Sausenthaler 20072 I (SR) Thompson 2010studies622 IV Hourihane 1996969 II Venter 2009482children2832children138cases;138controlsII Chatzi 2008II Willers 2008III-3 Jensen 2004Dietary guidelines for pregnant <strong>and</strong> <strong>breastfeeding</strong> women: evidence report464
Evidence TablesReference Chatzi 2008Food typeNutsStudy typeProspective cohort studyLevel of evidence II (aetiology)Setting Women presenting antenatal care at general practices in Menorca, a Mediterranean isl<strong>and</strong> in Spain (mid 1997 to mid 1998)FundingInstituto de Salud Carlos III red de Grupos Infancia y Media Ambiente, the Fundacio “La Caixa” , Instituto de Salud Carlos III, red de Centros deInvestigacion en Epidemiologica y Salud Publica, EU, National Center for Environmental <strong>Health</strong>, USA, the GA 2 LEN project, Ministry of Education <strong>and</strong>Science, Spain, Oficina de Ciencia y Tecnologia, Generalitat Valenciana.Participants482 children of 507 women who had attended antenatal care in MenorcaBaseline comparisons See confounding belowDietary assessment FFQTimingnot clear when women did FFQ <strong>and</strong> period of pregnancy it was intended to coverComparison≤ 1 v > 1 serves of nuts per weekOutcomesPersistent wheeze, atopic wheeze <strong>and</strong> atopy at 6.5 yearsResultsPersistent wheeze at 6.5 yearsLow 19 (12.50%) v high 18 (14.06%); pns (also adjusted for firstborn <strong>and</strong> lower respiratory tract infections at age 1)Atopic wheeze at 6.5 yearsLow 9 (4.71%) v high 11 (7.24%); pns (also adjusted for birthweight <strong>and</strong> maternal atopy)Atopy at 6.5 yearsLow 37 (16.09%) v high 33 (18.23%) pns (also adjusted for birthweight <strong>and</strong> maternal atopy)Followup6.5 yearsConfounding Analyses adjusted for gender, maternal <strong>and</strong> paternal asthma, maternal social class <strong>and</strong> education, BMI at age 6.5 years <strong>and</strong> total energy intake at 6.5yearsRisk of biasLow risk of bias: Results from 468/482 children (97%) able to be analysed (4 incomplete data <strong>and</strong> 8 implausible values);RelevanceDiets in Menorca may differ from diets of Australian women, particularly urban womenNuts <strong>and</strong> Seeds465
Reference Haggarty 2009Dietary patterns Nuts <strong>and</strong> seedsStudy typeProspective cohort studyLevel of evidence II (aetiology)SettingAberdeen, Scotl<strong>and</strong>FundingUK Food St<strong>and</strong>ards AgencyParticipants1277 sequentially enrolled pregnant women attending Aberdeen Maternity Hospital for ultrasound (a further 184 women were recruited later inpregnancy).Exclusions: diabetic women, women with multiple pregnancies, women who conceived as a result of fertility treatment, or clinical data not availableBaseline comparisons See confounding belowAssessmentFFQTimingAssessed at 19 weeks gestationComparisonIntake of nuts <strong>and</strong> seeds by deciles of deprivationOutcomesDeprivation (assessed using the Scottish Index of Multiple Deprivation);Low birthweight (defined as < 2500 g or lowest decile for birthweight z score adjusted for gestational age, sex <strong>and</strong> parity)Preterm birth (< 37 weeks)Admission to neonatal unitResultsDeprivationIntake of nuts <strong>and</strong> seeds did not differ significantly between deciles of deprivation on regression analysisFollowupConfoundingRisk of biasRelevanceOther commentsTo neonatal period(Some?) analyses adjusted for energy intakeLow to moderate risk of bias: low attrition, some lack of detail in reporting of outcomesLikely to be relevant to Australian womenAbout 40-50% of the least deprived women reported taking folic acid supplements compared with about 20% for the most deprived women;Most birth outcome associations were reported by nutrient rather than food group;Not easy to deduce quantities of intake of foods (main graphs reported as change in intake by deprivation decile)Dietary guidelines for pregnant <strong>and</strong> <strong>breastfeeding</strong> women: evidence report466
Reference Hourihane 1996Dietary patterns Nuts: peanutsStudy typeCross-sectional surveyLevel of evidence IV (aetiology)Setting Southampton, UK; 1994/5FundingUK Ministry of Agriculture, Fisheries <strong>and</strong> FoodParticipants622 respondents known to have a peanut allergy (mostly children)Baseline comparisons n/aDietary assessment questionnaireTimingVariable – after birthComparisonIntake of peanuts at least weekly during pregnancy <strong>and</strong> lactation versus no peanut consumptionOutcomesPeanut allergy, time of development of peanut allergyResultsMothers of younger prob<strong>and</strong>s (5 years or younger) were significantly more likely than mothers of older prob<strong>and</strong>s to have regularly consumed peanuts(at least weekly) during pregnancy <strong>and</strong> lactation (104 (50.7%) v 138 (33.1%); p < 0.005). In other words, peanut allergy presents earlier in womenconsuming peanuts during pregnancy <strong>and</strong> lactation.Followupn/aConfoundingn/aRisk of biasModerate-high risk of bias: 622/833 (75%) usable responses to questionnaire; maternal recall of peanut consumption during pregnancy <strong>and</strong> lactationsubject to biasRelevanceLikely to be relevant to Australian womenOther commentsNuts <strong>and</strong> Seeds467
Reference Jensen 2004Food typeNuts: peanuts <strong>and</strong> peanut butter (also in legumes)Study typeCase controlLevel of evidence III-3 (aetiology)SettingCalifornia, USA (part of the Northern California Childhood Leukemia Study)FundingPHSParticipants138 matched cases <strong>and</strong> controls:Cases: Children under 15 years of age, with a parent who spoke English or Spanish, were resident in the study area at the time of diagnosis of acutelymphoblastic leukemia (ALL), with no prior diagnosis of cancerControls: identified from birth certificates matched to the case on date of birth, sex, maternal race, Hispanic ethnicity of mother or father, <strong>and</strong> county ofresidence at birthBaseline comparisons A priori potential confounders were identified as birthweight, <strong>breastfeeding</strong>, maternal age <strong>and</strong> education, parental occupation <strong>and</strong> smoking duringpregnancy – no evidence of confounding was seen for these variables. Also see Confounding below.Dietary assessment FFQTimingDietary intake to reflect the year before the index pregnancy (to indicate dietary status at the start of pregnancy)ComparisonServes of nutsOutcomesChildhood acute lymphoblastic leukemiaResultsPeanuts, peanut butter: aOR 1.00 95% CI 0.86 to 1.18: mean consumption 2.99 [SD 1.89] serves per day*Followupn/aConfoundingAnalyses were adjusted for variables previously shown to be significantly associated with ALL in the overall study – income, prior fetal loss, child’sexposure to other children under age five, <strong>and</strong> maternal exposure to indoor insecticides during pregnancy; along with portion size <strong>and</strong> energyconsumptionRisk of biasLow-moderate risk of bias: Of eligible cases identified from January 1995 to November 1999, 83% consented to participate; 69% of the eligible controlsagreed to participate. Of the 161 matched pairs, seven pairs were excluded as the respondent was not the biological mother, 16 pairs were excludeddue to questionable dietary questionnaire data, leaving 138 matched pairs (86%); some recall bias likelyRelevanceLikely to be relevant for Australian women, though some diet components may differ e.g. high bean consumptionOther comments *Some consumption levels seem high – possibly per week rather than per day?Dietary guidelines for pregnant <strong>and</strong> <strong>breastfeeding</strong> women: evidence report468
Reference Sausenthaler 2007Food groupsNuts <strong>and</strong> seedsStudy typeProspective cohort study: from the LISA birth cohortLevel of evidence II (aetiology)Setting4 German cities (Munich, Leipzig, Wesel, Bad Honnef)FundingFederal Ministry for Education, Science, Research <strong>and</strong> Technology, GermanyParticipants3097 newborns recruitedBaseline comparisons See Confounding belowDietary assessment FFQTimingMaternal diet during the last 4 weeks of pregnancy (obtained shortly after birth, median 3 days)VariableLow intake group as reference group compared with high intake group: Nuts high intake = 1-2 times/week Seeds high intake = 1-2 times/weekOutcomesAllergic sensitisation, eczema at 2 yrsResultsDoctor-diagnosed eczema Any allergen sensitisation Food allergens Inhalant allergensAdjusted OR (95% CI)Nuts 0.85 (0.63, 1.14) 0.92 (0.62, 1.34) 1.10 (0.72, 1.67) 0.84 (0.46, 1.53)Seeds 1.24 (0.94, 1.64) 0.78 (0.53, 1.14) 0.72 (0.47, 1.12) 0.75 (0.42, 1.33)Length of followupConfoundingRisk of biasRelevanceOther comments2 yearsCrude <strong>and</strong> adjusted results reported (adjusted for study area, sex, maternal age, maternal smoking, level of parental education, exclusive <strong>breastfeeding</strong>≥ 4 months, parental history of atopic diseases, season of birth <strong>and</strong> all dietary variablesLow risk of bias: two year data available for 2641/3097 children (85%): 433 lost to follow-up, 9 excluded due to chronic disease, 14 missing maternalFFQLikely to be reasonably similar to dietary intakes of Australian women in AustraliaNuts <strong>and</strong> Seeds469
Reference Thompson 2010Food groupsNuts: peanutsStudy type Systematic review of studies published between 1 January 1999 <strong>and</strong> 7 March 2008Level of evidence III (aetiology)SettingInternationalFundingUK Food St<strong>and</strong>ards AgencyParticipantsTwo included studies: Frank 1999 (case control); Lack 2003 (case-control)Baseline comparisons See risk of biasDietary assessment Questionnaire/telephone interviewTimingQuestionnaire relating to pregnancy, lactation <strong>and</strong> child administered when child food allergy diagnosedComparisonFrequency of peanut consumption during pregnancy <strong>and</strong> lactationOutcomes 1) Sensitisation (positive peanut-specific IgE)2) Peanut allergy (double blind placebo-controlled food challenge)ResultsPregnancyFrank 1999: Peanut consumption during pregnancy > once per week < once per weekPeanut-sensitive group (n=23) 11 12Control group (n=16) 3 13Crude OR=3.97 (95% CI 0.73 to 24.0) p=0.063Lack 2003: % of mothers consuming peanuts during pregnancyCases (n = 23) – 65%; Controls (atopic; n = 70) – 71%; Controls (non-atopic; n = 140) – 61%: pnsLactationFrank 1999: Peanut consumption during lactation > once per week < once per weekCrude OR 2.19 95% CI 0.39 to 13.47Lack 2003: % of mothers consuming peanuts at least seven times a weekCases – 17%; Controls (atopic) – 5%; Controls (non-atopic) – 5%: p = 0.03, pns after adjustmentLength of followup Three yearsConfoundingSee risk of biasRisk of biasLow risk of bias for conduct of systematic review although studies published prior to 1999 not discussed); moderate risk of bias for included studies (onestudy did not adjust for confounders; while the other study did, it did not report which confounders were adjusted forRelevanceLikely to be reasonably similar to dietary intakes of Australian women in AustraliaOther comments Mentions ongoing studies such as LEAP (Learning Early About Peanut Allergy) – findings due 2013Dietary guidelines for pregnant <strong>and</strong> <strong>breastfeeding</strong> women: evidence report470
Reference Vadas 2001Food groupsPeanuts (dry roasted)Study typeBefore <strong>and</strong> after studyLevel of evidence IV (intervention)Setting North America (women recruited from March 1999 to October 2000)Funding<strong>Health</strong> Canada, the Peanut Foundation, Allergy, Asthma <strong>and</strong> Immunology Society of Ontario, <strong>and</strong> Nestle CanadaParticipants23 healthy lactating women aged 21-35 years, excluding women with known peanut or tree nut allergyBaseline comparisons NADietary assessment NATimingSee belowVariableIngestion of 50 g dry roasted peanuts after initial breast milk collection compared with breast milk collected at 1, 2, 3, 4, 6, 8 <strong>and</strong> 12 hours after peanutingestionOutcomesPeanut protein in breast milkResults Detection of peanut protein in 11/23 women (47.8%);Length of followupConfoundingRisk of biasRelevanceOther commentsIn these 11 women, peanut protein appeared within 1 hour to 6 hours; <strong>and</strong> cleared rapidly for all but one of the 11 womenn/an/aLow risk of bias: women acted as their own controls (they were instructed to avoid legumes 24 hours prior to start of the study)Likely to be relevant to Australian womenNuts <strong>and</strong> Seeds471
Reference Venter 2009Food groupsNuts: peanutsStudy typeProspective cohortLevel of evidence II (aetiology)SettingPortsmouth, UKFundingFood St<strong>and</strong>ards AgencyParticipants 969 pregnant women at 12 weeks gestation (with estimated birth date between 1 September 2001 <strong>and</strong> 31 August 2002)Baseline comparisons <strong>Pregnant</strong> women with a maternal history of atopic disease were more likely to smokeDietary assessment FFQTimingFFQ at 36 weeks gestationComparisonNo (54% of women) versus moderate (44%) versus frequent (2%) versus uncertain (
Reference Willers 2008Food typeNuts <strong>and</strong> nut productsStudy typeProspective cohort (longitudinal)Level of evidence II (aetiology)SettingNetherl<strong>and</strong>sFundingNetherl<strong>and</strong>s Organization for <strong>Health</strong> Research <strong>and</strong> Development, Netherl<strong>and</strong>s Organization for Scientific Research; Netherl<strong>and</strong>s Asthma Fund;Netherl<strong>and</strong>s Ministry of Spatial Planning, Housing, <strong>and</strong> the Environment; Netherl<strong>and</strong>s Ministry of <strong>Health</strong>, Welfare <strong>and</strong> Sport, GlaxoSmithKlineParticipants2,832 children (part of the Prevention <strong>and</strong> Incidence of Asthma <strong>and</strong> Mite Allergy (PIAMA) birth cohort studyBaseline comparisons See confounding belowDietaryFFQassessmentTimingFFQ administered at antenatal recruitment (mean gestational ages not reported) to cover dietary intake over the previous monthComparisonNuts: daily (once per day or more) or regular v rare consumption;Nut products: daily v regular v rare consumptionOutcomesWheeze, dyspnoea, prescription of inhaled steroids for respiratory problems, composite variable ‘asthma symptoms’ in the last 12 months (measuredlongitudinally from 1 to 8 years age); IgE at 8 years for a subset of childrenResultsNUTSWheeze from 1 to 8 years age (n = 2806)OR 0.96 95% CI 0.83 to 1.12aOR 0.99 95% CI 0.86 to 1.15Dyspnoea from 1 to 8 years age (n = 2806)OR 1.00 95% CI 0.82 to 1.19aOR 1.04 95% CI 0.88 to 1.23Steroid use from 1 to 8 years age (n = 2806)OR 0.95 95% CI 0.75 to 1.19aOR 1.03 95% CI 0.81 to 1.29Asthma symptoms (composite of previous three outcomes) from 1 to 8 years age (n = 2806)OR 0.96 95% CI 0.82 to 1.11aOR 1.00 95% CI 0.86 to 1.17NUT PRODUCTSWheeze from 1 to 8 years age (n = 2806)Regular v rareOR 1.04 95% CI 0.90 to 1.21aOR 1.01 95% CI 0.88 to 1.18Daily v rareOR 1.39 95% CI 1.05 to 1.86aOR 1.42 95% CI 1.06 to 1.89Nuts <strong>and</strong> SeedsDyspnoea from 1 to 8 years age (n = 2806)Regular v rareOR 0.99 95% CI 0.82 to 1.18473
aOR 0.98 95% CI 0.82 to 1.16Daily v rareOR 1.52 95% CI 1.12 to 2.06aOR 1.58 95% CI 1.16 to 2.15Steroid use from 1 to 8 years age (n = 2806)Regular v rareOR 0.94 95% CI 0.74 to 1.18aOR 0.94 95% CI 0.74 to 1.19Daily v rareOR 1.48 95% CI 0.98 to 2.22aOR 1.62 95% CI 1.06 to 2.46Asthma symptoms (composite of previous three outcomes) from 1 to 8 years age (n = 2806)Regular v rareOR 0.99 95% CI 0.85 to 1.15aOR 0.98 95% CI 0.84 to 1.14Daily v rareOR 1.41 95% CI 1.05 to 1.89aOR 1.47 95% CI 1.08 to 1.99FollowupConfoundingRisk of biasRelevanceOther comments8 yearsThe child’s dietary data on fruit, vegetables, fish, eggs, full cream milk, butter <strong>and</strong> peanut butter consumption at 2 years of age were used to check forpotential confounding by the child’s diet.Results were adjusted for by sex, maternal education, parental allergy, maternal smoking during pregnancy, smoking in the home at 8 years of age,<strong>breastfeeding</strong>, presence of older siblings, birthweight, maternal overweight 1 year after pregnancy, maternal supplement use during pregnancy, region<strong>and</strong> study arm (intervention or natural history arm).Moderate risk of bias: Initial study population of 4,146 mothers dropped to 2,832 participants with complete data (68.3%) (pregnancy questionnaire, atleast one of the outcome time points <strong>and</strong> all confounders). Participants with complete data were more likely to have a high education level, to have dailydairy <strong>and</strong> fruit intake during pregnancy <strong>and</strong> to have breastfed <strong>and</strong> less likely to have maternal asthma or maternal atopy, smoked during pregnancy, befrom a south western region compared with participants who did not have complete data.Dietary intakes likely to be different from Australian e.g. low fish consumption in study participantsNot clear when women assessed their diet during pregnancy;83% of pregnant women used supplements (50% used folic acid/iron)Dietary guidelines for pregnant <strong>and</strong> <strong>breastfeeding</strong> women: evidence report474
ReferencesChatzi L, Torrent M, Romieu I, Garcia-Esteban R, Ferrer C, Vioque J, KogevinasM <strong>and</strong> Sunyer J. "Mediterranean diet in pregnancy is protective for wheeze<strong>and</strong> atopy in childhood." Thorax 2008: 63(6): 507-13.Haggarty P, Campbell DM, Duthie S, Andrews K, Hoad G, Piyathilake C <strong>and</strong>McNeill G. "Diet <strong>and</strong> deprivation in pregnancy." Br J Nutr 2009: 102(10):1487-97.Hourihane JO, Dean TP <strong>and</strong> Warner JO. "Peanut allergy in relation toheredity, maternal diet, <strong>and</strong> other atopic diseases: results of a questionnairesurvey, skin prick testing, <strong>and</strong> food challenges." BMJ 1996: 313(7056): 518-21.Jensen CD, Block G, Buffler P, Ma X, Selvin S <strong>and</strong> Month S. "Maternal dietaryrisk factors in childhood acute lymphoblastic leukemia (United States)."Cancer Causes Control 2004: 15(6): 559-70.Thompson RL, Miles LM, Lunn J, Devereux G, Dearman RJ, Strid J <strong>and</strong> ButtrissJL. "Peanut sensitisation <strong>and</strong> allergy: influence of early life exposure topeanuts." Br J Nutr 2010: 103(9): 1278-86.Vadas P, Wai Y, Burks W <strong>and</strong> Perelman B. "Detection of peanut allergens inbreast milk of lactating women." JAMA 2001: 285(13): 1746-8.Venter C, Pereira B, Voigt K, Grundy J, Clayton CB, Higgins B, Arshad SH <strong>and</strong>Dean T. "Factors associated with maternal dietary intake, feeding <strong>and</strong>weaning practices, <strong>and</strong> the development of food hypersensitivity in theinfant." Pediatr Allergy Immunol 2009: 20(4): 320-7.Willers SM, Wijga AH, Brunekreef B, Kerkhof M, Gerritsen J, Hoekstra MO, deJongste JC <strong>and</strong> Smit HA. "Maternal food consumption during pregnancy <strong>and</strong>the longitudinal development of childhood asthma." Am J Respir Crit CareMed 2008: 178(2): 124-31.Sausenthaler S, Koletzko S, Schaaf B, Lehmann I, Borte M, Herbarth O, vonBerg A, Wichmann HE <strong>and</strong> Heinrich J. "Maternal diet during pregnancy inrelation to eczema <strong>and</strong> allergic sensitization in the offspring at 2 y of age."Am J Clin Nutr 2007: 85(2): 530-7.Nuts <strong>and</strong> Seeds475
Included studiesSalt/SodiumStudyOutcomes1. Bower 1961 Induction, caesarean, perinatal death, mean stay in hospital, birthweight, eclampsia, blood pressure change2. Duley 1999 & 2005 Hypertension, pre-eclampsia <strong>and</strong> birth outcomes3. Jensen 2004 Childhood acute lymphoblastic leukemia4. Morris 2001 Pre-eclampsia; pregnancy-associated hypertensionDietary guidelines for pregnant <strong>and</strong> <strong>breastfeeding</strong> women: evidence report476
Evidence summariesMaternal Outcomes1. In a quasi-RCT from the UK <strong>and</strong> Canada, no significant differences were seen betweenmaternal intake of 2 g versus 10 g versus 25 g per day in hospitalised pregnantwomen for eclampsia or caesarean section2. In a Cochrane systematic review, no significant differences were seen between a lowsalt diet or no dietary advice for pregnant women for pre-eclampsia or caesareansection3. In a US cohort study, amount of sodium in pregnant women’s diet was not associatedwith increased risk of pre-eclampsia or pregnancy-associated hypertensionBirth Outcomes4. In a quasi-RCT from the UK <strong>and</strong> Canada, no significant differences were seen betweenmaternal intake of 2 g versus 10 g versus 25 g per day in hospitalised pregnantwomen for perinatal death or birthweight5. In a Cochrane systematic review, no significant differences were seen between a lowsalt diet or no dietary advice for pregnant women for perinatal death, preterm birthor birthweightChildhood Outcomes6. In a US case control study, maternal sodium intake during pregnancy was notassociated with an increase in number of cases of childhood acute lymphoblasticleukemia in their offspringN Level References1082 III-1(intervention)2 RCTs(603women)I (CochraneSR)Bower 1961Duley 1999; Duley 20054314 II Morris 20011082 III-1(intervention)2 RCTs(603women)138cases;138controlsI (CochraneSR)Bower 1961Duley 1999; Duley 2005III-3 Jensen 2004Salt / Sodium477
Evidence TablesReference Bower 1964Food typeSaltStudy typeQuasi-RCT (allocated by booking or admission date or by ward) with historical armLevel of evidence III-1 (intervention)SettingLondon, UK & Toronto, CanadaFundingBerkeley Fellowship Committee of Caius College, Cambridge <strong>and</strong> Middlesex Hospital, UKParticipantsUK: 739 women (341 in 2 g group (1958); 201 in 10 g group (1959-60); 197 in 25 g group (1959-60); with at least two of 1) blood pressure > 140 systolicor 90 diastolic, providing that the systolic BP was not less than 120 <strong>and</strong> the diastolic BP was not less than 80; 2) definite oedema; 3) more than ‘a trace’of albuminuriaCanada: 243 women (113 low salt diet in 1960 <strong>and</strong> 130 normal diet in 1961)Baseline comparisons Not reportedDietary assessment NATimingNAComparison2 g versus 10 g versus 25 g salt per dayOutcomesInduction, caesarean, perinatal death, mean stay in hospital, birthweight, eclampsia, blood pressure change (first v second half of admission)Results UK 2g 10g 25g p (2 v 10g) p (2 v 25g)Induction 213/341 (63%) 118/201 (59%) 115/197 (58%) ns nsCaesarean 19/341 (5.6%) 10 (5.0%) 10 (5.1%) ns nsPerinatal death 20/341 (5.9%) 11/201 (5.5%) 9/197 (6.4%) ns nsHospital stay (days) 9.9 10 8.7 ns nsBirthweight (lbs) 6.7 6.9 6.9 ns nsEclampsia 4/341 2/201 2/197 ns nsBP Change- Systolic +0.101 -0.129 -0.019 ns ns- Diastolic +0.103 +0.020 +0.131 ns nsFollowupConfoundingRisk of biasRelevanceOther commentsCanada Low salt (1.5g) Normal salt (10g) pInduction 48/113 (42.5%) 47/130 (31.5%) nsCaesarean 19/113 (16.8) 16/130 (12.3%) nsPerinatal death 8/118 (7.1%) 5/133 (3.8%) nsHospital stay (days) 7.6 7.6 nsBirthweight (lbs) 7.0 6.8 nsBP Change- Systolic -0.055 +0.02 ns- Diastolic +0.017 -0.013 nsNANot reportedModerate to high risk of bias: no adjustments made for potential confoundersLimited relevance from old studyDietary guidelines for pregnant <strong>and</strong> <strong>breastfeeding</strong> women: evidence report478
Reference Duley 1999 <strong>and</strong> 2005Food typeSaltStudy typeSR ( 2 Cochrane reviews) of two RCTs:1) Steegers 1991; van Buul 1995; van Buul 1997; van Buul 1992; van Buul 1991; van der Maten 1995; van der Post 19972) Knuist 1998Level of evidence I (intervention)SettingNetherl<strong>and</strong>s (both trials)FundingDepartment for International Development, UK; MRC, UKParticipants603 pregnant nulliparous womenBaseline comparisons n/aDietary assessment n/aTimingFrom 12 weeks gestation in one trial <strong>and</strong> after 20 weeks gestation in the other trialComparisonLow salt diet (20 or 50 mmol/day) versus no dietary adviceOutcomesHypertension, pre-eclampsia <strong>and</strong> birth outcomes (see results)ResultsHypertension RR 0.98 95% CI 0.49 to 1.94 1 trial (n = 242)Pre-eclampsia RR 1.11 95% CI 0.46 to 2.66 2 trials (n = 603)Referral to hospital, no admission RR 1.05 95% CI 0.48 to 2.32 1 trial (n = 361)Admission to hospital RR 0.82 95% CI 0.56 to 1.22 1 trial (n = 361)Placental abruption RR 0.19 95% CI 0.01 to 3.98 1 trial (n = 361)Caesarean section RR 0.75 95% CI 0.44 to 1.27 1 trial (n = 361)Perinatal mortality RR 1.92 95% CI 0.18 to 21.03 2 trials (n = 409)Birthweight < 10 th centile RR 1.5 95% CI 0.73 to 3.07 1 trial (n = 242)Birthweight
Reference Jensen 2004Food typeSodiumStudy typeCase controlLevel of evidence III-3 (aetiology)SettingCalifornia, USA (part of the Northern California Childhood Leukemia Study)FundingPHSParticipants138 matched cases <strong>and</strong> controls:Cases: Children under 15 years of age, with a parent who spoke English or Spanish, were resident in the study area at the time of diagnosis of acutelymphoblastic leukemia (ALL), with no prior diagnosis of cancerControls: identified from birth certificates matched to the case on date of birth, sex, maternal race, Hispanic ethnicity of mother or father, <strong>and</strong> county ofresidence at birthBaseline comparisons A priori potential confounders were identified as birthweight, <strong>breastfeeding</strong>, maternal age <strong>and</strong> education, parental occupation <strong>and</strong> smoking duringpregnancy – no evidence of confounding was seen for these variables. Also see Confounding below.Dietary assessment FFQTimingDietary intake to reflect the year before the index pregnancy (to indicate dietary status at the start of pregnancy)ComparisonSodium intake per dayOutcomesChildhood acute lymphoblastic leukemiaResultsChildhood acute lymphoblastic leukemiaaOR 0.29 95% CI 0.05 to 1.84; mean daily intake of sodium 2603.7 mg [SD 1052.4]FollowupConfoundingRisk of biasRelevanceOther commentsn/aAnalyses were adjusted for variables previously shown to be significantly associated with ALL in the overall study – income, prior fetal loss, child’sexposure to other children under age five, <strong>and</strong> maternal exposure to indoor insecticides during pregnancy; along with portion size <strong>and</strong> energyconsumptionLow-moderate risk of bias: Of eligible cases identified from January 1995 to November 1999, 83% consented to participate; 69% of the eligible controlsagreed to participate. Of the 161 matched pairs, seven pairs were excluded as the respondent was not the biological mother, 16 pairs were excludeddue to questionable dietary questionnaire data, leaving 138 matched pairs (86%); some recall bias likelyLikely to be relevant for Australian women, though some diet components may differ e.g. high bean consumptionDietary guidelines for pregnant <strong>and</strong> <strong>breastfeeding</strong> women: evidence report480
Reference Morris 2001Food typeSaltStudy typeProspective cohort studyLevel of evidence II (aetiology)SettingUSA (part of RCT of calcium, CPEP); both arms of the RCT were pooled as no significant differences were seen between calcium <strong>and</strong> placeboFundingNICHHD, National Heart, Lung <strong>and</strong> Blood InstituteParticipants4314 women recruited at 13 to 21 weeks gestationBaseline comparisons See confounding belowDietary assessment 24 hour dietary recallTimingDietary recall at time of recruitmentComparisonAmount of dietary sodiumOutcomesPre-eclampsia <strong>and</strong> pregnancy-associated hypertension (diastolic BP ≥ 90 mmHg on 2 occasions from 4 to 168 hours apart)ResultsUnadjusted (univariate analysis)4322 mg/day SE 123; p < 0.15 compared with normotensivepregnancyPre-eclampsia (n = 311): 4215 mg/day SE 77Pregnancy-associated hypertension (n = 721): 4242 mg/day SE 39Normotensive pregnancy (n = 3215):Pre-eclapsia< 2544 mg/day 1.002544 – 3451 1.65 95% CI 1.11 to 2.463452 – 4328 1.23 95% CI 0.79 to 1.874329 – 5706 1.35 95% CI 0.87 to 2.105707 1.49 95% CI 0.90 to 2.48Pregnancy-associated hypertension< 2544 mg/day 1.002544 – 3451 1.02 95% CI 0.78 to 1.343452 – 4328 1.11 95% CI 0.84 to 1.464329 – 5706 1.05 95% CI 0.78 to 1.415707 1.06 95% CI 0.75 to 1.51FollowupConfoundingRisk of biasRelevanceOther commentsTo 24 hours postpartumAdjusted for total energy intake <strong>and</strong> for variables found to be significant in univariate analysis (race/ethnicity <strong>and</strong> BMI)Low-moderate risk of bias: Of the 4589 women recruited, 253 (5.5%) could not be followed up for the outcomes of pre-eclampsia <strong>and</strong> pregnancyassociatedhypertension; 22 women (0.5%) were excluded because pregnancy terminated < 20 weeks gestation;Accuracy of 24 hour dietary recall unknownLikely to be similar to Australian womenNot clear if OR or RR used in multivariate analyses (graph shows as RR; legend shows as OR)Salt / Sodium481
ReferencesBower D. "The influence of dietary salt intake on pre-eclampsia." J ObstetGynaecol Br Commonwealth 1961: 63: 123-5.Duley L, Henderson-Smart D. "Reduced salt intake compared to normaldietary salt, or high intake, in pregnancy." Cochrane Database of Systematic<strong>Review</strong>s 1999: (3).Duley L, Henderson-Smart D <strong>and</strong> Meher S. "Altered dietary salt forpreventing pre-eclampsia, <strong>and</strong> its complications." Cochrane Database SystRev 2005: (4): CD005548.Jensen CD, Block G, Buffler P, Ma X, Selvin S <strong>and</strong> Month S. "Maternal dietaryrisk factors in childhood acute lymphoblastic leukemia (United States)."Cancer Causes Control 2004: 15(6): 559-70.Morris CD, Jacobson SL, An<strong>and</strong> R, Ewell MG, Hauth JC, Curet LB, Catalano PM,Sibai BM <strong>and</strong> Levine RJ. "Nutrient intake <strong>and</strong> hypertensive disorders ofpregnancy: Evidence from a large prospective cohort." Am J Obstet Gynecol2001: 184(4): 643-51.Dietary guidelines for pregnant <strong>and</strong> <strong>breastfeeding</strong> women: evidence report482
Included StudiesSugarStudyOutcomes1. Chen 2009 GDM2. George 2005 Breastfeeding3. Haggarty 2009 Deprivation, SGA4. Herrick 2003 Cortisol concentrations in offspring aged 30 years5. Kwan 2009 Childhood acute lymphoblastic leukemia6. Lenders 1994 Gestational weight gain, preterm birth, birthweight, SGA7. Lenders 1996 SGA8. Nwaru 2010 Allergic sensitisation in offspring by 5 years9. Olafsdottir 2006 GWG10. Petridou 2005 Childhood acute lymphoblastic leukemia11. Petridou 1998a Cerebral palsy at 8 years12. Petridou 1998b Birthweight13. Stuebe 2009 GWGSugar483
Evidence SummariesMaternal Outcomes1. In a Scottish cohort study, confectionery intake did not differ significantly between deciles ofdeprivation on regression analysis <strong>and</strong> sugar sweetened beverages (soft drinks) showedsignificantly higher intake with higher levels of deprivation (p < 0.001)2. In a US cohort study, maternal consumption of sugar sweetened beverages was notassociated with an increased risk of excessive gestational weight gain under a multivariatelogistic regression model: aOR 0.87 95% CI 0.72 to 1.05 (serves per day)3. In a cohort study from USA, differing maternal consumption of sugar (low versus high) duringpregnancy was not associated with differences in gestational weight gain4. In a cohort study from Icel<strong>and</strong>, eating more sweets in early pregnancy was associated withincreased risk of excessive gestational weight gain: aOR 2.52 95% CI 1.10 to 5.775. In a US cohort study, consumption of sugar-sweetened beverages overall during pregnancywas not associated with an increased risk of gestational diabetes mellitus, although it wasfor sugar-sweetened cola beverages (but not diet cola): aOR for SSBs overall: 1.16 95% CI 0.98 to 1.37; p trend = 0.06 aOR for GDM with sugar-sweetened cola beverages: 1.22 95% CI 1.01 to 1.47; p trend = 0.04 aOR for GDM with diet cola beverages: 0.90 95% CI 0.78 to 1.03; p trend = 0.07Breastfeeding6. In a cohort study from the US, no significant differences were seen in postpartum addedsugar consumtion between lactating <strong>and</strong> nonlactating womenBirth Outcomes7. In a Scottish cohort study, low maternal sugar intake during pregnancy was associated withSGA (being in the lowest decile for st<strong>and</strong>ardised birthweight): OR 0.78 95% CI 0.64 to 0.96)8. In a cohort study from USA, differing maternal consumption of sugar (low versus high) duringpregnancy was not associated with differences in SGA (p = 0.08)9. In a cohort study from USA, high sugar consumption by pregnant teenagers was associatedwith a higher rate of SGA: aOR 2.01 95% CI 1.05 to 7.5310. In a cohort study from USA, differing maternal consumption of sugar (low versus high) duringpregnancy was not associated with differences in preterm birth (11% versus 12%)Asthma And Allergy Outcomes11. In a Finnish cohort study, no significant associations were seen between maternalconsumption of sweets <strong>and</strong> chocolates <strong>and</strong> allergic sensitisation in their children at fiveDietary guidelines for pregnant <strong>and</strong> <strong>breastfeeding</strong> women: evidence reportN Level References1277 II Haggarty 20091338 II Stuebe 2009337 II Lenders 1994495 II Olafsdottir 200613,475 II Chen 2009149 II George 20051277 II Haggarty 2009337 II Lenders 1994594 II Lenders 1996337 II Lenders 1994931 children II Nwaru 2009484
years of ageOther Childhood Outcomes12. In a US case-control study maternal intake of sugar during pregnancy was not associatedwith increased risk of acute lymphoblastic leukemia in children up to 15 years of age: aOR0.99 95% CI 0.96 to 1.02 for sweets as % energy (median consumption 8.00% energy per day)13. In a Greek case-control study, maternal intake of sugars <strong>and</strong> syrups was associated withincreased risk of acute lymphoblastic leukemia in children up to 5 years of age: logisticregression: one quintile more of sugars/syrups: aOR 1.32 95% CI 1.05 to 1.6714. In a Greek case-control study, cerebral palsy in children up to eight years of age was notassociated with maternal consumption of sugars <strong>and</strong> syrups during pregnancy; regressionanalysis for each unit (once a week) aOR 1.21 95% CI 0.77 to 1.9015. In a cohort study from Scotl<strong>and</strong>, no significant associations was seen between maternalconsumption of sweets <strong>and</strong> cortisol concentrations in offspring at 30 years of age282 cases;282 controls131 cases<strong>and</strong> 131controls138 cases;138 controlsIII-3 Kwan 2009III-3 Petridou 2005III-3Petridou 1998a251 II Herrick 2003Sugar485
Evidence TablesReference Chen 2009Food groupsSugar: sugar-sweetened beverages (SSB); [results for low calorie beverages included under ‘Beverages’]Study typeProspective cohortLevel of evidence II (aetiology)SettingUS (Nurses’ <strong>Health</strong> Study)FundingNIHParticipants 13,475 women who reported at least one singleton pregnancy between 1992 <strong>and</strong> 2001Exclusions: history of diabetes, cancer, cardiovascular disease or GDM on 1989 or 1991 questionnairesBaseline comparisons See confounding belowDietary assessments FFQTimingConsumption of SSBs before pregnancyComparison0.3 serves of SSBs a month versus 1-4 a week versus ≥ 5 a week versus 1 a dayOutcomesGDMResultsLength of followupConfoundingGDM (RR 95% CI)SSB consumption0-3 serves/month 1-4 serves/week ≥5 serves/week 1 serve/day p trendAll S SBsCases/person-years 323/185,682 229/173,189 208/185,757Model 1 1.00 1.01 (0.85 to 1.20) 1.23 (1.05 to 1.45) 1.25 (1.07 to 1.45) 0.005Model 2 1.00 1.02 (0.86 to 1.21) 1.17 (1.00 to 1.37) 1.18 (1.01 to 1.37) 0.04Model 3 1.00 1.06 (0.89 to 1.25) 1.23 (1.05 to 1.44) 1.23 (1.05 to 1.43) 0.01Model 4 1.00 1.03 (0.87 to 1.23) 1.16 (0.98 to 1.37) 1.16 (0.99 to 1.36) 0.06Sugar-sweetened colaCases/person-years 544/332,516 168/113,899 148/98,214Model 1 1.00 1.12 (0.94 to 1.33) 1.39 (1.16 to 1.67) 1.39 (1.16 to 1.67) < 0.001Model 2 1.00 1.07 (0.90 to 1.28) 1.26 (1.04 to 1.51) 1.25 (1.04 to 1.51) 0.02Model 3 1.00 1.11 (0.93 to 1.32) 1.29 (1.07 to 1.56) 1.29 (1.07 to 1.55) 0.007Model 4 1.00 1.08 (0.90 to 1.28) 1.22 (1.01 to 1.47) 1.22 (1.01 to 1.47) 0.04Other S SBsCases/person-years 448/254,751 256/195,695 156/94,182Model 1 1.00 1.00 (0.86 to 1.17) 0.98 (0.81 to 1.17) 0.97 (0.77 to 1.22) 0.78Model 2 1.00 1.00 (0.86 to 1.17) 0.95 (0.79 to 1.14) 0.94 (0.74 to 1.18) 0.58Model 3 1.00 1.06 (0.90 to 1.23) 0.99 (0.82 to 1.19) 0.99 (0.78 to 1.25) 0.92Model 4 1.00 1.02 (0.87 to 1.19) 0.94 (0.78 to 1.13) 0.92 (0.78 to 1.16) 0.4810 yearsModel 1: adjusted for age <strong>and</strong> parityModel 2: adjusted for age <strong>and</strong> parity; plus race/ethnicity; smoking status, family history of diabetes in a first degree relative, alcohol intake, physicalactivityModel 3: adjusted for age <strong>and</strong> parity, race/ethnicity; smoking status, family history of diabetes in a first degree relative, alcohol intake, physical activity;Dietary guidelines for pregnant <strong>and</strong> <strong>breastfeeding</strong> women: evidence report486
Risk of biasRelevanceOther commentsplus BMIModel 4: adjusted for age <strong>and</strong> parity, race/ethnicity; smoking status, family history of diabetes in a first degree relative, alcohol intake, physical activity;BMI, plus Western dietary patternLow-moderate risk of bias: typically 90% followup rate; analyses did not adjust for other caffeine useLikely to be relevant to Australian womenCaramel colouring in cola drinks is rich in advanced glycation end products, but positive association was not seen for diet cola (see Caffeine food group)Sugar487
Reference George 2005Food typeFoods with added sugar (Coke/Sprite; fruit drinks; Gatorade, Snapple; sugar, syrup, jams, honey); chocolate c<strong>and</strong>yStudy typeProspective cohort studyLevel of evidence II (aetiology)SettingTexas, USFundingNot reportedParticipants149 Medicaid-qualified women (30% white, 24% African American, 46% Hispanic) – recruited from a larger study on postpartum weight retentionInclusion criteria: 18 years or older; non-Hispanic white, African American or Hispanic ethnicity; birth of a health term infant, fluency <strong>and</strong> literacy inEnglish; absence of pregnancy-related abnormalities <strong>and</strong> disease conditions.Baseline comparisons Significant differences between lactating <strong>and</strong> non-lactating women – higher parity, BMI <strong>and</strong> lower education levels in non-lactating women.Dietary assessment Semiquantitative FFQ to cover pregnancy <strong>and</strong> first six months postpartumTimingFFQ administered at 6 weeks <strong>and</strong> 6 months postpartumComparisonNumber of serves of foods with added sugarOutcomesBreastfeeding (exclusive or partial at 6 months postpartum)ResultsLactating women <strong>and</strong> nonlactating women did not show significant differences in the amount of foods with added sugar that they consumed postpartumFollowup6 months postpartumConfoundingNo adjustment for potential confoundingRisk of biasModerate-to-high risk of bias; no attempt to control for confounding despite significant baseline differences between lactating <strong>and</strong> non-lactating women.RelevancePossibly relevant to low-income women in AustraliaOther comments Minimal reporting of resultsDietary guidelines for pregnant <strong>and</strong> <strong>breastfeeding</strong> women: evidence report488
Reference Haggarty 2009Dietary patterns Sugar: total sugars, confectionery, soft drinksStudy typeProspective cohort studyLevel of evidence II (aetiology)SettingAberdeen, Scotl<strong>and</strong>FundingUK Food St<strong>and</strong>ards AgencyParticipants1277 sequentially enrolled pregnant women attending Aberdeen Maternity Hospital for ultrasound (a further 184 women were recruited later inpregnancy).Exclusions: diabetic women, women with multiple pregnancies, women who conceived as a result of fertility treatment, or clinical dat not availableBaseline comparisons See confounding belowAssessmentFFQTimingAssessed at 19 weeks gestationComparisonIntake of sugar by deciles of deprivationOutcomesDeprivation (assessed using the Scottish Index of Multiple Deprivation);Low birthweight (defined as < 2500 g or lowest decile for birthweight z score adjusted for gestational age, sex <strong>and</strong> parity)Preterm birth (< 37 weeks)Admission to neonatal unitResultsDeprivationConfectionery intake did not differ significantly between deciles of deprivation on regression analysisSoft drinks: significantly higher intake with higher levels of deprivation (p < 0.001)FollowupConfoundingRisk of biasRelevanceOther commentsLowest decile for st<strong>and</strong>ardised birthweight: OR for diets low in sugars: 0.78 95% CI 0.64 to 0.96To neonatal period(Some?) analyses adjusted for energy intakeLow to moderate risk of bias: low attrition, some lack of detail in reporting of outcomesLikely to be relevant to Australian womenAbout 40-50% of the least deprived women reported taking folic acid supplements compared with about 20% for the most deprived women;Most birth outcome associations were reported by nutrient rather than food group;Not easy to deduce quantities of intake of foods (main graphs reported as change in intake by deprivation decile)Sugar489
Reference Herrick 2003Food groupsSugar; sweetsStudy typeProspective cohortLevel of evidence II (aetiology)SettingMotherwell, Scotl<strong>and</strong>FundingDunhill Medical Trust, NIHParticipants251 men <strong>and</strong> women whose mothers’ food intakes had been recorded during pregnancy during 1967 to 1968. These women had been advised to eat0.45 kg of red meat a day <strong>and</strong> to avoid carbohydrate-rich foods during pregnancyBaseline comparisons See confounding belowDietary assessment Mothers asked about consumption of 10 foodsTimingEarly pregnancy (≤ 20 weeks); late pregnancy (> 20 weeks)Comparisonportions of sweets (1/4 pound) per week; mean 1.1 [SD 0.8] portionsOutcomesCortisol concentrations in offspring aged 30 yearsResultsCortisol (change per unit change in maternal sweet consumption during pregnancy)No significant associationLength of followup 30 yearsConfoundingAnalyses adjusted for offspring’s gender, social class at birth, BMI, alcohol consumption, <strong>and</strong> activity levelRisk of biasModerate risk of bias: <strong>For</strong> the 1432 records from 1967-8 recorded liveborn, singleton births with complete names, birth measurements <strong>and</strong> ≥ 1 dietrecord. 965 offspring were alive <strong>and</strong> living locally; <strong>and</strong> after attrition or declining to participate, 251 (17.5%) were available for analysis.RelevanceVery high intake of meat <strong>and</strong> very low carbohydrate intake limits the relevance to current dietary intakes of Australian womenOther comments Authors state that “in the setting of advice to follow a pregnancy diet high in protein <strong>and</strong> low in carbohydrate, an unbalanced pattern of higher meat/fish<strong>and</strong> lower green vegetable consumption in late pregnancy leads to elevated cortisol concentrations in the offspring"Dietary guidelines for pregnant <strong>and</strong> <strong>breastfeeding</strong> women: evidence report490
Reference Kwan 2009Food typeSugar (energy from sweets)Study typeCase controlLevel of evidence III-3 (aetiology)Setting California, USA (part of the Northern California Childhood Leukemia Study – phase 1 <strong>and</strong> 2 (phase 1 reported in Jensen 2004)FundingPHS; Paul O’Gorman Foundation for Children with LeukemiaParticipants866 individuals - 282 matched cases <strong>and</strong> controls (205 pairs <strong>and</strong> 77 trios):Cases: Children under 15 years of age, with a parent who spoke English or Spanish, were resident in the study area at the time of diagnosis of acutelymphoblastic leukemia (ALL), with no prior diagnosis of cancerControls: identified from birth certificates matched to the case on date of birth, sex, maternal race, Hispanic ethnicity of mother or father, <strong>and</strong> county ofresidence at birth (in phase 1 (1995-99) only due to concerns about overmatching on potential environmental exposures linked to leukemia risk)Data collected from August 1995 to November 2002Baseline comparisons A priori potential confounders were identified as birthweight, <strong>breastfeeding</strong>, maternal age <strong>and</strong> education, <strong>and</strong> smoking during pregnancy.Also see Confounding below.Dietary assessment FFQTimingDietary intake to reflect the year before the index pregnancy (to indicate dietary status at the start of pregnancy)ComparisonDaily intake of sweets (% energy)OutcomesChildhood acute lymphoblastic leukemiaResults Sweets (% energy): aOR 0.99 95% CI 0.96 to 1.02: median consumption 8.00% energy per day (25 th , 75 th percentiles 4.09, 14.5)FollowupConfoundingRisk of biasRelevanceOther commentsn/aAnalyses were adjusted for total energy intake, household income, indoor insecticide exposure during pregnancy; <strong>and</strong> proportion of foods reported aslarge or extra-large portion sizeAlso adjusted for child’s diet, with little effect seen on resultsLow-moderate risk of bias: Of eligible cases identified from January 1995 to November 2002, 86% consented to participate; 56% of the eligible controlsagreed to participate. 190 participants excluded: leukemia diagnosis was not ALL (n = 127); no dietary data (n = 4); a case or a control respondent wasnot the biological mother (n = 14), questionable dietary questionnaire data (n = 45), leaving 282 matched sets (86%).Likely to be relevant for Australian women, though some diet components may differ e.g. high bean consumptionRegular use of any dietary supplement was not associated with risk of ALLSugar491
Reference Lenders 1994Food groupsSugar: total sum of simple carbohydrates (does not include complex carbohydrates such as starch or fibre)Study typeProspective cohort study (part of the Camden County Adolescent Family <strong>Health</strong> Program)Level of evidence II (aetiology)SettingCamden, New Jersey, USAFundingNICHHD, Heinz Pediatric Fellowship ProgramParticipants 337 pregnant adolescents from low-income families giving birth to live singleton babies > 20 weeks gestation (1982 to 1987);Baseline comparisons Participants were divided into two groups: high sugar intake (≥ 206 g, n = 34); low sugar intake group (< 206 g, n = 303)See confounding belowDietary assessment 24 hour dietary recallTimingFirst antenatal visitComparison high sugar intake (≥ 206 g = 90 th centile of sugar intake) versus low sugar intake group (< 206 g)OutcomesMaternal BMI, gestational weight gain, preterm birth, gestational age, birthweight, SGAResultsLow sugar (n = 303) High sugar (n = 34) pMaternal BMI, mean 22 [SD4] 21 [SD3]Gestation weight gain, mean 11 [SD8] 10 [SD4]SGA 32 (11%) 7 (21%) 0.083Preterm birth 33 (11%) 4 (12%)Gestational age at birth, weeks, mean 39 [SD3] 39 [SD2]Birthweight, g, mean 3204 [SD672] 3056 [SD603]Effect of high sugar intake on birthweight (multiple regression analysis): -216.6 g (SE10.3.9) p < 0.05*Length of followupConfoundingRisk of biasRelevanceOther commentsTo birth*adjusted for gestational age, ethnicity, marital status, age, parity, cigarette smoking, new weight gain, BMI, energyLow risk of bias: of the 425 adolescents r<strong>and</strong>omly selected from the total cohort of 2789 to provide dietary information, 88 (21%)were excluded mostlydue to lack of weight gain values <strong>and</strong> pre-pregnancy weight gain dataLikely to be relevant to pregnant adolescent women in AustraliaIn the high sugar intake group, the five most commonly listed products contributing to total sugar intake were carbonated beverages, fruit juices,icecream, syrup added to pancakes, <strong>and</strong> sweetened cerealsDietary guidelines for pregnant <strong>and</strong> <strong>breastfeeding</strong> women: evidence report492
Reference Lenders 1996Food groupssugarStudy typeProspective cohort/methodLevel of evidence II (aetiology)Setting City of Camden, NJ, USA; 1985 to 1990FundingNICHHDParticipants 594 pregnant teens aged 12-15 y at first pregnancy (Mean age 16.2 [1.9]); 61% black, 30% Hispanic, 9% white; nondiabetic; low substance use; 69%primiparas; 97% unmarriedBaseline comparisons After adjusting for energy intake, adolescents with a BMI ≥ 26 were three times more likely to consume high sugar dietsAlso see confounding belowDietary assessment 24 hour dietary recallsTimingAt entry, 28 weeks <strong>and</strong> 36 weeks gestationComparison High sugar diet defined as daily intake of total (simple carbohydrates) at or above the 90 th percentile (≥206 g); [n = 60]Reference group < 206 g total sugar/day [n = 534]OutcomesSGA (< 10 th percentile of birthweight for gestational age)ResultsSGAN %SGA aOR (95% CI)Reference 534 7 1.00High sugar 60 13 2.01 (1.05 to 7.35)Length of followupConfoundingRisk of biasRelevanceOther commentsTo birthAdjusted for ethnicity, age, smoking, inadequate weight gain, BMI, total energy intake, low gynaecological age, parity, pregnancy-induced hypertension<strong>and</strong> inadequate antenatal careLow risk of bias: uncertain how accurate 24 hour dietary recalls areReasonably relevant to teenage women in Australia; note that study found ethnic differences (Puerto Rican adolescents showed a strong associationbetween high sugar intake <strong>and</strong> shortened gestation)High sugar group consumed 44% of their total dietary energy as total sugar compared with 195 in the reference groupSugar493
Reference Nwaru 2010Food typeSugar: chocolate <strong>and</strong> sweetsStudy typeProspective cohort studyLevel of evidence II (aetiology)SettingTampere, Finl<strong>and</strong>FundingAcademy of Finl<strong>and</strong>, Finnish Pediatric Research Foundation, the Juho Vainio Foundation, the Yrjo Jahnsson Foundation, Turku, Oulu <strong>and</strong> TampereUniversity Hospitals, JDRF, Novo Nordisk Foundation, EU Biomed 2 ProgramParticipants931 mother-infant pairs (children with human leukocyte antigen-conferred susceptibility to type 1 diabetes) participating in the Finnish type 1 DiabetesPrediction <strong>and</strong> Prevention (DIPP) Nutrition Study between September 1996 <strong>and</strong> October 1997Baseline comparisons See confounding belowDietary assessment FFQTimingFFQ given to women after birth, for return at the three month visit (FFQ intended to cover maternal diet during pregnancy <strong>and</strong> lactation)ComparisonAmount of intake of chocolate <strong>and</strong> sweetsOutcomesAllergic sensitisation in offspring by 5 years: food allergens (egg, cow’s milk, fish, wheat); inhalant allergens (house dust mite, cat, timothy grass, birch)ResultsChocolates <strong>and</strong> sweetsFood allergensInhalant allergensOR 1.00 95% CI 0.88 to 1.16 OR 1.01 95% CI 0.90 to 1.13aOR 0.99 95% CI 0.86 to 1.14 aOR 1.00 95% CI 0.88 to 1.14FollowupConfoundingRisk of biasRelevanceOther commentsTo 5 yearsAdjusted for energy intake, place of birth, season of birth, sex of the child, number of siblings, gestational age at birth, parental asthma, parental allergicrhinitis, maternal age at birth, maternal smoking during pregnancy, maternal educationLow risk of bias: data available for 931/1175 (79.2%) children recruited – 108 did not participate in survey, a further 49 did not have IgE measurements,a further 87 had no FFQ or an incomplete FFQLikely to be relevant to Australian women; some differences in individual types of vegetables between Finl<strong>and</strong> <strong>and</strong> Australia28% of women took vitamin D supplements, 73% took iron supplements;HLA genotype not likely to have any impact on the development of allergic diseases.Dietary guidelines for pregnant <strong>and</strong> <strong>breastfeeding</strong> women: evidence report494
Reference Olafsdottir 2006Dietary patterns Sugar: eating more sweets in early pregnancyStudy typeProspective cohort studyLevel of evidence II (aetiology)SettingIcel<strong>and</strong>FundingIcel<strong>and</strong>ic Research Council, University of Icel<strong>and</strong> Research FundParticipants495 r<strong>and</strong>omly selected healthy pregnant women attending a routine first antenatal visitBaseline comparisons See confounding belowDietary assessment FFQTimingAt 11-15 weeks gestation; <strong>and</strong> 34-37 weeks gestation (to reflect food intake for the last 3 months)Comparison<strong>Eat</strong>ing more sweets versus not eating more sweets than usual (in early pregnancy)OutcomesGestational weight gain (optimal weight gain defined as 12.1 to 18.0 kg for women with normal pre-pregnancy weight; <strong>and</strong> 7.1 to 12.0 kg for overweightwomen)Results20% of the 301 women with BMI < 25 at first visit had excessive gestational weight gain;55% of the 194 women with BMI ≥ 25 at first visit had excessive gestational weight gain<strong>Eat</strong>ing more sweets in early pregnancyAt least optimal weight gain: aOR 2.78 95% 0.84 to 9.27Excessive weight gain: aOR 2.52 95% CI 1.10 to 5.77FollowupConfoundingRisk of biasRelevanceOther commentsTo birthAdjusted for maternal age, gestational length <strong>and</strong> smokingLow to moderate risk of bias: of the 549 women enrolled, 495 (90%) completed the study; 54 women were excluded (17 miscarriage/stillbirths, 5 sets oftwins or triplets, 17 preterm births, 15 missing data); 89 women did not complete FFQ at the second timepoint <strong>and</strong> so only 406 women could beincluded for measures relating to late pregnancy; limited number of confounders used in adjusted analysesLikely to be reasonably relevant to Australian womenSugar495
Reference Petridou 2005Food typeSugars <strong>and</strong> syrupsStudy typeCase-control studyLevel of evidence III-3SettingGreeceFundingThe Childhood Hematology-Oncology Group: Athens University Medical School, Aristotle University of Thessaloniki, University Hospital of HeraklionParticipants Cases: 131 children with acute lymphoblastic leukemia, aged 12 to 59 months, gender <strong>and</strong> age matched toControls: 131 children hospitalised for minor conditions between 1999 <strong>and</strong> 2003Baseline comparisons See confounding belowDietary assessment FFQTimingDuring index pregnancyComparisonQuintiles of sugars/syrups – median Q1; 10 g/day: median Q5 152 g/dayOutcomesAcute lymphoblastic leukemia (ALL)ResultsMedian g/day Cases Controls p for trendQ1: 10 21 31Q2: 25 19 34Q3: 44 29 23Q4: 79 29 23Q5: 152 33 20 0.004Logistic regression: one quintile more of sugars/syrups: aOR 1.32 95% CI 1.05 to 1.67FollowupConfoundingRisk of biasRelevanceOther commentsNATotal energy intake (but not mutually among food groups); matching variables; maternal age at birth; birthweight; maternal smoking during pregnancy;maternal years of schooling, maternal occupationModerate: moderate risk of recall bias for women being able to accurately remember their dietary intake during a pregnancy some time previously;Cases: 171 children with ALL were identified; 21 had missing data, consent was not given in 9 cases <strong>and</strong> 10 were unable to be matched, leaving 131(77%) of cases availableDiets of Greek women may differ from current diets of Australian womenDietary guidelines for pregnant <strong>and</strong> <strong>breastfeeding</strong> women: evidence report496
ReferenceFood typeStudy typeLevel of evidenceSettingFundingParticipantsBaseline comparisonsDietary assessmentTimingComparisonOutcomesResultsFollowupConfoundingRisk of biasRelevanceOther commentsPetridou 1998aSugars <strong>and</strong> syrups: sugar, cookies, chocolate bars, wafers, baklava, kataifi <strong>and</strong> other Greek sweets with syrup, spoonful sweets, jellies, glazed fruits,cream pastries, pancakes with syrup, bonbons, honey, compote (0.5).Case-control studyIII-3Greater Athens area, GreeceGreek Ministry of <strong>Health</strong> <strong>and</strong> Welfare, <strong>and</strong> Foundation for Research in Childhood ‘S. Doxiadis’Cases: 109 children with cerebral palsy (CP), born between 1984 <strong>and</strong> 1988 (estimated to be two-thirds of the children with CP born during this period)Controls (1): 155 neighbouring children of similar sex <strong>and</strong> age (± 12 months)Controls (2): 99 healthy siblings of similar sex <strong>and</strong> age (± 12 months) of the first neurological patient seen by the attending physician after a visit by theCP patientSee confounding belowFFQDuring pregnancy≤ 1 versus 2 versus > 2 serves of sugars <strong>and</strong> syrups per day;regression analysis: risk of cerebral palsy with change in consumption by one unit ( = consumption of sugars <strong>and</strong> syrup once daily)Cerebral palsy≤ 1 serve of sugars <strong>and</strong> syrups per day: 11/91 (12.1%) cases v 21/246 (8.5%) controls2 serves of sugars <strong>and</strong> syrups per day: 31/91 (34.0%) cases v 104/246 (42.3) controls> 2 serves of sugars <strong>and</strong> syrups per day: 49/91 (53.9%) cases v 121/246 (49.2%) controlsRegression analysis for each unit of consumption of sugars <strong>and</strong> syrups once daily:aOR 1.08 95% CI 0.73 to 1.62aOR 1.21 95% CI 0.77 to 1.90 (additionally adjusted for all food groups)8 yearsAge <strong>and</strong> sex of child, maternal age at birth, maternal age at menarche, maternal chronic disease, previous spontaneous abortions, persistent vomitingduring index pregnancy, multiple pregnancy, number of obstetric visits; timing of membrane rupture in index birth, use of general anaesthesia in theindex birth, mode of birth, abnormal placenta, infant head circumference at birth, congenital malformation, place of index birth, use of supplementaryiron during index pregnancy, physical exercise during index pregnancy, painless childbirth classes.The following were not included in the model:- Smoking or consumption of coffee or alcohol during pregnancy (stated to be “unrelated to CP <strong>and</strong> had no confounding influence”);- Gestational age, birthweight <strong>and</strong> maternal weight gain (stated to be “strong predictors of CP, but were not included in the model, since they areprobably intermediate stages in a possible link between diet <strong>and</strong> CP (mediators) rather than genuine confounders”Moderate-high: High risk of recall bias for women being able to accurately remember their dietary intake during a pregnancy 8 years previously;Cases: 109 children with CP were identified; for 6 children either collaboration with their guardian or a diagnosis of CP was not confirmed; <strong>and</strong> reliablematernal dietary intakes were not available for 12 women, leaving 91 cases available for analysis.Controls: 278 mother-child pairs were approached; 16 refused to participate; matching controls were not available in 8 instances, <strong>and</strong> reliable maternaldietary intakes were not available for 8 women, leaving 246 controls available for analysis.Diets of Greek women in 1998 may differ from current diets of Australian womenSugar497
ReferencePetridou 1998bFood typeSugars <strong>and</strong> syrups: sugar, cookies, chocolate bars, wafers, baklava, kataifi <strong>and</strong> other Greek sweets with syrup, spoonful sweets, jellies, glazed fruits,cream pastries, pancakes with syrup, bonbons, honey, compote (0.5).Study typeRetrospective cohort studyLevel of evidence III-2SettingTwo cities (Athens <strong>and</strong> Larissa) in GreeceFundingNot reportedParticipants 368 nondiabetic women giving birth to healthy singleton babies from March to October 1995Baseline comparisons See confounding belowDietary assessment FFQTimingImmediately after birthComparison< 1 versus 1-2 versus 3-4 versus > 4 serves of sugars <strong>and</strong> syrups per day;< 1 serve of sugars <strong>and</strong> syrups per day: 156/268 (42.4%)1-2 serves of sugars <strong>and</strong> syrups per day: 95/268 (25.8%)3-4 serves of sugars <strong>and</strong> syrups per day: 84/268 (22.8%)>4 serves of sugars <strong>and</strong> syrups per day: 33/268 (9.0%)OutcomesResultsFollowupConfoundingRisk of biasRelevanceOther commentsRegression analysis: mean change in birthweight (g) for each unit change in consumption ( = consumption of sugars <strong>and</strong> syrup once daily)BirthweightRegression analysis for each unit of consumption of sugars <strong>and</strong> syrups (once daily):4 g [SE33], p = 0.90-2 g [SE32], p = 0.96 without controlling for total energy intakeTo birthGender of child, birth order, maternal age, maternal education, maternal height, history of miscarriages, history of abortions, bleeding, smoking duringpregnancy, coffee drinking, alcohol drinking, maternal weight gain, total energy intake, folic acid supplementsLow-moderate risk of bias: of the 400 eligible women, 368 (92%) were available for analysis – 32 were unwilling or unable to participate; women wouldhave been aware of the birthweight of their baby before completing the FFQDiets of Greek women in 1995 may differ from current diets of Australian womenDietary guidelines for pregnant <strong>and</strong> <strong>breastfeeding</strong> women: evidence report498
Reference Stuebe 2009Dietary patterns Sugar: sugar-sweetened beveragesStudy typeProspective cohort study (Project Viva)Level of evidence II (aetiology)Setting8 urban <strong>and</strong> suburban obstetric offices of a multispecialty group practice in eastern Massachusetts, USAFundingUS NIH, Harvard Medical School, Harvard Pilgrim <strong>Health</strong> Care FoundationParticipants1338 women giving birth to a live singleton infant, < 22 weeks gestation at study entry; 379 (27%) were overweight (BMI ≥ 26); 703 (51%) experiencedexcessive weight gainExclusions: not fluent in EnglishBaseline comparisons See confounding belowDietary assessment FFQTimingAdministered in first <strong>and</strong> second trimesters of pregnancyComparisonSugar sweetened beverages (serves per day)Outcomes Excessive gestational weight gain (IOM 1990)ResultsExcessive gestational weight gain: sugar-sweetened beverages (SSBs)Serves per day, medianaOR (95% CI)Inadequate/adequate GWG excessive GWGSSBs 0.36 (IQR 0.11 to 0.75) 0.37 (IQR 0.12 to 0.75) 0.93 (0.78 to 1.11)FollowupConfoundingRisk of biasRelevanceOther commentsSSBs, per serving per day: multivariate logistic regression model:aOR 0.87 95% CI 0.72 to 1.05-0.46 kg 95% CI -0.87 to -0.05To birthAdjusted for pre-pregnancy BMI, maternal age, race/ethnicity, smoking status, gestational age at birth, nausea in first trimester in pregnancyLow risk of bias: Of 2083 eligible women, 1388 (67%) of women had data available for analysis (31 had missing information on pre-pregnancy BMI <strong>and</strong>gestational weight gain; 226 had missing covariate information <strong>and</strong> 438 had missing data on either first or second-trimester diet <strong>and</strong> mid-pregnancyphysical activity); included women were less likely to be African-American or Hispanic, to be younger, multiparous <strong>and</strong> obeseLikely to be relevant to Australian womenSurprising results for SSBs – one explanation given was that women gaining excessive weight may cut back SSBs, but this does not appear to hold forother foods such as fried foods.Sugar499
ReferencesChen L, Hu FB, Yeung E, Willett W <strong>and</strong> Zhang C. "Prospective study of pregravidsugar-sweetened beverage consumption <strong>and</strong> the risk of gestationaldiabetes mellitus." Diabetes Care 2009: 32(12): 2236-41.George GC, Hanss-Nuss H, Milani TJ <strong>and</strong> Freel<strong>and</strong>-Graves JH. "Food choices oflow-income women during pregnancy <strong>and</strong> postpartum." J Am Diet Assoc2005: 105(6): 899-907.Haggarty P, Campbell DM, Duthie S, Andrews K, Hoad G, Piyathilake C <strong>and</strong>McNeill G. "Diet <strong>and</strong> deprivation in pregnancy." Br J Nutr 2009: 102(10):1487-97.Herrick K, Phillips DI, Haselden S, Shiell AW, Campbell-Brown M <strong>and</strong> GodfreyKM. "Maternal consumption of a high-meat, low-carbohydrate diet in latepregnancy: relation to adult cortisol concentrations in the offspring." J ClinEndocrinol Metab 2003: 88(8): 3554-60.Kwan ML, Jensen CD, Block G, Hudes ML, Chu LW <strong>and</strong> Buffler PA. "Maternaldiet <strong>and</strong> risk of childhood acute lymphoblastic leukemia." Public <strong>Health</strong> Rep2009: 124(4): 503-14.Lenders CM, Hediger ML, Scholl TO, Khoo CS, Slap GB <strong>and</strong> Stallings VA."Effect of high-sugar intake by low-income pregnant adolescents on infantbirth weight." J Adolesc <strong>Health</strong> 1994: 15(7): 596-602.Nwaru BI, Ahonen S, Kaila M, Erkkola M, Haapala AM, Kronberg-Kippila C,Veijola R, Ilonen J, Simell O, Knip M <strong>and</strong> Virtanen SM. "Maternal diet duringpregnancy <strong>and</strong> allergic sensitization in the offspring by 5 yrs of age: aprospective cohort study." Pediatr Allergy Immunol 2010: 21(1 Pt 1): 29-37.Olafsdottir AS, Skuladottir GV, Thorsdottir I, Hauksson A <strong>and</strong> SteingrimsdottirL. "Maternal diet in early <strong>and</strong> late pregnancy in relation to weight gain." Int JObes (Lond) 2006: 30(3): 492-9.Petridou E, Koussouri M, Toupadaki N, Youroukos S, Papavassiliou A,Pantelakis S, Olsen J <strong>and</strong> Trichopoulos D. "Diet during pregnancy <strong>and</strong> the riskof cerebral palsy." Br J Nutr 1998a: 79(5): 407-12.Petridou E, Ntouvelis E, Dessypris N, Terzidis A <strong>and</strong> Trichopoulos D."Maternal diet <strong>and</strong> acute lymphoblastic leukemia in young children." CancerEpidemiol Biomarkers Prev 2005: 14(8): 1935-9.Petridou E, Stoikidou M, Diamantopoulou M, Mera E, Dessypris N <strong>and</strong>Trichopoulos D. "Diet during pregnancy in relation to birthweight in healthysingletons." Child Care <strong>Health</strong> Dev 1998b: 24(3): 229-42.Stuebe AM, Oken E <strong>and</strong> Gillman MW. "Associations of diet <strong>and</strong> physicalactivity during pregnancy with risk for excessive gestational weight gain." AmJ Obstet Gynecol 2009: 201(1): 58 e1-8.Lenders CM, Hediger ML, Scholl TO, Khoo CS, Slap GB <strong>and</strong> Stallings VA."Gestational age <strong>and</strong> infant size at birth are associated with dietary sugarintake among pregnant adolescents." J Nutr 1997: 127(6): 1113-7.Dietary guidelines for pregnant <strong>and</strong> <strong>breastfeeding</strong> women: evidence report500
Included StudiesVegetablesVegetablesStudyOutcomes1. Brekke 2009 Beta-cell autoimmunity2. Chatzi 2008 Child persistent wheeze, atopic wheeze, atopy (all at 6.5 years)3. George 2005 Breastfeeding at 6 months4. Giordano 2010 Child hypospadias5. Giordano 2008 Child hypospadias <strong>and</strong> cryptorchidism6. Herrick 2003 Cortisol concentrations in offspring at 30 years7. Jensen 2004 Childhood acute lymphoblastic leukemia8. Jones 2000 Bone mass at 8 years9. Knox 1972 Anencephalus10. Kwan 2009 Childhood acute lymphoblastic leukemia – update of Jensen 200411. Lagiou 2006 Maternal pregnancy hormones12. Lamb 2008 Islet autoimmunity13. Laraia 2007 “Pre-pregnancy BMI”14. Li 2009 Maternal URTI15. Martindale 2005 Eczema, wheeze in first 2 years of child’s life16. Mikkelsen 2006 Birthweight17. Mitchell 2004 SGA18. Miyake 2010 Infant wheeze <strong>and</strong> eczema up to 24 months19. Nwaru 2010 Allergic sensitisation in offspring by 5 years20. Oien 2010 Childhood eczema <strong>and</strong> asthma at 2 years21. Petridou 2005 Childhood acute lymphoblastic leukemia22. Petridou 1998 Cerebral palsy at 8 years23. Pierik 2004 Cryptorchidism <strong>and</strong> hypospadias24. Pogoda 2009 Childhood brain tumours25. Ramon 2009 Birthweight, SGA26. Sausenthaler 2007 Allergic sensitisation, eczema at 2 years of age27. Shiell 2001 Blood pressure in offspring at 27 to 30 years28. Willers 2007 Respiratory <strong>and</strong> atopic symptoms29. Willers 2008 Wheeze, dyspnoea, prescription of inhaled steroids for respiratory problems, composite variable ‘asthma symptoms’ in the last501
12 months (measured longitudinally from 1 to 8 years age)30. Yin 2010 Bone mass at 16 y31. Zhang 2006 GDMDietary guidelines for pregnant <strong>and</strong> <strong>breastfeeding</strong> women: evidence report502
Evidence StatementsMaternal Outcomes1. In a US cohort study, women who were obese before pregnancy were significantly lesslikely to meet recommendations for vegetable intake compared with overweight women: Adherence for overweight women was 101.3% [SD 80.1] compared with 86.4% [SD 64.5] forobese women (p < 0.03)2. In a US cohort study, increased maternal sex hormone binding globulin (SHBG) wassignificantly associated with increasing intake of vegetables <strong>and</strong> legumes duringpregnancy: 16 completed weeks GA: 4.2 % SHBG change 95% CI 0.6 to 7.9; 27 completed weeks GA: 4.2 %SHBG change 95% CI 0.2 to 8.4No significant associations were seen between vegetable intake <strong>and</strong> maternal oestradiol, oestriol,progesterone, or prolactin3. In a US cohort study, no association was seen between women having gestationaldiabetes mellitus (GDM) <strong>and</strong> their intake of vegetable fibre intake in fully adjustedanalyses (p for trend = 0.24)4. In a North American retrospective cohort study, no association was seen between upperrespiratory infections in women during the first half of pregnancy <strong>and</strong> their intake ofvegetables (p value for trend of 5 month risk = 0.33)Congenital Anomalies5. In a case-control study from the UK, stillbirths <strong>and</strong> infant death due to anencephalus werenegatively associated with canned beans, onions/shallots, brussel sprouts <strong>and</strong> oldpotatoes; <strong>and</strong> positively associated with new potatoes, tomatoes, cabbages, <strong>and</strong> cannedpeas6. In an Italian case-control study, no associations were seen between maternal intake ofvegetables <strong>and</strong> risk of hypospadias in offspring: aOR 0.89 95% CI 0.38 to 2.107. In an Italian case-control study, no associations were seen between maternal intake ofvegetables during pregnancy (less than once a week versus more than once a week) <strong>and</strong>hypospadias <strong>and</strong> cryptorchidism in offspring: Raw vegetables: aOR 1.12 95% CI 0.57 to 2.21 Cooked vegetables: OR 0.76 95% CI 0.39 to 1.46N Level References2394 II Laraia 2007270 II Lagiou 200613,110 II Zhang 20061034 III-2 Li 2006Notstated80cases;80controls90cases;243controlsIII-3 Knox 1972III-3 Giordano 2010III-3 Giordano 2008Vegetables503
Mostly market vegetables: OR 1.31 95% CI 0.69 to 2.518. In a Dutch case-control study, a vegetable-rich diet during pregnancy reduced the risk ofcryptorchidism in male offspring (aOR 0.4 95% CI 0.2 to 0.9) but no influence was seen onrisk of hypospadias (OR 0.7 95% CI 1.2)Birth Outcomes9. In a New Zeal<strong>and</strong> case-control study, no significant association was seen between SGA <strong>and</strong>vegetable intake at the time of conception (p = 0.32) or in the last month of pregnancy (p= 0.12)10. In a Danish cohort study, birthweight was not significantly associated with maternalintake of green leafy vegetables during pregnancy: Adjusted regression coefficient 5.5 95% CI -0.23 to -11.3 (additionally energy-adjusted)11. In a Spanish cohort study: lower birthweight <strong>and</strong> birth length were associated with lower maternal vegetable intake inthe first <strong>and</strong> third trimester Lower SGA for weight <strong>and</strong> for length (customised < 10 th percentile) were associated withlower maternal vegetable intake in the first trimester (p < 0.001 <strong>and</strong> p < 0.03 for adjustedtrend) <strong>and</strong> third trimester (p = 0.01 <strong>and</strong> p = 0.02) for adjusted trend across quintiles.Breastfeeding12. In a US study, lactating women: consumed more vegetables than non-lactating women (2.6 v 1.8 serves a day, p < 0.02); had significantly higher intakes of lettuce than women who bottle-fed exclusively (p < 0.0%)Childhood – Eczema And Other Allergy Outcomes13. In a Japanese cohort study: Eczema in children at 16-24 months was not associated with maternal intake of totalvegetables or other vegetables, but increased intake of green <strong>and</strong> yellow vegetables wasassociated with fewer cases of eczema (compared with lowest quartile):o 2 nd quartile aOR 0.30 95% 0.16 to 0.52o 3 rd quartile aOR 0.53 95% CI 0.31 to 0.89o 4 th quartile aOR 0.41 95% CI 0.24 to 0.71 (p = 0.01) Wheeze in children at 16-24 months was not associated with maternal intake of totalvegetables, green <strong>and</strong> yellow vegetables or other vegetables during pregnancy.14. In a Scottish cohort study, vegetable intake during pregnancy was not associated witheither eczema or wheeze in children in their 2 nd year of life443pairsIII-3 Pierik 20041138 III-3 Mitchell 200443,585 II Mikkelsen 2006787infantsII Ramon 2009149 II George 2005763 II Miyake 20101300childrenII Martindale 2005Dietary guidelines for pregnant <strong>and</strong> <strong>breastfeeding</strong> women: evidence report504
15. In a German cohort study:Allergen sensitisation or eczema in children at 2 years of age were not generally associated withmaternal intake of specific vegetables in pregnancy except for: Significantly increased allergen sensitisation with celery intake 2-3 times a month or more(aOR for any sensitisation 1.61 95% CI 1.07 to 2.41 <strong>and</strong> 1.81 95% CI 1.18 to 2.89 for foodallergens; Significantly increased allergen sensitisation with raw sweet pepper intake 2-3 months ormore (aOR for any sensitisation 1.45 95% CI 1.03 to 2.06 <strong>and</strong> 2.16 95% 95% CI 1.20 to3.90).16. In a retrospective cohort study from Norway, neither asthma nor eczema at two yearswas associated with vegetable intake during pregnancy: Asthma: almost daily versus ≤ once a week: OR 1.02 95% CI 0.58 to 1.81 Eczema: almost daily versus ≤ once a week: OR 0.72 95% CI 0.51 to 1.0217. In a Scottish cohort study, high vegetable intake during pregnancy (≥ once per week) wasnot significantly associated with respiratory <strong>and</strong> atopic outcomes in 5 year old children(pns; actual numbers not reported)18. In a Finnish cohort study, vegetable intake during pregnancy was not associated withallergen sensitisation in children at 5 years of age: Food allergen sensitisation aOR 0.80 95% CI 0.49 to 1.31 Inhalant sensitisation aOR 1.28 95% CI 0.82 to 1.9919. In a Spanish cohort study, persistent wheeze <strong>and</strong> atopy (but not atopic wheeze) inchildren at 6.5 years were significantly associated with low maternal vegetable intakeduring pregnancy: Persistent wheeze aOR 0.36 95% CI 0.14 to 0.92 (> 8 v ≤ 8 serves/week) Atopy aOR 0.40 95% CI 0.22 to 0.72 (> 8 v ≤ 8 serves/week)20. In a cohort study from the Netherl<strong>and</strong>s, wheeze, dyspnoea, steroid use or asthmasymptoms (composite of previous three) in children longitudinally over 1 to 8 years ofage were not associated with maternal vegetable intake during pregnancy (once per dayor more v 1-4 times a week or fewer): Wheeze aOR 0.97 95% CI 0.83 to 1.12 Dyspnoea aOR 0.99 95% CI 0.84 to 1.17 Steroid use aOR 0.96 95% CI 0.76 to 1.20 Asthma symptoms aOR 0.98 95% CI 0.84 to 1.14Childhood – Other Outcomes3097children3086childrenII Sausenthaler 2007III-2 Oien 20101212 II Willers 2007931children482children2830childrenII Nwaru 2010II Chatzi 2008II Willers 2008Vegetables505
21. In a Swedish cohort study, beta-cell autoimmunity in children up to 5 years wassignificantly associated with low maternal vegetable intake during pregnancy: aOR 2.89 95% CI 1.18 to 7.05 (daily v less than daily)(No significant associations were seen for potatoes/root vegetables, fried potatoes ormushrooms)22. In a cohort study from the US, islet autoimmunity in children up to 15 years of age wasnot associated with maternal vegetable intake during pregnancy; except for potatoes where an increased consumption was protective (delayed time to onsetof islet autoimmunity): aHR 0.49 95% CI 0.28 to 0.8723. In one Australian cohort study, bone mineral density of children at 8 years was notassociated with maternal vegetable intake during pregnancy: Total body bone mineral density – p = 0.53 for adjusted regression of portions per week24. In a Greek case-control study, cerebral palsy in children at 8 years was not associatedwith maternal vegetable intake during pregnancy: Regression analysis for each unit of consumption of vegetables once per day:aOR 1.19 95% CI 0.88 to 1.61 (additionally adjusted for all food groups)5,724children642children173children109childrenII Brekke 2009II Lamb 2008II Jones 2000III-3 Petridou 199825. In a US case-control study, lower risk of childhood acute lymphoblastic leukemia wasassociated with higher maternal intake of vegetables in the year prior to pregnancy:aOR 0.53 95% CI 0.33 to 0.85; mean consumption of vegetables 0.74 [SD 0.48] serves per day26. In a US case-control study (phase 1 reported in Jensen 2004), lower risk of childhoodacute lymphoblastic leukemia was associated with higher maternal intake of vegetablesin the year prior to pregnancy: aOR 0.65 95% CI 0.50 to 0.84: median consumption 0.74 (25 th 75 th percentiles 0.4, 1.0) servesper day27. In a Greek case-control study, lower risk of childhood acute lymphoblastic leukemia wasassociated with higher maternal intake of vegetables in the year prior to pregnancy: logistic regression: one quintile more of milk/dairy products: aOR 0.76 95% CI 0.60 to 0.9528. In an international case-control study, maternal vegetable consumption prior to, <strong>and</strong>during pregnancy was not generally associated with risk of childhood brain tumours,except for decreased risk of primitive neural ectodermal tumours, anaplastic astrocytomas<strong>and</strong> medulloblastomas with yellow-orange vegetables <strong>and</strong> anaplastic astrocytomas withcruciferous vegetablesDietary guidelines for pregnant <strong>and</strong> <strong>breastfeeding</strong> women: evidence report138cases;138controls866(282cases)131cases;131controls1281cases;2223controlsIII-3 Jensen 2004III-3 Kwan 2009III-3 Petridou 2005III-3 Pogoda 2009506
29. In one Australian cohort study bone mineral density of children at 8 years was notassociated with maternal intake of vegetables prior to pregnancy: Total body bone mineral density – p = 0.52 for adjusted regression of portions per week30. In an Australian cohort study (follow-up of Jones 2000) bone mass in 16 year-oldadolescents was not associated with maternal vegetable intake during pregnancy: Total body bone mineral density r 2 0.324; ß -2.3 (pns) for adjusted regression of portions perweek31. In a cohort study from Scotl<strong>and</strong>, systolic blood pressure was significantly increased in 27to 30 year old offspring of women with low intake of vegetables during pregnancy (inconjunction with a high red meat <strong>and</strong> low carbohydrate diet): < 7 serves per week of green vegetables: ß 0.26 95% CI 0.03 to 0.5032. In a cohort study from Scotl<strong>and</strong>, cortisol concentrations in offspring aged 30 years werehighest in women consuming less than 7 portions of green vegetables (<strong>and</strong> more than 21portions of meat/fish < per week) in late pregnancy173children216children626adultoffspring251adultoffspringII Jones 2000II Yin 2010II Shiell 2001II Herrick 2003Vegetables507
Evidence TablesReference Brekke 2009Food typeVegetablesStudy typeProspective cohort studyLevel of evidence II (aetiology)Setting5 years follow up of babies born in Southeast Sweden between 1 October 1997 <strong>and</strong> 1 October 1999 <strong>and</strong> invited to be in the SoutheastSweden (ABIS) study.FundingJDRF-Wallenberg foundations, Swedish Medical Research Council, Swedish Child Diabetes Foundation, Swedish Diabetes Association, Swedish DairyAssociation R & D, Majblomman Foundation <strong>and</strong> the Novo Nordisk Foundation.Participants5 year follow up of 5724 children who completed 2 of the 3 possible blood samplings (study cohort), 36% of the total 16004 children participating inABIS (the primary cohort).Dietary assessment FFQ performed after delivery, but used to recall diet during pregnancy, Food groups classified according to daily, 3-5 times/week, 1-2 times/wk or
RelevanceOther commentseducation, country of birth, marital status). There was no adjustment for the child’s dietary intake during the follow up period.Diets in Sweden may differ from diets of Australian women, particularly in relation to access to seafood. National data collected during ABIS suggestedduring pregnancy the most frequently consumed vegetables in Sweden were tomatoes, cabbage, onions, lettuce <strong>and</strong> cucumbers. Intake of fruit was notassessed, therefore it is possible there could be combined effects of fruits <strong>and</strong> vegetables, (if we suspect a diet high in vegetables is also high in fruit).Some funding from Swedish Dairy Association.Vegetables509
Reference Chatzi 2008Food typeVegetablesStudy typeProspective cohort studyLevel of evidence II (aetiology)Setting Women presenting antenatal care at general practices in Menorca, a Mediterranean isl<strong>and</strong> in Spain (mid 1997 to mid 1998)FundingInstituto de Salud Carlos III red de Grupos Infancia y Media Ambiente, the Fundacio “La Caixa” , Instituto de Salud Carlos III, red de Centros deInvestigacion en Epidemiologica y Salud Publica, EU, National Center for Environmental <strong>Health</strong>, USA, the GA2LEN project, Ministry of Education <strong>and</strong>Science, Spain, Oficina de Ciencia y Tecnologia, Generalitat Valenciana.Participants482 children of 507 women who had attended antenatal care in MenorcaBaseline comparisons See confounding belowDietary assessment FFQTimingnot clear when women did FFQ <strong>and</strong> period of pregnancy it was intended to coverComparison≤ 8 v > 8 serves of vegetables per weekOutcomesPersistent wheeze, atopic wheeze <strong>and</strong> atopy at 6.5 yearsResultsPersistent wheeze at 6.5 yearsaOR 0.36 95% CI 0.14 to 0.92 (also adjusted for firstborn <strong>and</strong> lower respiratory tract infections at age 1)Atopic wheeze at 6.5 yearsaOR pns (also adjusted for birthweight <strong>and</strong> maternal atopy)Atopy at 6.5 yearsaOR 0.40 95% CI 0.22 to 0.72 (also adjusted for birthweight <strong>and</strong> maternal atopy)Followup6.5 yearsConfounding Analyses adjusted for gender, maternal <strong>and</strong> paternal asthma, maternal social class <strong>and</strong> education, BMI at age 6.5 years <strong>and</strong> total energy intake at 6.5yearsRisk of biasLow risk of bias: results from 468/482 children (97%) able to be analysed (4 incomplete data <strong>and</strong> 8 implausible values);RelevanceDiets in Menorca may differ from diets of Australian women, particularly urban womenOther commentsDietary guidelines for pregnant <strong>and</strong> <strong>breastfeeding</strong> women: evidence report510
Reference George 2005Food typeVegetablesStudy typeProspective cohort studyLevel of evidence II (aetiology)SettingTexas, USFundingNot reportedParticipants149 Medicaid-qualified women (30% white, 24% African American, 46% Hispanic) – recruited from a larger study on postpartum weight retentionInclusion criteria: 18 years or older; non-Hispanic white, African American or Hispanic ethnicity; birth of a health term infant, fluency <strong>and</strong> literacy inEnglish; absence of pregnancy-related abnormalities <strong>and</strong> disease conditions.Baseline comparisons Significant differences between lactating <strong>and</strong> non-lactating women – higher parity, BMI <strong>and</strong> lower education levels in non-lactating women.Dietary assessment Semiquantitative FFQ to cover pregnancy <strong>and</strong> first six months postpartumTimingFFQ administered at 6 weeks <strong>and</strong> 6 months postpartumComparisonNumber of daily serves of vegetables (mostly potatoes, corn, tomatoes <strong>and</strong> lettuce).OutcomesBreastfeeding (exclusive or partial at 6 months postpartum)Results Lactating women consumed more vegetables in the postpartum period than non-lactating women (2.6 v 1.8 serves a day, p < 0.02)FollowupConfoundingRisk of biasRelevanceOther commentsAfter childbirth, lactating women had significantly higher intakes of lettuce than women who bottle-fed exclusively (p < 0.05)6 months postpartumNo adjustment for potential confoundingModerate-to-high risk of bias; no attempt to control for confounding despite significant baseline differences between lactating <strong>and</strong> non-lactating women.Possibly relevant to low-income women in AustraliaMinimal reporting of resultsVegetables511
Reference Giordano 2010Food typeVegetablesStudy typeCase-control studyLevel of evidence III-3 (aetiology)SettingRome, ItalyFundingNot reportedParticipants80 cases of hypospadias requiring surgical treatment in children aged 0 to 24 months (mean age 57.62 weeks)80 controls: healthy males without any congenital defect, aged 0 to 24 months (mean age 36.52 weeks);recruited between September 2005 <strong>and</strong> May 2007Baseline comparisons See confounding belowDietary assessment Interview on ‘typical’ maternal diet habits in relation to the index pregnancy <strong>and</strong> food frequenciesTimingFFQ administered on recruitment for mothers of cases <strong>and</strong> during vaccination visits for mothers of controlsComparisonRare versus frequent consumption of vegetablesOutcomesHypospadiasResultsVegetablesCases Controls OR aORRare 64 (80.0%) 66 (82.5%) 1.00 1.00Frequent 16 (20.0%) 14 (17.5%) 1.18 95% CI 0.53 to 2.61 0.89 95% CI 0.38 to 2.10FollowupConfoundingRisk of biasRelevanceOther commentsn/aAdjusted for mother’s BMI at conception <strong>and</strong> education of the father;Gestational age, birthweight <strong>and</strong> SGA were not included among the covariates in the regression models, as they may share a common aetiology withhypospadiasModerate risk of bias: Participation rate of parents of cases was higher than that of controls (85% versus 70%); very few potential confounders used inadjusted analysesLikely to be reasonably relevant for Australian womenLikely to be underpoweredDietary guidelines for pregnant <strong>and</strong> <strong>breastfeeding</strong> women: evidence report512
Reference Giordano 2008Food typeVegetables: raw vegetables, cooked vegetables, mostly market vegetablesStudy typeCase-control studyLevel of evidence III-3 (aetiology)SettingSicily, ItalyFundingSicilian Congenital Malformation RegistryParticipants90 cases: 43 cases of hypospadias <strong>and</strong> 48 cases of cryptorchidism (both in one infant)202 controls: r<strong>and</strong>omly selected controls born in the same year <strong>and</strong> the same regionBirths between 1998 to 2003Baseline comparisons Low birthweight, low maternal education, mother’s history of gynaecological disease <strong>and</strong> father’s history of urogenital diseases differed significantlybetween cases <strong>and</strong> controlsSee confounding belowDietary assessment Interview on maternal diet <strong>and</strong> food frequenciesTimingFFQComparisonConsumption of vegetables once a week or less versus more than once a weekOutcomesHypospadias <strong>and</strong> cryptorchidismResultsRaw vegetablesHypospadiasCases Controls OR≤ 1/week 12 (27.9%) 42 (20.9%) 1.00> 1/week 31 (72.1%) 159 (79.1%) 0.68 95% CI 0.32 to 1.44Cryptorchidism≤ 1/week 7 (14.9%) 42 (20.9%) 1.00> 1/week 40 (85.1%) 159 (79.1%) 1.51 95% CI 0.53 to 1.79Hypospadias <strong>and</strong> cryptorchidism≤ 1/week 19 (21.3%) 42 (20.9%) 1.00> 1/week 70. (78.7%) 159 (79.1% 0.76 95% CI 0.39 to 1.46Cooked vegetablesHypospadias≤ 1/week 16 (37.2%) 63 (31.2%) 1.00> 1/week 27 (62.8%) 139 (68.8%) 0.76 95% CI 0.39 to 1.52Cryptorchidism≤ 1/week 18 (37.5%) 63 (31.2%) 1.00> 1/week 30 (62.5%) 139 (68.8%) 0.76 95% CI 0.39 to 1.46Hypospadias <strong>and</strong> cryptorchidism≤ 1/week 34 (37.8%) 63 (31.2%) 1.00> 1/week 56 (62.2%) 139 (68.8%) 0.75 95% CI 0.44 to 1.26VegetablesMostly market vegetablesHypospadias513
≤ 1/week 15 (34.9%) 78 (38.6%) 1.00> 1/week 28 (65.1%) 124 (61.4%) 1.17 95% CI 0.59 to 2.34Cryptorchidism≤ 1/week 18 (37.5%) 78 (38.6%) 1.00> 1/week 30 (62.5%) 124 (61.4%) 1.05 95% CI 0.55 to 2.01Hypospadias <strong>and</strong> cryptorchidism≤ 1/week 15 (16.7%) 78 (38.6%) 1.00> 1/week 75 (83.3%) 124 (61.4%) 1.31 95% CI 0.69 to 2.51Raw vegetables (adjusted analysis)*aORHypospadias>1/week 1.59 95% CI 0.68 to 3.74Cryptorchidism>1/week 0.82 95% CI 0.32 to 2.12Hypospadias <strong>and</strong> cryptorchidism>1/week 1.12 95% CI 0.57 to 2.21FollowupConfoundingRisk of biasRelevanceOther commentsn/aResults for this food group were not presented as adjusted analyses*Analysis of raw vegetables adjusted for mother’s age, parity, education, gynaecological diseases; paternal urogenital diseases, <strong>and</strong> use of pesticides;birthweightModerate risk of bias: Participation rate of parents <strong>and</strong> data collection rate of cases was lower than that of controls (76% versus 91%); no adjustedresults presented for this food groupLikely to be reasonably relevant for Australian women, although hypospadias rates very high <strong>and</strong> unlikely that most Australian women will have suchhigh pesticide exposure; threshold of vegetable consumption very low (once a week versus more than once a week)Ragusa region in Sicily is a region of intensive agriculture (involving high rates of pesticide <strong>and</strong> other chemical use) with high rates of hypospadias <strong>and</strong>cryptorchidismDietary guidelines for pregnant <strong>and</strong> <strong>breastfeeding</strong> women: evidence report514
Reference Herrick 2003Food groupsVegetables: green vegetables; potatoesStudy typeProspective cohortLevel of evidence II (aetiology)SettingMotherwell, Scotl<strong>and</strong>FundingDunhill Medical Trust, NIHParticipants251 men <strong>and</strong> women whose mothers’ food intakes had been recorded during pregnancy during 1967 to 1968. These women had been advised to eat0.45 kg of red meat a day <strong>and</strong> to avoid carbohydrate-rich foods during pregnancyBaseline comparisons See confounding belowDietary assessment Mothers asked about consumption of 10 foodsTimingEarly pregnancy (≤ 20 weeks); late pregnancy (> 20 weeks)Comparisonportions of green vegetables <strong>and</strong> potatoes per weekOutcomesCortisol concentrations in offspring aged 30 yearsResultsGreen VegetablesCortisol concentrations highest in women consuming more than 21 portions of meat/fish <strong>and</strong> < 7 portions of green vegetables per week inlate pregnancyLength of followupConfoundingRisk of biasRelevanceOther commentsPotatoes: no significant association seen with cortisol concentrations (exact numbers not reported in paper)30 yearsAnalyses adjusted for offspring’s gender, social class at birth, BMI, alcohol consumption, <strong>and</strong> activity levelModerate risk of bias: <strong>For</strong> the 1432 records from 1967-8 recorded liveborn, singleton births with complete names, birth measurements <strong>and</strong> ≥ 1 dietrecord. 965 offspring were alive <strong>and</strong> living locally; <strong>and</strong> after attrition or declining to participate, 251 (17.5%) were available for analysis.Very high intake of meat <strong>and</strong> very low carbohydrate intake limits the relevance to current dietary intakes of Australian womenAuthors state that “in the setting of advice to follow a pregnancy diet high in protein <strong>and</strong> low in carbohydrate, an unbalanced pattern of higher meat/fish<strong>and</strong> lower green vegetable consumption in late pregnancy leads to elevated cortisol concentrations in the offspring"Vegetables515
Reference Jensen 2004Food typeVegetables: all; specific vegetables (string beans or peas; tomatoes or tomato juice; coleslaw or cabbage; mustard greens, turnip greens, collards, kale;carrots or mixed vegetables containing carrots; broccoli; spinach; cauliflower or brussel sproutsStudy typeCase controlLevel of evidence III-3 (aetiology)SettingCalifornia, USA (part of the Northern California Childhood Leukemia Study)FundingPHSParticipants138 matched cases <strong>and</strong> controls:Cases: Children under 15 years of age, with a parent who spoke English or Spanish, were resident in the study area at the time of diagnosis of acutelymphoblastic leukemia (ALL), with no prior diagnosis of cancerControls: identified from birth certificates matched to the case on date of birth, sex, maternal race, Hispanic ethnicity of mother or father, <strong>and</strong> county ofresidence at birthBaseline comparisons A priori potential confounders were identified as birthweight, <strong>breastfeeding</strong>, maternal age <strong>and</strong> education, parental occupation <strong>and</strong> smoking duringpregnancy – no evidence of confounding was seen for these variables. Also see Confounding below.Dietary assessment FFQTimingDietary intake to reflect the year before the index pregnancy (to indicate dietary status at the start of pregnancy)ComparisonServes of vegetablesOutcomesChildhood acute lymphoblastic leukemiaResults Vegetables as a group: aOR 0.53 95% CI 0.33 to 0.85: mean consumption 0.74 [SD 0.48] serves per dayString beans or peas:aOR 0.84 95% CI 0.71 to 1.00: mean consumption 3.40 [SD 1.81] serves per day*Tomatoes, tomato juice: aOR 0.94 95% CI 0.82 to 1.08: mean consumption 4.24 [SD 2.17] serves per day*Coleslaw, cabbage:Mustard greens, etc.:Carrots, etc.:Broccoli:Spinach:aOR 0.88 95% CI 0.71 to 1.08: mean consumption 2.07 [SD 1.51] serves per day*aOR 0.88 95% CI 0.58 to 1.34: mean consumption 1.23 [SD 0.80] serves per day*aOR 0.79 95% CI 0.67 to 0.94: mean consumption 4.14 [SD 1.86] serves per day*aOR 1.00 95% CI 0.84 to 1.19: mean consumption 3.72 [SD 1.81] serves per day*aOR 1.02 95% CI 0.81 to 1.27: mean consumption 2.18 [SD 1.51] serves per day*FollowupConfoundingRisk of biasRelevanceOther commentsCauliflower or b. Sprouts aOR 1.03 95% CI 0.83 to 1.27: mean consumption 2.13 [SD 1.49] serves per day*n/aAnalyses were adjusted for variables previously shown to be significantly associated with ALL in the overall study – income, prior fetal loss, child’sexposure to other children under age five, <strong>and</strong> maternal exposure to indoor insecticides during pregnancy; along with portion size <strong>and</strong> energyconsumptionLow-moderate risk of bias: Of eligible cases identified from January 1995 to November 1999, 83% consented to participate; 69% of the eligible controlsagreed to participate. Of the 161 matched pairs, seven pairs were excluded as the respondent was not the biological mother, 16 pairs were excludeddue to questionable dietary questionnaire data, leaving 138 matched pairs (86%); some recall bias likelyLikely to be relevant for Australian women, though some diet components may differ e.g. high bean consumption*Some consumption levels seem high – possibly per week rather than per day?Dietary guidelines for pregnant <strong>and</strong> <strong>breastfeeding</strong> women: evidence report516
Reference Jones 2000 (see also Yin 2010)Food typeVegetablesStudy typeProspective cohortLevel of evidence II (aetiology)SettingSouthern Tasmania, AustraliaFundingNHMRC, Tasmanian Government, Royal Hobart Hospital Acute Care ProgramParticipants173 mothers; <strong>and</strong> their infants born in 1988 (part of a larger infant health study of babies at high risk of SIDS)Exclusions: multiple pregnanciesBaseline comparisons Mothers with no tertiary education more likely to have been excluded due to missing dataDietary assessment FFQTimingDietary intake during third trimester of pregnancyComparisonLinear regression of density (portions per kJ)OutcomesBone mass (bone mineral density (BMD) <strong>and</strong> bone mineral content*) in 8 year old childrenResultsBMD at 8 years;Total body (g/cm 2 )r 2 0% 0.002 (p = 0.42)adjusted r 2 23% 0.001 (p = 0.52)Femoral neck (g/cm 2 )r 2 1% 0.002 (p = 0.50)adjusted r 2 33% 0.001 (p = 0.67)Lumbar spine (g/cm 2 )r 2 2% 0.005 (p = 0.1adjusted r 2 33% 0.004 (p = 0.11)Followup8 yearsConfounding Analyses were adjusted for method of dietary assessment, maternal education, parental unemployment, sex, weight at age 8 years, height at age 8years, weekend sunlight exposure in winter at age 8 years, smoking during pregnancy, sports participation, ever breast-fed <strong>and</strong> current calcium intake.Risk of biasModerate-high: 330 (215 males, 115 females) representing a 60% response rate from those available in 1996; 47% of the original 1988 cohort, Thisdropped to 173 (dietary information missing or unreliable for 115 mothers, 32 multiple births, 10 participants had missing data for confounders)representing 52% of participants from 1996 <strong>and</strong> 25% of those in the original cohort.72% of the 173 participants were male. Gender imbalance suggests potential selection bias (due to original selection of infants at high risk of SIDS)RelevanceInfants at high risk of SIDS represent a selected group (more males, preterm births, teenage mothers, smoking during pregnancy)Other comments *Bone mineral content not reported – stated to be similar to bone mineral density resultsVegetables517
Reference Knox 1972Food typeVegetables (canned beans, onions/shallots, brussel sprouts, old potatoes, new potatoes, tomatoes, cabbages, canned peas)Study typeCase control (cases matched to food consumption at population level for a particular period)Level of evidence III-3 (aetiology)SettingBirmingham, UKFundingNot reportedCases Stillbirths <strong>and</strong> infant deaths due to anencephalus between 1961 <strong>and</strong> 1967Baseline comparisons n/aDietary assessment Population surveysTimingEach quarterComparisonMonthly stillbirths <strong>and</strong> infant deaths due to anencephalus matched to quarterly consumption of main food stuffs (in previous five to nine months)OutcomesAnencephalusResultsCanned beans negatively associated with cases of anencephalus: r = -0.67 after a lag interval of five monthsOnions/shallots negatively associated with cases of anencephalus: r = -0.55 after a lag interval of five monthsBrussel sprouts negatively associated with cases of anencephalus: r = -0.54 after a lag interval of five monthsOld potatoes negatively associated with cases of anencephalus: r = -0.53 after a lag interval of five monthsNew potatoes positively associated with cases of anencephalus: r = +0.64 after a lag interval of five monthsTomatoes positively associated with cases of anencephalus: r = +0.62 after a lag interval of five monthsCabbages positively associated with cases of anencephalus: r = +0.60 after a lag interval of five monthsCanned peas positively associated with cases of anencephalus: r = +0.54 after a lag interval of nine months*FollowupConfoundingRisk of biasRelevanceOther commentsn/aAnalyses were not adjustedHigh risk of bias: links between population consumption of foods <strong>and</strong> anencephalus very distal <strong>and</strong> no control for potential confoundersLikely to differ from a modern Australian dietFood consumption of total population not likely to reflect food consumption of pregnant women; <strong>and</strong> will not be able to reflect differences between dietsof individual or specific groups*Positive association with canned peas may be due to magnesium salts used in processing <strong>and</strong> canningDietary guidelines for pregnant <strong>and</strong> <strong>breastfeeding</strong> women: evidence report518
Reference Kwan 2009Food typeVegetables: string beans or peas; tomatoes or tomato juice; coleslaw or cabbage; mustard greens, turnip greens, collards, kale; carrots or mixedvegetables containing carrots; broccoli; spinach; cauliflower or brussel sprouts; cooked green peppers, chilli peppers, hot chilli sauceStudy typeCase controlLevel of evidence III-3 (aetiology)Setting California, USA (part of the Northern California Childhood Leukemia Study – phase 1 <strong>and</strong> 2 (phase 1 reported in Jensen 2004)FundingPHS; Paul O’Gorman Foundation for Children with LeukemiaParticipants866 individuals - 282 matched cases <strong>and</strong> controls (205 pairs <strong>and</strong> 77 trios):Cases: Children under 15 years of age, with a parent who spoke English or Spanish, were resident in the study area at the time of diagnosis of acutelymphoblastic leukemia (ALL), with no prior diagnosis of cancerControls: identified from birth certificates matched to the case on date of birth, sex, maternal race, Hispanic ethnicity of mother or father, <strong>and</strong> county ofresidence at birth (in phase 1 (1995-99) only due to concerns about overmatching on potential environmental exposures linked to leukemia risk)Data collected from August 1995 to November 2002Baseline comparisons A priori potential confounders were identified as birthweight, <strong>breastfeeding</strong>, maternal age <strong>and</strong> education, <strong>and</strong> smoking during pregnancy.Also see Confounding below.Dietary assessment FFQTimingDietary intake to reflect the year before the index pregnancy (to indicate dietary status at the start of pregnancy)ComparisonServes of vegetablesOutcomesChildhood acute lymphoblastic leukemiaResultsVegetables (garden vegetable only – excludes salad, potatoes, soup <strong>and</strong> stew):aOR 0.65 95% CI 0.50 to 0.84: median consumption 0.74 (25 th 75 th percentiles 0.4, 1.0) serves per dayGreen beans: aOR 0.85 95% CI 0.74 to 0.98FollowupConfoundingRisk of biasRelevanceOther commentsCarrots: aOR 0.82 95% CI 0.71 to 0.96n/aAnalyses were adjusted for total energy intake, household income, indoor insecticide exposure during pregnancy; <strong>and</strong> proportion of foods reported aslarge or extra-large portion sizeAlso adjusted for child’s diet, with little effect seen on resultsLow-moderate risk of bias: Of eligible cases identified from January 1995 to November 2002, 86% consented to participate; 56% of the eligible controlsagreed to participate. 190 participants excluded: leukemia diagnosis was not ALL (n = 127); no dietary data (n = 4); a case or a control respondent wasnot the biological mother (n = 14), questionable dietary questionnaire data (n = 45), leaving 282 matched sets (86%).Likely to be relevant for Australian women, though some diet components may differ e.g. high bean consumptionRegular use of any dietary supplement was not associated with risk of ALL.Vegetables519
Reference Lagiou 2006Food typeVegetables <strong>and</strong> pulsesStudy typeProspective cohort studyLevel of evidence II (aetiology)SettingBoston, USAFundingNIHParticipants 277 pregnant women who were Caucasian, < 40 years old <strong>and</strong> parity no more than two (recruited between March 1994 <strong>and</strong> October 1995).Exclusions: women who had taken any kind of hormonal medication during the index pregnancy, with a prior diagnosis of diabetes mellitus or thyroiddisease, or if the fetus had a known major anomaly.Dietary assessment FFQTimingMailed to women prior to a routine antenatal visit around 27 weeks GA, to reflect women’s dietary intake during the second trimester of pregnancyBaseline comparisons Women in the study likely to be older, better educated, primiparae, lower BMI <strong>and</strong> less likely to smoke than pregnant women in the general USpopulationComparisonVegetables <strong>and</strong> pulses – times consumed per month (mean 103.9 SD (increment) 60.7); potatoesOutcomes Maternal pregnancy oestradiol, unconjugated oestriol, sex hormone binding globulin (SHBG), progesterone, prolactin – women’s blood was taken at 16<strong>and</strong> 27 completed weeks GA.ResultsMaternal oestradiol16 completed weeks GA: p < 0.1027 completed weeks GA: p < 0.10FollowupConfoundingRisk of biasRelevanceOther commentsMaternal oestriol16 completed weeks GA: p < 0.1027 completed weeks GA: p < 0.10Maternal SHBG16 completed weeks GA: 4.2% change 95% CI 0.6 to 7.927 completed weeks GA: 4.2% change 95% CI 0.2 to 8.4Maternal progesterone16 completed weeks GA: p < 0.1027 completed weeks GA: p < 0.10Maternal prolactin16 completed weeks GA: -4.5% change 95% CI -10.7 to 2.127 completed weeks GA: -4.4% change 95% CI -9.2 to 0.627 completed weeks GAAdjusted for age, parity, gender of offspring, smoking <strong>and</strong> GA at blood measurement, BMI before pregnancy, energy, coffee <strong>and</strong> alcohol intake duringpregnancyLow to moderate risk of bias: 277 of 402 (68.9%) eligible women were included – 77 refused to participate, 9 were subsequently excluded because theindex pregnancy was terminated through a spontaneous or induced abortion, 2 were excluded because of twin birth <strong>and</strong> 10 were lost to follow-up afterthe initial meeting.Indirect outcomes for (risk of) breast cancerStudy authors postulate that the association between increased birthweight <strong>and</strong> increased breast cancer risk are mediated through endocrinehormones; SHBG is inversely associated with pre-pregnancy BMI <strong>and</strong> maternal weight gain during pregnancyDietary guidelines for pregnant <strong>and</strong> <strong>breastfeeding</strong> women: evidence report520
Reference Lamb 2008Dietary patterns Vegetables (alfalfa sprouts, beans or lentils, Brussel sprouts, celery, cabbage or coleslaw, kale, mustard or chard greens, romaine or leaf lettuce, mixedvegetables, string beans, cooked spinach, raw spinach, yellow squash, iceberg or head lettuce, garlic, eggplant, zucchini or other summer squash, peasor lima beans, cauliflower, broccoli, tofu or soybeans, <strong>and</strong> red chilli sauce); potatoes (baked/boiled/mashed potatoes, French fried potatoes, potatochips); other root vegetables (beets, cooked carrots, raw carrots, yams or sweet potatoes)Study typePart of a longitudinal prospective birth cohort studyLevel of evidence II (aetiology)SettingDenver, Colorado, US (part of the Diabetes Autoimmunity Study in the Young (the DAISY))FundingNational Institutes of <strong>Health</strong>, Diabetes Endocrine Research CenterParticipants642 newborns at increased risk for type 1 diabetes (based on HLA genotype <strong>and</strong> family history), enrolled in the study from 1993 to 2004; 27 casesdefined as testing positive for islet autoantibodies at two consecutive blood draws <strong>and</strong> still positive (diabetic) at last follow-upBaseline comparisons See confounding belowDietary assessment FFQTimingFrom 1997 to 2004, mothers of infants enrolled in DAISY completed FFQ soon after birth, reflecting diet in the last trimester of pregnancy (but couldsubmit FFQ before child reached one year of age)ComparisonMonthly servings of vegetables, potatoes <strong>and</strong> other root vegetablesOutcomes Islet autoimmunity (a precursor of type 1 diabetes) at 9 months, 15 months, 2 years <strong>and</strong> annually thereafter up to the age of 15ResultsVegetables:aHR (for one st<strong>and</strong>ard deviation change in reported consumption) 0.61 95% CI 0.34 to 1.09 (59 mean monthly servings)Potatoes:aHR (for one st<strong>and</strong>ard deviation change in reported consumption) 0.58 95% CI 0.34 to 1.01 (18 mean monthly servings)additionally adjusted for <strong>breastfeeding</strong> duration <strong>and</strong> first introduction to cereals: aHR 0.49 95% CI 0.28 to 0.87FollowupConfoundingRisk of biasRelevanceOther commentsUp to 15 yearsSize for gestational age, ethnicity, maternal education, household income, exposure to type 1 diabetes or GDM in utero, gender of child, maternal ageat birth, total calories of maternal dietModerate risk of bias: subset of DAISY only (later enrolments); <strong>and</strong> women were not reminded to submit FFQ, leading to possible selection bias; of the661 FFQs returned, 5 were excluded because incomplete, <strong>and</strong> 14 for implausible dietary intakes, leaving 642 FFQs for analysis; child’s diet notcontrolled for (except partially for first introduction to cereals in the maternal potato consumption analysis)Likely to be relevant to some Australian women, although women in this study may have been at higher risk of diabetesVegetables521
Reference Laraia 2007Dietary patterns % of vegetable serving recommendationStudy typeProspective cohort studyLevel of evidence II (aetiology)SettingNorth Carolina, US (part of the Pregnancy, Infection <strong>and</strong> Nutrition (PIN) cohort)FundingNational Institute of Child <strong>Health</strong> <strong>and</strong> Human Development; NIHParticipants 2394 predominantly lower to middle income women, recruited between 24 <strong>and</strong> 29 weeks gestation (1995-2000)Baseline comparisons Mean DQI-P score varied significantly by socio-demographic characteristics; there were higher mean DQI-scores for women who engaged in prepregnancyvigorous exercise <strong>and</strong> pre-pregnancy vitamin useDietary assessment Modified block FFQTimingSelf-report at 26-28 weeks gestation covering previous 3 months (corresponding to the 2 nd trimester)ComparisonBMI categoriesOutcomesPregravid weight status (not an outcome but there is an association)ResultsAverage % of vegetable serving recommendation [SD]Underweight 98.5 [72.0]Normal weight 90.8 [65.6]Overweight 101.3 [80.1]Obese 86.4 [64.5]Obese group significantly different from overweight (p < 0.03) <strong>and</strong> underweight (p < 0.01)*adjusted for age, ethnicity, level of education, poverty, number of children, smoking duringpregnancy onlyFollowupConfoundingRisk of biasRelevanceOther comments26 to 31 weeks gestationAge, ethnicity, level of education, poverty, number of children, smoking during pregnancy, regular vitamin use prior to pregnancy, vigorous leisureactivity 3 months prior to pregnancyLow risk of bias: better to have used normal weight women as the reference rather than underweight women DQI-P tertile comparisonLikely to be relevant to Australian womenDietary guidelines for pregnant <strong>and</strong> <strong>breastfeeding</strong> women: evidence report522
Reference Li 2009Dietary patterns VegetablesStudy typeRetrospective cohort studyLevel of evidence III-2 (aetiology)SettingNorth AmericaFundingNational Institute of Dental <strong>and</strong> Craniofacial ResearchParticipants1034 mothers who had participated in a case-control study of children with congenital craniofacial malformationsBaseline comparisons See confounding belowDietary assessment FFQTimingFruit <strong>and</strong> vegetable intake in the six months before pregnancyComparisonQuartiles of vegetable consumption (never to four or more times a day)Serves per day, median (range)1 st quartile 0.73 (0 to 1.11)2 nd quartile 1.53 (1.12 to 2.00)3 rd quartile 2.47 (2.01 to 3.03)4 th quartile 4.00 (3.04 to 13.46)OutcomesUpper respiratory infection in women during the first half of pregnancy (not including asthma or allergy) [44 URTI episodes without a known start datewere excluded from hazards analysis]ResultsURTI (five month risk)HR (95% CI) aHR (95% CI) p-value for trendQ1 1.00 1.00Q2 1.12 (0.82 to 1.51) 1.11 (0.81 to 1.51)Q3 1.13 (0.84 to 1.52) 1.15 (0.84 to 1.58)Q4 1.10 (0.81 to 1.49) 1.17 (0.84 to 1.64) 0.33FollowupConfoundingRisk of biasRelevanceOther commentsURTI (three month risk)HR (95% CI) aHR (95% CI) p-value for trendQ1 1.00 1.00Q2 0.97 (0.66 to 1.44) 0.97 (0.65 to 1.46)Q3 0.81 (0.54 to 1.22) 0.84 (0.55 to 1.30)Q4 0.93 (0.62 to 1.38) 0.98 (0.63 to 1.52) 0.785 months since last menstrual periodAdjusted for age, race, energy intake, fruit intakeLow-moderate risk of bias: 1034/1163 (88.9%) women included in analysis – 88 with an incomplete FFQ, 41 with implausible energy intakes); womenwere interviewed at an average of 8 months after birth, but up to 36 months, so some risk of recall bias; some evidence of increased fruit <strong>and</strong> vegetableconsumption once pregnancy was known (misclassification bias)Likely to be relevant to Australian womenURTI during pregnancy may be associated with preterm birth <strong>and</strong> congenital abnormalitiesVegetables523
Reference Martindale 2005Dietary patterns VegetablesStudy typeProspective cohort studyLevel of evidence II (aetiology)SettingAberdeen, Scotl<strong>and</strong>FundingAsthma UKParticipants1300 singleton children born to women recruited between October 1997 <strong>and</strong> April 1999 (at a median gestational age of 12 weeks)Baseline comparisons Study population were slightly older, more likely to be primiparous, less likely to be current smokers, <strong>and</strong> more likely to be from nonmanual socialclasses than the corresponding general populationDietary assessment FFQ at 34 weeks gestation (also enquired about use of vitamin <strong>and</strong> mineral supplements during the previous 3 monthsTimingTiming of FFQ at 34 weeks was chosen to “avoid the dietary disruption of early pregnancy <strong>and</strong> to provide an indication of the habitual dietary intake inmiddle <strong>and</strong> late pregnancy”ComparisonNot clearly statedOutcomesSymptoms of wheeze, doctor-diagnosed eczemaResultsEczema in 2 nd year of life:Vegetables: no significant associationWheeze in 2 nd year of life:Vegetables: no significant associationFollowup6, 12 <strong>and</strong> 24 monthsConfoundingAnalyses adjusted for gender, maternal age, paternal social class, maternal smoking, other children in the home <strong>and</strong> antibiotic useRisk of bias Low-moderate risk of bias: 1924 singletons were born to the 2000 women recruited (34 twins, 42 miscarriage, stillbirth or neonatal death), 1751 (87.6%)of women completed the FFQ, with complete data sets from all three questionnaires available at 24 months for 1300 children (67.6%)RelevanceReasonably relevant, probably lower fruit <strong>and</strong> vegetable intake than in AustraliaOther comments Most results reported as intake of vitamin C <strong>and</strong> E, not by number of serves of fruit <strong>and</strong> vegetablesDietary guidelines for pregnant <strong>and</strong> <strong>breastfeeding</strong> women: evidence report524
Reference Mikkelsen 2006Food typeFruit <strong>and</strong> vegetablesStudy typeProspective cohort studyLevel of evidence II (aetiology)SettingWomen participating in the Danish National Birth Cohort, i.e. became pregnant during January 1997-October 2002 <strong>and</strong> recruited through generalpractitioners.FundingDanish National Research Foundation, March of Dimes Birth Defects Foundation, European Union, Novonordic Foundation, ISMF, the <strong>Health</strong>Foundation, Danish National Medical Research Foundation, Danish Heart Association.Participants43,585 pregnant women with singleton pregnancies for whom complete dietary information <strong>and</strong> birth records were available.Dietary assessment FFQ compared mid-pregnancy, validated in Danish men <strong>and</strong> women. Timeframe for food consumption unclear (i.e. consumption in last week, monthetc).Baseline comparisons See Confounding below.TimingFFQ completed at 25 weeks gestational age.ComparisonBirth weights in quintiles of intake of green leafy vegetables (GLV).Subgroup analyses performed on a group of thin women (BMI < 20).OutcomesBirth weight <strong>and</strong> z-scores (in singletons only)ResultsMean birthweight <strong>and</strong> Z-scores were consistently lowest in the lowest quintile.Regression coefficients of the dietary exposures <strong>and</strong> birthweightCrude (95% CI)Adjusted (95% CI)GLV 6.6 (0.75-12.5) pns 6.1 (0.35-11.5)*GLV – Energy-adjusted 6.0 (0.094-11.9)* 5.5 (-0.23-11.3) pns*p < 0.05Among lean women, substantially stronger associations were seen between the dietary exposures <strong>and</strong>outcomes.FollowupConfoundingRisk of biasRelevanceOther commentsUntil child was 18 months old (but birth weight only data reported here).Analyses adjusted for dietary supplements, maternal smoking, maternal height, pre-pregnant weight, paternal height, parity <strong>and</strong> maternal age.Separate analyses also adjusted for energy intake.Large population based cohort. Prospective ascertainment of outcomes.Low risk of bias.It is possible that the contribution of GLV to total vegetable intake may be different in Danish <strong>and</strong> Australian women (possible less in Danish women <strong>and</strong>this could explain the weak effect seen for GLV in this study).Vegetables525
Reference Mitchell 2004Dietary patterns Vegetables (green <strong>and</strong> root vegetables, peas, corn, lentils)Study typeCase-control studyLevel of evidence III-3 (aetiology)SettingWaitemata <strong>Health</strong> or Auckl<strong>and</strong> <strong>Health</strong>care regions, New Zeal<strong>and</strong>Funding<strong>Health</strong> Research Council of New Zeal<strong>and</strong>, Foundation for the Newborn, Child <strong>Health</strong> Research FoundationParticipants Mothers of 1138 children born between October 1995 <strong>and</strong> November 1997 (844 born SGA <strong>and</strong> 870 born appropriate for GA); only term infants (> 37weeks);Exclusions: preterm births (< 37 weeks), multiple births <strong>and</strong> those with congenital anomaliesBaseline comparisons See confounding belowDietary assessment FFQTimingFFQ administered after birth (to cover the periconception period <strong>and</strong> the last month of pregnancy)Comparison0-0.75 v > 0.75-1.25 v > 1.25-2.0 v > 2.0-3.0 v > 3 serves of vegetables per dayOutcomesSGA (≤ 10 th centile for GA <strong>and</strong> gender)ResultsSGA (Vegetable consumptionat time of conception)SGA AGA aOR (95% CI) p value fortrend0-0.75 138/539 (25.6%) 137/598 (22.9%) 1.25 (0.79 to 1.97)>0.75-1.25 93/539 (17.3%) 81/598 (13.5%) 1.58 (0.97 to 2.58)>1.25-2.0 87/539 (16.1%) 104/598 (17.4%) 1.12 (0.70 to 1.80)>2.0-3.0 126/539 (15.5%) 190/598 (31.8%) 1.40 (0.91 to 2.14)>3 99/539 (18.4%) 86/598 (14.4%) 1 0.32SGA (Vegetable consumption in last month of pregnancy)SGA AGA aOR (95% CI) p value fortrend0-0.75 146/539 (27.1%) 126/598 (21.1%) 1.20 (0.76 to 1.92)>0.75-1.25 76/539 (14.1%) 84/598 (14.1%) 0.94 (0.57 to 1.56)>1.25-2.0 91/539 (16.9%) 132/598 (22.1%) 0.69 (0.43 to 1.10)>2.0-3.0 159/539 (29.5%) 183/598 (30.6%) 0.98 (0.64 to 1.51)>3 67/539 (12.4%) 73/598 (12.2%) 1 0.12FollowupConfoundingRisk of biasRelevanceOther commentsNAAdjusted for socio-economic status, ethnicity, maternal height, maternal weight before pregnancy, maternal hypertension <strong>and</strong> maternal smoking; butfolate supplementation was not controlled for (periconception folate was significantly associated with reduced SGA risk).Low-moderate risk of bias: Of the 2182 eligible infants, parents of 1714 (78.6%) completed the FFQ; 1138 (67%) of women completed the FFQ; missingitems in completed FFQ treated as woman not consuming any vegetablesLikely to be relevant to Australian womenOnly term infants includedDietary guidelines for pregnant <strong>and</strong> <strong>breastfeeding</strong> women: evidence report526
Reference Miyake 2010Food typeFruit <strong>and</strong> vegetablesStudy typeProspective cohort studyLevel of evidence II (aetiology)SettingWomen recruited antenatally from hospital obstetric clinics in Neyagawa city <strong>and</strong> surround municipalities, Osaka Prefecture, Japan, from November2001 to March 2003.FundingMinistry of Education, Culture, Sports, Science <strong>and</strong> Technology; <strong>and</strong> <strong>Health</strong> <strong>and</strong> Labour Sciences Research Grants, Research on Allergic Disease <strong>and</strong>Immunology, Ministry of <strong>Health</strong>, Labour <strong>and</strong> Welfare, Japan.Participants763 mother-infant pairs follow up until 24 months postpartum.Dietary assessment Self-administered FFQ undertaken during pregnancy. FFQ validated amongst 92 women against weighed dietary records.Baseline comparisons See confounding belowVitamin C supplements or multivitamin supplements were only used by 5.6% <strong>and</strong> 4.2% of participants at least once a week, therefore contribution ofmicronutrients from supplements was not considered in the analysis.Timing FFQ undertaken at baseline recruitment relating to diet in the month prior, but varying time of diet assessment as women were recruited from between 5<strong>and</strong> 39 weeks gestation.ComparisonQuartile of dietary intakes <strong>and</strong> infant wheeze <strong>and</strong> eczema at 16-24 months.OutcomesInfant wheeze <strong>and</strong> eczema, based on symptoms defined according to ISAAC criteria.ResultsPrevalence of wheeze <strong>and</strong> asthma at 16-24 months was 22.1% <strong>and</strong> 18.6% respectively.75% of infants were breastfed for at least 6 months.No significant association between maternal intake of total vegetables, green <strong>and</strong> yellow vegetables, vegetables other than green <strong>and</strong> yellow vegetables- <strong>and</strong> wheeze.Similar for eczema with the exception of green <strong>and</strong> yellow vegetables.EczemaGreen <strong>and</strong> Yellow Vegetables Crude OR (CI) Adjusted OR (CI)Q1 1.00 1.00Q2 0.33 (0.19-0.56) 0.30 (0.16-0.52)Q3 0.55 (0.33-0.88) 0.53 (0.31-0.89)Q4 0.51 (0.31-0.83) 0.41 (0.24-0.71)P 0.02 0.01FollowupUntil 24 months postpartumConfoundingQuartile median adjusted for energy intake. Analyses adjusted for maternal age, gestation at baseline, residence, income, maternal <strong>and</strong> parentaleducation, maternal <strong>and</strong> parental history of asthma, atopic eczema <strong>and</strong> allergic rhinitis, changes in maternal diet in the previous month, season,maternal smoking, baby’s older siblings, baby’s birthweight, household smoking in the same room as infant, <strong>breastfeeding</strong> duration, <strong>and</strong> age of infant atthird survey.Risk of bias Moderate risk of bias (selection, ascertainment <strong>and</strong> attrition): low participation rate, women participating had higher education levels; close to 25%losses to follow up at 24 months assessment; Wheeze was assessed at varying ages between 16 <strong>and</strong> 24 months.RelevanceHigh prevalence of wheeze <strong>and</strong> eczema (22.1% <strong>and</strong> 18.6%) in this population aged 16-24 months - ?higher than that reported in Australia. Wheeze ininfancy is not a reliable predictor of asthma in older ages.Other commentsVegetables527
Reference Nwaru 2010Food typeVegetables (cabbages, canned vegetables, cucumber, tomaoto, sweet pepper, courgette, eggplant, salads, spinach, celery, corn, Chinese cabbage,fresh herbs, onions, leek, garlic, carrot, swede, turnip, beetroot, parsnip, Jerusalem, artichoke, potatoes)Study typeProspective cohort studyLevel of evidence II (aetiology)SettingTampere, Finl<strong>and</strong>FundingAcademy of Finl<strong>and</strong>, Finnish Pediatric Research Foundation, the Juho Vainio Foundation, the Yrjo Jahnsson Foundation, Turku, Oulu <strong>and</strong> TampereUniversity Hospitals, JDRF, Novo Nordisk Foundation, EU Biomed 2 ProgramParticipants931 mother-infant pairs (children with human leukocyte antigen-conferred susceptibility to type 1 diabetes) participating in the Finnish type 1 DiabetesPrediction <strong>and</strong> Prevention (DIPP) Nutrition Study between September 1996 <strong>and</strong> October 1997Baseline comparisons See confounding belowDietary assessment FFQTimingFFQ given to women after birth, for return at the three month visit (FFQ intended to cover maternal diet during pregnancy <strong>and</strong> lactation)ComparisonAmount of vegetable intakeOutcomesAllergic sensitisation in offspring by 5 years: food allergens (egg, cow’s milk, fish, wheat); inhalant allergens (house dust mite, cat, timothy grass, birch)ResultsTotal vegetables <strong>and</strong> rootsFood allergensInhalant allergensOR 0.77 95% CI 0.50 to 1.18 OR 1.16 95% CI 0.79 to 1.69aOR 0.80 95% CI 0.49 to 1.31 aOR 1.28 95% CI 0.82 to 1.99- PotatoesFood allergensInhalant allergensOR 0.74 95% CI 0.51 to 1.07 OR 0.74 95% CI 0.54 to 1.03aOR 0.73 95% CI 0.48 to 1.23 aOR 0.92 95% CI 0.63 to 1.35FollowupConfoundingRisk of biasRelevanceOther commentsTo 5 yearsAdjusted for energy intake, place of birth, season of birth, sex of the child, number of siblings, gestational age at birth, parental asthma, parental allergicrhinitis, maternal age at birth, maternal smoking during pregnancy, maternal educationLow risk of risk of bias: data available for 931/1175 (79.2%) children recruited – 108 did not participate in survey, a further 49 did not have IgEmeasurements, a further 87 had no FFQ or an incomplete FFQLikely to be relevant to Australian women; some differences in individual types of vegetables between Finl<strong>and</strong> <strong>and</strong> Australia28% of women took vitamin D supplements, 73% took iron supplements;HLA genotype not likely to have any impact on the development of allergic diseases.Dietary guidelines for pregnant <strong>and</strong> <strong>breastfeeding</strong> women: evidence report528
Reference Oien 2010Food typeVegetablesStudy typeRetrospective* cohort study (Prevention of Allergy among Children in Trondheim (PACT) study)Level of evidence III-2 (aetiology)SettingTrondheim, NorwayFunding Norwegian Department of <strong>Health</strong> <strong>and</strong> Social Affairs, Astra Zeneca Norway, Norwegian Medical Association, SINTEF Unimed 1999Participants3086 childrenBaseline comparisons See confounding belowDietary assessment FFQTimingAdministered when child was one year of ageComparison≤ 1/week versus 2-5/week versus almost dailyOutcomesChildhood eczema, asthma at two yearsResultsEczema at 2 years2-5/week (n = 1505) versus ≤ 1/week (n = 275) : OR 0.76 95% CI 0.55 to 1.06almost daily (n = 985) versus ≤ 1/week (n = 275): OR 0.72 95% CI 0.51 to 1.02Asthma at 2 years2-5/week (n = 1505) versus ≤ 1/week (n = 275) : OR 0.98 95% CI 0.56 to 1.69almost daily (n = 992) versus ≤ 1/week (n = 275): OR 1.02 95% CI 0.58 to 1.81FollowupConfoundingRisk of biasRelevanceOther commentsTo two yearsMaternal intake during pregnancy analyses were not adjustedModerate to high risk of bias: of the 5171 eligible children, questionnaires were completed for 3086 children (59.7%); analyses were not adjusted;mothers needed to recall their diet more than a year previouslyLikely to be relevant to Australian womenChildren were followed prospectively from one year of age to approximately two years of age; *information on exposure was assessed retrospectivelywhen the child was one year of age;Mothers’ consumption of fish <strong>and</strong> vegetables <strong>and</strong> children’s consumption of fish <strong>and</strong> vegetables were highly correlated;Vegetables529
Reference Petridou 1998Food typeVegetables: raw tomatoes, cooked tomatoes, cucumbers, peppers, raw cabbage, cooked cabbage, lettuce, raw carrots, cooked carrots, zucchini,onions, green beans, eggplants, spinach, leeks, okra, d<strong>and</strong>elions, artichokes, fresh broad beans, peas, cauliflower, broccoli, beets, mushrooms,vegetable pie (0.5), moussaka (0.5).Study typeCase-control studyLevel of evidence III-3SettingGreater Athens area, GreeceFundingGreek Ministry of <strong>Health</strong> <strong>and</strong> Welfare, <strong>and</strong> Foundation for Research in Childhood ‘S. Doxiadis’ParticipantsCases: 109 children with cerebral palsy (CP), born between 1984 <strong>and</strong> 1988 (estimated to be two-thirds of the children with CP born during this period)Controls (1): 155 neighbouring children of similar sex <strong>and</strong> age (± 12 months)Controls (2): 99 healthy siblings of similar sex <strong>and</strong> age (± 12 months) of the first neurological patient seen by the attending physician after a visit by theCP patientBaseline comparisons See confounding belowDietary assessment FFQTimingDuring pregnancyComparison≤ 4 versus 5 versus > 5 serves of vegetables per day;regression analysis: risk of cerebral palsy with change in consumption by one unit ( = consumption of vegetables once per day)OutcomesCerebral palsyResults≤ 4 serves of vegetables per day: 18/91 (19.8%) cases 63/246 (25.6%) controls5 serves of vegetables per day: 22/91 (24.2%) cases 86/246 (35.0%) controls> 5 serves of vegetables per day: 51/91 (56.0%) cases v 97/246 (39.4%) controlsFollowupConfoundingRisk of biasRelevanceOther commentsRegression analysis for each unit of consumption of vegetables once per day:aOR 1.36 95% CI 1.07 to 1.73aOR 1.19 95% CI 0.88 to 1.61 (additionally adjusted for all food groups)8 yearsAge <strong>and</strong> sex of child, maternal age at birth, maternal age at menarche, maternal chronic disease, previous spontaneous abortions, persistent vomitingduring index pregnancy, multiple pregnancy, number of obstetric visits; timing of membrane rupture in index birth, use of general anaesthesia in theindex birth, mode of birth, abnormal placenta, infant head circumference at birth, congenital malformation, place of index birth, use of supplementaryiron during index pregnancy, physical exercise during index pregnancy, painless childbirth classes.The following were not included in the model:- Smoking or consumption of coffee or alcohol during pregnancy (stated to be “unrelated to CP <strong>and</strong> had no confounding influence”);- Gestational age, birthweight <strong>and</strong> maternal weight gain (stated to be “strong predictors of CP, but were not included in the model, since they areprobably intermediate stages in a possible link between diet <strong>and</strong> CP (mediators) rather than genuine confounders”Moderate-high: High risk of recall bias for women being able to accurately remember their dietary intake during a pregnancy 8 years previously;Cases: 109 children with CP were identified; for 6 children either collaboration with their guardian or a diagnosis of CP was not confirmed; <strong>and</strong> reliablematernal dietary intakes were not available for 12 women, leaving 91 cases available for analysis.Controls: 278 mother-child pairs were approached; 16 refused to participate; matching controls were not available in 8 instances, <strong>and</strong> reliable maternaldietary intakes were not available for 8 women, leaving 246 controls available for analysis.Diets of Greek women in 1998 may differ from current diets of Australian womenDietary guidelines for pregnant <strong>and</strong> <strong>breastfeeding</strong> women: evidence report530
Reference Pierik 2004Food typeVegetable rich dietStudy type Case-control study (1999-2001)Level of evidence III-3SettingRotterdam, Netherl<strong>and</strong>sFundingEndocrine Modulators Study Group of the European Chemical Industry Council <strong>and</strong> Nutricia Research FoundationParticipantsCases: 78 cryptorchidism <strong>and</strong> 56 hypospadias cases (diagnosed at first child health visit)Controls: 313 controls= 443 mother-child pairs (including four boys with both abnormalities)Baseline comparisons See confounding belowDietary assessment Phyto-oestrogen specific food questionnaireTimingDuring index pregnancyComparisonVegetable rich diet: yes versus noOutcomesCryptorchidism <strong>and</strong> hypospadiasResultsCryptorchidism: yes versus no for vegetable rich dietaOR 0.4 95% CI 0.2 to 0.9HypospadiasCases Controls OR (95% CI)Yes 24 125 0.7 (0.4 to 1.2)No 54 186 1.0FollowupConfoundingRisk of biasRelevanceOther commentsNACryptorchidism analysis adjusted for a range of maternal <strong>and</strong> paternal risk factors; only univariate (unadjusted) analysis presented for hypospadiasModerate risk of bias: Participation rate was 85% for cases <strong>and</strong> 68% for controls; hypospadias analysis was unadjusted for potential confoundersReasonably relevant to Australian women although likely to be different ethnic mixVegetables531
Reference Pogoda 2009Food typeVegetables: all vegetables, yellow-orange vegetables, cruciferous vegetables, leafy green vegetablesStudy typeCase-control studySeparate centre reports: Preston-Martin 1996 (Los Angeles); Lubin 2000 (Israel); Cordier 1994 (France); McCredie 1994 (Australia)Level of evidence III-3 (aetiology)SettingInternational (seven countries – USA, Israel, Italy, Spain, Australia, France <strong>and</strong> Canada (International Collaborative Study of Childhood Brain Tumors)FundingNIH, California Department of <strong>Health</strong>, Southern California Environmental <strong>Health</strong> Sciences Center, National Cancer Institutes, Cancer SurveillanceSystem of Western Washington, Fred Hutchinson Cancer Research Center, Fondo de Investigaciones Sanitarias of Spain, Conselleria de Sanitat iConsum of Valencian Autonomous Community for the Childhood Cancer Registry of the Province of Valencia, Spanish Society of Paediatric Oncologywith the National Childhood Cancer Registry, ISCIII-RTIC, Villavecchia Foundation <strong>and</strong> Scientific Foundation of the AECCParticipants Cases: 1281Controls: 2223Years of diagnosis varied between centres, ranging from 1976 to 1992 (with most diagnosed between 1982 <strong>and</strong> 1992)Controls were frequency matched to cases in US centres <strong>and</strong> in France; otherwise they were individually matched (by region of residence, age, sex,<strong>and</strong> geographic area (except for Sydney <strong>and</strong> Los Angeles))Baseline comparisons See confounding belowDietary assessment St<strong>and</strong>ardised study questionnaire using detailed dietary recall methods <strong>and</strong> abstract food models to gauge portion sizeTimingDiet during the past year <strong>and</strong> during the index pregnancyComparisonQuartilesOutcomesChildhood brain tumoursResultsAll tumours (n = 1203 cases)Controls Cases aOR 95% CICruciferous vegetablesQ1 1195 (55%) 652 (55%) 1.0Q2 318 (15%) 189 (16%) 1.0 (0.9 to 1.2)Q3 332 (15%) 175 (15%) 0.9 (0.8 to 1.1)Q4 339 (16%) 159 (14%) 0.9 (0.6 to 1.4)P for trend = 0.45Leafy green vegetablesQ1 964 (44%) 535 (46%) 1.0Q2 405 (19%) 221 (19%) 0.9 (0.6 to 1.5)Q3 425 (19%) 193 (16%) 0.9 (0.6 to 1.2)Q4 392 (18%) 226 (19%) 1.1 (0.9 to 1.4)P for trend = 0.60Yellow-orange vegetablesQ1 710 (36%) 420 (40%) 1.0Q2 426 (21%) 215 (20%) 0.9 (0.7 to 1.1)Q3 404 (20%) 214 (20%) 0.8 (0.7 to 1.0)Q4 444 (22%) 208 (20%) 0.8 (0.6 to 1.0)P for trend = 0.04Astroglials (n = 621 cases)Cruciferous vegetablesQ1 1195 (55%) 309 (52%) 1.0Q2 318 (15%) 109 (18%) 1.2 (1.0 to 1.4)Dietary guidelines for pregnant <strong>and</strong> <strong>breastfeeding</strong> women: evidence report532
Q3 332 (15%) 94 (16%) 0.9 (0.8 to 1.2)Q4 339 (16%) 87 (15%) 1.0 (0.6 to 1.5)P for trend = 0.64Leafy green vegetablesQ1 946 (44%) 251 (42%) 1.0Q2 405 (19%) 111 (19%) 1.0 (0.7 to 1.3)Q3 425 (19%) 112 (19%) 1.0 (0.7 to 1.4)Q4 392 (18%) 123 (21%) 1.2 (0.8 to 1.6)P for trend = 0.45Yellow-orange vegetablesQ1 710 (36%) 209 (39%) 1.0Q2 426 (21%) 95 (18%) 0.7 (0.5 to 1.1)Q3 404 (20%) 121 (23%) 0.9 (0.7 to 1.3)Q4 444 (22%) 111 (21%) 0.8 (0.6 to 1.1)P for trend = 0.24Primitive neural ectodermal tumours (PNETs) (n = 257 cases)Cruciferous vegetablesQ1 1195 (55%) 146 (59%) 1.0Q2 318 (15%) 34 (14%) 0.9 (0.7 to 1.3)Q3 332 (15%) 35 (15%) 0.9 (0.7 to 1.4)Q4 339 (16%) 34 (14%) 1.0 (0.5 to 1.7)P for trend = 0.88Leafy green vegetablesQ1 964 (44%) 125 (50%) 1.0Q2 405 (19%) 46 (18%) 0.9 (0.4 to 1.9)Q3 425 (19%) 34 (14%) 0.6 (0.3 to 1.3)Q4 392 (18%) 44 (18%) 1.0 (0.7 to 1.5)P for trend = 0.71Yellow-orange vegetablesQ1 710 (36%) 87 (38%) 1.0Q2 318 (15%) 59 (26%) 1.2 (0.9 to 1.5)Q3 332 (15%) 38 (17%) 0.7 (0.5 to 0.8)Q4 339 (16%) 42 (19%) 0.6 (0.4 to 0.9)P for trend = 0.0002Tumour SubtypesAstrocytomasPilocytic (142 cases) Anaplastic (96 cases) Other (199 cases)Cruciferous vegetables 1.2 (0.6 to 2.6) 0.4 (0.3 to 0.7) 0.8 (0.5 to 1.5)P for trend 0.57 < 0.0001 0.45Yellow-orange vegetables 0.5 (0.4 to 0.6) 0.6 (0.4 to 1.0) 0.7 (0.5 to 1.1)P for trend 0.0004 0.03 0.21Vegetables533
FollowupConfoundingRisk of biasRelevanceOther commentsOther typesMalignant gliomas(122 cases)Medulloblastomas (193 cases) PNET (64 cases) Ependymomas(104 cases)Cruciferous vegetables 1.1 (0.6 to 2.3) 0.6 (0.3 to 1.3) 1.7 (0.7 to 3.7) 0.8 (0.3 to 2.2)P for trend 0.79 0.44 0.51 0.74Yellow-orange vegetables 1.1 (0.9 to 1.3) 0.5 (0.3 to 0.8) 0.8 (0.4 to 1.7) 0.7 (0.3 to 1.4)P for trend 0.18 0.0004 0.45 0.22n/aAnalyses adjusted for age <strong>and</strong> sex of child, study centre <strong>and</strong> each food group;Adjustment for total intake of foods had little effect on estimatesModerate risk of bias: 75% of eligible cases <strong>and</strong> 71% of eligible controls participated (based on centres for which these data were available); some lackof st<strong>and</strong>ardisation in dietary assessments between study centres; potentially high risk of recall bias for women whose pregnancies may have been atleast 10 years previously.Likely to be relevant to Australian womenDietary guidelines for pregnant <strong>and</strong> <strong>breastfeeding</strong> women: evidence report534
Reference Ramon 2009Food typeVegetablesStudy typeProspective cohort studyLevel of evidence II (aetiology)SettingWomen attending hospital for fetal anomaly screening in Valencia, Spain between February 2004 <strong>and</strong> June 2005 (INMA-Valencia cohort)FundingInstituto de Salud Carlos III, Ministerio Sanidad y Consumo, Ministerio Educacion y Ciencia.Participants787 infants born between May 2004 <strong>and</strong> February 2006 to women at least 16 y, singleton pregnancy, antenatal visit at 10-13 weeks, no assistedconception, no chronic hypertensionMean age 30 y (range 16 to 43); 55% primiparous, 67% completed secondary education; 62% employed; 24% overweight or obeseDaily intake fruit 293.0 [216.1] g/dayDaily intake veg. 213.3 [121.0] g/dayDietary assessment FFQ to assess diet in the first trimester (administered at 10-13 weeks) <strong>and</strong> then diet since the first assessment (administered at 28-32 weeks). FFQvalidated for Spanish population.Baseline comparisons See Confounding belowTimingFFQ administered at 10-13 wks <strong>and</strong> then again at 28-32 weeks gestation.ComparisonQuintiles of vegetable intake in first <strong>and</strong> third trimester <strong>and</strong> birthweight, birth length, SGA (weight), SGA (length).First trimester vegetable intake was 72.8 g/day (range 0 to 114) for quintile 1 <strong>and</strong> 394.7 g/day (range 299.4 to 948.8) in quintile 5OutcomesBirthweight st<strong>and</strong>ardised for gender <strong>and</strong> GA;SGA (weight or length) defined as below 10 th percentile based on growth reference charts st<strong>and</strong>ardised for both gender <strong>and</strong> GA for the SpanishpopulationResultsSummary: lower vegetable intake in the first <strong>and</strong> third trimester is associated with SGA (strongest in first trimester), lower vegetable intake in the firsttrimester is associated with SGA for length. Lower intake of vegetables was associated with decreased birthweight <strong>and</strong> length.Adjusted OR of the dietary exposures <strong>and</strong> SGA for weight <strong>and</strong> length (crude not reported)SGA for weight (95% CI) SGA for length (95% CI)Vegetable – first trimesterQ1 3.7 (1.5-8.9) 1.6 (0.6-4.5)Q2 3.0 (1.2-7.0) 1.9 (0.7-5.3)Q3 1.7 (0.7-4.3) 0.3 (0.1-1.3)Q4 1.0 (0.4-2.7) 0.8 (0.2-2.3)Q5 1 1P
FollowupConfoundingRisk of biasRelevanceOther commentsUntil birth.Analyses adjusted for energy intake, maternal age, maternal pre-pregnancy weight, maternal height, paternal height, weight gain, parity, smoking duringpregnancy, caffeine intake, working, country of origin, infant sex, socioeconomic status.Low/moderate risk of selection bias due to 54% participation rate. (Women who worked were more likely to participate).More generalisable to Australian women than some of the other studies of veg. Undertaken in a ‘horticultural area’ where fruit <strong>and</strong> vegetables arewidely available.Authors suggest that low vegetable consumption may affect the lower tail of the birthweight <strong>and</strong> length distribution.Dietary guidelines for pregnant <strong>and</strong> <strong>breastfeeding</strong> women: evidence report536
Reference Sausenthaler 2007Food groupsVegetables (also nuts <strong>and</strong> seeds, fats <strong>and</strong> oils, dairy, fish, eggs, fruit)Study typeProspective cohort study: from the LISA birth cohortLevel of evidence II (aetiology)Setting4 German cities (Munich, Leipzig, Wesel, Bad Honnef)FundingFederal Ministry for Education, Science, Research <strong>and</strong> Technology, GermanyParticipants3097 newborns recruitedBaseline comparisons See Confounding belowDietary assessment FFQTimingMaternal diet during the last 4 weeks of pregnancy (obtained shortly after birth, median 3 days)VariableLow intake group as reference group compared with high intake group: Raw carrots high intake = 1-2 times/week Spinach high intake = 2-3 times/month Cabbage high intake = 1-2 times/week Celery high intake = 2-3 times/month Raw tomatoes high intake = 3-4 times/week Raw sweet pepper high intake = 2-3 times/month Salad high intake = 3-4 times/week Vegetable juice high intake = 2-3 times/monthOutcomesAllergic sensitisation, eczema at 2 years of ageResultsDoctor-diagnosed eczema Any allergen sensitisation Food allergens Inhalant allergensVegetablesAdjusted OR (95% CI)Raw carrots 1.12 (0.85, 1.46) 0.85 (0.61, 1.18) 1.02 (0.69, 1.49) 0.77 (0.47, 1.28)Spinach 1.26 (0.99, 1.61) 0.97 (0.71, 1.32) 0.82 (0.58, 1.17) 1.18 (0.73, 1.91)Cabbage 1.24 (0.96, 1.59) 0.92 (0.66, 1.28) 0.84 (0.58, 1.22) 1.16 (0.71, 1.90)Celery 0.94 (0.67, 1.31) 1.61 (1.07, 2.41) 1.85 (1.18, 2.89) 1.39 (0.74, 2.58)Raw tomatoes 0.83 (0.63, 1.10) 0.81 (0.57, 1.16) 0.74 (0.49, 1.11) 1.05 (0.62, 1.77)Raw sweet pepper 0.97 (0.75, 1.27) 1.45 (1.03, 2.06) 1.16 (0.79, 1.69) 2.16 (1.20, 3.90)Salad 0.92 (0.69, 1.22) 1.09 (0.76, 1.57) 1.14 (0.76, 1.72) 0.92 (0.52, 1.62)Vegetable juice 0.91 (0.68, 1.22) 0.78 (0.53, 1.16) 0.85 (0.56, 1.31) 0.85 (0.46, 1.56)Length of followupConfoundingRisk of biasRelevanceOther comments2 yearsCrude <strong>and</strong> adjusted results reported (adjusted for study area, sex, maternal age, maternal smoking, level of parental education, exclusive <strong>breastfeeding</strong>≥ 4 months, parental history of atopic diseases, season of birth <strong>and</strong> all dietary variablesLow risk of bias: two year data available for 2641/3097 children (85%): 433 lost to follow-up, 9 excluded due to chronic disease, 14 missing maternalFFQLikely to be reasonably similar to dietary intakes of Australian women in AustraliaVegetables537
Reference Shiell 2001Food groupsGreen vegetablesStudy typeProspective cohortLevel of evidence II (aetiology)SettingMotherwell, Scotl<strong>and</strong>FundingDunhill Medical TrustParticipants626 (274 men <strong>and</strong> 352 women) whose mothers’ food intakes had been recorded during pregnancy during 1967 to 1968. These women had beenadvised to eat 0.45 kg of red meat a day <strong>and</strong> to avoid carbohydrate-rich foods during pregnancyBaseline comparisons See confounding belowDietary assessment Mothers asked about consumption of 10 foodsTimingEarly pregnancy (≤ 20 weeks); late pregnancy (> 20 weeks)ComparisonMaternal consumption of green vegetables (mean consumption in late pregnancy was 5.4 [SD 2.8] serves per weekOutcomesSystolic <strong>and</strong> diastolic blood pressure at in offspring aged 27 to 30 yearsResultsSystolic blood pressure at 27 to 30 yearsRegression coefficient for amount of maternal green vegetable consumption; ß -0.29 95% CI -0.62 to 0.05Diastolic blood pressure at 27 to 30 yearsRegression coefficient for amount of maternal green vegetable consumption; ß -0.12 95% CI -0.38 to 0.14Systolic blood pressure for < 7 serves of maternal green vegetable consumption/week at 27 to 30 years*Regression coefficient: ß 0.26 95% CI 0.03 to 0.50Length of followupConfoundingRisk of biasRelevanceOther comments27 to 30 yearsAnalyses adjusted for offspring’s gender, BMI, alcohol consumption, <strong>and</strong> cuff size used for blood pressureModerate risk of bias: <strong>For</strong> the 1432 records from 1967-8 recorded liveborn, singleton births with complete names, birth measurements <strong>and</strong> ≥ 1 dietrecord. 965 offspring were alive <strong>and</strong> living locally; <strong>and</strong> after attrition or declining to participate, 626 (43.7%) were available for analysis.Very high intake of meat <strong>and</strong> very low carbohydrate intake limits the relevance to current dietary intakes of Australian women*Authors state that “low intake of green vegetables, a source of folate, accentuated the effect of high meat <strong>and</strong> fish consumption on systolic bloodpressure"Dietary guidelines for pregnant <strong>and</strong> <strong>breastfeeding</strong> women: evidence report538
Reference Willers 2007Food typeVegetablesStudy typeProspective cohort (longitudinal)Level of evidence II (aetiology)SettingAntenatal clinics at Aberdeen Maternity Hospital, Aberdeen, Scotl<strong>and</strong>FundingAsthma UK, GA 2 LEN European Network of Excellence on Global Allergy <strong>and</strong> AsthmaParticipants1212 children (singleton births) whose mothers were recruited between October 1997 <strong>and</strong> April 1999 at a median gestational age of 12 weeksBaseline comparisons Women were representative of the local obstetric populationSee confounding belowDietary assessment FFQTimingFFQ mailed at 32 weeks gestation to cover dietary intake over the previous 2-3 monthsComparisonTertiles:OutcomesWheeze, (asthma), allergic rhinitis, atopic eczema, hay fever at 5 yearsResultsVegetables (total) <strong>and</strong> green leafy vegetables – no consistent linear associations with respiratory <strong>and</strong> atopic outcomes in 5 year old children (exactnumbers not reported in the paper).FollowupConfoundingRisk of biasRelevanceOther comments5 yearsAdjusted for maternal age, paternal social class, maternal education, maternal smoking during pregnancy, smoking in the child’s home at 5 years,energy intake, maternal asthma, maternal atopy, child’s birthweight, child’s sex, presence of older siblings, <strong>and</strong> <strong>breastfeeding</strong>Low risk of bias: Initial study population of 1924 children dropped to 1212 participants with complete data (63.0%) (questionnaire, at least one of theoutcome time points).Likely to be reasonably relevant to Australian womenInclusion of maternal supplement use during pregnancy did not materially change the resultsVegetables539
Reference Willers 2008Food typeVegetablesStudy typeProspective cohort (longitudinal)Level of evidence II (aetiology)SettingNetherl<strong>and</strong>sFundingNetherl<strong>and</strong>s Organization for <strong>Health</strong> Research <strong>and</strong> Development, Netherl<strong>and</strong>s Organization for Scientific Research; Netherl<strong>and</strong>s Asthma Fund;Netherl<strong>and</strong>s Ministry of Spatial Planning, Housing, <strong>and</strong> the Environment; Netherl<strong>and</strong>s Ministry of <strong>Health</strong>, Welfare <strong>and</strong> Sport, GlaxoSmithKlineParticipants2,832 children (part of the Prevention <strong>and</strong> Incidence of Asthma <strong>and</strong> Mite Allergy (PIAMA) birth cohort studyBaseline comparisons See confounding belowDietary assessment FFQTimingFFQ administered at antenatal recruitment (mean gestational ages not reported) to cover dietary intake over the previous monthComparisonDaily (once per day or more) v 1-4 times a week or fewerOutcomesWheeze, dyspnoea, prescription of inhaled steroids for respiratory problems, composite variable ‘asthma symptoms’ in the last 12 months (measuredlongitudinally from 1 to 8 years age)Results Wheeze from 1 to 8 years age (n = 2830)OR 0.97 95% CI 0.85 to 1.12aOR 0.97 95% CI 0.83 to 1.12Dyspnoea from 1 to 8 years age (n = 2830)OR 1.01 95% CI 0.86 to 1.19aOR 0.99 95% CI 0.84 to 1.17Steroid use from 1 to 8 years age (n = 2830)OR 0.93 95% CI 0.75 to 1.15aOR 0.96 95% CI 0.76 to 1.20FollowupConfoundingRisk of biasRelevanceOther commentsAsthma symptoms (composite of previous three outcomes) from 1 to 8 years age (n = 2830)OR 0.98 95% CI 0.85 to 1.13aOR 0.98 95% CI 0.84 to 1.148 yearsThe child’s dietary data on fruit, vegetables, fish, eggs, full cream milk, butter <strong>and</strong> peanut butter consumption at 2 years of age were used to check forpotential confounding by the child’s diet.Results were adjusted for by sex, maternal education, parental allergy, maternal smoking during pregnancy, smoking in the home at 8 years of age,<strong>breastfeeding</strong>, presence of older siblings, birthweight, maternal overweight 1 year after pregnancy, maternal supplement use during pregnancy, region<strong>and</strong> study arm (intervention or natural history arm).Moderate risk of bias: Initial study population of 4,146 mothers dropped to 2,832 participants with complete data (68.3%) (pregnancy questionnaire, atleast one of the outcome time points <strong>and</strong> all confounders). Participants with complete data were more likely to have a high education level, to have dailydairy <strong>and</strong> fruit intake during pregnancy <strong>and</strong> to have breastfed <strong>and</strong> less likely to have maternal asthma or maternal atopy, smoked during pregnancy, befrom a south western region compared with participants who did not have complete data.Dietary intakes likely to be different from Australian e.g. low fish consumption in study participantsNot clear when women assessed their diet during pregnancy;83% of pregnant women used supplements (50% used folic acid/iron)Dietary guidelines for pregnant <strong>and</strong> <strong>breastfeeding</strong> women: evidence report540
Reference Yin 2010 (see also Jones 2000)Food typeVegetablesStudy typeProspective cohortLevel of evidence II (aetiology)SettingSouthern Tasmania, AustraliaFundingNHMRC, Tasmanian Government, Royal Hobart Hospital Acute Care ProgramParticipants216 adolescents born in 1988 (part of a larger infant health study of babies at high risk of SIDS)Exclusions: multiple pregnanciesBaseline comparisons Children with unemployed fathers more likely to have been excluded due to missing dataDietary assessment FFQTimingDietary intake during third trimester of pregnancyComparisonLinear regression of density (portions per kJ)OutcomesBone mass (bone mineral density (BMD) <strong>and</strong> bone mineral content*) in 16 year old adolescentsResultsBMD at 16 years;Total body (g/cm 2 )r 2 -0.003; ß + 2.5 (pns)adjusted r 2 0.324; ß – 2.3 (pns)Femoral neck (g/cm 2 )r 2 0.004 ß + 7.7 (pns)adjusted r 2 0.348; ß + 2.7 (pns)Lumbar spine (g/cm 2 )r 2 – 0.004; ß + 2.1 (pns)adjusted r 2 0.197; ß -1.8 (pns)Followup16 yearsConfoundingAnalyses were adjusted for sex, weight at age 16 years, sunlight exposure in winter at age 16 years, smoking during pregnancy, sports participation,ever breast-fed, current calcium intake, Tanner stage, maternal age at the time of childbirth <strong>and</strong> “other factors” [these other factors were not listed in thepaper]Risk of bias Moderate-high: 415 children were followed from birth to age 16. This dropped to 216 (dietary information missing or unreliable for 138 mothers, 47multiple births, 14 participants had missing data for confounders) representing 52% of participants followed from birth to age 16.70% of the 216 participants were male. Gender imbalance suggests potential selection bias (due to original selection of infants at high risk of SIDS)RelevanceInfants at high risk of SIDS represent a selected group (more males, preterm births, teenage mothers, smoking during pregnancy)Other comments *Bone mineral content results not reported;Study flow figures differ between 2000 <strong>and</strong> 2010 reports (e.g. numbers of multiple births)Vegetables541
Reference Zhang 2006Food typeVegetable fibreStudy typeProspective cohort studyLevel of evidence II (aetiology)SettingUSA (Nurses’ <strong>Health</strong> Study II)FundingNIHParticipants 13,110 women who reported having at least one singleton pregnancy lasting ≥ 6 months, between 1992 <strong>and</strong> 1998Exclusions: implausible total energy intake (< 500 kcal/day or > 3,500 kcal/day); multiple gestation; history of diabetes, cancer, cardiovascular disease,or GDM on the 1989 or 1991 questionnaire.Baseline comparisons See resultsDietary assessment FFQTimingFFQs administered in 1991 or 1995 to reflect dietary intake over the past yearComparisonQuintiles of vegetable fibre intake (lowest quintile = reference)OutcomesSelf-reported diagnosis of gestational diabetes mellitus (GDM)ResultsGDM (adjusted for age, parity, BMI)g/day cases/person-years RR (95% CI) p-value for trendQ1 (< 4.1) 168/20,201 1.00Q2 (4.2 to 5.4) 163/20,591 1.02 (0.83 to 1.26)Q3 (5.5 to 6.8) 161/19,734 0.99 (0.80 to 1.23)Q4 (6.9 to 8.8) 140/18,826 0.95 (0.76 to 1.19)Q5 (> 8.8) 126/19,280 0.77 (0.61 to 0.98) 0.03GDM (adjusted for age, parity, BMI, race/ethnicity, smoking, family history of diabetes, alcohol intake, physical activity, total energy, proteinintake, saturated fat, <strong>and</strong> polyunsaturated, monounsaturated <strong>and</strong> trans fatty acids)g/day cases/person-years RR (95% CI) p-value for trendQ1 (< 4.1) 168/20,201 1.00Q2 (4.2 to 5.4) 163/20,591 1.04 (0.84 to 1.28)Q3 (5.5 to 6.8) 161/19,734 1.00 (0.80 to 1.24)Q4 (6.9 to 8.8) 140/18,826 0.97 (0.77 to 1.22)Q5 (>8.8) 126/19,280 0.83 (0.64 to 1.08) pnsGDM (adjusted for age, parity, BMI, physical activity, race/ethnicity, smoking, family history of diabetes, alcohol intake, total energy, proteinintake, saturated fat, <strong>and</strong> polyunsaturated, monounsaturated <strong>and</strong> trans fatty acids, <strong>and</strong> vegetable <strong>and</strong> fruit fibre)g/day cases/person-years RR (95% CI) p-value for trendQ1 (< 4.1) 168/20,201 1.00Q2 (4.2 to 5.4) 163/20,591 1.06 (0.86 to 1.32)Q3 (5.5 to 6.8) 161/19,734 1.04 (0.83 to 1.29)Q4 (6.9 to 8.8) 140/18,826 1.01 (0.80 to 1.28)Q5 (> 8.8) 126/19,280 0.87 (0.67 to 1.13) pnsFollowupVariableConfoundingSee resultsRisk of bias Low risk of bias: actual attrition figures for this substudy not reported but overall attrition reported to be 10%Dietary guidelines for pregnant <strong>and</strong> <strong>breastfeeding</strong> women: evidence report542
RelevanceOther commentsLikely to be relevant to Australian womenDietary assessment periods will differ in relation to timing of pregnancies – need to assume a woman’s diet will remain similar over time <strong>and</strong> whether orshe is pregnant or planning to become pregnant. This assumption may not apply to alcohol intake, for exampleVegetables543
ReferencesBrekke H <strong>and</strong> Ludvigsson J. "Daily vegetable intake during pregnancynegatively associated to islet autoimmunity in the offspring--the ABIS study."Pediatr Diabetes 2010: 11(4): 244-50.Chatzi L, Torrent M, Romieu I, Garcia-Esteban R, Ferrer C, Vioque J, KogevinasM <strong>and</strong> Sunyer J. "Mediterranean diet in pregnancy is protective for wheeze<strong>and</strong> atopy in childhood." Thorax 2008: 63(6): 507-13.George GC, Hanss-Nuss H, Milani TJ <strong>and</strong> Freel<strong>and</strong>-Graves JH. "Food choices oflow-income women during pregnancy <strong>and</strong> postpartum." J Am Diet Assoc2005: 105(6): 899-907.Giordano F, Abballe A, De Felip E, di Domenico A, Ferro F, Grammatico P,Ingelido AM, Marra V, Marrocco G, Vallasciani S <strong>and</strong> Figa-Talamanca I."Maternal exposures to endocrine disrupting chemicals <strong>and</strong> hypospadias inoffspring." Birth Defects Res A Clin Mol Teratol 2010: 88(4): 241-50.Giordano F, Carbone P, Nori F, Mantovani A, Taruscio D <strong>and</strong> Figa-Talamanca I."Maternal diet <strong>and</strong> the risk of hypospadias <strong>and</strong> cryptorchidism in theoffspring." Paediatr Perinat Epidemiol 2008: 22(3): 249-60.Herrick K, Phillips DI, Haselden S, Shiell AW, Campbell-Brown M <strong>and</strong> GodfreyKM. "Maternal consumption of a high-meat, low-carbohydrate diet in latepregnancy: relation to adult cortisol concentrations in the offspring." J ClinEndocrinol Metab 2003: 88(8): 3554-60.Jensen CD, Block G, Buffler P, Ma X, Selvin S <strong>and</strong> Month S. "Maternal dietaryrisk factors in childhood acute lymphoblastic leukemia (United States)."Cancer Causes Control 2004: 15(6): 559-70.Jones G, Riley MD <strong>and</strong> Dwyer T. "Maternal diet during pregnancy isassociated with bone mineral density in children: a longitudinal study." Eur JClin Nutr 2000: 54(10): 749-56.Dietary guidelines for pregnant <strong>and</strong> <strong>breastfeeding</strong> women: evidence reportKnox EG. "Anencephalus <strong>and</strong> dietary intakes." Br J Prev Soc Med 1972: 26(4):219-23.Kwan ML, Jensen CD, Block G, Hudes ML, Chu LW <strong>and</strong> Buffler PA. "Maternaldiet <strong>and</strong> risk of childhood acute lymphoblastic leukemia." Public <strong>Health</strong> Rep2009: 124(4): 503-14.Lagiou P, Lagiou A, Samoli E, Hsieh CC, Adami HO <strong>and</strong> Trichopoulos D. "Dietduring pregnancy <strong>and</strong> levels of maternal pregnancy hormones in relation tothe risk of breast cancer in the offspring." Eur J Cancer Prev 2006: 15(1): 20-6.Lamb MM, Myers MA, Barriga K, Zimmet PZ, Rewers M <strong>and</strong> Norris JM."Maternal diet during pregnancy <strong>and</strong> islet autoimmunity in offspring."Pediatr Diabetes 2008: 9(2): 135-41.Laraia BA, Bodnar LM <strong>and</strong> Siega-Riz AM. "Pregravid body mass index isnegatively associated with diet quality during pregnancy." Public <strong>Health</strong> Nutr2007: 10(9): 920-6.Li L <strong>and</strong> Werler MM. "Fruit <strong>and</strong> vegetable intake <strong>and</strong> risk of upper respiratorytract infection in pregnant women." Public <strong>Health</strong> Nutr 2010: 13(2): 276-82.Martindale S, McNeill G, Devereux G, Campbell D, Russell G <strong>and</strong> Seaton A."Antioxidant intake in pregnancy in relation to wheeze <strong>and</strong> eczema in thefirst two years of life." Am J Respir Crit Care Med 2005: 171(2): 121-8.Mikkelsen TB, Osler M, Orozova-Bekkevold I, Knudsen VK <strong>and</strong> Olsen SF."Association between fruit <strong>and</strong> vegetable consumption <strong>and</strong> birth weight: aprospective study among 43,585 Danish women." Sc<strong>and</strong> J Public <strong>Health</strong>2006: 34(6): 616-22.544
Mitchell EA, Robinson E, Clark PM, Becroft DM, Glavish N, Pattison NS, PryorJE, Thompson JM <strong>and</strong> Wild CJ. "Maternal nutritional risk factors for small forgestational age babies in a developed country: a case-control study." ArchDis Child Fetal Neonatal Ed 2004: 89(5): F431-5.Miyake Y, Sasaki S, Tanaka K <strong>and</strong> Hirota Y. "Consumption of vegetables, fruit,<strong>and</strong> antioxidants during pregnancy <strong>and</strong> wheeze <strong>and</strong> eczema in infants."Allergy 2010: 65(6): 758-65.Nwaru BI, Ahonen S, Kaila M, Erkkola M, Haapala AM, Kronberg-Kippila C,Veijola R, Ilonen J, Simell O, Knip M <strong>and</strong> Virtanen SM. "Maternal diet duringpregnancy <strong>and</strong> allergic sensitization in the offspring by 5 yrs of age: aprospective cohort study." Pediatr Allergy Immunol 2010: 21(1 Pt 1): 29-37.Oien T, Storro O <strong>and</strong> Johnsen R. "Do early intake of fish <strong>and</strong> fish oil protectagainst eczema <strong>and</strong> doctor-diagnosed asthma at 2 years of age? A cohortstudy." J Epidemiol Community <strong>Health</strong> 2010: 64(2): 124-9.Petridou E, Koussouri M, Toupadaki N, Youroukos S, Papavassiliou A,Pantelakis S, Olsen J <strong>and</strong> Trichopoulos D. "Diet during pregnancy <strong>and</strong> the riskof cerebral palsy." Br J Nutr 1998a: 79(5): 407-12.Petridou E, Ntouvelis E, Dessypris N, Terzidis A <strong>and</strong> Trichopoulos D."Maternal diet <strong>and</strong> acute lymphoblastic leukemia in young children." CancerEpidemiol Biomarkers Prev 2005: 14(8): 1935-9.Pierik FH, Burdorf A, Deddens JA, Juttmann RE <strong>and</strong> Weber RF. "Maternal <strong>and</strong>paternal risk factors for cryptorchidism <strong>and</strong> hypospadias: a case-controlstudy in newborn boys." Environ <strong>Health</strong> Perspect 2004: 112(15): 1570-6.Pogoda JM, Preston-Martin S, Howe G, Lubin F, Mueller BA, Holly EA, FilippiniG, Peris-Bonet R, McCredie MR, Cordier S <strong>and</strong> Choi W. "An international casecontrolstudy of maternal diet during pregnancy <strong>and</strong> childhood brain tumorrisk: a histology-specific analysis by food group." Ann Epidemiol 2009: 19(3):148-60.Ramon R, Ballester F, Iniguez C, Rebagliato M, Murcia M, Esplugues A, MarcoA, Garcia de la Hera M <strong>and</strong> Vioque J. "Vegetable but not fruit intake duringpregnancy is associated with newborn anthropometric measures." J Nutr2009: 139(3): 561-7.Sausenthaler S, Koletzko S, Schaaf B, Lehmann I, Borte M, Herbarth O, vonBerg A, Wichmann HE <strong>and</strong> Heinrich J. "Maternal diet during pregnancy inrelation to eczema <strong>and</strong> allergic sensitization in the offspring at 2 y of age."Am J Clin Nutr 2007: 85(2): 530-7.Shiell AW, Campbell-Brown M, Haselden S, Robinson S, Godfrey KM <strong>and</strong>Barker DJ. "High-meat, low-carbohydrate diet in pregnancy: relation to adultblood pressure in the offspring." Hypertension 2001: 38(6): 1282-8.Willers SM, Devereux G, Craig LC, McNeill G, Wijga AH, Abou El-Magd W,Turner SW, Helms PJ <strong>and</strong> Seaton A. "Maternal food consumption duringpregnancy <strong>and</strong> asthma, respiratory <strong>and</strong> atopic symptoms in 5-year-oldchildren." Thorax 2007: 62(9): 773-9.Willers SM, Wijga AH, Brunekreef B, Kerkhof M, Gerritsen J, Hoekstra MO, deJongste JC <strong>and</strong> Smit HA. "Maternal food consumption during pregnancy <strong>and</strong>the longitudinal development of childhood asthma." Am J Respir Crit CareMed 2008: 178(2): 124-31.Yin J, Dwyer T, Riley M, Cochrane J <strong>and</strong> Jones G. "The association betweenmaternal diet during pregnancy <strong>and</strong> bone mass of the children at age 16."Eur J Clin Nutr 2010: 64(2): 131-7.Zhang C, Liu S, Solomon CG <strong>and</strong> Hu FB. "Dietary fiber intake, dietary glycemicload, <strong>and</strong> the risk for gestational diabetes mellitus." Diabetes Care 2006a:29(10): 2223-30.Vegetables545
Excluded StudiesExcluded studiesSTUDYNarrative review 26. Belfort 2008 54. Qiu 2008 81. Knudsen 2006 108. Lopez-Exposito 20091. Jackson 2001 27. Bo 2001 55. Rocha 2010 82. Krauss-Etschmann 2007 109. Marques 20082. Kind 2006 28. Brender 2004 56. Sabel 2009 83. Liu 2010 110. Oberl<strong>and</strong>er 2010No perinatal outcomes 29. Brion 2008a 57. Saldana 2004 84. Lucia Bergman 2007 111. Olafsdottir 20053. Bolton 1968 30. Brion 2010 58. S<strong>and</strong>ers 1992 85. Luoto 2010 112. Romon 20014. Cuco 2006 31. Campbell 1996 59. Scholl 2004 86. Makrides 2006 113. Ross 19985. Ereman 1987 32. Chan 1987 60. Shaw 2008 87. Olafsdottir 2005 114. Schulze 20036. Glueck 1980 33. Chierici 1999 61. Shiell 2000 88. Olsen 2008 115. Shaw 20037. Kankaanpaa 2001 34. Clausen 2001 62. Skajaa 1991 89. Picciano 2003 116. Wang 20008. Miyake 2008 35. Devereux 2007 63. Sloan 2001 90. Rees 20089. Myers 2009 36. Devereux 2006 64. Smedts 2009 91. Szajewska 200610. Northstone 2008 37. Duggleby 2010 65. Smedts 2008 92. Tofail 200611. Palmer 2005 38. Duggleby 2002 66. Tobias 2005 Other12. Petrakos 2006 39. Erkkola 2009 67. Van Eijsden 2008 93. Alm 200913. Petridou 1992 40. Ferl<strong>and</strong> 2003 68. Verkleij-hagoort 2006 94. Arkkola 200814. Pinto 2009 41. Gale 2008 69. Wijendran 1999 95. Arshad 199215. Rogers 1998 42. Javid 2006 70. Wolff 2008 96. Artal 200716. Scopesi 2001 43. Lagiou 2004 71. Yazdy 2010 97. Atkinson 199817. Snook Parrott 2009 44. Litonjua 2006 Supplements 98. Baker 200918. Specker 1994 45. Mahon 2010 72. Adair 1996 99. Carmichael 200319. Storro 2010 46. Major 1998 73. Bergmann 2008 100. Catov 200720. Talai Rad 2009 47. Mathews 1999 74. Denburg 2005 101. Ch<strong>and</strong>ra 198921. Vahmiko 2010 48. Miyake 2010 75. Doornbos 2009 102. Conangelo 200922. Vance 2005 49. Moses 1997 76. Freeman 2007 103. Conti 1998Nutrient not food based 50. Newson 2004 77. Furuhjelm 2009 104. Harvey 200723. Al 1995 51. Nilsen 2010 78. Geppert 2008 105. Jahanfar 200924. Algert 1985 52. O’Neil 2009 79. Haugen 2008 106. Kramer 200625. Bakker 2008 53. Philipps 1977 80. Klinger 2006 107. Liu 2009Dietary guidelines for pregnant <strong>and</strong> <strong>breastfeeding</strong> women: evidence report546
ReferencesNarrative review1. Jackson AA <strong>and</strong> Robinson SM. "Dietary guidelines for pregnancy: a reviewof current evidence." Public <strong>Health</strong> Nutr 2001: 4(2B): 625-30.2. Kind KL, Moore VM <strong>and</strong> Davies MJ. "Diet around conception <strong>and</strong> duringpregnancy--effects on fetal <strong>and</strong> neonatal outcomes." Reprod BiomedOnline 2006: 12(5): 532-41.No perinatal outcomes3. Bolton JH. "Dietary protein in pregnancy: its importance." Aust N Z JObstet Gynaecol 1968: 8(1): 20-1.4. Cuco G, Fern<strong>and</strong>ez-Ballart J, Sala J, Viladrich C, Iranzo R, Vila J <strong>and</strong> Arija V."Dietary patterns <strong>and</strong> associated lifestyles in preconception, pregnancy<strong>and</strong> postpartum." Eur J Clin Nutr 2006: 60(3): 364-71.5. Ereman RR, Lonnerdal B <strong>and</strong> Dewey KG. "Maternal sodium intake doesnot affect postpr<strong>and</strong>ial sodium concentrations in human milk." J Nutr1987: 117(6): 1154-7.6. Glueck CJ, Christopher C, Tsang RC <strong>and</strong> Mellies MJ. "Cholesterol-free diet<strong>and</strong> the physiologic hyperlipidemia of pregnancy in familialhypercholesterolemia." Metabolism 1980: 29(10): 949-55.7. Kankaanpaa P, Nurmela K, Erkkila A, Kalliomaki M, Holmberg-Marttila D,Salminen S <strong>and</strong> Isolauri E. "Polyunsaturated fatty acids in maternal diet,breast milk, <strong>and</strong> serum lipid fatty acids of infants in relation to atopy."Allergy 2001: 56(7): 633-8.8. Miyake Y, Sasaki S, Tanaka K, Ohya Y, Matsunaga I, Yoshida T, Hirota Y<strong>and</strong> Oda H. "Relationship between dietary fat <strong>and</strong> fish intake <strong>and</strong> theprevalence of atopic eczema in pregnant Japanese females: baseline datafrom the Osaka Maternal <strong>and</strong> Child <strong>Health</strong> Study." Asia Pac J Clin Nutr2008: 17(4): 612-9.9. Myers GJ, Thurston SW, Pearson AT, Davidson PW, Cox C, Shamlaye CF,Cernichiari E <strong>and</strong> Clarkson TW. "Postnatal exposure to methyl mercuryfrom fish consumption: a review <strong>and</strong> new data from the Seychelles ChildDevelopment Study." Neurotoxicology 2009: 30(3): 338-49.10. Northstone K, Emmett PM <strong>and</strong> Rogers I. "Dietary patterns in pregnancy<strong>and</strong> associations with nutrient intakes." Br J Nutr 2008: 99(2): 406-15.11. Palmer DJ, Gold MS <strong>and</strong> Makrides M. "Effect of cooked <strong>and</strong> raw eggconsumption on ovalbumin content of human milk: a r<strong>and</strong>omized,double-blind, cross-over trial." Clin Exp Allergy 2005: 35(2): 173-8.12. Petrakos G, Panagopoulos P, Koutras I, Kazis A, Panagiotakos D,Economou A, Kanellopoulos N, Salamalekis E <strong>and</strong> Zabelas A. "Acomparison of the dietary <strong>and</strong> total intake of micronutrients in a group ofpregnant Greek women with the Dietary Reference Intakes." Eur J ObstetGynecol Reprod Biol 2006: 127(2): 166-71.13. Petridou E, Katsouyanni K, Hsieh CC, Antsaklis A <strong>and</strong> Trichopoulos D."Diet, pregnancy estrogens <strong>and</strong> their possible relevance to cancer risk inthe offspring." Oncology 1992: 49(2): 127-32.14. Pinto E, Barros H <strong>and</strong> dos Santos Silva I. "Dietary intake <strong>and</strong> nutritionaladequacy prior to conception <strong>and</strong> during pregnancy: a follow-up study inthe north of Portugal." Public <strong>Health</strong> Nutr 2009: 12(7): 922-31.Excluded Studies547
15. Rogers I <strong>and</strong> Emmett P. "Diet during pregnancy in a population ofpregnant women in South West Engl<strong>and</strong>. ALSPAC Study Team. AvonLongitudinal Study of Pregnancy <strong>and</strong> Childhood." Eur J Clin Nutr 1998:52(4): 246-50.16. Scopesi F, Ciangherotti S, Lantieri PB, Risso D, Bertini I, Campone F,Pedrotti A, Bonacci W <strong>and</strong> Serra G. "Maternal dietary PUFAs intake <strong>and</strong>human milk content relationships during the first month of lactation."Clin Nutr 2001: 20(5): 393-7.17. Snook Parrott M, Bodnar LM, Simhan HN, Harger G, Markovic N <strong>and</strong>Roberts JM. "Maternal cereal consumption <strong>and</strong> adequacy ofmicronutrient intake in the periconceptional period." Public <strong>Health</strong> Nutr2009: 12(8): 1276-83.18. Specker BL. "Nutritional concerns of lactating women consumingvegetarian diets." Am J Clin Nutr 1994: 59(5 Suppl): 1182S-6S.19. Storro O, Oien T, Dotterud CK, Jenssen JA <strong>and</strong> Johnsen R. "A primaryhealth-care intervention on pre- <strong>and</strong> postnatal risk factor behavior toprevent childhood allergy. The Prevention of Allergy among Children inTrondheim (PACT) study." BMC Public <strong>Health</strong> 2010: 10: 443.20. Talai Rad N, Ritterath C, Siegmund T, Wascher C, Siebert G, Henrich W<strong>and</strong> Buhling KJ. "Longitudinal analysis of changes in energy intake <strong>and</strong>macronutrient composition during pregnancy <strong>and</strong> 6 weeks post-partum."Arch Gynecol Obstet 2009.21. Vahamiko S, Isolauri E, Pesonen U, Koskinen P, Ekblad U <strong>and</strong> Laitinen K."Dietary sucrose intake is related to serum leptin concentration inoverweight pregnant women." Eur J Nutr 2010: 49(2): 83-90.22. Vance GH, Lewis SA, Grimshaw KE, Wood PJ, Briggs RA, Thornton CA <strong>and</strong>Warner JO. "Exposure of the fetus <strong>and</strong> infant to hens' egg ovalbumin viathe placenta <strong>and</strong> breast milk in relation to maternal intake of dietaryegg." Clin Exp Allergy 2005: 35(10): 1318-26.Nutrient not food based23. Al MD, van Houwelingen AC, Badart-Smook A, Hasaart TH, Roumen FJ<strong>and</strong> Hornstra G. "The essential fatty acid status of mother <strong>and</strong> child inpregnancy-induced hypertension: a prospective longitudinal study." Am JObstet Gynecol 1995: 172(5): 1605-14.24. Algert S, Shragg P <strong>and</strong> Hollingsworth DR. "Moderate caloric restriction inobese women with gestational diabetes." Obstet Gynecol 1985: 65(4):487-91.25. Bakker R, Rifas-Shiman SL, Kleinman KP, Lipshultz SE <strong>and</strong> Gillman MW."Maternal calcium intake during pregnancy <strong>and</strong> blood pressure in theoffspring at age 3 years: a follow-up analysis of the Project Viva cohort."Am J Epidemiol 2008: 168(12): 1374-80.26. Belfort MB, Rifas-Shiman SL, Rich-Edwards JW, Kleinman KP, Oken E <strong>and</strong>Gillman MW. "Maternal iron intake <strong>and</strong> iron status during pregnancy <strong>and</strong>child blood pressure at age 3 years." Int J Epidemiol 2008: 37(2): 301-8.27. Bo S, Menato G, Lezo A, Signorile A, Bardelli C, De Michieli F, MassobrioM <strong>and</strong> Pagano G. "Dietary fat <strong>and</strong> gestational hyperglycaemia."Diabetologia 2001: 44(8): 972-8.28. Brender JD, Olive JM, Felkner M, Suarez L, Marckwardt W <strong>and</strong> HendricksKA. "Dietary nitrites <strong>and</strong> nitrates, nitrosatable drugs, <strong>and</strong> neural tubedefects." Epidemiology 2004: 15(3): 330-6.Dietary guidelines for pregnant <strong>and</strong> <strong>breastfeeding</strong> women: evidence report548
29. Brion MJ, Leary SD, Smith GD, McArdle HJ <strong>and</strong> Ness AR. "Maternalanemia, iron intake in pregnancy, <strong>and</strong> offspring blood pressure in theAvon Longitudinal Study of Parents <strong>and</strong> Children." Am J Clin Nutr 2008a:88(4): 1126-33.30. Brion MJ, Ness AR, Rogers I, Emmett P, Cribb V, Davey Smith G <strong>and</strong>Lawlor DA. "Maternal macronutrient <strong>and</strong> energy intakes in pregnancy<strong>and</strong> offspring intake at 10 y: exploring parental comparisons <strong>and</strong> prenataleffects." Am J Clin Nutr 2010: 91(3): 748-56.31. Campbell DM, Hall MH, Barker DJ, Cross J, Shiell AW <strong>and</strong> Godfrey KM."Diet in pregnancy <strong>and</strong> the offspring's blood pressure 40 years later." Br JObstet Gynaecol 1996: 103(3): 273-80.32. Chan GM, McMurry M, Westover K, Engelbert-Fenton K <strong>and</strong> Thomas MR."Effects of increased dietary calcium intake upon the calcium <strong>and</strong> bonemineral status of lactating adolescent <strong>and</strong> adult women." Am J Clin Nutr1987: 46(2): 319-23.33. Chierici R, Saccom<strong>and</strong>i D <strong>and</strong> Vigi V. "Dietary supplements for thelactating mother: influence on the trace element content of milk." ActaPaediatr Suppl 1999: 88(430): 7-13.34. Clausen T, Slott M, Solvoll K, Drevon CA, Vollset SE <strong>and</strong> Henriksen T."High intake of energy, sucrose, <strong>and</strong> polyunsaturated fatty acids isassociated with increased risk of preeclampsia." Am J Obstet Gynecol2001: 185(2): 451-8.35. Devereux G, McNeill G, Newman G, Turner S, Craig L, Martindale S,Helms P <strong>and</strong> Seaton A. "Early childhood wheezing symptoms in relationto plasma selenium in pregnant mothers <strong>and</strong> neonates." Clin Exp Allergy2007: 37(7): 1000-8.36. Devereux G, Turner SW, Craig LC, McNeill G, Martindale S, Harbour PJ,Helms PJ <strong>and</strong> Seaton A. "Low maternal vitamin E intake during pregnancyis associated with asthma in 5-year-old children." Am J Respir Crit CareMed 2006: 174(5): 499-507.37. Duggleby SL <strong>and</strong> Jackson AA. "Relationship of maternal protein turnover<strong>and</strong> lean body mass during pregnancy <strong>and</strong> birth length." Clin Sci (Lond)2001: 101(1): 65-72.38. Duggleby SL <strong>and</strong> Jackson AA. "Higher weight at birth is related todecreased maternal amino acid oxidation during pregnancy." Am J ClinNutr 2002: 76(4): 852-7.39. Erkkola M, Kaila M, Nwaru BI, Kronberg-Kippila C, Ahonen S, NevalainenJ, Veijola R, Pekkanen J, Ilonen J, Simell O, Knip M <strong>and</strong> Virtanen SM."Maternal vitamin D intake during pregnancy is inversely associated withasthma <strong>and</strong> allergic rhinitis in 5-year-old children." Clin Exp Allergy 2009:39(6): 875-82.40. Ferl<strong>and</strong> S <strong>and</strong> O'Brien HT. "Maternal dietary intake <strong>and</strong> pregnancyoutcome." J Reprod Med 2003: 48(2): 86-94.41. Gale CR, Robinson SM, Harvey NC, Javaid MK, Jiang B, Martyn CN,Godfrey KM <strong>and</strong> Cooper C. "Maternal vitamin D status during pregnancy<strong>and</strong> child outcomes." Eur J Clin Nutr 2008: 62(1): 68-77.42. Javaid MK, Crozier SR, Harvey NC, Gale CR, Dennison EM, Boucher BJ,Arden NK, Godfrey KM <strong>and</strong> Cooper C. "Maternal vitamin D status duringpregnancy <strong>and</strong> childhood bone mass at age 9 years: a longitudinal study."Lancet 2006: 367(9504): 36-43.43. Lagiou P, Tamimi RM, Mucci LA, Adami HO, Hsieh CC <strong>and</strong> Trichopoulos D."Diet during pregnancy in relation to maternal weight gain <strong>and</strong> birthsize." Eur J Clin Nutr 2004: 58(2): 231-7.Excluded Studies549
44. Litonjua AA, Rifas-Shiman SL, Ly NP, Tantisira KG, Rich-Edwards JW,Camargo CA, Jr., Weiss ST, Gillman MW <strong>and</strong> Gold DR. "Maternalantioxidant intake in pregnancy <strong>and</strong> wheezing illnesses in children at 2 yof age." Am J Clin Nutr 2006: 84(4): 903-11.45. Mahon P, Harvey N, Crozier S, Inskip H, Robinson S, Arden N,Swaminathan R, Cooper C <strong>and</strong> Godfrey K. "Low maternal vitamin D status<strong>and</strong> fetal bone development: cohort study." J Bone Miner Res 2010:25(1): 14-9.46. Major CA, Henry MJ, De Veciana M <strong>and</strong> Morgan MA. "The effects ofcarbohydrate restriction in patients with diet-controlled gestationaldiabetes." Obstet Gynecol 1998: 91(4): 600-4.47. Mathews F, Yudkin P <strong>and</strong> Neil A. "Influence of maternal nutrition onoutcome of pregnancy: prospective cohort study." BMJ 1999: 319(7206):339-43.48. Miyake Y, Sasaki S, Tanaka K <strong>and</strong> Hirota Y. "Maternal B vitamin intakeduring pregnancy <strong>and</strong> wheeze <strong>and</strong> eczema in Japanese infants aged 16-24 months: The Osaka Maternal <strong>and</strong> Child <strong>Health</strong> Study." Pediatr AllergyImmunol 2010.49. Moses RG, Sh<strong>and</strong> JL <strong>and</strong> Tapsell LC. "The recurrence of gestationaldiabetes: could dietary differences in fat intake be an explanation?"Diabetes Care 1997: 20(11): 1647-50.50. Newson RB, Shaheen SO, Henderson AJ, Emmett PM, Sherriff A <strong>and</strong>Calder PC. "Umbilical cord <strong>and</strong> maternal blood red cell fatty acids <strong>and</strong>early childhood wheezing <strong>and</strong> eczema." J Allergy Clin Immunol 2004:114(3): 531-7.51. Nilsen RM, Vollset SE, Monsen AL, Ulvik A, Haugen M, Meltzer HM,Magnus P <strong>and</strong> Uel<strong>and</strong> PM. "Infant birth size is not associated withmaternal intake <strong>and</strong> status of folate during the second trimester inNorwegian pregnant women." J Nutr 2010: 140(3): 572-9.52. O'Neil CE, Nicklas TA, Liu Y <strong>and</strong> Franklin FA. "Impact of dairy <strong>and</strong>sweetened beverage consumption on diet <strong>and</strong> weight of a multiethnicpopulation of head start mothers." J Am Diet Assoc 2009: 109(5): 874-82.53. Philipps C <strong>and</strong> Johnson NE. "The impact of quality of diet <strong>and</strong> otherfactors on birth weight of infants." Am J Clin Nutr 1977: 30(2): 215-25.54. Qiu C, Coughlin KB, Frederick IO, Sorensen TK <strong>and</strong> Williams MA. "Dietaryfiber intake in early pregnancy <strong>and</strong> risk of subsequent preeclampsia." AmJ Hypertens 2008: 21(8): 903-9.55. Rocha CMMd <strong>and</strong> Kac G. "High dietary ratio of omega-6 to omega-3polyunsaturated acids during pregnancy <strong>and</strong> prevalence of post-partumdepression." Maternal & Child Nutrition 2010: 9999(9999).56. Sabel KG, Lundqvist-Persson C, Bona E, Petzold M <strong>and</strong> Str<strong>and</strong>vik B. "Fattyacid patterns early after premature birth, simultaneously analysed inmothers' food, breast milk <strong>and</strong> serum phospholipids of mothers <strong>and</strong>infants." Lipids <strong>Health</strong> Dis 2009: 8: 20.57. Saldana TM, Siega-Riz AM <strong>and</strong> Adair LS. "Effect of macronutrient intakeon the development of glucose intolerance during pregnancy." Am J ClinNutr 2004: 79(3): 479-86.58. S<strong>and</strong>ers TA <strong>and</strong> Reddy S. "The influence of a vegetarian diet on the fattyacid composition of human milk <strong>and</strong> the essential fatty acid status of theinfant." J Pediatr 1992: 120(4 Pt 2): S71-7.Dietary guidelines for pregnant <strong>and</strong> <strong>breastfeeding</strong> women: evidence report550
59. Scholl TO, Chen X, Khoo CS <strong>and</strong> Lenders C. "The dietary glycemic indexduring pregnancy: influence on infant birth weight, fetal growth, <strong>and</strong>biomarkers of carbohydrate metabolism." Am J Epidemiol 2004: 159(5):467-74.60. Shaw GM, Carmichael SL, Laurent C <strong>and</strong> Siega-Riz AM. "Periconceptionalglycaemic load <strong>and</strong> intake of sugars <strong>and</strong> their association with neuraltube defects in offspring." Paediatr Perinat Epidemiol 2008: 22(6): 514-9.61. Shiell AW, Campbell DM, Hall MH <strong>and</strong> Barker DJ. "Diet in late pregnancy<strong>and</strong> glucose-insulin metabolism of the offspring 40 years later." BJOG2000: 107(7): 890-5.62. Skajaa K, Dorup I <strong>and</strong> S<strong>and</strong>strom BM. "Magnesium intake <strong>and</strong> status <strong>and</strong>pregnancy outcome in a Danish population." Br J Obstet Gynaecol 1991:98(9): 919-28.63. Sloan NL LS, Leighton J, Himes JH, Rush D. "The effect of prenatal dietaryprotein intake on birth weight." Nutrition Research 2001: 21: 129-39.64. Smedts HP, de Vries JH, Rakhsh<strong>and</strong>ehroo M, Wildhagen MF, Verkleij-Hagoort AC, Steegers EA <strong>and</strong> Steegers-Theunissen RP. "High maternalvitamin E intake by diet or supplements is associated with congenitalheart defects in the offspring." BJOG 2009: 116(3): 416-23.65. Smedts HP, Rakhsh<strong>and</strong>ehroo M, Verkleij-Hagoort AC, de Vries JH,Ottenkamp J, Steegers EA <strong>and</strong> Steegers-Theunissen RP. "Maternal intakeof fat, riboflavin <strong>and</strong> nicotinamide <strong>and</strong> the risk of having offspring withcongenital heart defects." Eur J Nutr 2008: 47(7): 357-65.66. Tobias JH, Steer CD, Emmett PM, Tonkin RJ, Cooper C <strong>and</strong> Ness AR. "Bonemass in childhood is related to maternal diet in pregnancy." OsteoporosInt 2005: 16(12): 1731-41.Excluded Studies67. van Eijsden M, Hornstra G, van der Wal MF, Vrijkotte TG <strong>and</strong> Bonsel GJ."Maternal n-3, n-6, <strong>and</strong> trans fatty acid profile early in pregnancy <strong>and</strong>term birth weight: a prospective cohort study." Am J Clin Nutr 2008:87(4): 887-95.68. Verkleij-Hagoort AC, de Vries JH, Ursem NT, de Jonge R, Hop WC <strong>and</strong>Steegers-Theunissen RP. "Dietary intake of B-vitamins in mothers born achild with a congenital heart defect." Eur J Nutr 2006: 45(8): 478-86.69. Wijendran V, Bendel RB, Couch SC, Philipson EH, Thomsen K, Zhang X <strong>and</strong>Lammi-Keefe CJ. "Maternal plasma phospholipid polyunsaturated fattyacids in pregnancy with <strong>and</strong> without gestational diabetes mellitus:relations with maternal factors." Am J Clin Nutr 1999: 70(1): 53-61.70. Wolff S, Legarth J, Vangsgaard K, Toubro S <strong>and</strong> Astrup A. "A r<strong>and</strong>omizedtrial of the effects of dietary counseling on gestational weight gain <strong>and</strong>glucose metabolism in obese pregnant women." Int J Obes (Lond) 2008:32(3): 495-501.71. Yazdy MM, Liu S, Mitchell AA <strong>and</strong> Werler MM. "Maternal dietaryglycemic intake <strong>and</strong> the risk of neural tube defects." Am J Epidemiol2010: 171(4): 407-14.Supplements72. Adair CD, Sanchez-Ramos L, Briones DL <strong>and</strong> Ogburn P, Jr. "The effect ofhigh dietary n-3 fatty acid supplementation on angiotensin II pressorresponse in human pregnancy." Am J Obstet Gynecol 1996: 175(3 Pt 1):688-91.73. Bergmann RL, Haschke-Becher E, Klassen-Wigger P, Bergmann KE, RichterR, Dudenhausen JW, Grathwohl D <strong>and</strong> Haschke F. "Supplementation with200 mg/day docosahexaenoic acid from mid-pregnancy through lactationimproves the docosahexaenoic acid status of mothers with a habituallylow fish intake <strong>and</strong> of their infants." Ann Nutr Metab 2008: 52(2): 157-66.551
74. Denburg JA, Hatfield HM, Cyr MM, Hayes L, Holt PG, Sehmi R, Dunstan JA<strong>and</strong> Prescott SL. "Fish oil supplementation in pregnancy modifiesneonatal progenitors at birth in infants at risk of atopy." Pediatr Res2005: 57(2): 276-81.75. Doornbos B, van Goor SA, Dijck-Brouwer DA, Schaafsma A, Korf J <strong>and</strong>Muskiet FA. "Supplementation of a low dose of DHA or DHA+AA does notprevent peripartum depressive symptoms in a small population basedsample." Prog Neuropsychopharmacol Biol Psychiatry 2009: 33(1): 49-52.76. Freeman MP <strong>and</strong> Sinha P. "Tolerability of omega-3 fatty acidsupplements in perinatal women." Prostagl<strong>and</strong>ins Leukot Essent FattyAcids 2007: 77(3-4): 203-8.77. Furuhjelm C, Warstedt K, Larsson J, Fredriksson M, Bottcher MF, Falth-Magnusson K <strong>and</strong> Duchen K. "Fish oil supplementation in pregnancy <strong>and</strong>lactation may decrease the risk of infant allergy." Acta Paediatr 2009:98(9): 1461-7.78. Geppert J, Demmelmair H, Hornstra G <strong>and</strong> Koletzko B. "Cosupplementationof healthy women with fish oil <strong>and</strong> evening primrose oilincreases plasma docosahexaenoic acid, gamma-linolenic acid <strong>and</strong>dihomo-gamma-linolenic acid levels without reducing arachidonic acidconcentrations." Br J Nutr 2008: 99(2): 360-9.79. Haugen M, Brantsaeter AL, Alex<strong>and</strong>er J <strong>and</strong> Meltzer HM. "Dietarysupplements contribute substantially to the total nutrient intake inpregnant Norwegian women." Ann Nutr Metab 2008: 52(4): 272-80.80. Klingler M, Blaschitz A, Campoy C, Cano A, Molloy AM, Scott JM, Dohr G,Demmelmair H, Koletzko B <strong>and</strong> Desoye G. "The effect ofdocosahexaenoic acid <strong>and</strong> folic acid supplementation on placentalapoptosis <strong>and</strong> proliferation." Br J Nutr 2006: 96(1): 182-90.Dietary guidelines for pregnant <strong>and</strong> <strong>breastfeeding</strong> women: evidence report81. Knudsen VK, Hansen HS, Osterdal ML, Mikkelsen TB, Mu H <strong>and</strong> Olsen SF."Fish oil in various doses or flax oil in pregnancy <strong>and</strong> timing ofspontaneous delivery: a r<strong>and</strong>omised controlled trial." BJOG 2006: 113(5):536-43.82. Krauss-Etschmann S, Shadid R, Campoy C, Hoster E, Demmelmair H,Jimenez M, Gil A, Rivero M, Veszpremi B, Decsi T <strong>and</strong> Koletzko BV."Effects of fish-oil <strong>and</strong> folate supplementation of pregnant women onmaternal <strong>and</strong> fetal plasma concentrations of docosahexaenoic acid <strong>and</strong>eicosapentaenoic acid: a European r<strong>and</strong>omized multicenter trial." Am JClin Nutr 2007: 85(5): 1392-400.83. Liu Z, Qiu L, Chen YM <strong>and</strong> Su YX. "Effect of milk <strong>and</strong> calciumsupplementation on bone density <strong>and</strong> bone turnover in pregnantChinese women: a r<strong>and</strong>omized controlled trail." Arch Gynecol Obstet2010.84. Lucia Bergmann R, Bergmann KE, Haschke-Becher E, Richter R,Dudenhausen JW, Barclay D <strong>and</strong> Haschke F. "Does maternaldocosahexaenoic acid supplementation during pregnancy <strong>and</strong> lactationlower BMI in late infancy?" J Perinat Med 2007: 35(4): 295-300.85. Luoto R, Kalliomaki M, Laitinen K <strong>and</strong> Isolauri E. "The impact of perinatalprobiotic intervention on the development of overweight <strong>and</strong> obesity:follow-up study from birth to 10 years." Int J Obes (Lond) 2010: 34(10):1531-7.86. Makrides M, Duley L <strong>and</strong> Olsen SF. "Marine oil, <strong>and</strong> other prostagl<strong>and</strong>inprecursor, supplementation for pregnancy uncomplicated by preeclampsiaor intrauterine growth restriction." Cochrane Database SystRev 2006: 3: CD003402.552
87. Olafsdottir AS, Magnusardottir AR, Thorgeirsdottir H, Hauksson A,Skuladottir GV <strong>and</strong> Steingrimsdottir L. "Relationship between dietaryintake of cod liver oil in early pregnancy <strong>and</strong> birthweight." BJOG 2005:112(4): 424-9.88. Olsen SF, Osterdal ML, Salvig JD, Mortensen LM, Rytter D, Secher NJ <strong>and</strong>Henriksen TB. "Fish oil intake compared with olive oil intake in latepregnancy <strong>and</strong> asthma in the offspring: 16 y of registry-based follow-upfrom a r<strong>and</strong>omized controlled trial." Am J Clin Nutr 2008: 88(1): 167-75.89. Picciano MF. "Pregnancy <strong>and</strong> lactation: physiological adjustments,nutritional requirements <strong>and</strong> the role of dietary supplements." J Nutr2003: 133(6): 1997S-2002S.90. Rees AM, Austin MP <strong>and</strong> Parker GB. "Omega-3 fatty acids as a treatmentfor perinatal depression: r<strong>and</strong>omized double-blind placebo-controlledtrial." Aust N Z J Psychiatry 2008: 42(3): 199-205.91. Szajewska H, Horvath A <strong>and</strong> Koletzko B (2006) "Effect of n-3 long-chainpolyunsaturated fatty acid supplementation of women with low-riskpregnancies on pregnancy outcomes <strong>and</strong> growth measures at birth: ameta-analysis of r<strong>and</strong>omized controlled trials (Structured abstract)."American Journal of Clinical Nutrition, 1337-44.92. Tofail F, Kabir I, Hamadani JD, Chowdhury F, Yesmin S, Mehreen F <strong>and</strong>Huda SN. "Supplementation of fish-oil <strong>and</strong> soy-oil during pregnancy <strong>and</strong>psychomotor development of infants." J <strong>Health</strong> Popul Nutr 2006: 24(1):48-56.Other93. Alm B, Aberg N, Erdes L, Mollborg P, Pettersson R, Norvenius SG, GoksorE <strong>and</strong> Wennergren G. "Early introduction of fish decreases the risk ofeczema in infants." Arch Dis Child 2009: 94(1): 11-5.Excluded Studies94. Arkkola T, Uusitalo U, Kronberg-Kippila C, Mannisto S, Virtanen M,Kenward MG, Veijola R, Knip M, Ovaskainen ML <strong>and</strong> Virtanen SM. "Sevendistinct dietary patterns identified among pregnant Finnish women--associations with nutrient intake <strong>and</strong> sociodemographic factors." Public<strong>Health</strong> Nutr 2008: 11(2): 176-82.95. Arshad SH, Matthews S, Gant C <strong>and</strong> Hide DW. "Effect of allergenavoidance on development of allergic disorders in infancy." Lancet 1992:339(8808): 1493-7.96. Artal R, Catanzaro RB, Gavard JA, Mostello DJ <strong>and</strong> Friganza JC. "A lifestyleintervention of weight-gain restriction: diet <strong>and</strong> exercise in obese womenwith gestational diabetes mellitus." Appl Physiol Nutr Metab 2007:32(3): 596-601.97. Atkinson JO, Mahomed K, Williams MA, Woelk GB, Mudzamiri S <strong>and</strong>Weiss NS. "Dietary risk factors for pre-eclampsia among womenattending Harare Maternity Hospital, Zimbabwe." Cent Afr J Med 1998:44(4): 86-92.98. Baker PN, Wheeler SJ, S<strong>and</strong>ers TA, Thomas JE, Hutchinson CJ, Clarke K,Berry JL, Jones RL, Seed PT <strong>and</strong> Poston L. "A prospective study ofmicronutrient status in adolescent pregnancy." Am J Clin Nutr 2009:89(4): 1114-24.99. Carmichael SL, Shaw GM, Selvin S <strong>and</strong> Schaffer DM. "Diet quality <strong>and</strong> riskof neural tube defects." Med Hypotheses 2003: 60(3): 351-5.100. Catov JM, Bodnar LM, Kip KE, Hubel C, Ness RB, Harger G <strong>and</strong>Roberts JM. "Early pregnancy lipid concentrations <strong>and</strong> spontaneouspreterm birth." Am J Obstet Gynecol 2007: 197(6): 610 e1-7.101. Ch<strong>and</strong>ra RK, Puri S <strong>and</strong> Hamed A. "Influence of maternal diet duringlactation <strong>and</strong> use of formula feeds on development of atopic eczema inhigh risk infants." BMJ 1989: 299(6693): 228-30.553
102. Colangelo LA, He K, Whooley MA, Daviglus ML <strong>and</strong> Liu K. "Higherdietary intake of long-chain omega-3 polyunsaturated fatty acids isinversely associated with depressive symptoms in women." Nutrition2009: 25(10): 1011-9.103. Conti J, Abraham S <strong>and</strong> Taylor A. "<strong>Eat</strong>ing behavior <strong>and</strong> pregnancyoutcome." J Psychosom Res 1998: 44(3-4): 465-77.104. Harvey NC, Poole JR, Javaid MK, Dennison EM, Robinson S, InskipHM, Godfrey KM, Cooper C <strong>and</strong> Sayer AA. "Parental determinants ofneonatal body composition." J Clin Endocrinol Metab 2007: 92(2): 523-6.105. Jahanfar S <strong>and</strong> Sharifah H. "Effects of restricted caffeine intake bymother on fetal, neonatal <strong>and</strong> pregnancy outcome." Cochrane DatabaseSyst Rev 2009: (2): CD006965.106. Kramer MS <strong>and</strong> Kakuma R. "Maternal dietary antigen avoidanceduring pregnancy or lactation, or both, for preventing or treating atopicdisease in the child." Cochrane Database Syst Rev 2006: 3: CD000133.107. Liu CY, Hsu YH, Wu MT, Pan PC, Ho CK, Su L, Xu X, Li Y <strong>and</strong> ChristianiDC. "Cured meat, vegetables, <strong>and</strong> bean-curd foods in relation tochildhood acute leukemia risk: a population based case-control study."BMC Cancer 2009: 9: 15.108. Lopez-Exposito I, Song Y, Jarvinen KM, Srivastava K <strong>and</strong> Li XM."Maternal peanut exposure during pregnancy <strong>and</strong> lactation reducespeanut allergy risk in offspring." J Allergy Clin Immunol 2009: 124(5):1039-46.109. Marques RC, Dorea JG, Bernardi JV, Bastos WR <strong>and</strong> Malm O."Maternal fish consumption in the nutrition transition of the AmazonBasin: growth of exclusively breastfed infants during the first 5 years."Ann Hum Biol 2008: 35(4): 363-77.Dietary guidelines for pregnant <strong>and</strong> <strong>breastfeeding</strong> women: evidence report110. Oberl<strong>and</strong>er TF, Jacobson SW, Weinberg J, Grunau RE, Molteno CD<strong>and</strong> Jacobson JL. "Prenatal alcohol exposure alters biobehavioralreactivity to pain in newborns." Alcohol Clin Exp Res 2010: 34(4): 681-92.111. Olafsdottir AS, Magnusardottir AR, Thorgeirsdottir H, Hauksson A,Skuladottir GV <strong>and</strong> Steingrimsdottir L. "Relationship between dietaryintake of cod liver oil in early pregnancy <strong>and</strong> birthweight." BJOG 2005:112(4): 424-9.112. Romon M, Nuttens MC, Vambergue A, Verier-Mine O, Biausque S,Lemaire C, Fontaine P, Salomez JL <strong>and</strong> Beuscart R. "Higher carbohydrateintake is associated with decreased incidence of newborn macrosomia inwomen with gestational diabetes." J Am Diet Assoc 2001: 101(8): 897-902.113. Ross JA. "Maternal diet <strong>and</strong> infant leukemia: a role for DNAtopoisomerase II inhibitors?" Int J Cancer Suppl 1998: 11: 26-8.114. Schulze MB, Hoffmann K, Kroke A <strong>and</strong> Boeing H. "Risk ofhypertension among women in the EPIC-Potsdam Study: comparison ofrelative risk estimates for exploratory <strong>and</strong> hypothesis-oriented dietarypatterns." Am J Epidemiol 2003: 158(4): 365-73.115. Shaw GM, Quach T, Nelson V, Carmichael SL, Schaffer DM, Selvin S<strong>and</strong> Yang W. "Neural tube defects associated with maternalpericonceptional dietary intake of simple sugars <strong>and</strong> glycemic index." AmJ Clin Nutr 2003: 78(5): 972-8.116. Wang Y, Storlien LH, Jenkins AB, Tapsell LC, Jin Y, Pan JF, Shao YF,Calvert GD, Moses RG, Shi HL <strong>and</strong> Zhu XX. "Dietary variables <strong>and</strong> glucosetolerance in pregnancy." Diabetes Care 2000: 23(4): 460-4.554
Excluded Studies555