Effects of forest harvest on biogeochemical processes in the
Effects of forest harvest on biogeochemical processes in the
Effects of forest harvest on biogeochemical processes in the

Create successful ePaper yourself
Turn your PDF publications into a flip-book with our unique Google optimized e-Paper software.
LAND, AIR AND WATER RESOURCES PAPEREFFECTS OF FOREST HARVEST ON BIOGEOCHEMICALPROCESSES IN THE CASPAR CREEK WATERSHEDFINAL REPORT TO: CALIFORNIA DEPARTMENT OF FORESTRY & FIRE PROTECTIONAGREEMENT NUMBER 8CA17039RANDY A. DAHLGRENSoils and BiogeochemistryDepartment <str<strong>on</strong>g>of</str<strong>on</strong>g> Land, Air and Water ResourcesUniversity <str<strong>on</strong>g>of</str<strong>on</strong>g> CaliforniaDavis, CA 95616December 1998
<str<strong>on</strong>g>Effects</str<strong>on</strong>g> <str<strong>on</strong>g>of</str<strong>on</strong>g> Forest Harvest <strong>on</strong> BiogeochemicalProcesses <strong>in</strong> <strong>the</strong> Caspar Creek WatershedF<strong>in</strong>al Report to: California Department <str<strong>on</strong>g>of</str<strong>on</strong>g> Forestry & Fire Protecti<strong>on</strong>Agreement Number 8CA17039Randy A. DahlgrenSoils and BiogeochemistryDepartment <str<strong>on</strong>g>of</str<strong>on</strong>g> Land, Air, and Water ResourcesOne Shields AvenueUniversity <str<strong>on</strong>g>of</str<strong>on</strong>g> CaliforniaDavis, CA 95616-8627Ph<strong>on</strong>e: 530-752-2814FAX: 530-752-1552email: radahlgren@ucdavis.eduDecember 1998
Table <str<strong>on</strong>g>of</str<strong>on</strong>g> C<strong>on</strong>tentsExecutive Summary . . . . . . . . . . . . . . . . . . . . . . . . . . . . . . . . . . . . . . . . . . . . . . 1Introducti<strong>on</strong> . . . . . . . . . . . . . . . . . . . . . . . . . . . . . . . . . . . . . . . . . . . . . . . . . . . . 4Research Objectives . . . . . . . . . . . . . . . . . . . . . . . . . . . . . . . . . . . . . . . . . . . . . . 7Materials and Methods . . . . . . . . . . . . . . . . . . . . . . . . . . . . . . . . . . . . . . . . . . . . 8Study site characteristics . . . . . . . . . . . . . . . . . . . . . . . . . . . . . . . . . . . . . . 8Solid-phase soil analyses. . . . . . . . . . . . . . . . . . . . . . . . . . . . . . . . . . . . . . 8Collecti<strong>on</strong> and analysis <str<strong>on</strong>g>of</str<strong>on</strong>g> ecosystem waterflows . . . . . . . . . . . . . . . . . . .9Nutrient analysis <strong>in</strong> biomass . . . . . . . . . . . . . . . . . . . . . . . . . . . . . . . . . . .12Statistical analyses . . . . . . . . . . . . . . . . . . . . . . . . . . . . . . . . . . . . . . . . . . 13Results and Discussi<strong>on</strong> . . . . . . . . . . . . . . . . . . . . . . . . . . . . . . . . . . . . . . . . . . .14Soils and soil properties . . . . . . . . . . . . . . . . . . . . . . . . . . . . . . . . . . . . . 14Biomass nutrient c<strong>on</strong>centrati<strong>on</strong>s and pools : . . . . . . . . . . . . . . . . . . . . . .19Precipitati<strong>on</strong>, canopy throughfall and soil soluti<strong>on</strong> chemistry . . . . . . . . 45Stream water chemistry . . . . . . . . . . . . . . . . . . . . . . . . . . . . . . . . . . . . . .55Relati<strong>on</strong>ship between solute c<strong>on</strong>centrati<strong>on</strong>s and stream discharge . . . . .69Relati<strong>on</strong>ship <str<strong>on</strong>g>of</str<strong>on</strong>g> pipeflow water chemistry to stream water chemistry . . .69Nutrient fluxes <strong>in</strong> stream water . . . . . . . . . . . . . . . . . . . . . . . . . . . . . . . . 90Cumulative effects <str<strong>on</strong>g>of</str<strong>on</strong>g> <str<strong>on</strong>g>harvest</str<strong>on</strong>g><strong>in</strong>g <strong>on</strong> stream water quality . . . . . . . . . . . 92Suspended sediments . . . . . . . . . . . . . . . . . . . . . . . . . . . . . . . . . . . . . . . 102Ecosystem nitrogen budget . . . . . . . . . . . . . . . . . . . . . . . . . . . . . . . . . . .104C<strong>on</strong>clusi<strong>on</strong>s . . . . . . . . . . . . . . . . . . . . . . . . . . . . . . . . . . . . . . . . . . . . . . . . . .106Literature cited . . . . . . . . . . . . . . . . . . . . . . . . . . . . . . . . . . . . . . . . . . . . . . . .108Appendices . . . . . . . . . . . . . . . . . . . . . . . . . . . . . . . . . . . . . . . . . . . . . . . . . . .110
<str<strong>on</strong>g>Effects</str<strong>on</strong>g> <str<strong>on</strong>g>of</str<strong>on</strong>g> Forest Harvest <strong>on</strong> BiogeochemicalProcesses<strong>in</strong> <strong>the</strong> Caspar Creek WatershedRandy A. DahlgrenEXECUTIVE SUMMARYWater quality and l<strong>on</strong>g-term susta<strong>in</strong>ability are major comp<strong>on</strong>ents addressed with<strong>in</strong> <strong>the</strong> ecosystemapproach to <str<strong>on</strong>g>forest</str<strong>on</strong>g> management. Forest <str<strong>on</strong>g>harvest</str<strong>on</strong>g> practices are <str<strong>on</strong>g>of</str<strong>on</strong>g>ten implicated as hav<strong>in</strong>g adverseimpacts <strong>on</strong> sensitive aquatic communities and <strong>on</strong> <strong>the</strong> l<strong>on</strong>g-term susta<strong>in</strong>ability <str<strong>on</strong>g>of</str<strong>on</strong>g> <str<strong>on</strong>g>forest</str<strong>on</strong>g>ecosystems. While careless <str<strong>on</strong>g>harvest</str<strong>on</strong>g> practices can certa<strong>in</strong>ly cause adverse impacts, proper <str<strong>on</strong>g>forest</str<strong>on</strong>g>management practices can m<strong>in</strong>imize or even elim<strong>in</strong>ate <strong>the</strong>se adverse effects. As <str<strong>on</strong>g>forest</str<strong>on</strong>g>ecosystems become more <strong>in</strong>tensively managed, it is imperative that management practices bedeveloped and utilized to m<strong>in</strong>imize envir<strong>on</strong>mental impacts and assure l<strong>on</strong>g-term ecosystemsusta<strong>in</strong>ability. This research exam<strong>in</strong>ed <strong>the</strong> effects <str<strong>on</strong>g>of</str<strong>on</strong>g> <str<strong>on</strong>g>forest</str<strong>on</strong>g> <str<strong>on</strong>g>harvest</str<strong>on</strong>g> and post-<str<strong>on</strong>g>harvest</str<strong>on</strong>g> managementpractices <strong>on</strong> <strong>biogeochemical</strong> <strong>processes</strong>. The biogeochemistry approach exam<strong>in</strong>es <strong>processes</strong> and<strong>in</strong>teracti<strong>on</strong>s occurr<strong>in</strong>g with<strong>in</strong> and between <strong>the</strong> atmosphere, hydrosphere, biosphere and geosphere.Results from this research provide <strong>in</strong>formati<strong>on</strong> to help us understand <strong>the</strong> complex <strong>in</strong>teracti<strong>on</strong>sthat occur <strong>in</strong> nutrient cycl<strong>in</strong>g <strong>processes</strong> at <strong>the</strong> ecosystem scale: This <strong>in</strong>formati<strong>on</strong> can be fur<strong>the</strong>rapplied to <strong>the</strong> development <str<strong>on</strong>g>of</str<strong>on</strong>g> management practices to ma<strong>in</strong>ta<strong>in</strong> l<strong>on</strong>g-term <str<strong>on</strong>g>forest</str<strong>on</strong>g> productivityand to m<strong>in</strong>imize adverse envir<strong>on</strong>mental impacts from <str<strong>on</strong>g>forest</str<strong>on</strong>g> management activities.The primary objective <str<strong>on</strong>g>of</str<strong>on</strong>g> this study was to exam<strong>in</strong>e <strong>the</strong> cumulative effects <str<strong>on</strong>g>of</str<strong>on</strong>g> <str<strong>on</strong>g>forest</str<strong>on</strong>g> managementpractices <strong>on</strong> stream water solute c<strong>on</strong>centrati<strong>on</strong>s and <strong>on</strong> nutrient cycl<strong>in</strong>g <strong>in</strong> a coastalredwood/Doug fir ecosystem. Specific objectives were to:1. Exam<strong>in</strong>e changes <strong>in</strong> stream water solute c<strong>on</strong>centrati<strong>on</strong>s and nutrient fluxes follow<strong>in</strong>g various<str<strong>on</strong>g>harvest</str<strong>on</strong>g> and post-<str<strong>on</strong>g>harvest</str<strong>on</strong>g> <str<strong>on</strong>g>forest</str<strong>on</strong>g> management practices,2. Exam<strong>in</strong>e <strong>the</strong> magnitude and spatial pattern <str<strong>on</strong>g>of</str<strong>on</strong>g> downstream impacts associated withdisturbance <strong>in</strong> headwater catchments,3. Exam<strong>in</strong>e <strong>the</strong> relati<strong>on</strong>ship, between stream water and pipeflow solute c<strong>on</strong>centrati<strong>on</strong>s and <strong>the</strong>irrelati<strong>on</strong>ship to stream discharge, and4. Compare nutrient cycl<strong>in</strong>g with<strong>in</strong> clearcut and n<strong>on</strong>-undisturbed (reference) catchments.1
Major f<strong>in</strong>d<strong>in</strong>gs <str<strong>on</strong>g>of</str<strong>on</strong>g> researchSoils. There were m<strong>in</strong>imal changes <strong>in</strong> soil properties and soil nutrient pools three years after clearcut<str<strong>on</strong>g>harvest</str<strong>on</strong>g><strong>in</strong>g. The 1-3 cm thick litter layer (Oi/Oa) was largely lost from <strong>the</strong> clearcut watershed due tomix<strong>in</strong>g and decompositi<strong>on</strong> follow<strong>in</strong>g <str<strong>on</strong>g>harvest</str<strong>on</strong>g>. This may lead to a greater erosi<strong>on</strong> potential <strong>in</strong> <strong>the</strong>short-term follow<strong>in</strong>g <str<strong>on</strong>g>harvest</str<strong>on</strong>g>. Soil pH <strong>in</strong> <strong>the</strong> A and AB horiz<strong>on</strong>s <str<strong>on</strong>g>of</str<strong>on</strong>g> <strong>the</strong> clearcut watershed was decreasedby 0.2 to 0.5 units follow<strong>in</strong>g <str<strong>on</strong>g>harvest</str<strong>on</strong>g>. This pH depressi<strong>on</strong> will have little impact <strong>on</strong> ecosystem <strong>processes</strong>.There were no significant changes to soil nutrient pools follow<strong>in</strong>g clearcutt<strong>in</strong>g. Thus, clearcutt<strong>in</strong>g had nomajor effect <strong>on</strong> soil properties and nutrient pools <strong>in</strong> <strong>the</strong> three years follow<strong>in</strong>g <str<strong>on</strong>g>harvest</str<strong>on</strong>g>.Biomass Nutrients. Rapid regrowth <str<strong>on</strong>g>of</str<strong>on</strong>g> redwood stump sprouts immobilized large c<strong>on</strong>centrati<strong>on</strong>s <str<strong>on</strong>g>of</str<strong>on</strong>g>nutrients, <strong>the</strong>reby attenuat<strong>in</strong>g <strong>the</strong>ir loss by leach<strong>in</strong>g from <strong>the</strong> watershed. A mean <str<strong>on</strong>g>of</str<strong>on</strong>g> 5020 redwoodstem/ha hav<strong>in</strong>g an above-ground biomass <str<strong>on</strong>g>of</str<strong>on</strong>g> 15 Mg/ha was measured six years follow<strong>in</strong>g <strong>the</strong> clearcut.The above-ground biomass <str<strong>on</strong>g>of</str<strong>on</strong>g> <strong>the</strong> regenerat<strong>in</strong>g redwood c<strong>on</strong>ta<strong>in</strong>ed 70, 56, 12, 80, 14 and 7 kg/ha <str<strong>on</strong>g>of</str<strong>on</strong>g> N,Ca, Mg, K, P and S, respectively. This rapid regrowth <str<strong>on</strong>g>of</str<strong>on</strong>g> redwoods also provides soil cover whichappreciably reduces <strong>the</strong> erosi<strong>on</strong> potential follow<strong>in</strong>g <str<strong>on</strong>g>harvest</str<strong>on</strong>g>. Based <strong>on</strong> foliar nutrient c<strong>on</strong>centrati<strong>on</strong>s <strong>in</strong> <strong>the</strong>redwood sprouts, <strong>the</strong>re are no apparent nutrient deficiencies limit<strong>in</strong>g <strong>the</strong>ir regrowth. Harvest<strong>in</strong>g <str<strong>on</strong>g>of</str<strong>on</strong>g> <strong>the</strong>80-year-old redwood/Doug fir <str<strong>on</strong>g>forest</str<strong>on</strong>g> resulted <strong>in</strong> removal (<strong>in</strong> wood and bark) <str<strong>on</strong>g>of</str<strong>on</strong>g> 949, 65, 405, 401 and 75kg/ha <str<strong>on</strong>g>of</str<strong>on</strong>g> N, P, K, Ca and Mg, respectively. A comparis<strong>on</strong> <str<strong>on</strong>g>of</str<strong>on</strong>g> nutrients removed <strong>in</strong> biomass with soilnutrient pools <strong>in</strong>dicates that N, P and S are <strong>the</strong> most critical nutrients with respect to l<strong>on</strong>g-term <str<strong>on</strong>g>forest</str<strong>on</strong>g>productivity. The data suggest that nitrogen fixati<strong>on</strong> by Ceanothus species may be necessary to replacenitrogen lost to <str<strong>on</strong>g>harvest</str<strong>on</strong>g><strong>in</strong>g <strong>in</strong> order to ma<strong>in</strong>ta<strong>in</strong> <strong>the</strong> l<strong>on</strong>g-term productivity and susta<strong>in</strong>ability <str<strong>on</strong>g>of</str<strong>on</strong>g> <strong>the</strong>seecosystems. We c<strong>on</strong>clude that <strong>the</strong> stump sprout<strong>in</strong>g ability <str<strong>on</strong>g>of</str<strong>on</strong>g> redwood makes <strong>the</strong>se ecosystemscomparatively resilient to <strong>the</strong> adverse effects <str<strong>on</strong>g>of</str<strong>on</strong>g> nutrient loss by leach<strong>in</strong>g and erosi<strong>on</strong>.Ecosystem Waterflows. In <strong>the</strong> period 4-6 years follow<strong>in</strong>g clearcutt<strong>in</strong>g, c<strong>on</strong>centrati<strong>on</strong>s <str<strong>on</strong>g>of</str<strong>on</strong>g> most solutes <strong>in</strong>soil soluti<strong>on</strong>s were significantly lower <strong>in</strong> <strong>the</strong> clearcut watershed. The <strong>on</strong>ly solute to show an <strong>in</strong>crease <strong>in</strong><strong>the</strong> clearcut watershed was NO 3 . This is due to <strong>in</strong>creased m<strong>in</strong>eralizati<strong>on</strong> from organic matter (due towarmer and moister soil c<strong>on</strong>diti<strong>on</strong>s) and decreased uptake due to removal <str<strong>on</strong>g>of</str<strong>on</strong>g> vegetati<strong>on</strong>. We believe <strong>the</strong>lower c<strong>on</strong>centrati<strong>on</strong>s for most solutes <strong>in</strong> <strong>the</strong> clearcut results from diluti<strong>on</strong>. Canopy <strong>in</strong>tercepti<strong>on</strong> (10-16%)and higher evapotranspirati<strong>on</strong> <strong>in</strong> <strong>the</strong> pre-<str<strong>on</strong>g>harvest</str<strong>on</strong>g>, sec<strong>on</strong>d growth <str<strong>on</strong>g>forest</str<strong>on</strong>g> substantially decrease <strong>the</strong> amount<str<strong>on</strong>g>of</str<strong>on</strong>g> water leach<strong>in</strong>g from <strong>the</strong> reference watershed. This is also reflected <strong>in</strong> <strong>the</strong> lack <str<strong>on</strong>g>of</str<strong>on</strong>g> streamflow <strong>in</strong> <strong>the</strong>reference watershed follow<strong>in</strong>g cessati<strong>on</strong> <str<strong>on</strong>g>of</str<strong>on</strong>g> ra<strong>in</strong>fall, which is <strong>in</strong> c<strong>on</strong>trast to <strong>the</strong> clearcut watershed that haswater flow throughout <strong>the</strong> dry summer m<strong>on</strong>ths.Stream water solute c<strong>on</strong>centrati<strong>on</strong>s were similar between <strong>the</strong> reference and clearcut watersheds, exceptfor NO 3 and SO 4 which had higher c<strong>on</strong>centrati<strong>on</strong>s <strong>in</strong> <strong>the</strong> clearcut watershed. Elevated c<strong>on</strong>centrati<strong>on</strong>s <str<strong>on</strong>g>of</str<strong>on</strong>g>NO 3 and SO 4 are most likely due to <strong>in</strong>creased leach<strong>in</strong>g from <strong>the</strong> soil as m<strong>in</strong>eralizati<strong>on</strong> is enhanced anduptake by vegetati<strong>on</strong> is greatly reduced. With <strong>the</strong> excepti<strong>on</strong> <str<strong>on</strong>g>of</str<strong>on</strong>g> NO 3 , all solute c<strong>on</strong>centrati<strong>on</strong>s display alarge decrease due to diluti<strong>on</strong> dur<strong>in</strong>g high-discharge, storm events.2
In c<strong>on</strong>trast, NO 3 c<strong>on</strong>centrati<strong>on</strong>s <strong>in</strong>crease at peak discharge, probably reflect<strong>in</strong>g a change <strong>in</strong> <strong>the</strong>hydrologic flowpath and source <str<strong>on</strong>g>of</str<strong>on</strong>g> <strong>the</strong> water. We speculate that subsurface lateral flow above clay rich,argillic horiz<strong>on</strong>s and macropore flow through root channels deliver NO 3 -enriched waters from <strong>the</strong> uppersoil horiz<strong>on</strong>s dur<strong>in</strong>g storm events. Much <str<strong>on</strong>g>of</str<strong>on</strong>g> this water may reach <strong>the</strong> stream channel as pipeflow. Solutec<strong>on</strong>centrati<strong>on</strong>s <strong>in</strong> pipeflow can expla<strong>in</strong> many <str<strong>on</strong>g>of</str<strong>on</strong>g> <strong>the</strong> changes <strong>in</strong> stream water solute c<strong>on</strong>centrati<strong>on</strong>s dur<strong>in</strong>gstorm events. The elevated c<strong>on</strong>centrati<strong>on</strong> <str<strong>on</strong>g>of</str<strong>on</strong>g> NO 3 <strong>in</strong> stream water from <strong>the</strong> clearcut watersheds wasrapidly decreased <strong>in</strong> <strong>the</strong> higher-order downstream segments. This decrease <strong>in</strong> NO 3 c<strong>on</strong>centrati<strong>on</strong> isbelieved to result from a diluti<strong>on</strong> effect, although <strong>in</strong>-stream immobilizati<strong>on</strong> and denitriflcati<strong>on</strong> <strong>in</strong> <strong>the</strong>riparian z<strong>on</strong>e may also have an effect. Thus, <strong>the</strong> impacts <str<strong>on</strong>g>of</str<strong>on</strong>g> elevated NO 3 c<strong>on</strong>centrati<strong>on</strong>s <strong>on</strong> <strong>the</strong> aquaticcommunity are primarily restricted to <strong>the</strong> stream segment dra<strong>in</strong><strong>in</strong>g <strong>the</strong> clearcut watershed with littleeffect <strong>on</strong> <strong>the</strong> higher-order downstream segments.Nutrient fluxes from <strong>the</strong> clearcut watershed were generally 2 to 2.5 times greater than from <strong>the</strong> adjacentreference watershed. S<strong>in</strong>ce stream water solute c<strong>on</strong>centrati<strong>on</strong>s were similar <strong>in</strong> both watersheds, <strong>the</strong><strong>in</strong>creased fluxes must be primarily due to an <strong>in</strong>creased water flux from <strong>the</strong> clearcut watershed. Whileelevated NO 3 c<strong>on</strong>centrati<strong>on</strong>s <strong>in</strong> stream water from <strong>the</strong> clearcut watershed might suggest a large loss <str<strong>on</strong>g>of</str<strong>on</strong>g>nitrogen due to clearcutt<strong>in</strong>g, c<strong>on</strong>versi<strong>on</strong> to a flux (kg/ha/yr) <strong>in</strong>dicates maximum loss <str<strong>on</strong>g>of</str<strong>on</strong>g> <strong>on</strong>ly 1.85kg/ha/yr, and fluxes decreased to 0.4µm) <strong>in</strong>dicat<strong>in</strong>g amixture <str<strong>on</strong>g>of</str<strong>on</strong>g> <strong>in</strong>organic and organic comp<strong>on</strong>ents. Suspended sediments <strong>in</strong> <strong>the</strong> reference watershed had amuch larger organic matter comp<strong>on</strong>ent compared to <strong>the</strong> clearcut watershed. C<strong>on</strong>centrati<strong>on</strong>s <str<strong>on</strong>g>of</str<strong>on</strong>g> N (1.2 -6.5 g/kg) and P (1.1 - 1.5 g/kg) are relatively high <strong>in</strong> <strong>the</strong> suspended sediments <strong>in</strong>dicat<strong>in</strong>g that enhancederosi<strong>on</strong> could lead to appreciable nutrient loss follow<strong>in</strong>g <str<strong>on</strong>g>forest</str<strong>on</strong>g> <str<strong>on</strong>g>harvest</str<strong>on</strong>g>. An estimate <str<strong>on</strong>g>of</str<strong>on</strong>g> nitrogen loss bysuspended sediment transport <strong>in</strong>dicates losses <strong>on</strong> <strong>the</strong> order <str<strong>on</strong>g>of</str<strong>on</strong>g> 1 to 2 kg N/ha/yr <strong>in</strong> both reference andclearcut watersheds. The greater fluxes <str<strong>on</strong>g>of</str<strong>on</strong>g> suspended sediment <strong>in</strong> <strong>the</strong> clearcut watershed were <str<strong>on</strong>g>of</str<strong>on</strong>g>fset by<strong>the</strong> lower nitrogen c<strong>on</strong>centrati<strong>on</strong> <str<strong>on</strong>g>of</str<strong>on</strong>g> <strong>the</strong> suspended sediment <strong>in</strong> <strong>the</strong> clearcut watershed.AcknowledgmentsWe acknowledge <strong>the</strong> valuable guidance and logistical support from E. Keppeler, R. Ziemer, J. Munn,R.J. Zasoski and N. Henry. Field and laboratory assistance by Z. Yu, J. Holloway, D. Bast<strong>on</strong>, R.Northup, and <strong>the</strong> entire field staff <str<strong>on</strong>g>of</str<strong>on</strong>g> <strong>the</strong> USDA Forest Service/Jacks<strong>on</strong> State Forest Caspar CreekResearch Team is greatly appreciated. I also thank E. Keppeler and J. Munn for <strong>the</strong>ir valuable comments<strong>on</strong> a previous draft <str<strong>on</strong>g>of</str<strong>on</strong>g> this report.3
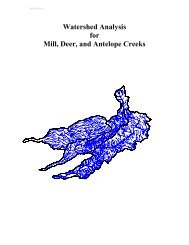
Introducti<strong>on</strong>This study exam<strong>in</strong>es <strong>the</strong> cumulative effects <str<strong>on</strong>g>of</str<strong>on</strong>g> timber <str<strong>on</strong>g>harvest</str<strong>on</strong>g> and post-<str<strong>on</strong>g>harvest</str<strong>on</strong>g> practices <strong>on</strong> streamwater solute c<strong>on</strong>centrati<strong>on</strong>s and nutrient cycl<strong>in</strong>g <strong>processes</strong> <strong>in</strong> a coastal redwood/Doug fir ecosystem<strong>in</strong> nor<strong>the</strong>rn California. Timber <str<strong>on</strong>g>harvest</str<strong>on</strong>g> practices are <str<strong>on</strong>g>of</str<strong>on</strong>g>ten implicated as hav<strong>in</strong>g adverseenvir<strong>on</strong>mental impacts <strong>on</strong> sensitive aquatic communities and <strong>on</strong> <strong>the</strong> l<strong>on</strong>g-term susta<strong>in</strong>ability <str<strong>on</strong>g>of</str<strong>on</strong>g><str<strong>on</strong>g>forest</str<strong>on</strong>g> ecosystems. Previous studies exam<strong>in</strong><strong>in</strong>g <strong>the</strong> impacts <str<strong>on</strong>g>of</str<strong>on</strong>g> timber <str<strong>on</strong>g>harvest</str<strong>on</strong>g> <str<strong>on</strong>g>of</str<strong>on</strong>g>ten providec<strong>on</strong>flict<strong>in</strong>g results suggest<strong>in</strong>g that site c<strong>on</strong>diti<strong>on</strong>s, specific <str<strong>on</strong>g>harvest</str<strong>on</strong>g><strong>in</strong>g techniques, and post-<str<strong>on</strong>g>harvest</str<strong>on</strong>g>practices have a str<strong>on</strong>g effect <strong>on</strong> <strong>the</strong> result<strong>in</strong>g impacts. Thus, <str<strong>on</strong>g>harvest</str<strong>on</strong>g> impacts are highly site specificand can not be directly extrapolated from o<strong>the</strong>r sites and/or ecosystems. While <strong>the</strong> effects <str<strong>on</strong>g>of</str<strong>on</strong>g> <str<strong>on</strong>g>forest</str<strong>on</strong>g><str<strong>on</strong>g>harvest</str<strong>on</strong>g> practices <strong>on</strong> streamflow and sediment generati<strong>on</strong> have been <strong>in</strong>tensively studied (e.g., Rice etal., 1979; Ziemer, 1981; Keppeler and Ziemer, 1990; Thomas, 1990; Wright et al., 1990), <strong>the</strong>impacts <str<strong>on</strong>g>of</str<strong>on</strong>g> <str<strong>on</strong>g>harvest</str<strong>on</strong>g><strong>in</strong>g practices <strong>on</strong> stream water solute c<strong>on</strong>centrati<strong>on</strong>s and nutrient cycl<strong>in</strong>g <strong>processes</strong>have not been fully evaluated for <strong>the</strong> coastal regi<strong>on</strong> <str<strong>on</strong>g>of</str<strong>on</strong>g> nor<strong>the</strong>rn California. This type <str<strong>on</strong>g>of</str<strong>on</strong>g> research isbecom<strong>in</strong>g <strong>in</strong>creas<strong>in</strong>gly important as <str<strong>on</strong>g>forest</str<strong>on</strong>g>ed watersheds become more <strong>in</strong>tensively managed andattempts are made to m<strong>in</strong>imize adverse management impacts.Stream water solute c<strong>on</strong>centrati<strong>on</strong>s and ecosystem-scale nutrient cycl<strong>in</strong>g are regulated by complex<strong>in</strong>teracti<strong>on</strong>s occurr<strong>in</strong>g with<strong>in</strong> and between <strong>the</strong> atmosphere, hydrosphere, biosphere and geosphere(Fig. 1). To ga<strong>in</strong> <strong>in</strong>sights <strong>in</strong>to <strong>the</strong> important <strong>processes</strong> regulat<strong>in</strong>g stream water solute c<strong>on</strong>centrati<strong>on</strong>sand ecosystem nutrient cycl<strong>in</strong>g, an <strong>in</strong>tegrated study <strong>in</strong>corporat<strong>in</strong>g both watershed-scale andplot-scale <strong>in</strong>vestigati<strong>on</strong>s was performed.Watershed-scale studies are based <strong>on</strong> <strong>in</strong>put-output budgets for nutrients and water (Fig. 2).Watershed manipulati<strong>on</strong>s are a powerful approach for study<strong>in</strong>g <strong>the</strong> effects <str<strong>on</strong>g>of</str<strong>on</strong>g> <str<strong>on</strong>g>forest</str<strong>on</strong>g> managementpractices (e.g., clearcutt<strong>in</strong>g, burn<strong>in</strong>g) <strong>on</strong> nutrient cycl<strong>in</strong>g <strong>processes</strong>. Manipulati<strong>on</strong> studies comm<strong>on</strong>lyutilize <strong>the</strong> paired watershed approach <strong>in</strong> which two watersheds with similar characteristics areemployed. One watershed <str<strong>on</strong>g>of</str<strong>on</strong>g> <strong>the</strong> pair is ma<strong>in</strong>ta<strong>in</strong>ed <strong>in</strong> its orig<strong>in</strong>al state to serve as a reference while<strong>the</strong> o<strong>the</strong>r watershed undergoes a particular experimental treatment. Studies <strong>on</strong> <strong>the</strong> watershed scale<strong>in</strong>tegrate all <strong>processes</strong> occurr<strong>in</strong>g with<strong>in</strong> <strong>the</strong> boundaries <str<strong>on</strong>g>of</str<strong>on</strong>g> a given watershed. This may <strong>in</strong>cludeseveral plant species, several soil types, c<strong>on</strong>trast<strong>in</strong>g microclimates, and complex hydrologic flowpaths. Watershed studies provide ecosystem level data that <strong>in</strong>corporate all ecosystem <strong>processes</strong>, butdo not dist<strong>in</strong>guish between <strong>in</strong>dividual <strong>processes</strong> or <strong>the</strong>ir relative importance.To ga<strong>in</strong> a greater understand<strong>in</strong>g <str<strong>on</strong>g>of</str<strong>on</strong>g> how specific <strong>processes</strong> affect stream water solute c<strong>on</strong>centrati<strong>on</strong>sand nutrient cycl<strong>in</strong>g, a plot-scale <strong>in</strong>vestigati<strong>on</strong> was <strong>in</strong>tegrated with<strong>in</strong> <strong>the</strong> paired watersheds <str<strong>on</strong>g>of</str<strong>on</strong>g> thisstudy. Plot-scale studies employ a comb<strong>in</strong>ati<strong>on</strong> <str<strong>on</strong>g>of</str<strong>on</strong>g> biomass, litter, and solid-phase soil sampl<strong>in</strong>g todeterm<strong>in</strong>e nutrient pools, and collecti<strong>on</strong> and quantificati<strong>on</strong> <str<strong>on</strong>g>of</str<strong>on</strong>g> ecosystem waterflows (e.g.,precipitati<strong>on</strong>, canopy throughfall, soil soluti<strong>on</strong>s, and stream water) to determ<strong>in</strong>e nutrient fluxes.These measurements were <strong>in</strong>tegrated with hydrologic <strong>in</strong>vestigati<strong>on</strong>s by <strong>the</strong> USDA ForestService/Jacks<strong>on</strong> State Forest, Caspar Creek Research Team, lead by R. Ziemer and E. Keppeler,which exam<strong>in</strong>ed storm run<str<strong>on</strong>g>of</str<strong>on</strong>g>f characteristics, suspended sediment c<strong>on</strong>centrati<strong>on</strong>s, and hillslopehydrology <strong>in</strong>clud<strong>in</strong>g macropore flow. These <strong>in</strong>tegrated plot-scale studies provide a much greater4
Fig. 2. Watershed-scale <strong>in</strong>vestigati<strong>on</strong>s are based <strong>on</strong> <strong>in</strong>put/output budgets for both water and nutrients. Thedifference between <strong>the</strong> volume <str<strong>on</strong>g>of</str<strong>on</strong>g> water <strong>in</strong>put as precipitati<strong>on</strong> and lost as stream water can- be assignedto evapotranspirati<strong>on</strong> if <strong>the</strong> bedrock is relatively impermeable. The difference between nutrient <strong>in</strong>putsand outputs is a measure <str<strong>on</strong>g>of</str<strong>on</strong>g> <strong>the</strong> net nutrient balance associated with all pools and fluxes with<strong>in</strong> <strong>the</strong> watershed.
understand<strong>in</strong>g <str<strong>on</strong>g>of</str<strong>on</strong>g> <strong>the</strong> importance <str<strong>on</strong>g>of</str<strong>on</strong>g> <strong>in</strong>dividual <strong>processes</strong>. The trade-<str<strong>on</strong>g>of</str<strong>on</strong>g>f for greater understand<strong>in</strong>g <str<strong>on</strong>g>of</str<strong>on</strong>g><strong>in</strong>dividual <strong>processes</strong> is that plot-scale studies are much more labor <strong>in</strong>tensive and costly than simplymeasur<strong>in</strong>g <strong>in</strong>puts and outputs from a watershed. Because a s<strong>in</strong>gle watershed may c<strong>on</strong>ta<strong>in</strong> severalc<strong>on</strong>trast<strong>in</strong>g stands, soils, hydrologic flowpaths, and dist<strong>in</strong>ct microclimates, it is not always possible topredict watershed scale resp<strong>on</strong>se from plot-scale <strong>in</strong>vestigati<strong>on</strong>s. Thus, <strong>the</strong> most powerful approach is tocouple watershed-scale <strong>in</strong>vestigati<strong>on</strong>s that <strong>in</strong>tegrate all <strong>processes</strong> and all spatial variability with<strong>in</strong> awatershed with plot-scale studies to ascerta<strong>in</strong> details <strong>on</strong> <strong>the</strong> importance <str<strong>on</strong>g>of</str<strong>on</strong>g> <strong>in</strong>dividual <strong>processes</strong>.Research ObjectivesThe primary objective <str<strong>on</strong>g>of</str<strong>on</strong>g> this study was to exam<strong>in</strong>e <strong>the</strong> cumulative effects <str<strong>on</strong>g>of</str<strong>on</strong>g> <str<strong>on</strong>g>forest</str<strong>on</strong>g> managementpractices <strong>on</strong> stream water solute c<strong>on</strong>centrati<strong>on</strong>s and nutrient cycl<strong>in</strong>g <strong>in</strong> a coastal redwood/Doug firecosystem. Specific objectives were to:1. Exam<strong>in</strong>e changes <strong>in</strong> stream water solute c<strong>on</strong>centrati<strong>on</strong>s and nutrient fluxes follow<strong>in</strong>g various <str<strong>on</strong>g>harvest</str<strong>on</strong>g>and post-<str<strong>on</strong>g>harvest</str<strong>on</strong>g> <str<strong>on</strong>g>forest</str<strong>on</strong>g> management practices,2. Exam<strong>in</strong>e <strong>the</strong> magnitude and spatial pattern <str<strong>on</strong>g>of</str<strong>on</strong>g> downstream impacts associated with disturbance <strong>in</strong>headwater catchments,3. Exam<strong>in</strong>e <strong>the</strong> relati<strong>on</strong>ship between stream water and pipeflow solute c<strong>on</strong>centrati<strong>on</strong>s and <strong>the</strong>irrelati<strong>on</strong>ship to stream discharge, and4. Compare nutrient cycl<strong>in</strong>g with<strong>in</strong> clearcut and n<strong>on</strong>-disturbed (reference) catchments.Five subwatersheds with<strong>in</strong> <strong>the</strong> North Fork <str<strong>on</strong>g>of</str<strong>on</strong>g> Caspar Creek experimental watershed were subjected totypical timber <str<strong>on</strong>g>harvest</str<strong>on</strong>g> practices, <strong>in</strong>clud<strong>in</strong>g various comb<strong>in</strong>ati<strong>on</strong>s <str<strong>on</strong>g>of</str<strong>on</strong>g> fell<strong>in</strong>g, yard<strong>in</strong>g, road c<strong>on</strong>structi<strong>on</strong>,broadcast burn<strong>in</strong>g, and herbicide treatment. Three additi<strong>on</strong>al subwatersheds rema<strong>in</strong>ed undisturbed andwere m<strong>on</strong>itored as c<strong>on</strong>trols. To <strong>in</strong>vestigate <strong>the</strong> effects <str<strong>on</strong>g>of</str<strong>on</strong>g> <strong>the</strong>se practices <strong>on</strong> water quality, stream watersamples were collected from headwater catchments <str<strong>on</strong>g>of</str<strong>on</strong>g> treated and reference watersheds, and from variouslocati<strong>on</strong>s downstream from <strong>the</strong> disturbances to determ<strong>in</strong>e how far <strong>the</strong> impacts <str<strong>on</strong>g>of</str<strong>on</strong>g> <strong>the</strong>se practices persisted.In additi<strong>on</strong>, a detailed (i.e., plot-scale) nutrient cycl<strong>in</strong>g study was performed <strong>in</strong> a clearcut and <strong>in</strong> areference watershed to ga<strong>in</strong> <strong>in</strong>sights <strong>in</strong>to changes <strong>in</strong> nutrient cycl<strong>in</strong>g follow<strong>in</strong>g <str<strong>on</strong>g>forest</str<strong>on</strong>g> <str<strong>on</strong>g>harvest</str<strong>on</strong>g>.7
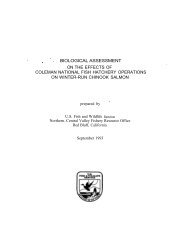
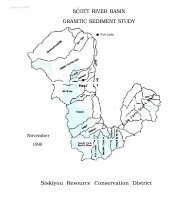
Materials and MethodsStudy Site CharacteristicsHeadwater catchments <strong>in</strong> <strong>the</strong> North Fork <str<strong>on</strong>g>of</str<strong>on</strong>g> Caspar Creek were selected for this study (Fig. 3). Thewatersheds are located <strong>in</strong> <strong>the</strong> Jacks<strong>on</strong> Dem<strong>on</strong>strati<strong>on</strong> State Forest, 11 km sou<strong>the</strong>ast <str<strong>on</strong>g>of</str<strong>on</strong>g> Fort Bragg,California, and approximately 7 km from <strong>the</strong> Pacific Ocean. The North Fork <str<strong>on</strong>g>of</str<strong>on</strong>g> Caspar Creek has adra<strong>in</strong>age area <str<strong>on</strong>g>of</str<strong>on</strong>g> 483 ha and ranges <strong>in</strong> elevati<strong>on</strong> from 37 to 320 m. The topography <str<strong>on</strong>g>of</str<strong>on</strong>g> <strong>the</strong> North Forkwatersheds ranges from broad, rounded ridge tops to steep <strong>in</strong>ner gorges. Slopes with<strong>in</strong> <strong>the</strong> watershed are:35% <str<strong>on</strong>g>of</str<strong>on</strong>g> <strong>the</strong> area with slopes 70% (Wright et al., 1990).The climate is Mediterranean, hav<strong>in</strong>g dry summers with coastal fog. Summer temperatures are mild,rang<strong>in</strong>g from 10 to 25° C. W<strong>in</strong>ters are mild and wet, with temperatures rang<strong>in</strong>g between 5 and 14° C.The average annual ra<strong>in</strong>fall is about 1200 mm with no appreciable snowfall (Ziemer, 1981). Soils aredom<strong>in</strong>ated by Alfisols and Ultisols formed <strong>in</strong> residuum derived predom<strong>in</strong>ately from sandst<strong>on</strong>e andwea<strong>the</strong>red coarse-gra<strong>in</strong>ed shale <str<strong>on</strong>g>of</str<strong>on</strong>g> Cretaceous Age. The soils are well dra<strong>in</strong>ed and have relatively highsaturated and unsaturated hydraulic c<strong>on</strong>ductivities (Wosika, 1981).The North Fork <str<strong>on</strong>g>of</str<strong>on</strong>g> Caspar Creek was orig<strong>in</strong>ally clearcut logged and burned <strong>in</strong> approximately 1910 (Tilleyand Rice, 1977). Current vegetati<strong>on</strong> is dom<strong>in</strong>ated by sec<strong>on</strong>d-growth redwood (Sequoia sempervirens (D.D<strong>on</strong>) Endl.) and Douglas fir (Pseudotsuga menziesii (Mirb.) Franco) with some associated westernhemlock (Tsuga heterophylla (Raf.) Sarg.) and grand fir (Abies grandis (Dougl.) L<strong>in</strong>dl.). The mean standdensity based <strong>on</strong> cruise data from subwatersheds JOH, KJE and LAN was 321 stems/ha hav<strong>in</strong>g a meanDBH <str<strong>on</strong>g>of</str<strong>on</strong>g> 61 cm. The distributi<strong>on</strong> between species was: redwood 207 stems/ha, 56 cm DBH; Doug fir 86stems/ha, 66 cm DBH; and grand fir/western hemlock 27 stems/ha, 56 cm DBH. Precut timber volume at<strong>the</strong> <strong>on</strong>set <str<strong>on</strong>g>of</str<strong>on</strong>g> this study was estimated at about 700 m3/ha (Krammes and Burns, 1973).Solid-Phase Soil AnalysesSites for six soil pits were randomly selected with<strong>in</strong> a clearcut (KJE) and reference (MUN) watershedus<strong>in</strong>g a quadrant map <str<strong>on</strong>g>of</str<strong>on</strong>g> <strong>the</strong> study area. Soil pits (1.5 x 0.5 x 1-1.2 m; L x W x D) were excavated byhand to a depth corresp<strong>on</strong>d<strong>in</strong>g to <strong>the</strong> limit <str<strong>on</strong>g>of</str<strong>on</strong>g> <strong>the</strong> major root<strong>in</strong>g z<strong>on</strong>e (BC horiz<strong>on</strong>; 100-120 cm). Thesaprolitic parent material below this depth was unc<strong>on</strong>solidated, and a few roots were observed topenetrate several meters <strong>in</strong>to this material as revealed <strong>in</strong> nearby roadcuts. Each ped<strong>on</strong> was described andbulk soil samples and clods for bulk density measurements were collected from across <strong>the</strong> entire 1.5-mpit face for each morphological horiz<strong>on</strong>. All soil samples were collected dur<strong>in</strong>g <strong>the</strong> m<strong>on</strong>th <str<strong>on</strong>g>of</str<strong>on</strong>g> September(1992) when <strong>the</strong> soil was at its driest moisture c<strong>on</strong>tent <str<strong>on</strong>g>of</str<strong>on</strong>g> <strong>the</strong> year.Soil samples were air-dried, gently crushed, and passed through a 2-mm sieve; roots pass<strong>in</strong>g through <strong>the</strong>sieve were removed with a forceps. The air-dried,
The clay-size fracti<strong>on</strong> (
us<strong>in</strong>g a vacuum pump and flask. Zero-tensi<strong>on</strong> lysimeters were placed <strong>in</strong> duplicate at <strong>the</strong> 20 and 40 cmdepths al<strong>on</strong>g with a s<strong>in</strong>gle collector at <strong>the</strong> 60 cm depth. Lysimeters were <strong>in</strong>stalled by tunnel<strong>in</strong>g frombelow and from <strong>the</strong> side <str<strong>on</strong>g>of</str<strong>on</strong>g> <strong>the</strong> excavated soil pit to <strong>the</strong> desired depth. This <strong>in</strong>stallati<strong>on</strong> techniquem<strong>in</strong>imizes disturbance to <strong>the</strong> soil fabric and root<strong>in</strong>g system overly<strong>in</strong>g <strong>the</strong> lysimeter. Lysimeters were<strong>in</strong>stalled <strong>on</strong>e year before soil soluti<strong>on</strong>s were collected for chemical analysis. This equilibrati<strong>on</strong> periodm<strong>in</strong>imizes <strong>the</strong> potential for artifacts due to disturbance from lysimeter <strong>in</strong>stallati<strong>on</strong>.Stream water samples were collected from a series <str<strong>on</strong>g>of</str<strong>on</strong>g> subwatersheds and from selected sites al<strong>on</strong>g <strong>the</strong>ma<strong>in</strong> channel <str<strong>on</strong>g>of</str<strong>on</strong>g> <strong>the</strong> North Fork <str<strong>on</strong>g>of</str<strong>on</strong>g> Caspar Creek. Samples from <strong>in</strong>dividual headwater catchments wereexam<strong>in</strong>ed to evaluate <strong>the</strong> effects <str<strong>on</strong>g>of</str<strong>on</strong>g> specific timber <str<strong>on</strong>g>harvest</str<strong>on</strong>g> practices <strong>on</strong> stream water solutec<strong>on</strong>centrati<strong>on</strong>s. Solute c<strong>on</strong>centrati<strong>on</strong>s from subwatersheds receiv<strong>in</strong>g various comb<strong>in</strong>ati<strong>on</strong>s <str<strong>on</strong>g>of</str<strong>on</strong>g> <str<strong>on</strong>g>forest</str<strong>on</strong>g><str<strong>on</strong>g>harvest</str<strong>on</strong>g> practices (e.g., clearcutt<strong>in</strong>g, burn<strong>in</strong>g, and herbicide treatment) were compared to referencewatersheds hav<strong>in</strong>g no disturbance. Figure 3 shows <strong>the</strong> sampl<strong>in</strong>g locati<strong>on</strong>s with<strong>in</strong> <strong>the</strong> North Fork CasparCreek watershed and <strong>the</strong> completi<strong>on</strong> date <str<strong>on</strong>g>of</str<strong>on</strong>g> fell<strong>in</strong>g activities with<strong>in</strong> each watershed. For more detailed<strong>in</strong>formati<strong>on</strong> <strong>on</strong> <str<strong>on</strong>g>harvest</str<strong>on</strong>g> and post-<str<strong>on</strong>g>harvest</str<strong>on</strong>g> management activities, c<strong>on</strong>tact <strong>the</strong> USDA Forest Service,Redwood Sciences Laboratory, Arcata, CA. Additi<strong>on</strong>ally, samples were collected al<strong>on</strong>g <strong>the</strong> ma<strong>in</strong> channel<str<strong>on</strong>g>of</str<strong>on</strong>g> <strong>the</strong> North Fork to determ<strong>in</strong>e <strong>the</strong> magnitude and persistence <str<strong>on</strong>g>of</str<strong>on</strong>g> <strong>the</strong> cumulative effects <str<strong>on</strong>g>of</str<strong>on</strong>g> timber <str<strong>on</strong>g>harvest</str<strong>on</strong>g>practices with<strong>in</strong> <strong>the</strong> larger watershed.Grab samples were collected biweekly (ra<strong>in</strong>y seas<strong>on</strong>) to m<strong>on</strong>thly (n<strong>on</strong>-ra<strong>in</strong>y seas<strong>on</strong>) from eightsubwatersheds (BAN,CAR,EAG,GIB,HEN,IVE,KJE,MUN) and five sites (ARF,DOL,FLY,JOH, LAN)al<strong>on</strong>g higher order segments <str<strong>on</strong>g>of</str<strong>on</strong>g> <strong>the</strong> North Fork (Fig. 3). All stream water samples were collected atstream gaug<strong>in</strong>g stati<strong>on</strong>s and stream stage (discharge) was recorded for each water sample. Watersampl<strong>in</strong>g commenced <strong>in</strong> March 1991 and c<strong>on</strong>t<strong>in</strong>ued through June 1996. In additi<strong>on</strong> to <strong>the</strong> regular grabsample protocol, automatic pump<strong>in</strong>g samplers were used to <strong>in</strong>tensively collect water samples dur<strong>in</strong>gstorm events from selected headwater catchments. In particular, <strong>the</strong> clearcut catchment (KJE) and <strong>the</strong>reference catchment (MUN) were sampled <strong>in</strong>tensively dur<strong>in</strong>g storm events for five water years(1991-96). The autosamplers were programmed to collect storm samples us<strong>in</strong>g a stage-activated,even-<strong>in</strong>terval timed sampl<strong>in</strong>g (1 hour <strong>in</strong>terval). Pipeflow was also collected <strong>in</strong> <strong>the</strong> clearcut (KJE) andreference (MUN) subwatersheds (see Fig. 3) us<strong>in</strong>g a stage-activated, even-<strong>in</strong>terval timed sampl<strong>in</strong>gprotocol for <strong>the</strong> 1991-96 water years. All stream water and pipeflow samples were collected by <strong>the</strong>U.S.D.A. Forest Service/Jacks<strong>on</strong> State Forest, Caspar Creek Research Team.Prior to chemical analyses, all ecosystem waterflows were filtered through a 0.2 µm membrane filter.The pH was measured potentiometrically us<strong>in</strong>g a comb<strong>in</strong>ati<strong>on</strong> electrode. Cati<strong>on</strong>s (Ca, Mg, K, Na, NH 4 )and ani<strong>on</strong>s (Cl, NO 3 , ortho-PO 4 , SO 4 ) were determ<strong>in</strong>ed by i<strong>on</strong> chromatography (Di<strong>on</strong>ex). Dissolvedorganic and <strong>in</strong>organic carb<strong>on</strong> were determ<strong>in</strong>ed <strong>on</strong> selected samples us<strong>in</strong>g a Dohrmann carb<strong>on</strong> analyzer.Alkal<strong>in</strong>ity was determ<strong>in</strong>ed <strong>on</strong> selected samples by titrati<strong>on</strong> to an endpo<strong>in</strong>t <str<strong>on</strong>g>of</str<strong>on</strong>g> pH=4.5 to estimatec<strong>on</strong>centrati<strong>on</strong>s <str<strong>on</strong>g>of</str<strong>on</strong>g> bicarb<strong>on</strong>ate. The dissolved <strong>in</strong>organic carb<strong>on</strong> c<strong>on</strong>centrati<strong>on</strong>s and HCO 3 c<strong>on</strong>centrati<strong>on</strong>sdeterm<strong>in</strong>ed from alkal<strong>in</strong>ity titrati<strong>on</strong>s verified that we could acceptably estimate HCO 3 c<strong>on</strong>centrati<strong>on</strong>s as<strong>the</strong> difference between <strong>the</strong> sum <str<strong>on</strong>g>of</str<strong>on</strong>g> cati<strong>on</strong> and ani<strong>on</strong> charge (
Fig. 3. Watershed map <strong>in</strong>dicat<strong>in</strong>g <strong>the</strong> locati<strong>on</strong> <str<strong>on</strong>g>of</str<strong>on</strong>g> <strong>the</strong> <strong>in</strong>dividual subwatersheds with<strong>in</strong> <strong>the</strong> North Fork <str<strong>on</strong>g>of</str<strong>on</strong>g> Caspar Creek.Letters <strong>in</strong>dicate locati<strong>on</strong> <str<strong>on</strong>g>of</str<strong>on</strong>g> stream water sampl<strong>in</strong>g sites, triangles <strong>the</strong> locati<strong>on</strong> <str<strong>on</strong>g>of</str<strong>on</strong>g> pip<strong>in</strong>g water samples, and years<strong>in</strong>dicate <strong>the</strong> year <strong>in</strong> which <strong>the</strong> fell<strong>in</strong>g activity was completed <strong>in</strong> <strong>the</strong> clearcut watersheds. For more detailed<strong>in</strong>formati<strong>on</strong> <strong>on</strong> <str<strong>on</strong>g>harvest</str<strong>on</strong>g> and post <str<strong>on</strong>g>harvest</str<strong>on</strong>g> management activities, c<strong>on</strong>tact <strong>the</strong> USDA Forest Service, RedwoodSciences Laboratory, Arcata, CA.
Dur<strong>in</strong>g <strong>the</strong> 1994-95 water year, water samples from three storm events were bulked to provideapproximately a 20 L sample for isolati<strong>on</strong> <str<strong>on</strong>g>of</str<strong>on</strong>g> <strong>the</strong> suspended fracti<strong>on</strong> (>0.4 µm). Sufficientsuspended sediment was obta<strong>in</strong>ed for complete chemical analysis from all three events <strong>in</strong> <strong>the</strong> clearcutwatershed (KJE), but from <strong>on</strong>ly <strong>on</strong>e storm event (January) <strong>in</strong> <strong>the</strong> reference catchment (MUN). Carb<strong>on</strong> andnitrogen c<strong>on</strong>centrati<strong>on</strong>s were determ<strong>in</strong>ed by dry combusti<strong>on</strong> us<strong>in</strong>g a C/N analyzer. C<strong>on</strong>centrati<strong>on</strong>s <str<strong>on</strong>g>of</str<strong>on</strong>g> Al,Si, Fe, Ca, Mg, K, Na and P were quantified as follows: fusi<strong>on</strong> with lithium metaborate, dissoluti<strong>on</strong> <strong>in</strong>nitric acid, and quantificati<strong>on</strong> us<strong>in</strong>g ICP spectroscopy.Nutrient Analysis <strong>in</strong> BiomassNutrient pools <strong>in</strong> biomass were determ<strong>in</strong>ed for <strong>the</strong> regenerat<strong>in</strong>g redwood spouts <strong>in</strong> <strong>the</strong> clearcut watershed(KJE) and for <strong>the</strong> redwood/Doug fir stand <strong>in</strong> <strong>the</strong> reference watershed (MUN). A total <str<strong>on</strong>g>of</str<strong>on</strong>g> ten randomlyselected 10 x 10 m plots were selected with<strong>in</strong> <strong>the</strong> clearcut watershed to quantify total above-groundbiomass producti<strong>on</strong> six years follow<strong>in</strong>g <str<strong>on</strong>g>harvest</str<strong>on</strong>g> (November, 1995). All shoots and <strong>the</strong>ir diameters wererecorded with<strong>in</strong> each plot for <strong>the</strong> stump sprout<strong>in</strong>g redwoods. To develop allometric relati<strong>on</strong>ships for <strong>the</strong>redwood sprouts, 10 <strong>in</strong>dividual stems spann<strong>in</strong>g <strong>the</strong> range <str<strong>on</strong>g>of</str<strong>on</strong>g> diameter classes (0.76-7.6 cm) weredestructively sampled. Biomass from each sample was divided <strong>in</strong>to eight categories: foliage, twigs (100 mm).The weight <str<strong>on</strong>g>of</str<strong>on</strong>g> each category was recorded follow<strong>in</strong>g dry<strong>in</strong>g at 70° C. Biomass from <strong>the</strong> <strong>in</strong>dividualcategories <str<strong>on</strong>g>of</str<strong>on</strong>g> each tree was <strong>the</strong>n ground (
Nutrient pools <strong>in</strong> biomass <str<strong>on</strong>g>of</str<strong>on</strong>g> <strong>the</strong> sec<strong>on</strong>d growth redwood/Doug fir <str<strong>on</strong>g>forest</str<strong>on</strong>g> were determ<strong>in</strong>ed from standdensity, allometric relati<strong>on</strong>ships obta<strong>in</strong>ed from Gholz et al. (1979), and nutrient c<strong>on</strong>centrati<strong>on</strong>s determ<strong>in</strong>edfrom <strong>the</strong> preced<strong>in</strong>g analyses. Root biomass <strong>in</strong> <strong>the</strong> reference watershed and follow<strong>in</strong>g <str<strong>on</strong>g>harvest</str<strong>on</strong>g> <strong>in</strong> <strong>the</strong>clearcut watershed was estimated from <strong>the</strong> data <str<strong>on</strong>g>of</str<strong>on</strong>g> Ziemer and Lewis (unpublished data) obta<strong>in</strong>ed from acomparable <str<strong>on</strong>g>forest</str<strong>on</strong>g> stand <strong>in</strong> nor<strong>the</strong>rn California. Due to several assumpti<strong>on</strong>s that are required for <strong>the</strong>secalculati<strong>on</strong>s, it must be stressed that <strong>the</strong> biomass nutrient pools are our best estimates ra<strong>the</strong>r than aprecisely measured value.Statistical AnalysesDifferences between solid-phase soil properties, soil soluti<strong>on</strong> solute c<strong>on</strong>centrati<strong>on</strong>s and biomass nutrientc<strong>on</strong>centrati<strong>on</strong>s were tested us<strong>in</strong>g appropriate statistical methods (e.g., t-test, ANOVA). All statisticalanalyses were performed us<strong>in</strong>g SYSTAT for W<strong>in</strong>dows, Versi<strong>on</strong> 5 (SYSTAT Inc., Evanst<strong>on</strong>, IL).13
Soils and Soil PropertiesResults and Discussi<strong>on</strong>The USDA-SCS soil mapp<strong>in</strong>g <str<strong>on</strong>g>of</str<strong>on</strong>g> <strong>the</strong> watersheds <strong>in</strong> <strong>the</strong> North Fork <str<strong>on</strong>g>of</str<strong>on</strong>g> Caspar Creek showed <strong>the</strong> follow<strong>in</strong>gsoil distributi<strong>on</strong>:Upper slopes <str<strong>on</strong>g>of</str<strong>on</strong>g> <strong>the</strong> watershed (about 49% <str<strong>on</strong>g>of</str<strong>on</strong>g> watershed)Vandamme loam: f<strong>in</strong>e, mixed, isomesic Typic HaplohumultsLower and middle slopes <str<strong>on</strong>g>of</str<strong>on</strong>g> <strong>the</strong> watershed (about 48% <str<strong>on</strong>g>of</str<strong>on</strong>g> watershed)Irmulco loam: f<strong>in</strong>e-loamy, mixed, isomesic Ultic HapludalfsTramway loam: f<strong>in</strong>e-loamy, mixed, isomesic Ultic HapludalfsAdjacent to stream channel <strong>in</strong> lower porti<strong>on</strong>s <str<strong>on</strong>g>of</str<strong>on</strong>g> <strong>the</strong> watershed (about 3% <str<strong>on</strong>g>of</str<strong>on</strong>g> watershed)Dehaven-Hotel loam complex: loamy-skeletal, mixed, isomesic Mollic/Ultic HapludalfsA typical ped<strong>on</strong> descripti<strong>on</strong> for a soil <strong>in</strong> <strong>the</strong> reference watershed (MUN) is shown <strong>in</strong> Table 1. These soilsc<strong>on</strong>ta<strong>in</strong> a thick argillic horiz<strong>on</strong> (Btl, Bt2, Bt3) that c<strong>on</strong>ta<strong>in</strong>s 30 - 45% clay. Roots were c<strong>on</strong>centrated <strong>in</strong> <strong>the</strong>A and AB horiz<strong>on</strong>s with a lower abundance <str<strong>on</strong>g>of</str<strong>on</strong>g> roots <strong>in</strong> <strong>the</strong> dense argillic horiz<strong>on</strong>. Road cut exposuresshowed that some roots extend to a depth <str<strong>on</strong>g>of</str<strong>on</strong>g> several meters <strong>in</strong>to <strong>the</strong> saprolitic parent material. Bulkdensity for <strong>the</strong> Oi/Oa, A, AB, and Bt horiz<strong>on</strong>s were 0.19, 0.75, 1.32 and 1.57 g/cm 3 , respectively. Claym<strong>in</strong>eralogy was dom<strong>in</strong>ated by randomly <strong>in</strong>terstratified chlorite-vermiculite <strong>in</strong> <strong>the</strong> A, AB and Btl horiz<strong>on</strong>sand randomly <strong>in</strong>terstratified chlorite-vermiculite/smectite at depth. The abundance <str<strong>on</strong>g>of</str<strong>on</strong>g> smectite <strong>in</strong> <strong>the</strong>randomly <strong>in</strong>terstratified complex <strong>in</strong>creased with <strong>in</strong>creas<strong>in</strong>g depth. A m<strong>in</strong>or comp<strong>on</strong>ent <str<strong>on</strong>g>of</str<strong>on</strong>g> kaol<strong>in</strong>ite wasfound throughout <strong>the</strong> entire soil pr<str<strong>on</strong>g>of</str<strong>on</strong>g>ile.A comparis<strong>on</strong> <str<strong>on</strong>g>of</str<strong>on</strong>g> selected solid-phase soil properties between <strong>the</strong> reference and clearcut watersheds isshown <strong>in</strong> Table 2. The soils <strong>in</strong> <strong>the</strong> reference watershed were moderately acid (pH range 5.4 to 6.3) anddisplayed a general pH decrease with <strong>in</strong>creas<strong>in</strong>g depth (Table 2). Organic C and total N c<strong>on</strong>centrati<strong>on</strong>swere highest <strong>in</strong> <strong>the</strong> A and AB horiz<strong>on</strong>s and decreased with depth. The C/N molar ratio <strong>in</strong> <strong>the</strong> Oi/Oa litterlayer was 91 compared to a range <str<strong>on</strong>g>of</str<strong>on</strong>g> 26 to 14 <strong>in</strong> <strong>the</strong> m<strong>in</strong>eral soil horiz<strong>on</strong>s. Acid digestible Pc<strong>on</strong>centrati<strong>on</strong>s showed a similar distributi<strong>on</strong> to that <str<strong>on</strong>g>of</str<strong>on</strong>g> organic C and total N while available Pc<strong>on</strong>centrati<strong>on</strong>s showed a large decrease <strong>in</strong> <strong>the</strong> B horiz<strong>on</strong>s ( Mg » K ~ Na.The effects <str<strong>on</strong>g>of</str<strong>on</strong>g> clearcutt<strong>in</strong>g <strong>on</strong> solid-phase soil properties are most readily observed <strong>in</strong> <strong>the</strong> upper soilhoriz<strong>on</strong>s where biological <strong>in</strong>fluences and physical disturbance factors are greatest. There were <strong>on</strong>ly a fewstatistically significant differences (p
Table 1. Soil pr<str<strong>on</strong>g>of</str<strong>on</strong>g>ile descripti<strong>on</strong> for a representative soil pr<str<strong>on</strong>g>of</str<strong>on</strong>g>ile <strong>in</strong> <strong>the</strong> clearcut (KJE) and reference (MUN) catchments <str<strong>on</strong>g>of</str<strong>on</strong>g> <strong>the</strong>North Fork, Caspar Creek watershed:Horiz<strong>on</strong> Depth Color Texture Structure C<strong>on</strong>sistence Roots Boundary >2 mm(cm) (moist) (%)Oi 3-O †A 0-12 10YR 3/3 1 2 f-m sbk sh fr so po 3vf, 3f, 2m, lco cw
Fig. 4.Nutrient pools <strong>in</strong> soils <str<strong>on</strong>g>of</str<strong>on</strong>g> <strong>the</strong> reference (MUN) and clearcut (KJE) watersheds three years follow<strong>in</strong>gcompleti<strong>on</strong> <str<strong>on</strong>g>of</str<strong>on</strong>g> <strong>the</strong> <str<strong>on</strong>g>harvest</str<strong>on</strong>g>. The <strong>in</strong>dividual segments <str<strong>on</strong>g>of</str<strong>on</strong>g> each bar <strong>in</strong>dicate <strong>the</strong> amount c<strong>on</strong>ta<strong>in</strong>ed with<strong>in</strong><strong>in</strong>dividual soil horiz<strong>on</strong>s. Error bar <strong>in</strong>dicates SEM and <strong>the</strong> <strong>on</strong>ly significant difference (p
Biomass Nutrient C<strong>on</strong>centrati<strong>on</strong>s and PoolsClearcut watershed (KJE)The number and size distributi<strong>on</strong> <str<strong>on</strong>g>of</str<strong>on</strong>g> stump sprout<strong>in</strong>g redwoods <strong>in</strong> watershed ME six years after <str<strong>on</strong>g>harvest</str<strong>on</strong>g>was determ<strong>in</strong>ed from an <strong>in</strong>ventory <str<strong>on</strong>g>of</str<strong>on</strong>g> ten 10 x 10 m plots. This <strong>in</strong>ventory showed 5020±1970 stem/ha(mean±std. dev.; range = 2600 - 8300 stems/ha) hav<strong>in</strong>g a DBH <str<strong>on</strong>g>of</str<strong>on</strong>g> 2.59±0.71 cm (mean±std. dev.). TheDBH <str<strong>on</strong>g>of</str<strong>on</strong>g> <strong>the</strong> stump sprouts ranged from 0.98)and significant (p < 0.001) relati<strong>on</strong>ships were <strong>in</strong>dicated for foliage, twigs ( 1 cm) branch diameter classes were regressed <strong>in</strong>dividually ra<strong>the</strong>r than as a summati<strong>on</strong> <str<strong>on</strong>g>of</str<strong>on</strong>g> allbranch diameter classes (Table 2b).Nutrient c<strong>on</strong>centrati<strong>on</strong>s for foliage, twigs (
100Diameter Distributi<strong>on</strong>2080166012408204Fig. 5.00 2 4 6 8Diameter Class (cm)The diameter distributi<strong>on</strong> at breast-height for redwood stump sprouts six yearsfollow<strong>in</strong>g <str<strong>on</strong>g>harvest</str<strong>on</strong>g> (1989 > 1995) <strong>in</strong> <strong>the</strong> clearcut watershed (KJE).200
Allometric Relati<strong>on</strong>s for Redwood SproutsDiameter at Breast Height (cm)Fig. 6.Allometric relati<strong>on</strong>ships for various biomass comp<strong>on</strong>ents <str<strong>on</strong>g>of</str<strong>on</strong>g> redwood stump sproutsas a functi<strong>on</strong> <str<strong>on</strong>g>of</str<strong>on</strong>g> stem diameter at breast height.21
Table 2b. Allometric relati<strong>on</strong>ships based <strong>on</strong> diameter at breast height for foliage, twigs, andvarious size branch comp<strong>on</strong>ents.Equati<strong>on</strong> (units = grams and cm) r 2 Significancelog (Foliage) = 1.690 log (D) + 2.050 0.99 p
Table 3. Nutrient c<strong>on</strong>centrati<strong>on</strong>s <strong>in</strong> six-year-old, stump sprout<strong>in</strong>g redwoods grow<strong>in</strong>g <strong>in</strong> <strong>the</strong> clearcut watershed (KJE).Element/Foliage Twigs Branch Branch Branch Branch BranchComp<strong>on</strong>ent (n= 7) (n=7) (0.2-0.5 cm) (0.5-1 cm) (1-2 cm) (2-5 cm) (5-10 cm)(n=7) (n=7) (n=7) (n=5) (n=3)Branch(10-20 cm)(n=1)N 11600a 7630b 3310c 2340cd 2190cd 1220d 1100d 400C 521400a 513760ab 501810ab 498100b 509370ab 496660b 499730ab 466000Ca 7253a 5381b 3647c 2805c 2509cd 1613d 1614cd 1205Mg 1788a 1330a 581b 390b 456b 276b 319b 353K 9444ab 12413a 6007bc 3170c 3936c 2006c 1512c 1248P 1958a 1992a 733b 412b 541b 301b 216b 209S 942a 676b 341c 250c 298c 201c 185c 232Fe 95.1ab 53.7ab 18.9a 25.3a 61.2ab 107ab 173b 344Zn 31.4a 33.3a 17.2b 12.3b 10.4bc 9.0c 8.1c 6.9Mn 385a 185b 88.9c 56.2c 57.9c 44.5c 38.6c 17.4Cu 3.0a 1.4a 2.7a 2.0a 3.0a 2.3a 2.9a 3.2Al 105ab 87.6ab 24.9a 19.0a 60.7ab 101ab 196b 269C/N 53.5a 79.9ab 190b 259c 282c 507d 554d 1431C/P 725a 699a 1961ab 3352bc 3179b 5397cd 6092d 5757C/S 1505a 2068a 4106ab 5458bc 5157bc 7636c 7579c 5367Values <strong>in</strong> each column followed by <strong>the</strong> same lower case letter are not significantly different when compar<strong>in</strong>g a given nutrient between biomass comp<strong>on</strong>ent.
Table 4. Nutrient pools <strong>in</strong> <strong>the</strong> above-ground comp<strong>on</strong>ents and live roots <str<strong>on</strong>g>of</str<strong>on</strong>g> redwood stump sprouts<strong>in</strong> <strong>the</strong> clearcut watershed (KJE) six years after <str<strong>on</strong>g>harvest</str<strong>on</strong>g>. Live root biomass was estimatedfrom <strong>the</strong> unpublished data <str<strong>on</strong>g>of</str<strong>on</strong>g> Ziemer and Lewis.Element Foliage Twigs(
Table 5. Estimated live-root biomass <strong>in</strong> <strong>the</strong> sec<strong>on</strong>d growth reference watershed(MUN) and <strong>the</strong> clearcut watershed (KJE) six years follow<strong>in</strong>g <str<strong>on</strong>g>harvest</str<strong>on</strong>g>. Rootbiomass was estimated from <strong>the</strong> unpublished data <str<strong>on</strong>g>of</str<strong>on</strong>g> Ziemer and Lewis.Reference watershed Clearcut watershedRoot size-class Redwood Doug fir Redwood Doug fir------------------------------ kg/ha ------------------------------10 mm 43275 28191 3116 -Total roots 49913 33210 5503 -25
iomass follow<strong>in</strong>g a clearcut which is largely <strong>the</strong> result <str<strong>on</strong>g>of</str<strong>on</strong>g> <strong>the</strong> rapid regrowth associated with regenerati<strong>on</strong>from stump sprout<strong>in</strong>g versus establishment from seed. The large <strong>in</strong>tact root<strong>in</strong>g system can acquire anabundance <str<strong>on</strong>g>of</str<strong>on</strong>g> nutrients and water to support regrowth. Also important <strong>in</strong> this rapid regrowth is <strong>the</strong>immobilizati<strong>on</strong> <str<strong>on</strong>g>of</str<strong>on</strong>g> potentially mobile nutrients <strong>in</strong>to <strong>the</strong> above-ground biomass follow<strong>in</strong>g clearcutt<strong>in</strong>g. Theaccumulati<strong>on</strong> <str<strong>on</strong>g>of</str<strong>on</strong>g> 70, 56, 12, 80, 14 and 7 kg/ha <str<strong>on</strong>g>of</str<strong>on</strong>g> N, Ca, Mg, K, P and S, respectively, attenuates leach<strong>in</strong>g<str<strong>on</strong>g>of</str<strong>on</strong>g> <strong>the</strong>se nutrients follow<strong>in</strong>g <strong>the</strong> clearcut (Table 4). The warmer and moister soil c<strong>on</strong>diti<strong>on</strong>s comb<strong>in</strong>ed withhigher organic matter c<strong>on</strong>centrati<strong>on</strong>s from logg<strong>in</strong>g slash follow<strong>in</strong>g clearcutt<strong>in</strong>g can result <strong>in</strong> higherdecompositi<strong>on</strong>, m<strong>in</strong>eralizati<strong>on</strong> and leach<strong>in</strong>g. Thus, rapid immobilizati<strong>on</strong> <str<strong>on</strong>g>of</str<strong>on</strong>g> nutrients by <strong>the</strong> aggrad<strong>in</strong>gredwood <str<strong>on</strong>g>forest</str<strong>on</strong>g> will have a str<strong>on</strong>g <strong>in</strong>fluence <strong>on</strong> nutrient dynamics and leach<strong>in</strong>g follow<strong>in</strong>g <str<strong>on</strong>g>harvest</str<strong>on</strong>g> <strong>in</strong> <strong>the</strong>seecosystems.Reference watershed (MUN)The goal <str<strong>on</strong>g>of</str<strong>on</strong>g> most <str<strong>on</strong>g>forest</str<strong>on</strong>g> management plans is to assure l<strong>on</strong>g-term susta<strong>in</strong>ability <str<strong>on</strong>g>of</str<strong>on</strong>g> <str<strong>on</strong>g>forest</str<strong>on</strong>g> ecosystems.From a nutrient cycl<strong>in</strong>g perspective, l<strong>on</strong>g-term susta<strong>in</strong>ability can <strong>on</strong>ly be ma<strong>in</strong>ta<strong>in</strong>ed if nutrient <strong>in</strong>puts (e.g., atmospheric depositi<strong>on</strong>, nitrogen fixati<strong>on</strong> and rock wea<strong>the</strong>r<strong>in</strong>g) equal or exceed nutrient losses (e.g.,removal by <str<strong>on</strong>g>harvest</str<strong>on</strong>g>, stream export <str<strong>on</strong>g>of</str<strong>on</strong>g> suspended sediment and dissolved nutrients). To address <strong>the</strong>susta<strong>in</strong>ability issue, nutrient pools with<strong>in</strong> <strong>the</strong> reference watershed were determ<strong>in</strong>ed and used to estimate<strong>the</strong> amount <str<strong>on</strong>g>of</str<strong>on</strong>g> nutrients lost by biomass removal dur<strong>in</strong>g <str<strong>on</strong>g>harvest</str<strong>on</strong>g>.Nutrient c<strong>on</strong>centrati<strong>on</strong>s <strong>in</strong> <strong>the</strong> foliage, twigs, branches, wood, bark and roots were determ<strong>in</strong>ed for <strong>the</strong> twodom<strong>in</strong>ant tree species (redwood and Doug fir) <strong>in</strong> <strong>the</strong> reference watershed (MUN) (Tables 6-10). Abetween species comparis<strong>on</strong> <str<strong>on</strong>g>of</str<strong>on</strong>g> nutrient c<strong>on</strong>centrati<strong>on</strong>s <strong>in</strong> foliage shows generally higher c<strong>on</strong>centrati<strong>on</strong>s<str<strong>on</strong>g>of</str<strong>on</strong>g> N, P, S, K and Fe <strong>in</strong> Doug fir while redwood had higher c<strong>on</strong>centrati<strong>on</strong>s <str<strong>on</strong>g>of</str<strong>on</strong>g> Ca and Mg (Table 6).Foliage bear<strong>in</strong>g twigs for redwood and Doug fir had similar c<strong>on</strong>centrati<strong>on</strong>s for most nutrients; however,c<strong>on</strong>centrati<strong>on</strong>s <str<strong>on</strong>g>of</str<strong>on</strong>g> Ca and Mg were <strong>on</strong>ce aga<strong>in</strong> higher <strong>in</strong> <strong>the</strong> redwood (Table 7). Nutrient c<strong>on</strong>centrati<strong>on</strong>s <strong>in</strong><strong>the</strong> bark and wood were similar between species, while <strong>the</strong> Doug fir had higher c<strong>on</strong>centrati<strong>on</strong>s <str<strong>on</strong>g>of</str<strong>on</strong>g> P, Kand Mn <strong>in</strong> most size classes <str<strong>on</strong>g>of</str<strong>on</strong>g> <strong>the</strong> branches (Tables 8 & 9). There were no c<strong>on</strong>sistent differences <strong>in</strong>nutrient c<strong>on</strong>centrati<strong>on</strong>s between species for any <str<strong>on</strong>g>of</str<strong>on</strong>g> <strong>the</strong> root size classes (Table 10). These nutrient datasuggest that Doug fir will have a somewhat higher demand for N, P and K compared to redwood grow<strong>in</strong>gwith<strong>in</strong> <strong>the</strong> same stand.Ecosystem level nutrient pools were calculated us<strong>in</strong>g allometric relati<strong>on</strong>ships from <strong>the</strong> literature, data <strong>on</strong>root biomass from Ziemer and Lewis (unpublished; Table 5), <strong>the</strong> stand density data for redwood andDoug fir from <strong>the</strong> adjacent watershed (KJE; redwood = 201 stems/ha; Doug fir = 97 stems/ha), and <strong>the</strong>nutrient c<strong>on</strong>centrati<strong>on</strong>s discussed above. Because no allometric relati<strong>on</strong>ships were available forabove-ground biomass <strong>in</strong> redwood, we used <strong>the</strong> Doug fir allometric relati<strong>on</strong>ships for <strong>the</strong> redwood. Thisextrapolati<strong>on</strong> will <strong>in</strong>troduce a potential error <strong>in</strong>to <strong>the</strong> estimates for <strong>the</strong> redwood above-ground nutrientestimates; however, this error will most likely be <strong>on</strong> <strong>the</strong> order <str<strong>on</strong>g>of</str<strong>on</strong>g>
Table 6. Mean (±SEM) element c<strong>on</strong>centrati<strong>on</strong>s and C/N ratio <str<strong>on</strong>g>of</str<strong>on</strong>g> foliage by age class for <strong>the</strong> sec<strong>on</strong>d-growth Doug fir and redwood stand <strong>in</strong> watershedMUN.AgeSpecies Class C N C/N P S K Ca Mg Fe Zn Mn Cu--------- g kg –1 ------------ mg kg –1 ratio ----------------------------------------------------------------- mg kg -1 -----------------------------------------------Doug fir Current 528aA 11.2aA 56aA 1640aA 860aA 9120aA 302OaA 1320aA 83.6aA 12.2aA 334aA 3.4aA(5) (0.5) (2) (90) (50) (470) (170) (90) (6.9) (1.2) (4.6) (0.5)1 Year 531aA 13.7bA 46aA 2180bA 1110bA 8140abA 5610bA 1490aA 85.5aA 12.7aA 530abA 2.4aA(3) (0.4) (1) (150) (60) (530) (270) (130) (4.0) (1.2) (83) (0.3)2 Year 527aA 13.1bA 50aA 2350bA 1130bA 7500bcA 7230cA 1470aA 99.2aA 13.7aA 615abA 2.6aA(4) (0.7) (5) (170) (60) (480) (340) (150) (6.7) (1.1) (93) (0.4)3 Year 521aA 12.4abA 50aA 2160bA 1200bA 6610cA 9240dA 1460aA 83.7aA 15.8aA 655bA 3.laA(4) (0.6) (3) (150) (80) (480) (680) (180) (7.3) (1.4) (104) (0.5)Redwood Current 521aA 12.OaA 51aA 1630aA 1040aB 7530aA 7350aB 2240aB 57.5aB 19.8aB 397aA 2.3aB(3) (0.4) (2) (70) (40) (670) (300) (100) (2.9) (1.2) (46) (0.2)1 Year 515aB 11.ObB 55aB 1300bB 970aA 5470bB 8980bB 2150aB 72.3aA 12.9bA 425aA 2.laA(3) (0.3) (1) (110) (40) (550) (280) (170) (9.6) (1.0) (47) (0.2)2 Year 522aA 10.2bB 60bA 1190bB '. 930aB 5240bB 9850bcB 2140aB 69.1aB 12.6bA 332abB 1.7aA(3) (0.3) (2) (110) (70) (430) (360) (190) (9.4) (1.3) (56) (0.3)3 Year 525aA 9.OcB 69cB 1050bB 950aB 4710bB 10450cA 2170aB 63.9aB 14.ObA 204bB 1.9aB(2) (0.3) (3) (110) (40) (360) (310) (200) (5.1) (1.6) (38) (0.2)Values <strong>in</strong> each column followed by <strong>the</strong> same lower case letter are not significantly different when compar<strong>in</strong>g between age classes with<strong>in</strong> each species (ANOVA with Fisher's leastsignificant difference test, p
Table 7. Mean (±SEM) element c<strong>on</strong>centrati<strong>on</strong>s and C/N ratio <str<strong>on</strong>g>of</str<strong>on</strong>g> foliage bear<strong>in</strong>g twigs by age class for <strong>the</strong> sec<strong>on</strong>d-growth Doug fir andredwood stand <strong>in</strong> watershed MUN.AgeSpecies Class C N C/N P S K Ca Mg Fe Zn Mn Cug kg -1 mg kg -1 ratio ------------------------------------------------------------------- mg kg -1 -------------------------------------------------------------Doug fir Current 569aA 8730aA 73aA 1370aA 680aA 6220aA 4430aA 1600aA 58.1aA 34.laA 248aA 8.OaA(9) (450) (3) (80) (40) (200) (240) (70) (6.7) (3.4) (10) (1.0)1 Year 528aA 7180bA 87bA 1090bA 650aA 5520bA 5870bA 900bA 80.2aA 40.9aA 260aA 7.2aA(5) (210) (2) (80) (20) (240) (240) (50) (5.4) (3.2) (12) (1.1)2 Year 522aA 7190bA 89bA 940bcA 610abA 4810cA 6490bA 800bcA 83.laA 39.8aA 251aA 7.OaA(4) (600) (5) (60) (30) (230) (260) (40) (11.2) (2.7) (13) (1.2)3 Year 515aA 5510cA 111cA 820cA 560bA 4300cA 6540bA 740cA 90.5aA 36.8aA 227aA 6.7aA(3) (210) (4) (50) (20) (280) (310) (40) (16.7) (2.2) (14) (1.1)Redwood Current 511aB 9150aA 66aA 1910aB 860aB 9170aB 7370aB 1890aA 70.OaA 19.9aB 256aA 2.2aB(3) (290) (2) (80) (40) (770) (280) (120) (11.5) (1.2) (31) (0.2)1 Year 515aB 6750bA 90bA 1430bB 720bA 6390bA 8250bB 1690aB 85.laA 19.7aB 233abA 1.8aB(4) (190) (2) (70) (30) (560) (250) (160) (12.6) (1.8) (32) (0.3)2 Year 508aB 5280cB 115cB 890cA 570cA 4890cA 8550bB 1310bB 62.4abA 20.9aB 157bcB 2.3aB(3) (220) (5) (70) (20) (320) (240) (110) (6.6) (1.9) (25) (0.7)3 Year 508aA 3740dB 164dB 600dB 490dB 3570cB 8520bB 1070bB 42.1bB 20.1aB 111cB 2.OaB(2) (210) (7) (30) (10) (120) (290) (130) (3.6) (2.3) (17) (0.3)Values <strong>in</strong> each column followed by <strong>the</strong> same lower case letter are not significantly different when compar<strong>in</strong>g between age classes with<strong>in</strong> each species (ANOVA with Fisher's leastsignificant difference test, p
Table 8. Mean (±SEM) element c<strong>on</strong>centrati<strong>on</strong>s and C/N ratio <str<strong>on</strong>g>of</str<strong>on</strong>g> branches by size class for <strong>the</strong> sec<strong>on</strong>d-growth Doug fir and redwood stand <strong>in</strong>watershed MUN.DiameterSpecies Class C N C/N P S K Ca Mg Fe Zn Mn Cu--mm-- g kg -1 mg kg -1 ratio -------------------------------------------------------------------- mg kg -1 -------------------------------------------------------------Doug fir 50 519bA 1100dA 571dA 100dA 120dA 900cA 1710dA, 240dA 78.1bA 10.6dA 72dA 2.5bA(4) (60) (31) (10) (10) (16.0) (110) (20) (14.5) (1.0) (5) (0.6)Redwood
Table 9. Mean (±SEM) element c<strong>on</strong>centrati<strong>on</strong>s and C/N ratio <str<strong>on</strong>g>of</str<strong>on</strong>g> wood and bark for <strong>the</strong> sec<strong>on</strong>d growth Doug fir and redwood stand <strong>in</strong>watershed MUN.Comp-Species <strong>on</strong>ent C N C/N P S K Ca Mg Fe Zn Mn Cu-g kg -1 - -mg kg -1 - --ratio-- -------------------------------------------------------------------mg kg -1 -------------------------------------------------------------Doug fir Wood 495aA 630aA 918aA 50aA 60aA 310aA 180aA 10aA 204aA 1.7aA 8.9aA 0.5aA(4) (60) (93) (10) (
Table 10. Mean (±SEM) element c<strong>on</strong>centrati<strong>on</strong>s and C/N ratio <str<strong>on</strong>g>of</str<strong>on</strong>g> roots by size class for <strong>the</strong> sec<strong>on</strong>d-growth Doug fir and redwood stand <strong>in</strong>watershed MUN.SpeciesRootC N C/N P S K Ca Mg Fe Zn Mn Cudiameter-- mm -- g kg -1 mg kg -1 ratio ---------------------------------------------------------------- mg kg -1 ----------------------------------------------------------------Doug fir 10 512aA 1830dA 35lcA 400cA 350cA 1070bA 3170aA 450cA 466bA 12.5cA 139aA 2.6bA(8) (260) (61) (40) (80) (80) (1120) (70) (96) (1.6) (28) (0.5)Redwood 10 482aA 1530cA 419cA 470aA 520aA 1940bB 5940aA 530aA 630bA 15.ObA 194aA 2.6bA9 300 (91) (150) (130) (90) (940) (90) (144) (1.8) (69) (0.3)Values <strong>in</strong> each column followed by <strong>the</strong> same lower case letter are not significantly different when compar<strong>in</strong>g root diameter classes with<strong>in</strong> each species (ANOVA with Fisher's leastsignificant difference test, p
Nutrient pools as a functi<strong>on</strong> <str<strong>on</strong>g>of</str<strong>on</strong>g> species and biomass comp<strong>on</strong>ent are shown <strong>in</strong> Tables 11-21. There was atotal <str<strong>on</strong>g>of</str<strong>on</strong>g> 644 Mg/ha <str<strong>on</strong>g>of</str<strong>on</strong>g> carb<strong>on</strong> (~ 1288 Mg/ha <str<strong>on</strong>g>of</str<strong>on</strong>g> biomass-dry weight) stored <strong>in</strong> <strong>the</strong> redwood and Doug fir<strong>in</strong> this 80+ year old <str<strong>on</strong>g>forest</str<strong>on</strong>g> ecosystem (watershed MUN; Table 11). This compares with carb<strong>on</strong> storage <str<strong>on</strong>g>of</str<strong>on</strong>g>10.5 Mg/ha <strong>in</strong> <strong>the</strong> 6 year old redwood regrowth <strong>in</strong> <strong>the</strong> adjacent watershed (KJE). The wood and barkcomp<strong>on</strong>ents c<strong>on</strong>ta<strong>in</strong> about 86% <str<strong>on</strong>g>of</str<strong>on</strong>g> <strong>the</strong> carb<strong>on</strong> with<strong>in</strong> <strong>the</strong> ecosystem and <strong>on</strong>ly 6.4% <str<strong>on</strong>g>of</str<strong>on</strong>g> <strong>the</strong> total biomasscarb<strong>on</strong> pool is found <strong>in</strong> <strong>the</strong> below-ground root<strong>in</strong>g comp<strong>on</strong>ent. In comparis<strong>on</strong>, <strong>the</strong> biomass c<strong>on</strong>ta<strong>in</strong>s nearlyfour times <strong>the</strong> amount <str<strong>on</strong>g>of</str<strong>on</strong>g> organic carb<strong>on</strong> stored <strong>in</strong> <strong>the</strong> soil pr<str<strong>on</strong>g>of</str<strong>on</strong>g>ile (~ 170 Mg/ha; Fig. 4).There was a total <str<strong>on</strong>g>of</str<strong>on</strong>g> 1480 kg/ha <str<strong>on</strong>g>of</str<strong>on</strong>g> nitrogen <strong>in</strong> <strong>the</strong> redwood and Doug fir biomass <strong>in</strong> this ecosystem(Table 12). Only 10% (166 kg/ha) <str<strong>on</strong>g>of</str<strong>on</strong>g> <strong>the</strong> nitrogen pool is found <strong>in</strong> <strong>the</strong> below-ground root<strong>in</strong>g biomass.Approximately 64% (949 kg/ha) <str<strong>on</strong>g>of</str<strong>on</strong>g> <strong>the</strong> total nitrogen <strong>in</strong> <strong>the</strong> biomass is c<strong>on</strong>ta<strong>in</strong>ed with<strong>in</strong> <strong>the</strong> wood andbark comp<strong>on</strong>ents. Because c<strong>on</strong>venti<strong>on</strong>al clearcutt<strong>in</strong>g removes <strong>the</strong> wood and bark comp<strong>on</strong>ents, it is this949 kg/ha <str<strong>on</strong>g>of</str<strong>on</strong>g> nitrogen that will be directly removed from <strong>the</strong> ecosystem by <str<strong>on</strong>g>harvest</str<strong>on</strong>g><strong>in</strong>g. This represents anannual loss <str<strong>on</strong>g>of</str<strong>on</strong>g> about 12 kg/ha/yr over <strong>the</strong> 80-year <str<strong>on</strong>g>harvest</str<strong>on</strong>g> rotati<strong>on</strong>. These values compare to N losses from<strong>the</strong> ecosystem <str<strong>on</strong>g>of</str<strong>on</strong>g> 0.15 to 1.85 kg/ha/yr <strong>in</strong> stream water and <strong>in</strong>puts <str<strong>on</strong>g>of</str<strong>on</strong>g> 0.1 to 0.4 kg/ha/yr <strong>in</strong> precipitati<strong>on</strong>.These <strong>in</strong>puts/outputs al<strong>on</strong>e would suggest a n<strong>on</strong>susta<strong>in</strong>able <str<strong>on</strong>g>forest</str<strong>on</strong>g> practice; however, nitrogen fixers suchas Ceanothus species, lichens, and algae c<strong>on</strong>tribute to nitrogen <strong>in</strong>puts <strong>in</strong>to <strong>the</strong>se ecosystems. Fur<strong>the</strong>rmore,<strong>the</strong> pool <str<strong>on</strong>g>of</str<strong>on</strong>g> total nitrogen c<strong>on</strong>ta<strong>in</strong>ed with<strong>in</strong> <strong>the</strong> soil pr<str<strong>on</strong>g>of</str<strong>on</strong>g>ile is <strong>on</strong> <strong>the</strong> order <str<strong>on</strong>g>of</str<strong>on</strong>g> 10 Mg/ha. Thus,
Table 11. Estimated carb<strong>on</strong> pools c<strong>on</strong>ta<strong>in</strong>ed <strong>in</strong> above- and below-ground liv<strong>in</strong>g biomass <str<strong>on</strong>g>of</str<strong>on</strong>g> <strong>the</strong>redwood/Doug fir ecosystem <strong>in</strong> <strong>the</strong> reference watershed (MUN).Redwood Doug fir Ecosystem----------------------------------- Mg/ha ----------------------------------Foliage 7.45 4.95 12.4New 1.79 1.24Old 5.66 3.71Branches 20.6 14.3 34.95 cm 11.8 8.24Wood 285 203 488Bark 36.8 30.7 67.5Roots 24.0 17.0 41.0< 1 mm 0.44 0.091-2 mm 1.30 0.282-5 mm 0.86 0.925-10 mm 0.62 1.21> 10 mm 20.8 14.5Total 374 270 64433
Table 12. Estimated nitrogen pools c<strong>on</strong>ta<strong>in</strong>ed <strong>in</strong> above- and below-ground liv<strong>in</strong>g biomass <str<strong>on</strong>g>of</str<strong>on</strong>g> <strong>the</strong>redwood/Doug fir ecosystem <strong>in</strong> <strong>the</strong> reference watershed (MUN).Redwood Doug fir Ecosystem----------------------------------- kg/ha ------------------------------------Foliage 151 118 269New 41 26Old 110 92Branches 50.5 44.9 95.45 cm 25.4 17.5Wood 477 258 735Bark 130 84 214Roots 96.5 69.8 16610 mm 66.1 51.7Total 905 575 148034
Table 13. Estimated phosphorus pools c<strong>on</strong>ta<strong>in</strong>ed <strong>in</strong> above- and below-ground liv<strong>in</strong>g biomass <str<strong>on</strong>g>of</str<strong>on</strong>g> <strong>the</strong>redwood/Doug fir ecosystem <strong>in</strong> <strong>the</strong> reference watershed (MUN).Redwood Doug fir Ecosystem-------------------------------------------- kg/ha -------------------------------------------Foliage 18 20 38New 6 4Old 12 16Branches 4.4 5.4 9.85 cm 1.37 1.59Wood 28 20 48Bark 11 6 17Roots 25.5 15 40.5< 1 mm 0.97 0.181-2 mm 1.98 0.432-5 mm 1.28 1.005-10 mm 0.92 1.60> 10 mm 20.3 11.3Total 87 66 15335
Table 14. Estimated potassium pools c<strong>on</strong>ta<strong>in</strong>ed <strong>in</strong> above- and below-ground liv<strong>in</strong>g biomass <str<strong>on</strong>g>of</str<strong>on</strong>g> <strong>the</strong>redwood/Doug fir ecosystem <strong>in</strong> <strong>the</strong> reference watershed (MUN).Redwood Doug fir Ecosystem----------------------------------------- kg/ha ---------------------------------------------Foliage 82 74 156New 26 21Old 56 53Branches 42 42 845 cm 17.2 14.3Wood 219 127 346Bark 34 25 59Roots 99 40 13910 mm 83.9 30.2Total 476 308 78436
Table 15. Estimated calcium pools c<strong>on</strong>ta<strong>in</strong>ed <strong>in</strong> above- and below-ground liv<strong>in</strong>g biomass <str<strong>on</strong>g>of</str<strong>on</strong>g> <strong>the</strong>redwood/Doug fir ecosystem <strong>in</strong> <strong>the</strong> reference watershed (MUN).Redwood Doug fir Ecosystem----------------------------------------- kg/ha ---------------------------------------------Foliage 131 59 190New 25 7Old 106 52Branches 110 69 1795 cm 46.2 27.2Wood 197 74 271Bark 65 65 130Roots 307 120 42710 mm 257 89.5Total 810 387 119737
Table 16. Estimated magnesium pools c<strong>on</strong>ta<strong>in</strong>ed <strong>in</strong> above- and below-ground liv<strong>in</strong>g biomass <str<strong>on</strong>g>of</str<strong>on</strong>g><strong>the</strong> redwood/Doug fir ecosystem <strong>in</strong> <strong>the</strong> reference watershed (MUN).Redwood Doug fir Ecosystem----------------------------------------- kg/ha ----------------------------------------------Foliage 31 14 45New 8 3Old 23 11Branches 11.9 8.3 20.25 cm 5.26 3.81Wood 51 4 55Bark 12 8 20Roots 34.8 16.8 51.5< 1 mm 1.15 0.251-2 mm 2.20 0.542-5 mm 1.67 1.735-10 mm 0.88 1.60>10 mm 28.8 12.7Total 141 51.1 19238
Table 17. Estimated sulfur pools c<strong>on</strong>ta<strong>in</strong>ed <strong>in</strong> above- and below-ground liv<strong>in</strong>g biomass <str<strong>on</strong>g>of</str<strong>on</strong>g> <strong>the</strong>redwood/Doug fir ecosystem <strong>in</strong> <strong>the</strong> reference watershed (MUN).Redwood Doug fir Ecosystem---------------------------------------- kg/ha -----------------------------------------------Foliage 14 10 24New 4 2Old 10 8Branches 6.6 4.7 11.35 cm 2.74 1.91Wood 62 25 87Bark 23 14 37Roots 28 13 41< 1 mm 0.94 0.181-2 mm 2.01 0.402-5 mm 1.35 1.155-10 mm 0.87 1.10>10 mm 22.5 9.88Total 134 67 20139
Table 18. Estimated ir<strong>on</strong> pools c<strong>on</strong>ta<strong>in</strong>ed <strong>in</strong> above- and below-ground liv<strong>in</strong>g biomass <str<strong>on</strong>g>of</str<strong>on</strong>g> <strong>the</strong>redwood/Doug fir ecosystem <strong>in</strong> <strong>the</strong> reference watershed (MUN).Redwood Doug fir Ecosystem----------------------------------------- kg/ha ----------------------------------------------Foliage 0.94 0.83 1.8New 0.20 0.20Old 0.74 0.63Branches 1.19 1.84 3.05 cm 0.57 1.24Wood 251 83 334Bark 18.3 7.7 26Roots 38.7 16.5 5610 mm 33.0 13.2Total 311 110 42140
Table 19. Estimated z<strong>in</strong>c pools c<strong>on</strong>ta<strong>in</strong>ed <strong>in</strong> above- and below-ground liv<strong>in</strong>g biomass <str<strong>on</strong>g>of</str<strong>on</strong>g> <strong>the</strong>redwood/Doug fir ecosystem <strong>in</strong> <strong>the</strong> reference watershed (MUN).Redwood Doug fir Ecosystem----------------------------------------- kg/ha ---------------------------------------------Foliage 0.21 0.13 0.34New 0.07 0.03Old 0.14 0.10Branches 0.48 0.63 1.115 cm 0.14 0.17Wood 2.36 0.70 3.06Bark 0.55 0.55 1.10Roots 0.78 0.45 1.2310 mm 0.65 0.35Total 4.38 2.46 6.8441
Table 20. Estimated manganese pools c<strong>on</strong>ta<strong>in</strong>ed <strong>in</strong> above- and below-ground liv<strong>in</strong>g biomass <str<strong>on</strong>g>of</str<strong>on</strong>g> <strong>the</strong>redwood/Doug fir ecosystem <strong>in</strong> <strong>the</strong> reference watershed (MUN).Redwood Doug fir Ecosystem----------------------------------------- kg/ha ---------------------------------------------Foliage 4.9 5.0 9.9New 1.4 0.8Old 3.5 4.2Branches 1.9 2.6 4.55 cm 0.89 1.14Wood 8.6 3.6 12.2Bark 2.2 2.4 4.6Roots 11.0 5.8 16.8< 1 mm 0.29 0.061-2 mm 1.18 0.152-5 mm 0.84 0.645-10 mm 0.34 0.51>10 mm 8.39 3.92Total 28.6 19.4 48.042
Table 21. Estimated copper pools c<strong>on</strong>ta<strong>in</strong>ed <strong>in</strong> above- and below-ground liv<strong>in</strong>g biomass <str<strong>on</strong>g>of</str<strong>on</strong>g> <strong>the</strong>redwood/Doug fir ecosystem <strong>in</strong> <strong>the</strong> reference watershed (MUN).Redwood Doug fir Ecosystem----------------------------------------- kg/ha ----------------------------------------------Foliage 0.03 0.03 0.06New 0.01 0.01Old 0.02 0.02Branches 0.07 0.09 0.155 cm 0.03 0.04Wood 1.12 0.20 1.32Bark 0.15 0.28 0.43Roots 0.16 0.11 0.27< 1 mm 0.02 0.011-2 mm 0.01 0.012-5 mm 0.01 0.015-10 mm 0.01 0.01>10 mm 0.11 0.07Total 1.53 0.70 2.2343
Fig. 7.Nutrient pools c<strong>on</strong>ta<strong>in</strong>ed <strong>in</strong> <strong>the</strong> above- and below-ground liv<strong>in</strong>g biomass <strong>in</strong> <strong>the</strong>reference watershed (MUN), and <strong>in</strong> <strong>the</strong> clearcut (KJE) watershed six years follow<strong>in</strong>g<strong>the</strong> <str<strong>on</strong>g>harvest</str<strong>on</strong>g>.44
Precipitati<strong>on</strong>, Canopy Throughfall and Soil Soluti<strong>on</strong> ChemistryChanges <strong>in</strong> aqueous chemistry al<strong>on</strong>g <strong>the</strong> hydrologic cycle with<strong>in</strong> <strong>the</strong> sec<strong>on</strong>d growth redwood/Dougfir and clearcut ecosystems are shown <strong>in</strong> Figure 8. Each comp<strong>on</strong>ent <str<strong>on</strong>g>of</str<strong>on</strong>g> <strong>the</strong> hydrologic cycle will bediscussed below.Precipitati<strong>on</strong>. The precipitati<strong>on</strong> was str<strong>on</strong>gly <strong>in</strong>fluenced by sea salts with <strong>the</strong> chemical compositi<strong>on</strong>dom<strong>in</strong>ated by sodium (48 µM) and chloride (49 µM) <strong>in</strong> a near-stoichiometric balance (Table 22).There were trace <strong>in</strong>puts <str<strong>on</strong>g>of</str<strong>on</strong>g> N (NH 4 = 0.8 µM & NO 3 = 1.0 µM) and P (ortho-PO 4 = 0.5 µM) add<strong>in</strong>gimportant macro-nutrients to this ecosystem. O<strong>the</strong>r macro-nutrients present <strong>in</strong> appreciablec<strong>on</strong>centrati<strong>on</strong>s were K (4.0 µM), Mg (13 µM), Ca (15 µM) and SO 4 (4 µM). The mean pH <str<strong>on</strong>g>of</str<strong>on</strong>g> <strong>the</strong>ra<strong>in</strong>fall was slightly acidic at 6.42.Canopy Throughfall. Canopy <strong>in</strong>tercepti<strong>on</strong> ([precipitati<strong>on</strong>-canopy throughfall]/precipitati<strong>on</strong>) averaged10±14% (mean±std deviati<strong>on</strong>; range = -11 to 30%) for Doug fir and 16±11% (mean±std deviati<strong>on</strong>;range = 8 to 36%) for redwood. These canopy <strong>in</strong>tercepti<strong>on</strong> values are c<strong>on</strong>sistent with <strong>the</strong> range <str<strong>on</strong>g>of</str<strong>on</strong>g> 9to 26% measured <strong>in</strong> this same watershed (MUN) by E. Keppeler <str<strong>on</strong>g>of</str<strong>on</strong>g> <strong>the</strong> USDA Forest Service,Caspar Creek Research Team. Mean <strong>in</strong>tercepti<strong>on</strong> rates for c<strong>on</strong>ifers generally range between 10-35%,but are highly dependent <strong>on</strong> <strong>the</strong> form, distributi<strong>on</strong> and <strong>in</strong>tensity <str<strong>on</strong>g>of</str<strong>on</strong>g> precipitati<strong>on</strong>. The lower<strong>in</strong>tercepti<strong>on</strong> rates <strong>in</strong> this coastal-fog z<strong>on</strong>e are most probably a result <str<strong>on</strong>g>of</str<strong>on</strong>g> fog c<strong>on</strong>densati<strong>on</strong> and dripfrom <strong>the</strong> canopy. In a few <strong>in</strong>stances, canopy throughfall volumes were actually higher thanprecipitati<strong>on</strong> volumes <strong>in</strong>dicat<strong>in</strong>g capture <str<strong>on</strong>g>of</str<strong>on</strong>g> fog by <strong>the</strong> canopy.The chemical compositi<strong>on</strong> <str<strong>on</strong>g>of</str<strong>on</strong>g> <strong>the</strong> precipitati<strong>on</strong> was substantially altered by <strong>in</strong>teracti<strong>on</strong> with <strong>the</strong>redwood and Doug fir canopies (Table 22). C<strong>on</strong>centrati<strong>on</strong>s <str<strong>on</strong>g>of</str<strong>on</strong>g> Na, Cl, SO 4 , Mg and Ca were enrichedby a factor <str<strong>on</strong>g>of</str<strong>on</strong>g> 2 to 5.5 times <strong>on</strong> pass<strong>in</strong>g through <strong>the</strong> canopy. The enrichment factor for <strong>the</strong>se elementswas generally a factor <str<strong>on</strong>g>of</str<strong>on</strong>g> two greater for <strong>the</strong> Doug fir canopy. S<strong>in</strong>ce <strong>the</strong>se elements are derivedprimarily from sea salt capture, <strong>the</strong>se data suggest that <strong>the</strong> capture efficiency <str<strong>on</strong>g>of</str<strong>on</strong>g> <strong>the</strong> Doug fir canopyis appreciably greater than that <str<strong>on</strong>g>of</str<strong>on</strong>g> <strong>the</strong> redwood canopy. The large enrichments for ortho-PO 4 (22times for Doug fir) and K (13-16 times) <strong>in</strong> <strong>the</strong> canopy throughfall is probably due to exudati<strong>on</strong> andleach<strong>in</strong>g <str<strong>on</strong>g>of</str<strong>on</strong>g> <strong>the</strong>se comp<strong>on</strong>ents from <strong>the</strong> foliage. The enrichment values are substantially larger thanfor <strong>the</strong> sea salt dom<strong>in</strong>ated elements suggest<strong>in</strong>g that aerosol and particulate capture is not <strong>the</strong>dom<strong>in</strong>ant process affect<strong>in</strong>g ortho-PO 4 and K enrichment. In c<strong>on</strong>trast to <strong>the</strong> large enrichment factorsfor <strong>the</strong> majority <str<strong>on</strong>g>of</str<strong>on</strong>g> elements, c<strong>on</strong>centrati<strong>on</strong>s <str<strong>on</strong>g>of</str<strong>on</strong>g> NH 4 and NO 3 were not appreciably altered by canopy<strong>processes</strong>. The pH <str<strong>on</strong>g>of</str<strong>on</strong>g> <strong>the</strong> canopy throughfall was 0.4 to 0.5 units lower than that <str<strong>on</strong>g>of</str<strong>on</strong>g> <strong>the</strong> <strong>in</strong>com<strong>in</strong>gprecipitati<strong>on</strong> <strong>in</strong>dicat<strong>in</strong>g some leach<strong>in</strong>g <str<strong>on</strong>g>of</str<strong>on</strong>g> acidic comp<strong>on</strong>ents (e.g., organic acids) from <strong>the</strong> canopy.Soil Soluti<strong>on</strong>s. The soil soluti<strong>on</strong> charge balances <strong>in</strong> <strong>the</strong> reference (MUN) and clearcut (KJE)watersheds show <strong>the</strong> follow<strong>in</strong>g cati<strong>on</strong> and ani<strong>on</strong> distributi<strong>on</strong>s (Fig. 8):Reference Ca = Na > Mg > KClearcut Ca > Na > Mg > KReference Cl > HCO 3 >> SO 4 Clearcut HCO 3 > Cl > SO 4 .45
Fig. 8.Soluti<strong>on</strong> charge balance diagrams for precipitati<strong>on</strong> (PPT), canopy throughfall (TF),soil soluti<strong>on</strong>s at 20, 40 and 60 cm depths and stream water for <strong>the</strong> period October,1993 to June, 1996 <strong>in</strong> <strong>the</strong> clearcut (KJE) and reference (MUN) watersheds. Thewidth <str<strong>on</strong>g>of</str<strong>on</strong>g> each compartment is equal to <strong>the</strong> charge c<strong>on</strong>tributed by each i<strong>on</strong>. Theani<strong>on</strong> charge deficit is assumed to be <strong>the</strong> c<strong>on</strong>tributi<strong>on</strong> <str<strong>on</strong>g>of</str<strong>on</strong>g> dissociated organic acids.46
Table 22. Mean-±SEM solute c<strong>on</strong>centrati<strong>on</strong>s for precipitati<strong>on</strong> and canopy throughfall from Doug fir andredwood.Precipitati<strong>on</strong> Canopy ThroughfallDoug firRedwoodpH 6.42 (0.11)a 5.92 (0.08)b 6.07 (0.10 bCl (µM) 48.6 3.5)a 272.8 43.8)b 123.9 16.0)cNO 3 (µM) 1.0 (0.2 a 1.2 (0.9)a 0.6 (0.2)aPO 4 (µM) 0.5 (0.3 a 10.8 3.0)b 8.1 2.1 bSO 4 (µM) 4.3 0.3 a 16.3 3.1 b 8.0 (0.9 cNa (µM) 48.3 3.8)a 258.6 33.5 b 98.2 (13.3 cNH 4 (µM) 0.8 0.4)ab 0.5 (0.2 a 1.9 (0.5)bK (µM) 4.0 0.8 a 65.6 (8.9 b 52.7 (8.1)bMg (µM) 12.9 0.8)a 49.9 (5.9 b 31.6 (3.2)cCa (µM) 14.5 (1.6 a 56.4 (6.9)b 42.2 4.1)bSi (µM) 2.4 (0.3)a 1.9 (0.4)a 2.7 (0.7)aValues with <strong>the</strong> same lower-case letter with<strong>in</strong> a row <strong>in</strong>dicate that <strong>the</strong>se values are not statisticallydifference at p
Soil soluti<strong>on</strong> pH values <strong>in</strong>creased by about 0.8 units compared to <strong>the</strong> <strong>in</strong>com<strong>in</strong>g canopy throughfall(Fig. 9). With<strong>in</strong> <strong>the</strong> soil pr<str<strong>on</strong>g>of</str<strong>on</strong>g>ile, pH values were similar with <strong>in</strong>creas<strong>in</strong>g depth (range = 6.7 to 6.9).The pH was about 0.1 units lower at <strong>the</strong> 20 cm depth <strong>in</strong> <strong>the</strong> clearcut compared to <strong>the</strong> referencewatershed (Table 23). C<strong>on</strong>centrati<strong>on</strong>s <str<strong>on</strong>g>of</str<strong>on</strong>g> base cati<strong>on</strong>s (Na, Ca, Mg and K) were generally lower <strong>in</strong> <strong>the</strong>clearcut compared to <strong>the</strong> reference catchment (Fig. 10; Table 23). Lower c<strong>on</strong>centrati<strong>on</strong>s <strong>in</strong> <strong>the</strong>clearcut may result from reduced capture efficiency for sea salts due to removal <str<strong>on</strong>g>of</str<strong>on</strong>g> <strong>the</strong> <str<strong>on</strong>g>forest</str<strong>on</strong>g> canopyand diluti<strong>on</strong> result<strong>in</strong>g from a reducti<strong>on</strong> <strong>in</strong> evapotranspirati<strong>on</strong> associated with removal <str<strong>on</strong>g>of</str<strong>on</strong>g> <strong>the</strong> <str<strong>on</strong>g>forest</str<strong>on</strong>g>canopy. C<strong>on</strong>centrati<strong>on</strong>s <str<strong>on</strong>g>of</str<strong>on</strong>g> <strong>the</strong> ani<strong>on</strong>s, C1 and SO 4 , were lower <strong>in</strong> <strong>the</strong> clearcut watershed (Fig. 11;Table 23). Reduced capture efficiency for sea salts and diluti<strong>on</strong> result<strong>in</strong>g from reducedevapotranspirati<strong>on</strong> may also c<strong>on</strong>tribute to this pattern. Silic<strong>on</strong> c<strong>on</strong>centrati<strong>on</strong>s were a factor <str<strong>on</strong>g>of</str<strong>on</strong>g> 1.5times lower <strong>in</strong> <strong>the</strong> reference watershed (Fig. 12; Table 23). Because Si c<strong>on</strong>centrati<strong>on</strong>s are regulatedprimarily by m<strong>in</strong>eral equilibria, it is believed that k<strong>in</strong>etic factors related to <strong>the</strong> lower residence time<str<strong>on</strong>g>of</str<strong>on</strong>g> water (due to less ET and canopy <strong>in</strong>tercepti<strong>on</strong>) <strong>in</strong> <strong>the</strong> soil pr<str<strong>on</strong>g>of</str<strong>on</strong>g>iles <str<strong>on</strong>g>of</str<strong>on</strong>g> <strong>the</strong> clearcut are resp<strong>on</strong>siblefor this difference. In c<strong>on</strong>trast, silic<strong>on</strong> c<strong>on</strong>centrati<strong>on</strong>s are virtually identical <strong>in</strong> <strong>the</strong> stream watersdra<strong>in</strong><strong>in</strong>g <strong>the</strong> two watersheds suggest<strong>in</strong>g that Si c<strong>on</strong>centrati<strong>on</strong>s reach equilibrium before <strong>the</strong> soilsoluti<strong>on</strong>s emerge as stream flow.C<strong>on</strong>centrati<strong>on</strong>s <str<strong>on</strong>g>of</str<strong>on</strong>g> NH 4 were very low (
Table 23. Mean±SEM for soil soluti<strong>on</strong> c<strong>on</strong>centrati<strong>on</strong>s <strong>in</strong> <strong>the</strong> reference (MUN) and clearcut (KJE) watersheds at Caspar Creek. Soilsoluti<strong>on</strong>s were collected at <strong>the</strong> 20, 40, and 60 cm depths.20 cm depth 40 cm depth 60 cm depthReference Clearcut Reference Clearcut Reference ClearcutpH 6.86 (0.03) * 6.75 (0.03) * 6.76 (0.06) 6.73 (0.05) 6.78 (0.06) 6.70 (0.06)Cl (µM) 325.6 (39.3) ** 94.7 (12.5) ** 434.8 (58.1) ** 160.7 (22.3) ** 360.2 (35.3) ** 105.4 (11.2) **NO 3 (µM) 2.1 (0.6) ** 7.4 (1.8) ** 0.3 (0.1) ** 4.7 (1.7) ** 0.4 (0.3) 2.27 (1.3)PO 4 (µM) 0.3 (0.2) ** 2.0 (0.6) ** 0.3 (0.2) 0.8 (0.5) 0.1 (0.1) 0.3 (0.1)SO 4 (µM) 26.5 (4.7) ** 10.3 (1.6) ** 22.8 (2.1) ** 14.2 (2.3) ** 25.8 (2.7) ** 12.5 (1.7) **Na (µM) 265.2 (18.5) ** 131.9 (16.7) ** 381.7 (28.3)** 192.3 (21.8) ** 346.1 (28.4) ** 195.2 (18.7) **NH 4 (µM) 1.9 (1.4) 2.1 (1.2) 0.3 (0.3) 0.7 (0.3) 0.9 (0.5) 0.4 (0.3)K (µM) 91.2 (5.8) 114.0 (16.4) 74.9 (6.1) * 55.0 (9.1) * 56.4 (3.8) ** 35.2 (2.6) **Mg (µM) 81.6 (4.7) ** 64.0 (3.3) ** 72.7 (5.0) ** 55.5 (3.5) ** 70.3 (3.3) ** 54.6 (4.3) **Ca (µM) 188.7 (9.0) 166.3 (11.3) 172.3 (9.6) ** 101.1 (8.3) ** 143.7 (5.2) ** 84.1 (8.1) **Si (µM) 49.4 (2.8)** 30.0 (3.9)** 67.3 (6.0)* 51.1 (6.3)* 66.6 (5.9)** 47.5 (5.8)*** and * * <strong>in</strong>dicate that means between reference and clearcut values for a given depth are statistically different at <strong>the</strong> p=.10 andp=.05 significance level, respectively.
Fig. 9. Mean±standard deviati<strong>on</strong> for pH <str<strong>on</strong>g>of</str<strong>on</strong>g> precipitati<strong>on</strong> (PPT), canopy throughfall (TF), soil soluti<strong>on</strong>s at 20,40 and 60 cm depths, and stream water for <strong>the</strong> period October, 1993 to June, 1996 <strong>in</strong> <strong>the</strong> clearcut(KJE) and reference (MUN) watersheds.50
Fig. 10.Mean±standard deviati<strong>on</strong> for base cati<strong>on</strong>s <strong>in</strong> precipitati<strong>on</strong> (PPT), canopy throughfall (TF), soilsoluti<strong>on</strong>s at 20, 40 and 60 cm depths, and stream water for <strong>the</strong> period October, 1993 to June,1996 <strong>in</strong> <strong>the</strong> clearcut (KJE) and reference (MUN) watersheds.51
Fig. 11.Mean±standard deviati<strong>on</strong> for major ani<strong>on</strong>s <strong>in</strong> precipitati<strong>on</strong> (PPT), canopy throughfall (TF),soil soluti<strong>on</strong>s at 20, 40 and 60 cm depths, and stream water for <strong>the</strong> period October, 1993 toJune, 1996 <strong>in</strong> <strong>the</strong> clearcut (KJE) and reference (MUN) watersheds.52
Fig. 12.Mean±standard deviati<strong>on</strong> for silic<strong>on</strong> <strong>in</strong> precipitati<strong>on</strong> (PPT), canopy throughfall (TF),soil soluti<strong>on</strong>s at 20, 40 and 60 cm depths, and stream water for <strong>the</strong> period October,1993 to June, 1996 <strong>in</strong> <strong>the</strong> clearcut (KJE) and reference (MUN) watersheds.53
Fig. 13.Mean±standard deviati<strong>on</strong> for amm<strong>on</strong>ium <strong>in</strong> precipitati<strong>on</strong> (PPT), canopy throughfall(TF), soil soluti<strong>on</strong>s at 20, 40 and 60 cm depths, and stream water for <strong>the</strong> periodOctober, 1993 to June, 1996 <strong>in</strong> <strong>the</strong> clearcut (KJE) and reference (MUN) watersheds.54
Stream Water ChemistryWatershed-scale manipulati<strong>on</strong>s axe a powerful approach for study<strong>in</strong>g <strong>the</strong> effects <str<strong>on</strong>g>of</str<strong>on</strong>g> <str<strong>on</strong>g>forest</str<strong>on</strong>g>management practices <strong>on</strong> nutrient cycl<strong>in</strong>g <strong>processes</strong>. Watershed manipulati<strong>on</strong> studies comm<strong>on</strong>lyutilize a paired watershed approach <strong>in</strong> which two watersheds with similar characteristics areemployed. In this study, stream water chemistry from <strong>the</strong> reference watershed (MUN) was comparedto that from <strong>the</strong> clearcut watershed (KJE) to exam<strong>in</strong>e <strong>the</strong> effects <str<strong>on</strong>g>of</str<strong>on</strong>g> <str<strong>on</strong>g>harvest</str<strong>on</strong>g> and post-<str<strong>on</strong>g>harvest</str<strong>on</strong>g>management practices <strong>on</strong> nutrient cycl<strong>in</strong>g. The export <str<strong>on</strong>g>of</str<strong>on</strong>g> nutrients <strong>in</strong> stream water is <strong>on</strong>e <str<strong>on</strong>g>of</str<strong>on</strong>g> <strong>the</strong>primary <strong>processes</strong> resp<strong>on</strong>sible for nutrient losses from <str<strong>on</strong>g>forest</str<strong>on</strong>g>ed ecosystems. M<strong>on</strong>itor<strong>in</strong>g <str<strong>on</strong>g>of</str<strong>on</strong>g> streamwater chemistry began <strong>in</strong> <strong>the</strong> clearcut watershed approximately 1.25 years (March, 1991) follow<strong>in</strong>gcompleti<strong>on</strong> <str<strong>on</strong>g>of</str<strong>on</strong>g> fell<strong>in</strong>g operati<strong>on</strong>s.Nitrate. Nitrate c<strong>on</strong>centrati<strong>on</strong>s <strong>in</strong> <strong>the</strong> reference watershed were generally less than our detecti<strong>on</strong>limits <str<strong>on</strong>g>of</str<strong>on</strong>g> 0.4 µM; however, c<strong>on</strong>centrati<strong>on</strong>s exceed<strong>in</strong>g 10 µM were measured dur<strong>in</strong>g two storm events<strong>in</strong> 1995-96 (Fig. 14). In c<strong>on</strong>trast, nitrate c<strong>on</strong>centrati<strong>on</strong>s <strong>in</strong> <strong>the</strong> clearcut watershed ranged between 10and 50 um dur<strong>in</strong>g storm events. Baseflow NO 3 c<strong>on</strong>centrati<strong>on</strong>s <strong>in</strong> <strong>the</strong> clearcut watershed were low and<str<strong>on</strong>g>of</str<strong>on</strong>g>ten below detecti<strong>on</strong> limits. It appears that NO 3 c<strong>on</strong>centrati<strong>on</strong>s showed a progressive decrease <strong>in</strong>peak c<strong>on</strong>centrati<strong>on</strong>s <strong>in</strong> <strong>the</strong> years follow<strong>in</strong>g <strong>the</strong> clearcut (1991 to 1994); however, c<strong>on</strong>centrati<strong>on</strong>s<strong>in</strong>creased aga<strong>in</strong> dur<strong>in</strong>g storm events <strong>in</strong> 1995-96. The <strong>in</strong>creased NO 3 c<strong>on</strong>centrati<strong>on</strong>s dur<strong>in</strong>g 1995-96were observed <strong>in</strong> both <strong>the</strong> clearcut and reference watersheds suggest<strong>in</strong>g that <strong>the</strong> <strong>in</strong>crease was notsolely due to <strong>the</strong> disturbance associated with <strong>the</strong> clearcut <str<strong>on</strong>g>harvest</str<strong>on</strong>g><strong>in</strong>g.Increased NO 3 c<strong>on</strong>centrati<strong>on</strong>s <strong>in</strong> stream water after clearcutt<strong>in</strong>g is a comm<strong>on</strong> observati<strong>on</strong>; however,<strong>the</strong> magnitude <str<strong>on</strong>g>of</str<strong>on</strong>g> NO 3 leach<strong>in</strong>g varies appreciably between sites. For example, maximum NO 3c<strong>on</strong>centrati<strong>on</strong>s follow<strong>in</strong>g whole-tree clearcutt<strong>in</strong>g <str<strong>on</strong>g>of</str<strong>on</strong>g> a nor<strong>the</strong>rn hardwood <str<strong>on</strong>g>forest</str<strong>on</strong>g> <strong>in</strong> <strong>the</strong> Hubbard BrookEcological Forest <str<strong>on</strong>g>of</str<strong>on</strong>g> New Hampshire were 500 µM (Dahlgren and Driscoll, 1994), an order <str<strong>on</strong>g>of</str<strong>on</strong>g>magnitude greater than those observed <strong>in</strong> this study. We feel that <strong>the</strong> rapid immobilizati<strong>on</strong> <str<strong>on</strong>g>of</str<strong>on</strong>g>nitrogen <strong>in</strong>to <strong>the</strong> stump sprout<strong>in</strong>g redwood biomass is an important factor limit<strong>in</strong>g <strong>the</strong> leach<strong>in</strong>g losses<str<strong>on</strong>g>of</str<strong>on</strong>g> NO 3 <strong>in</strong> <strong>the</strong>se redwood/Doug fir ecosystems.The maximum c<strong>on</strong>centrati<strong>on</strong>s <str<strong>on</strong>g>of</str<strong>on</strong>g> NO 3 typically occur <strong>in</strong> <strong>the</strong> sec<strong>on</strong>d year follow<strong>in</strong>g clearcutt<strong>in</strong>g. Thisresults from microbial immobilizati<strong>on</strong> <str<strong>on</strong>g>of</str<strong>on</strong>g> N dur<strong>in</strong>g decompositi<strong>on</strong> <str<strong>on</strong>g>of</str<strong>on</strong>g> woody litter with high C/Nratios that is added to <strong>the</strong> soil organic matter pool as slash dur<strong>in</strong>g <strong>the</strong> <str<strong>on</strong>g>harvest</str<strong>on</strong>g>. S<strong>in</strong>ce we missed <strong>the</strong>January 1990 to March 1991 m<strong>on</strong>itor<strong>in</strong>g period, we can not state specifically <strong>the</strong> tim<strong>in</strong>g <str<strong>on</strong>g>of</str<strong>on</strong>g> peak NO 3c<strong>on</strong>centrati<strong>on</strong>s follow<strong>in</strong>g <str<strong>on</strong>g>harvest</str<strong>on</strong>g> <strong>in</strong> watershed KJE. We do have immediate post-<str<strong>on</strong>g>harvest</str<strong>on</strong>g> streamwater m<strong>on</strong>itor<strong>in</strong>g from clearcut watersheds EAG and GIB that show maximum NO 3 c<strong>on</strong>centrati<strong>on</strong>s<strong>in</strong> <strong>the</strong> spr<strong>in</strong>g follow<strong>in</strong>g <strong>the</strong> cutt<strong>in</strong>g (see appendices I & K). The maximum NO 3 c<strong>on</strong>centrati<strong>on</strong> <strong>in</strong>stream water from <strong>the</strong>se two watersheds was 70 µM and c<strong>on</strong>centrati<strong>on</strong>s decreased over time <strong>in</strong> afashi<strong>on</strong> similar to watershed KJE. Thus, we are c<strong>on</strong>fident from our m<strong>on</strong>itor<strong>in</strong>g <str<strong>on</strong>g>of</str<strong>on</strong>g> watersheds EAGand GIB that <strong>the</strong> data from clearcut watershed KJE is representative <str<strong>on</strong>g>of</str<strong>on</strong>g> <strong>the</strong> resp<strong>on</strong>se <str<strong>on</strong>g>of</str<strong>on</strong>g> stream waterchemistry to clearcutt<strong>in</strong>g.The maximum NO 3 c<strong>on</strong>centrati<strong>on</strong>s described above occur dur<strong>in</strong>g high flow storm events and drop tolow levels dur<strong>in</strong>g baseflow. We <strong>in</strong>terpret <strong>the</strong>se data to <strong>in</strong>dicate that chang<strong>in</strong>g hydrologic55
Fig. 14.Streamwater nitrate c<strong>on</strong>centrati<strong>on</strong>s (symbols) and streamflow (l<strong>in</strong>es) <strong>in</strong> <strong>the</strong> clearcut (KJE)and reference (MUN) watersheds <str<strong>on</strong>g>of</str<strong>on</strong>g> <strong>the</strong> North Fork, Caspar Creek. Fell<strong>in</strong>g was completed<strong>in</strong> <strong>the</strong> clearcut watershed <strong>in</strong> November 1989. Grab samples were collected biweeklydur<strong>in</strong>g periods <str<strong>on</strong>g>of</str<strong>on</strong>g> baseflow while autosamplers were used to collected samples dur<strong>in</strong>gstorm events.56
flowpaths dur<strong>in</strong>g storm events result <strong>in</strong> <strong>the</strong> delivery <str<strong>on</strong>g>of</str<strong>on</strong>g> high-NO 3 waters to <strong>the</strong> stream dur<strong>in</strong>g peakdischarge. Soil soluti<strong>on</strong> data <strong>in</strong>dicates that <strong>the</strong> highest NO 3 c<strong>on</strong>centrati<strong>on</strong>s occur with<strong>in</strong> <strong>the</strong> upper soilhoriz<strong>on</strong>s. The soils with<strong>in</strong> <strong>the</strong> watershed have a thick argillic horiz<strong>on</strong> (clay-enriched) beg<strong>in</strong>n<strong>in</strong>g at adepth <str<strong>on</strong>g>of</str<strong>on</strong>g> approximately 30 cm. The argillic horiz<strong>on</strong> c<strong>on</strong>ta<strong>in</strong>s >40% clay, substantially reduc<strong>in</strong>g <strong>the</strong>hydraulic c<strong>on</strong>ductivity, which results <strong>in</strong> saturati<strong>on</strong> above this layer. Given <strong>the</strong> steep slopes with<strong>in</strong> <strong>the</strong>watershed, this saturated z<strong>on</strong>e may move laterally downslope, leach<strong>in</strong>g nutrients from with<strong>in</strong> <strong>the</strong>nutrient-rich root<strong>in</strong>g z<strong>on</strong>e (upper 30 cm) and deliver<strong>in</strong>g <strong>the</strong>m to <strong>the</strong> stream as subsurface lateral flowdur<strong>in</strong>g peak discharge. This mechanism is supported by repeated observati<strong>on</strong>s <str<strong>on</strong>g>of</str<strong>on</strong>g> lateral flow above<strong>the</strong> argillic horiz<strong>on</strong> and through macropores (e.g., root channels) <strong>on</strong> roadcuts with<strong>in</strong> <strong>the</strong> Caspar Creekdra<strong>in</strong>age.Sulfate. Stream water c<strong>on</strong>centrati<strong>on</strong>s <str<strong>on</strong>g>of</str<strong>on</strong>g> SO 4 were c<strong>on</strong>sistently higher by approximately 20 µM <strong>in</strong> <strong>the</strong>clearcut watershed compared to <strong>the</strong> reference watershed (Fig. 15). The <strong>in</strong>creased c<strong>on</strong>centrati<strong>on</strong>s <strong>in</strong><strong>the</strong> clearcut watershed are most likely due to <strong>in</strong>creased decompositi<strong>on</strong>/m<strong>in</strong>eralizati<strong>on</strong> coupled withdecreased SO 4 uptake by vegetati<strong>on</strong>. The immobilizati<strong>on</strong> <str<strong>on</strong>g>of</str<strong>on</strong>g> S <strong>in</strong> redwood sprouts is approximately anorder <str<strong>on</strong>g>of</str<strong>on</strong>g> magnitude less than immobilizati<strong>on</strong> <str<strong>on</strong>g>of</str<strong>on</strong>g> N (70 kg N/ha versus 6.8 kg S/ha). These differences<strong>in</strong> S m<strong>in</strong>eralizati<strong>on</strong> and biological uptake lead to greater SO 4 producti<strong>on</strong> and less biological demand,which may c<strong>on</strong>tribute to <strong>the</strong> greater leach<strong>in</strong>g <str<strong>on</strong>g>of</str<strong>on</strong>g> SO 4 from <strong>the</strong> watershed. Sulfate c<strong>on</strong>centrati<strong>on</strong>s <strong>in</strong>both watersheds were decreased by 20 to 50 um dur<strong>in</strong>g peak flows associated with storm events. Thisdecrease is probably attributable to dilute waters enter<strong>in</strong>g <strong>the</strong> stream as subsurface lateral flow.Chloride. Chloride c<strong>on</strong>centrati<strong>on</strong>s <strong>in</strong> <strong>the</strong> clearcut watershed showed a str<strong>on</strong>g temporal pattern at both<strong>the</strong> seas<strong>on</strong>al and storm-event scale (Fig. 16). Seas<strong>on</strong>ally, maximum Cl c<strong>on</strong>centrati<strong>on</strong>s occurreddur<strong>in</strong>g <strong>the</strong> summer period <str<strong>on</strong>g>of</str<strong>on</strong>g> low streamflow. Dur<strong>in</strong>g storm events, Cl c<strong>on</strong>centrati<strong>on</strong>s were reducedby up to 200 µM as a result <str<strong>on</strong>g>of</str<strong>on</strong>g> diluti<strong>on</strong>, possibly related to changes <strong>in</strong> <strong>the</strong> hydrologic flowpath. Thedecrease <strong>in</strong> Cl c<strong>on</strong>centrati<strong>on</strong>s dur<strong>in</strong>g peak streamflows is <strong>in</strong> complete c<strong>on</strong>trast to NO 3 c<strong>on</strong>centrati<strong>on</strong>swhich peak dur<strong>in</strong>g maximum streamflow.Chloride c<strong>on</strong>centrati<strong>on</strong>s <strong>in</strong> <strong>the</strong> reference watershed were generally 100 µM greater than those <strong>in</strong> <strong>the</strong>clearcut watershed. The Cl c<strong>on</strong>centrati<strong>on</strong> versus stream discharge relati<strong>on</strong>ship was identical between<strong>the</strong> reference and clearcut watersheds with a large diluti<strong>on</strong> occurr<strong>in</strong>g dur<strong>in</strong>g peak waterflows. Streamwater samples were not collected from <strong>the</strong> reference watershed dur<strong>in</strong>g <strong>the</strong> summer dry periodbecause evapotranspirati<strong>on</strong> (ET) was greater <strong>in</strong> <strong>the</strong> sec<strong>on</strong>d growth stand reduc<strong>in</strong>g streamflowdurati<strong>on</strong>. Similarly, <strong>in</strong>tercepti<strong>on</strong> water loss <str<strong>on</strong>g>of</str<strong>on</strong>g> 10-16% by <strong>the</strong> sec<strong>on</strong>d growth canopy results <strong>in</strong> lesswater reach<strong>in</strong>g <strong>the</strong> soil surface. The water loss associated with canopy <strong>in</strong>tercepti<strong>on</strong> and ET results <strong>in</strong>less water yield and streamflow durati<strong>on</strong> with<strong>in</strong> <strong>the</strong> reference watershed. The differences <strong>in</strong> waterflux also have an appreciable effect <strong>on</strong> stream water solute c<strong>on</strong>centrati<strong>on</strong>s.57
Fig. 15.Streamwater sulfate c<strong>on</strong>centrati<strong>on</strong>s (symbols) and streamflow (l<strong>in</strong>es) <strong>in</strong> <strong>the</strong> clearcut (KJE)and reference (MUN) watersheds <str<strong>on</strong>g>of</str<strong>on</strong>g> <strong>the</strong> North Fork, Caspar Creek. Fell<strong>in</strong>g was completed<strong>in</strong> <strong>the</strong> clearcut watershed <strong>in</strong> November 1989. Grab samples were collected biweekly dur<strong>in</strong>gperiods <str<strong>on</strong>g>of</str<strong>on</strong>g> baseflow while autosamplers were used to collected samples dur<strong>in</strong>g stormevents.58
Fig. 16.Streamwater chloride c<strong>on</strong>centrati<strong>on</strong>s (symbols) and streamflow (l<strong>in</strong>es) <strong>in</strong> <strong>the</strong> clearcut (KJE)and reference (MUN) watersheds <str<strong>on</strong>g>of</str<strong>on</strong>g> <strong>the</strong> North Fork, Caspar Creek. Fell<strong>in</strong>g was completed <strong>in</strong><strong>the</strong> clearcut watershed <strong>in</strong> November 1989. Grab samples were collected biweekly dur<strong>in</strong>gperiods <str<strong>on</strong>g>of</str<strong>on</strong>g> baseflow while autosamplers were used to collected samples dur<strong>in</strong>g storm events.59
Bicarb<strong>on</strong>ate. Bicarb<strong>on</strong>ate is <strong>the</strong> major ani<strong>on</strong> <strong>in</strong> <strong>the</strong> stream water and is also <strong>the</strong> dom<strong>in</strong>ant source <str<strong>on</strong>g>of</str<strong>on</strong>g>alkal<strong>in</strong>ity. C<strong>on</strong>centrati<strong>on</strong>s <str<strong>on</strong>g>of</str<strong>on</strong>g> HCO3 were very similar between <strong>the</strong> clearcut and reference watershedsas were <strong>the</strong> patterns <str<strong>on</strong>g>of</str<strong>on</strong>g> decreased HC03 c<strong>on</strong>centrati<strong>on</strong>s <strong>in</strong> resp<strong>on</strong>se to <strong>in</strong>creased stream dischargedur<strong>in</strong>g storm events (Fig. 17). The primary source <str<strong>on</strong>g>of</str<strong>on</strong>g> bicarb<strong>on</strong>ate is from carb<strong>on</strong> dioxide released byroot and microbial respirati<strong>on</strong> with<strong>in</strong> <strong>the</strong> soil pr<str<strong>on</strong>g>of</str<strong>on</strong>g>ile. Thus, as waterflow through <strong>the</strong> soil pr<str<strong>on</strong>g>of</str<strong>on</strong>g>ile<strong>in</strong>creases, <strong>the</strong> HC03 c<strong>on</strong>centrati<strong>on</strong>s are reduced due to diluti<strong>on</strong> by <strong>the</strong> percolat<strong>in</strong>g waters. Thismechanism may expla<strong>in</strong>, <strong>in</strong> part, <strong>the</strong> large reducti<strong>on</strong> <strong>in</strong> stream water HC03 c<strong>on</strong>centrati<strong>on</strong>s dur<strong>in</strong>ghigh discharge events. Changes <strong>in</strong> <strong>the</strong> hydrologic flowpath may also result <strong>in</strong> diluti<strong>on</strong> <str<strong>on</strong>g>of</str<strong>on</strong>g> HC03c<strong>on</strong>centrati<strong>on</strong>s dur<strong>in</strong>g storm events because water is quickly routed through <strong>the</strong> soil/bedrock. Theprimary source <str<strong>on</strong>g>of</str<strong>on</strong>g> HCO3 is chemical wea<strong>the</strong>r<strong>in</strong>g <strong>in</strong>volv<strong>in</strong>g carb<strong>on</strong>ic acid (e.g., H 2 CO 3 + NaAlSi 3 O 8+ 7H 2 0= Na + + 3H 4 SiO 4 + Al(OH) 3(s) + HCO 3 - ). Rates <str<strong>on</strong>g>of</str<strong>on</strong>g> chemical wea<strong>the</strong>r<strong>in</strong>g are c<strong>on</strong>trolled byk<strong>in</strong>etics factors ra<strong>the</strong>r than equilibrium. Thus, <strong>the</strong> shorter <strong>the</strong> residence time <str<strong>on</strong>g>of</str<strong>on</strong>g> water <strong>in</strong> <strong>the</strong>soilibedrock c<strong>on</strong>t<strong>in</strong>uum, <strong>the</strong> less time for chemical wea<strong>the</strong>r<strong>in</strong>g and <strong>the</strong> lower HCO 3 c<strong>on</strong>centrati<strong>on</strong>s.Base cati<strong>on</strong>s (Ca. Mg, K, and Na). C<strong>on</strong>centrati<strong>on</strong>s <str<strong>on</strong>g>of</str<strong>on</strong>g> base cati<strong>on</strong>s <strong>in</strong> stream water resp<strong>on</strong>ded similarlybetween <strong>the</strong> reference and clearcut watersheds (Figs. 18-21). There was no appreciable difference <strong>in</strong>base cati<strong>on</strong> c<strong>on</strong>centrati<strong>on</strong>s between <strong>the</strong> clearcut and reference watersheds. Similarly, both watershedsshowed a similar diluti<strong>on</strong> effect dur<strong>in</strong>g high discharge events and ma<strong>in</strong>ta<strong>in</strong>ed a similar range <str<strong>on</strong>g>of</str<strong>on</strong>g> basecati<strong>on</strong> c<strong>on</strong>centrati<strong>on</strong>s. There is a dist<strong>in</strong>ct <strong>in</strong>crease <strong>in</strong> base cati<strong>on</strong> c<strong>on</strong>centrati<strong>on</strong>s follow<strong>in</strong>g <strong>the</strong> end <str<strong>on</strong>g>of</str<strong>on</strong>g><strong>the</strong> ra<strong>in</strong>y seas<strong>on</strong>. This is well illustrated by <strong>the</strong> progressive <strong>in</strong>crease <strong>in</strong> Ca and Mg c<strong>on</strong>centrati<strong>on</strong>s <strong>in</strong><strong>the</strong> clearcut watershed dur<strong>in</strong>g <strong>the</strong> June to January period. This resp<strong>on</strong>se is identical to that <str<strong>on</strong>g>of</str<strong>on</strong>g> HCO 3and Cl c<strong>on</strong>centrati<strong>on</strong>s s<strong>in</strong>ce each unit <str<strong>on</strong>g>of</str<strong>on</strong>g> positive charge must by paired with <strong>on</strong>e unit <str<strong>on</strong>g>of</str<strong>on</strong>g> negativecharge (i.e., electr<strong>on</strong>eutrality). It is <strong>the</strong> availability <str<strong>on</strong>g>of</str<strong>on</strong>g> mobile ani<strong>on</strong>s which dictates <strong>the</strong> c<strong>on</strong>centrati<strong>on</strong>s<str<strong>on</strong>g>of</str<strong>on</strong>g> cati<strong>on</strong>s <strong>in</strong> soluti<strong>on</strong> (Johns<strong>on</strong> and Cole, 1980). Thus, s<strong>in</strong>ce Cl and HCO 3 c<strong>on</strong>centrati<strong>on</strong>s are notdiluted by water <strong>in</strong>puts dur<strong>in</strong>g <strong>the</strong> summer m<strong>on</strong>ths, <strong>the</strong>ir higher c<strong>on</strong>centrati<strong>on</strong>s result <strong>in</strong> <strong>in</strong>creasedc<strong>on</strong>centrati<strong>on</strong>s <str<strong>on</strong>g>of</str<strong>on</strong>g> base cati<strong>on</strong>s <strong>in</strong> stream water.The identical resp<strong>on</strong>se between <strong>the</strong> clearcut and reference watersheds results from base cati<strong>on</strong>buffer<strong>in</strong>g by <strong>the</strong> large pool <str<strong>on</strong>g>of</str<strong>on</strong>g> exchangeable cati<strong>on</strong>s. The pool <str<strong>on</strong>g>of</str<strong>on</strong>g> exchangeable cati<strong>on</strong>s is relativelyhigh (Ca = 18, Mg = 5, K = 3 & Na = 1 Mg/ha; Fig. 4) and soil soluti<strong>on</strong>s obta<strong>in</strong> rapid equilibriumwith <strong>the</strong> exchangeable cati<strong>on</strong>s. Thus, <strong>the</strong> distributi<strong>on</strong> <str<strong>on</strong>g>of</str<strong>on</strong>g> cati<strong>on</strong>s is relatively fixed by equilibrium with<strong>the</strong> exchange complex while <strong>the</strong> c<strong>on</strong>centrati<strong>on</strong>s <str<strong>on</strong>g>of</str<strong>on</strong>g> base cati<strong>on</strong>s <strong>in</strong> soluti<strong>on</strong> are dictated by <strong>the</strong>c<strong>on</strong>centrati<strong>on</strong> <str<strong>on</strong>g>of</str<strong>on</strong>g> mobile ani<strong>on</strong>s.Silic<strong>on</strong>. Silic<strong>on</strong> is a useful element to m<strong>on</strong>itor <strong>in</strong> stream water s<strong>in</strong>ce its c<strong>on</strong>centrati<strong>on</strong>s are regulatedby m<strong>in</strong>eral equilibrium/k<strong>in</strong>etics with little <strong>in</strong>fluence from biological cycl<strong>in</strong>g. The range <str<strong>on</strong>g>of</str<strong>on</strong>g> Sic<strong>on</strong>centrati<strong>on</strong>s is similar between <strong>the</strong> clearcut and reference watersheds <strong>in</strong>dicat<strong>in</strong>g that similarmechanisms are resp<strong>on</strong>sible for regulat<strong>in</strong>g Si c<strong>on</strong>centrati<strong>on</strong>s <strong>in</strong> both watersheds and that <strong>the</strong>semechanisms are not appreciably affected by clearcutt<strong>in</strong>g (Fig. 22). At baseflow, Si c<strong>on</strong>centrati<strong>on</strong>s <strong>in</strong>both watersheds are with<strong>in</strong> a narrow range <str<strong>on</strong>g>of</str<strong>on</strong>g> 250 to 300 µM. This level probably reflects equilibriumwith silicate m<strong>in</strong>erals. The large decrease observed dur<strong>in</strong>g high discharge events reflectsdisequilibrium c<strong>on</strong>diti<strong>on</strong>s where Si dissoluti<strong>on</strong> k<strong>in</strong>etics or mix<strong>in</strong>g <str<strong>on</strong>g>of</str<strong>on</strong>g> waters from different hydrologicflowpaths regulate stream water Si c<strong>on</strong>centrati<strong>on</strong>s. As discussed with<strong>in</strong> <strong>the</strong> N03 secti<strong>on</strong>, we believethat <strong>the</strong> hydrologic flowpath is short-circuited through <strong>the</strong> upper soil horiz<strong>on</strong>s (above <strong>the</strong> argillichoriz<strong>on</strong>) dur<strong>in</strong>g storm events. This decreases <strong>the</strong> c<strong>on</strong>tact time between <strong>the</strong> soil soluti<strong>on</strong> and <strong>the</strong> soilm<strong>in</strong>erals which prevents atta<strong>in</strong>ment <str<strong>on</strong>g>of</str<strong>on</strong>g> equilibrium c<strong>on</strong>diti<strong>on</strong>s.60
Fig. 17.Streamwater bicarb<strong>on</strong>ate c<strong>on</strong>centrati<strong>on</strong>s (symbols) and streamflow (l<strong>in</strong>es) <strong>in</strong> <strong>the</strong> clearcut(KJE) and reference (MUN) watersheds <str<strong>on</strong>g>of</str<strong>on</strong>g> <strong>the</strong> North Fork, Caspar Creek. Fell<strong>in</strong>g wascompleted <strong>in</strong> <strong>the</strong> clearcut watershed <strong>in</strong> November 1989. Grab samples were collectedbiweekly dur<strong>in</strong>g periods <str<strong>on</strong>g>of</str<strong>on</strong>g> baseflow while autosamplers were used to collected samplesdur<strong>in</strong>g storm events.61
Fig. 18.Streamwater calcium c<strong>on</strong>centrati<strong>on</strong>s (symbols) and streamflow (l<strong>in</strong>es) <strong>in</strong> <strong>the</strong> clearcut (KJE)and reference (MUN) watersheds <str<strong>on</strong>g>of</str<strong>on</strong>g> <strong>the</strong> North Fork, Caspar Creek. Fell<strong>in</strong>g was completed <strong>in</strong><strong>the</strong> clearcut watershed <strong>in</strong> November 1989. Grab samples were collected biweekly dur<strong>in</strong>gperiods <str<strong>on</strong>g>of</str<strong>on</strong>g> baseflow while autosamplers were used to collected samples dur<strong>in</strong>g storm events.62
Fig. 19.Streamwater magnesium c<strong>on</strong>centrati<strong>on</strong>s (symbols) and streamflow (l<strong>in</strong>es) <strong>in</strong> <strong>the</strong> clearcut (KJE),and reference (MUN) watersheds <str<strong>on</strong>g>of</str<strong>on</strong>g> <strong>the</strong> North Fork, Caspar Creek. Fell<strong>in</strong>g was completed <strong>in</strong><strong>the</strong> clearcut watershed <strong>in</strong> November 1989. Grab samples were collected biweekly dur<strong>in</strong>gperiods <str<strong>on</strong>g>of</str<strong>on</strong>g> baseflow while autosamplers were used to collected samples dur<strong>in</strong>g storm events.63
Fig. 20.Streamwater potassium c<strong>on</strong>centrati<strong>on</strong>s (symbols) and streamflow (l<strong>in</strong>es) <strong>in</strong> <strong>the</strong> clearcut (KJE)and reference (MUN) watersheds <str<strong>on</strong>g>of</str<strong>on</strong>g> <strong>the</strong> North Fork, Caspar Creek. Fell<strong>in</strong>g was completed <strong>in</strong><strong>the</strong> clearcut watershed <strong>in</strong> November 1989. Grab samples were collected biweekly dur<strong>in</strong>gperiods <str<strong>on</strong>g>of</str<strong>on</strong>g> baseflow while autosamplers were used to collected samples dur<strong>in</strong>g storm events.64
Fig. 21.Streamwater sodium c<strong>on</strong>centrati<strong>on</strong>s (symbols) and streamflow (l<strong>in</strong>es) <strong>in</strong> <strong>the</strong> clearcut (KJE) andreference (MUN) watersheds <str<strong>on</strong>g>of</str<strong>on</strong>g> <strong>the</strong> North Fork, Caspar Creek. Fell<strong>in</strong>g was completed <strong>in</strong> <strong>the</strong>clearcut watershed <strong>in</strong> November 1989. Grab samples were collected biweekly dur<strong>in</strong>g periods <str<strong>on</strong>g>of</str<strong>on</strong>g>baseflow while autosamplers were used to collected samples dur<strong>in</strong>g storm events.65
Fig. 22Streamwater silic<strong>on</strong> c<strong>on</strong>centrati<strong>on</strong>s (symbols) and streamflow (l<strong>in</strong>es) <strong>in</strong> <strong>the</strong> clearcut (KJE) andreference (MUN) watersheds <str<strong>on</strong>g>of</str<strong>on</strong>g> <strong>the</strong> North Fork, Caspar Creek. Fell<strong>in</strong>g was completed <strong>in</strong> <strong>the</strong>clearcut watershed <strong>in</strong> November 1989. Grab samples were collected biweekly dur<strong>in</strong>g periods<str<strong>on</strong>g>of</str<strong>on</strong>g> baseflow while autosamplers were used to collected samples dur<strong>in</strong>g storm events.66
pH. Stream water pH values were generally c<strong>on</strong>sistent between <strong>the</strong> clearcut and reference watershedsand fell with<strong>in</strong> <strong>the</strong> range 6.5 to 7.5 (Fig. 23). The pH values were highest dur<strong>in</strong>g baseflow and decreasedby up to <strong>on</strong>e unit dur<strong>in</strong>g peak streamflows. As with Si c<strong>on</strong>centrati<strong>on</strong>s, <strong>the</strong> decrease <strong>in</strong> pH dur<strong>in</strong>g highflow probably reflects <strong>in</strong>complete neutralizati<strong>on</strong> due to decreased c<strong>on</strong>tact time with <strong>the</strong> soil. Thus, <strong>the</strong>shorter <strong>the</strong> residence time <str<strong>on</strong>g>of</str<strong>on</strong>g> water <strong>in</strong> <strong>the</strong> soil/bedrock c<strong>on</strong>t<strong>in</strong>uum, <strong>the</strong> less time for chemical wea<strong>the</strong>r<strong>in</strong>gand <strong>the</strong> lower <strong>the</strong> pH and c<strong>on</strong>centrati<strong>on</strong>s <str<strong>on</strong>g>of</str<strong>on</strong>g> HCO 3 and Si. Dur<strong>in</strong>g storm events, a large fracti<strong>on</strong> <str<strong>on</strong>g>of</str<strong>on</strong>g> wateris probably routed laterally through <strong>the</strong> soil (above <strong>the</strong> argillic or through macropores) which prevents<strong>in</strong>teracti<strong>on</strong> with <strong>the</strong> lower soil horiz<strong>on</strong>s and bedrock. The pH <str<strong>on</strong>g>of</str<strong>on</strong>g> <strong>the</strong> soil soluti<strong>on</strong> mov<strong>in</strong>g through <strong>the</strong>upper soil horiz<strong>on</strong>s is regulated primarily by cati<strong>on</strong> exchange reacti<strong>on</strong>s. In fact, <strong>the</strong> pH <str<strong>on</strong>g>of</str<strong>on</strong>g> stream water isgenerally with<strong>in</strong> <strong>the</strong> range found for soil soluti<strong>on</strong> pH values <strong>in</strong> <strong>the</strong> upper soil horiz<strong>on</strong>s (Table 22) and <strong>the</strong>solid-phase soil pH (Table 2).67
Fig. 23.Streamwater pH (symbols) and streamflow (l<strong>in</strong>es) <strong>in</strong> <strong>the</strong> clearcut (KJE) and reference (MUN)watersheds <str<strong>on</strong>g>of</str<strong>on</strong>g> <strong>the</strong> North Fork, Caspar Creek. Fell<strong>in</strong>g was completed <strong>in</strong> <strong>the</strong> clearcut watershed<strong>in</strong> November 1989. Grab samples were collected biweekly dur<strong>in</strong>g periods <str<strong>on</strong>g>of</str<strong>on</strong>g> baseflow whileautosamplers were used to collected samples dur<strong>in</strong>g storm events.68
Relati<strong>on</strong>ship between Solute C<strong>on</strong>centrati<strong>on</strong>s and Stream DischargeThe preced<strong>in</strong>g discussi<strong>on</strong> <strong>in</strong>dicated that solute c<strong>on</strong>centrati<strong>on</strong>s over <strong>the</strong> five-year m<strong>on</strong>itor<strong>in</strong>g periodwere str<strong>on</strong>gly affected by stream discharge dur<strong>in</strong>g a given storm event. Most solute c<strong>on</strong>centrati<strong>on</strong>sshowed a diluti<strong>on</strong> with <strong>in</strong>creas<strong>in</strong>g discharge, except for NO 3 which <strong>in</strong>creased with <strong>in</strong>creas<strong>in</strong>gdischarge. The relati<strong>on</strong>ship between solute c<strong>on</strong>centrati<strong>on</strong>s as a functi<strong>on</strong> <str<strong>on</strong>g>of</str<strong>on</strong>g> discharge was not asclearly <strong>in</strong>dicated when all <strong>the</strong> data from <strong>the</strong> five year study were comb<strong>in</strong>ed (Figs. 24-33). Somesolutes, such as Ca, Mg, Na, Cl, SO 4 and Si, showed a trend <str<strong>on</strong>g>of</str<strong>on</strong>g> decreas<strong>in</strong>g c<strong>on</strong>centrati<strong>on</strong>s with<strong>in</strong>creas<strong>in</strong>g streamflow rates; however, <strong>the</strong>re was appreciable scatter, especially <strong>in</strong> <strong>the</strong> 50 to 100 L/sflow range. In c<strong>on</strong>trast, pH, K, HCO 3 and NO 3 c<strong>on</strong>centrati<strong>on</strong>s showed little trend with streamdischarge rates. We believe that much <str<strong>on</strong>g>of</str<strong>on</strong>g> <strong>the</strong> scatter that occurs <strong>in</strong> <strong>the</strong> midflow range is due toseas<strong>on</strong>al changes <strong>in</strong> <strong>biogeochemical</strong> <strong>processes</strong>, such as <strong>the</strong> fall flush<strong>in</strong>g <str<strong>on</strong>g>of</str<strong>on</strong>g> solutes that haveaccumulated over <strong>the</strong> summer period with no active leach<strong>in</strong>g or periods <str<strong>on</strong>g>of</str<strong>on</strong>g> especially active plantuptake dur<strong>in</strong>g <strong>the</strong> spr<strong>in</strong>g.Relati<strong>on</strong>ship <str<strong>on</strong>g>of</str<strong>on</strong>g> Pipeflow Water Chemistry to Stream Water ChemistryPipeflow collected by <strong>the</strong> Caspar Creek Research Team appears to orig<strong>in</strong>ate from subsurfacemacropore flow from <strong>the</strong> adjacent uplands. There were dist<strong>in</strong>ct differences between <strong>the</strong> solutec<strong>on</strong>centrati<strong>on</strong>s <str<strong>on</strong>g>of</str<strong>on</strong>g> pipeflow and streamflow for several solutes suggest<strong>in</strong>g that <strong>the</strong> source <str<strong>on</strong>g>of</str<strong>on</strong>g> <strong>the</strong> twowaterflows was different. Water orig<strong>in</strong>at<strong>in</strong>g from different hydrologic flowpaths was previouslysuggested as an explanati<strong>on</strong> for <strong>in</strong>creased NO 3 c<strong>on</strong>centrati<strong>on</strong>s <strong>in</strong> stream water dur<strong>in</strong>g high flow,storm events.Am<strong>on</strong>g <strong>the</strong> base cati<strong>on</strong>s (Ca, Mg, K and Na), Ca c<strong>on</strong>centrati<strong>on</strong>s showed a general trend <str<strong>on</strong>g>of</str<strong>on</strong>g> be<strong>in</strong>glower <strong>in</strong> pipeflow than <strong>in</strong> stream water collected at <strong>the</strong> same time (Fig. 34). In c<strong>on</strong>trast, Kc<strong>on</strong>centrati<strong>on</strong>s showed a general trend <str<strong>on</strong>g>of</str<strong>on</strong>g> be<strong>in</strong>g higher <strong>in</strong> pipeflow than <strong>in</strong> stream water (Fig. 35).C<strong>on</strong>centrati<strong>on</strong>s <str<strong>on</strong>g>of</str<strong>on</strong>g> Mg and Na were generally similar between pipeflow and stream water dur<strong>in</strong>gstorm events; however, pipeflow c<strong>on</strong>centrati<strong>on</strong>s were greater dur<strong>in</strong>g baseflow (Fig. 36 & 37).Sodium c<strong>on</strong>centrati<strong>on</strong>s behaved differently between <strong>the</strong> clearcut and reference watersheds as Nac<strong>on</strong>centrati<strong>on</strong>s were higher <strong>in</strong> <strong>the</strong> pipeflow <strong>in</strong> <strong>the</strong> reference watershed but similar to stream water <strong>in</strong><strong>the</strong> clearcut watershed. The c<strong>on</strong>trast<strong>in</strong>g behavior <str<strong>on</strong>g>of</str<strong>on</strong>g> <strong>the</strong>se base cati<strong>on</strong>s could provide a valuable cluec<strong>on</strong>cern<strong>in</strong>g <strong>the</strong> dynamics <str<strong>on</strong>g>of</str<strong>on</strong>g> hydrologic flowpaths dur<strong>in</strong>g storm events. Additi<strong>on</strong>al <strong>in</strong>formati<strong>on</strong>c<strong>on</strong>cern<strong>in</strong>g base cati<strong>on</strong> c<strong>on</strong>centrati<strong>on</strong>s <strong>in</strong> potential end-member water sources would facilitate <strong>the</strong> use<str<strong>on</strong>g>of</str<strong>on</strong>g> <strong>the</strong>se data <strong>in</strong> end-member mix<strong>in</strong>g models. For example, water orig<strong>in</strong>at<strong>in</strong>g from deepergroundwater that is <strong>in</strong> c<strong>on</strong>tact with relatively unwea<strong>the</strong>red bedrock may c<strong>on</strong>ta<strong>in</strong> elevated Cac<strong>on</strong>centrati<strong>on</strong>s due to <strong>the</strong> dissoluti<strong>on</strong> <str<strong>on</strong>g>of</str<strong>on</strong>g> calcium carb<strong>on</strong>ate from <strong>the</strong> mar<strong>in</strong>e bedrock. Thus, waterorig<strong>in</strong>at<strong>in</strong>g from deeper groundwater sources may be Ca-enriched expla<strong>in</strong><strong>in</strong>g, <strong>in</strong> part, why Cac<strong>on</strong>centrati<strong>on</strong>s are greater <strong>in</strong> stream water at base flow. In c<strong>on</strong>trast, K is str<strong>on</strong>gly cycled by <strong>the</strong>vegetati<strong>on</strong> result<strong>in</strong>g <strong>in</strong> <strong>the</strong> highest K c<strong>on</strong>centrati<strong>on</strong>s <strong>in</strong> <strong>the</strong> upper soil horiz<strong>on</strong>s (Fig. 10; Table 2). Ifpipeflow were to orig<strong>in</strong>ate from preferential flowpaths above <strong>the</strong> clay-rich argillic horiz<strong>on</strong>, <strong>the</strong>soluti<strong>on</strong>s would be expected to have elevated K c<strong>on</strong>centrati<strong>on</strong>s relative to soluti<strong>on</strong>s orig<strong>in</strong>at<strong>in</strong>g fromdeeper groundwater sources.69
Fig. 24.Relati<strong>on</strong>ship between stream water pH and stream discharge for <strong>the</strong> reference (MUN) andclearcut (KJE) watersheds dur<strong>in</strong>g <strong>the</strong> five year study period.70
Fig. 25.Relati<strong>on</strong>ship between stream water calcium c<strong>on</strong>centrati<strong>on</strong>s and stream discharge for <strong>the</strong>reference (MUN) and clearcut (KJE) watersheds dur<strong>in</strong>g <strong>the</strong> five year study period.71
Fig. 26.Relati<strong>on</strong>ship between stream water magnesium c<strong>on</strong>centrati<strong>on</strong>s and stream discharge for<strong>the</strong> reference (MUN) and clearcut (KJE) watersheds dur<strong>in</strong>g <strong>the</strong> five year study period.72
Fig. 27.Relati<strong>on</strong>ship between stream water potassium c<strong>on</strong>centrati<strong>on</strong>s and stream discharge for <strong>the</strong>reference (MUN) and clearcut (KJE) watersheds dur<strong>in</strong>g <strong>the</strong> five year study period.73
Fig. 28.Relati<strong>on</strong>ship between stream water sodium c<strong>on</strong>centrati<strong>on</strong>s and stream discharge for <strong>the</strong>reference (MUN) and clearcut (KJE) watersheds dur<strong>in</strong>g <strong>the</strong> five year study period.74
Fig. 29.Relati<strong>on</strong>ship between stream water chloride c<strong>on</strong>centrati<strong>on</strong>s and stream discharge for <strong>the</strong>reference (MUN) and clearcut (KJE) watersheds dur<strong>in</strong>g <strong>the</strong> five year study period.75
Fig. 30.Relati<strong>on</strong>ship between stream water nitrate c<strong>on</strong>centrati<strong>on</strong>s and stream discharge for <strong>the</strong>reference (MUN) and clearcut (KJE) watersheds dur<strong>in</strong>g <strong>the</strong> five year study period.76
Fig. 31.Relati<strong>on</strong>ship between strearn water sulfate c<strong>on</strong>centrati<strong>on</strong>s and stream discharge for <strong>the</strong>reference (MW and clearcut (KJE) watersheds dur<strong>in</strong>g <strong>the</strong> five year study period.77
Fig. 32.Relati<strong>on</strong>ship between stream water bicarb<strong>on</strong>ate c<strong>on</strong>centrati<strong>on</strong>s and stream discharge for <strong>the</strong>reference (MUN) and clearcut (KJE) watersheds dur<strong>in</strong>g <strong>the</strong> five year study period.78
Fig. 33.Relati<strong>on</strong>ship between stream water silic<strong>on</strong> c<strong>on</strong>centrati<strong>on</strong>s and stream discharge for <strong>the</strong>reference (MUN) and clearcut (KJE) watersheds dur<strong>in</strong>g <strong>the</strong> five year study period.79
Fig. 34.Comparis<strong>on</strong> <str<strong>on</strong>g>of</str<strong>on</strong>g> stream water and pipeflow calcium c<strong>on</strong>centrati<strong>on</strong>s for <strong>the</strong> reference(MUN) and clearcut (KJE) watersheds dur<strong>in</strong>g <strong>the</strong> 1991 - 1993 water years.80
Fig. 35.Comparis<strong>on</strong> <str<strong>on</strong>g>of</str<strong>on</strong>g> stream water and pipeflow potassium c<strong>on</strong>centrati<strong>on</strong>s for <strong>the</strong> reference(MUN) and clearcut (KJE) watersheds dur<strong>in</strong>g <strong>the</strong> 1991 - 1993 water years.81
Fig. 36.Comparis<strong>on</strong> <str<strong>on</strong>g>of</str<strong>on</strong>g> stream water and pipeflow magnesium c<strong>on</strong>centrati<strong>on</strong>s for <strong>the</strong> reference(MUN) and clearcut (KJE) watersheds dur<strong>in</strong>g <strong>the</strong> 1991 - 1993 water years.82
Fig. 37.Comparis<strong>on</strong> <str<strong>on</strong>g>of</str<strong>on</strong>g> stream water and pipeflow sodium c<strong>on</strong>centrati<strong>on</strong>s for <strong>the</strong>reference(MUN) and clearcut (KJE) watersheds dur<strong>in</strong>g <strong>the</strong> 1991 - 1993 water years.83
Chloride c<strong>on</strong>centrati<strong>on</strong>s <strong>in</strong> pipeflow and stream water <strong>in</strong> <strong>the</strong> clearcut watershed (KJE) were similar dur<strong>in</strong>gstorm events, but were nearly a factor <str<strong>on</strong>g>of</str<strong>on</strong>g> two greater <strong>in</strong> pipeflow dur<strong>in</strong>g baseflow (Fig. 38). In c<strong>on</strong>trast,chloride c<strong>on</strong>centrati<strong>on</strong>s were always greater <strong>in</strong> <strong>the</strong> pipeflow than <strong>in</strong> stream waters with<strong>in</strong> <strong>the</strong> referencewatershed. C<strong>on</strong>centrati<strong>on</strong>s <str<strong>on</strong>g>of</str<strong>on</strong>g> SO 4 were similar for pipeflow and stream waters <strong>in</strong> both watersheds (Fig.39). Perhaps <strong>the</strong> most <strong>in</strong>formative difference between pipeflow and stream water chemistry occurs forN03. C<strong>on</strong>centrati<strong>on</strong>s <str<strong>on</strong>g>of</str<strong>on</strong>g> NO 3 <strong>in</strong> pipeflow generally exceeded those <strong>in</strong> stream water with<strong>in</strong> <strong>the</strong> clearcutwatershed (Fig. 40). In c<strong>on</strong>trast, <strong>the</strong>re was virtually no NO 3 <strong>in</strong> pipeflow, stream water, or soil soluti<strong>on</strong>s <strong>in</strong><strong>the</strong> reference watershed. This behavior <strong>in</strong>dicates that pipeflow orig<strong>in</strong>ates from a nitrate-rich water sourcethat is str<strong>on</strong>gly affected by clearcutt<strong>in</strong>g. The fact that NO 3 <strong>in</strong> pipeflow is found <strong>on</strong>ly <strong>in</strong> <strong>the</strong> clearcutsuggests that <strong>the</strong> pipeflow orig<strong>in</strong>ates largely from <strong>the</strong> biologically active soil z<strong>on</strong>e. Our data suggests thata primary source <str<strong>on</strong>g>of</str<strong>on</strong>g> <strong>the</strong> pipeflow water is from <strong>the</strong> upper soil horiz<strong>on</strong>s (above <strong>the</strong> argillic horiz<strong>on</strong>) whichis <strong>the</strong> <strong>on</strong>ly water source that c<strong>on</strong>ta<strong>in</strong>s appreciable c<strong>on</strong>centrati<strong>on</strong>s <str<strong>on</strong>g>of</str<strong>on</strong>g> NO 3 (Fig. 11).C<strong>on</strong>centrati<strong>on</strong>s <str<strong>on</strong>g>of</str<strong>on</strong>g> Si <strong>in</strong> pipeflow and stream water were similar dur<strong>in</strong>g most storm event; however, Sic<strong>on</strong>centrati<strong>on</strong>s were greater <strong>in</strong> pipeflow dur<strong>in</strong>g baseflow (Fig. 41). This behavior dur<strong>in</strong>g baseflowsuggests that <strong>the</strong> pipeflow water orig<strong>in</strong>ates from a more Si-rich envir<strong>on</strong>ment s<strong>in</strong>ce k<strong>in</strong>etic limitati<strong>on</strong>swould not be a primary factor c<strong>on</strong>troll<strong>in</strong>g Si c<strong>on</strong>centrati<strong>on</strong>s dur<strong>in</strong>g baseflow c<strong>on</strong>diti<strong>on</strong>s. Aga<strong>in</strong> it would benecessary to know whe<strong>the</strong>r <strong>the</strong> soil z<strong>on</strong>e or <strong>the</strong> geologic material supports a greater Si solubility. The Sic<strong>on</strong>centrati<strong>on</strong>s collected <strong>in</strong> our soil soluti<strong>on</strong> study were very dilute (
12001000800600400200012001000800600400200 O J A J O J A J O1991 1992 1993Fig. 38. Comparis<strong>on</strong> <str<strong>on</strong>g>of</str<strong>on</strong>g> stream water and pipeflow chloride c<strong>on</strong>centrati<strong>on</strong>s for <strong>the</strong> reference(MUN) and clearcut (KJE) watersheds dur<strong>in</strong>g <strong>the</strong> 1991 - 1993 water years.85
12510075502501007550250O J A J O J A J O1991 1992 1993Fig. 39. Comparis<strong>on</strong> <str<strong>on</strong>g>of</str<strong>on</strong>g> stream water and pipeflow sulfate c<strong>on</strong>centrati<strong>on</strong>s for <strong>the</strong> reference(MUN) and clearcut (KJE) watersheds dur<strong>in</strong>g <strong>the</strong> 1991 - 1993 water years.86
Fig. 40.Comparis<strong>on</strong> <str<strong>on</strong>g>of</str<strong>on</strong>g> stream water and pipeflow nitrate c<strong>on</strong>centrati<strong>on</strong>s for <strong>the</strong> reference(MUN) and clearcut (KJE) watersheds dur<strong>in</strong>g <strong>the</strong> 1991 - 1993 water years.87
Fig. 41.Comparis<strong>on</strong> <str<strong>on</strong>g>of</str<strong>on</strong>g> stream water and pipeflow silic<strong>on</strong> c<strong>on</strong>centrati<strong>on</strong>s for <strong>the</strong> reference (MUN)and clearcut (KJE) watersheds dur<strong>in</strong>g <strong>the</strong> 1991 - 1993 water years.88
1991 1992 1993Fig. 42.Comparis<strong>on</strong> <str<strong>on</strong>g>of</str<strong>on</strong>g> stream water and pipeflow pH values for <strong>the</strong> reference (MUN) and clearcut(KJE) watersheds dur<strong>in</strong>g <strong>the</strong> 1991 - 1993 water years.89
Nutrient Fluxes <strong>in</strong> Stream WaterWhile elemental c<strong>on</strong>centrati<strong>on</strong>s <strong>in</strong> stream water give a good idea <str<strong>on</strong>g>of</str<strong>on</strong>g> <strong>processes</strong> regulat<strong>in</strong>g stream watersolute c<strong>on</strong>centrati<strong>on</strong>s, <strong>the</strong> most important c<strong>on</strong>siderati<strong>on</strong> from a nutrient cycl<strong>in</strong>g perspective is <strong>the</strong> nutrientflux (kg/ha/yr) associated with streamflow. Nutrient fluxes are calculated by comb<strong>in</strong><strong>in</strong>g stream discharge(L/s) with nutrient c<strong>on</strong>centrati<strong>on</strong>s (mg/L). S<strong>in</strong>ce <strong>the</strong> water yield between <strong>the</strong> clearcut and referencewatersheds differ appreciably (Keppeler, pers<strong>on</strong>al communicati<strong>on</strong>), what appears to be small differences<strong>in</strong> stream water nutrient c<strong>on</strong>centrati<strong>on</strong>s result <strong>in</strong> much larger differences <strong>in</strong> nutrient fluxes.Nutrient fluxes <strong>in</strong> precipitati<strong>on</strong> are shown for <strong>the</strong> five years <str<strong>on</strong>g>of</str<strong>on</strong>g> <strong>the</strong> study <strong>in</strong> Table 24. The precipitati<strong>on</strong>fluxes are regulated to a large degree by <strong>the</strong> precipitati<strong>on</strong> amount for a given year. Precipitati<strong>on</strong> fromnearby Fort Bragg dur<strong>in</strong>g <strong>the</strong> study period ranged from a low <str<strong>on</strong>g>of</str<strong>on</strong>g> 78 cm dur<strong>in</strong>g <strong>the</strong> 1993-94 water year to ahigh <str<strong>on</strong>g>of</str<strong>on</strong>g> 148 cm dur<strong>in</strong>g <strong>the</strong> 1994-95 water year (Table 24). The highest elemental <strong>in</strong>puts (2.6 - 23 kg/ha/yr)occur for Cl, Na, Ca and Mg reflect<strong>in</strong>g <strong>the</strong> close proximity to <strong>the</strong> ocean, which is <strong>the</strong> primary source <str<strong>on</strong>g>of</str<strong>on</strong>g><strong>the</strong>se c<strong>on</strong>stituents. Lesser fluxes (1-2.6 kg/ha/yr) <str<strong>on</strong>g>of</str<strong>on</strong>g> K and S occur, followed by very low <strong>in</strong>puts ( Mg > K. Fluxes <str<strong>on</strong>g>of</str<strong>on</strong>g> Na, Ca,Mg and K from <strong>the</strong> clearcut watershed were 2.4, 2.5, 2.6 and 2.2 times greater than those from <strong>the</strong>reference watershed, respectively. The relative uniformity <strong>in</strong> base cati<strong>on</strong> fluxes between <strong>the</strong> twowatersheds is c<strong>on</strong>sistent with <strong>the</strong> fact that <strong>the</strong> distributi<strong>on</strong> <str<strong>on</strong>g>of</str<strong>on</strong>g> base c<strong>on</strong>centrati<strong>on</strong>s <strong>in</strong> stream water is largelyregulated by equilibrium with exchangeable cati<strong>on</strong> c<strong>on</strong>centrati<strong>on</strong>s. These base cati<strong>on</strong> fluxes are alsoc<strong>on</strong>sistent with that <str<strong>on</strong>g>of</str<strong>on</strong>g> Si which showed a 2.4 times greater flux from <strong>the</strong> clearcut watershed.90
Table 24. Nutrient fluxes c<strong>on</strong>ta<strong>in</strong>ed <strong>in</strong> precipitati<strong>on</strong> and stream water from <strong>the</strong> reference (MUN) and clearcut (KJE) watersheds for <strong>the</strong> fiveyear study period.Watershed Water year N Cl P S Na K Mg Ca Si PPTElemental Flux (kg/ha/yr)PPT 1991-92 0.22 14.3 0.01 1.14 9.2 1.31 2.61 4.82 0.56 83.1PPT 1992-93 0.4 22.6 0.05 1.86 14.2 1.33 3.85 6.25 1.13 130.9PPT 1993-94 0.36 14.5 0.04 1.07 9 1.09 2.78 6.37 0.13 78.3PPT 1994-95 0.15 23.5
Similarly, <strong>the</strong>se elemental ratios are <strong>on</strong> <strong>the</strong> same order <str<strong>on</strong>g>of</str<strong>on</strong>g> magnitude as that <str<strong>on</strong>g>of</str<strong>on</strong>g> Cl which is a major ani<strong>on</strong>regulat<strong>in</strong>g <strong>the</strong> leach<strong>in</strong>g <str<strong>on</strong>g>of</str<strong>on</strong>g> base cati<strong>on</strong>s from <strong>the</strong> soil. These ratios could be compared to <strong>the</strong> differences <strong>in</strong>water flux between <strong>the</strong> clearcut and reference watersheds to determ<strong>in</strong>e <strong>the</strong> importance <str<strong>on</strong>g>of</str<strong>on</strong>g> differences <strong>in</strong>water fluxes <strong>in</strong> regulat<strong>in</strong>g nutrient fluxes between <strong>the</strong> two watersheds. Data for this analysis are availablefrom <strong>the</strong> Caspar Creek Research Team.Cumulative <str<strong>on</strong>g>Effects</str<strong>on</strong>g> <str<strong>on</strong>g>of</str<strong>on</strong>g> Harvest<strong>in</strong>g <strong>on</strong> Stream Water QualityThe distance to which a <str<strong>on</strong>g>harvest</str<strong>on</strong>g><strong>in</strong>g effect (i.e., change <strong>in</strong> water quality) is observed downstream from <strong>the</strong><str<strong>on</strong>g>harvest</str<strong>on</strong>g>ed catchment is a very important attribute <str<strong>on</strong>g>of</str<strong>on</strong>g> watershed biogeochemistry. Some impacts may beobserved well downstream <str<strong>on</strong>g>of</str<strong>on</strong>g> <strong>the</strong> actual disturbance while o<strong>the</strong>r impacts may not be detectable at alldownstream <str<strong>on</strong>g>of</str<strong>on</strong>g> <strong>the</strong> disturbance. Figures 43 to 51 show solute c<strong>on</strong>centrati<strong>on</strong>s <strong>in</strong> headwater catchments andat sampl<strong>in</strong>g po<strong>in</strong>ts al<strong>on</strong>g <strong>the</strong> North Fork <str<strong>on</strong>g>of</str<strong>on</strong>g> Caspar Creek. Sampl<strong>in</strong>g po<strong>in</strong>ts HEN, IVE and MUN occur at<strong>the</strong> base <str<strong>on</strong>g>of</str<strong>on</strong>g> headwater catchments that were not <str<strong>on</strong>g>harvest</str<strong>on</strong>g>ed and <strong>the</strong>refore serve as reference watersheds(Fig. 3). Sampl<strong>in</strong>g po<strong>in</strong>ts BAN, CAR, EAG, GIB and KJE occur at <strong>the</strong> base <str<strong>on</strong>g>of</str<strong>on</strong>g> headwater catchments thatwere clearcut <str<strong>on</strong>g>harvest</str<strong>on</strong>g>ed. Sampl<strong>in</strong>g po<strong>in</strong>ts ARF, FLY, LAN and JOH occur al<strong>on</strong>g <strong>the</strong> ma<strong>in</strong> trunk <str<strong>on</strong>g>of</str<strong>on</strong>g> <strong>the</strong>North Fork and are listed from downstream to upstream positi<strong>on</strong>s, respectively. Sampl<strong>in</strong>g po<strong>in</strong>t DOLoccurs below <strong>the</strong> EAG gaug<strong>in</strong>g stati<strong>on</strong> just before this tributary enters <strong>the</strong> North Fork.There was c<strong>on</strong>siderable variability am<strong>on</strong>g <strong>the</strong> three reference watersheds (HEN, IVE and MUN) for <strong>the</strong>follow<strong>in</strong>g solutes: Na, Mg, Ca, Cl, SO 4 and Si (Figs. 43 - 48). Thus, without several years <str<strong>on</strong>g>of</str<strong>on</strong>g> pre<str<strong>on</strong>g>harvest</str<strong>on</strong>g>data, it is not possible to determ<strong>in</strong>e how much <str<strong>on</strong>g>of</str<strong>on</strong>g> <strong>the</strong> solute variability is due to <str<strong>on</strong>g>harvest</str<strong>on</strong>g><strong>in</strong>g impacts ra<strong>the</strong>rthan spatial variability between watersheds. It was previously shown that <strong>the</strong> most obvious effect <str<strong>on</strong>g>of</str<strong>on</strong>g><str<strong>on</strong>g>harvest</str<strong>on</strong>g><strong>in</strong>g was elevated NO 3 c<strong>on</strong>centrati<strong>on</strong>s <strong>in</strong> stream water. All three reference watersheds showedvirtually no detectable c<strong>on</strong>centrati<strong>on</strong>s <str<strong>on</strong>g>of</str<strong>on</strong>g> nitrate <strong>in</strong>dicat<strong>in</strong>g that <strong>the</strong> nitrogen cycle is tightly closed with<strong>in</strong><strong>the</strong> sec<strong>on</strong>d growth <str<strong>on</strong>g>forest</str<strong>on</strong>g>s (Fig. 49). Stream water dra<strong>in</strong><strong>in</strong>g <strong>the</strong> clearcut watersheds (BAN, CAR, EAG,GIB, and KJE) showed enhanced NO 3 c<strong>on</strong>centrati<strong>on</strong>s with a maximum c<strong>on</strong>centrati<strong>on</strong> <str<strong>on</strong>g>of</str<strong>on</strong>g> about 70 µM <strong>in</strong>watershed EAG (Appendix I). Nitrate c<strong>on</strong>centrati<strong>on</strong>s were quickly reduced downstream from <strong>the</strong><str<strong>on</strong>g>harvest</str<strong>on</strong>g>ed watersheds. For example, sampl<strong>in</strong>g po<strong>in</strong>t JOH occurs just downstream from <strong>the</strong> c<strong>on</strong>fluence <str<strong>on</strong>g>of</str<strong>on</strong>g>watersheds MUN and KJE and shows much lower NO 3 c<strong>on</strong>centrati<strong>on</strong>s than that <str<strong>on</strong>g>of</str<strong>on</strong>g> <strong>the</strong> clearcut watershed(KJE). Sampl<strong>in</strong>g po<strong>in</strong>t LAN occurs at a po<strong>in</strong>t downstream <str<strong>on</strong>g>of</str<strong>on</strong>g> watersheds MUN, KJE, JOH, IVE and HENand shows even lower NO 3 c<strong>on</strong>centrati<strong>on</strong>s. Similarly, sampl<strong>in</strong>g po<strong>in</strong>t DOL is immediately downstream <str<strong>on</strong>g>of</str<strong>on</strong>g><strong>the</strong> clearcut watershed EAG and shows a large decrease <strong>in</strong> NO 3 c<strong>on</strong>centrati<strong>on</strong>s relative to that leav<strong>in</strong>gEAG. At <strong>the</strong> sampl<strong>in</strong>g po<strong>in</strong>t fur<strong>the</strong>st downstream (ARF), NO 3 c<strong>on</strong>centrati<strong>on</strong>s are generally
WatershedFig. 43. Box and whisker plots <strong>in</strong>dicat<strong>in</strong>g range <str<strong>on</strong>g>of</str<strong>on</strong>g> stream water pH values <strong>in</strong> <strong>the</strong> varioussubwatersheds <str<strong>on</strong>g>of</str<strong>on</strong>g> <strong>the</strong> North Fork, Caspar Creek watershed for <strong>the</strong> period April, 1993 to June,1996. The 10 th , 25 th , 75 th and 90 th percentiles are displayed al<strong>on</strong>g with <strong>the</strong> mean l<strong>in</strong>e with<strong>in</strong>box and data (circles) outside <strong>the</strong> 10 th and 90 th percentiles. Reference watersheds: H=HEN,I=IVE and M=MUN; clearcut watersheds: B=BAN (1991), C=CAR (1991), E=EAG (1991),G=GIB (1991), K=KJE (1989); o<strong>the</strong>r sampl<strong>in</strong>g po<strong>in</strong>ts: A=ARF, D=DOL, F=FLY, J=JOH andL=LAN.93
WatershedFig. 44.Box and whisker plots <strong>in</strong>dicat<strong>in</strong>g range <str<strong>on</strong>g>of</str<strong>on</strong>g> stream water calcium c<strong>on</strong>centrati<strong>on</strong>s <strong>in</strong> <strong>the</strong> varioussubwatersheds <str<strong>on</strong>g>of</str<strong>on</strong>g> <strong>the</strong> North Fork, Caspar Creek watershed for <strong>the</strong> period April, 1993 to June,1996. The 10 th , 25 th , 75 th and 90 th percentiles are displayed al<strong>on</strong>g with <strong>the</strong> mean l<strong>in</strong>e with<strong>in</strong>box and data (circles) outside <strong>the</strong> 10 th and 90 th percentiles. Reference watersheds: H=HEN,I=IVE and M=MUN; clearcut watersheds: B=BAN (1991), C=CAR (1991), E=EAG (1991),G=GIB (1991), K=KJE (1989); o<strong>the</strong>r sampl<strong>in</strong>g po<strong>in</strong>ts: A=ARF, D=DOL, F=FLY, J=JOH andL=LAN.94
WatershedFig. 45.Box and whisker plots <strong>in</strong>dicat<strong>in</strong>g range <str<strong>on</strong>g>of</str<strong>on</strong>g> stream water magnesium c<strong>on</strong>centrati<strong>on</strong>s <strong>in</strong> <strong>the</strong>various subwatersheds <str<strong>on</strong>g>of</str<strong>on</strong>g> <strong>the</strong> North Fork, Caspar Creek watershed for <strong>the</strong> period April, 1993to June, 1996. The 10 th , 25 th , 75 th and 90 th percentiles are displayed al<strong>on</strong>g with <strong>the</strong> mean l<strong>in</strong>ewith<strong>in</strong> box and data (circles) outside <strong>the</strong> 10 th and 90 th percentiles. Reference watersheds:H=HEN, I=IVE and M=MUN; clearcut watersheds: B=BAN (1991), C=CAR (1991),E=EAG (1991), G=GIB (1991), K=KJE (1989); o<strong>the</strong>r sampl<strong>in</strong>g po<strong>in</strong>ts: A=ARF, D=DOL,F=FLY, J=JOH and L=LAN.95
WatershedFig. 46.Box and whisker plots <strong>in</strong>dicat<strong>in</strong>g range <str<strong>on</strong>g>of</str<strong>on</strong>g> stream water potassium c<strong>on</strong>centrati<strong>on</strong>s <strong>in</strong> <strong>the</strong>various subwatersheds <str<strong>on</strong>g>of</str<strong>on</strong>g> <strong>the</strong> North Fork, Caspar Creek watershed for <strong>the</strong> period April, 1993to June, 1996. The 10 th , 25 th , 75 th and 90 th percentiles are displayed al<strong>on</strong>g with <strong>the</strong> mean l<strong>in</strong>ewith<strong>in</strong> box and data (circles) outside <strong>the</strong> 10 th and 90 th percentiles. Reference watersheds:H=HEN, I=IVE and M=MUN; clearcut watersheds: B=BAN (1991), C=CAR (1991),E=EAG (1991), G=GIB (1991), K=KJE (1989); o<strong>the</strong>r sampl<strong>in</strong>g po<strong>in</strong>ts: A=ARF, D=DOL,F=FLY, J=JOH and L=LAN.96
WatershedFig. 47.Box and whisker plots <strong>in</strong>dicat<strong>in</strong>g range <str<strong>on</strong>g>of</str<strong>on</strong>g> stream water sodium c<strong>on</strong>centrati<strong>on</strong>s <strong>in</strong> <strong>the</strong> varioussubwatersheds <str<strong>on</strong>g>of</str<strong>on</strong>g> <strong>the</strong> North Fork, Caspar Creek watershed for <strong>the</strong> period April, 1993 to June,1996. The 10 th , 25 th , 75 th and 90 th percentiles are displayed al<strong>on</strong>g with <strong>the</strong> mean l<strong>in</strong>e with<strong>in</strong>box and data (circles) outside <strong>the</strong> 10 th and 90 th percentiles. Reference watersheds: H=HEN,I=IVE and M=MUN; clearcut watersheds: B=BAN (1991), C=CAR (1991), E=EAG (1991),G=GIB (1991), K=KJE (1989); o<strong>the</strong>r sampl<strong>in</strong>g po<strong>in</strong>ts: A=ARF, D=DOL, F=FLY, J=JOH andL=LAN.97
WatershedFig. 48.Box and whisker plots <strong>in</strong>dicat<strong>in</strong>g range <str<strong>on</strong>g>of</str<strong>on</strong>g> stream water chloride c<strong>on</strong>centrati<strong>on</strong>s <strong>in</strong> <strong>the</strong> varioussubwatersheds <str<strong>on</strong>g>of</str<strong>on</strong>g> <strong>the</strong> North Fork, Caspar Creek watershed for <strong>the</strong> period April, 1993 to June,1996. The 10 th , 25 th , 75 th and 90 th percentiles are displayed al<strong>on</strong>g with <strong>the</strong> mean l<strong>in</strong>e with<strong>in</strong>box and data (circles) outside <strong>the</strong> 10 th and 90 th percentiles. Reference watersheds: H=HEN,I=IVE and M=MUN; clearcut watersheds: B=BAN (1991), C=CAR (1991), E=EAG (1991),G=GIB (1991), K=KJE (1989); o<strong>the</strong>r sampl<strong>in</strong>g po<strong>in</strong>ts: A=ARF, D=DOL, F=FLY, J=JOH andL=LAN.98
WatershedFig. 49.Box and whisker plots <strong>in</strong>dicat<strong>in</strong>g range <str<strong>on</strong>g>of</str<strong>on</strong>g> stream water nitrate c<strong>on</strong>centrati<strong>on</strong>s <strong>in</strong> <strong>the</strong> varioussubwatersheds <str<strong>on</strong>g>of</str<strong>on</strong>g> <strong>the</strong> North Fork, Caspar Creek watershed for <strong>the</strong> period April, 1993 to June,1996. The 10 th , 25 th , 75 th and 90 th percentiles are displayed al<strong>on</strong>g with <strong>the</strong> mean l<strong>in</strong>e with<strong>in</strong>box and data (circles) outside <strong>the</strong> 10 th and 90 th percentiles. Reference watersheds: H=HEN,I=IVE and M=MUN; clearcut watersheds: B=BAN (1991), C=CAR (1991), E=EAG (1991),G=GIB (1991), K=KJE (1989); o<strong>the</strong>r sampl<strong>in</strong>g po<strong>in</strong>ts: A=ARF, D=DOL, F=FLY, J=JOH andL=LAN.99
WatershedFig. 50.Box and whisker plots <strong>in</strong>dicat<strong>in</strong>g range <str<strong>on</strong>g>of</str<strong>on</strong>g> stream water sulfate c<strong>on</strong>centrati<strong>on</strong>s <strong>in</strong> <strong>the</strong> varioussubwatersheds <str<strong>on</strong>g>of</str<strong>on</strong>g> <strong>the</strong> North Fork, Caspar Creek watershed for <strong>the</strong> period April, 1993 to June,1996. The 10 th , 25 th , 75 th and 90 th percentiles are displayed al<strong>on</strong>g with <strong>the</strong> mean l<strong>in</strong>e with<strong>in</strong>box and data (circles) outside <strong>the</strong> 10 th and 90 th percentiles. Reference watersheds: H=HEN,I=IVE and M=MUN; clearcut watersheds: B=BAN (1991), C=CAR (1991), E=EAG (1991),G=GIB (1991), K=KJE (1989); o<strong>the</strong>r sampl<strong>in</strong>g po<strong>in</strong>ts: A=ARF, D=DOL, F=FLY, J=JOH andL=LAN.100
WatershedFig. 51.Box and whisker plots <strong>in</strong>dicat<strong>in</strong>g range <str<strong>on</strong>g>of</str<strong>on</strong>g> stream water silic<strong>on</strong> c<strong>on</strong>centrati<strong>on</strong>s <strong>in</strong> <strong>the</strong> varioussubwatersheds <str<strong>on</strong>g>of</str<strong>on</strong>g> <strong>the</strong> North Fork, Caspar Creek watershed for <strong>the</strong> period April, 1993 to June,1996. The 10 th , 25 th 75 th and 90 th percentiles are displayed al<strong>on</strong>g with <strong>the</strong> mean l<strong>in</strong>e with<strong>in</strong>box and data (circles) outside <strong>the</strong> 10 th and 90 th percentiles. Reference watersheds: H=HEN,I=IVE and M=MUN; clearcut watersheds: B=BAN (1991), C=CAR (1991), E=EAG (1991),G=GIB (1991), K=KJE (1989); o<strong>the</strong>r sampl<strong>in</strong>g po<strong>in</strong>ts: A=ARF, D=DOL, F=FLY, J=JOH andL=LAN.101
With <strong>the</strong> excepti<strong>on</strong> <str<strong>on</strong>g>of</str<strong>on</strong>g> <strong>in</strong>creased NO 3 c<strong>on</strong>centrati<strong>on</strong>s, <strong>the</strong>re was no o<strong>the</strong>r obvious impact <str<strong>on</strong>g>of</str<strong>on</strong>g> <str<strong>on</strong>g>harvest</str<strong>on</strong>g><strong>in</strong>g <strong>on</strong>stream water solute c<strong>on</strong>centrati<strong>on</strong>s. Ano<strong>the</strong>r trend worth not<strong>in</strong>g is <strong>the</strong> apparent <strong>in</strong>crease <strong>in</strong> K, Mg, Ca andSO 4 c<strong>on</strong>centrati<strong>on</strong>s with decreas<strong>in</strong>g elevati<strong>on</strong>s with<strong>in</strong> <strong>the</strong> watershed (MUN --> ARF) (Figs. 50, 44, 45 &47). No obvious explanati<strong>on</strong> for this trend is apparent. The pH values are relatively uniform across <strong>the</strong>various watersheds (Fig. 51) while Na, Cl and Si c<strong>on</strong>centrati<strong>on</strong>s (Figs. 43, 46 & 48) are relatively uniformwith a few outly<strong>in</strong>g values occurr<strong>in</strong>g <strong>in</strong> some watersheds.Suspended SedimentsSuspended sediment (>0.4 µm) is <str<strong>on</strong>g>of</str<strong>on</strong>g>ten a major form <str<strong>on</strong>g>of</str<strong>on</strong>g> elemental loss from <str<strong>on</strong>g>forest</str<strong>on</strong>g>ed ecosystemsfollow<strong>in</strong>g <str<strong>on</strong>g>harvest</str<strong>on</strong>g>, especially for <strong>the</strong> elements P, C, Fe, Al and Si. We collected stream water for chemicalanalysis <str<strong>on</strong>g>of</str<strong>on</strong>g> suspended sediments from three major storm events dur<strong>in</strong>g <strong>the</strong> 1994-95 water year. Weobta<strong>in</strong>ed sufficient sample from <strong>the</strong> clearcut watershed (KJE) for all three events, but <strong>on</strong>ly enoughsuspended sediment from <strong>the</strong> January collecti<strong>on</strong> <strong>in</strong> <strong>the</strong> reference watershed (MUN). S<strong>in</strong>ce <strong>the</strong> CasparCreek Research Team has collected <strong>the</strong> data <strong>on</strong> suspended sediment fluxes, it would be possible toestimate elemental losses (kg/ha/yr) associated with <strong>the</strong> suspended sediment fracti<strong>on</strong>.The compositi<strong>on</strong> <str<strong>on</strong>g>of</str<strong>on</strong>g> <strong>the</strong> suspended sediments <strong>in</strong>dicates that <strong>the</strong>y c<strong>on</strong>sist <str<strong>on</strong>g>of</str<strong>on</strong>g> a mixture <str<strong>on</strong>g>of</str<strong>on</strong>g> organic and<strong>in</strong>organic materials (Table 25). Elemental c<strong>on</strong>centrati<strong>on</strong>s for <strong>the</strong> three samples from <strong>the</strong> clearcutwatershed were similar; however, carb<strong>on</strong> c<strong>on</strong>centrati<strong>on</strong>s varied by a factor <str<strong>on</strong>g>of</str<strong>on</strong>g> three between <strong>the</strong> collecti<strong>on</strong>periods. Of <strong>the</strong> two watersheds, <strong>the</strong> reference watershed had a substantially greater organic mattercomp<strong>on</strong>ent as <strong>in</strong>dicated by higher carb<strong>on</strong> and nitrogen c<strong>on</strong>centrati<strong>on</strong>s. Much <str<strong>on</strong>g>of</str<strong>on</strong>g> <strong>the</strong> m<strong>in</strong>eral matterc<strong>on</strong>ta<strong>in</strong>ed <strong>in</strong> <strong>the</strong> suspended sediment load <str<strong>on</strong>g>of</str<strong>on</strong>g> <strong>the</strong> reference watershed has probably orig<strong>in</strong>ated from streamchannel erosi<strong>on</strong> s<strong>in</strong>ce <strong>the</strong> litter layer at <strong>the</strong> surface <str<strong>on</strong>g>of</str<strong>on</strong>g> <strong>the</strong> <str<strong>on</strong>g>forest</str<strong>on</strong>g> soil m<strong>in</strong>imizes surface run<str<strong>on</strong>g>of</str<strong>on</strong>g>f and erosi<strong>on</strong>.In c<strong>on</strong>trast, <strong>the</strong> loss <str<strong>on</strong>g>of</str<strong>on</strong>g> <strong>the</strong> litter layer from <strong>the</strong> clearcut watershed results <strong>in</strong> a greater potential for surfaceerosi<strong>on</strong> <str<strong>on</strong>g>of</str<strong>on</strong>g> m<strong>in</strong>eral soil materials. Thus, <strong>the</strong> higher organic matter c<strong>on</strong>centrati<strong>on</strong> <str<strong>on</strong>g>of</str<strong>on</strong>g> suspended sediments <strong>in</strong><strong>the</strong> reference watershed probably reflects <strong>the</strong> c<strong>on</strong>trast<strong>in</strong>g nature <str<strong>on</strong>g>of</str<strong>on</strong>g> <strong>the</strong> soil surface <strong>in</strong> <strong>the</strong> two watersheds.The chemical compositi<strong>on</strong> <str<strong>on</strong>g>of</str<strong>on</strong>g> <strong>the</strong> suspended sediments is dom<strong>in</strong>ated by silic<strong>on</strong>, with appreciablec<strong>on</strong>centrati<strong>on</strong>s <str<strong>on</strong>g>of</str<strong>on</strong>g> alum<strong>in</strong>um and ir<strong>on</strong>. This is c<strong>on</strong>sistent with <strong>the</strong>se c<strong>on</strong>stituents represent<strong>in</strong>g <strong>the</strong> dom<strong>in</strong>antrock-form<strong>in</strong>g elements. Similarly, <strong>the</strong> c<strong>on</strong>centrati<strong>on</strong>s <str<strong>on</strong>g>of</str<strong>on</strong>g> base cati<strong>on</strong>s (Ca, Mg, Na and K) are likelyregulated by <strong>the</strong> m<strong>in</strong>eralogical compositi<strong>on</strong> <str<strong>on</strong>g>of</str<strong>on</strong>g> bedrock and soil The carb<strong>on</strong> and nitrogen c<strong>on</strong>tentorig<strong>in</strong>ates from organic matter. The C/N molar ratio <str<strong>on</strong>g>of</str<strong>on</strong>g> <strong>the</strong> suspended sediments ranged between 31 and59 which falls between <strong>the</strong> C/N molar ratio <str<strong>on</strong>g>of</str<strong>on</strong>g> <strong>the</strong> litter layer (91) and A horiz<strong>on</strong>s (26) (Table 2).Phosphorus <strong>in</strong> <strong>the</strong> suspended sediment may orig<strong>in</strong>ate from both organic matter and ortho-phosphateadsorbed <strong>on</strong> m<strong>in</strong>eral surfaces.An estimate <str<strong>on</strong>g>of</str<strong>on</strong>g> nitrogen lost <strong>in</strong> <strong>the</strong> suspended sediment fracti<strong>on</strong> from <strong>the</strong> reference (MUN) andclearcut (KJE) watersheds was made from suspended sediment data collected by <strong>the</strong> Caspar CreekResearch Team. The suspended sediment load predicted for an unlogged c<strong>on</strong>diti<strong>on</strong> <strong>in</strong> water years1990-96 for <strong>the</strong> entire North Fork Caspar Creek experimental watershed was about 385 kg/ha/yrbefore <str<strong>on</strong>g>harvest</str<strong>on</strong>g> activities (Lewis, pers<strong>on</strong>al communicati<strong>on</strong>). If <strong>the</strong> nitrogen c<strong>on</strong>centrati<strong>on</strong> (4.4 g N/kg)<str<strong>on</strong>g>of</str<strong>on</strong>g> <strong>the</strong> suspended sediments from <strong>the</strong> reference watershed (MUN) is representative <str<strong>on</strong>g>of</str<strong>on</strong>g> that for <strong>the</strong>102
Table 25. Elemental compositi<strong>on</strong> <str<strong>on</strong>g>of</str<strong>on</strong>g> suspended sediments c<strong>on</strong>ta<strong>in</strong>ed <strong>in</strong> <strong>the</strong> stream water <str<strong>on</strong>g>of</str<strong>on</strong>g> a clearcut (KJE) and reference (MUN)watershed dur<strong>in</strong>g selected storm events <strong>in</strong> <strong>the</strong> 1994-95 water year.--------------------- Watershed KJE ------------------- ------------------- Watershed MUN -------------------December January March Mean±Std. December January March Mean±Std.Dev. Dev.Element ----------------------------------------------- mg/kg suspended sediment --------------------------------------------------Al 3.28 3.51 3.82 3.5±4.27 NA † 2.98 NASi 26.1 29.3 30.1 28.5±12.1 NA 25.8 NAFe 2.54 2.47 3.47 2.83±.56 NA 1.83 NACa 0.52 0.44 0.41 0.46±.06 NA 0.21 NAMg 1.89 1.76 1.82 1.82±.07 NA 1.33 NAK 1.30 1.21 1.43 1.31±.11 NA 0.82 NANa 0.63 0.41 0.32 0.45±.16 NA 0.13 NAN 0.21 0.15 0.12 0.16±.05 0.65 0.28 0.40 0.44± .19P 0.11 0.13 0.15 0.13±.02 NA 0.04 NAC 9.1 5.8 3.2 6.01±3.0 29.3 14.3 22.6 22.1± 7.5† Not analyzed due to <strong>in</strong>sufficient sample.
entire watershed before <str<strong>on</strong>g>harvest</str<strong>on</strong>g>, 1.7 kg N/ha/yr would be lost from <strong>the</strong> watershed as suspended sediment.Harvest activities with<strong>in</strong> <strong>the</strong> entire North Fork experimental watershed resulted <strong>in</strong> an <strong>in</strong>crease <str<strong>on</strong>g>of</str<strong>on</strong>g> 345kg/ha/yr <str<strong>on</strong>g>of</str<strong>on</strong>g> suspended sediment (Lewis, pers<strong>on</strong>al communicati<strong>on</strong>). However, <strong>the</strong> total nitrogen lost from<strong>the</strong> clearcut watershed (1.2 kg N/ha/yr) was actually somewhat lower than that lost from <strong>the</strong> referencewatershed because <str<strong>on</strong>g>of</str<strong>on</strong>g> <strong>the</strong> lower nitrogen c<strong>on</strong>centrati<strong>on</strong> associated with suspended sediment from <strong>the</strong>clearcut watershed (1.6 g N/kg). Because <str<strong>on</strong>g>of</str<strong>on</strong>g> <strong>the</strong> limited data collected <strong>in</strong> this study and <strong>the</strong> large temporalvariability associated with suspended sediment fluxes over <strong>the</strong> course <str<strong>on</strong>g>of</str<strong>on</strong>g> a <str<strong>on</strong>g>harvest</str<strong>on</strong>g> rotati<strong>on</strong>, it is verydifficult to estimate <strong>the</strong> l<strong>on</strong>g-term nitrogen fluxes from <strong>the</strong>se watersheds.Ecosystem Nitrogen BudgetAn ecosystem nitrogen budget dem<strong>on</strong>strat<strong>in</strong>g <strong>the</strong> effects <str<strong>on</strong>g>of</str<strong>on</strong>g> clearcut <str<strong>on</strong>g>harvest</str<strong>on</strong>g> management is providedbelow as an example <str<strong>on</strong>g>of</str<strong>on</strong>g> how all <strong>the</strong> data provided <strong>in</strong> this report can be <strong>in</strong>tegrated. Susta<strong>in</strong>able <str<strong>on</strong>g>forest</str<strong>on</strong>g>ry isbased <strong>on</strong> <strong>the</strong> premise <str<strong>on</strong>g>of</str<strong>on</strong>g> remov<strong>in</strong>g essential nutrients at a rate less than or equal to that which can bereplenished by natural <strong>processes</strong>. As shown <strong>in</strong> <strong>the</strong> preced<strong>in</strong>g discussi<strong>on</strong>, nitrogen is lost from <strong>the</strong>ecosystem primarily by biomass removal, suspended sediment transport, and leach<strong>in</strong>g. Denitrificati<strong>on</strong>may also result <strong>in</strong> nitrogen loss; however, we have no estimates <str<strong>on</strong>g>of</str<strong>on</strong>g> how much nitrogen may be lost by thismechanism. The primary <strong>in</strong>puts <str<strong>on</strong>g>of</str<strong>on</strong>g> nitrogen <strong>in</strong>to <strong>the</strong> ecosystem are atmospheric depositi<strong>on</strong> and nitrogenfixati<strong>on</strong>, primarily by Ceanothus. A nitrogen budget was calculated <strong>on</strong> <strong>the</strong> basis <str<strong>on</strong>g>of</str<strong>on</strong>g> estimated nitrogen<strong>in</strong>puts and outputs over <strong>the</strong> course <str<strong>on</strong>g>of</str<strong>on</strong>g> an 80-year <str<strong>on</strong>g>harvest</str<strong>on</strong>g> rotati<strong>on</strong> (Table 26). Nitrogen losses aredom<strong>in</strong>ated by biomass removal (~ 950 kg/ha/rotati<strong>on</strong>), which removes about 60 percent <str<strong>on</strong>g>of</str<strong>on</strong>g> <strong>the</strong> nitrogenc<strong>on</strong>ta<strong>in</strong>ed <strong>in</strong> <strong>the</strong> biomass. Although <strong>the</strong> nitrogen loss <strong>in</strong> <strong>the</strong> suspended sediment fracti<strong>on</strong> cannot beprecisely estimated, it appears to be <strong>on</strong> <strong>the</strong> order <str<strong>on</strong>g>of</str<strong>on</strong>g> 1.0 to 2.0 kg N/ha/yr or 80 to 160 kg N/ha/rotati<strong>on</strong>.The stream water N flux fur<strong>the</strong>r results <strong>in</strong> <strong>the</strong> loss <str<strong>on</strong>g>of</str<strong>on</strong>g> about 20 kg N/ha/rotati<strong>on</strong>. The summati<strong>on</strong> <str<strong>on</strong>g>of</str<strong>on</strong>g> <strong>the</strong>selosses greatly exceed <strong>the</strong> <strong>on</strong>ly measured <strong>in</strong>put <str<strong>on</strong>g>of</str<strong>on</strong>g> about 20 kg N/ha/rotati<strong>on</strong> <strong>in</strong> <strong>the</strong> bulk precipitati<strong>on</strong>.Regardless <str<strong>on</strong>g>of</str<strong>on</strong>g> <strong>the</strong> amount <str<strong>on</strong>g>of</str<strong>on</strong>g> nitrogen lost <strong>in</strong> <strong>the</strong> suspended sediment fracti<strong>on</strong>, <strong>the</strong>re is a net loss <str<strong>on</strong>g>of</str<strong>on</strong>g>nitrogen from this ecosystem based <strong>on</strong> measured fluxes.These budget calculati<strong>on</strong>s suggest a n<strong>on</strong>susta<strong>in</strong>able <str<strong>on</strong>g>forest</str<strong>on</strong>g> management practice over <strong>the</strong> l<strong>on</strong>g term;however, nitrogen fixers such as Ceanothus can c<strong>on</strong>tribute appreciable nitrogen <strong>in</strong>puts <strong>in</strong>to <strong>the</strong>seecosystems. Ceanothus thyrsiflorus (blue-blossom ceanothus) is an aggressive <strong>in</strong>vader after clearcutt<strong>in</strong>g,and it has <strong>the</strong> potential to fix large quantities <str<strong>on</strong>g>of</str<strong>on</strong>g> nitrogen to replenish <strong>the</strong> nitrogen deficit imposed by<str<strong>on</strong>g>harvest</str<strong>on</strong>g><strong>in</strong>g. Nitrogen fixati<strong>on</strong> rates for Ceanothus velunt<strong>in</strong>us <strong>in</strong> <strong>the</strong> Oreg<strong>on</strong> Cascades range from 70 to 100kg N/ha/yr (B<strong>in</strong>kley et al.,1982; Youngberg and Wollum, 1976). These data, as well as data reported <strong>in</strong> <strong>the</strong>literature (e.g., Swans<strong>on</strong> and Frankl<strong>in</strong>, 1992), suggest that nitrogen fixati<strong>on</strong> by Ceanothus may benecessary to ma<strong>in</strong>ta<strong>in</strong> <strong>the</strong> l<strong>on</strong>g-term productivity and susta<strong>in</strong>ability <str<strong>on</strong>g>of</str<strong>on</strong>g> <str<strong>on</strong>g>forest</str<strong>on</strong>g> ecosystems. Additi<strong>on</strong>alresearch appears warranted to determ<strong>in</strong>e <strong>the</strong> importance <str<strong>on</strong>g>of</str<strong>on</strong>g> Ceanothus <strong>in</strong> <strong>the</strong> post-<str<strong>on</strong>g>harvest</str<strong>on</strong>g> recovery <str<strong>on</strong>g>of</str<strong>on</strong>g> <strong>the</strong>nitrogen capital <strong>in</strong> this ecosystem.104
Table 26. Nitrogen budget for clearcut <str<strong>on</strong>g>harvest</str<strong>on</strong>g> management based <strong>on</strong> an 80-year<str<strong>on</strong>g>harvest</str<strong>on</strong>g> rotati<strong>on</strong>. The suspended sediment flux is estimated based <strong>on</strong>limited data from this study.Nutrient comp<strong>on</strong>entNitrogen pool--- kg/ha --Nitrogen fluxes-- kg/ha/rotati<strong>on</strong> --Soil poolBiomass poolAtmospheric depositi<strong>on</strong>Nitrogen fixati<strong>on</strong> fluxHarvest removal fluxStream-water fluxSuspended sediment flux9,5001,480+20+?-950-10-80 to -160
SoilsC<strong>on</strong>clusi<strong>on</strong>sThere were m<strong>in</strong>imal changes <strong>in</strong> soil properties and soil nutrient pools follow<strong>in</strong>g clearcutt<strong>in</strong>g. The 1-3 cmthick litter layer (Oi/Oa) was largely lost from <strong>the</strong> clearcut watershed due to mix<strong>in</strong>g and decompositi<strong>on</strong>follow<strong>in</strong>g <str<strong>on</strong>g>harvest</str<strong>on</strong>g>. This may lead to a greater erosi<strong>on</strong> potential <strong>in</strong> <strong>the</strong> short-term follow<strong>in</strong>g <str<strong>on</strong>g>harvest</str<strong>on</strong>g><strong>in</strong>g. SoilpH <strong>in</strong> <strong>the</strong> A and AB horiz<strong>on</strong>s <str<strong>on</strong>g>of</str<strong>on</strong>g> <strong>the</strong> clearcut watershed was decreased by 0.2 to 0.5 units follow<strong>in</strong>g<str<strong>on</strong>g>harvest</str<strong>on</strong>g>. This pH depressi<strong>on</strong> will have little impact <strong>on</strong> ecosystem <strong>processes</strong>. There were no significantchanges to soil nutrient pools follow<strong>in</strong>g clearcutt<strong>in</strong>g. Thus, clearcutt<strong>in</strong>g had no major effect <strong>on</strong> soilproperties and nutrient pools <strong>in</strong> <strong>the</strong> three years follow<strong>in</strong>g <str<strong>on</strong>g>harvest</str<strong>on</strong>g>.Biomass NutrientsRapid regrowth <str<strong>on</strong>g>of</str<strong>on</strong>g> redwood stump sprouts immobilized large c<strong>on</strong>centrati<strong>on</strong>s <str<strong>on</strong>g>of</str<strong>on</strong>g> nutrients, <strong>the</strong>reby reduc<strong>in</strong>g<strong>the</strong>ir loss by leach<strong>in</strong>g from <strong>the</strong> watershed. A mean <str<strong>on</strong>g>of</str<strong>on</strong>g> 5020 redwood stem/ha hav<strong>in</strong>g an above-groundbiomass <str<strong>on</strong>g>of</str<strong>on</strong>g> 15 Mg/ha was measured six years follow<strong>in</strong>g <strong>the</strong> clearcut. The above-ground biomass <str<strong>on</strong>g>of</str<strong>on</strong>g> <strong>the</strong>regenerat<strong>in</strong>g redwood c<strong>on</strong>ta<strong>in</strong>ed 70, 56, 12, 80, 14 and 7 kg/ha <str<strong>on</strong>g>of</str<strong>on</strong>g> N, Ca, Mg, K, P and S, respectively.This rapid regrowth <str<strong>on</strong>g>of</str<strong>on</strong>g> redwoods also provides soil cover which appreciably reduces <strong>the</strong> erosi<strong>on</strong> potentialfollow<strong>in</strong>g <str<strong>on</strong>g>harvest</str<strong>on</strong>g>. Based <strong>on</strong> foliar nutrient c<strong>on</strong>centrati<strong>on</strong>s <strong>in</strong> <strong>the</strong> redwood sprouts, <strong>the</strong>re are no apparentnutrient deficiencies limit<strong>in</strong>g <strong>the</strong>ir regrowth. Harvest<strong>in</strong>g <str<strong>on</strong>g>of</str<strong>on</strong>g> <strong>the</strong> 80-year-old redwood/Doug fir <str<strong>on</strong>g>forest</str<strong>on</strong>g>resulted <strong>in</strong> removal (<strong>in</strong> wood and bark) <str<strong>on</strong>g>of</str<strong>on</strong>g> 949, 65, 405, 401 and 75 kg/ha <str<strong>on</strong>g>of</str<strong>on</strong>g> N, P, K, Ca and Mg,respectively. A comparis<strong>on</strong> <str<strong>on</strong>g>of</str<strong>on</strong>g> nutrients removed <strong>in</strong> biomass with soil nutrient pools <strong>in</strong>dicates that N, Pand S are <strong>the</strong> most critical nutrients with respect to l<strong>on</strong>g-term <str<strong>on</strong>g>forest</str<strong>on</strong>g> productivity. The data suggest thatnitrogen fixati<strong>on</strong> by Ceanothus species may be necessary to ma<strong>in</strong>ta<strong>in</strong> <strong>the</strong> l<strong>on</strong>g-term productivity andsusta<strong>in</strong>ability <str<strong>on</strong>g>of</str<strong>on</strong>g> <strong>the</strong>se ecosystems. We c<strong>on</strong>clude that <strong>the</strong> stump sprout<strong>in</strong>g ability <str<strong>on</strong>g>of</str<strong>on</strong>g> redwood makes <strong>the</strong>seecosystems comparatively resilient to <strong>the</strong> adverse effects <str<strong>on</strong>g>of</str<strong>on</strong>g> nutrient loss by leach<strong>in</strong>g and erosi<strong>on</strong>.Ecosystem WaterflowsIn <strong>the</strong> period 4-6 years follow<strong>in</strong>g clearcutt<strong>in</strong>g, c<strong>on</strong>centrati<strong>on</strong>s <str<strong>on</strong>g>of</str<strong>on</strong>g> most solutes <strong>in</strong> soil soluti<strong>on</strong>s weresignificantly lower <strong>in</strong> <strong>the</strong> clearcut watershed. The <strong>on</strong>ly solute to show an <strong>in</strong>crease <strong>in</strong> <strong>the</strong> clearcutwatershed was NO 3 . This is due to <strong>in</strong>creased m<strong>in</strong>eralizati<strong>on</strong> from organic matter (due to warmer andmoister soil c<strong>on</strong>diti<strong>on</strong>s) and decreased uptake due to removal <str<strong>on</strong>g>of</str<strong>on</strong>g> vegetati<strong>on</strong>. We believe <strong>the</strong> lower solutec<strong>on</strong>centrati<strong>on</strong>s <strong>in</strong> stream water from <strong>the</strong> clearcut watersheds reflect a diluti<strong>on</strong> effect. Canopy <strong>in</strong>tercepti<strong>on</strong>(10-16%) and higher evapotranspirati<strong>on</strong> <strong>in</strong> <strong>the</strong> sec<strong>on</strong>d growth <str<strong>on</strong>g>forest</str<strong>on</strong>g> substantially decrease <strong>the</strong> amount <str<strong>on</strong>g>of</str<strong>on</strong>g>water leach<strong>in</strong>g from <strong>the</strong> reference watershed. This is also reflected <strong>in</strong> <strong>the</strong> lack <str<strong>on</strong>g>of</str<strong>on</strong>g> streamflow <strong>in</strong> <strong>the</strong>reference watershed follow<strong>in</strong>g cessati<strong>on</strong> <str<strong>on</strong>g>of</str<strong>on</strong>g> ra<strong>in</strong>fall which is <strong>in</strong> c<strong>on</strong>trast to water flow <strong>in</strong> <strong>the</strong> clearcutwatersheds that c<strong>on</strong>t<strong>in</strong>ued to flow throughout <strong>the</strong> dry summer m<strong>on</strong>ths.106
Stream water solute c<strong>on</strong>centrati<strong>on</strong>s were similar between <strong>the</strong> reference and clearcut watersheds, except forNO 3 and SO 4 which had higher c<strong>on</strong>centrati<strong>on</strong>s <strong>in</strong> <strong>the</strong> clearcut watershed. Elevated c<strong>on</strong>centrati<strong>on</strong>s <str<strong>on</strong>g>of</str<strong>on</strong>g> NO 3and SO 4 are most likely due to <strong>in</strong>creased leach<strong>in</strong>g from <strong>the</strong> soil as m<strong>in</strong>eralizati<strong>on</strong> is enhanced and uptakeby vegetati<strong>on</strong> is greatly reduced. With <strong>the</strong> excepti<strong>on</strong> <str<strong>on</strong>g>of</str<strong>on</strong>g> NO 3 , all solute c<strong>on</strong>centrati<strong>on</strong>s display a largedecrease due to diluti<strong>on</strong> dur<strong>in</strong>g high-discharge, storm events. In c<strong>on</strong>trast, NO 3 c<strong>on</strong>centrati<strong>on</strong>s <strong>in</strong>crease atpeak discharge probably reflect<strong>in</strong>g a change <strong>in</strong> <strong>the</strong> hydrologic flowpath and source <str<strong>on</strong>g>of</str<strong>on</strong>g> <strong>the</strong> water. Wespeculate that subsurface lateral flow above <strong>the</strong> clay-rich, argillic horiz<strong>on</strong> and macropore flow throughroot channels delivers NO 3 -enriched waters from <strong>the</strong> upper soil horiz<strong>on</strong>s dur<strong>in</strong>g storm events. Much <str<strong>on</strong>g>of</str<strong>on</strong>g>this water may reach <strong>the</strong> stream channel as pipeflow which has solute c<strong>on</strong>centrati<strong>on</strong>s that can expla<strong>in</strong>many <str<strong>on</strong>g>of</str<strong>on</strong>g> <strong>the</strong> changes <strong>in</strong> stream water solute c<strong>on</strong>centrati<strong>on</strong>s dur<strong>in</strong>g storm events. The elevatedc<strong>on</strong>centrati<strong>on</strong> <str<strong>on</strong>g>of</str<strong>on</strong>g> NO 3 <strong>in</strong> <strong>the</strong> clearcut watersheds was rapidly decreased <strong>in</strong> <strong>the</strong> higher-order downstreamsegments. This decrease <strong>in</strong> NO 3 c<strong>on</strong>centrati<strong>on</strong> is believed to be primarily due to diluti<strong>on</strong>, although<strong>in</strong>-stream immobilizati<strong>on</strong> and denitrificati<strong>on</strong> <strong>in</strong> <strong>the</strong> riparian z<strong>on</strong>e may also have an effect. Thus, <strong>the</strong>impacts <str<strong>on</strong>g>of</str<strong>on</strong>g> elevated NO 3 c<strong>on</strong>centrati<strong>on</strong>s <strong>on</strong> <strong>the</strong> aquatic community are primarily restricted to <strong>the</strong> streamsegment dra<strong>in</strong><strong>in</strong>g <strong>the</strong> clearcut watershed with little effect <strong>on</strong> <strong>the</strong> higher-order downstream segments.Nutrient fluxes from <strong>the</strong> clearcut watershed were generally 2 to 2.5 times greater than those from <strong>the</strong>adjacent reference watershed. S<strong>in</strong>ce stream water solute c<strong>on</strong>centrati<strong>on</strong>s were similar <strong>in</strong> both watersheds,<strong>the</strong> <strong>in</strong>creased fluxes must be primarily due to an <strong>in</strong>creased water flux <strong>in</strong> <strong>the</strong> clearcut watershed. Whileelevated NO 3 c<strong>on</strong>centrati<strong>on</strong>s <strong>in</strong> stream water from <strong>the</strong> clearcut watershed might suggest a large loss <str<strong>on</strong>g>of</str<strong>on</strong>g>nitrogen due to clearcutt<strong>in</strong>g, c<strong>on</strong>versi<strong>on</strong> to a flux (kg/ha/yr) <strong>in</strong>dicates a maximum loss <str<strong>on</strong>g>of</str<strong>on</strong>g> <strong>on</strong>ly 1.85kg/ha/yr and fluxes have decreased to 0.4 µm) <strong>in</strong>dicate a mixture <str<strong>on</strong>g>of</str<strong>on</strong>g> <strong>in</strong>organic and organiccomp<strong>on</strong>ents. Suspended sediments <strong>in</strong> <strong>the</strong> reference watershed had a much larger organic comp<strong>on</strong>entcompare to <strong>the</strong> clearcut watershed. C<strong>on</strong>centrati<strong>on</strong>s <str<strong>on</strong>g>of</str<strong>on</strong>g> N (1.2 - 6.5 g/kg) and P (1.1 - 1.5 g/kg) arerelatively high <strong>in</strong> <strong>the</strong> suspended sediments <strong>in</strong>dicat<strong>in</strong>g that enhanced erosi<strong>on</strong> could lead to appreciablenutrient loss follow<strong>in</strong>g <str<strong>on</strong>g>forest</str<strong>on</strong>g> <str<strong>on</strong>g>harvest</str<strong>on</strong>g>. An estimate <str<strong>on</strong>g>of</str<strong>on</strong>g> nitrogen loss by suspended sediment transport<strong>in</strong>dicates losses <strong>on</strong> <strong>the</strong> order <str<strong>on</strong>g>of</str<strong>on</strong>g> 1 to 2 kg N/ha/yr <strong>in</strong> both reference and clearcut watersheds. The greaterfluxes <str<strong>on</strong>g>of</str<strong>on</strong>g> suspended sediment <strong>in</strong> <strong>the</strong> clearcut watershed were <str<strong>on</strong>g>of</str<strong>on</strong>g>fset by <strong>the</strong> lower nitrogen c<strong>on</strong>centrati<strong>on</strong> <str<strong>on</strong>g>of</str<strong>on</strong>g><strong>the</strong> suspended sediment <strong>in</strong> <strong>the</strong> clearcut watershed.107
Literature CitedB<strong>in</strong>kley, D., K. Cromack and R.L. Fredriksen. 1982. Nitrogen accreti<strong>on</strong> and availability <strong>in</strong> somesnowbrush ecosystems. Forest Science. 28:720-724.Dahlgren, R.A. and C.T. Driscoll. 1994. The effects <str<strong>on</strong>g>of</str<strong>on</strong>g> whole-tree clearcutt<strong>in</strong>g <strong>on</strong> soil <strong>processes</strong> at <strong>the</strong>Hubbard Brook Experimental Forest, New Hampshire, USA. Plant Soil. 158:239-262.Driscoll, C.T., R.D. Fuller and D.M. Sim<strong>on</strong>e. 1988. L<strong>on</strong>gitud<strong>in</strong>al variati<strong>on</strong>s <strong>in</strong> trace metal c<strong>on</strong>centrati<strong>on</strong>s<strong>in</strong> a nor<strong>the</strong>rn <str<strong>on</strong>g>forest</str<strong>on</strong>g>ed ecosystem. J. Envir<strong>on</strong>. Quality. 17:101-107.Gholz, H.L., C.C. Grier, A.G. Campbell and A.T. Brown. 1979. Equati<strong>on</strong>s for estimat<strong>in</strong>g biomass andleaf area <str<strong>on</strong>g>of</str<strong>on</strong>g> plants <strong>in</strong> <strong>the</strong> Pacific Northwest. Research Paper 41. Forest Research Laboratory,Oreg<strong>on</strong> State University, Corvallis, OR. 37 p.Johns<strong>on</strong>, D.W. and D.W. Cole. 1980. Ani<strong>on</strong> mobility <strong>in</strong> soils: relevance to nutrient transport fromterrestrial ecosystems. Envir<strong>on</strong>. Int. 3:79-90.Keppeler, E.T. and R.R. Ziemer. 1990. Logg<strong>in</strong>g effects <strong>on</strong> streamflow: water yield and summer lowflows at Caspar Creek <strong>in</strong> Northwestern California. Water Resour. Res. 26:1669-1679.Krammes, J.S. and D.M. Burns. 1973. Road c<strong>on</strong>structi<strong>on</strong> <strong>on</strong> Caspar Creek watersheds ... a 10-yearprogress report. Res. Paper PSW-93. Pac. Southwest For. and Range Exp. Stn. U.S. Dept. <str<strong>on</strong>g>of</str<strong>on</strong>g>Agric. Berkeley, CA. 10 p.Olsen, S.R. and L.E. Sommers. 1982. Phosphorus. pp. 403-430. In: A.L. Page, R.H. Miller and D.R.Kenney (Eds.), Methods <str<strong>on</strong>g>of</str<strong>on</strong>g> Soil Analysis, Part 2. Chemical and Microbiological Properties.Agr<strong>on</strong>omy M<strong>on</strong>ogr. No. 9 (2nd ed.). Am. Soc. <str<strong>on</strong>g>of</str<strong>on</strong>g> Agr<strong>on</strong>omy, Madis<strong>on</strong>, WI.Pitt, R.L., H.J. Percival, R.A. Dahlgren and L.F. Hill. 1997. Soil and soluti<strong>on</strong> chemistry under pastureand radiata p<strong>in</strong>e <strong>in</strong> New Zealand. Plant Soil. 191:279-290.Park<strong>in</strong>s<strong>on</strong>, J.A. and S.E. Allen. 1975. A wet oxidati<strong>on</strong> procedure suitable for <strong>the</strong> determ<strong>in</strong>ati<strong>on</strong> <str<strong>on</strong>g>of</str<strong>on</strong>g> N andm<strong>in</strong>eral nutrients <strong>in</strong> biological material. Commun. Soil Sci. Plant Anal. 6:1-11.Rice, R.M., F.B. Tilley and P.A. Datzman. 1979. A watershed's resp<strong>on</strong>se to logg<strong>in</strong>g and roads: SouthFork <str<strong>on</strong>g>of</str<strong>on</strong>g> Caspar Creek, California, 1967-1976. Res. Paper PSW-146. Pac. Southwest For. andRange Exp. Stn., U.S. Dept. <str<strong>on</strong>g>of</str<strong>on</strong>g> Agric. Berkeley, CA. 12 p.Soil Survey Staff, 1984. Procedures for collect<strong>in</strong>g soil samples and methods <str<strong>on</strong>g>of</str<strong>on</strong>g> analysis for soil survey.Soil Survey Investigati<strong>on</strong>s Rep. No. 1. USDA-SCS Agric. Handbook 436. U.S. GovernmentPr<strong>in</strong>t<strong>in</strong>g Office, Wash<strong>in</strong>gt<strong>on</strong>, DC.108
Swans<strong>on</strong>, F.J. and JR Frankl<strong>in</strong>. 1992. New <str<strong>on</strong>g>forest</str<strong>on</strong>g>ry pr<strong>in</strong>ciples from ecosystem analysis <str<strong>on</strong>g>of</str<strong>on</strong>g> PacificNorthwest <str<strong>on</strong>g>forest</str<strong>on</strong>g>. Ecological Applicati<strong>on</strong>s. 2:262-274.Thomas, R.B. 1990. Problems <strong>in</strong> determ<strong>in</strong><strong>in</strong>g <strong>the</strong> return <str<strong>on</strong>g>of</str<strong>on</strong>g> a watershed to pretreatment c<strong>on</strong>diti<strong>on</strong>s:techniques applied to a study at Caspar Creek, California. Water Resour. Res. 26:2079-2087.Tilley, F.B. and R.M. Rice. 1977. Caspar Creek watershed study -- A current status report. State ForestNotes 66, State <str<strong>on</strong>g>of</str<strong>on</strong>g> California Dept. <str<strong>on</strong>g>of</str<strong>on</strong>g> Forestry. Sacramento, CA 15 p.Whittig, L.D. and W.R. Allardice. 1986. X-ray diffracti<strong>on</strong> techniques. pp. 331-362. In: A. Klute (Ed.),Methods <str<strong>on</strong>g>of</str<strong>on</strong>g> Soil Analysis, Part 1. Physical and M<strong>in</strong>eralogical Methods. Agr<strong>on</strong>omy M<strong>on</strong>ogr. No.9 (2nd ed.). Am. Soc. <str<strong>on</strong>g>of</str<strong>on</strong>g> Agr<strong>on</strong>omy, Madis<strong>on</strong>, WI.Wosika, E.P. 1981. Hydrologic properties <str<strong>on</strong>g>of</str<strong>on</strong>g> <strong>on</strong>e major and two m<strong>in</strong>or soil series <str<strong>on</strong>g>of</str<strong>on</strong>g> <strong>the</strong> coast ranges <str<strong>on</strong>g>of</str<strong>on</strong>g>nor<strong>the</strong>rn California. M.S. <strong>the</strong>sis. Humboldt State Univ., Arcata, CA. 15 p.Wright, K.A., K.H. Sendek, R.M. Rice and R.B. Thomas. 1990. Logg<strong>in</strong>g effects <strong>on</strong> streamflow: stormrun<str<strong>on</strong>g>of</str<strong>on</strong>g>f at Caspar Creek <strong>in</strong> northwestern California. Water Resour. Res. 26:1657-1667.Youngberg, C.T. and A.G. Wollum. 1976. Nitrogen accreti<strong>on</strong> <strong>in</strong> develop<strong>in</strong>g Ceanothus velut<strong>in</strong>us stands.Soil Sci. Soc. Am. J. 40:109-112.Ziemer, R.R. 1981. Storm flow resp<strong>on</strong>se to road build<strong>in</strong>g and partial cutt<strong>in</strong>g <strong>in</strong> small streams <str<strong>on</strong>g>of</str<strong>on</strong>g> nor<strong>the</strong>rnCalifornia. Water Resour. Res. 17:907-917.109
AppendicesA Precipitati<strong>on</strong> chemistry - watershed KJE . . . . . . . . . . . . . . . . . . . . . . . . . . . 111B Canopy throughfall - redwood - watershed MUN . . . . . . . . . . . . . . . . . . . . . 112C Canopy throughfall - Doug fir - watershed MUN . . . . . . . . . . . . . . . . . . . . . 113D Stream water chemistry - watershed AEI . . . . . . . . . . . . . . . . . . . . . . . . . . . . 114E Stream water chemistry - watershed ARF . . . . . . . . . . . . . . . . . . . . . . . . . . . 115F Stream water chemistry - watershed BAN . . . . . . . . . . . . . . . . . . . . . . . . . . . 116G Stream water chemistry - watershed CAR . . . . . . . . . . . . . . . . . . . . . . . . . . . 117H Stream water chemistry - watershed DOL . . . . . . . . . . . . . . . . . . . . . . . . . . . 1181 Stream water chemistry - watershed EAG . . . . . . . . . . . . . . . . . . . . . . . . . . . 120J Stream water chemistry - watershed FLY . . . . . . . . . . . . . . . . . . . . . . . . . . . 122K Stream water chemistry - watershed GIB . . . . . . . . . . . . . . . . . . . . . . . . . . . 123L Stream water chemistry - watershed HEN . . . . . . . . . . . . . . . . . . . . . . . . . . . 125M Stream water chemistry - watershed IVE . . . . . . . . . . . . . . . . . . . . . . . . . . . . 126N Stream water chemistry - watershed JOH . . . . . . . . . . . . . . . . . . . . . . . . . . . 125O Stream water chemistry - watershed KJE . . . . . . . . . . . . . . . . . . . . . . . . . . . 128P Stream water chemistry - watershed LAN . . . . . . . . . . . . . . . . . . . . . . . . . . . 136Q Stream water chemistry - watershed MUN . . . . . . . . . . . . . . . . . . . . . . . . . . 137R Pipeflow - watershed KJE . . . . . . . . . . . . . . . . . . . . . . . . . . . . . . . . . . . . . . . 144S Pipeflow - watershed MUN . . . . . . . . . . . . . . . . . . . . . . . . . . . . . . . . . . . . . . 147T Soil soluti<strong>on</strong> chemistry - watershed KJE & MUN . . . . . . . . . . . . . . . . . . . . . 150U Manuscript presented at <strong>the</strong> Caspar Creek Symposium . . . . . . . . . . . . . . . . . 154110
Caspar Creek - Precipitati<strong>on</strong> Chemistry - Watershed KJEType Date pH Na NH4 K Mg Ca CI N03 P04 S04 SiµM µM µM µM µM µM µM µM µM µMPPT 11 /03/92 6.93 66.6 0.00 4.1 9.5 0.2 73.0 3.00 0.00 7.0 2.3PPT 12/07/92 7.71 30.4 0.00 2.6 8.2 5.0 25.0 2.00 0.00 4.0 2.1PPT 12/07/92 7.63 26.1 0.00 0.0 4.1 5.0 29.0 5.00 1.00 4.0 2.4PPT 12/09/92 6.96 32.6 0.00 4.1 9.9 11.7 38.0 1.00 0.00 3.0 3.0PPT 12/15/92 5.97 43.5 0.00 2.6 11.1 8.7 50.0 1.00 0.00 3.0 2.6PPT 12/15/92 5.82 35.2 0.00 1.5 9.5 5.5 43.0 0.00 0.00 3.0 2.5PPT 12/31 /92 6.18 98.3 1.11 2.8 17.7 7.2 110.0 1.40 0.00 8.1 3.1PPT 12/31/92 6.52 95.7 0.00 3.3 19.3 9.2 112.6 1.90 0.00 7.9 3.6PPT 01 /07/93 5.81 18.7 0.30 0.5 6.3 5.8 24.0 2.01 0.00 2.5 2.8PPT 01 /07/93 5.84 19.0 0.57 0.5 6.4 8.9 24.4 2.74 0.00 2.5 3.5PPT 01/13/93 5.84 54.9 0.00 2.1 10.3 6.8 57.3 2.75 0.00 3.7 2.7PPT 01 /13/93 5.74 41.5 0.59 1.5 9.6 5.8 47.6 4.00 0.58 4.1 2.8PPT 01/14/93 5.73 21.4 0.52 0.7 7.2 7.3 25.7 0.73 0.60 2.1 2.8PPT 01/14/93 5.77 24.1 0.00 0.6 7.9 5.6 21.1 1.26 0.50 2.2 2.7PPT 02/04/93 6.13 38.8 0.50 1.1 13.7 17.6 50.0 0.00 0.00 2.5 2.4PPT 02/04/93 7.13 36.5 0.75 1.1 9.6 7.3 41.6 2.01 0.00 2.9 3.0PPT 02/26/93 5.50 87.0 0.00 2.6 20.6 20.0 79.0 1.00 0.00 6.0 3.0PPT 02/26/93 5.84 91.3 0.00 5.1 16.5 7.5 42.0 0.00 0.00 7.0 2.6PPT 03/23/93 6.14 69.4 0.00 4.3 15.9 13.4 45.7 1.42 0.00 6.2 2.6PPT 04/06/93 5.64 43.5 0:00 2.6 12.3 10:0 44.0 0.00 0.00 5.0 1.6PPT 04/06/93 5.45 47.8 0.00 2.6 12.3 10.0 44.0 .00 0.00 5.0 2.2PPT 04/29/93 6.43 47.5 0.00 3.4 15.3 19.3 49.5 2.85 0.00 5.4 2.6PPT 04/29/93 7.10 47.1 3.64 5.3 17.5 28.6 41.8 0.64 0.00 4.8 2.4PPT 06/03/93 6.96 37.3 9.40 4.0 17.7 35.8 42.7 0.00 0.56 4.9 7.9PPT 06/03/93 7.38 49.2 0.00 8.0 17.9 36.7 55.0 0.00 0.00 5.6 7.2PPT 12/18/93 6.05 28.5 6.20 4.8 15.2 30.4 31.3 0.36 3.86 3.3 0.0PPT 01 /27/94 5.70 27.5 12.40 8.3 19.4 40.1 33.0 0.72 7.73 3.8 0.0PPT 01 /27/94 6.40 29.5 0.00 1.4 11.0 20.7 29.5 0.00 0.00 2.7 0.0PPT 02/18/94 5.95 28.3 0.00 1.0 9.3 8.6 30.5 0.00 0.00 3.8 0.0PPT 03/18/94 5.65 69.6 0.00 3.8 14.4 8.7 43.0 0.00 0.00 6.0 2.4PPT 12/06/94 7.06 71.3 0.00 1.8 15.6 9.2 76.2 0.00 0.00 4.9 0.0PPT 12/06/94 7.28 79.2 0.00 5.1 18.9 20:2 76.8 0.00 0.00 5.6 0.0PPT 12/18/94 5.60 42.2 0.00 1.3 8.2 11.2 46.3 3.53 0.00 4.4 2.9PPT 01 /05/95 6.01 23.1 0.00 1.0 9.1 9:0 24.6 0.00 0.00 2.4 0.0PPT 01/05/95 5.88 33.5 0.00 1.0 9.5 8.2 36.3 0.00 0.00 5.2 0.0PPT 01/15/95 6.68 67.5 0.00 3.8 19.6 15.7 66.2 0.00 0.00 4.4 2.1PPT 01 /31 /95 7.12 27.5 3.71 1.0 11.1 26.1 33.1 0.95 0.00 2.1 1.3PPT 01 /31 /95 7.10 38.4 0.00 18.3 7.8 13.1 31.9 0.00 0.00 2.6 1.5PPT 02/20/95 7.50 37.2 0.36 1.8 10.2 7.4 77.5 0.00 0.00 6.8 2.2PPT 02/20/95 7.11 91.0 0.00 5.2 22.7 36.0 44.8 0.00 0.00 4.2 2.0PPT 03/11/95 7.28 37.7 0.00 18.6 7.8 13.8 17.3 0.00 0.00 1.8 1.4PPT 03/11/95 7.08 28.8 0.00 22.5 10.3 20.6 69.3 0.00 9.48 6.5 1.9PPT 12/21/95 6.58 56.3 0.00 3.1 14.2 14.2 56.6 0.00 0.00 5.4 0.0PPT 01 /20/96 5.36 83.0 0.00 3.3 26.3 22.2 52.1 0.00 0.00 3.7 4.3PPT 02/11/96 5.80 82.2 0.00 4.1 18.5 19.5 57.9 0.00 0.00 3.5 2.1PPT 03/10/96 5.95 28.3 0.00 1.0 9.3 8.6 30.5 0.00 0.00 3.8 0.0PPT 03/30/96 7.30 37.8 0.18 10.0 9.0 10.2 54.7 0.00 0.00 4.7 1.9111
Caspar Creek - Canopy Throughfall Chemistry - Watershed MUNType Species Date pH Na NH4 K Mg Ca CI NO3 PO4 SO4 SiµM µM µM µM µM µM µM µM µM µMTF RW 01/29/94 7.14 51.1 0.00 24.5 28.8 57.8 61.7 4.06 2.34 5.6 8.2TF RW 01 /29/94 7.26 54.3 0.00 26.0 22.7 38.6 52.8 6.03 2.03 5.2 4.8TF RW 01 /29/94 7.60 37.0 5.51 19.0 18.8 36.0 48.7 2.35 2.45 3.5 5.3TF RW 02/19/94 6.68 46.2 0.00 16.1 15.6 26.2 65.4 0.00 0.00 3.9 0.0TF RW 02/19/94 6.44 45.3 0.00 19.7 11.9 19.5 61.3 0.00 0.00 4.8 0.0TF RW 02/19/94 6.86 53.7 0.00 18.7 22.2 29.8 68.0 0.00 0.00 4.8 0.0TF RW 12/18/94 6.68 244.5 0.00 234.5 81.5 117.5 374.8 0.00 51.53 21.5 18.9TF RW 12/18/94 6.57 242.7 0.00 186.7 86.0 117.5 388.8 0.00 55.55 21.9 10.7TF RW 12/18/94 6.56 292.3 0.00 171.9 85.6 86.8 434.1 0.57 46.28 26.4 18.3TF RW 01 /05/95 5.78 148.3 0.00 48.3 30.9 33.7 175.8 0.00 5.87 9.9 0.0TF RW 01/05/95 6.05 108.3 0.00 50.6 39.1 50.2 135.8 0.00 9.35 6.8 0.0TF RW 01/05/95 6.10 107.9 0.00 45.5 31.3 41.9 130.2 0.00 6.75 7.2 0.0TF RW 01/14/95 5.59 19.3 0.00 21.4 23.4 30.7 93.8 0:00 0.99 4.8 0.6TF RW 01/14/95 5.33 20.7 0.00 18.6 22.5 22.5 90.8 0.00 1.84 5.5 4.7TF RW 01/14/95 5.08 20.1 0.00 19.6 9.0 15.5 103.1 0.54 1.27 5.9 0.0TF RW 02/07/95 6.53 17.9 7.59 9.4 8.3 13.0 42.8 0.00 1.99 3.3 0.0TF RW 02/07/95 6.68 16.0 7.59 8.7 8.1 15.5 38.5 0.00 1.83 2.9 0.0TF RW 02/07/95 6.77 20.6 0.16 12.0 6.7 20.6 48.6 0.00 3.21 3.4 0.0TF RW 02/19/95 5.58 315.6 8.07 94.3 44.5 38.4 174.8 2.05 5.42 10.8 2.9TF RW 02/19/95 5.90 83.3 1.78 51.2 23.5 35.1 139.9 0.58 5.99 10.9 1.6TF RW 02/19/95 5.63 101.9 1.07 75.0 29.9 35.5 147.0 0.00 2.22 9.3 2.2TF RW 03/11 /95 5.49 81.5 0.00 30.0 18.5 25.5 39.2 0.00 1.39 3.1 2.3TF RW 03/11/95 7.13 27.1 2.56 23.7 15.7 32.7 36.8 0.00 2.78 3.1 2.1TF RW 03/11/95 5.47 29.8 0.00 23.2 14.8 35.5 44.1 0.00 1.41 3.9 1.9TF RW 12/17/95 5.67 404.8 4.36 131.5 68.7 65.6 434.4 0.75 28.08 24.4 0.0TF RW 12/17/95 5.65 127.0 0.00 119.2 64.6 112.7 175.8 0.00 15.06 10.5 0.0TF RW 12/17/95 5.66 135.7 0.00 126.3 56.8 47.4 200.3 0.00 19.05 10.0 0.0TF RW 01/02/96 5.56 42.6 2.86 24.8 40.3 24.9 52.3 1.39 0.00 4.0 0.0TF RW 01/02/96 6.54 35.7 0.71 18.7 14.4 19.0 41.1 0.00 0.00 2.8 0.0TF RW 01/02/96 5.58 32.2 1.43 15.3 7.8 7.7 35.9 0.00 0.00 3.2 0.0TF RW 01/20/96 5.74 113.0 0.00 41.9 47.3 37.2 101.2 0.00 3.54 6.2 5.7TF RW 01/20/96 5.86 95.7 0.00 49.4 32.5 36.2 82.8 0.00 5.36 5.4 4.6TF RW 01/20/96 5.58 111.7 0.00 46.81 40.3 42.4 108.3 0.00 3.94 6.4 5.3TF RW 02/11/96 5.78 107.4 0.00 28.91 44.0 63.81 84.9 0.00 2.46 5.0 1.8TF RW 02/11/96 5.78 98.7 0.00 28.4 22.2 35.4 73.8 0.00 0.00 4.5 2.1TF RW 02/11/96 5.77 90.0 7.14 33.2 32.1 32.7 90.0 1.69 0.00 10.3 2.1TF RW 03/17/96 5.35 65.7 2.86 19.7 17.3 33.9 85.9 1.78 0.00 6.1 0.0TF RW 03117/96 5.21 71.3 4.29 22.3 16.9 28.9 101.7 2.49 2.71 6.3 0.0TF RW 03/17/96 5.25 65.21 2.86 19.9 16.9 33.4 93.3 2.42 0.00 5.7 0.0TF RW 06/20/96 6.36 101.9 0.00 67.2 32.6 51.8 133.6 0.00 10.01 9.4 2.2TF RW 06/20/96 6.291 104.9 13.05 68.9 31.4 44.7 136.1 0.00 10.56 11.7 2.5TF RW 06/20/96 6.18 134.6 6.75 100.8 43.7 80.1 176.7 0.00 24.86 15.1 0.9112
Caspar Creek - Canopy Throughfall Chemistry - Watershed MUNType Species Date pH Na NH4 K Mg Ca CI NO3 PO4 SO4 SiµM µM µM µM µM µM µM µM µM µMTF DF 01/29/94 7.02 102.8 6.23 40.8 27.0 36.5 77.4 5.50 6.90 7.1 6.1TF DF 01/29/94 6.89 99.9 8.14 30.3 28.1 30.5 95.3 1.76 5.04 8.0 11.3TF DF 01/29/94 7.10 175.5 0.00 61.1 24.3 31.8 133.5 0.00 5.51 11.0 5.3TF DF 02/19/94 6.89 131.0 0.00 49.1 22.0 26.5 145.3 0.00 4.08 7.4 0.0TF DF 02/19/94 6.51 126.2 3.12 31.4 21.4 28.8 144.7 1.60 1.91 8.1 0.0TF DF 02/19/94 6.60 103.1 0.00 32.3 24.9 79.5 114.0 2.65 3.89 7.1 0.0TF DF 12/18/94 6.35 762.5 0.00 193.9 148.9 107.0 946.6 0.00 61.73 60.7 0.0TF DF 12/18/94 6.13 1048.7 0.00 227.1 183.9 124.0 1396.6 37.01 93.39 114.0 2.4TF DF 12/18/94 6.67 816.0 0.00 293.1 146.9 106.5 1013.8 0.00 68.48 59.2 0.4TF DF 01/05/95 5.59 283.6 0.00 61.6 62.5 86.8 335.1 0.00 8.79 17.4 0.0TF DF 01/05/95 5.76 311.9 0.00 74.7 52.3 39.4 351.4 0.00 7.59 16.7 0.0TF DF 01/05/95 6.49 342.6 0.00 61.3 47.9 38.2 389.0 0.00 4.91 20.5 0.0TF DF 01/14/95 5.58 36.0 0.00 31.4 22.7 24.5 124.4 0.00 2.16 6.7 0.0TF DF 01/14/95 5.59 23.6 0.00 53.9 20.1 18.2 103.4 0.00 2.55 5.9 0.0TF DF 01/14/95 5.69 111.1 1.64 21.1 20.2 26.0 117.5 0.00 2.33 6.0 0.0TF DF 02/07/95 6.26 109.4 0.39 17.7 11.0 13.7 71.2 0.00 3.96 4.2 0.0TF DF 02/07/95 6.51 35.8 0.69 13.7 9.4 15.0 54.7 0.00 4.99 4.1 0.0TF DF 02/19/95 5.51 201.1 0.00 76.3 39.0 32.2 438.7 0.00 9.63 16.3 5.0TF DF 02/19/95 5.34 514.1 0.00 102.2 75.3 191.2 368.6 0.00 8.58 17.3 5.3TF DF 02/19/95 5.17 251.8 1.64 84.2 42.5 43.8 291.6 0.00 10.45 13.4 4.5TF DF 03/11/95 5.45 355.9 0.00 88.8 68.4 204.6 75.5 0.78 4.26 5.1 2.5TF DF 03/11/95 5.58 80.6 0.00 29.8 18.6 24.8 88.0 0.00 4.45 4.8 1.9TF DF 03/11/95 5.87 403.9 0.00 20.7 88.2 138.2 49.1 0.00 3.05 3.5 2.6TF DF 12/17/95 5.46 407.4 0.00 65.4 65.8 57.9 432.8 0.00 15.30 24.8 0.0TF DF 12/17/95 5.66 165.2 0.00 107.4 49.0 50.9 217.4 0.00 21.15 10.1 0.0TF DF 12/17/95 5.51 305.7 0.00 111.5 59.7 66.3 283.9 0.58 25.18 21.1 0.0TF DF 01/02/96 5.41 113.9 0.00 19.7 17.3 17.7 84.0 0.00 0.00 5.9 0.0TF DF 01/02/96 5.61 92.6 0.00 24.8 15.2 19.5 65.5 0.00 0.00 5.7 0.0TF DF 01/02/96 5.48 83.0 0.71 28.4 32.5 43.6 73.1 0.00 2.00 4.7 0.0TF DF 01/20/96 5.39 310.9 0.00 50.6 67.5 30.2 292.8 0.00 2.56 15.0 5.0TF DF 01/20/96 5.54 253.5 0.00 57.3 41.6 38.7 217.1 0.00 4.64 10.9 5.7TF DF 01/20/96 5.53 213.0 0.00 48.1 46.9 58.4 195.9 0.00 4.27 10.6 6.0TF DF 02/11/96 5.74 208.3 0.00 36.3 31.3 34.2 160.6 0.00 1.32 9.4 2.1TF DF 02/11/96 5.83 163.0 0.00 32.5 35.4 41.4 121.7 0.00 1.47 7.3 2.8TF DF 02/11/96 5.60 213.9 0.00 32.7 43.2 35.2 173.2 0.00 1.57 9.9 3.6TF DF 03/17/96 5.56 170.0 0.00 27.1 23.9 32.7 167.4 1.08 0.00 9.1 0.0TF DF 03/17/96 5.61 153.5 0.00 36.3 33.3 67.1 158.8 0.00 4.23 8.5 0.0TF DF 03/17/96 5.58 196.1 0.00 36.3 62.1 50.4 179.3 0.00 0.00 10.0 0.0TF DF 06/20/96 6.13 413.0 0.00 99.3 76.3 72.4 545.0 0.00 8.88 28.1 1.3TF DF 06/20/96 6.38 319.6 0.00 78.9 63.0 57.4 368.3 0.00 10.02 21.9 1.4TF DF 06/20/96 5.98 394.7 0.00 79.3 76.3 69.5 523.5 0.00 10.66 29.8 3.2113
Caspar Creek - Watershed AEI# DATE TIME Streamflow pH Na NH4 K Mg Ca CI NO3 PO4 SO4 HCO3 SiL/s µM µM µM µM µM µM µM µM µM µM µM1 04/16/92 22:25 85.9 7.33 437.4 0.00 26.3 149.0 257.6 386.0 0.00 0.11 76.8 737.1 278.52 04/16/92 23:25 110.5 7.55 428.2 0.00 25.3 149.0 253.9 368.4 0.00 0.00 78.8 733.4 270.83 04/17/92 00:25 110.5 7.40 441.8 0.00 25.8 153.5 268.4 353.7 0.00 0.00 76.5 804.8 279.74 04/17/92 01:25 138.1 7.46 460.1 0.00 26.5 157.4 274.9 392.4 0.00 0.12 77.6 803.6 286.95 04/17/92 02:25 138.1 7.48 464.1 0.00 27.6 158.0 268.6 367.2 0.54 0.08 74.6 827.9 294.36 04/17192 03:25 168.3 7.30 438.6 0.00 25.9 158.6 270.0 404.8 0.00 0.14 77.8 761.1 289.97 04/17/92 04:25 168.3 7.30 477.6 0.00 25.8 156.0 265.1 390.3 0.00 0.00 76.4 802.5 293.38 04/17/92 05:25 201.2 7.54 469.9 0.00 26.0 156.4 256.8 431.9 0.00 0.10 76.5 737.4 293.29 04/17/92 06:25 201.2 7.47 466.7 0.00 25.3 150.3 247.2 420.0 11.80 0.00 75.5 704.3 292.810 04/17/92 07:25 201.2 7.43 481.7 0.00 26.7 153.1 257.6 398.6 3.06 0.15 74.1 779.7 299.611 04/17/92 08:25 201.2 7.55 483.2 0.00 26.2 151.5 254.8 394.2 4.71 0.00 74.4 774.4 298.412 04/17/92 09:25 201.2 7.52 490.3 0.00 26.5 151.4 255.5 411.0 4.32 0.00 74.3 766.7 297.113 04/17/92 10:15 201.2 7.42 478.51 0.00 26.4 150.9 254.3 406.5 6.23 0 00 74 9 752 7 297.5114
Caspar Creek • Watershed ARF# DATE TIME Streamflow pH Na NH4 K Mg Ca CI NO3 PO4 SO4 HCO3 SiL/s µM µM µM µM µM µM µM µM µM µM µM1 04/10/91 10:53 6.7 7.57 480.0 0.00 25.0 143.0 223.0 407.0 0.60 0.00 101.0 627.4 miss<strong>in</strong>g2 04/16/91 11:57 6.7 7.18 476.0 0.00 24.0 163.0 266.0 421.0 0.30 3.00 104.0 725.7 miss<strong>in</strong>g3 04/24/91 11:36 4.2 7.42 506.0 0.00 25.0 175.0 292.0 419.0 0.00 0.30 109.0 827.7 miss<strong>in</strong>g4 05/01/91 12:21 6.7 7.19 499.0 0.00 25.0 168.0 289.0 410.0 0.00 0.20 112.0 803.8 miss<strong>in</strong>g5 02/05/92 11:40 13.9 7.07 559.8 0.00 22.6 171.4 279.4 427.2 2.76 0.00 84.0 886.1 262.56 02/11/92 12:55 238.4 7.51 484.6 0.00 23.7 150.8 246.2 453.2 7.05 0.07 72.3 697.1 252.87 02/13/92 11:46 445.6 7.05 445.0 0.00 23.7 124.6 200.4 458.0 13.61 0.30 60.0 526.8 252.38 02/25/92 14:30 97.9 7.02 458.5 0.00 22.7 131.9 214.3 431.7 0.00 0.09 68.4 605.1 298.89 03/04/92 10:17 30.7 7.23 510.2 0.00 24.4 150.8 247.6 465.8 0.85 0.94 90.0 683.8 298.910 03/11/92 11:55 30.7 7.32 603.7 0.00 24.3 153.4 312.0 471.8 0.40 0.00 86.0 914.5 298.911 03/25/92 11:45 24.3 7.30 505.8 0.00 24.6 147.2 241.3 449.8 0.04 0.31 81.3 694.8 299.712 04/08/92 11:10 6.7 7.66 506.0 0.00 24.8 165.7 273.6 472.0 0.00 0.34 99.9 737.4 299.613 04/16/92 10:30 13.9 7.10 564.7 0.00 30.9 179.3 310.2 468.5 0.00 0.26 94.2 917.3 299.114 04/23/92 12:45 30.7 7.40 527.4 0.00 29.7 158.9 269.9 455.6 0.00 0.40 90.2 778.2 297.715 04/29/92 13:18 10.0 7.44 567.1 0.00 31.5 176.1 300.5 466.4 8.44 0.00 98.8 879.4 302.416 05/06/92 10:39 10.0 7.65 550.8 0.00 22.6 194.3 323.4 464.3 0.00 0.32 104.0 935.9 308.417 05/21/92 11:20 4.2 7.64 536.8 0.00 26.4 193.5 335.8 438.0 0.00 0.49 109.6 964.0 306.718 06/11/92 11:56 1.2 7.39 566.0 0.00 29.2 190.6 339.4 528.1 0.00 0.30 117.0 892.8 311.019 07/09/92 12:00 0.7 7.38 576.1 0.00 29.9 210.6 367.2 526.2 0.00 0.11 119.9 995.6 313.820 08/04/92 10:00 0.1 7.35 603.3 0.00 26.9 223.4 407.9 496.0 0.00 0.00 129.0 1138.8 307.821 09/15/92 11:45 0.0 7.45 608.7 0.00 29.9 238.3 422.8 529.7 0.00 0.21 146.0 1138.8 305.622 11/04/92 16:30 4.2 7.23 630.3 0.00 33.0 230.8 400.4 538.0 2.00 0.00 124.0 1137.7 311.023 11/19/92 11:50 0.4 7.46 600.3 0.00 30.7 238.6 414.2 518.0 0.00 0.00 133.0 1152.5 276.224 12/02/92 12:50 6.7 7.53 574.2 0.00 28.1 226.2 394.2 503.0 0.00 1.00 124.0 1091.2 313.525 12/16/92 14:00 37.9 7.24 451.9 0.00 26.6 148.1 247.3 423.0 5.00 0.00 80.0 681.2 201.426 12/30/92 11:10 492.9 6.81 421.5 0.00 23.5 119.7 206.1 393.9 1.80 0.00 64.4 572.1 269.327 01/12/93 10:57 255.1 7.27 468.2 0.00 22.9 127.9 214.7 411.9 1.86 0.00 62.3 637.9 280.628 02/17/93 12:30 64.4 7.52 452.0 0.00 22.9 139.7 245.6 369.2 0.00 0.00 75.7 725.0 279.829 03/03/93 10:56 64.4 7.55 508.9 0.00 23.0 144.0 249.5 429.0 0.00 0.00 73.0 743.9 299.030 03/24/93 15:05 218.6 7.48 530.7 0.00 28.1 148.1 242.0 406.0 0.00 0.00 67.0 799.0 293.731 04/06/93 12:02 64.4 7.52 539.4 0.00 23.0 152.2 264.5 403.0 0.00 0.00 79.0 834.7 301.632 04/28/93 14:12 64.4 6.84 494.6 0.00 25.8 144.9 270.7 385.9 0.00 0.00 76.9 811.8 277.933 05/12/93 15:36 18.7 6.87 526.6 0.00 25.1 165.1 309.2 416.3 0.00 0.00 89.9 904.1 285.934 05/27/93 15:50 218.6 7.13 553.8 0.00 30.5 153.7 283.8 365.0 0.00 0.00 71.3 951.7 293.635 06/09/93 10:30 54.7 7.08 551.2 0.00 25.4 156.2 289.6 415.2 0.00 0.00 81.6 889.7 313.536 07/02/93 10:20 6.7 7.21 596.3 0.00 28.7 180.9 341.6 440.3 0.00 0.61 98.2 1032.7 318.837 07/22/93 16:00 2.4 7.31 619.0 0.00 28.9 191.2 360.5 508.2 0.00 0.00 109.6 1024.0 308.238 08/10/93 10:50 1.2 7.19 632.8 0.00 27.9 199.3 377.5 449.4 0.00 0.00 113.6 1137.8 306.839 09/07/93 10:40 0.4 7.64 654.7 0.00 28.6 211.3 398.1 518.8 0.00 0.00 121.7 1139.9 300.440 10/20/93 11:51 0.1 6.96 665.5 0.00 23.8 239.4437.9440.7 0.00 0.00 133.6 1336.0 274.941 12/01/93 12:12 1.2 7.38 585.3 0.00 24.1 222.9 387.4 468.3 0.00 1.08 135.3 1090.0 276.842 12/29/93 15:01 4.2 7.32 551.3 0.00 22.2 194.4 341.8 457.3 0.00 0.00 126.9 934.9 281.343 02/02/94 12:31 18.7 7.60 511.6 0.00 23.3 160.1 292.0 423.0 4.05 0.00 92.0 828.0 306.444 02/02/94 14:45 18.7 7.10 513.7 0.00 23.6 160.4 293.2 384.7 2.05 0.00 92.5 872.8 296.645 03/16/94 15:54 13.9 6.73 577.1 0.00 31.8 184.8 318.7 392.7 0.00 0.00 104.3 1014.5 295.346 05/18/94 15:40 6.7 7.37 572.8 0.00 32.8 195.3 3483 395.8 0.00 1.50 108.0 1079.5 293.247 06/29/94 14:00 1.2 7.54 584.6 0.00 41.4 215.4 388.5 625.5 0.00 0.00 121.3 965.7 281.448 10/05/94 10:00 0.7 6.95 729.7 0.00 38.1 286.0 536.6 482.5 0.00 0.82 144.0 1641.7 266.249 11/02/94 14:00 1.2 7.31 691.2 0.00 30.4 283.5 529.8 447.6 0.00 0.88 151.9 1595.8 269.450 12/06/94 14:53 4.2 6.98 584.6 0.00 27.4 276.4 487.7 523.1 8.15 0.00 128.1 1352.7 272.951 01/03/95 11:09 45.9 7.35 481.1 0.00 24.3 154.7 266.0 414.2 2.76 0.00 100.4 729.0 266.652 02/01/95 12:51 697.0 6.40 433.6 0.00 23.7 96.4 189.7 350.3 2.05 0.00 48.8 579.7 278.853 03/01/95 11:39 10.0 6.69 620.8 0.00 27.6 192.7 363.5 428.2 12.14 0.00 94.5 1131.5 305.754 04/05/95 12:20 30.7 6.81 442.5 0.00 24.3 140.7 253.0 407.4 0.00 0.00 70.6 705.4 308.055 05/05/95 13:20 110.5 6.92 450.4 0.00 26.6 134.2 237.9 364.8 0.00 0.00 61.5 733.4 304.656 06/05/95 12:25 10.0 7.30 515.3 0.00 25.4 164.7 297.0 454.6 0.00 0.00 74.9 859.6 299.057 11/01/95 12:00 miss<strong>in</strong>g 7.38 638.3 0.00 29.2 227.6 405.7 455.8 0.00 0.00 124.0 1230.3 267.358 12/05/95 12:00 miss<strong>in</strong>g 7.37 648.7 0.00 29.9 236.6 406.0 436.0 0.00 0.00 121.1 1285.7 245.259 01/11/96 12:00 miss<strong>in</strong>g 7.45 628.3 0.00 35.3 165.8 295.5 424.5 0.00 0.00 92.4 976.9 400.060 02/09/96 13:54 168.3 7.36 431.7 0.00 22.2 126.7 212.3 411.0 0.00 2.80 67.2 583.7 301.861 03/19/96 13:37 85.9 7.46 438.3 0.00 21.5 131.4 220.2 398.8 0.00 0.00 72.2 619.7 303.962 04/03/96 14:30 74.8 7.62 461.8 0.00 22.6 139.1 233.4 460.5 0.00 0.00 79.2 610.6 299.663 05/08/96 09:46 30.7 7.63 489.3 0.00 21.7 158.0 262.5 505.7 0.00 0.00 95.8 654.7 318.9115
Caspar Creek - Watershed BAN# DATE TIME Streamflow pH Na NH4 K Mg Ca CI NO3 PO4 SO4 HCO3 SiL/s µM µM µM µM µM µM µM µM µM µM µM1 04/16/91 12:44 6.77 7.42 674.0 0.00 29.0 278.0 508.0 670.0 0.00 0.00 155.0 1295.0 miss<strong>in</strong>g2 04/24/91 13:02 0.0 7.16 732.0 0.00 29.0 323.0 610.0 669.0 0.00 0.00 164.0 1630.0 miss<strong>in</strong>g3 05/01/91 12:47 0.0 7.30 744.0 0.00 29.0 316.0 613.0 665.0 0.00 0.00 170.0 1626.0 miss<strong>in</strong>g4 02/05/92 13:00 1.4 7.17 633.5 0.00 25.9 200.4 348.4 804.0 0.09 0.13 92.8 767.3 286.05 02/13/92 13:00 14.3 7.03 529.8 0.00 30.3 138.3 239.4 796.0 0.07 0.07 42.6 434.2 259.26 02/25/92 14:50 3.5 7.00 599.4 0.00 29.2 160.1 269.8 809.0 0.37 0.10 66.7 551.7 305.77 03/04/92 11:08 2.5 7.26 673.9 0.00 31.7 198.8 334.2 850.5 0.27 0.16 85.0 751.0 313.48 03/11/92 13:03 2.5 7.57 746.2 0.00 33.9 193.9 368.1 869.0 0.15 0.30 4.7 865.3 327.19 03/25/92 13:05 1.7 7.11 644.8 0.00 30.4 193.3 322.0 793.5 0.21 0.46 91.3 729.0 312.010 04/01/92 14:10 1.7 7.31 660.0 0.00 32.0 217.4 367.2 751.1 0.00 0.00 106.2 897.7 320.111 04/08/92 12:36 2.0 7.23 681.1 0.00 33.8 222.3 378.7 771.4 0.00 0.13 114.8 915.7 323.212 04/16/92 11:27 1.7 7.13 695.1 0.00 35.1 207.6 366.7 746.0 0.20 0.28 88.6 955.1 321.913 04/23/92 13:35 1.7 7.26 699.6 0.00 36.7 196.0 347.5 742.0 0.00 0.38 89.7 901.4 316.814 04/29/92 14:03 1.4 7.25 736.8 0.00 37.4 229.2 397.2 752.0 0.00 0.66 108.4 1057.4 325.715 05/06/92 12:30 1.2 7.37 690.0 0.00 28.8 246.0 423.7 755.1 0.54 0.00 123.5 1055.6 338.316 05/21/92 12:16 0.3 7.28 698.0 0.00 34.1 265.7 471.9 778.9 0.00 0.52 137.5 1153.1 344.417 06/11/92 12:30 0.3 7.24 760.4 0.00 32.2 287.4 539.3 805.7 0.00 0.23 151.9 1336.3 351.418 06/11/92 12:40 0.3 7.04 756.6 0.00 36.8 289.9 545.7 868.1 0.05 0.00 153.4 1289.9 354.719 07/09/92 12:40 1.2 7.16 722.0 0.00 34.2 255.8 461.4 808.2 0.00 0.00 125.5 1131.4 337.720 08/04/92 11:00 0.8 7.46 758.6 0.00 29.9 305.6 578.3 761.0 0.00 0.00 154.0 1487.5 363.121 11/04/92 16:25 2.2 7.53 664.2 0.00 31.5 205.7 369.3 714.0 1.00 0.00 94.0 942.5 335.222 11/19/92 13:00 1.0 7.29 791.6 0.00 33.2 296.2 536.4 793.0 0.00 0.00 146.0 1405.1 283.623 12/02/92 13:15 1.4 7.37 704.7 0.00 30.7 259.2 464.1 691.0 5.00 0.00 122.0 1241.8 271.924 12/16/92 14:30 2.5 7.16 554.6 0.00 32.2 155.9 271.0 645.0 4.00 0.00 74.0 643.5 267.225 12/29/92 13:10 14.3 6.97 585.9 0.00 33.5 146.0 265.2 614.8 15.40 0.00 57.2 697.3 273.126 01/12/93 12:43 6.5 7.28 581.0 0.00 29.3 132.6 233.6 575.1 7.55 0.59 61.6 636.4 302.427 02/17/93 12:45 2.2 7.49 603.8 0.00 28.4 158.4 282.8 626.6 0.00 0.00 81.3 825.3 294.528 03/03/93 15:22 2.2 7.42 639.4 0.00 30.7 1681 289.4 555.0 0.00 0.00 92.0 847.3 299.929 03/24/93 14:40 6.5 7.51 595.9 0.00 30.7 148.1 259.5 493.0 0.00 0.00 73.0 802.7 295.930 04/07/93 12:19 2.8 7.45 865.6 0.00 33.2 172.8 316.9 609.0 0.00 0.00 97.0 1075.1 296.331 04/28/93 11:15 2.8 6.88 616.9 0.00 28.2 163.2 312.8 530.6 0.00 0.00 83.8 898.8 302.132 05/12/93 10:30 1.2 6.81 693.2 0.00 29.2 199.9 378.5 546.5 0.00 0.00 103.6 1125.5 308.233 05/27/93 15:40 7.4 7:18 615.6 0.00 30.8 153.8 298.6 402.8 0.00 0.00 66.4 1015.3 298.934 06109/93 12:30 2.2 7.17 528.0 0.00 24.2 146.3 263.6 388.8 0.00 0.00 74.7 833.7 311.935 07/02/93 15:45 1.2 7.07 763.9 0.00 32.3 231.7 442.9 584.6 0.00 0.00 121.3 1318.3 335.036 07/22/93 15:55 0.8 7.22 814.3 0.00 35.2 266.5 510.0 755.4 0.00 0.00 133.1 1380.7 337.537 08/10/93 12:15 0.4 7.00 971.8 0.00 38.3 289.5 557.6 748.8 0.00 0.00 153.6 1648.2 344.938 09/07/93 11:30 0.4 7.57 880.6 0.00 33.8 326.2 636.3 866.5 0.00 0.00 162.4 1648.2 355.239 12/29/93 15:00 0.8 7.36 679.1 0.00 26.3 240.7 428.7 591.1 4.13 0.73 143.9 1160.5 333.940 02/02/94 14:12 2.0 7.20 618.7 0.00 28.4 168.7 315.4 484.7 7.71 0.00 101.0 921.0 313.641 03/16/94 15:45 1.2 6.66 689.8 0.00 30.7 214.3 391.9 508.0 0.00 0.00 118.7 1187.5 313.642 04/13/94 11:20 1.2 7.40 842.4 0.00 43.7 274.0 497.2 711.9 2.51 0.00 150.8 1412.5 318.743 05/18194 12:05 1.0 7.43 702.4 0.00 35.4 238.2 435.2 522.0 0.00 0.00 119.0 1324.6 311.144 06129/94 12:59 1.0 7.42 756.6 0.00 33.8 304.5 565.1 728.3 0.00 0.00 145.6 1510.1 306.745 10/05/94 13:00 0.1 7.08 904.4 0.00 32.8 413.7 612.0 719.5 16.79 0.00 193.6 1865.2 325.446 12/06/94 13:10 1.7 7.15 674.6 0.00 28.4 345.2 557.3 618.1 9.88 0.00 129.1 1622.1 307.847 01/03/95 13:15 2.8 7:23 548.1 0.00 26.6 145.2 255.0 454.9 5.57 0.00 88.6 737.6 290.648 02/01/95 15:53 11.1 6.44 363.2 0.00 20.1 96:3 172.1 314.0 0.00 0.00 58.0 490.1 281.249 03/01/95 13:09 1.0 6.48 520.4 0.00 25.0 171.4 290.0 528.2 0.00 0.00 106.3 727.3 314.750 04/05/95 13:30 1.2 7.15 565.3 0.00 29.5 165.1 304.8 449.6 0.00 0.00 92.9 899.3 307.751 05/05/95 14:08 2.8 6.90 528.3 0.00 26.9 136.0 247.6 359.8 0.58 0.00 73.5 815.1 307.152 06/05/95 12:53 1.2 7.21 665.1 0.00 36.0 212.6 392.0 571.6 0.65 0.00 91.8 1154.6 310.453 11/01/95 12:00 miss<strong>in</strong>g 7.45 688.7 0.00 29.9 204.5 342.1 480.4 0.00 0.00 94.2 1143.2 291.554 12/05J95 12:00 miss<strong>in</strong>g 7.26 914.8 0.00 34.5 380.7 685.5 856.1 0.00 0.00 215.4 1794.9 306.055 01/11/96 12:00 miss<strong>in</strong>g 7.54 767.0 0.00 38.1 195.9 363.6 504.0 0.00 0.00 116.2 1187.6 447.356 03/19/96 13:22 1.2 7.25 526.5 0.00 24.9 146.6 253.5 400.3 0.00 0.00 91.8 767.6 306.057 04/03/96 14:25 2.2 7.58 479.4 0.00 24.1 143.8 223.2 410.0 0.00 0.00 87.1 653.3 296.158 05/08/96 09:56 1.7 7.55 608.4 0.00 25.3 186.6 320.4 221.5 0.00 0.00 32.0 1362.4 361.2116
Caspar Creek - Watershed CAR# DATE TIME Streamflow pH Na NH4 K Mg Ca CI NO3 PO4 SO4 HCO3 SiL/s µM µM µM µM µM µM µM µM µM µM µM1 04/16/91 13:07 1.5 7.36 523.0 0.00 30.0 226.0 343.0 402.0 0.00 0.00 118.0 1053.0 miss<strong>in</strong>g2 04/24/91 13:34 1.5 7.50 557.0 0.00 28.0 261.0 406.0 383.0 0.00 0.20 122.0 1291.8 miss<strong>in</strong>g3 05/01/91 13:03 1.5 7.49 543.0 0.00 28.0 240.0 383.0 370.0 0.00 0.20 119.0 1208.8 miss<strong>in</strong>g4 02/05/92 13:13 3.1 7.12 540.1 0.00 24.9 199.3 312.6 475.9 19.59 0.11 77.0 939.0 264.65 02/11/92 15:40 13.2 7.32 462.3 0.00 26.1 147.0 228.1 461.3 0.33 0.00 74.4 628.1 235.36 02/13/92 13:40 23.0 7.27 402.8 0.00 23.8 122.7 185.7 454.6 0.00 0.22 60.8 467.0 232.67 02/25/92 15:12 9.7 7.09 431.0 0.00 24.0 132.6 204.6 451.9 0.00 0.09 70.9 535.7 316.38 03/04/92 11:32 6.1 7.22 497.3 0.00 25.9 156.6 236.2 670.0 0.00 0.41 101.7 435.0 289.09 03/11/92 13:32 7.2 7.54 599.2 0.00 27.3 157.1 303.2 499.4 0.06 0.15 86.7 874.3 295.710 03/25/92 13:20 5.5 6.90 466.3 0.00 25.3 149.2 230.3 437.3 1.03 0.17 82.4 647.3 304.711 04/01/92 14:14 5.5 7.26 496.2 0.00 28.4 166.6 254.4 533.1 0.00 0.14 96.7 640.1 306.012 04/08/92 12:58 4.5 7.64 516.3 0.00 26.7 173.9 265.5 519.7 0.00 0.00 105.8 690.7 306.013 04/16/92 11:00 7.2 7.27 598.1 0.00 44.0 198.7 283.4 526.7 0.00 0.21 102.0 875.3 295.914 04/23/92 13:55 7.8 7.39 519.3 0.00 29.9 158.3 253.7 518.2 0.00 0.00 95.9 663.1 303.215 04/29/92 14:42 5.5 7.43 559.8 0.00 35.0 181.4 282.7 523.4 0.00 0.00 103.3 792.9 309.516 05/06/92 12:52 4.5 7.53 538.1 0.00 23.7 198.7 301.9 533.9 0.00 0.00 111.3 806.5 318.217 05/12/92 14:31 4.0 7.30 516.9 0.00 31.1 194.9 297.8 575.1 0.00 0.00 114.3 729.9 318.318 05/21/92 12:52 4.5 7.40 553.8 0.00 29.4 209.3 334.5 534.3 0.00 0.21 119.7 897.0 328.119 06/11/92 13:29 2.3 7.20 579.5 0.00 30.6 214.9 344.8 620.6 0.00 0.38 131.6 845.4 325.820 07/09/92 13:00 4.5 7.35 588.9 0.00 32.1 217.2 339.1 600.1 0.00 0.20 129.5 874.1 310.621 08/04/92 11:50 2.7 7.23 669.0 0.00 30.2 266.1 424.9 622.0 0.00 0.00 145.0 1169.3 324.822 11/04/92 16:20 5.5 6.88 610.3 0.00 40.7 218.4 322.1 578.0 16.00 0.00 126.0 886.0 296.823 11/19/92 13:30 2.3 7.47 648.1 0.00 33.2 263.3 414.2 607.0 0.00 0.00 149.0 1131.2 282.124 12/02/92 13:35 4.0 7.41 643.8 0.00 33.2 250.9 386.7 639.0 6.00 0.00 144.0 1019.3 286.825 12/29/92 14:00 41.1 6.89 408.0 0.00 26.9 117.6 189.9 394.1 16.10 0.00 73.9 491.9 242.426 01/12/93 13:50 17.9 7.13 457.7 0.00 24.0 127.9 199.9 412.0 6.74 0.00 63.7 591.2 287.827 02/17/93 13:04 9.1 7.40 481.4 0.00 28.3 142.3 229.7 401.7 0.00 0.00 78.0 695.8 284.028 03/03/93 13:07 9.1 7.52 530.7 0.00 30.7 156.3 242.0 443.0 0.00 0.00 82.0 751.0 282.929 03/24/93 14:30 18.7 7.20 513.3 0.00 28.1 144.0 227.0 394.0 0.00 0.00 76.0 737.4 328.530 04/07/93 12:38 9.1 7.09 556.8 0.00 25.6 160.4 249.5 422.0 0.00 0.00 85.0 810.2 306.631 04/28/93 12:15 10.4 6.83 580.4 0.00 26.8 154.9 267.2 448.0 0.00 0.00 91.0 821.3 303.732 05/12/93 11:15 7.8 6.88 584.0 0.00 27.6 180.7 298.6 459.1 0.00 0.00 96.9 917.1 308.633 05/27/93 12:00 23.0 7.12 566.7 0.00 26.9 157.1 264.4 377.3 11.16 0.00 77.3 893.5 265.634 06/09/93 13:00 9.1 6.93 558.5 0.00 26.5 164.2 276.9 430.9 0.00 0.00 88.2 860.1 316.435 07/02/93 15:10 4.5 7.01 640.9 0.00 37.4 205.8 341.6 516.1 2.22 0.00 107.9 1039.0 330.436 07/22/93 15:45 2.7 7.21 668.7 0.00 31.9 229.9 381.7 548.2 0.00 0.00 114.0 1147.6 339.437 08/10/93 12:30 3.5 7.20 694.1 0.00 31.0 244.0 406.2 521.1 0.00 0.00 116.6 1271.3 331.138 09/07/93 12:00 3.1 7.53 720.0 0.00 33.0 265.6 445.3 587.8 8.57 0.00 121.9 1334.7 336.239 10/20/93 13:51 1.2 7.29 782.5 0.00 33.8 301.9 487.8 508.5 0.00 0.75 127.4 1631.7 316.840 12/01/93 14:09 1.2 7.23 666.2 0.00 27.9 291.9 451.4 568.3 0.00 0.56 139.6 1332.5 324.541 12/29/93 14:32 1.9 7.34 609.8 0.00 27.9 227.3 354.5 527.5 0.00 0.00 129.3 1015.1 318.342 02/02/94 13:42 9.1 7.10 527.7 0.00 26.3 165.0 274.4 430.6 10.95 0.00 94.6 802.0 332.643 03/16/94 12:17 5.5 6.65 572.5 0.00 30.7 189.1 303.4 451.5 1.73 0.00 106.9 921.3 305.444 04/13/94 14:18 4.5 7.41 836.2 0.00 40.1 237.6 376.9 625.2 4.78 0.00 135.4 1204.6 311.545 05/18/94 16:05 5.5 7.30 616.0 0.00 37.2 220.7 349.3 479.1 0.00 0.00 119.9 1074.3 308.246 06/29/94 12:24 3.1 7.51 642.8 0.00 33.5 260.5 412:7 601.7 2.20 0.00 127.0 1164.8 286.847 11/02/94 14:11 0.0 7.25 714.6 0.00 30.4 250.5 429.5 498.8 0.00 0.00 107.7 1390.9 267.648 12/06/94 13:30 2.3 7.11 635.5 0.00 31.2 269.3 402.1 607.2 10.43 0.00 133.0 1125.9 291.449 01/03/95 13:52 6.6 7.51 509.4 0.00 25.8 167.9 259.7 470.7 9.42 0.00 105.9 698.5 266.950 02/01/95 15:52 44.5 6.50 420.7 0.00 21.2 103.0 192.0 285.4 2.97 0.00 53.9 635.7 271.451 03/01/95 13:28 4.0 6.51 524.5 0.00 23.8 158,6 287.0 439.7 50.36 0.00 98.5 752.4 321.152 04/05/95 13:50 7.8 7.29 453.9 0.00 27.6 144.3 234.8 375.9 1.23 0.00 77.3 708.0 309.953 05/05/95 13:50 11.8 6.86 446.4 0.00 25.4 132.7 218.8 334.3 1.22 0.00 66.4 706.3 307.954 06/05/95 13:12 4.5 7.56 553.1 0.00 34.4 180.8 299.6 452.1 0.00 0.00 77.4 941.5 318.655 01/11/96 12:00 miss<strong>in</strong>g 7.53 629.1 0.00 38.4 178.6 289.8 400.5 0.00 0.00 93.8 1016.1 423.156 02/09/96 13:35 13.2 7.27 430.7 0.00 23.0 126.4 195.9 267.0 0.00 0.00 77.5 676.4 340.957 03/19/96 13:16 7.8 7.37 434.9 0.00 22.1 129.5 201.5 312.0 0.00 0.00 80.6 645.8 310.758 04/03/96 14:20 10.4 7.40 557.1 0.00 24.9 153.7 260.7 445.2 0.00 1.79 87.9 788.0 301.459 05/08/96 10:00 4.5 7.63 502.9 0.00 24.6 168.1 255.8 458.7 0.00 0.00 100.5 715.6 360.1117
Caspar Creek - Watershed DOS# DATE TIME Streamwater pH Na NH4 K Mg Ca CI N03 P04 S04 HCO3 SiL/s µM µM µM µM µM µM µM µM µM µM µM1 04/16/91 10:57 6.8 7.47 512.0 0.00 25.0 150.0 234.0 470.0 0.00 0.50 98.0 638.5 miss<strong>in</strong>g2 04/24/91 14:03 6.1 7.47 532.0 0.00 25.0 185.0 263.0 468.0 0.00 0.00 103.0 739.0 miss<strong>in</strong>g3 05/01/91 13:13 7.6 7.46 539.0 0.00 26.0 164.0 263.0 468.0 0.00 0.30 110.0 730.7 miss<strong>in</strong>g4 11/26/91 10:50 5.1 7.17 586.2 0.00 31.1 189.0 284.8 1032.0 0.00 0.00 138.0 256.9 250.15 11/26/91 11:50 5.1 7.12 612.8 0.00 24.5 196.8 297.8 1108.0 0.00 0.00 146.0 226.5 264.36 11/26/91 13:50 5.1 6.95 611.7 0.00 27.9 199.9 296.6 1131.0 0.00 0.00 144.0 213.7 263.67 11/26/91 18:50 5.1 7.16 615.3 0.00 24.3 198.4 298.2 1216.0 0.10 0.00 140.0 136.6 264.28 11/26/91 20:50 5.1 6.92 610.2 0.00 27.7 197.2 296.9 1252.0 0.20 0.00 148.0 77.8 263.39 11/26/91 21:50 5.1 7.06 604.3 0.00 24.1 195.6 293.9 1231.0 0.00 0.00 147.0 82.5 261.710 11/27/91 02:50 5.1 7.14 649.9 0.00 26.6 200.9 298.3 1148.0 0.00 0.00 146.0 234.9 262.311 11/27/91 03:50 5.1 7.09 632.6 0.00 27.9 199.2 291.9 1147.0 0.00 0.00 142.0 211.7 260.012 11/27/91 06:50 5.1 7.05 618.4 0.00 27.4 199.1 294.4 1139.0 0.00 0.00 141.0 211.7 261.013 11/27/91 20:50 5.1 7.12 628.2 0.00 27.3 201.2 298.4 1051.0 0.10 0.00 142.0 319.5 263.314 11/28/91 05:50 5.1 7.16 616.8 0.00 26.2 200.7 296.8 1239.0 0.10 0.00 144.0 110.7 263.315 11/28/91 20:50 5.1 7.15 629.4 0.00 25.8 200.7 297.6 1188.0 0.00 0.00 142.0 179.8 265.416 11/29/91 05:50 5.1 7.18 615.1 0.00 25.9 201.2 301.8 134.0 0.10 0.00 144.0 224.9 263.217 11/29/91 08:50 5.1 7.29 632.9 0.00 28,4 201.7 296.5 1159.0 2.60 0.00 145.0 206.2 268.718 11/30/91 02:50 5.1 7.16 605.8 0.00 26.9 201.7 299.7 1204.0 0.00 0.00 142.0 147.4 261.419 11/30/91 08:50 5.1 7.09 629.6 0.00 25.2 201.4 303.5 1257.0 0.00 0.00 143.0 121.7 263.220 02/05/92 14:20 9.3 6.65 550.8 0.00 24.6 164.9 257.5 543.1 6.67 0.24 95.2 679.9 271.121 02/13/92 15:15 60.8 7.09 584.7 0.00 28.4 121.1 160.0 740.0 9.50 0.60 71.2 282.9 263.722 02/25/92 15:30 20.4 6.78 477.3 0.00 24.6 130.8 207.0 465.4 8.83 0.14 62.7 577.6 300.523 03/04/92 13:23 12.9 7.26 634.8 0.00 26.3 152.5 301.5 510.7 0.07 0.00 80.4 897.7 292.424 03/11/92 13:57 11.0 7.43 642.2 0.00 26.3 152.3 302.1 506.2 1.52 0.00 81.5 906.7 292.225 03/18/92 15:45 47.7 7.08 498.6 0.00 26.8 128.8 201.8 480.6 16.62 0.00 52.3 584.9 296.526 03/25/92 14:10 8.4 7.21 503.8 0.00 27.2 143.0 223.9 525.5 0.05 0.00 71.9 595.6 300.127 04/01/92 13:47 8.4 7.11 582.4 0.00 29.6 163.0 249.8 649.5 3.97 0.15 93.2 597.6 298.828 04/08/92 13:28 6.8 7.61 541.7 0.00 27.1 158.8 245.0 522.1 0.22 0.18 91.7 670.5 303.629 04/16/92 11:50 11.0 7.28 609.4 0.00 32.4 178.2 286.0 515.0 0.00 0.00 96.3 862.3 302.030 04/23/92 15:10 12.0 7.09 572.5 0.00 31.3 163.3 265.7 485.7 9.23 0.26 84.7 797.2 307.531 04/29/92 15:40 8.4 7.25 591.6 0.00 37.5 169.9 272.2 510.4 4.01 0.00 91.2 816.5 303.432 05/06/92 13:25 7.6 7.48 564.2 0.00 22.8 182.5 284.5 506.7 0.00 0.00 97.0 820.3 313.733 05/21/92 13:43 5.3 7.36 565.8 0.00 27.9 181.8 292.0 504.5 0.00 0.08 100.1 836.6 316.834 06/11/92 14:00 4.0 7.26 558.8 0.00 28.9 170.1 280.0 557.4 0.00 0.16 105.8 718.6 316.335 07/09/92 13:15 5.3 7.32 608.9 0.00 31.6 197.8 315.1 562.5 0.00 0.00 111.6 880.5 299.136 08/04/92 12:10 4.7 7.08 591.1 0.00 28.9 186.3 303.4 538.0 0.00 0.00 114.0 833.5 304.337 09/15/92 14:02 6.8 7.32 627.4 0.00 30.7 207.9 332.8 543.3 0.00 0.08 113.0 970.2 299.438 11/04/92 16:00 6.1 7.09 683.8 0.00 35.5 234.1 368.8 598.0 11.00 0.00 136.0 1044.0 304.839 12/02/92 14:40 7.6 7.30 626.4 0.00 30.7 226.2 359.3 555.0 0.00 1.00 132.0 1008.1 287.840 12/29/92 15:15 59.1 6.75 466.3 0.00 25.3 126.3 209.6 441.7 18.40 0.00 73.1 557.0 251.941 01/12/93 14:30 41.5 7.21 490.7 0.00 23.8 125.0 205.9 459.8 10.05 0.00 55.4 595.6 284.542 02/17/93 13:58 20.4 7.41 490.8 0.00 24.5 130.2 222.0 400.6 1.93 0.00 74.4 668.5 276.043 03/03/93 14:32 19.2 7.42 539.4 0.00 25.6 148.1 242.0 462.0 0.00 0.00 69.0 745.1 297.244 03/24/93 13:30 41.5 7.45 535.0 0.00 25.6 139.9 229.5 440.0 0.00 0.00 63.0 733.4 304.745 04/07/93 14:20 18.1 7.38 569.8 0.00 25.6 148.1 244.5 431.0 0.00 0.00 76.0 797.6 315.146 04/28/93 13:10 18.1 7.32 522.0 0.00 28.3 143.7 259.8 416.0 0.00 0.00 74.3 792.8 294.647 05/12/93 14:20 8.4 6.78 550.9 0.00 27.9 153.7 275.0 429.3 0.00 0.00 80.8 845.1 288.448 05/27/93 13:15 30.3 7.04 580.8 0.00 29.1 182.8 287.5 391.8 0.00 0.00 68.1 982.3 301.949 06/09/93 13:00 16.0 7.11 578.7 0.00 30.0 151.2 271.0 427.1 0.00 0.00 75.9 874.0 314.050 07/02/93 13:39 7.6 7.25 622.5 0.00 26.7 171.9 306.1 495.2 0.00 0.00 89.1 931.9 313.351 07/22/93 15:30 6.8 7.36 670.2 0.00 28.5 186.0 325.3 541.3 0.00 0.00 99.5 981.0 313.152 08/10/93 14:00 5.3 7.20 675.9 0.00 29.9 191.7 335.3 482.2 0.00 0.00 100.9 1075.9 308.753 09/07/93 12:30 6.1 7.40 697.2 0.00 32.3 199.3 349.3 540.1 0.00 0.00 103.4 1079.9 300.354 10/20/93 14:28 5.3 7.02 716.0 0.00 25.8 221.3 370.0 462.3 0.00 0.00 111.3 1239.6 268.355 12/01/93 13:40 4.0 7.47 710.3 0.00 26.7 224.1 380.6 500.8 0.00 0.00 125.2 1195.2 288.056 12/29/93 14:22 6.8 7.34 593.9 0.00 27.3 181:7 320.1 525.8 0.54 1.07 119.1 859.3 278.357 02/02/94 11:25 8.4 7.00 548.4 0.00 24.4 152.5 266.2 427.2 5.86 0.00 90.5 796.3 303.158 03/16/94 14:12 2.8 6.75 571.8 0.00 28.4 168.5 280.9 407.2 0.00 0.00 89.6 912.8 280.259 04/13/94 13:31 5.3 7.39 892.3 0.00 41.7 202.9 348.4 579.7 0.00 0.00 122.5 1211.8 294.160 05/18/94 15:08 5.3 7.42 614.8 0.00 35.3 193.8 325.5 433.7 0.00 0.00 105.5 1044.0 301.1118
Caspar Creek - Watershed DOL# DATE TIME Streamwater pH Na NH4 K Mg Ca CI NO3 PO4 SO4 HCO3 SiL/s µM µM µM µM µM µM µM µM µM µM µM61 06/29/94 10:28 3.4 7.52 602.8 0.00 37.2 204.9 338.4 534.6 0.00 0.00 107.5 977.0 343.662 10/05/94 12:53 3.4 7.17 732.3 0.00 31.4 241.0 421.7 451.2 0.00 0.00 104.0 1429.8 268.263 11/02/94 15:20 2.8 7.25 714.6 0.00 30.4 250.5 429.5 498.8 0.00 0.00 107.7 1390.9 267.664 12/06/94 13:45 6.8 7.22 605.5 0.00 30.2 234.6 401.2 557.2 5.89 0.00 134.6 1075.0 278.665 01/03/95 14:47 17.0 7.48 518.9 0.00 25.1 151.0 241.0 452.3 9.09 0.00 104.4 657.9 280.866 02/01/95 15:00 90.4 6.48 383.7 7.21 22.4 86.4 150.11 404.9 6.50 0.00 42.8 389.3 289.767 03/01/95 14:03 7.6 6.64 511.8 0.00 24.8 134.1 226.5 456.3 34.43 0.00 91.4 584.2 312.868 04/05/95 12:10 11.0 7.24 472.5 0.58 26.1 138.8 239.31 471.8 1.33 0.00 64.7 652.9 313.069 05/05/95 13:30 22.7 6.88 468.7 0.00 23.4 131.2 227.6 388.1 0.00 0.00 54.9 711.8 319.670 06/05/95 13:52 6.8 7.56 549.4 0.00 26.4 159.7 268.9 484.8 0.82 0.00 65.5 816.4 314.171 11/01/95 12:00 miss<strong>in</strong>g 7.31 604.3 0.00 28.6 224.3 387.0 380.7 0.00 1.36 99.5 1274.5 249.872 12/05/95 12:00 miss<strong>in</strong>g 7.40 711.3 0.00 35.8 232.1 363.3 492.3 0.00 0.00 110.6 1224.5 254.473 01/11/96 12:00 miss<strong>in</strong>g 7.46 650.9 0.00 36.3 160.1 264.8 457.7 0.00 0.00 86.2 906.8 436.374 02/09/96 12:51 33.0 7.37 465.1 0.00 22.8 129.0 209.5 386.6 0.00 0.00 71.8 634.8 343.475 03/19/96 13:00 22.7 7.29 476.5 0.00 22.6 132.7 215.7 334.0 0.00 0.00 73.9 714.1 336.776 04/03/96 13:13 22.7 7.35 493.7 0.00 23.3 143.8 228.0 374.4 0.00 0.00 78.8 728.5 334.977 05/08/96 10:13 8.4 7.58 512.2 0.00 22.9 152.6 240.7 532.9 0.00 0.00 85.0 618.9 337.7119
Caspar Creek - Watershed EAG# DATE TIME Streamflow pH Na NH4 K Mg Ca CI NO3 PO4 SO4 HCO3 SiL/s µM µM µM µM µM µM µM µM µM µM µM1 04/16/91 11:16 6.1 7.47 506.0 0.00 27.0 142.0 208.0 513.0 0.00 0.00 109.0 502.0 miss<strong>in</strong>g2 05/01/91 12:52 5.0 7.41 553.0 0.00 30.0 160.0 243.0 520.0 0.00 0.20 124.0 620.8 miss<strong>in</strong>g3 11/26/91 10:50 7.3 7.05 605.2 0.00 29.3 187.4 270.2 260.0 5.60 0.00 146.0 992.0 268.44 11/26/91 11:20 7.3 7.12 598.1 0.00 32.3 190.6 276.1 482.0 4.90 0.00 156.0 764.9 269.65 11/26/91 13:20 7.3 6.91 608.0 0.00 30.2 191.0 275.2 604.0 6.50 0.00 184.0 592.2 267.56 11/26/91 16:20 7.3 6.98 611.8 0.00 29.9 191.5 275.8 599.5 6.30 0.00 170.0 630.6 270.87 11/26/91 19:20 7.3 7.22 639.5 0.00 28.2 193.3 278.8 610.5 10.80 0.00 156.0 678.6 278.28 11/26/91 22:20 7.3 7.35 588.6 0.00 37.5 194.2 280.8 592.0 8.40 0.00 151.0 673.6 269.09 11/26/91 23:20 9.7 7.05 614.3 0.00 41.3 195.9 283.5 602.5 4.80 0.00 147.0 713.1 268.110 11/27/91 00:20 7.3 7.44 611.8 0.00 33.0 192.3 281.2 622.0 3.30 0.00 154.0 658.5 270.011 11/27/91 05:20 7.3 6.80 612.4 0.00 30.1 194.1 279.0 617.5 4.90 0.00 150.0 666.3 272.712 11/27/91 12:20 7.3 6.83 631.8 0.00 32.4 192.6 279.5 613.0 8.30 0.00 152.0 683.2 269.513 11/27/91 18:20 7.3 7.13 637.8 0.00 30.8 197.1 285.2 558.0 4.10 0.00 156.0 759.2 276.114 11/28/91 15:20 7.3 6.98 631.4 0.00 26.4 196.5 285.0 558.0 7.20 0.00 162.0 731.6 276.515 11/29/91 03:20 7.3 6.83 611.7 0.00 29.3 193.4 281.2 570.0 7.30 0.00 149.0 714.8 270.116 11/29/91 15:20 7.3 6.95 594.0 0.00 29.7 196.1 281.3 640.0 8.90 0.00 155.0 619.8 270.817 11/29/91 18:20 7.3 7.29 630.9 0.00 26.6 192.6 275.2 663.0 5.20 0.00 180.0 564.9 271.218 11/29/91 21:20 7.3 6.98 616.4 0.00 26.1 193.7 275.7 641.0 2.60 0.00 155.0 627.9 271.519 02/05/92 14:00 10.4 7.17 564.9 0.00 25.9 143.1 205.1 544.4 0.86 0.00 82.7 576.5 254.720 02/10/92 11:26 9.1 7.13 538.8 0.00 27.2 163.0 241.8 606.8 14.33 0.00 100.9 552.6 276.821 02/11/92 14:35 28.6 7.02 517.3 0.00 26.5 142.7 208.1 563.0 2.42 4.39 81.8 512.0 244.222 02/12/92 05:30 65.2 6.88 470.2 0.00 27.4 128.8 183.8 514.4 3.13 3.78 69.7 462.1 223.823 02/13/92 14:42 43.3 6.95 477.6 0.00 26.0 125.6 183.2 532.4 59.26 0.06 61.6 406.4 240.624 02/14/92 13:53 52.7 6.99 476.8 0.00 26.2 121.3 176.1 525.0 47.19 0.00 62.5 400.7 243.925 02/15/92 15:07 50.3 7.33 454.3 0.00 25.0 118.1 172.4 507.2 2.42 6.93 60.2 423.4 248.026 02/16192 12:55 52.7 7.07 469.4 0.00 25.3 114.8 166.5 526.2 56.69 0.18 56.5 361.4 231.527 02/17/92 18:00 41.1 6.45 467.0 0.00 26.0 111.6 165.6 442.2 57.81 0.39 54.5 438.1 266.128 02/18/92 12:20 26.7 6.68 476.6 0.00 25.3 118.1 174.1 518.8 1.58 0.00 61.3 443.3 260.729 02/19/92 14:29 41.1 6.57 461.1 0.00 24.8 115.3 168.7 519.2 42.79 0.14 58.9 374.0 250.130 02/19/92 23:10 108.4 6.76 435.7 0.00 29.7 105.6 150.0 437.1 63.77 0.00 51.8 372.1 225.631 02/20/92 12:01 78.7 7.28 433.1 0.00 26.0 105.9 155.11 490.1 69.21 0.00 52.0 317.8 241.232 02/21/92 10:58 32.6 7.00 461.9 0.00 26.5 112.1 165.5 494.0 48.52 0.00 54.8 391.5 274.133 02/25/92 15:36 14.7 7.01 483.8 0.00 24.9 124.7 187.5 509.8 34.26 0.00 65.6 457.8 315.834 03/04/92 12.42 9.7 6.93 568.9 0.00 28.2 140.3 204.2 783.9 31.50 0.10 96.9 276.9 287.435 03/15192 15:24 78.7 6.04 549.8 0.00 29.1 109.7 164.9 444.4 63.87 0.00 61.5 96.8 237.636 03/16/92 04:05 81.5 6.67 532.4 0.00 27.5 108.7 159.5 427.3 57.34 0.00 55.5 500.8 241.337 03/16/92 17:25 87.3 6.86 460.3 0.00 29.9 105.8 154.9 435.5 68.34 0.25 52.9 401.6 237.138 03/18/92 14:45 26.7 6.97 475.6 0.001 28.3 117.8 174.0 484.8 46.35 0.00 61.2 434.1 278.539 03/25/92 14:40 9.1 7.08 543.6 0.001 27.5 134.1 196.9 605.8 18.98 0.00 84.2 539.9 293.340 04/01/92 13:25 8.4 6.81 581.2 0.00 30.0 149.5 220.0 733.4 34.75 0.12 104.7 372.6 287.441 04/08/92 13:30 5.5 7.31 556.0 0.00 29.2 150.8 220.8 570.0 9.42 0.00 99.5 550.1 282.542 04/16/92 11:25 9.7 7.15 617.4 0.00 34.7 165.8 253.9 556.7 9.82 0.00 102.2 720.7 292.443 04/23/92 14:35 7.8 7.16 565.2 0.00 31.4 147.3 227.9 538.1 18.82 0.81 96.3 596.8 300.544 04/29/92 15:28 7.8 7.26 594.5 0.00 36.6 158.1 240.6 534.1 8.34 0.00 102.0 682.1 297.545 05/06/92 14:05 6.6 7.40 580.0 0.00 24.41 173.5 254.9 547.9 2.74 0.00 109.3 691.8 307.546 05/21/92 14:59 5.51 7.26 574.1 0.00 29.9 174.3 264.7 527.1 0.46 0.00 113.6 727.1 315.047 06111/92 13:40 5.01 7.26 576.5 0.00 31.3 172.4 266.2 586.4 0.00 0.00 127.3 644.1 321.348 07/09/92 14:00 4.5 7.20 609.3 0.00 32.7 191.5 288.8 676.2 4.87 0.00 127.0 767.6 299.149 08/04/92 12:40 4.5 7.23 656.8 0.00 30.2 209.8 326.6 557.0 0.00 0.00 134.0 934.8 313.550 09/15/92 14:35 4.0 7.41 657.8 0.00 33.8 226.9 340.3 590.8 5.50 0.00 148.8 932.0 307.351 11/04/92 15:50 5.5 7.17 692.9 0.00 37.3 220.9 334.1 578.0 37.00 0.00 138.0 949.2 309.952 11/25/92 14:10 5.5 7.48 656.8 0.00 33.2 218.0 326.8 594.0 20.00 0.00 149.0 867.8 302.653 12/02/92 14:15 6.6 7.66 639.4 0.00 33.2 213.9 324.4 574.0 19.00 0.00 148.0 860.2 266.854 12/29/92 14:40 45.6 6.90 484.6 0.00 27.6 118.5 182.1 437.4 35.10 0.00 74.4 492.1 258.555 01/12/93 14:20 23.0 7.20 488.8 0.00 25.3 109.9 173.5 407.6 22.99 0.00 67.5 515.3 283.356 02/17/93 14:27 13.2 7.34 511.1 0.00 25.7 126.3 202.7 384.3 10.72 0.00 81.8 636.0 279.457 03/03/93 14:50 9.1 7.42 530.7 0.00 28.1 131.6 202.1 408.0 1.00 0.00 82.0 653.3 282.158 03/24/93 14:00 23.9 7.59 539.4 0.00 28.1 127.5 194.6 376.0 0.00 0.00 76.0 683.8 320.059 04/07/93 12:31 11.8 7.58 595.9 0.00 28.1 135.7 209.6 401.0 0.00 0.00 89.0 735.7 286.960 04/28/93 12:40 10.4 6.86 521.1 0.00 25.5 132.4 226.0 388.4 0.00 0.00 84.5 706.1 288.5120
Caspar Creek - Watershed EAG# DATE TIME Streamflow pH Na NH4 K M Ca CI NO3 PO4 SO4 HCO3 SiL/s µM µM µM µM µM µM µM µM µM µM µM61 05/12/93 12:10 6.6 6.97 562.4 0.00 31.7 144.8 246.3 424.7 0.00 0.00 94.1 763.3 283.262 05/27/93 12:50 17.9 7.16 583.4 0.00 27.3 148.8 249.2 382.2 0.00 0.00 73.3 878.0 284.263 06/09/93 12:40 10.4 7.18 578.6 0.00 28.0 141.7 239.8 423.8 0.00 0.00 93.7 758.3 306.564 07/02/93 14:40 6.1 7.16 634.4 0.00 29.9 164.2 275.3 469.8 0.00 0.57 105.0 862.9 300.265 07/22/93 15:45 5.5 7.14 663.1 0.00 31.4 185.9 305.0 520.5 0.00 0.00 109.3 937.1 305.266 08/10/93 13:30 3.5 7.07 682.6 0.00 32.8 196.8 323.9 478.4 0.00 0.00 115.4 1047.7 303.567 09/07/93 13:07 2.7 7.34 723.2 0.00 34.5 214.0 349.2 565.9 0.00 0.54 124.6 1068.4 304.068 12/29/93 14:05 3.5 7.32 598.0 0.00 36.1 176.4 278.1 490.0 12.62 0.00 129.2 782.0 291.169 02/02/94 12:10 9.1 7.10 533.1 0.00 26.2 135.4 226.7 383.6 14.41 0.00 98.2 689.0 292.670 03/16/94 13:50 7.8 6.58 579.3 0.00 31.1 157.5 248.7 396.4 0.00 0.00 105.6 815.1 276.071 05/18/94 13:15 6.1 7.35 595.0 0.00 40.9 172.4 275.3 415.7 0.00 0.00 113.7 888.2 290.472 06/29/94 10:51 5.5 7.62 611.6 0.00 88.9 197.3 307.2 580.8 0.00 0.00 122.1 884.5 269.173 12/06/94 14:11 6.6 7.25 578.5 0.00 30.2 168.3 274.7 508.6 16.20 0.00 121.4 727.2 286.474 01/03/95 14:31 11.8 7.16 492.0 0.00 26.1 133.7 205.1 408.2 17.57 0.00 99.9 570.1 272.675 02/01/95 15:45 43.3 6.55 397.3 0.00 21.0 100.3 180.3 280.8 21.85 0.83 54.8 566.5 274.276 03/01/95 14:56 6.1 6.67 474.9 0.00 22.9 146.5 265.2 399.8 52.20 0.00 95.3 678.6 299.177 04/05/95 12:10 9.1 7.14 453.0 0.00 25.9 126.3 204.2 346.1 8.65 0.00 73.3 638.5 291.378 05/05/95 12:41 16.3 7.02 443.4 0.00 24.3 114.0 192.6 307.5 4.34 0.00 64.1 641.0 293.279 06/05/95 13:33 6.6 7.56 527.4 0.00 28.0 145.2 235.1 413.2 4.32 0.00 72.0 754.7 298.280 11/01/95 12:00 miss<strong>in</strong>g 7.29 622.6 2.14 32.0 291.4 469.6 388.4 4.30 0.00 100.7 1584.4 260.981 12/05/95 12:00 miss<strong>in</strong>g 7.30 755.2 0.00 38.1 258.0 381.5 506.7 0.00 0.00 118.3 1329.2 267.682 01/11/96 12:00 miss<strong>in</strong>g 7.39 622.2 0.00 37.1 142.4 221.9 358.7 0.00 0.00 92.2 844.9 438.183 02/09/96 13:01 16.3 7.29 424.4 0.00 22.7 110.2 197.0 224.6 0.00 0.00 76.3 684.2 319.684 03/19/96 12:49 16.3 7.31 437.2 0.00 22.9 108.7 169.6 291.7 0.00 0.00 77.6 570.0 318.985 04/03/96 13:34 13.2 7.30 466.6 0.00 23.7 127.9 196.3 282.2 0.00 0.00 80.5 695.5 310.386 05/08/96 10:23 7.8 7.46 492.4 0.00 24.5 133.1 202.9 376.9 0.00 0.00 83.6 645.0 328.1121
Caspar Creek - Watershed FLY# DATE TIME Streamflow pH Na NH4 K M Ca CI NO3 PO4 SO4 HCO3 SiL/s µM µM µM µM µM µM µM µM µM µM µM1 02/05192 14:10 18.9 7.14 480.9 0.00 22.3 154.8 250.3 493.0 3.22 0.00 97.4 622.4 275.32 02/13/92 15:30 209.6 7.40 425.8 0.00 22.6 117.3 183.4 373.3 12.37 0.08 57.7 548.5 257.83 03/04/92 13:48 30.6 7.32 576.2 0.00 24.2 137.6 291.2 418.1 0.30 0.20 80.9 877.8 299.14 03/11/92 12:35 28.8 7.29 506.3 0.00 24.6 142.2 224.1 425.0 0.71 0.28 81.8 674.1 303.75 03/25/92 15:17 32.5 7.30 491.3 0.00 24.0 33.7 210.1 427.9 0.00 0.00 83.6 607.9 303.86 04/01/92 13:04 17.4 7.09 481.3 0.00 26.0 145.7 231.9 430.8 0.00 0.18 83.2 665.2 304.27 04/08/92 12:50 25.3 7.65 485.6 0.00 24.8 153.2 243.3 431.8 0.00 0.00 91.3 688.9 311.58 04/16/92 12:17 20.4 7.28 563.9 0.00 30.3 165.6 270.7 439.0 0.00 0.00 88.5 850.7 306.79 04/23/92 13:49 25.3 7.42 527.7 0.00 30.7 153.2 255.0 426.8 0.00 0.25 83.6 780.6 310.310 04/29/92 14:35 13.4 7.36 530.4 0.00 30.7 160.2 262.9 439.3 10.98 0.14 90.7 775.5 308.011 05/06/92 13:30 13.4 7.63 499.0 0.00 26.3 166.7 270.7 422.0 0.00 0.25 93.4 795.1 319.312 05/21/92 16:33 6.8 7.55 520.1 0.00 26.7 180.0 298.1 438.9 0.00 0.30 97.5 868.9 322.313 06/11/92 13:00 3.6 7.45 523.5 0.00 27.4 174.2 297.6 451.0 0.00 0.48 100.4 842.4 325.514 07/09/92 12:34 6.8 7.15 554.1 0.00 31.0 199.1 332.2 465.7 0.00 0.47 101.8 978.1 331.115 08/04/92 13:10 1.4 7.38 533.7 0.00 30.7 196.8 331.6 442.0 0.00 0.00 107.0 963.2 312.916 09/15192 13:20 0.0 7.40 558.1 0.00 28.9 223.0 376.3 443.6 0.00 0.09 115.1 1111.7 317.917 11/19/92 14:50 1.8 7.49 569.8 0.00 30.7 230.4 386.7 467.0 0.00 0.00 114.0 1139.7 321.618 12/02/92 15:00 8.8 7.32 565.5 0.00 28.1 222.1 374.3 459.0 1.00 1.00 104.0 1117.4 317.319 12/16/92 14:00 27.0 7.14 427.6 0.00 25.3 136.6 221.8 392.0 5.00 0.00 75.0 622.6 279.420 12/30/92 14:30 218.9 6.96 418.4 0.00 25.1 116.8 196.1 374.9 1.40 0.00 61.3 570.5 275.621 01/12/93 13:00 64.4 7.37 454.1 0.00 22.6 119.2 195.2 385.9 3.18 0.00 59.5 597.4 280.922 02/17/93 15:00 59.2 7.52 447.5 0.00 22.1 135.4 234.5: 349.0 0.00 0.00 71.7 717.1 284.923 03/03/93 13:42 54.3 7.62 508.9 0.00 25.6 148.1 239.5 397.0 0.00 0.00 73.0 766.7 294.024 03124/93 15:05 149.9 7.54 517.6 0.00 28.1 131.6 219.6 392.0 0.00 0.00 64.0 728.1 288.225 04/07/93 13:17 44.9 7.57 513.3 0.00 23.0 144.0 237.0 383.0 0.00 0.00 74.0 767.3 301.726 04/10/93 13:33 8.8 7.60 458.0 0:00 25.0 143.0 223.0 399.0 1.80 0.00 91.0 632.2 303.727 04/16193 10:43 8.8 7.43 458.0 0.00 24.0 148.0 230.0 416.0 0.00 0.00 95.0 632.0 310.728 05/01/93 12:18 8.8 7.42 506.0 0.00 27.0 159.0 261.0 408.0 0.00 0.00 102.0 761.0 317.629 05/12/93 14:25 28.8 6.86 503.0 0.00 24.4 152.9 276.9 375.6 0.00 0.00 78.2 854.9 290.930 05/27/93 13:38 120.1 7.11 538.2 0.00 25.5 145.7 259.0 356.7 8.93 0.00 66.5 874.6 293.031 06/09/93 11:45 49.5 7.20 661.6 0.00 29.0 173.7 330.4 542.6 4.63 0.00 89.8 971.9 316.132 07/02/93 13:30 11.0 7.14 578.4 0.00 29.8 171.1 308.3 419.9 0.00 0.00 85.6 975.8 315.033 07/22/93 15:30 8.8 7.36 590.6 0.00 29.4 182.8 328.7 477:9 0.00 0.00 92.7 979.6 318.834 08/10/93 14:30 5.1 7.21 606.3 0.00 27.8 192.1 346.2 425.3 0.00 0.00 94.3 1097.0 320.335 09/07/93 13:49 4.3 7.47 621.2 0.00 28.7 202.6 368.8 464.2 0.00 0.00 99.5 1129.4 316.136 10/20/93 15:15 2.4 7.29 622.9 0.00 22.3 228.3 400.4 397.7 0.00 0.67 103.9 1296.4 297.537 12/01/93 13:24 2.4 7.49 618.5 0.00 27.1 225.0 403.4 444.8 0.00 0.94 109.8 1237.0 299.938 12129/93 13:00 5.1 7.42 521.5 0.00 22.4 185.7 319.0 440.2 0.00 1.26 109.5 893.0 304.839 02/02/94 10:58 28.8 7.20 486.5 0.00 22.6 148.8 263.6 367.7 3.71 0.00 84.8 792.8 302.740 03/16/94 13:26 22.0 6.75 521.6 0.00 33.8 165.1 284.1 373.3 0.00 0.00 83.1 914.1 287.841 04/13194 13:37 16.0 7.06 591.3 0.00 28.0 195.0 335:9 410.9 0.86 0.00 99.6 1070.0 304.242 05/18/94 14:46 22.0 7.36 543.7 0.00 34.3 185.5 320.8 377.7 0.00 0.00 91.0 1030.9 307.543 06/29/94 11:53 3.0 7.62 578.0 0.00 28.0 209.2 363.0 442.9 0.00 0.00 103.7 1100.1 280.944 10/05/94 12:23 0.0 7.26 641.1 0.00 28.7 255.5 467.9 382.9 0.00 0.00 116.0 1501.6 275.745 11/02/94 14:45 1.4 7.66 635.1 0.00 27.8 266.9 485.5 451.3 0.00 0.00 126.3 1463.7 280.046 12/06/94 13:17 8.8 7.16 548.1 0.00 25.3 194.2 349.6 511.2 1.25 0.00 110.8 926.9 282.747 01/03/95 14:10 34.4 7.45 475.9 0.00 22.8 148.5 244.3 420.9 0.98 0.00 90.0 682.4 272.648 02/01/95 13:11 392.8 6.57 338.3 0.00 20.9 88.3 151.8 337.6 2.92 0.00 48.7 401.5 288.549 03101/95 14:28 17.4 6.62 443.1 0.00 23.4 144.3 234.4 417.0 14.27 0.00 89.6 613.3 312.450 04/05/95 10:40 32.5 7.02 422.9 0.00 23.7 130.5 227.5 401.4 0.00 0.00 63.1 634.8 306.751 05/05/95 11:46 69.8 7.08 437.8 0.00 22.4 127.1 220.2 364.0 0.61 0.00 56.4 677.6 308.852 06/05/95 13:08 13.4 7.60 500.2 0.00 24.9 157.0 271.5 433.2 0.83 0.00 60.7 826.7 305.153 11/01/95 12:00 miss<strong>in</strong>g 7.34 593.9 0.00 27.9 257.2 410:5 330.3 0.00 0.00 90.1 1446.6 272.654 12105/95 12:00 miss<strong>in</strong>g 7.31 617.4 0.00 29.9 230.0 382.5 413.4 0.00 0.00 98.6 1261.9 260.955 01/11/96 12:00 miss<strong>in</strong>g 7.45 585.7 0.00 34.8 156.4 264.6 401.9 0.00 0.00 82.9 894.7 422.856 02/09/96 12:18 99.7 7.26 431.2 0.00 21.8 121.5 196.6 321.3 0.00 0.00 73.3 621.2 322.857 03/19/96 11:13 49.5 7.36 442.5 0.00 21.2 125.9 209.4 291.8 0.00 0.00 74.3 693.8 316.758 04/03/96 14:00 40.6 7.30 511.2 0.00 25.5 134.0 228.4 374.1 0.00 0.00 84.3 718.7 303.659 04/03/96 14:00 40.6 7.54 456.6 0.00 21.8 135.8 220.6 347.9 0.00 0.00 76.2 691.0 317.4122
Caspar Creek - Watershed GIB# DATE TIME Streamflow pH Na NH4 K M Ca CI NO3 PO4 SO4 HCO3 SiL/s µM µM µM µM µM µM µM µM µM µM µM1 04/10/91 13:03 3.5 7.66 452.0 0.00 26.0 160.0 235.0 352.0 0.00 0.20 85.0 745.8 miss<strong>in</strong>g2 04/16/91 10:12 2.8 7.53 470.0 0.00 27.0 171.0 251.0 362.0 0.00 0.20 91.0 796.8 miss<strong>in</strong>g3 04/24/91 12:43 3.2 7.49 532.0 0.00 25.0 165.0 263.0 361.0 0.00 0.00 103.0 846.0 miss<strong>in</strong>g4 05/01/91 11:22 3.2 7.52 505.0 0.00 27.0 196.0 306.0 340.0 0.00 0.00 99.0 998.0 miss<strong>in</strong>g5 12/06/91 11:00 2.2 7.05 622.1 0.00 28.6 233.5 363.5 490.0 1.40 0.00 101.0 1151.3 299.86 12/06/91 15:00 2.2 7.16 529.1 0.00 34.9 229.2 358.4 410.0 3.20 0.00 122.0 1081.8 296.27 12/06/91 16:10 2.2 7.44 502.7 0.00 35.6 229.5 356.3 396.0 0.00 0.00 101.0 1111.8 289.78 12/06/91 19:10 3.4 6.74 521.1 0.00 32.8 234.2 363.2 407.0 2.90 0.00 107.0 1125.0 283.89 12/07/91 03:10 2.2 7.30 546.1 0.00 28.3 244.9 376.4 437.0 0.00 0.00 117.0 1146.0 308.310 12/07/91 06:10 2.2 6.69 535.1 0.00 29.3 239.7 366.2 414.0 0.00 0.00 110.0 1142.2 300.511 12/07/91 09:10 3.4 7.33 536.4 0.00 28.7 237.3 363.2 406.0 12.60 0.00 115.0 1117.4 301.512 12/07/91 15:10 3.4 7.46 518.9 0.00 28.3 223.0 333.9 425.0 0.00 0.00 126.0 984.0 301.013 12/07/91 18:10 3.4 7.43 524.5 0.00 31.8 235.2 355.8 404.0 0.00 0.00 131.0 1072.4 302.714 12/07/91 21:10 3.4 7.64 519.5 0.00 31.9 221.0 329.3 399.0 1.80 0.00 114.0 1023.3 300.915 12/08/91 00:10 3.4 7.58 514.8 0.00 28.4 222.0 331.9 426.0 0.00 0.00 115.0 995.1 301.316 12/08/91 06:10 2.2 7.43 533.0 0.00 28.7 220.2 328.2 421.0 0.00 0.00 112.0 1013.6 301.617 12/08/91 15:10 2.2 7.27 533.0 0.00 27.6 217.7 324.1 406.0 0.00 0.00 116.0 1006.4 310.118 02/05/92 13:25 5.7 7.05 451.1 0.00 25.0 147.5 211.9 487.3 8.46 0.00 78.0 543.2 296.519 02/11/92 13:37 18.3 7.16 420.6 0.00 26.0 134.3 192.6 369.0 25.00 0.30 62.2 581.6 264.620 02/12/92 04:04 33.8 6.99 379.1 0.00 33.2 120.2 170.9 340.8 1.68 1.03 54.8 541.4 245.121 02/12/92 16:54 36.5 7.13 367.9 0.00 29.6 118.8 161.8 330.5 25.22 0.41 50.1 502.3 251.222 02/13/92 14:45 30.9 7.24 367.7 0.00 27.1 110.4 158.1 358.6 16.93 0.12 50.9 454.6 263.923 02/15/92 12:45 41.5 6.87 370.3 0.00 27.0 103.0 146.9 353.7 21.36 0.31 46.8 428.2 258.224 02/17/92 13:00 36.8 6.88 370.5 0.00 29.9 100.4 145.7 333.7 12.22 0.07 44.3 458.0 266.325 02/19/92 13:45 33.1 6.95 370.2 0.00 25.7 100.0 143.9 340.0 4.21 0.00 47.3 444.9 258.126 02/20/92 02:13 73.5 6.91 355.9 0.00 32.9 99.2 142.4 334.0 18.24 0.00 44.5 430.9 245.027 02/20/92 10:30 56.7 7.18 359.3 0.00 29.2 99.5 139.6 334.2 25.22 0.11 43.6 420.1 251.828 02/21/92 14:27 32.3 6.89 354.6 0.00 26.6 101.4 142.3 346.2 5.27 0.00 44.9 427.5 281.129 02/22/92 13:32 26.7 6.92 370.8 0.00 27.0 105.8 146.2 354.0 3.52 0.00 47.5 449.3 280.130 02/23/92 11:05 21.4 6.96 549.1 0.00 27.5 92.4 110.2 643.9 0.79 0.00 37.8 261.4 234.031 02/25/92 14:33 13.2 7.00 387.0 0.00 25.9 106.7 153.1 367.5 0.00 0.00 54.6 455.7 300.032 03/04/92 12:16 7.4 7.32 556.8 0.00 29.7 132.0 266.3 400.5 0.42 0.00 67.4 847.4 303.233 03/11/92 11:45 8.3 7.31 438.4 0.00 29.7 130.9 185.4 406.6 0.00 0.00 67.7 558.6 310.434 03/15/92 15:11 35.3 7.13 411.9 0.00 28.3 107.4 150.3 323.9 24.90 0.06 49.7 507.4 258.635 03/16/92 05:30 77.4 6.93 357.0 0.00 33.5 96.8 144.1 281.4 30.94 0.13 43.0 473.9 223.636 03/16/92 16:11 65.9 6.93 355.5 0.00 31.3 101.1 143.2 316.3 26.56 0.00 42.7 447.2 256.037 03/16/92 20:10 60.3 6.85 357.5 0.00 32.3 100.9 145.4 319.0 19.20 0.00 42.1 459.9 248.538 03/18/92 15:00 22.7 7.10 402.7 0.00 27.4 106.8 148.0 354.1 5.70 0.00 48.5 483.1 288.839 03/25/92 15:25 8.3 6.62 409.3 0.00 32.3 124.4 176.3 404.2 4.38 3.20 67.3 496.6 303.740 04/01/92 12:25 6.5 6.45 453.1 0.00 29.2 138.8 195.9 412.0 0.39 0.00 72.1 595.0 307.841 04/08/92 11:30 4.9 7.58 466.3 0.00 44.7 144.5 205.5 436.0 4.14 0.00 77.6 615.7 303.542 04/16/92 12:55 6.5 7.33 518.4 0.00 34.1 160.5 234.5 412.6 0.00 0.39 76.1 777.3 315.143 04/23/92 13:19 8.7 7.30 464.4 0.00 30.6 135:4 199.7 399.9 2.37 0.00 68.4 626.2 308.144 04/29/92 13:40 6.5 7.28 503.3 0.00 34.5 151.5 223.9 411.2 78.41 0.00 74.4 650.3 319.945 05/06/92 12:50 6.5 7.49 449.8 0.00 27.6 157.8 225.3 405.3 0.00 0.00 79.2 679.8 338.246 05/12/92 15:03 4.2 7.40 451.7 0.00 28.2 161.3 233.1 402.4 0.00 0.18 80.0 706.1 334.447 05/21/92 16:10 4.9 7.48 481.7 0.00 27.8 172.0 256.8 396.5 0.00 0.10 83.3 804.0 342.848 06/11 /92 12:35 2.8 7.37 496.1 0.00 28.9 174.7 270.8 414.9 0.00 0.37 85.9 828.7 350.449 07/09/92 11:37 3.5 7.34 504.0 0.00 30.2 191.2 288.9 428.4 0.00 0.30 87.5 890.7 334.150 08/04/92 13:35 3.2 7.28 506.7 0.00 26.3 199.9 319.6 398.0 0.00 2.00 93.0 986.1 345.551 09/15/92 12:50 4.2 7.35 533.6 0.00 30.2 225.4 352.2 403.3 0.09 0.00 99.5 1116.7 354.452 11/04/92 15:00 3.5 7.17 571.1 0.00 32.2 229.5 352.3 439.0 5.00 2.00 94.0 1133.0 348.453 11/19/92 14:10 3.2 7.48 530.7 0.00 30.7 226.2 351.8 412.0 0.00 1.00 97.0 1110.4 274.754 12/02/92 14:02 3.5 7.44 526.3 0.00 30.7 222.1 346.8 397.0 1.00 0.00 95.0 1106.9 273.555 12/16/92 14:25 11.1 7.02 393:2 0.00 27.9 120.5 176.1 349.0 14.00 0.00 61.0 529.4 268.956 12/29/92 14:35 32.3 7.06 379.7 0.00 25.6 114.4 172.2 306.4 13.00 0.00 55.5 547.9 258.657 01/12/93 12:18 18.9 7.31 413.0 0.00 25.2 109.2 161.8 324.4 13.37 0.00 53.4 535.6 290.458 02/17/93 15:51 10.1 7.33 426.8 0.00 25.2 124.6 193.4 323.9 0.00 0.00 61.4 641.3 290.759 03/03/93 13:31 10.1 7.61 461.1 0.00 25.6 127.5 189.6 330.0 0.00 0.00 65.0 660.9 299.260 03/24/93 14:43 16.6 7.55 448.0 0.00 28.1 127.5 184.6 325.0 0.00 0.00 61.0 653.5 283.561 04/07/93 13:45 10.1 7.60 461.1 0.00 25.6 135.7 207.1 329.0 0.00 0.00 65.0 713.3 304.862 05/12/93 14:20 5.7 6.89 472.9 0.00 30.9 148.9 242.6 350.1 0.00 0.00 67.2 802.5 293.863 05/27/93 14:05 12.2 7.19 498.1 0.00 25.0 150.2 246.0 311.3 0.00 0.00 58.9 886.4 304.064 06/09/93 11:54 9.2 7.31 520.1 0.00 44.8 140.3 235.0 392.2 0.00 1.24 67.4 787.2 317.665 07/02/93 11:45 4.2 7.24 542.8 0.00 26.4 168.7 276.9 382.7 0.38 0.00 77.8 921.8 328.666 07/22/93 15:10 3.5 7.33 566.1 0.00 27.8 191.6 308.0 412.9 0.00 0.53 81.9 1015.7 334.667 08/10/93 12:40 2.8 7.24 583.5 0.00 28.0 204.9 331.8 370.1 0.00 0.56 83.9 1146.3 333.568 09/07/93 14:30 2.8 7.51 606.5 0.00 30.0 225.3 369.7 410.4 0.00 0.00 90.2 1235.7 340.369 10/20/93 14:24 2.8 6.93 627.2 0.00 23.8 255.5 412.2 355.3 0.00 0.00 96.1 1438.9 317.870 12/01/93 12:20 2.2 7.19 560.6 0.00 27.0 246.5 385.3 409.2 0.73 0.00 107.3 1226.7 328.8123
Caspar Creek - Watershed GIB# DATE TIME Streamflow pH Na NH4 K M Ca Cl NO3 PO4 SO4 HCO3 SiL/s µM µM µM µM µM µM µM µM µM µM µM71 12/29/93 13:07 1.2 7.48 505.3 0.00 21.0 179.4 305.9 384.4 0.00 0.83 106.8 898.0 310.472 12/29/93 13:40 2.8 7.36 515.5 0.00 23.5 191.2 304.0 387.5 0.84 0.63 92.6 955.2 331.073 02/02/94 10:10 4.9 7.50 463.8 0.00 24.6 141.0 229.5 .347.6 4.17 0.00 69.5 738.6 316.274 03/16/94 13:05 4.9 6.62 503.6 0.00 27.9 164.3 256.0 338.3 0.00 0.00 73.6 886.5 304.075 04/13/94 13:10 2.8 7.90 550.8 0.00 30.3 191.4 301.8 387.5 0.00 0.00 81.2 1017.6 307.276 05/18/94 13:45 3.5 7.43 511.5 0.00 35.4 186.8 290.0 358.9 0.00 0.00 76.1 989.0 308.277 06/29/94 14:45 3.5 7.56 521.7 0.00 29.0 211.8 330.8 405.7 0.00 0.00 83.9 1062.4 292.578 10/05/94 12:46 1.7 7.12 590.3 0.00 27.0 280.8 472.8 360.5 0.77 0.00 98.6 1566.0 304.879 11/02/94 14:05 2.8 7.59 613.2 0.00 26.5 299.8 509.8 362.6 0.00 0.00 108.2 1680.0 316.480 12/06/94 12:46 4.2 7.22 506.3 0.00 26.3 191.7 314.4 416.3 1.51 0.00 95.9 935.3 302.681 01/03/95 13:37 8.7 7.44 431.1 0.00 23.5 144.0 217.6 357.7 3.76 0.00 76.2 663.9 278.682 02/01/95 12:43 29.5 6.62 535.3 0.00 23.7 128.3 216.1 264.9 5.55 0.00 46.6 884.1 281.483 03/01/95 14:20 5.7 6.66 449.8 0.00 22.9 175.3 319.4 358.3 0.00 0.00 82.5 938.8 315.184 04/05/95 10:03 9.2 7.02 395.5 0.00 24.0 121.2 192.4 311.2 0.00 0.00 58.1 619.3 295.885 05/05/95 10:54 12.2 7.12 395.2 0.00 22.4 115.8 184.3 305.6 0.00 0.00 50.7 610.9 298.486 06/05/95 11:48 5.7 7.48 461.8 0.00 24.7 151.8 238.2 365.8 1.03 0.00 52.4 794.9 305.387 11/01/95 12:00 miss<strong>in</strong>g 7.28 560.4 0.00 29.7 261.3 443.1 360.1 0.96 0.00 77.5 1483.0 255.588 12/05/95 12:00 miss<strong>in</strong>g 7.44 637.0 0.00 32.0 279.4 439.9 411.5 0.00 0.00 122.4 1451.2 303.689 01/11/96 12:00 miss<strong>in</strong>g 7.32 544.3 0.00 35.0 148.1 227.2 328.3 0.00 0.00 72.2 857.4 423.590 02/09/96 12:00 14.3 7.35 389.0 0.00 22.1 113.5 168.3 276.6 0.00 0.00 54.1 590.0 319.291 03/19/96 11:19 9.2 7.48 395.3 0.00 21.8 114.1 168.8 241.4 0.00 0.00 72.0 597.6 308.992 04/03/96 12:45 8.3 7.63 418.6 0.00 22.4 129.1 190.0 265.2 0.00 0.00 73.2 667.6 314.993 05/08/96 10:52 miss<strong>in</strong>g 7.61 411.8 0.00 21.0 136.2 210.9 367.5 0.00 0.00 73.7 612.1 331.0124
Caspar Creek - Watershed HEN# DATE TIME Streamflow pH Na NH4 K Mg Ca CI NO3 PO4 SO4 HCO3 SiL/s µM µM µM µM µM µM µM µM µM µM µM1 04/24/91 11:30
Caspar Creek – IVE# DATE TIME Streamflow pH Na NH4 K Mg Ca CI NO3 PO4 SO4 HCO3 SiL/s µM µM µM µM µM µM µM µM µM µM µM1 04110/91 12:11 0.5 7.66 423.0 0.00 24.0 163.0 264.0 311.0 0.00 0.00 69.0 852.0 miss<strong>in</strong>g2 04/16191 09:48 0.2 7.56 429.0 0.00 25.0 177.0 282.0 318.0 0.00 0.00 77.0 900.0 miss<strong>in</strong>g6 04/24/91 11:01 0.5 7.45 453.0 0.00 25.0 199.0 323.0 322.0 0.00 0.00 81.0 1038.0 miss<strong>in</strong>g4 05101/91 10:24 0.7 7.45 521.0 0.00 25.0 190.0 316.0 320.0 0.00 0.50 88.0 1061.6 miss<strong>in</strong>g5 02/05/92 11:40 0.5 7.05 498.1 0.00 23.2 211.0 347.2 554.4 19.45 0.00 94.2 875.3 304.96 02/13/92 13:15 6.4 6.97 382.9 0.00 21.2 146.11 238.1 316.21 0.00 0.63 54.1 747.5 290.27 03/04/92 11:10 1.6 7.66 568.2 0.00 23.9 169.0 330.7 334.0 0.12 0.17 64.6 1118.1 327.28 03/11/92 10:36 1.0 7.62 661.8 0.00 23.7 168.2 328.2 322.8 0.22 0.38 65.8 1123.4 323.79 03/25/92 13:20 1.5 7.21 450.7 0.00 24.6 158.7 259.4 340.5 0.11 0.31 56.7 857.0 335.110 04/01/92 10:43 1.0 7.78 574.6 0.00 28.2 176.5 337.5 336.5 2.81 0.24 63.2 1164.9 337.011 04/08/92 10:10 0.5 7.31 469.2 0.00 25.6 190.6 307.8 352.0 0.77 0.10 71.9 995.0 330.012 04/16192 11:15 0.5 7.33 513.9 0.00 30.3 209.6 351.5 346.1 0.00 0.52 74.1 1171.6 342.013 04/23/92 11:51 1.5 7.51 489.4 0.00 31.6 187.6 311.4 332.9 0.001 0.00 68.2 1049.7 334.114 04/29/92 11:40 0.5 7.25 490.1 0.00 30.1 196.8 328.1 351.0 10.72 0.14 72.4 1063.4 340.815 06/06/92 11:00 0.6 7.68 501.5 0.00 24.4 225.7 364.2 3 5 0.00 0.43 77.5 1193.9 353.816 05/21/92 13-40 0.5 7.76 477.6 0.00 27.1 231.5 381.2 350.5 0.00 0.11 81.5 1216.7 363.117 06/11/92 11:05 0.5 7.55 489.4 0.00 28.1 232.5 396.3 360.1 0.00 6.3-6 84.5 1245.6 377.718 06/24/92 10:20 0.3 7.34 501.3 0.00 29.5 263.1 443.7 364.3 0.00 0.19 87.6 1414.8 379.519 07/09/92 10:00 0.2 7.29 505.6 0.00 31.5 260.9 441.1 356.0 0.00 0.11 87.1 1410.8 375.220 08/05/92 12:15 0.0 7.33 520.7 0.00 30.2 268.6 474.1 355.0 0.00 0.00 91.0 1499.2 382.021 09/15192 11:20 0.2 7.40 522.9 0.00 29.11 281.0 484.6 358.7 0.00 0.08 90.3 1543.9 388.422 11/04192 13:50 0.5 7.12 562.9 0.00 32.0 294.9 502.5 365.0 0.00 1.00 92.0 1639.7 368.123 11/19/92 12:05 0.2 7.43 530.7 0.00 33.2 279.7 479.0 369.0 0.00 1.00 90.0 1531.4 353.824 12/02/92 13:00 0.7 7.41 787.3 0.00 48.6 172.8 272.2 959.0 0.00 0.00 92.0 582.7 334.325 12/16192 13:10 1.0 7.01 393.6 0.00 25.3 159.2 271.0 326.0 0.00 0.00 66.0 821.3 284.326 12/29/92 12:10 7.4 7.11 389.7 0.00 22.8 139.4 246.0 308.2 0.00 0.00 56.1 763.0 283.827 01/12/93 10:15 9.6 7.49 394.8 0.00 21.5 121.9 211.1 330.1 0.00 0.00 41.3 669.7 308.828 02/17/93 13:23 3.3 7.68 401.1 0.00 22.4 144.4 253.2 321.6 0.00 0.00 51.0 795.0 303.229 03/03/93 11:50 3.3 7.69 426.3 0.00 23.0 148.1 259.5 377.0 0.00 0.00 49.0 789.4 337.230 03/24/93 12:10 7.4 7:65 465.4 0.00 25.6 152.2 249.5 362.0 0.00 0.00 44.0 844.4 325.131 04/07/93 12:21 4.5 7.67 478.5 0.00 23.0 160.4 276.9 376.0 0.00 0.00 52.0 896.2 333.932 04/28/93 11:35 1.5 6:84 434.2 0.00 23.8 153.2 281.8 348.4 0.00 0.00 50.2 879.1 316.333 05/12/93 12:25 1.5 6.93 481.5 0.00 25.0 180.4 327.1 382.3 0.00 0.00 58.3 1022.8 339.234 05/27/93 13:30 4.5 7.22 514.4 0.00 24.4 184.2 330.0 340.0 0.00 0.00 52.8 1121.6 343.535 06/07/93 08:29 2.2 7.19 490.7 0.00 26.5 165.5 301.9 363.0 0.00 0.00 54.0 981.1 347.136 07/02/93 11:06 0.5 7.22 539.9 0.00 26.3 206.4 372.7 395.0 0.00 0.00 69.4 1190.8 366.037 07/22/93 14:00 0.5 7.41 560.6 0.00 27.5 227.4 407.5 417.6 0.00 0.00 72.5 1295.4 372.438 08/10/93 10:30 0.2 7.41 575.8 0.00 27.7 236.7 426.3 372.7 0.00 0.66 76.1 1404.1 378.439 09/07/93 13:00 0.5 7.24 587.8 0.00 30.0 252.8 454.6 392.4 0.00 0.00 82.0 1476.1 380.940 10/20/93 11:38 0.2 7.38 570.7 0.00 26.1 270.3 472.6 340.0 0.00 0.00 84.7 1573.1 363.141 12/01/93 09:40 0.2 7.48 524.0 0.00 24.4 255.7 424.4 358.3 0.00 1.01 86.4 1376.5 375.842 12/29/93 11:06 0.2 7.20 505.5 0.00 24.5 232.0 388.8 372.2 1.33 0.80 87.8 1221.5 352.943 02/02/94 09:40 1.0 7.60 473.9 0.00 23.5 187.6 332.1 339.0 1.88 0.00 70.5 1054.9 344.544 03/16/94 11:15 1.0 6.45 497.8 0.00 29.3 193.6 337.1 365.7 0.00 0.00 70.3 1082.2 327.345 04/13194 10:42 0.5 7.76 566.3 0.00 29.8 236.4 404.3 381.8 0.00 0.00 80.0 1335.8 349.246 05/18/94 11:32 1.0 7.42 519.1 0.00 37.4 228.0 390.9 354.6 0.00 0.00 74.7 1290.3 347.947 06/29/94 12:45 0.2 7.58 520.2 0.00 29.4 267.3 457.2 382.0 0.00 0.80 84.3 1447.2 344.648 10/05/94 14:30 0.2 7.42 574.7 0.00 39.9 303.6 551.5 353.1 9.85 0.00 85.0 1791.7 372.449 11/02/94 12:55 0.2 7.77 566.8 0.00 29.7 301.5 551.7 357.2 0.84 0.00 88.9 1767.1 369.650 12106/94 10:57 0.5 7.40 519.4 0.00 26.9 236.6 428.9 434.3 1.82 0.00 96.9 1247.3 341.851 01/03/95 11:56 1.3 7.54 468.0 0.00 24.0 203.7 346.1 381.5 1.39 0.00 89.8 1029.0 303.552 02/01/95 11:55 24.8 6.61 401.5 0.00 19.8 86.0 146.7 350.8 0.00 0.83 31.0 473.0 315.153 03/01/95 12:04 1.9 6.82 497.0 0.00 21.3 119.3 203.0 414.8 0.00 0.00 78.8 590.6 359.354 04/05/95 09:20 2.9 7.05 403.7 0.00 23.9 152.2 266.3 421.4 0.00 0.00 43.7 755.8 353.055 05/05/95 09:25 5.4 6.92 414.4 0.00 22.5 139.2 247.5 415.1 0.00 0.00 44.4 706.5 338.556 06/05/95 11:08 1.5 7.47 477.3 0.00 25.4 184.6 327.8 444.1 0.00 0.00 45.9 991.8 367.457 11/01/95 12:00 miss<strong>in</strong>g 7.32 784.3 0.00 35.8 241.6 381.3 483.5 4.52 0.86 125.1 1326.8 271.958 12/05/95 12:00 miss<strong>in</strong>g 7.38 561.3 0.00 30.7 260.1 429.9 376.2 0.00 0.00 75.4 1445.0 334.559 02/09/96 11:40 6.4 7.33 406.7 0.00 22.1 135.8 226.5 349.8 0.00 0.00 66.6 670.3 352.360 03/19/96 10:58 3.7 7.26 418.2 0.00 21.6 143.1 237.0 381.7 0.00 0.00 41.9 734.5 365.161 04/03196 11:10 3.7 7.54 440.4 0.00 22.0 153.3 252.8 391.6 0.00 0.00 49.2 784.7 363.062 05/07/96 16:06 0.5 7.77 462.1 0.00 23.0 166.2 275.7 515.4 0.00 0.00 63.1 727.2 365.8126
Caspar Creek - Watershed JOH# DATE TIME Streamflow pH Na NH4 K Mg Ca CI NO3 PO4 SO4 HCO3 SiL/s µM µM µM µM µM µM µM µM µM µM µM1 04/10/91 10:15 2.8 7.56 485.0 0.00 24.0 114.0 159.0 453.0 11.70 0.00 73.0 444.3 miss<strong>in</strong>g2 04/16/91 10:54 0.0 7.12 520.0 0.00 23.0 119.0 163.0 482.0 5.90 0.00 78.0 463.1 miss<strong>in</strong>g3 05/01/91 09:51 2.3 7.36 513.0 0.00 25.0 122.0 174.0 473.0 1.00 0.00 79.0 498.0 miss<strong>in</strong>g4 02/05/92 11:00 2.8 6.99 532.7 0.00 21.8 126.4 179.2 380.2 3.36 0.16 69.7 642.6 249.45 02/13/92 12:00 35.7 7.25 432.7 0.00 20.6 98.4 144.6 410.4 20.78 0.00 55.5 397.3 231.76 03/04/92 11:45 5.3 7.03 515.6 0.00 22.8 110.5 159.1 598.5 0.00 0.00 72.2 334.8 271.77 03/11/92 10:12 6.1 7.50 611.6 0.00 24.7 117.2 259.2 447.1 0.93 0.00 69.7 801.6 269.38 03/25/92 12:25 6.1 7.15 474.9 0.00 23.5 108.4 156.5 477.5 0.00 0.00 60.7 429.5 269.79 04/01/92 10:30 4.0 7.23 536.8 0.00 26.5 121.4 172.1 460.5 0.00 0.00 66.5 556.9 276.510 04/08/92 09:40 0.9 7.55 506.8 0.00 23.5 118.8 168.8 478.0 0.24 0.00 69.6 488.0 267.211 04/16/92 10:10 2.8 6.48 563.7 0.00 28.7 132.2 200.4 492.9 0.00 0.00 74.5 615.7 283.012 04/23/92 11:19 6.8 7.27 543.0 0.00 27.2 122.8 186.8 445.5 0.00 0.00 71.2 601.5 276.513 04/29/92 10:50 0.9 7.32 547.8 0.00 28.5 126.9 189.1 471.1 0.54 0.14 75.7 584.9 280.814 05/06/92 10:20 0.9 7.28 519,2 0.00 26.3 135.9 196.6 480.9 0.00 0.21 77.0 575.4 295.615 05/21/92 12:40 0.0 6.88 527.5 0.00 24.1 141.3 201.0 496.3 0.00 0.21 76.1 587.6 295.316 12/02/92 12:01 0.3 7.23 587.2 0.00 30.7 172.8 249.5 531.0 0.00 0.00 85.0 761.4 314.617 12/16/92 12:50 6.8 6.94 435.0 0.00 22.3 105.3 152.9 407.0 3.00 0.00 64.0 435.7 298.118 12/29/92 11:30 44.6 6.77 436.7 0.00 21.5 104.5 160.4 388.2 0.00 0.00 56.9 486.0 237.819 01/12/93 12:50 27.7 7.25 479.8 0.00 23.3 100.4 154.1 418.3 3.85 0.00 49.2 491.7 253.220 02/17/93 11:55 9.3 7.28 475.8 0.00 29.2 106.6 166.4 377.8 0.00 0.00 58.8 555.5 244.221 03/03/93 11:10 8.4 7.48 508.9 0.00 23.0 115.2 174.7 425.0 0.00 0.00 56.0 574.6 269.722 03/24/93 11:35 35.7 7.41 491.5 0.00 23.0 111.1 172.2 405.0 0.00 0.00 54.0 568.0 263.623 04/07/93 11:26 16.0 7.52 530.7 0.00 23.0 123.4 184.6 408.0 0.00 0.00 63.0 635.8 277.824 04/28/93 10:45 13.9 6.90 503.6 0.00 22.9 119.5 201.3 402.6 0.00 0.00 59.1 647.4 276.825 05/12/93 11:35 5.3 7.01 530.4 0.00 27.2 126.9 210.9 438.9 0.00 0.00 62.9 668.6 275.726 05/24/93 10:13 4.0 7.15 599.0 0.00 23.5 136.8 225.9 469.5 0.00 0.57 68.7 740.2 291.627 05/27/93 11:45 27.7 7.19 522.1 0.00 23.7 128.9 218.7 365.5 0.00 0.51 55.4 764.4 272.428 06/09/93 10:15 12.0 7.23 540.7 0.00 32.5 125.9 211.2 407.3 0.00 0.00 61.6 716.8 288.029 07/01/93 10:50 6.8 7.29 596.1 0.00 23.7 138.7 231.3 491.3 0.00 0.00 69.9 728.9 276.330 07/22/93 14:39 6.8 7.49 618.2 0.00 25.1 146.0 241.9 528.4 0.00 0.00 72.6 745.6 294.531 08/10/93 09:25 4.0 7.07 635.6 0.00 27.0 156.1 254.5 481.6 0.46 0.00 72.6 856.7 297.832 02/02/94 10:48 2.8 7.20 514.8 0.00 21.8 121.6 197.6 395.3 0.44 0.00 72.2 635.1 275.733 03/16/94 10:45 2.8 6.58 535.6 0.00 23.9 138.7 216.1 452.5 0.00 0.00 72.3 671.9 272.334 04/13/94 10:10 2.8 7.79 615.3 0.00 25.7 156.3 236.2 479.4 0.00 0.00 82.7 781.3 281.735 05/18/94 10:13 2.8 7.45 563.1 0.00 48.9 152.4 238.2 427.5 0.00 0.00 81.4 802.9 284.336 06/29/94 10:57 0.0 7.53 579.4 0.00 74.0 167.3 255.9 594.5 0.00 0.00 82.8 739.7 259.837 12/06/94 10:33 0.0 7.24 574.6 0.00 24.8 153.9 233.8 582.2 0.00 0.00 100.4 591.8 252.038 01/03/95 11:20 6.1 7.151 493.7 0.00 21.5 125.5 188.6 430.6 0.00 0.00 85.1 542.6 251.439 02/01/95 13:31 71.4 6.711 504.3 0.00 21.6 119.3 185.5 355.0 0.64 0.00 41.0 697.8 245.540 03/01/95 11:08 5.3 6.92 495.4 0.00 21.7 113.3 183.9 451.9 0.00 0.00 81.4 497.0 286.241 04/05/95 10:04 0.0 6.90 449.2 0.00 22.8 109.7 176.6 435.8 0.00 0.00 51.6 505.7 278.742 11/01/95 12.10 miss<strong>in</strong>g 7.42 673.0 0.00 26.3 170.4 259.9 562.8 0.00 0.00 83.3 830.4 258.043 12/05/95 12:00 miss<strong>in</strong>g 7.40 744.3 0.00 32.5 196.7 288.0 626.9 0.00 0.00 96.8 925.8 241.644 01/11/96 12:00 miss<strong>in</strong>g 7.21 607.4 0.00 33.2 154.7 187.3 434,9 0.75 0.00 66.9 755.2 432.745 02/09/96 11:10 18.1 7.30 439.9 0.00 20.8 101.5 154.5 392.9 0.00 0.00 41.5 496.9 281.546 03/19/96 10:26 10.1 7.27 443.5 0.00 20.4 103.8 158.0 346.2 0.00 0.00 43.6 553.9 289.047 04/03/96 10:45 12.0 7.20 465.8 0.00 21.2 117.4 182.8 343.1 0.00 0.00 49.9 644.4 296.448 05/07/96 15:00 0.9 7.56 481.8 0.00 20.9 117.5 176.3 502.3 0.00 0.00 68.4 451.1 322.4127
Caspar Creek - Watershed KJE# DATE TIME Streamfiow pH Na NH4 K Mg Ca CI NO3 PO4 SO4 HCO3 SiL/s µM µM µM µM µM µM µM µM µM µM µM1 03/27/91 09:36 5.42 7.50 489.0 0.00 24.7 115.0 145.0 475.0 30.2 0.00 75.0 378.5 235.62 04/10/91 09:36 5.42 7.58 491.0 0.00 25.0 113.0 152.0 482.0 25.50 0.00 78.0 382.5 250.73 04/16191 09:52 5.42 7.42 511.0 0.00 23.0 114.0 156.0 504.0 17.90 0.00 79.0 394.1 262.74 04/24/91 09:22 4.52 7.30 543.0 0.00 23.0 123.0 169.0 524.0 16.50 1.00 82.0 445.5 264.75 05/01/91 09:21 4.96 7.30 543.0 0.00 24.0 123.0 171.0 515.0 11.80 0.00 84.0 460.2 269.86 02/05/92 10:00 7.40 6.57 503.4 0.00 20.5 126.0 174.8 504.0 18.00 0.00 83.8 435.7 250.87 02/10/92 10:25 6.38 6.89 530.3 0.00 23.4 132.3 185.1 508.4 18.92 0.07 78.7 503.7 257.38 02/11/92 10:40 13.23 7.23 489.3 0.00 22.0 117.8 161.7 428.0 28.25 0.00 73.1 467.7 241.39 02/12/92 02:30 26.42 6.94 432.6 0.00 22.4 101.2 139.7 365.0 26.24 0.00 68.3 409.0 213.510 02/12/92 13:44 36.88 7.03 433.1 0.00 21.7 88.8 123.4 355.5 44.29 0.16 57.0 365.5 206.211 02/13/92 10:30 29.77 7.47 440.6 0.00 20.4 94.1 134.4 374.3 39.08 0.07 58.9 386.8 220.812 02/15/92 06:55 29.77 7.08 429.1 0.00 20.7 89.0 127.6 368.4 40.66 0.00 56.4 361.3 226.013 02/18/92 15:15 20.16 7.32 445.3 0.00 21.2 93.6 133.1 370.8 28.46 0.29 62.0 396.7 235.614 02/22/92 10:26 18.70 7.00 432.1 0.00 21.2 88.4 127.7 378.1 22.12 0.06 60.6 364.0 250.715 02/25/92 12:10 10.17 6.95 454.7 0.00 20.6 96.7 137.5 405.0 20.68 0.17 68.1 382.0 262.716 03/04/92 07:45 6.89 6.45 491.5 0.00 23.5 109.3 153.2 436.0 7.60 0.00 75.4 445.8 264.717 03/11/92 04:30 6.89 7.08 516.0 0.00 20.9 109.7 151.3 572.8 8.70 0.16 82.5 312.4 269.818 03/16/92 06:00 60.14 6.75 452.2 0.00 24.0 74.5 106.5 259.9 8.30 0.39 53.0 463.9 207.919 03/16/92 08:58 69.13 6.28 562.2 0.00 25.4 79.2 106.7 278.1 15.19 0.00 52.9 560.3 200.020 03/16/92 14:43 54.74 6.82 461.0 0.00 22.4 76.3 111.6 284.6 18.21 0.00 52.7 451.0 215.521 03/17/92 10:20 28.08 6.90 438.8 0.00 22.8 85.3 122.8 344.8 17.49 0.06 56.2 403.3 235.822 03/18/92 09:41 17.27 7.27 449.7 0.00 22.0 90.8 128.5 376.3 24.34 0.16 62.1 385.6 247.623 03/25/92 10:45 6.38 7.16 491.3 0.00 22.9 106.8 151.1 424.5 7.17 0.00 71.9 461.7 270.224 04/01/92 09:50 4.52 7.48 626.7 0.00 21.8 112.1 233.0 431.1 5.03 0.00 75.0 752.5 278.325 04/08/92 09:05 7.40 7.59 521.5 0.00 22.0 117.0 163.9 466.0 0.51 0.18 79.9 479.1 279.626 04/16/92 09:20 8.47 7.16 574.7 0.00 29.3 132.2 201.6 458.1 0.00 0.36 81.8 649.8 279.627 04/23/92 10:39 5.90 7.38 538.0 0.00 26.8 119.7 178.0 409.3 0.00 0.00 78.2 594.5 277.428 04/29/92 10:05 6.38 7.37 582.3 0.00 27.7 126.6 190.2 471.8 0.32 0.00 80.4 610.7 280.529 05/06/92 09:30 6.38 7.40 508.5 0.00 22.2 127.8 182.6 470.0 0.00 0.00 80.1 521.4 296.530 05/21/92 09:35 4.52 7.30 541.5 0.00 23.5 135.9 198.6 470.2 0.00 0.00 80.1 603.6 303.431 06/01/92 12:25 3.67 7.25 562.5 0.00 24.4 132.3 200.2 567.4 0.06 0.13 80.8 522.7 307.232 06/11/92 09:20 2.89 7.39 535.0 0.00 22.9 127.6 191.5 52.3 0.00 0.00 82.0 479.8 304.633 06/24/92 08:00 2.53 7.31 584.9 0.00 28.0 152.5 221.0 570.3 0.00 0.16 85.9 617.8 332.334 07/09/92 08:20 2.89 7.24 558.2 0.00 27.3 149.2 216.8 532.7 0.08 0.13 83.0 618.8 307.135 08/05/92 10:50 2.18 7.50 600.7 0.00 22.0 157.5 234.0 602.0 0.00 0.00 88.0 627.9 293.636 09/15/92 08:53 4.09 7.39 629.1 0.00 26.4 171.8 248.0 641.2 0.00 0.00 91.9 670.0 310.837 11/04/92 10:31 3.27 7.49 613.3 0.00 30.2 163.3 229.5 573.0 0.00 0.00 89.0 678.2 300.938 11/19/92 09:30 3.27 7.60 678.6 0.00 33.2 176.9 257.0 614.0 0.00 0.00 98.0 769.5 346.039 12/02/92 10:13 2.89 7.40 582.9 0.00 28.1 164.5 244.5 535.0 0.00 0.00 91.0 712.1 355.340 12/08/92 12:55 7.40 7.22 495.9 0.00 28.4 123.4 174.7 425.0 9.00 0.00 69.0 548.3 288.941 12/08/92 13:55 9.82 7.16 448.0 0.00 28.1 115.2 167.2 404:0 7.00 1.00 65.0 499.8 222.642 12/08/92 14:55 12.47 7.07 430.6 0.00 28.1 111.1 159.7 391.0 8.00 0.00 64.0 475.2 210.943 12/08/92 15:55 15.33 7.06 426.3 0.00 28.1 102.8 152.2 373.0 5.00 0.00 62.0 462.5 201.144 12/08/92 16:55 21.82 7.06 421.9 0.00 28.1 98.7 144.7 371.0 5.00 1.00 61.0 438.9 201.145 12/08/92 17:55 28.92 7.05 408.9 0.00 28.4 90.5 134.7 360.0 9.00 0.00 59.0 400.7 192.746 12/08/92 18:55 38.74 7.04 387.1 0.00 28.1 86.4 127.2 327.0 9.00 0.00 58.0 390.5 183.147 12/08/92 19:55 59.26 7.01 378.4 0.00 28.1 82.3 124.8 308.0 15.00 1.00 56.0 385.6 183.848 12/08/92 20:55 58.83 7.04 369.7 0.00 23.0 82.3 119.8 301.0 15.00 0.00 56.0 368.8 181.249 12/08/92 21:55 61.46 7.08 365.4 0.00 25.6 82.3 119.8 296.0 16.00 0.00 55.0 373.0 195.950 12/08/92 22:55 63,91 7.06 382.8 0.00 26.1 82.3 122.3 299.0 19.00 0.00 55.0 389.9 202.351 12/08/92 23:55 63.91 7.03 369.7 0.00 25.6 78.2 119.8 295.0 17.00 0.00 55.0 369.1 181.252 12/09/92 00:55 63.91 7.02 382.8 0.00 25.6 82.3 117.3 297.0 18.00 0.00 55.0 382.4 184.153 12/09/92 01:55 58.83 7.05 374.1 0.00 25.6 78.2 117.3 292.0 18.00 1.00 55.0 370.5 187.154 12/09/92 02:55 58.83 7.03 374.1 0.00 25.6 78.2 119.8 303.0 17.00 0.00 55.0 365.5 191.255 12/09/92 03:55 54.11 7.05 374.1 0.00 25.6 82.3 119.8 297.0 21.00 1.00 54.0 377.7 201.756 12/09/92 04:55 54.11 7.03 374.1 0.00 23.0 82.3 119.8 294.0 20.00 0.00 56.0 375.2 192.457 12/09/92 05:55 54.11 7.07 382.8 0.00 24.3 82.3 119.8 304.0 19.00 1.00 57.0 374.1 197.158 12/09/92 06:55 51.80 7.04 374.1 0.00 25.6 82.3 122.3 305.0 18.00 1.00 56.0 373.7 194.859 12/09/92 07:55 49.53 6.98 378.4 0.00 23.0 82.3 122.3 319.0 21.00 0.00 56.0 358.5 195.360 12/09/92 08:55 51.59 7.13 387.1 0.00 24.4 82.3 122.3 318.0 _ 19.00 0.00 58.0 367.6 194.261 12/09/92 09:55 45.10 7.18 378.4 0.00 25.6 78.2 119.8 306.0 16.00 0.00 55.0 367.8 195.162 12/09/92 10:55 45.10 7.16 374.1 0.00 25.6 78.2 119.8 297.0 18.00 0.00 55.0 370.5 197.063 12/09/92 11:55 40.82 7.14 378.4 0.00 25.6 82.3 119.8 311.0 16.00 0.00 56.0 369.1 201.564 12/09/92 12:55 40.82 7.16 378.4 0.00 23.0 82.3 122.3 302.0 16.00 0.00 56.0 380.5 203.065 12/09/92 13:55 40.82 7.14 391.5 0.00 23.0 82.3 122.3 316.0 16.00 1.00 56.0 379.5 205.566 12/09/92 14:55 40.82 7.11 378.4 0.00 23.0 82.3 122.3 311.0 16.00 0.00 58.0 367.5 203.867 12/09/92 15:55 36.69 7.12 387.1 0.00 25.6 82.3 122.3 313.0 14.00 1.00 58.0 378.8 206.568 12/09/92 16:55 36.69 7.11 378.4 0.00 23.0 82.3 122.3 305.0 15.00 0.00 55.0 380.5 206.369 12/09/92 17:55 36.69 7.13 378.4 0.00 23.4 82.3 122.3 310.0 16.00 0.00 56.0 372.9 210.570 12/09/92 18:55 36.69 7.10 378.4 0.00 23.0 82.3 122.3 307.0 14.00 0.00 57.0 375.5 208.1128
Caspar Creek - Watershed KJE# DATE TIME Streamflow pH Na NH4 K Mg Ca CI NO3 PO4 SO4 HCO3 SiL/s µM µM µM µM µM µM µM µM µM µM µM71 12/09/92 19:55 36.69 7.11 382.8 0.00 23.0 82.3 119.8 304.0 11.00 1.00 57.0 380.9 204.972 12/09/92 20:55 36.69 7.10 382.8 0.00 23.0 82.3 119.8 296.0 8.00 0.00 57.0 391.9 207.473 12/09/92 21:55 38.74 7.06 391.5 0.00 23.0 82.3 119.8 304.0 10.00 0.00 58.0 388.6 206.374 12/09/92 22:55 40.82 6.96 382.8 0.00 23.0 82.3 119.8 300.0 11.00 0.00 58:0 382.9 207.975 12/09/92 23:55 40.82 6.88 382.8 0.00 23.0 82.3 119.8 305.0 13.00 0.00 57.0 377.9 218.576 12/10/92 00:55 40.82 6.84 387.1 0.00 23.0 82.3 119.8 300.0 12.00 0.00 58.0 386.2 213.877 12/10/92 01:55 38.74 6.60 387.1 0.00 25.6 82.3 119.8 301.0 10.00 0.00 57.5 390.8 214.178 12/10/92 02:55 36.69 6.54 382.8 0.00 23.0 82.3 122.3 302.0 12.00 0.00 57.0 386.8 214.179 12/10/92 03:55 36.69 6.53 382.8 0.00 23.0 82.3 122.3 302.0 12.00 0.00 58.0 384.8 213.680 12/10/92 04:55 36.69 6.48 382.8 0.00 23.0 82.3 122.3 298.0 13.00 0.00 58.0 387.8 208.481 12/10/92 05:55 40.82 6.49 378.4 0.00 23.0 82.3 119.8 291.0 11.00 1.00 55.0 393.5 205.982 12/10/92 06:55 45.10 6.49 374.1 0.00 23.0 78.2 117.3 282.0 10.00 0.00 55.0 385.9 205.483 12/10/92 07:55 45.10 6.51 369.7 0.00 23.0 78.2 114.8 282.0 11.00 0.00 55.0 375.6 199.584 12/10/92 08:55 56.45 6.49 334.9 0.00 25.6 69.9 107.3 250.0 12.00 0.00 50.0 352.9 189.585 12/10/92 17:05 94.27 6.83 339.3 0.00 25.6 69.9 107.3 268.0 13.00 0.00 47.0 344.3 190.286 12/10/92 18:05 90.19 6.80 339.3 0.00 23.0 69.9 109.8 273.0 13.00 0.00 47.0 341.7 188.187 12/10/92 19:05 81.97 6.92 343.6 0.00 23.0 74.0 109.8 289.0 15.00 0.00 47.0 336.3 194.788 12/10/92 20:05 74.03 6.90 348.0 0.00 23.0 74.0 112.3 278.0 16.00 0.00 48.0 353.6 195.889 12/10/92 21:05 68.90 6.89 352.3 0.00 25.6 74.0 112.3 287.0 17.00 0.00 48.0 350.5 202.390 12/10/92 22:05 63.91 6.88 356.7 0.00 23.0 74.0 114.8 298.0 16.00 0.00 48.0 347.3 201.391 12/10/92 23:05 61.46 6.81 361.0 0.00 23.0 74.0 114.8 291.0 16.00 0.00 48.0 358.7 202.492 12/11/92 00:05 58.83 6.87 361.0 0.00 23.0 74.0 114.8 303.0 15.00 0.00 48.0 347.7 204.793 12/11/92 01:05 54.11 6.83 361.0 0.00 23.0 74.0 117.3 313.0 15.00 0.00 49.0 340.7 210.894 12/11/92 02:05 49.53 6.83 356.7 0.00 23.0 78.2 117.3 298.0 14.00 0.00 49.0 360.5 208.095 12/11/92 03:05 45.10 6.80 361.0 0.00 23.0 78.2 114.8 294.0 14.00 0.00 49.0 363.9 212.796 12/11/92 04:05 45.10 6.81 343.6 0.00 23.0 74.0 112.3 295.0 13.00 0.00 47.0 337.3 206.497 12/11/92 05:05 42.94 6.79 361.0 0.00 23.0 78.2 117.3 296.0 14.00 0.00 53.0 358.9 208.798 12/11/92 06:05 40.82 6.83 356.7 0.00 23.0 78.2 117.3 314.0 13.00 0.00 52.0 339.5 215.699 12/11/92 07:05 40.82 6.78 369.7 0.00 23.0 78.2 119.8 312.0 14.00 0.00 55.0 352.6 216.3100 12/11/92 08:05 38.74 6.77 365.4 0.00 23.0 78.2 117.3 300.0 11.00 0.00 53.0 362.2 222.9101 12/11/92 09:05 36.69 6.83 365.4 0.00 23.0 78.2 117.3 312.0 11.00 0.00 53.0 350.2 213.4102 12/11/92 10:05 36.69 6.91 365.4 0.00 23.0 78.2 119.8 306.0 11.00 0.00 55.0 357.2 213.6103 12/11/92 11:05 36.69 6.90 369,7 0.00 23.0 82.3 119.8 311.0 11.00 0.00 55.0 364.8 215.1104 12/11/92 12:05 36.69 6.83 369.7 0.00 24.5 78.2 117.3 311.0 11.00 0.00 54.0 355.0 211.6105 12/11/92 13:05 36.69 6.85 374.1 0.00 25.6 78.2 119.8 320.0 10.00 0.00 56.0 353.5 218.2106 12/11/92 14:05 32.72 6.83 361.0 0.00 23.0 78.2 117.3 306.0 10.00 0.00 54.0 350.9 214.9107 12/11/92 15:05 32.72 6.84 361.0 0.00 23.5 78.2 117.3 300.0 10.00 0.00 54.0 357.3 210.2108 12/11/92 16:05 32.72 6.82 369.7 0.00 23.0 78.2 117.3 306.0 10.00 0.00 55.0 357.6 214.0109 12/16/92 12:06 9.59 7.11 439.8 0.00 24.3 102.8 149.7 370.0 10.00 0.00 71.0 447.1 238.7110 12/29/92 10:45 19.42 7.01 450.6 0.00 22.5 104.1 155.7 360.9 8.00 0.00 70.3 483.2 239.5111 12/31/92 03:16 35.05 6.83 406.3 0.00 22.8 90.1 135.7 318.3 9.30 0.00 64.3 424.5 221.0112 12/31/92 04:16 40.82 6.99 395.4 0.00 18.9 86.4 132.0 307.9 6.90 0.50 62.5 411.3 223.5113 12/31/92 05:16 47.70 6.98 384.9 0.00 20.7 84.7 125.2 296.9 7.60 0.00 61.2 398.7 212.5114 12/31/92 06:16 54.11 6.96 385.4 0.00 18.9 83.5 122.8 282.2 6.70 0.00 59.0 409.9 205.9115 12/31/92 07:16 65.48 6.93 370.2 0.00 21.0 79.4 118.0 276.2 7.30 0.00 57.4 387.6 204.1116 12/31/92 08:16 68.90 6.95 366.7 0.00 19.2 77.3 116.5 264.1 6.70 0.00 55.2 392.4 191.7117 12/31/92 09:16 68.90 6.92 355.4 0.00 20.7 74.0 114.3 260.2 4.40 0.50 53.4 381.3 197.8118 12/31/92 10:16 71.92 6.88 347.1 0.00 18.4 71.6 108.8 253.9 6.60 0.00 52.2 361.3 186.6119 12/31/92 11:16 149.26 6.93 323.6 0.00 20.5 67.9 104.3 241.5 6.60 0.00 48.6 343.1 174.7120 12131/92 12:16 161.54 6.78 318.0 0.00 21.0 65.8 95.3 237.5 4.80 0.00 46.4 326.1 168.2121 12/31/92 13:16 175.45 6.76 309.3 0.00 20.2 64.2 99.6 231.5 5.60 0.00 44.5 330.8 162.2122 12/31/92 14:16 176.73 6.78 314.0 0.00 23.0 65.0 101.5 240.7 6.90 0.00 44.1 334.3 168.6123 12/31192 15:16 167.50 6.77 317.5 0.00 20.7 65.4 101.5 242.7 8.70 0.00 44.3 332.1 169.9124 12/31/92 16:16 176.73 6.75 315.4 0.00 22.51 65.4 98.8 240.0 5.20 0.00 44.8 331.5 171.1125 12131/92 17:16 168.44 6.78 320.6 0.00 21.2 65.4 100.0 242.5 6.80 0.00 44.3 334.8 172.3126 12131/92 18:16 165.61 6.85 317.1 0.00 22.0 66.2 102.3 240.9 9.70 0.00 44.1 337.3 174.0127 12131/92 19:16 158.75 6.81 326.7 0.00 20.7 67.9 106.5 259.7 9.40 0.00 45.5 336.1 181.3128 12/31/92 20:16 142.65 6.90 330.1 0.00 20.5 67.9 106.0 252.9 9.901 0.00 45.7 344.2 184.4129 12/31/91 21:16 134.97 6.84 333.4 0.00 21.0 76.5 101.0 294.9 6.901 0.00 57.0 293.7 186.7130 12131/92 22:16 126.02 6.97 336.7 0.00 22.3 70.3 108.0 255.9 8.80 0.00 47.1 356.8 188.9131 12/31/92 23:16 119.81 6.91 336.7 0.00 21.0 71.2 110.8 261.8 9.70 0.00 47.4 355.2 197.5132 01/01/93 00:16 119.81 6.90 347.5 0.00 25.1 74.5 114.5 272.7 8.70 0.00 47.7 373.8 259.3133 01/01/93 01:16 109.88 6.93 346.7 0.00 24.6 72.8 115.0 269.6 10.10 0.00 47.4 372.4 200.4134 01/01/93 02:16 107.44 6.84 350.6 0.00 24.0 72.8 114.5 265.9 12.20 0.00 49.0 373.2 200.6135 01/07/93 03:29 45.10 7.18 444.5 0.00 21.7 91.3 135.4 297.7 4.52 0.62 62.9 491.4 229.3136 01/07/93 04:29 94.27 7.16 437.4 0.00 20.2 90.7 133.6 298.6 3.02 0.00 62.7 479.2 224.5137 01/07/93 05:29 45.10 7.13 434.6 0.00 21.2 89.5 132.8 300.5 4.16 0.70 63.0 469.7 232.9138 01/07/93 06:29 35.96 7.10 435.9 0.00 21.4 89.9 133.6 297.8 6.08 0.68 62.2 475.9 229.7139 01/07/93 07:29 35.96 7.11 439.7 0.00 20.1 88.2 132.3 301.9 4.45 0.00 62.3 469.9 223.1140 01/07/93 08:29 35.96 7.08 435.2 0.00 20.7 88.6 131.8 297.4 6.04 0.53 61.7 469.9 224.4129
Caspar Creek - Watershed KJE# DATE TIME Streamflow pH Na NH4 K Mg Ca CI NO3 PO4 SO4 HCO3 SiL/s µM µM µM µM µM µM µM µM µM µM µM141 01/07/93 09:29 35.96 7.09 430.7 0.00 20.7 88.4 131.4 296.2 6.15 0.00 60.9 467.0 218.0142 01/07/93 10:29 35.96 7.13 434.0 0.00 20.2 88.2 131.3 297.1 6.33 0.63 60.6 468.5 225.2143 01/07/93 11:27 35.96 7.12 431.8 0.00 20.9 87.7 131.1 297.7 5.96 0.53 61.2 464.3 231.0144 01/07/93 12:27 35.96 7.14 436.5 0.00 20.2 88.1 132.1 297.1 4.03 0.45 61.5 473.0 234.1145 01/07/93 13:02 35.96 7.08 431.1 0.00 20.4 88.4 132.3 303.2 5.69 0.67 61.6 460.8 228.7146 01/07/93 19:05 35.05 7.07 435.0 0.00 20.8 87.3 131.0 297.6 5.26 0.47 61.0 467.3 228.0147 01/07/93 19:22 35.05 7.09 439.2 0.00 20.5 88.4 132.3 301.2 4.98 0.00 60.9 473.2 233.7148 01/07/93 20:22 35.05 7.12 436.6 0.00 20.5 88.2 133.4 302.0 5.07 0.45 61.8 469.7 233.4149 01/07/93 21:22 35.05 7.10 438.9 0.00 20.7 89.0 133.5 306:6 3.80 0.00 61.7 470.6 234.4150 01/07/93 22:22 35.05 7.04 440.2 0.00 20.7 89.4 133.6 307.0 6.62 0.00 61.3 470.8 235.3151 01/07/93 23:22 31.49 7.05 438.6 0.00 20.4 88.6 133.3 302.1 4.44 0.00 61.3 473.7 233.8152 01/08/93 00:22 35.05 7.04 438.9 0.00 20.0 88.9 134.1 310.1 4.35 0.67 61.1 468.3 239.2153 01/08/93 01:22 31.49 7.13 438.9 0.00 21.3 88.3 132.5 301.3 6.45 0.00 60.4 473.5 236.0154 01/08/93 02:22 31.49 7.13 436.4 0.00 21.2 88.4 131.8 301.8 5.35 0.75 59.7 471.5 232.2155 01/08/93 03:22 31.49 7.24 436.5 0.00 21.5 89.0 132.5 302.1 4.62 0.50 59.8 474.7 228.3156 01/08/93 04:22 31.49 7.22 441.0 0.00 21.6 88.7 132.6 294.3 6.22 0.00 59.7 485.3 230.0157 01/12/93 10:15 15.88 7.21 467.1 0.00 21.1 95.7 143.1 340.2 7.38 0.00 66.2 485.9 244.0158 01/13/93 19:42 13.23 7.12 434.4 0.00 20.8 93.6 141.8 310.7 2.54 2.22 61.8 489.1 225.6159 01/13/93 20:42 15.88 7.09 434.3 0.00 20.9 92.5 136.7 295.6 2.47 0.00 62.0 491.5 222.7160 01/13/93 21:42 21.67 7.13 416.8 0.00 20.8 89.1 131.9 287.6 4.94 0.00 60.4 466.2 216.2161 01/13/93 22:42 33.25 7.16 413.9 0.00 20.4 87.5 129.7 272.7 3.29 0.79 61.1 470.6 209.7162 01/13/93 23:42 40.63 7.18 413.6 0.00 20.7 85.7 125.1 268.1 4.33 0.00 59.0 465.3 204.0163 01/14/93 00:42 48.51 7.16 406.0 0.00 20.2 82.7 120.7 261.9 7.22 0.00 59.1 445.8 204.9164 01/14/93 01:42 54.74 7.20 401.3 0.00 20.3 82.3 121.0 261.9 3.77 0.00 57.6 447.2 201.9165 01/14/93 02:42 61.24 7.14 397.6 0.00 20.1 79.5 120.2 256.6 3.79 0.00 56.6 443.5 197.7166 01/14/93 03:42 65.71 7.24 386.8 0.00 20.3 79.5 119.1 257.5 3.61 0.00 57.1 428.9 200.1167 01/14/93 04:42 72.62 7.11 398.1 0.00 20.7 78.4 118.2 254.1 4.30 0.00 56.7 440.3 199.5168 01/14/93 05:42 65.71 7.04 400.2 0.00 20.7 78.4 117.4 257.6 6.85 0.00 56.9 434.2 200.4169 01/14/93 06:42 67.98 7.08 403.1 0.00 21.1 79.0 118.1 259.9 6.68 0.00 57.5 436.8 203.5170 01/14/93 07:42 67.98 7.03 405.4 0.00 20.9 79.6 119.0 265.6 7.66 0.00 56.7 436.8 207.3171 01/14/93 08:42 63.46 7.02 408.2 0.00 20.8 78.9 119.0 261.1 9.74 0.46 57.4 439.3 203.4172 01/14/93 09:42 63.46 7.05 413.3 0.00 21.0 80.2 119.3 261.7 9.66 0.51 57.7 446.7 208.9173 01/14/93 10:42 63.46 7.07 419.6 0.00 21.6 80.6 121.8 273.5 11.65 0.00 58.1 444.5 206.6174 01/14/93 11:42 59.04 7.05 417.7 0.00 21.5 80.9 122.0 265.8 9.68 0.52 58.4 452.6 213.9175 01/14/93 12:42 59.04 7.16 416.0 0.00 20.8 81.0 121.7 272.4 8.44 0.00 58.4 444.6 211.8176 01/14/93 13:44 50.56 6.80 421.7 0.00 21.7 82.0 123.8 269.9 4.67 0.78 56.5 467.4 223.3177 01/14/93 15:44 44.51 6.87 424.0 0.00 22.6 82.3 124.9 276.0 6.71 0.46 57.1 464.1 229.4178 01/14/93 17:44 40.63 6.90 424.4 0.00 22.2 83.3 126.1 286.3 5.67 0.00 57.5 458.5 228.3179 01/14/93 19:44 35.05 6.94 424.7 0.00 21.8 83.8 127.0 282.9 6.88 0.00 57.8 462.8 237.1180 01/14/93 21:44 35.05 6.97 427.6 0.00 20.8 85.7 127.7 286.0 4.69 0.92 57.8 468.8 237.1181 01/14/93 23:44 35.05 6.98 432.5 0.00 20.9 85.9 128.8 290.9 6.24 0.00 58.5 468.8 235.0182 01/15/93 01:44 31.49 6.98 433.4 0.00 20.9 86.3 130.0 294.3 8.52 0.00 59.5 465.2 239.7183 01/15/93 03:44 31.49 7.01 436.4 0.00 20.8 86.3 130.6 296.0 7.22 0.00 59.4 469.0 239.2184 01/15/93 05:44 28.08 7.03 436.9 0.00 21.2 86.9 131.6 294.4 8.49 0.00 61.1 470.1 234.9185 01/15/93 07:44 28.08 7.02 437.3 0.00 23.4 87.6 133.4 304.7 9.60 0.68 59.2 470.0 261.1186 01/15/93 09:44 28.08 7.01 434.3 0.00 21.2 87.6 131.5 302.4 8.40 0.00 60.0 462.8 252.8187 01/15/93 11:44 24.80 6.95 437.5 0.00 21.5 88.3 133.9 304.7 8.60 0.00 59.6 470.7 243.1188 01/15/93 13:44 29.77 6.98 436.1 0.00 23.7 87.2 131.5 292.5 8.26 0.96 59.9 476.6 238.5189 01/15/93 15:44 29.77 7.02 434.4 0.00 23.0 83.0 124.2 292.7 8.85 0.00 61.0 448.3 237.4190 01/15/93 17:44 29.77 7.05 432.6 0.00 22.6 88.3 132.2 298.7 8.46 0.45 60.9 467.3 237.1191 01/15/93 19:44 26.42 6.92, 429.5 0.00 22.4 87.8 133.0 297.5 7.40 0.00 60.4 467.8 236.5192 01/15/93 21:44 24.80 6.95 432.5 0.00 20.7 88.0 132.7 292.8 5.51 0.00 60.3 475,5 241.5193 01/15193 23:44 26.42 6.97 436.1 0.00 21.2 88.6 133.7 301.4 7.59 0.46 61.0 470.9 236.0194 01/16/93 01:44 29.77 7.01 435.7 0.00 22.4 88.5 133.9 296.0 7.89 0.00 61.3 476.4 241.6195 01/16/93 03:44 29.77 6.98 440.1 0.00 20.9 89.2 134.9 296.2 6.92 0.45 61.6 482.7 234.0196 01/16/93 05:44 29.77 6.95 441.4 0.00 21.5 88.6 134.6 296.4 6.79 0.45 61.2 483.7 242.6197 01/16/93 07:44 29.77 7.03 439.0 0.00 22.6 89.4 135.2 297.4 7.97 0.00 61.0 483.2 246.4198 01/16193 09:44 29.77 7.02 436.5 0.00 20.8 88.8 137.2 301.3 7.33 0.00 60.9 479.1 239.6199 01/16/93 11:44 26.42 7.02 441.2 0.00 20.9 89.2 135.1 303.6 8.06 0.00 61.1 476.8 240.2200 01/19/93 21:21 81.97 7.13 409.0 0.00 19.6 86.8 127.2 276.6 0.00 0.00 57.6 464.8 212.8201 01/19/93 22:21 68.90 7.18 403.4 0.00 19.7 84.3 126.0 258.6 0.00 0.00 56.4 472.2 208.4202 01/19/93 23:21 61.46 7.21 381.8 0.00 19.7 80.4 120.0 243.3 0.48 0.00 55.2 448.1 194.7203 01/20/93 00:21 72.62 7.18 364.4 0.00 20.3 75.5 113.4 215.2 0.00 0.00 49.4 448.6 181.0204 01/20/93 01:21 105.29 7.10 342.5 0.00 20.3 69.1 103.6 195.1 0.68 0.00 46.8 418.7 171.7205 01/20/93 02:21 124.60 7.12 329.6 0.00 20.7 65.9 100.8 190.4 0.00 0.00 44.9 403.6 144.5206 01/20/93 03:21 139.09 6.86 328.9 0.00 22.2 63.8 97.0 194.0 0.00 0.00 45.7 387.3 182.8207 01/20/93 04:21 151.08 7.08 323.9 0.00 21.4 63.7 97.6 189.9 0.00 0.00 45.3 387.3 163.9208 01/20/93 05:21 160.30 6.97 322.5 0.00 22.6 61.4 95.3 190.1 0.00 0.00 42.7 383.0 162.5209 01/20/93 06:21 169.71 7.03 324.6 0.00 22.6 62.8 98.3 191.2 0.00 0.72 44.7 388.7 184.0210 01/20/93 07:21 176.09 7.19 323.0 0.00 22.0 63.6 99.5 187.6 0.00 0.65 43.3 397.1 165.9130
Caspar Creek - Watershed KJE# DATE TIME Streamflow pH Na NH4 K Mg Ca CI NO3 PO4 SO4 HCO3 SiL/s µM µM µM µM µM µM µM µM µM µM µM211 01/20/93 08:21 179.31 6.88 324.6 0.00 22.9 63.2 98.9 197.3 0.00 0.00 44.4 385.7 165.4212 01/20/93 09:21 166.55 7.23 327.7 0.00 23.2 64.4 100.7 201.0 0.00 0.00 45.2 389.7 164.8213 01/20/93 10:21 166.55 7.23 330.6 0.00 25.0 63.8 101.1 199.5 0.00 0.00 44.5 397.0 171.3214 01/20/93 11:21 216.09 7.19 315.9 0.00 23.3 62.3 97.4 191.7 0.00 0.00 42.5 382.1 159.6215 01/20/93 12:21 266.31 7.24 303.9 0.00 24.0 59.5 93.6 179.0 0.00 0.00 41.6 371.9 151.9216 01/20/93 13:21 273.78 7.16 302.5 0.00 24.5 57.7 93.5 184.1 0.00 0.00 40.9 363.3 152.2217 01/20/93 16:21 172.89 7.16 317.6 0.00 23.4 61.9 97.7 201.8 0.00 0.00 42.8 372.9 162.2218 01/20/93 19:21 118.97 7.23 336.3 0.00 22.9 65.5 104.7 217.3 0.00 0.00 47.6 387.0 175.9219 01/20/93 22:21 82.21 7.26 353.5 0.00 22.9 69.8 110.3 232.4 0.00 0.71 47.2 409.8 186.9220 01/21/93 01:21 74.98 7.23 368.6 0.00 22.4 72.4 115.0 251.1 0.46 0.00 48.3 417.6 197.9221 01/21/93 04:21 59.04 7.28 371.9 0.00 22.1 74.0 116.9 252.4 0.58 0.00 50.5 421.7 202.1222 01/21/93 07:21 54.74 7.28 379.8 0.00 21.4 75.0 118.3 257.6 2.04 0.00 51.8 424.7 209.2223 01/21/93 10:21 44.51 7.26 382.6 0.00 21.5 75.8 119.3 258.2 2.60 0.00 51.9 429.7 254.3224 02/17/93 11:10 7.93 7.42 470.4 0.00 21.1 104.4 159.9 331.1 0.46 0.00 70.9 546.8 269.5225 03/03/93 10:30 8.47 7.45 522.0 0.00 23.0 111.1 164.7 348.0 0.00 0.00 75.0 598.5 260.7226 03/24/93 10:55 11.97 7.53 517.6 0.00 23.0 115.2 172.2 330.0 0.00 0.00 72.0 641.3 260.4227 04/07/93 10:15 9.59 7.59 539.4 0.00 23.0 115.2 172.2 353.0 0.00 0.00 75.0 634.1 259.8228 04/28/93 08:10 11.97 7.06 492.0 0.00 22.4 113.1 187.1 349.3 0.00 0.00 72.7 620.1 266.4229 05/12/93 11:15 4.52 6.94 564.3 0.00 23.1 120.2 198.9 430.3 0.00 0.00 76.2 642.9 268.9230 05/24/93 11:15 4.52 7.06 598.8 0.00 23.3 135.3 220.4 430.1 0.00 0.00 77.1 749.1 283.1231 05/27/93 11:15 15.88 7.25 534.9 0.00 22.6 126.5 206.8 333.4 0.00 0.00 68.4 754.0 265.1232 06/09/93 09:20 8.47 7.29 541.4 0.00 22.6 120.8 199.2 369.3 0.00 0.00 75.0 684.8 277.4233 07/01/93 12:40 3.67 7.21 601.6 0.00 24.6 130.5 214.3 470.0 0.00 0.00 79.2 687.2 286.2234 07/22/93 14:00 3.27 7.35 637.6 0.00 25.8 142.1 232.4 543.9 0.00 0.00 80.7 707.1 295.6235 08/10/93 08:15 2.89 7.09 649.0 0.00 24.8 148.0 241.5 522.5 0.00 0.00 80.1 770.0 291.6236 09/07/93 10:30 2.18 7.58 689.0 0.00 26.1 158.8 257.1 623.8 0.00 0.00 84.6 753.7 289.9237 10/20/93 10:19 2.53 7.44 764.2 0.00 23.3 182.6 277.7 626.1 0.00 0.00 93.7 894.7 270.1238 12/01/93 09:51 0.53 7.24 646.0 0.00 23.8 176.8 267.7 659.9 0.00 1.30 103.0 692.9 282.2239 12/29/93 10:15 2.89 7.30 542.5 0.00 21.3 139.3 202.7 459.7 0.00 0.55 94.2 599.7 283.3240 01/23/94 04:19 33.25 6.60 462.3 0.00 22.9 101.1 163.0 288.5 2.97 1.13 60.3 601.4 215.6241 01/23/94 05:19 36.88 6.70 433.0 0.00 22.2 93.1 152.4 257.8 3.70 0.00 57.1 570.7 212.1242 01/23/94 06:19 40.63 6.80 427.2 0.00 22.1 101.3 182.7 261.1 4.60 0.00 56.6 638.4 210.1243 01/23/94 07:19 79.78 6.90 423.4 0.00 21.6 96.3 159.5 252.7 4.35 0.00 57.3 584.9 209.5244 01/23/94 08:19 79.78 6.80 422.9 0.00 21.3 91.0 149.7 250.8 4.01 0.00 58.4 554.1 215.7245 01/23/94 09:19 74.98 6.90 424.6 0.00 21.1 90.1 147.0 254.1 4.19 0.00 56.1 549.2 214.9246 01/23/94 10:19 36.88 6.90 425.1 0.00 21.0 90.3 150.3 254.2 4.02 0,00 58.6 551.9 214.2247 01/23/94 12:19 36.88 6.80 420.3 0.00 20.9 90.7 147.5 249.8 7.08 0.00 58.7 543.5 217.3248 01/23/94 13:19 33.25 6.90 426.5 0.00 20.6 90.4 148.1 254.6 3.35 0.00 65.4 535.3 214.9249 01/23/94 14:18 33.25 6.90 425.7 0.00 20.5 91.0 149.0 258.3 4.23 0.00 60.9 541.8 219.9250 01/23/94 15:19 33.25 6.90 425.2 0.00 20.4 91.6 148.4 257.2 4.09 0.00 59.8 544.6 216.0251 01/23/94 16:19 33.25 6.90 426.4 0.00 20.5 92.0 152.1 258.4 2.75 0.00 58.7 556.7 221.2252 01/23/94 17:18 33.25 7.00 425.0 0.00 21.6 90.5 148.2 260.9 3.93 0.00 61.5 536.0 220.7253 01/23/94 18:19 33.25 7.00 426.8 0.00 20.4 93.1 155.8 255.0 4.36 0.00 57.1 571.4 223.8254 01/23/94 19:19 33.25 7.10 425.6 0.00 20.7 90.0 146.8 257.6 3.44 0.00 59.3 540:0 222.1255 01/23/94 20:18 33.25 6.90 425.9 0.00 20.5 93.3 156.5 261.1 4.91 0.00 60.5 559.2 225.7256 01/23/94 21:19 33.25 6.60 424.4 0.00 20.4 98.1 164.1 264.5 5.44 0.00 60.6 578.2 227.3257 01/23/94 22:19 33.25 6.70 424.2 0.00 20.5 91.4 149.8 259.0 4.45 0.00 61.0 541.7 225.4258 01/24/94 00:19 33.25 6.70 425.8 0.00 20.4 91.4 149.6 263.8 4.29 0.00 63.9 532.3 224.1259 01/24/94 01:19 33.25 6.80 429.3 0.00 20.5 90.9 149.3 258.5 4.18 0.00 60.5 546.5 220.5260 01/24/94 02:19 33.25 6.80 426.5 0.00 20.4 90.6 149.0 267.5 3.66 0.00 62.4 530.2 221.0261 01/24/94 03:19 33.25 6.90 427.5 0.00 20.4 90.7 149.7 264.8 8.00 0.00 64.3 527.3 223.8262 01/24/94 04:19 33.25 6.90 424.6 0.00 20.5 91.5 149.9 275.4 4.20 0.00 62.3 523.7 224.6263 01/24/94 05:19 33.25 6.90 427.1 0.00 20.7 90.6 150.0 266.2 4.35 0.00 61.7 535.2 224.6264 02/02/94 10:16 7.40 7.50 501.3 0.00 21.1 122.2 198.5 345.9 1.67 0.00 78.1 660.1 279.1265 02/17/94 03:23 36.88 7.20 445.1 3.36 21.7 108.8 157.6 255.0 2.11 0.00 67.5 607.4 207.3266 02/17/94 04:23 36.88 7.14 393.0 2.97 21.8 95.8 147.3 237.1 2.27 0.00 62.0 537.5 196.4267 02/17/94 05:23 40.63 7.10 429.7 0.00 21.4 97.6 149.6 240.7 3.78 0.00 63.9 573.2 197.3268 02/17/94 06:23 50.56 7.16 388.6 3.20 20.8 91.3 142.6 238.2 4.28 0.00 58.6 517.7 185.4269 02/17/94 07:23 54.74 7.07 380.5 3.54 20.1 89.2 139.8 225.1 3.75 0.00 60.6 508.5 186.2270 02/17/94 08:28 54.74 6.96 372.8 0.00 21.5 84.8 138.5 215.7 4.61 0.00 56.0 508.5 186.1271 02/17/94 11:00 59.04 7.07 392.2 3.53 20.5 88.9 137.2 213.0 4.26 0.00 59.5 528.5 190.4272 02/17/94 13:00 59.04 7.13 390.2 0.85 22.7 91.9 145.1 234.1 5.93 0.00 59.3 528.2 198.5273 02/17/94 15:00 74.98 7.14 365.4 1.73 20.3 81.9 129.2 208.5 3.81 0.00 58.9 478.0 191.7274 02/17/94 17:00 72.62 7.07 390.7 0.00 22.1 86.1 136.3 213.6 3.37 0.00 57.71 525.2 194.0275 02/17/94 19:00 74.98 7.01 393.6 0.00 22.0 85.3 139.0 257.0 5.71 0.00 64.3 473.0 201.0276 02/17/94 21:00 74.98 7.01 396.5 0.00 24.4 84.6 133.4 229.0 4.09 0.00 57.7 508.3 195.0277 02/17/94 23:00 67.98 7.18 399.2 0.00 21.9 85.6 133.9 217.7 4.06 0.00 58.6 521.3 192.9278 02/18/94 01:00 63.46 7.11 461.0 0.00 22.0 97.5 140.0 233.2 2.82 0.00 66.2 589.5 209.1279 02/18/94 03:00 59.04 7.03 470.3 0.00 22.7 99.5 142.2 246.0 3.21 0.00 68.0 591.2 213.5280 02/18/94 05:00 54.74 7.22 438.5 0.00 22.4 92.0 139.3 257.2 3.58 0.00 64.6 533.6 213.5131
Caspar Creek - Watershed KJE# DATE TIME Streamflow pH Na NH4 K Mg Ca CI NO3 PO4 SO4 HCO3 SiL/s µM µM µM µM µM µM µM µM µM µM µM281 02/18/94 07:00 50.56 7.05 400.1 0.00 22.0 85.8 150.4 233.7 3.66 0.00 59.9 537.4 211.5282 02/18/94 09:00 50.56 7.07 363.0 2.29 20.6 85.3 151.5 233.4 3.79 0.00 58.5 502.9 209.9283 02/18/94 13:00 44.51 7.06 386.0 0.00 20.0 82.6 136.8 231.0 2.76 0.00 60.9 489.0 213.8284 02/18/94 16:00 44.51 7.06 386.0 0.00 20.3 82.9 139.2 239.8 3.47 0.00 57.5 492.3 210.9285 02/18/94 19:00 40.63 6.98 394.6 0.00 20.0 84.8 140.0 258.9 3.17 0.00 61.7 478.4 213.1286 02/18/94 22:00 36.88 7.07 401.7 0.00 20.7 91.9 155.5 256.1 4.11 0.00 60.8 535.4 220.6287 02/19/94 01:00 33.25 7.04 391.4 3.30 19.6 86.9 143.5 248.8 4.16 0.00 62.5 493.8 224.1288 02/19/94 04:00 21.67 7.06 383.7 6.06 20.1 86.0 141.2 244.4 3.09 0.00 62.2 486.2 249.9289 03/16/94 10:00 3.67 6.51 537.9 0.00 24.5 131.1 200.6 374.8 0.00 0.00 82.9 685.2 264.4290 04/13/94 10:10 2.89 7.73 595.4 0.00 24.5 148.9 226.1 468.0 0.00 0.00 87.0 728.0 277.6291 05/18/94 08:57 3.67 7.38 555.7 0.00 24.4 142.8 220.5 408.3 0.00 0.00 86.3 725.8 270.4292 06/29/94 09:15 2.89 7.67 579.9 0.00 24.3 162.6 247.9 500.8 0.00 0.00 88.6 747.2 263.0293 10/05/94 10:06 2.18 7.18 748.5 0.00 25.8 215.7 355.9 622.0 0.00 0.00 96.4 802.7 282.0294 11/02/94 10:30 1.54 7.58 781.3 0.00 23.3 243.3 384.7 614.6 0.75 0.00 113.2 819.1 266.9295 12/06/94 09:50 3.67 7.49 541.1 0.00 23.3 146.9 240.8 505.5 0.00 0.00 94.4 645.5 264.4296 01/03/95 10:26 8.47 7.14 477.6 0.00 21.7 119.7 178.2 370.3 0.82 0.00 88.2 547.7 253.1297 01/14/95 15:45 40.82 6.97 313.0 0.00 21.2 63.1 111.6 178.9 0.62 0.00 42.2 419.8 159.2298 01/14/95 16:45 36.69 7.08 308.7 0.00 21.8 63.6 119.4 177.0 0.78 0.00 41.6 435.6 156.7299 01/14/95 17:45 36.69 7.05 318.1 0.00 22.2 63.5 115.0 183.5 1.96 0.00 42.8 426.3 155.1300 01/14/95 , 19:45 34.69 7.05 325.8 0.00 22.3 65.1 115.2 184.7 1.76 0.00 44.4 433.3 158.7301 01/14/95 20:45 32.72 7.10 322.8 0.00 22.7 66.2 116.9 186.4 0.00 0.00 46.5 432.2 179.3302 01/14/95 21:45 32.72 7.03 331.6 0.00 21.7 66.7 117.7 186.4 1.65 0.00 48.2 437.5 166.5303 01/14/95 22:45 32.72 7.10 348.1 0.00 23.3 67.9 122.3 203.0 1.19 0.00 46.3 455.1 164.9304 01/14/95 23:45 32.72 6.90 326.1 0.95 21.8 67.4 118.1 194.1 1.49 0.00 48.2 426.9 171.3305 01/15/95 00:45 28.92 7.09 350.4 0.00 21.7 68.7 121.2 198.0 0.00 0.00 49.7 454.5 174.8306 01/15/95 01:45 28.92 7.10 342.5 0.00 21.7 69.1 120.8 201.4 0.00 0.00 49.1 444.3 178.2307 01/15/95 02:45 28.92 7.20 341.1 0.00 20.7 68.6 120.8 205.7 1.13 0.00 48.0 438.0 176.4308 01/15/95 03:45 28.92 7.11 350.7 0.00 22.6 69.9 123.9 204.2 0.75 0.00 48.0 459.9 174.6309 01/15/95 05:45 28.92 7.10 330.3 3.35 20.4 71.9 127.0 208.8 1.63 0.85 49.2 439.5 180.4310 01/15/95 07:45 25.28 7.05 345.9 0.00 21.0 70.3 123.5 210.7 0.00 0.80 51.1 441.6 184.3311 01/15/95 09:45 25.28 7.07 345.1 0.83 21.3 72.3 125.9 208.1 2.23 0.00 51.2 450.1 188.1312 01/15/95 11:45 25.28 6.94 339.1 1.12 21.8 73.0 128.2 215.1 3.17 0.00 52.1 440.8 187.1313 01/15/95 13:45 25.28 6.78 353.7 0.00 22.6 71.7 122.4 222.4 1.25 0.00 53.0 434.8 190.3314 01/26/95 09:24 18.41 6.83 336.0 0.00 19.1 110.4 122.6 250.4 0.00 0.00 60.2 450.4 258.9315 01/26/95 10:24 21.82 6.73 330.6 0.00 18.4 110.3 122.0 240.6 0.00 0.00 60.3 452.3 237.4316 01/26/95 11:24 25.28 6.75 318.1 0.00 18.4 108.1 119.5 224.7 0.00 1.61 58.6 449.8 223.7317 01/26/95 12:24 32.72 6.80 314.5 0.00 18.3 106.8 120.0 218.7 0.00 0.00 56.6 454.4 215.3318 01/26/95 13:24 36.69 6.80 312.1 0.00 21.9 107.6 117.5 219.0 0.00 0.00 56.0 453.1 216.1319 01/26/95 14:24 40.82 6.79 314.3 0.00 18.4 108.9 119.3 213.9 0.00 0.00 57.3 460.6 217.6320 01/26/95 15:24 45.10 6.79 321.7 0.00 18.5 107.7 120.8 215.8 0.00 0.00 56.9 467.6 221.2321 01/26/95 16:24 49.53 6.83 313.7 0.00 18.4 106.3 118.6 208.9 0.00 0.00 56.8 459.3 218.0322 01/26/95 17:24 49.53 6.82 326.9 0.00 18.6 105.6 120.9 208.6 0.00 1.28 56.4 477.3 217.6323 01/26/95 18:24 49.53 6.90 319.1 0.00 18.5 106.6 120.3 205.0 0.00 0.00 55.7 474.8 264.0324 01/26/95 19:24 49.53 6.97 322.1 0.00 19.3 109.1 118.1 213.4 0.00 0.00 56.2 470.1 220.1325 01/26/95 20:24 49.53 6.92 313.4 0.00 18.5 104.5 114.6 207.1 0.00 0.00 55.9 451.2 220.9326 01/26/95 21:24 45.10 6.91 315.7 0.00 18.6 104.5 114.2 206.2 0.00 0.00 55.4 454.6 219.4327 01/26/95 22:24 45.10 6.96 316.7 0.00 18.4 104.8 117.4 208.4 0.00 0.00 55,6 459.9 223.5328 01/26t95 23:24 40.82 6.97 312.0 0.00 19.2 104.3 115.4 215.4 0.00 0.00 56.2 442.8 219.4329 01/27/95 00:24 36.88 6.92 314.8 0.00 18.3 104.9 114.9 216.2 0.00 0.00 56.1 444.3 221.9330 01/27/95 01:24 40.82 6.86 321.0 0.00 18.5 104.9 123.2 212.0 0.00 0.00 56.2 471.2 225.2331 01/27/95 02:24 36.69 6.91 324.1 0.00 18.5 104.2 120.8 220.6 0.00 0.00 56.9 458.1 226.3332 01/27/95 03:24 36.69 6.86 318.9 0.00 18.5 106.0 124.6 219.2 0.00 0.00 56.4 466.6 227.4333 01/27/95 04:24 32.72 6.85 319.0 0.00 18.6 105.1 117.8 220.7 0.00 0.00 56.2 450.3 229.7334 01/27/95 05:24 32.72 6.82 320.9 0.00 18.4 104.3 119.9 219.3 0.00 0.00 56.5 455.5 232.4335 01/27/95 06:24 32.72 6.88 326.2 0.00 18.6 104.8 121.2 224.6 0.00 0.00 66.9 458.3 230.4336 01/27/95 07:24 28.92 6.87 323.4 0.00 18.4 108.0 122.8 226.3 0.00 0.00 56.5 464.1 235.0337 01/27/95 08:24 28.92 6.87 322.3 0.00 18.6 104.6 122.2 224.4 0.00 0.00 57.3 455.4 235.0338 01/30/95 06:57 35.41 6.86 317.4 0.00 18.3 108.3 118.3 215.5 0.57 0.00 56.4 460.0 225.8339 01/30/95 07:57 40.82 6.87 303.0 0.26 18.4 106.8 117.4 197.3 0.00 0.00 54.9 462.5 219.7340 01/30/95 08:57 45.10 6.89 311.6 0.00 18.3 105.9 115.4 204.7 0.90 0.00 54.1 458.7 219.0341 01/30/95 09:57 49.53 6.87 363.8 0.00 17.8 74.2 126.3 202.4 0.00 0.00 54.2 471.7 222.7342 01/30/95 10:57 54.11 6.88 364.1 0.00 17.7 73.3 124.9 204.0 0.00 0.00 53.2 467.9 220.9343 01/30/95 11:57 58.83 6.89 346.3 0.00 17.8 73.1 125.6 199.0 0.00 0.00 55.8 450.8 219.6344 01/30/95 12:57 58.83 7.24 371.5 0.00 19.2 72.6 122.0 198.4 0.00 0.00 53.2 475.2 220.8345 01/30/95 13:57 58.83 7.18 361.1 0.00 18.5 71.4 122.3 200.7 0.00 0.00 53.5 459.2 233.9346 01/30/95 14:57 57.31 7.14 363.0 0.00 17.9 72.6 126.2 206.7 0.00 0.00 54.0 463.8 219.4347 01/30/95 15:57 54.11 7.09 383.8 0.00 17.9 73.8 125.6 201.1 0.00 0.00 55.0 489.4 237.7348 01/30/95 16:57 54.11 7.06 371.4 0.00 18.3 72.6 124.1 214.2 0.00 0.00 55.1 458.7 236.3349 01/30/95 17:57 49.53 7.06 395.6 0.00 18.0 72.4 124.3 210.0 0.00 0.00 55.3 486.2 223.9350 01/30/95 18:57 49.53 7.02 357.6 0.43 17.9 74.2 128.5 210.9 0.00 0.00 55.7 458.7 226.0132
Caspar Creek - Watershed KJE# DATE TIME Streamflow pH Na NH4 K Mg Ca CI NO3 PO4 SO4 HCO3 SiL/s µM µM µM µM µM µM µM µM µM µM µM351 01/30195 19:57 45.10 7.01 374.3 0.00 17.6 74.2 127.0 208.8 0.00 0.00 54.1 477.7 228.0352 01/30/95 20:57 45.10 6.97 369.6 0.00 18.0 75.8 126.9 220.1 0.00 0.00 55.0 462.7 234.2353 01/30/95 21:57 40.82 6.98 375.7 0.00 18.3 75.9 129.7 213.6 0.00 0.00 55.0 481.5 242.1354 01/30/95 22:57 36.88 6.96 374.7 0.00 18.3 74.9 128.1 220.5 0.00 0.00 55.4 467.5 231.9355 01/30/95 23:57 42.17 6.95 366.3 0.00 18.3 74.1 125.9 221.2 0.00 0.00 54.7 454.1 236.6356 01/31/95 00:57 40.82 6.95 369.3 0.00 17.9 74.9 128.4 215.3 0.00 0.00 54.7 469.3 231.8357 01/31/95 01:57 40.82 6.93 372.3 0.00 18.1 76.1 133.9 219.3 1.06 0.00 56.2 477.7 237.3358 01/31/95 02:57 36.69 6.94 371.5 0.71 18.4 75.6 129.3 227.3 0.00 0.00 56.1 460.1 238.0359 01/31/95 03:57 36.69 6.91 373.5 0.00 18.2 75.9 129.0 225.6 0.00 0.00 56.0 464.0 240.9360 01/31/95 04:57 36.69 6.90 378.1 0.00 20.3 77.2 137.2 228.2 0.47 0.00 56.5 485.4 245.8361 01/31195 05:57 32.72 6.76 411.6 0.00 20.7 90.6 158.0 222.3 0.00 0.00 60.6 586.0 238.1362 02/01/95 11:11 22.44 6.66 368.7 0.00 19.2 93.7 170.0 238.6 1.13 0.00 59.0 557.7 240.9363 02/07/95 18:45 5.24 6.49 317.2 0.00 21.2 62.5 108.8 184.5 0.00 0.00 44.4 407.7 180.3364 02/20/95 14:48 5.90 6.56 438.8 0.00 21.5 110.3 176.0 354.2 0.00 0.00 74.2 530.3 260.7365 03101/95 10:08 4.96 6.93 476.1 0.00 22.3 144.0 163.2 359.6 0.00 0.00 87.1 579.1 273.7366 03/08/95 20:24 26.42 7.21 344.9 2.51 19.9 76.0 127.2 179.1 0.69 0.00 45.9 499.7 190.2367 03/08/95 21:17 31.49 6.87 402.7 0.00 19.5 88.6 141.1 198.2 3.81 0.00 48.5 582.7 202.7368 03/08/95 22:17 45.10 7.10 382.6 0.00 18.9 86.0 136.8 191.7 13.93 0.00 51.9 537.7 195.7369 03/08/95 23:17 58.83 7.10 350.0 0.00 19.6 69.4 117.2 183.1 16.96 0.00 51.3 440.2 190.0370 03/09/95 00:17 94.01 7.14 373.3 0.00 19.7 76.4 125.3 166.1 22.75 0.00 46,8 513.8 182.5371 03109/95 01:17 113.43 7.15 380.0 0.00 20.5 76.0 125.2 152.9 12.43 0.00 43.2 551.2 180.4372 03/09/95 02:17 119.81 7.13 371.7 0.00 19.5 73.4 123.0 163.9 6.42 0.00 51.7 510.2 184.1373 03/09/95 03:17 119.81 7.21 368.0 0.00 19.6 73.1 121.8 165.9 15.91 0.00 45.6 504.5 188.0374 03/09/95 04:17 126.02 7.11 371.2 0.00 19.7 70.9 121.0 163.2 9.61 0.00 45.1 511.7 182.5375 03/09/95 05:17 130.33 7.12 366.0 0.00 19.4 72.9 120.4 163.2 5.12 0.00 43.6 516.5 182.3376 03/09/95 06:17 127.17 6.75 369.3 0.00 19.5 75.7 121.8 168.2 5.02 0.00 44.7 .521.2 199.8377 03/09/95 07:17 130.33 7.01 373.3 0.00 20.0 74.0 120.0 172.1 25.33 0.00 46.1 491.7 190.5378 03/09/95 08:17 130.33 6.98 358.3 0.00 20.3 72.5 121.2 167.7 12.25 0.00 45.3 505.4 191.9379 03/09/95 09:17 74.74 7.08 365.9 0.00 20.3 71.6 120.2 168.6 13.33 0.00 45.4 497.2 298.0380 03/09/95 10:16 80.50 6.91 366.6 0.00 20.4 70.6 114.0 163.7 10.35 0.00 44.4 493.5 191.5381 03/09/95 11:16 85.67 7.08 377.5 0.00 20.3 72.3 120.1 184.8 13.43 0.00 49.0 486.3 197.6382 03/09/95 12:17 91.46 7.12 371.7 0.00 19.4 80.7 137.7 173.4 11.39 0.00 46.5 550.0 198.3383 03/09/95 14:11 107.71 6.94 369.8 0.00 21.0 76.0 119.7 176.9 14.78 0.00 46.0 498.4 205.4384 03109/95 14:12 107.71 6.90 358.3 0.00 19.7 68.7 117.5 179.0 20.75 0.00 45.1 460.6 209.5385 03/09/95 16:13 89.93 6.79 368.4 0.00 18.7 71.9 120.7 174.3 23.25 0.00 48.5 447.5 214.4386 03/09/95 18:13 74.03 6.97 382.8 0.00 18.6 76.0 124.4 162.4 12.96 0.00 44.8 547.3 220.9387 03/09/95 20:13 58.83 6.92 399.8 0.00 19.4 78.2 128.1 200.9 19.93 0.00 48.8 513.6 224.8388 03/09/95 22:13 52.64 6.77 380.6 0.00 21.8 74.1 126.4 207.5 26.23 0.00 50.8 468.0 232.2389 03/10/95 00:13 49.53 7.20 389.9 0.00 21.8 81.7 164.5 208.4 1.08 0.00 51.0 592.6 213.2390 03/11/95 17:15 36.69 6.82 427.0 0.00 22.2 90.6 153.6 221.0 0.94 0.00 56.4 603.0 243.1391 03113/95 23:58 100.52 6.91 440.5 0,00 22.2 90.3 148.2 183.9 2.26 0.00 46.1 661.6 207.3392 03114/95 01:58 95.82 6.81 334.8 0.00 20.4 73.9 122.7 187.8 2.47 0.00 49.2 459.6 209.3393 03114/95 03:58 90.19 6.85 343.6 0.00 20.2 78.3 126.7 184.8 3.25 0.00 49.8 486.2 220.0394 03/14/95 05:58 106.36 6.89 331.5 0.92 20.0 75.8 122.3 182.3 2.41 0.00 46.9 469.1 202.8395 03/14/95 07:58 164.35 6.88 299.7 0.92 20.2 73.2 113.7 161.4 1.29 0.00 43.6 443.8 185.2396 03/14/95 09:58 232.18 6.99 282.2 1.91 21.1 65.2 108.2 146.6 3.73 0.00 40.3 419.2 173.5397 03/14/95 13:58 173.85 6.60 225.0 1.99 17.9 65.0 86.5 149.4 10.12 0.00 40.5 305.2 137.0398 03114/95 15:58 145.34 7.11 292.5 0.36 20.1 63.0 106.9 152.6 7.90 0.00 40.8 410.3 181.4399 03/14/95 17:58 119.81 7.01 304.2 0.60 21.1 67.5 112.9 165.0 8.31 0.00 42.0 428.8 192.2400 03/14/95 19:58 101.57 7.04 321.0 0.001 21.0 69.5 117.6 166.3 3.64 0.00 61.4 423.5 197.4401 03/14/95 21:58 85.67 7.03 321.9 0.59 21.1 72.5 126.0 173.6 3.56 0.00 70.9 420.9 202.3402 03/14/95 23:58 74.03 7.11 325.2 0.66 21.1 72.6 123.4 177.0 2.98 0.00 46.0 466.4 208.9403 03/15/95 01:58 63.91 7.13 336.6 0.00 21.3 75.2 124.2 195.0 4.16 0.00 49.0 459.6 211.5404 03/15/95 03:58 63.91 7.10 329.1 0.00 20.6 73.4 121.8 183.9 5.84 0.00 47.5 455.3 215.1405 03/15/95 05:58 54.11 7.13 334.8 2.99 21.2 76.4 122.4 190.8 2.38 0.00 49.0 462.4 216.2406 03/20/95 08:28 50.56 7.15 345.4 0.50 20.4 76.9 128.4 211.0 3.17 0.00 53.0 456.2 230.4407 04/05/95 09:17 5.90 6.96 441.2 0.00 21.6 122.9 173.4 331.6 0.00 0.00 65.8 592.3 265.0408 05/05/95 09:30 11.97 7.10 431.4 0.00 19.9 100.6 156.3 301.5 3.57 0.00 69.1 522.1 270.3409 06/05/95 07:45 5.42 7.47 520.4 0.00 22.0 123.5 192.4 423.1 0.00 0.00 57.7 635.7 280.2410 12/05/95 12.00 8.47 7.45 779.6 0.00 29.9 112.8 311.2 670.4 0.00 0.00 100.7 785.8 270.8411 12/12/95 00:53 107.98 6.86 500.9 0.00 23.0 114.8 173.6 323.0 18.87 0.00 67.7 623.4 218.5412 12/12/95 01:53 124.60 7.081 523.5 0.00 23.2 128.4 190.8 385.6 24.32 0.00 67.0 641.1 195.7413 12/12/95 02:53 106.10 7.10 464.3 0.00 24.6 109.5 165.6 320.7 19.29 0.00 54.6 589.8 181.1414 12/12/95 03:53 114.25 7.07 480.9 0.00 24.3 109.9 166.6 321.1 22.06 0.00 57.0 600.9 189.3415 12/12/95 04:53 89.93 7.13 479.1 0.00 24.6 109.5 158.4 317.6 18.34 0.00 58.6 586.3 190.0416 12/12/95 05:53 68.67 7.14 485.2 0.00 23.5 110.7 166.8 326.2 20.18 0.00 59.9 597.7 198.9417 12/12/95 06:53 59.70 7.13 489.6 0.00 23.5 110.3 167.1 330 6 15.40 0.00 62.3 597.2 202.1418 12/12/95 07:53 54.96 7.19 491.3 0.00 23.0 111.1 168.6 323.1 22.57 0.00 62.1 603.8 237.7419 12/12/95 08:53 53.90 7.20 490.0 0.00 22.8 109.9 166.3 318.8 16.22 0.00 62.3 605.5 203.9420 12/12/95 09.53 51.18 7.23 515.7 0.00 23.0 105.8 166.61 314.2 19.97 0.00 63.6 622.1 206.8133
Caspar Creek - Watershed KJE# DATE TIME Streamflow pH Na NH4 K Mg Ca Cl NO3 PO4 SO4 HCO3 SiL/s µM µM µM µM µM µM µM µM µM µM µM421 12/12/95 10:53 49.74 7.27 464.3 0.00 24.6 109.5 165.6 313.1 17.00 0.00 64.8 579.3 206.0422 12/12/95 11:53 41.39 7.28 479.1 0.00 24.6 109.5 158.4 313.2 11.74 0.00 64.6 585.2 206.8423 12/12/95 12:53 32.55 7.21 444.8 30.00 26.1 109.8 156.2 322.3 12.44 0.00 65.2 537.7 212.8424 12/12/95 13:53 25.12 7.18 446.1 0.00 24.6 109.5 159.4 303.8 11.94 0.00 65.6 561.5 213.5425 12/12/95 14:53 24.80 7.15 446.1 0.00 24.6 109.5 159.6 314.2 10.31 0.00 65.5 553.3 216.0426 12/12/95 15:53 21.82 7.20 449.1 0.00 24.6 109.5 156.9 307.2 16.63 0.00 66.6 549.4 219.9427 12/12/95 16:53 57.53 7.33 498.3 0.00 22.8 112.3 172.3 315.1 13.99 0.00 65.7 629.8 219.2428 12/12/95 17:53 19.28 7.28 497.8 0.00 22.5 111.1 166.8 314.2 10.87 0.00 65.7 619.7 219.6429 12/12/95 18:53 18.12 7.26 497.4 0.00 22.5 111.1 166.8 303.2 9.87 0.00 66.9 629.0 222.1430 12/12/95 19:53 16.99 7.34 500.0 0.00 22.5 112,8 170.3 314.9 9.21 0.00 66.4 631.7 220.3431 12/12/95 20:53 16.71 7.29 499.1 0.00 22.3 112.8 173.6 304.9 8.11 0.00 67.1 646.8 220.6432 12/12/95 21:53 16.85 7.09 502.2 0.00 22.5 114.0 171.6 324.2 8.10 0.00 68.7 626.1 221.7433 12/12/95 22:53 15.33 7.28 503'.5 0.00 22.3 114.4 171.3 315.6 7.31 0.00 69.1 636.1 218.9434 12/12/95 23:53 14.27 7.16 430.4 0.00 26.9 103.3 160.1 293.3 6.59 0.00 51.9 580.5 164.4435 01/11/96 12:00 4.52 7.38 596.5 0.00 32.5 158.8 180.3 333.0 0.00 0.00 75.6 823.1 300.7436 01/16/96 08:02 61.24 7.29 550.4 0.00 32,0 118.5 164.6 272.8 0.00 0.00 68.8 738.2 279.7437 01/16/96 09:24 56.88 7.37 458.3 0.00 31.5 101.2 134.2 182.8 0.00 0.00 50.5 676.8 222.4438 01/16/96 10:24 54.74 7.38 447.4 0.00 31.2 97.1 131.4 184.5 0.00 0.00 50.4 650.4 216.0439 01/16/96 11:24 52.64 7.40 453.9 0.00 31.5 97.1 130.9 186.9 0.00 0.00 51.0 652.5 225.3440 01/16/96 12:24 48.51 7.41 450.4 0.00 31.2 97.1 129.9 182.0 0.00 0.00 50.9 651.8 220.6441 01/16/96 13:24 46.49 7.41 450.9 0.00 31.2 96.7 129.9 184.6 0.00 0.00 51.2 648.3 229.9442 01/16/96 14:24 44.51 7.01 458.3 0.00 31.2 96.3 130.4 184.2 0.00 0.00 51.4 656.0 226.0443 01/16/96 15:24 44.51 7.51 457.0 0.00 30.9 96.3 130.4 185.8 0.00 0.00 52.1 651.4 232.0444 01/16/96 16:24 42.55 7.50 459.6 0.00 30.9 96.7 130.7 188.3 0.00 0.00 51.5 654.1 233.5445 01/16/96 17:24 40.63 7.46 459.6 0.00 30.9 97.5 132.7 192.6 0.00 0.00 52.2 654.0 228.8446 01/16/96 18:24 40.63 7.43 453.0 0.00 31.2 96.3 131.4 188.5 0.00 0.00 52.0 647.2 228.5447 01/16/96 19:24 38.74 7.37 458.3 0.00 30.4 96.7 131.9 190.9 0.00 0.00 51.5 652.0 230.6448 01/16/96 20:24 36.88 7.38 459.6 0.00 30.7 97.1 132.4 194.2 0.00 0.00 54.8 645.5 234.9449 01/17/96 00:02 33.25 7.39 460.4 0.00 30.7 97.1 133.2 194.2 0.00 0.00 51.8 653.9 232.4450 01/17/96 01:02 31.49 7.40 467.8 0.00 30.7 98.8 130.7 198.4 0.00 0.00 54.3 650.5 236.7451 01/17/96 02:02 31.49 7.38 468.3 0.00 30.4 98.8 134.4 199.3 0.00 0.00 53.0 659.7 240.6452 01/17/96 03:02 29.77 7.36 460.0 0.00 30.4 97.5 131.7 199.6 2.93 0.00 54.0 638.2 236.7453 01/17/96 04:02 29.77 7.44 460.0 0.00 30.2 97.5 133.7 193.0 0.00 0.00 53.6 652.4 235.2454 01/17/96 05:02 28.08 7.45 475.7 0.00 30.7 100.0 137.2 207.0 0.00 0.00 55.0 663.6 249.5455 01/17/96 06:02 28.08 7.49 476.1 0.00 30.7 98.4 137.2 204.0 0.00 0.00 54.5 665.0 248.0456 01/17/96 07:02 26.42 7.46 468.7 0.00 30.4 95.6 135.4 206.6 0.00 0.00 53.6 647.5 242.7457 01/24/96 13:40 97.38 7.25 468.7 0.00 30.2 94.7 131.9 198.6 0.00 0.00 54.2 644.9 246.6458 01/24/96 14:40 84.68 7.20 457.4 0.00 31.2 95.1 128.4 186.9 0.00 0.00 50.8 647.1 232.0459 01/24/96 15:40 77.36 7.16 464.3 0.00 29.9 94.2 126.4 183.0 1.59 0.00 49.6 651.8 222.1460 01/24/96 16:40 70.29 7.24 434.8 0.00 30.7 90.9 123.9 171.5 0.00 0.00 46.6 630.5 208.9461 01/24/96 17:40 65.71 7.25 409.1 0.00 31.2 88.5 119.5 156.8 0.00 0.00 42.6 614.3 202.8462 01/24/96 18:40 59.04 7.24 409.1 0.00 31.2 88.5 119.5 150.5 0.00 0.00 39.2 627.3 184.3463 01/24/96 19:40 54.74 7.23 378.3 0.00 32.2 81.5 113.7 146.5 0.00 0.00 39.0 576.4 182.2464 01/24/96 20:40 52.64 7.22 383.5 0,00 32.2 81.9 114.2 146.0 0.00 0.00 39.2 583.6 187.2465 01/24/96 21:40 48.51 7.22 390.9 0.00 32.0 82.7 115.2 153.9 0.00 0.00 40.0 584.9 192.9466 01/24/96 22:40 46.49 7.31 400.9 0.00 32.2 84.8 116.7 152.6 0.00 0.00 39.9 603.7 194.3467 01/24/96 23:40 42.55 7.31 429.1 0.00 33.5 85.2 119.0 175.3 0.00 0.00 44.1 607.4 204.3468 01/25/96 00:40 40.63 7.27 417.4 0.00 32.8 83.5 121.4 163.9 0.00 0.00 43.4 609.5 207.5469 01/25/96 01:40 38.74 7.20 422.6 0.00 32.0 84.4 121.4 164.9 0.00 0.00 44.5 612.3 222.4470 01/25/96 02:40 38.74 7.20 425.7 0.00 35.3 88.5 125.4 166.4 0.00 0.00 44.8 632.7 215.7471 01/25/96 03:40 38.74 7.16 425.2 0.00 32.0 89.3 123.2 167.9 10.47 0.00 44.3 615.2 215.7472 01/25/96 04:40 36.88 7.16 429.1 0.00 31.5 89.7 122.7 169.9 3.24 0.00 45.1 622.1 221.0473 01/25196 05:40 35.05 7.12 441.7 0.00 31.8 89.7 124.2 177.1 2.41 0.00 48.1 625.8 223.1474 01/25/96 06:40 35.05 7.18 433.9 0.00 31.5 89.3 124.9 171.4 0.00 0.00 45.5 631.5 222.1475 01/25/96 07:40 33.25 7.23 424.3 0.00 31.2 91.4 120.0 172.8 0.00 0.00 49.1 607.1 224.9476 01/25/96 08:40 33.25 7.23 439.1 0.00 30.9 92.2 123.2 183.2 1.62 0.00 48.4 619.3 231.7477 01/25/96 09:40 31.49 7.27 44011 0.00 30.9 92.6 123.9 186.6 0.00 0.00 48.7 620.6 234.2478 01/25/96 10:40 31.49 7.27 447.0 0.00 30.9 93.0 124.4 183.7 0.00 0.00 51.2 626.8 236.3479 01/25/96 11:40 29.77 7.08 452.2 0.00 30.7 93.0 125.4 193.5 0.96 0.00 50.1 625.1 239.1480 01/25/96 12:40 29.77 7.21 453.5 0.00 31.7 93.8 126.2 193.0 0.00 0.00 50.0 632.4 247.7481 01/27/96 00:20 31.49 6.81 448.3 0.00 29.9 94.2 129.9 186.1 0.00 0.00 53.9 632.6 247.3482 01/27/96 01:20 31.49 7.37 437.4 0.00 29.7 95.1 127.9 184.4 0.00 0.00 54.4 619.8 230.6483 01/27/96 02:20 33.25 7.23 428.3 0.00 29.7 92.2 129.9 174.2 0.00 0.00 51.1 625.7 232.4484 01/27/96 03:20 33.25 7.29 436.1 0.00 29.4 94.7 129.4 184.2 0.00 0.00 53.9 621.7 229.2485 01/27/96 04:20 35.05 7.29 450.9 0.00 29.9 93.4 128.7 183.6 0.00 0.00 54.6 632.3 236.7486 01/27/96 05:20 35.05 7.25 450.9 0.00 29.9 95.1 131.2 180.0 0.00 0.00 52.9 647.5 242.3487 01/27/96 06:20 35.05 7.26 440.4 0.00 29.9 95.1 129.4 176.6 0.00 0.00 52.6 637.5 236.7488 01/27/96 07:20 35.05 7.17 441.3 0.00 29.4 93.4 127.7 177.7 0.00 0.00 52.8 629.6 233.8489 01/27/96 08:20 35.05 7.37 456.5 0.00 30.2 93.8 128.4 177.5 0.00 0.00 52.5 648.7 238.1490 01/27/96 09:21 35.05 7.44 458.3 0.00 29.9 94.7 129.9 178.4 0.00 0.00 52.4 654.2 244.8134
Caspar Creek - Watershed KJE# DATE TIME Streamflow pH Na NH4 K Mg Ca CI NO3 PO4 SO4 HCO3 SiL/s µM µM µM µM µM µM µM µM µM µM µM491 01/27/96 10:20 35.05 7.44 450.9 0.00 29.7 94.2 129.9 175.1 0.00 0.00 53.1 647.6 240.2492 01/27/96 11:20 35.05 7.38 444.3 0.00 29.7 93.8 127.7 174.3 0.00 0.00 51.5 639.7 233.5493 01/27/96 12:20 33.25 7.36 448.3 0.00 29.9 94.2 128.9 181.7 0.00 0.00 $2.2 638.5 234.2494 01/27/96 13:20 33.25 7.19 453.9 0.00 30.2 94.7 129.4 181.8 0.00 0.00 52.8 644.9 242.7495 01/27/96 14:20 33.25 7.18 468.7 0.00 30.2 94.2 130.4 187.3 0.00 0.00 53.3 654.2 243.4496 01/27/96 15:20 33.25 7.26 455.7 0.00 29.9 93.8 129.9 180.9 0.00 0.00 53.9 644.4 242.0497 01/27/96 16:20 33.25 7.35 440.9 0.00 29.9 94.2 127.9 171.3 0.00 0.00 51.0 641.7 232.7498 01/27/96 17:20 31.49 7.38 457.0 0.00 29.9 93.4 132.4 182.4 0.00 0.00 54.0 648.2 246.6499 01/27/96 18:20 31.49 7.37 459.1 0.00 29.9 93.8 132.2 182.0 0.00 0.00 53.6 651.9 242.7500 01/27/96 19:20 31.49 7.26 454.8 0.00 29.9 94.7 131.9 183.7 0.00 0.00 53.9 646.3 244.5501 01/27/96 20:20 31.49 7.29 462.6 0.00 29.7 93.4 129.4 180.3 0.00 0.00 52.5 652.7 241.3502 01/27/96 21:20 31.49 7.33 461.7 0.00 29.9 93.8 129.9 183.4 0.00 0.00 58.1 639.5 247.7503 01/27/96 22:20 29.77 7.29 465.2 0.00 29.4 95.1 129.9 190.6 0.00 0.00 55.1 643.8 245.6504 01/27/96 23:20 28.08 7.39 468.7 0.00 30.2 94.7 131.9 194.8 0.00 0.00 64.3 648.6 243.4505 02109/96 10:48 11.97 7.16 416.3 0.00 19.1 95.8 143.5 228.3 0.00 0.00 59.1 567.4 270.8506 02/19/96 14:22 38.74 7.06 424.8 0.00 20.2 82.7 130.2 178.2 10.40 0.00 49.3 583.6 224.6507 02119/96 15:22 44.51 6.91 427.4 0.00 18.9 84.0 131.2 179.1 14.49 0.00 50.4 592.2 226.0508 02/19/96 16:22 50.56 7.03 432.2 0.00 19.2 81.1 125.2 179.4 11.58 0.00 50.3 572.3 224.9509 02/1 9/96 17:22 56.88 7.10 427.0 0.00 19.2 83.0 133.4 178.3 16.53 0.00 49.5 585.1 223.1510 02/19/96 18:22 63.46 7.09 428.7 0.00 19.4 81.1 125.9 176.9 10.12 0.00 49.2 576.8 220.3511 02/19/96 19:22 70.29 7.10 430.9 0.00 19.2 84.8 137.4 177.7 15.09 0.00 48.8 604.1 223.1512 02/19/96 20:22 77.36 7.06 435.2 0.00 19.2 86.4 134.2 182.5 15.60 0.00 49.8 597.8 231.3513 02/19/96 21:22 84.68 7.01 438.7 0.00 19.7 90.9 159.6 185.3 11.50 0.00 50.8 661.1 231.7514 02/19/96 22:22 89.68 6.80 442.2 0.00 19.3 85.6 162.1 182.9 6.97 0.00 49.6 667.7 230.2515 02/19/96 23:22 97.38 6.74 422.6 0.00 18.7 83.5 116.7 184.1 30.61 0.00 49.1 528.9 226.3516 02/20/96 00:22 94.79 6.97 423.0 0.00 19.9 80.2 118.2 176.7 22.31 0.00 50.4 540.1 228.8517 02/20/96 01:22 92.22 7.04 426.1 0.00 21.0 76.5 124.7 188.2 19.89 0.00 50.1 541.3 230.2518 02/20/96 02:22 87.17 7.05 423.5 0.00 19.9 78.6 123.9 181.4 18.29 0.00 49.2 550.4 232.4519 02/20/96 03:22 82.21 7.05 422.6 0.00 19.9 77.8 124.4 183.3 23.17 0.00 50.5 539.4 230.6520 02/20/96 04:22 77.36 7.07 425.7 0.00 19.9 79.0 125.2 189.9 27.21 0.00 50.3 536.3 242.0521 02/20/96 05:22 72.62 6.97 426.1 0.00 19.4 79.0 124.2 197.4 19.30 0.00 51.6 532.1 241.3522 02/20/96 06:22 67.98 7.09 436.5 0.00 20.7 79.4 126.9 199.4 17.51 0.00 51.0 551.2 244.1523 02/20/96 07:22 63.46 7.25 426.1 0.00 18.9 84.0 135.2 193.5 9.19 0.00 50.6 579.4 243.4524 02/20/96 08:22 59.04 7.01 425.2 0.00 18.9 79.4 125.2 186.4 10.74 0.00 50.0 556.2 240.6525 02/20/96 09:22 54.74 7.22 428.7 0.00 19.4 81.9 135.2 193.1 11.51 0.00 52.4 572.9 240.6526 02/20/96 10:22 50.56 7.07 432.2 0.00 19.4 79.4 127.4 194.0 10.66 0.00 50.9 558.8 244.8527 02/20/96 11:22 46.49 6.98 421.7 0.00 18.7 81.1 153.6 199.8 13.01 0.00 51.4 594.2 246.3528 02/20/96 12:22 42.55 7.11 427.8 0.00 19.4 81.1 129.2 195.8 0.00 0.00 51.8 568.5 249.5529 02/20/96 13:22 38.74 7.14 438.7 0.00 18.7 81.5 130.2 201.4 5.93 0.00 51.8 569.8 245.9530 03/19/96 10:07 4.52 7.16 445.2 0.00 19.8 100.7 156.1 263:7 0.00 0.00 56.2 602.7 276.5531 04/03/96 10:20 8.47 7.18 451.4 0.00 19.6 108.9 158.1 251.5 0.00 0.00 60.0 633.4 274.4532 05/07/96 14:45 2.89 7.68 483.8 0.00 19.8 115.4 173.5 400.9 0.00 0.00 84.7 511.2 322.8135
Caspar Creek - Watershed LAN# DATE TIME Streamflow pH Na NH4 K Mg Ca CI NO3 PO4 SO4 HCO3 SiL/s µM µM µM µM µM µM µM µM µM µM µM1 04/10/91 12:31 10.3 7.38 439.0 0.00 24.0 131.0 201.0 369.0 5.40 0.00 85.0 582.6 miss<strong>in</strong>g2 04/16/91 12:12 8.0 7.43 445.0 0.00 23.0 134.0 214.0 376.0 1.00 0.00 89.0 609.0 miss<strong>in</strong>g3 04/24/91 11:14 8.0 7.24 607.0 0.00 27.0 163.0 239.0 546.0 0.00 0.00 104.0 684.0 miss<strong>in</strong>g4 05/01/91 10:42 8.0 7.40 472.0 0.00 24.0 144.0 231.0 367.0 0.00 0.00 96.0 687.0 miss<strong>in</strong>g5 02/05/92 12:05 8.0 7.10 469.6 0.00 20.9 145.3 232.6 398.9 0.63 0.00 63.9 679.0 266.56 02/13/92 14:00 122.8 6.66 430.7 0.00 22.5 115.6 177.1 374.0 10.21 0.33 63.9 526.2 251.67 03/04/92 11:33 15.4 7.30 568.9 0.00 22.4 130.4 280.8 369.0 0.29 0.70 78.1 887.4 295.08 03/11/92 11:00 15.4 7.01 534.2 0.00 30.6 142.5 215.2 536.0 0.10 0.00 88.7 566.7 282.49 03/25/92 14:40 18.3 7.00 614.4 0.00 35.3 149.8 221.9 627.3 0.80 5.76 89.4 580.4 272.610 04/01/92 11:04 10.3 6.94 502.4 0.00 27.2 141.2 226.3 490.2 0.00 0.25 87.1 600.0 303.611 04/08/92 10:55 12.7 7.73 478.7 0.00 23.9 144.8 228.2 405.0 0.16 0.06 84.1 675.2 285.512 04/16/92 11:40 18.3 7.23 540.0 0.00 27.8 158.5 260.1 421.7 0.00 0.35 86.7 809.3 300.313 04/23192 12:25 12.7 7.33 606.8 0.00 33.5 140.0 226.9 357.0 0.00 0.55 80.9 754.8 300.014 04/29/92 12:20 8.0 7.38 527.7 0.00 28.7 153.3 254.0 403.0 0.00 0.00 89.6 788.8 299.215 05/06/92 11:30 8.0 7.60 495.8 0.00 24.3 162.4 257.2 426.2 0.00 0.16 91.8 749.3 314.616 05121/92 15:00 4.1 7.41 515.2 0.00 26.0 172.9 283.8 412.0 0.00 0.20 94.3 853.7 318.317 06/11/92 11:30 1.4 7.35 513.7 0.00 25.9 163.3 275.8 443.1 0.00 0.33 97.0 780.4 320.918 07/09/92 10:38 1.4 7.04 533.8 0.00 30.2 189.8 324.5 420.6 0.06 0.15 96.9 978.0 304.619 08/04/92 14:00 1.4 7.28 589.4 0.00 29.2 206.1 359.5 426.0 0.00 0.00 104.0 1115.8 314.620 09/15/92 11:50 0.0 7.14 563.2 0.00 27.2 220.4 370.6 411.0 0.07 0.25 120.3 1120.6 318.921 11/04/92 14:30 0.4 7.11 630.3 0.00 33.0 235.7 393.5 500.0 0.00 1.00 107.0 1206.6 309.322 11/24/92 14:54 1.4 7.33 582.9 0.00 28.1 222.1 369.3 476.0 0.00 0.00 104.0 1109.8 363.223 12/02/92 13:45 4.1 7.38 548.1 0.00 28.1 218.0 371.8 428.0 0.00 1.00 105.0 1116.7 271.924 12/16/92 14:00 18.3 7.17 488.0 0.00 25.3 141.5 223.8 468.0 0.00 0.00 80.0 616.0 238.925 12/29/92 14:00 154.8 7.05 398.0 0.00 22.8 111.5 181.1 331.4 0.00 0.00 62.7 549.2 271.626 01/12/93 10:56 91.0 7.24 448.3 0.00 21.3 114.2 184.0 374.3 0.00 0.00 57.0 577.9 270.527 02/17/93 14:58 39.0 7.46 423.6 0.00 22.2 123.3 210.9 313.2 0.00 0.00 63.7 673.6 274.128 03/03/93 12:05 39.0 7.50 478.5 0.00 23.0 135.7 214.6 376.0 0.00 0.00 67.0 692.1 292.829 03/24/93 13:40 107.9 7.55 500.2 0.00 25.6 131.6 209.6 380.0 0.00 1.00 61.0 705.2 290.130 04/07/93 13:25 31.5 7.61 517.6 0.00 23.0 139.9 227.01 380.0 0.00 0.00 70.0 754.4 295.331 04/28/93 12:50 39.0 7.09 496.4 0.00 24.4 133.9 239.3 397.1 0.00 0.00 69.0 732.1 291.932 05/12/93 13:45 12.7 6.49 513.9 0.00 29.9 147.4 262.5 403.2 0.00 0.00 74.1 810.9 283.733 05/27/93 14:40 96.5 7.16 530.9 0.00 25.0 141.1 246.3 351.1 0.00 0.54 62.5 854.1 291.634 06/09/93 09:44 39.0 7.24 504.8 0.00 25.6 137.3 245.5 346.9 0.00 0.00 66.0 817.2 317.435 07/02/93 10:00 8.0 7.03 568.6 0.00 24.9 166.4 295.1 426.1 0.00 0.00 83.8 922.9 319.536 07/22/93 14:40 4.1 7.25 592.0 0.00 26.1 179.5 320.1 427.5 0.00 0.00 87.4 1015.0 322.937 08/10/93 11:45 1.4 7.34 609.3 0.00 25.8 188.9 336.0 404.7 0.00 1.12 88.3 1102.5 324.838 09/07/93 14:00 1.4 7.40 635.4 0.00 28.8 199.9 359.2 473.8 0.00 0.00 92.6 1123.5 325.039 10/20/93 13:47 1.4 7.43 915.2 0.00 29.7 220.5 383.5 526.0 0.67 1.52 116.6 1391.4 304.040 12/01/93 12:36 1.4 7.45 693.7 0.00 28.5 220.2 372.9 542.8 0.00 1.64 98.3 1167.4 289.441 02/02/94 11:45 21.3 7.20 468.4 0.00 21.8 141.6 247.1 333.3 4.57 0.00 82.5 764.5 309.442 03/16/94 11:58 8.0 6.71 633.6 0.00 35.7 171.1 273.1 597.9 0.00 0.00 101.8 756.5 239.843 04/13/94 12:00 2.6 7.60 725.3 0.00 32.3 203.1 319.3 653.0 1.75 0.00 112.8 921.8 267.644 05/18/94 13:18 10.3 7.46 530.9 0.00 35.7 175.8 302.2 365.9 0.00 0.00 86.9 982.9 303.245 06/29/94 14:15 1.4 7.51 554.0 0,00 33.8 198.7 339.7 464.3 0.00 0.00 97.1 1006.1 286.046 10/05/94 10:00 0.0 7.40 637.0 0.00 24.0 256.4 472.5 376.9 6.84 0.00 119.6 1495.7 304.447 11/02/94 13:30 0.0 7.69 625.6 0.00 27.8 271.6 481.2 396.4 0.00 1.24 128.3 1504.7 292.948 12/06/94 11:14 4.1 7.26 536.8 0.00 24.0 186.0 329.4 503.8 0.00 0.00 100.3 887.0 275.249 01/03/95 13:10 22.9 7.40 456.7 0.00 22.0 141.5 232.0 366.5 0.91 0.95 94.1 669.4 264.450 02/01/95 14:57 254.6 6.58 428.5 0.00 21.2 89.6 155.6 309.6 2.69 0.00 43.9 539.9 276.751 03/01/95 14:30 10.3 6.84 406.2 0.00 21.0 136.4 159.2 408.2 1.55 0.00 86.4 436.0 308.252 04/05/95 10:53 18.3 7.20 395.6 0.00 21.7 124.3 216.5 359.7 0.00 0.00 57.0 625.2 308.153 05/05/95 10:30 47.2 7.07 422.1 0.00 21.1 118.2 204.5 357.4 0.00 0.00 58.2 614.9 307.254 06/05/95 10:39 8.0 7.57 476.5 0.00 23.2 150.0 258.8 412.5 0.00 0.00 54.6 795.6 308.555 12/05/95 12:00 miss<strong>in</strong>g 7.33 596.5 0.00 27.9 222.2 .364.6 389.8 0.00 0.00 87.8 1232.5 265.556 01/11/96 12:00 miss<strong>in</strong>g 7.46 601.7 0.00 35.0 151.4 248.6 404.1 0.00 0.00 80.9 871.2 403.957 02/09/96 11:30 56.0 7.14 434.9 0.00 21.4 117.2 186.8 367.0 0.00 0.00 51.0 595.3 306.858 03/19/96 10:52 24.5 7.34 450.9 0.00 20.7 123.4 196.3 373.3 0.00 1.60 53.2 629.7 316.059 04/03/96 11:30 39.0 7.26 465.9 0.00 21.2 129.5 205.1 380.4 0.00 0.00 54.5 666.8 309.660 05/07/96 15:53 miss<strong>in</strong>g 7.56 486.0 0.00 24.3 142.9 227.0 510.4 0.00 0.00 81.0 577.8 322.1136
Caspar Creek - Watershed MUN# DATE TIME Streamflow pH Na NH4 K Mg Ca CI NO3 PO4 SO4 HCO3 SiL/s µM µM µM µM µM µM µM µM µM µM µM1 03/27/91 09:36 5.42 7.15 513.3 0.00 23.0 111.1 182.1 445.0 0.00 0.00 49.0 579.7 275.32 04/10/91 09:36 5.42 7.11 522.0 0.00 25.6 119.3 182.1 450.0 0.00 0.00 45.0 610.4 275.23 04/16/91 09:36 3.67 7.14 543.7 0.00 23.0 119.3 189.6 453.0 0.00 0.00 55.0 621.6 282.84 04/24/91 09:36 4.52 7.16 497.4 0.00 22.3 117.2 204.6 432.3 0.00 0.00 49.8 631.1 289.95 05/01/91 09:36 5.42 7.08 501.1 0.00 26.1 121.2 210.9 429.9 0.00 0.00 54.1 653.3 273.56 02/11/92 10:50 4.96 7.05 499.3 0.00 24.2 123.1 186.0 511.0 0.09 0.30 61.2 508.2 226.77 02/12/92 02:46 10.76 7.27 425.7 0.00 23.4 100.4 156.5 456.9 0.00 0.00 43.2 419.7 196.48 02/12/92 11:35 14.53 7.09 437.1 0.00 27.3 116.4 142.0 483.1 0.00 0.07 43.8 410.5 259.59 02/12/92 13:35 11.97 7.26 448.5 0.00 22.8 104.6 159.0 503.4 0.00 0.18 44.4 406.3 213.010 02/13/92 11:01 7.40 6.98 471.2 0.00 21.9 105.5 159.9 509.3 0.00 0.48 48.1 418.4 223.111 02/14/92 16:00 10.76 6.95 422.5 0.00 21.8 94.5 146.1 450.0 0.19 0.11 43.7 387.9 232.412 02/15/92 11:05 11.97 6.63 447.2 0.00 21.5 98.5 150.2 479.2 0.14 0.32 41.5 403.8 218.513 02/22/92 10:50 11.97 6.86 389.1 0.00 20.7 89.1 131.5 452.6 0.25 0.00 37.8 322.6 245.214 02/25/92 12:37 3.43 6.82 416.3 0.00 24.2 94.9 152.2 433.5 0.00 0.00 44.9 411.4 259.615 03/16/92 05:10 57.96 6.74 449.6 0.00 25.5 79.7 122.6 361.3 0.18 0.58 31.4 455.5 199.416 03/16/92 09:52 52.64 6.95 430.8 0.00 25.8 85.4 135.2 357.7 0.17 0.88 32.8 474.4 198.317 03/16/92 15:31 40.63 6.97 433.8 0.00 27.5 89.0 146.0 394.5 0.14 0.00 32.4 472.0 210.218 03/17/92 10:00 20.16 7.28 436.8 0.00 25.7 90.8 137.7 467.0 0.00 0.00 37.1 378.5 246.619 03/18/92 11:00 11.97 7.37 439.3 0.00 23.2 95.3 142.8 474.3 0.00 0.11 40.2 384.2 257.320 12/08/92 17:03 12.85 6.43 406.3 0.00 27.3 99.1 201.8 489.0 1.00 0.00 42.0 461.5 170.221 12/08/92 21:03 24.32 6.45 370.2 0.00 24.0 88.4 142.2 448.0 0.00 0.00 35.0 337.5 163.822 12/09/92 03:03 15.20 6.51 398.9 0.00 24.8 95.0 151.7 480.0 0.00 0.00 40.0 357.1 165.323 12/09/92 04:03 15.20 6.63 418.0 0.00 24.3 99.5 158.7 492.0 0.00 0.00 42.0 382.8 178.124 12/09/92 05:03 15.20 6.61 415.0 0.00 24.8 97.9 156.2 476.0 0.00 0.00 42.0 388.0 195.025 12/09/92 06:03 15.20 6.56 404.1 0.00 24.8 96.3 153.4 465.0 0.00 0.00 42.0 379.3 191.326 12/09/92 07:03 11.85 6.57 416.7 0.00 24.3 100.4 158.9 480.0 0.00 0.00 43.0 393.6 185.427 12/09/92 08:03 11.97 6.52 421.1 0.00 24.0 101.2 161.9 484.0 0.00 0.00 44.0 399.3 196.728 12/09/92 15:07 10.76 6.90 439.3 0.00 24.3 104.9 164.4 511.0 0.00 0.00 46.0 399.3 203.229 12/10/92 08:05 24.32 6.52 387.1 0.00 23.0 90.5 142.2 421.0 0.00 0.00 37.0 380.6 196.930 12/10/92 09:05 57.53 6.53 356.7 0.00 25.6 82.3 129.7 371.0 0.00 0.00 31.0 373.3 168.931 12/10/92 10:05 71.45 6.57 339.3 0.00 25.6 78.2 124.8 363.0 0.00 0.00 28.0 351.7 158.632 12/10/92 11:05 71.45 6.69 339.3 0.00 25.6 78.2 124.8 368.0 0.00 0.00 28.0 346.7 156.133 12/10/92 12:05 71.45 6.67 339.3 0.00 25.6 78.2 124.8 372.0 0.00 0.00 28.0 342.7 181.134 12/10/92 13:05 62.79 6.65 348.0 0.00 25.6 78.2 127.2 391.0 0.00 0.00 28.0 337.4 166.835 12/10/92 14:05 54.74 6.58 356.7 0.00 25.6 82.3 129.7 390.0 0.00 0.00 29.0 358.3 171.036 12/10/92 15:05 49.53 6.59 361.0 0.00 25.6 82.3 132.2 406.0 0.00 0.00 30.0 349.6 175.837 12/10/92 16:05 44.51 6.68 369.7 0.00 25.6 82.3 132.2 422.0 0.00 0.00 30.0 342.3 205.338 12/10/92 17:05 39.68 6.69 369.7 0.00 25.6 86.4 134.7 436.0 0.00 0.00 30.0 341.5 186.639 12/10/92 18:05 35.05 6.67 378.4 0.00 25.6 86.4 134.7 440.0 0.00 0.00 31.0 344.2 198.340 12/10/92 19:05 30.63 6.66 382.8 0.00 25.6 66.4 137.2 425.0 0.00 0.00 32.0 366.6 193.541 12/10/92 20:05 28.41 6.66 382.8 0.00 25.6 86.4 142.2 445.0 0.00 0.00 32.0 356.6 200.242 12/10/92 21:05 26.42 6.77 391.5 0.00 25.6 90.5 139.7 428.0 0.00 0.00 33.0 383.5 201.843 12/10/92 22:05 26.42 6.76 391.5 0.00 23.0 90.5 142.2 440.0 0.00 0.00 33.0 373.9 205.744 12/10/92 23:05 37.43 6.73 343.6 0.00 25.6 82.3 127.2 384.0 0.00 0.00 30.0 344.2 176.845 12/11/92 00:05 30.63 6.73 400.2 0.00 25.6 94.6 144.7 450.0 0.00 0.00 35.0 384.4 210.846 12/11/92 01:05 30.63 6.74 400.2 0.00 25.6 90.5 144.7 448.0 0.00 0.00 34.0 380.2 210.547 12/11/92 02:05 26.42 6.84 404.5 0.00 23.0 94.6 147.2 452.0 0.00 0.00 36.0 387.2 214.148 12/11/92 03:05 25.44 6.82 404.5 0.00 23.0 94.6 147.2 462.0 0.00 0.00 36.0 377.2 216.349 12/11/92 04:05 26.42 6.44 400.2 0.00 25.6 90.5 144.7 457.0 0.00 0.00 37.0 365.2 214.950 12/11/92 05:05 26.42 6.46 404.5 0.00 23.0 94.6 147.2 449.0 0.00 0.00 37.0 388.2 214.651 12/11/92 06:05 26.42 7.03 404.5 0.00 23.0 90.5 144.7 439.0 0.00 0.00 37.0 385.0 213.652 12/11/92 07:05 26.42 6.59 404.5 0.00 23.0 94.6 147.2 450.0 0.00 0.00 38.0 385.2 226.753 12/11/92 08:05 26.42 6.67 413.2 0.00 23.0 94.6 149.7 459.0 0.00 0.00 38.0 389.9 219.054 12/11/92 09:05 26.42 6.63 404.5 0.00 25.6 94.6 147.2 449.0 0.00 0.00 38.0 388.7 218.755 12/11/92 10:05 26.42 6.68 404.5 0.00 23.0 94.6 147.2 457.0 0.00 0.00 39.0 376.2 218.056 12/11/92 11:05 26.42 6.77 408.9 0.00 23.0 94.6 149.7 468.0 0.00 0.00 40.0 372.5 219.957 12/11/92 12:05 26.42 6.85 413.2 0.00 23.0 94.6 149.7 469.0 0.00 0.00 39.0 377.9 220.558 12/11/92 13:05 26.42 6.85 404.5 0.00 25.6 94.6 149.7 465.0 0.00 0.00 39.0 375.7 217.659 12/11/92 14:05 26.42 6.82 408.9 0.00 28.1 94.6 147.2 460.0 0.00 0.00 39.0 382.6 218.060 12/11/92 15:05 26.42 6.84 408.9 0.00 23.0 94.6 147.2 471.0 0.00 0.00 39.0 366.5 217.361 12/11/92 16:05 26.42 6.81 413.2 0.00 23.0 94.6 147.2 468.0 0.00 0.00 39.0 373.9 218.462 12/11/92 17:05 26.42 6.52 408.9 0.00 23.0 94.6 147.2 452.0 0.00 0.00 39.0 385.5 216.863 12/11/92 18:05 26.42 6.54 400.2 0.00 23.0 94.6 147.2 463.0 0.00 0.00 38.0 367.8 216.464 12/29/92 11:00 11.36 7.10 434.5 0.00 22.8 104.1 169.7 448.2 0.00 0.00 46.4 463.8 227.565 12/31/92 00:03 11.85 6.86 364.5 0.00 28.4 81.4 129.2 397.9 0.00 0.00 24.4 367.6 178.466 12/31/92 01:03 15.20 6.91 364.1 0.00 26.9 81.4 130.5 411.2 0.00 0.00 24.9 353.8 184.467 12/31/92 02:03 18.55 6.93 423.7 0.00 23.8 101.2 164.9 429.1 0.00 0.00 42.6 465.4 226.968 12/31/92 03:03 22.29 6.97 412.4 0.00 22.3 97.5 158.9 415.7 0.00 0.00 40.5 450.7 221.669 12/31/92 04:03 35.05 6:96 396.7 0.00 23.5 92.1 148.0 394.3 0.00 0.00 36.5 433.1 199.870 12/31/92 05:03 49.53 6.94 386.3 0.00 24.6 86.4 140.2 375.1 0.00 0.00 33.2 422.5 184.6137
Caspar Creek - Watershed MUN# DATE TIME Streamflow pH Na NH4 K Mg Ca CI NO3 PO4 SO4 HCO3 SiL/s µM µM µM µM µM µM µM µM µM µM µM71 12/31/92 06:03 60.14 6.96 371.5 0.00 25.1 81.4 134.2 363.5 0.00 0.00 32.3 399.8 178.172 12131/92 07:03 73.33 6.92 366.7 0.00 25.3 79.4 130.5 365.3 0.00 0.00 30.5 385.5 169.073 12/31/92 08:03 77.36 6.94 359.7 0.00 24.8 78.6 127.2 370.1 0.00 0.00 30.1 365.9 168.474 12/31/92 09:03 79.05 6.95 351.9 0.00 25.3 77.3 126.7 362.3 0.00 0.00 28.8 365.5 168.475 12/31/92 10:03 79.05 6.93 350.6 0.00 25.1 76.5 125.5 358.1 0.00 0.00 27.8 366.0 164.476 12/31/92 11:03 113.43 6.98 337.1 0.00 26.1 72.0 121.5 354.0 0.00 0.00 25.0 346.2 156.677 12/31/92 12:03 137.61 6.96 312.3 0.00 28.1 71.2 116.5 331.2 0.00 0.00 23.5 337.6 145.778 12/31/92 13:03 137.61 6.92 322.7 0.00 28.6 72.4 117.0 343.3 0.00 0.00 23.6 339.7 143.679 12/31/92 14:03 135.56 6.91 328.4 0.00 28.1 73.6 119.3 351.8 0.00 0.00 23.9 342.7 151.180 12/31/92 15:03 130.33 6.91 336.2 0.00 27.9 74.9 120.8 355.6 0.00 0.00 23.3 353.2 155.081 12/31/92 16:03 135.56 6.95 338.0 0.00 27.9 75.7 121.3 365.5 0.00 0.00 23.3 347.6 153.382 12/31/92 17:03 137.61 6.89 338.0 0.00 27.6 76.9 122.5 370.4 0.00 0.00 23.4 347.3 151.083 12/31/92 18:03 123.18 6.90 339.7 0.00 26.9 76.1 124.3 387.2 0.00 0.00 23.4 333.3 149.984 12/31/92 19:03 113.98 6.85 340.1 0.00 27.6 78.6 125.0 377.6 0.00 0.00 23.3 350.7 149.785 12/31/92 20:03 102.63 6.95 354.1 0.00 29.7 78.2 125.2 402.4 0.00 0.00 24.1 339.9 154.886 12/31/92 21:03 89.68 6.85 354.9 0.00 27.6 80.6 126.5 408.3 0.00 0.00 24.0 340.5 161.787 12/31/92 22:03 83.44 6.86 360.6 0.00 27.6 80.6 128.2 405.6 0.00 0.00 24.7 351.0 164.188 12/31/92 23:03 81.48 6.85 362.3 0.00 27.4 80.2 127.5 416.3 0.00 0.00 24.1 340.6 170.389 01/06/93 20:59 21.67 7.06 448.4 0.00 21.3 98.0 155.3 405.3 0.00 0.74 39.6 491.6 216.390 01/06/93 21:59 26.42 7.02 431.9 0.00 22.0 94.2 150.0 389.4 1.59 0.00 36.9 477.5 212.491 01/06/93 22:59 31.49 7.08 431.5 0.00 20.6 92.4 152.9 379.6 0.00 0.00 35.7 491.8 208.192 01/06/93 23:43 35.05 7.05 429.4 0.00 22.0 92.2 146.6 397.2 0.00 0.00 36.1 459.6 208.493 01/06/93 23:45 35.05 7.05 430.4 0.00 20.7 92.1 146.2 378.5 0.00 0.00 35.6 478.1 207.494 01/06/93 23:46 35.05 7.03 429.3 0.00 20.9 92.1 146.4 384.4 0.00 0.48 35.7 471.4 210.995 01/12/93 11:10 9.59 7.30 472.7 0.00 23.0 103.7 162.4 449.8 0.00 0.00 39.2 499.8 252.896 01/13/93 19:47 18.70 7.28 461.0 0.00 21.9 97.0 153.2 400.8 0.00 0.54 36.8 508.9 217.397 01/13/93 20:47 26.42 7.31 433.7 0.00 21.2 92.9 149.5 396.7 0.83 0.00 36.6 468.7 212.998 01/13/93 21:47 35.05 7.27 414.5 0.00 21.3 87.8 141.5 359.7 0.00 0.57 34.4 465.9 200.099 01/13/93 22:47 48.51 7.26 399.5 0.00 21.4 83.5 133.3 344.0 0.00 0.00 32.1 446.2 187.4100 01/13/93 23:47 59.04 7.27 392.0 0.00 21.4 80.7 128.7 332.0 0.00 0.00 30.8 438.7 181.2101 01/14/93 00:47 63.46 7.14 395.1 0.00 22.0 80.6 129.5 334.9 0.00 0.54 31.3 440.0 181.2102 01/14/93 01:47 63.46 7.21 392.9 0.00 22.0 80.2 128.2 344.4 0.00 0.00 30.4 426.5 181.2103 01/14/93 02:47 63.46 7.24 397.7 0.00 22.1 80.8 128.2 349.9 0.00 0.00 30.9 426.1 183.4104 01/14/93 03:47 56.88 7.21 403:1 0.00 22.2 82.2 130.2 361.5 0.00 0.00 31.4 425.7 188.3105 01/14/93 04:47 56.88 7.27 406.5 0.00 22.3 83.7 131.8 362.9 0.00 0.47 31.8 433.4 192.7106 01/14/93 05:47 52.64 7.22 410.7 0.00 22.5 84.3 133.2 373.9 0.00 0.51 31.0 432.4 196.5107 01/14/93 06:47 52.64 7.34 422.0 0.00 22.6 86.4 134.0 378.4 0.52 0.00 32.4 441.6 196.1108 01/14/93 07:47 48.51 7.22 427.0 0.00 22.4 87.4 135.2 377.5 0.00 0.00 31.5 454.2 201.3109 01/14/93 08:47 48.51 7.22 430.2 0.00 22.9 89.0 137.9 390.8 0.00 0.46 31.6 453.0 205.0110 01/14/93 09:47 44.51 7.28 431.2 0.00 22.7 88.3 136.6 398.1 0.00 0.00 31.1 443.3 207.2111 01/14/93 10:47 44.51 7.22 434.2 0.00 21.8 89.3 138.9 408.1 0.00 0.00 31.3 441.6 225.0112 01/14/93 11:47 44.51 7.23 437.4 0.00 22.5 89.3 139.9 406.8 0.00 0.00 32.3 446.8 207.8113 01/14/93 12:47 44.51 7.14 443.0 0.00 22.8 90.3 141.4 402.7 0.00 0.00 31.9 462.7 211.1114 01/14/93 13:47 40.63 7.25 448.1 0.00 22.7 91.8 142.8 414.6 0.00 0.00 31.4 462.8 214.9115 01/14/93 14:45 40.63 7.19 448.6 0.00 22.9 91.7 144.6 415.4 0.00 0.00 32.5 463.7 214.0116 01/14/93 16:45 35.05 7.20 452.1 0.00 22.9 92.7 145.9 419.0 0.00 0.00 32.8 467.7 215.7117 01/14/93 18:45 35.05 7.18 453.8 0.00 22.3 93.5 148.1 413.6 0.00 0.00 33.1 479.5 224.0118 01/14/93 20:45 31.49 7.25 461.4 0.00 22.8 94.1 148.7 423.6 0.00 0.00 33.1 480.0 226.0119 01/14/93 22:45 31.49 7.29 458.6 0.00 22.3 94.4 149.4 413.7 0.00 0.45 33.3 488.1 224.6120 01/15/93 00:45 26.42 7.24 466.2 0.00 22.8 95.2 150.2 424.6 0.86 0.00 33.7 487.0 228.0121 01/15/93 02:45 26.42 7.21 460.5 0.00 22.5 95.2 150.0 421.4 0.00 0.00 34.1 483.6 227.8122 01/15/93 04:45 26.42 7.27 467.1 0.00 22.5 95.9 152.5 429.7 0.00 0.00 34.2 488.4 237.3123 01/15/93 06:45 21.67 7.15 460.7 0.00 22.6 95.4 152.0 429.5 0.00 0.00 34.2 480.1 232.5124 01/15/93 08:45 21.67 7.29 466.5 0.00 22.6 96.1 152.6 433.2 0.71 0.43 34.6 483.4 238.9125 01/15/93 10:45 21.67 7.25 464.4 0.00 22.6 96.0 153.0 431.5 0.00 0.00 34.7 484.2 238.0126 01/15/93 12:45 21.67 7.30 462.3 0.00 22.4 94.6 150.0 423.7 0.00 0.00 33.6 482.8 234.0127 01/15/93 14:45 21.67 7.24 455.1 0.00 22.5 95.0 151.6 420.8 0.00 0.00 33.6 482.6 233.6128 01/15/93 16:45 26.42 7.23 459.7 0.00 22.5 97.0 150.8 421.5 0.00 0.00 34.0 488.2 231.0129 01/15/93 18:45 26.42 7.26 457.5 0.00 22.6 97.8 149.8 429.8 0.00 0.00 34.8 475.9 229.6130 01/15/93 20:45 26.42 7.30 447.5 0.00 23.0 95.0 147.6 416.0 0.00 0.00 34.1 471.5 234.0131 01/15/93 22:45 26.42 7.28 446.5 0.00 21.8 93.7 148.6 415.5 0.00 0.00 34.5 468.3 229.1132 01/16/93 00:45 26.42 7.22 451.1 0.00 21.8 94.5 149.6 413.1 0.43 0.00 34.5 478.8 234.3133 01/16/93 02:45 26.42 7.24 449.4 0.00 22.1 94.7 150.1 411.3 0.00 0.00 34.0 481.8 228.9134 01/16/93 04:45 26.42 7.30 451.9 0.00 22.3 95.2 150.4 423.9 0.00 0.00 33.1 475.2 230.5135 01/16/93 06:45 26.42 7.26 450.9 0.00 22.3 95.3 150.6 420.2 0.00 0.00 34.0 476.8 233.3136 01/16/93 08:45 26.42 7.19 453.8 0.00 21.9 95.6 151.0 417.0 0.00 0.00 34.0 483.9 232.8137 01/16/93 10:45 26.42 7.21 458.4 0.00 22.0 95.9 150.2 437.7 0.00 0.00 34.2 466.5 233.1138 01/16/93 12:45 26.42 7.26 458.3 0.00 21.9 96.1 151.5 433.4 0.00 0.70 36.7 468.4 234.6139 01/19/93 20:46 31.49 7.28 438.4 0.00 21.2 93.2 149.6 390.0 0.00 0.00 35.8 483.6 222.4140 01/19/93 21:46 48.51 7.36 411.4 0.00 20.4 87.9 139.9 344.8 0.00 0.00 32.4 477.7 202.7138
Caspar Creek - Watershed MUN# DATE TIME Streamflow pH Na NH4 K Mg Ca CI NO3 PO4 SO4 HCO3 SiL/s µM µM µM µM µM µM µM µM µM µM µM143 01/20/93 00:46 157.20 7.26 326.5 0.00 22.9 68.3 108.6 251.4 0.00 0.61 23.8 404.3 145.4144 01/20/93 01:46 160.30 7.30 329.7 0.00 24.1 67.2 108.8 258.2 0.00 0.00 24.8 398.0 144.7145 01/20/93 02:46 160.30 7.21 327.4 0.00 23.5 67.4 106.8 269.6 0.00 0.00 24.1 381.5 144.3146 01/20/93 03:46 163.41 7.27 339.7 0.00 24.6 68.6 109.4 279.5 0.00 0.00 24.5 391.6 150.5147 01/20/93 04:46 160.30 7.24 336.9 0.00 25.2 68.3 109.5 283.1 0.00 0.00 24.9 384.8 151.0148 01/20/93 05:46 169.71 7.30 340.8 0.00 25.4 68.8 109.8 288.5 0.00 0.00 24.1 386.8 150.1149 01/20/93 06:46 169.71 7.28 344.6 0.00 25.6 69.7 111.6 288.4 0.00 0.00 24.1 396.2 149.7150 01/20/93 07:46 176.09 7.16 336.4 0.00 25.4 70.4 110.5 293.4 0.00 0.00 23.0 384.4 152.5151 01/20/93 08:46 172.89 7.23 337.2 0.00 25.3 70.8 110.9 294.8 0.00 0.00 22.0 387.0 151.9152 01/20/93 09:46 166.55 7.05 344.4 0.00 25.9 72.1 112.2 309.8 0.00 0.00 23.0 383.0 157.7153 01/20/93 10:46 189.10 7.28 328.6 0.00 25.7 68.9 108.3 295.3 0.00 0.00 21.3 370.7 147.4154 01/20/93 11:46 230.06 7.03 317.0 0.00 26.6 64.8 105.3 281.0 0.00 0.00 21.5 359.6 146.1155 01/20/93 12:46 277.55 7.01 306.9 0.00 28.2 62.6 102.1 285.1 0.00 0.00 21.4 336.7 139.9156 01/20/93 13:46 244.33 7.10 323.2 0.00 28.3 67.0 108.5 292.0 0.00 0.69 20.9 368.9 142.3157 01/20/93 16:46 166.55 7.14 354.0 0.00 28.0 72.4 114.6 329.3 0.00 0.00 22.1 382.7 162.2158 01/20/93 19:46 77.36 7.24 370.5 0.00 26.4 77.2 122.6 351.6 0.00 0.00 24.5 395.9 177.0159 01/20/93 22:46 40.63 7.16 384.9 0.00 25.8 79.6 126.9 369.4 0.00 0.58 24.4 405.7 192.0160 01/21/93 01:46 29.77 7.42 395.1 0.00 24.7 82.4 129.7 367.0 0.00 0.96 24.7 427.4 198.3161 01/21/93 04:46 23.22 7.03 399.8 0.00 24.6 83.5 131.6 382.9 0.00 0.00 25.6 420.5 210.8162 01/21/93 07:46 23.22 7.34 406.8 0.00 23.8 85.0 133.9 380.7 0.00 0.00 26.5 434.6 210.0163 02/17/93 11:15 2.89 7.50 466.1 0.00 22.1 107.4 173.2 395.6 0.00 0.00 51.4 551.0 269.6164 03/03/93 10:40 4.96 7.54 513.3 0.00 23.0 111.1 182.1 445.0 0.00 0.00 49.0 579.7 275.3165 03/24/93 11:15 13.88 7.62 522.0 0.00 25.6 119.3 182.1 450.0 0.00 0.00 45.0 610.4 275.2166 04/06/93 09:50 5.42 7.55 543.7 0.00 23.0 119.3 189.6 453.0 0.00 0.00 55.0 621.6 282.8167 04/28/93 10:20 2.89 6.91 497.4 0.00 22.3 117.2 204.6 432.3 0.00 0.00 49.8 631.1 289.9168 05/12/93 10:45 2.18 7.04 501.1 0.00 26.1 121.2 210.9 429.9 0.00 0.00 54.1 653.3 273.5169 05/24/93 10:50 0.18 7.21 534.3 0.00 24.0 130.7 226.5 375.9 0.00 0.00 54.0 788.5 306.4170 05/27/93 11:25 11.97 6.73 549.2 0.00 23.8 126.2 218.4 427.0 0.00 0.00 54.9 725.6 276.4171 06/09/93 09:45 3.67 7.09 539.3 0.00 24.0 125.4 216.4 434.6 0.00 0.00 54.9 702.5 299.8172 01/24/94 05:52 24.80 6.90 432.1 0.00 23.8 105.0 183.8 407.5 0.00 1.02 40.9 544.3 222.8173 01/24/94 06:52 24.80 6.90 457.1 0.00 22.5 100.5 175.0 412.6 0.00 0.00 41.5 535.0 224.5174 01/24/94 07:52 24.80 7.00 456.5 0.00 22.5 100.8 177.2 417.3 0.00 0.00 41.4 534.8 228.4175 01/24/94 08:52 21.67 7.00 462.3 0.00 22.7 101.0 176.2 415.4 0.00 0.00 42.0 540.0 233.1176 01/24/94 09:52 21.67 6.90 455.6 0.00 22.7 100.3 175.9 405.3 0.00 0.00 41.6 542.2 228.9177 02/17/94 02:40 44.51 7.08 386.1 0.00 25.8 90.9 155.5 311.2 0.96 0.00 37.9 516.7 126.9178 02/17/94 03:40 67.98 7.00 368.8 0.00 29.9 85.3 148.5 287.7 0.00 0.00 35.5 507.5 120.9179 02/17/94 04:40 67.98 6.90 369.0 0.00 29.5 83.6 148.8 298.6 0.00 0.00 35.6 493.6 124.2180 02/17/94 05:40 63.46 7.09 369.9 0.00 29.8 83.7 146.2 309.4 1.41 0.00 35.7 477.3 126.7181 02/17/94 06:40 56.88 7.07 375.0 0.00 24.5 86.1 147.4 315.4 2.30 0.00 35.9 477.1 134.8182 02/17/94 07:40 52.64 7.09 378.4 0.00 24.8 87.0 148.5 316.1 0.89 0.00 36.0 485.2 139.2183 02/17/94 08:00 52.64 7.12 380.0 0.00 24.6 88.5 150.3 318.0 0.00 0.00 37.1 489.8 136.0184 02/17/94 11:00 52.64 7.23 380.0 0.00 24.4 87.1 149.3 325.3 0.00 0.00 35.4 481.4 138.4185 02/17/94 13:00 52.64 7.07 389.2 0.00 24.5 88.5 152.0 348.0 0.00 0.00 37.1 472.7 144.2186 02/17/94 15:00 63.46 7.12 383.6 0.00 24.2 86.7 147.2 333.6 0.00 0.00 35.4 471.1 190.7187 02/17/94 17:00 65.71 7.07 380.9 0.00 24.3 86.9 144.1 344.5 0.00 0.00 35.2 452.2 183.2188 02/17/94 19:00 67.98 7.09 377.4 0.00 25.1 84.6 143.8 333.3 0.00 0.00 35.9 454.4 186.3189 02/17/94 21:00 61.24 7.20 388.7 0.00 24.0 88.5 155.6 383.0 0.00 0.00 34.4 449.0 197.7190 02/17/94 23:00 56.88 7.15 399.8 0.00 25.7 89.4 147.8 366.8 0.00 0.00 35.2 462.9 196.3191 02/18/94 01:00 52.64 7.03 388.1 0.00 24.0 87.2 145.5 353.1 0.00 0.00 32.4 459.7 196.4192 02/18/94 03:00 52.64 7.09 388.5 0.00 25.5 88.5 148.9 357.2 0.00 0.00 34.5 462.4 205.9193 02/18/94 05:00 48.51 7.05 431.4 0.00 25.6 97.1 153.1 368.5 0.00 0.00 39.5 510.0 210.5194 02/18/94 07:00 44.51 7.02 421.6 0.00 26.7 96.7 158.1 365.5 0.00 0.00 38.9 514.9 214.9195 02/18/94 09:00 48.51 7.06 442.2 0.00 25.1 95.6 149.8 397.8 0.00 0.00 39.4 481.4 204.5196 02/18/94 13:00 44.51 7.10 406.4 0.00 24.9 92:4 150.6 385.9 0.00 0.00 36.9 457.5 205.9197 02/18/94 16:00 44.51 7.08 409.4 0.00 25.7 95.6 156.2 380.3 0.00 0.00 35.8 487.0 214.2198 02/18/94 19:00 40.63 7.04 408.6 0.00 24.4 93.3 153.5 382.6 0.00 0.00 35.4 473.0 216.2199 02/18/94 22:00 35.05 7.07 422.0 0.00 24.0 95.7 154.8 408.6 0.00 0.00 39.1 460.2 221.4200 02/19/94 01:00 50.56 7.09 411.2 0.00 24.2 103.3 173.9 383.8 0.00 0.00 39.2 527.5 226.0201 03/16/94 10:28 1.54 6.70 487.8 0.00 25.3 130.3 207.8 368.5 0.00 0.00 57.6 705.5 272.0202 01/14/95 00:00 99.46 6.58 466.4 0.00 28.1 108.5 142.9 407.8 0.55 0.00 27.1 534.7 177.4203 01/14/95 15:45 44.11 6.55 329.8 8.25 26.2 73.5 126.6 361.5 0.00 0.00 23.5 347.7 158.5204 01/14/95 16:45 42.17 6.74 336.7 1.35 27.1 75.0 136.6 364.9 0.00 0.00 22.8 376.5 162.4205 01/14/95 17:45 42.17 6.66 358.5 0.00 27.1 74.6 128.0 452.6 0.00 0.00 24.2 289.6 166.6206 01/14/95 18:45 40.06 6.66 345.5 0.91 27.0 76.5 130.9 365.1 0.00 0.00 23.7 375.0 168.9207 01/14/95 19:45 35.96 6.66 363.3 0.00 27.3 76.9 132.2 387.1 0.00 0.00 22.4 376.9 173.9208 01/14/95 20:45 35.96 6.65 364.3 0.00 26.6 76.1 130.1 388.5 0.00 0.00 23.6 367.6 179.6209 01/14/95 21:45 35.96 6.66 373.5 0.00 26.4 77.0 131.1 410.8 0.00 0.00 23.3 358.9 180.7210 01/14/95 22:45 32.02 6.61 360.3 1.31 26.4 76.6 130.3 435.2 0.00 0.88 23.3 318.8 181.7139
Caspar Creek - Watershed MUN# DATE TIME Streamflow pH Na NH4 K Mg Ca CI NO3 PO4 SO4 HCO3 SiL/s µM µM µM µM µM µM µM µM µM µM µM211 01/14/95 23:45 32.02 6.74 397.4 0.00 26.3 83.4 137.7 443.1 0.00 0.00 23.5 375.8 185.1212 01/15/95 00:45 32.02 6.76 382.3 0.00 25.0 81.0 136.7 430.5 0.65 0.00 23.3 365.0 184.7213 01/15/95 01:45 32.02 6.77 387.0 0.00 25.8 81.1 138.2 423.5 1.46 0.00 23.4 379.7 184.4214 01/15/95 02:45 28.24 6.73 373.6 5.21 26.8 81.9 135.8 441.2 0.67 0.00 24.2 345.7 184.1215 01/15/95 03:45 28.24 6.70 391.4 0.00 25.5 82.1 140.1 449.0 0.00 0.73 23.8 364.7 183.8216 01/15/95 05:45 28.24 6.60 394.0 0.00 25.1 84.4 140.9 452.1 0.85 0.00 25.2 366.3 195.2217 01/15/95 07:45 24.64 6.57 386.8 1.93 24.8 85.5 142.6 433.2 3.91 0.00 26.0 378.7 201.0218 01/15/95 09:45 24.64 6.56 379.6 4.26 24.5 86.6 144.3 436.8 0.81 0.00 24.8 378.9 195.0219 01/15/95 11:45 24.64 6.61 381.3 2.65 24.3 86.3 145.5 459.8 1.49 0.00 26.6 354.8 180.1220 01/15/95 13:45 24.64 6.60 382.8 2.69 24.6 86.6 146.2 460.5 1.20 0.00 25.6 360.1 197.3221 01/26/95 11:01 28.24 6.41 388.7 0.00 19.7 82.1 146.7 417.9 0.00 0.00 36.0 376.3 232.0222 01/26/95 12:01 44.51 6.82 382.2 0.00 20.5 78.5 139.4 371.0 0.00 0.00 33.2 401.1 211.8223 01/26/95 13:01 72.39 6.85 378.0 0.00 20.8 79.6 138.6 350.6 0.00 0.00 32.4 419.8 204.0224 01/26/95 14:01 77.60 6.74 385.0 0.00 20.9 77.7 142.0 359.8 0.00 0.00 31.7 422.3 198.1225 01/26/95 15:01 77.60 6.99 385.6 0.00 20.8 78.5 136.7 355.1 0.00 0.00 30.9 419.8 196.4226 01/26/95 16:01 72.62 6.91 388.6 0.86 21.2 79.6 137.4 379.9 0.00 0.00 31.3 401.2 198.8227 01/26/95 17:01 67.30 6.87 398.6 0.00 21.5 81.8 140.4 384.2 0.00 0.00 30.4 419.4 205.6228 01/26/95 18:01 62.57 6.98 399.6 0.00 21.0 82.0 141.9 392.7 0.00 0.00 31.2 413.3 212.9229 01/26/95 19:01 57.74 6.60 412.0 0.00 21.7 84.0 144.3 390.3 0.00 0.00 30.4 439.3 212.5230 01 /26/95 20:01 53.06 6.50 402.7 0.00 21.2 83.7 142.3 383.5 0.00 0.00 29.8 432.9 217.7231 01/26/95 21:01 48.51 6.52 407.9 0.00 20.9 85.1 145.1 412.6 0.00 0.00 30.7 415.3 222.1232 01/26/95 22:01 44.11 6.89 417.5 0.00 21.5 86.5 150.0 404.4 0.00 0.00 30.6 446.4 222.2233 01/26/95 23:01 40.06 6.93 416.2 0.00 21.3 86.3 148.4 434.1 0.00 0.00 31.4 410.0 224.0234 01/27/95 00:01 40.06 7.06 428.4 0.00 21.9 87.7 152.0 412.6 0.61 0.00 30.6 455.1 223.9235 01/27/95 01:01 40.06 7.10 451.4 0.00 22.1 92.6 154.6 448.6 0.00 0.00 31.3 456.8 230.0236 01/27/95 02:01 35.96 7.13 428.7 0.00 21.4 88.3 154.1 437.4 0.52 0.00 33.7 429.8 235.8237 01/27/95 03:01 35.96 7.16 427.5 0.00 21.3 88.9 152.2 430.5 0.00 0.00 31.3 438.0 243.6238 01/27/95 04:01 32.02 7.26 423.9 1.86 21.6 91.2 153.7 429.6 0.00 0.00 31.0 443.8 238.6239 01/27/95 05:01 32.02 7.23 456.6 0.00 22.3 95.8 155.6 452.3 0.00 0.00 31.3 466.9 245.5240 01/27/95 06:01 31.67 7.22 454.9 0.00 21.5 97.8 163.7 438.0 0.00 0.00 33.5 494.5 239.2241 01/27/95 07:01 28.24 7.24 432.1 0.00 21.8 89.5 153.7 443.4 0.00 0.00 34.4 428.1 242.9242 01/27/95 08:01 28.24 7.23 434.5 0.00 21.6 90.3 157.1 437.6 0.00 0.00 30.9 451.5 237.6243 01/27/95 09:01 28.24 7.21 429.8 0.00 22.5 89.5 155.6 468.5 0.00 0.00 32.4 409.1 240.1244 01/27/95 10:01 24.64 6.76 419.7 0.00 21.1 91.2 153.9 472.6 0.00 0.00 34.7 389.0 251.1245 01/30/95 05:04 32.02 6.35 402.6 0.00 21.2 84.5 146.5 435.2 0.00 0.00 33.2 384.4 237.9246 01/30/95 06:04 44.11 6.33 390.4 0.00 20.7 83.0 143.2 378.0 0.00 0.00 30.7 424.1 219.2247 01/30/95 07:04 59.70 6.63 379.8 0.00 20.8 79.3 137.8 376.6 0.00 0.00 29.5 399.4 211.8248 01/30/95 08:04 72.62 6.67 378.6 0.00 21.1 78.7 136.8 357.9 0.00 0.84 29.2 414.3 202.6249 01/30/95 09:04 77.60 6.69 386.2 2.21 20.9 82.2 142.0 351.5 0.00 0.00 29.1 445.9 202.0250 01/30/95 10:04 77.60 6.70 389.0 0.00 21.1 80.9 137.7 374.3 1.66 0.00 31.1 409.1 215.8251 01/30/95 11:04 72.39 7.09 395.4 0.00 21.1 82.9 142.6 378.1 0.00 0.00 30.2 428.9 207.2252 01/30/95 12:04 67.30 7.17 399.3 0.00 21.2 83.1 140.2 390.0 0.60 0.00 29.5 417.5 216.2253 01/30/95 13:04 67.30 7.15 391.9 0.93 21.5 83.3 140:3 383.1 0.00 0.00 29.6 418.3 214.2254 01/30/95 14:04 62.57 7.15 401.6 0.00 21.2 83.8 141.0 393.8 1.35 0.00 29.5 418.1 218.5255 01/30/95 15:04 57.31 7.07 407.8 0.00 21.2 84.0 143.1 412.2 0.00 0.00 29.6 411.8 226.2256 01/30/95 16:04 57.74 7.26 422.3 0.00 21.4 84.4 144.2 426.4 0.00 0.00 29.7 415.1 229.1257 01/30/95 17:04 53.06 7.19 407.9 0.00 21.2 83.7 142.7 427.9 0.00 0.00 30.4 393.1 229.5258 01/30/95 18:04 48.51 7.19 412.5 0.00 21.3 85.6 146.6 428.6 1.70 0.00 30.1 407.6 225.9259 01/30/95 19:04 48.51 7.17 425.1 0.00 21.6 86.5 145.7 432.6 0.00 0.00 30.0 418.6 229.1260 01/30/95 21:04 42.55 7.11 419.1 0.00 21.3 86.3 148.4 440.5 0.00 0.00 30.0 409.5 241.6261 01/30/95 22:04 40.06 7.10 423.4 0.00 21.2 89.7 151.4 454.1 0.75 0.00 30.2 411.6 237.8262 01/30/95 23:04 40.06 7.11 418.1 0.00 21.0 87.2 149.7 445.6 0.00 0.00 30.4 406.5 242.3263 01/31/95 00:04 35.96 7.12 422.1 0.00 213 89.5 151.9 438.5 1.00 0.00 30.5 425.7 235.4264 01/31/95 01:04 35.96 7.14 422.1 0.00 21.4 87.9 152.0 458.3 0.00 0.00 32.1 400.9 239.9265 01/31/95 02:04 34.33 7.17 423.6 0.00 21.8 88.3 152.1 451.2 0.00 0.00 30.4 414.3 241.7266 01/31/95 03:04 32.02 6.82 422.9 0.00 21.5 87.4 150.5 476.5 0.00 0.00 33.4 377.0 241.5267 01/31/95 04:04 32.02 6.45 392.9 0.00 20.5 86.9 148.8 443.6 0.75 0.00 31.5 377.3 242.7268 02/01/95 12:07 26.42 6.60 418.8 0.00 20.7 86.4 147.0 441.8 0.00 0.00 37.2 390.1 258.1269 02/20/95 14:52 29.77 6.67 412.4 0.00 20.7 85.8 145.3 414.5 0.72 0.00 49.3 381.6 279.0270 03/08/95 20:25 30.11 7.04 410.5 0.00 20.8 85.3 145.3 398.9 2.48 0.00 42.1 406.7 212.4271 03108/95 21:25 53.06 7.19 399.5 0.00 21.3 78.8 134.9 286.7 7.53 0.00 32.6 488.9 186.1272 03108/95 22:25 85.67 7.13 398.9 0.00 21.5 88.7 146.0 277.0 9.86 0.00 31.1 540.7 174.9273 03/08/95 23:25 94.53 7.09 383.5 0.00 19.5 86.7 138.0 268.1 11.89 0.00 30.3 511.9 172.0274 03/09/95 00:25 123.18 6.93 372.9 0.00 23.0 70.6 129.4 265.1 10.06 0.00 27.3 466.1 171.4275 03/09/95 01:25 117.30 6.94 387.6 0.00 22.1 75.6 127.2 261.4 5.15 0.00 27.7 493.3 169.9276 03109/95 02:25 108.25 6.85 395.5 0.00 22.2 78.4 130.7 287.6 6.61 0.00 39.9 462.0 179.0277 03/09/95 03:25 99.46 6.90 394.4 0.00 22.5 76.8 129.7 302.9 6.74 0.00 28.9 462.6 183.4278 03/09/95 04:25 99.46 6.80 396.9 0.00 22.6 76.8 130.2 302.1 4.67 0.00 36.3 454.3 186.8279 03/09/95 05:25 99.46 6.97 397.5 0.00 22.8 78.1 131.0 301.2 7.76 0.00 28.0 473.5 183.0280 03/09/95 06:25 105.29 6.99 397.2 0.00 23.3 76.4 129.7 303.2 5.21 0.00 28.6 467.1 190.2140
Caspar Creek - Watershed MUN# DATE TIME Streamflow pH Na NH4 K Mg Ca CI NO3 PO4 SO4 HCO3 SiL/s µM µM µM µM µM µM µM µM µM µM µM281 03/09/95 07:25 108.25 6.98 395.3 0.00 23.4 75.6 128.7 302.7 8.85 0.00 28.0 459.9 181.3282 03/09/95 08:25 111.24 6.93 382.9 0.00 23.9 73.7 124.0 305.7 9.59 0.00 27.2 432.4 179.0283 03/09/95 09:25 123.18 6.92 387.9 0.00 24.3 76.0 128.1 308.0 8.69 0.00 27.0 449.6 177.8284 03/09/95 10:25 123.18 6.91 393.5 0.00 24.4 77.2 128.4 306.1 10.88 0.00 27.5 457.0 177.4285 03/09/95 11:25 111.24 6.93 399.5 0.00 24.5 78.5 129.9 300.9 7.55 0.00 27.3 477.5 182.7286 03/09/95 12:25 105.29 7.01 408.9 0.00 24.1 85.7 151.6 317.9 5.19 0.00 27.9 528.8 186.3287 03/09/95 13:25 96.60 6.97 427.7 0.00 24.8 84.4 136.3 330.6 6.78 0.00 28.1 500.3 191.1288 03/09/95 15:25 72.39 6.58 430.0 0.00 23.8 85.3 140.6 345.5 6.30 0.00 41.3 471.2 250.8289 03/09/95 17:25 62.57 6.90 443.8 0.00 24.6 90.5 151.8 359.1 0.00 0.00 50.7 492.4 208.1290 03/09/95 19:25 53.06 6.68 451.0 0.00 24.1 93.4 151.4 371.3 0.00 0.00 29.2 534.9 217.1291 03/09/95 21:25 46.29 6.77 460.4 0.00 24.0 92.2 150.7 386.5 0.00 0.00 29.8 524.2 223.0292 03/09/95 23:25 42.17 6.75 466.8 0.00 24.1 92.7 151.5 398.2 1.10 0.00 37.4 505.3 226.8293 03/10/95 01:25 35.96 6.83 377.3 0.00 20.0 89.0 138.1 389.3 0.00 0.00 31.0 396.0 229.1294 03/11/95 17:12 32.02 6.77 408.7 0.00 21.1 88.1 138.0 407.3 0.00 0.00 32.9 408.8 247.1295 03/13/95 06:13 48.51 6.88 440.0 0.00 22.1 87.2 139.9 348.2 0.00 0.00 31.2 505.8 224.6296 03/13/95 07:13 57.74 6.86 430.1 0.00 22.3 87.9 141.9 348.4 0.00 0.00 31.2 501.3 214.0297 03/13/95 08:13 62.57 6.95 435.4 0.00 22.3 88.1 141.1 333.1 0.00 0.00 31.3 520.6 209.0298 03/13/95 09:13 62.57 6.92 437.9 0.00 22.4 88.6 142.1 335.5 3.42 0.00 31.2 520.3 211.6299 03/13/95 10:13 57.74 6.94 441.5 0.00 22.4 95.1 148.1 327.8 0.00 0.00 30.4 561.6 212.2300 03/13/95 11:13 56.23 6.90 443.3 0.00 22.7 89.5 146.3 345.1 0.00 0.00 30.4 531.7 215.4301 03/13/95 12:13 53.06 6.97 395.8 6.55 22.4 91.8 151.0 358.7 0.00 0.00 30.3 484.5 219.7302 03/13/95 13:13 48.51 6.90 452.9 0.00 22.8 92.2 154.5 364.6 2.06 0.00 30.8 540.7 223.0303 03/13/95 14:13 48.51 6.94 446.6 0.00 22.8 94.3 148.1 369.0 0.00 0.00 31.4 522.3 226.3304 03/13/95 15:13 48.51 6.93 445.1 0.00 22.8 89.6 147.5 373.8 1.04 0.00 30.5 506.2 223.4305 03/13/95 16:13 53.06 7.05 445.1 0.00 22.8 89.6 147.5 359.5 0.00 0.00 29.8 523.1 219.8306 03/13/95 17:13 62.57 6.78 389.0 3.73 24.5 90.4 168.8 369.1 0.66 0.00 30.7 500.6 216.7307 03/13/95 18:13 67.30 6.69 374.4 0.50 23.3 91.1 151.2 354.3 1.79 0.00 30.0 466.3 243.9308 03/13/95 19:13 82.95 6.60 365.4 0.53 23.0 86.1 137.4 332.7 4.62 0.00 28.7 440.8 205.3309 03/13/95 20:13 105.29 6.88 359.6 6.40 25.2 81.4 134.7 314.1 1.51 0.00 28.0 445.4 193.3310 03/13/95 21:13 111.24 6.68 366.6 0.00 24.4 80.4 133.5 318.7 1.04 0.00 27.5 444.1 237.8311 03/13/95 22:13 105.29 6.61 363.2 3.75 24.3 88.1 150.8 318.0 0.00 0.00 28.2 490.8 192.8312 03/13/95 23:13 99.46 6.65 363.8 1.74 24.4 82.8 135.3 335.6 0.78 0.00 28.3 431.3 197.5313 03/14/95 00:13 97.64 7.08 371.0 0.79 23.7 85.6 140.3 334.0 2.93 0.00 28.6 452.E 205.3314 03/14/95 01:13 93.76 7.03 370.4 3.74 23.9 84.3 134.6 339.5 2.01 0.00 28.7 433.3 200.6315 03/14/95 02:13 94.53 7.09 370.2 3.23 23.9 84.0 135.8 341.5 0.00 0.00 28.3 435.6 200.2316 03/14/95 03:13 84.68 7.18 369.1 0.69 23.8 83.7 136.8 350.3 0.00 0.00 28.6 426.4 202.1317 03/14/95 04:13 82.95 7.14 373.8 0.74 23.6 83.4 136.4 351.5 0.00 0.00 28.1 429.2 203.3318 03/14/95 05:13 82.95 7.15 365.8 2.85 23.7 88.1 39.6 341.0 0.00 0.00 27.3 449.2 200.4319 03/20/95 00:17 9.59 7.05 402.6 2.97 25.5 91.3 148.9 400.3 4.86 0.00 31.8 435.8 238.1320 03/20/95 08:17 82.21 7.04 354.4 0.45 22.5 78.0 131.1 297.1 0.00 0.00 30.9 436.4 195.9321 03/20/95 09:17 79.29 7.08 356.1 7.15 23.4 78.7 130.1 311.4 0.00 0.00 30.9 424.1 198.8322 03/20/95 10:17 74.03 7.11 366.9 1.48 22.9 80.2 132.9 326.9 0.59 0.00 31.6 425.4 202.5323 03/20/95 11:17 67.30 7.15 368.4 0.70 23.2 83.4 136.7 337.0 2.53 0.00 32.2 427.8 206.3324 03/20/95 13:17 57.74 7.03 379.1 0.97 23.8 85.2 137.4 350.7 8.19 0.00 32.0 425.3 214.4325 03/20/95 14:17 54.53 7.12 396.8 0.00 23.5 85.7 142.9 358.4 1.21 0.00 31.8 454.4 218.6326 03/20/95 15:17 53.06 7.17 386.2 0.63 23.4 86.7 143.8 368.4 2.62 0.00 32.0 435.7 220.5327 03/20/95 16:17 48.51 7.16 390.5 0.00 24.2 88.3 147.2 374.0 0.55 0.00 32.1 447.0 227.2328 03/20/95 17:17 48.51 7.13 391.0 3.86 24.8 87.9 145.2 374.3 2.53 0.00 31.6 442.0 225.2329 03/20/95 18:17 44.11 7.15 398.3 4.59 24.0 88.7 145.9 382.2 1.41 0.00 32.7 442.5 231.8330 03/20/95 19:17 44.11 7.09 393.7 0.65 23.7 88.4 149.7 376.7 1.03 0.00 32.0 451.5 231.9331 03/20/95 20:17 40.06 7.11 394.9 4.11 24.3 89.2 166.6 378.8 3.80 0.00 32.1 484.0 232.5332 03/20/95 21:17 40.06 7.15 397.5 5.20 24.1 89.9 148.3 395.8 1.72 0.00 31.7 437.1 233.4333 03/20/95 22:17 38.74 7.13 391.0 0.00 24.0 88.8 148.2 386.9 1.56 0.00 32.0 436.7 231.8334 03/20/95 23:17 35.96 7.17 395.9 5.00 24.7 89.0 147.4 383.2 1.47 0.00 32.0 444.7 234.4335 03/21/95 01:17 35.96 7.14 400.5 1.72 24.0 99.8 164.7 390.5 1.66 0.00 32.5 496.2 238.3336 03/21/95 02:17 35.96 7.15 415.8 0.00 23.4 90.5 149.7 390.5 1.05 0.00 32.0 464.2 237.5337 03/21/95 03:17 32.02 6.96 400.5 0.47 23.3 91.0 155.4 390.4 1.27 0.00 31.7 461.4 243.3338 03/21/95 04:17 32.02 7.14 394.7 2.50 23.4 91.5 151.0 395.9 1.49 0.00 32.0 441.7 240.8339 03/21/95 05:17 32.02 7.16 411.3 0.00 23.2 90.8 150.3 400.8 0.00 0.00 32.1 451.8 241.6340 03/21/95 06:17 32.02 7.15 411.6 0.00 23.1 92.8 152.9 411.9 0.00 0.00 31.9 450.5 242.6341 03/21/95 07:17 32.02 7.11 406.1 0.00 23.1 89.7 149.1 394.8 0.00 0.00 41.3 429.4 241.7342 04/05/95 09:37 3.27 7.14 443.2 0.00 23.1 112.5 176.6 473.7 0.00 0.00 45.9 479.1 277.3343 05/05/95 09:23 7.40 7.16 458.8 0.00 22.8 124.9 195.3 474.6 0.00 0.00 46.5 554.5 282.7344 12/12/95 00:20 13.23 6.86 506.5 0.00 27.1 104.5 156.9 498.1 0.00 0.00 54.5 449.2 187.5345 12/12/95 01:20 12.59 7.08 493.5 0.00 29.9 105.3 157.1 449.7 0.00 0.00 39.7 519.3 176.2346 12/12/95 02:20 10.76 7.10 490.0 0.00 28.4 102.1 156.6 445.5 0.00 0.00 38.7 512.8 175.4347 12/12/95 03:20 9.59 7.07 494.8 0.00 28.1 102.9 156.6 453.9 0.00 0.00 40.2 507.7 182.6348 12/12/95 04:20 9.02 7.13 506.5 0.00 27.1 104.5 156.9 469.2 0.00 0.00 42.2 502.9 188.3349 12/12/95 05:20 8.47 7.14 512.2 0.00 26.9 106.2 157.4 475.7 0.00 0.00 45.0 500.3 189.7350 12/12/95 06:20 7.40 7.13 515.2 0.00 26.9 106.2 158.1 486.1 0.00 0.00 46.4 491:8 194.7141
Caspar Creek - Watershed MUN# DATE TIME Streamflow pH Na NH4 K Mg Ca CI NO3 PO4 SO4 HCO3 SiL/s µM µM µM µM µM µM µM µM µM µM µM351 12/12/95 07:20 6.89 7.19 523.9 0.00 26.6 108.6 159.1 495.6 0.00 0.00 47.6 495.2 201.1352 12/12195 08:20 6.19 7.20 527.8 0.00 25.8 109.5 159.1 498.1 0.00 0.00 48.4 495.9 200.7353 12/12/95 09:20 5.71 7.23 533.0 0.00 25.8 111.5 160.1 497.8 0.00 0.00 49.5 505.3 206.8354 12/12/95 10:20 4.52 7.27 535.2 0.00 25.6 112.3 159.4 503.9 0.00 0.00 50.7 498.9 207.1355 12/12/95 11:20 4.52 7.28 561.7 0.00 26.1 118.5 162.1 500.4 0.00 0.00 51.3 546.1 208.9356 12/12/95 12:20 4.52 7.21 545.2 0.00 25.8 114.8 160.6 512.5 0.00 0.00 52.5 504.3 211.0357 12/12/95 13:20 4.09 7.18 548.3 0.00 26.1 114.8 160.8 518.6 0.00 0.00 53.6 500.0 211.4358 12/12/95 14:20 3.67 7.15 552.6 0.00 25.8 116.0 161.3 523.6 0.00 0.00 53.9 501.8 215.7359 12/12/95 15:20 3.27 7.20 543.0 0.00 26.6 117.3 161.7 540.5 0.00 0.00 55.1 476.8 214.2360 12/12/95 16:20 2.89 7.33 561.7 0.00 26.1 118.5 162.1 533.0 0.00 0.00 56.2 503.7 220.6361 12/12/95 17:20 2.89 7.28 563.0 0.00 26.3 119.6 162.6 538.0 0.00 0.00 57.5 500.8 224.0362 12/12/95 18:20 2.67 7.26 558.3 0.00 26.1 120.6 163.1 527.6 0.00 0.00 57.5 509.1 227.4363 12/12/95 19:20 2.32 7.34 558.7 0.00 25.3 122.1 163.4 537.2 0.00 0.00 57.0 503.7 231.7364 12/12/95 20:20 2.18 7.29 564.3 0.00 25.8 123.5 163.6 540.9 0.00 0.00 57.9 507.6 233.1365 12/12/95 21:20 1.54 7.09 565.7 0.00 25.8 125.1 169.6 544.9 0.00 0.00 59.4 517.3 232.4366 12/12/95 22:20 1.54 7.28 570.9 0.00 26.1 125.1 167.6 549.1 0.00 0.00 59.9 513.5 233.1367 12/12/95 23:20 1.54 7.16 574.3 0.00 26.6 126.7 170.1 543.0 0.00 0.00 60.8 530.1 229.5368 12/29/95 00:22 23.22 6.86 467.8 0.00 36.1 85.2 139.7 346.7 0.00 0.00 32.5 541.9 183.6369 12/29/95 01:22 59.04 7.08 428.3 0.00 36.6 88.9 123.4 299.5 0.00 0.00 26.9 536.1 162.3370 12/29/95 02:22 54.74 7.10 425.7 0.00 36.1 86.0 121.4 300.8 0.00 0.00 26.0 523.8 164.1371 12/29/95 03:22 50.56 7.07 423.0 0.00 36.1 86.4 122.7 301.7 0.00 0.00 26.0 523.6 166.2372 12/29/95 04:22 46.49 7.13 423.0 0.00 36.3 87.2 119.0 311.8 0.00 0.00 26.1 507.8 168.0373 12/29/95 05:22 42.55 7.14 428.3 0.00 36.1 83.5 121.9 318.3 0.00 0.00 27.8 501.5 173.3374 12/29/95 06:22 38.74 7.13 433.9 0.00 36.1 86.0 120.7 319.6 0.00 0.00 26.9 510.0 173.0375 12/29/95 07:22 36.88 7.19 430.9 0.00 35.8 84.0 119.5 316.6 0.00 0.00 25.9 505.0 173.0376 12/29/95 08:22 35.05 7.20 428.3 0.00 35.5 86.8 120.0 316.1 0.00 0.00 27.1 507.1 175.8377 12/29/95 09:22 33.25 7.23 431.3 0.00 35.3 86.4 124.4 329.6 0.00 0.00 27.2 504.3 180.1378 12/29/95 10:22 31.49 7.27 428.7 0.00 35.5 86.8 130.4 323.3 0.00 0.00 26.8 521.9 174.4379 12/29/95 11:22 29.77 7.28 483.0 0.00 38.1 85.2 126.7 365.8 0.00 0.00 28.9 521.2 185.8380 12/30/95 12:22 28.08 7.21 437.0 0.00 36.1 84.4 131.9 327.6 0.00 0.00 26.2 525.6 175.8381 12/30/95 13:22 26.42 7.18 442.2 0.00 36.1 86.4 123.7 336.1 0.00 0.00 27.2 508.0 180.8382 12/30/95 14:22 24.80 7.15 452.6 0.00 36.1 86.4 130.4 327.4 0.00 0.00 27.5 540.1 184.7383 12/30/95 15:22 24.80 7.20 458.7 0.00 36.1 88.1 126.7 342.6 0.00 0.00 27.6 526.5 186.5384 12/30/95 16:22 23.22 7.33 458.3 0.00 35.8 88.5 127.2 345.6 0.00 0.00 27.4 524.9 187.9385 12/30/95 17:22 23.22 7.45 466.5 0.00 35.8 89.7 128.4 349.3 0.00 0.00 28.3 532.7 190.0386 12/30/95 18:22 21.67 7.38 467.8 0.00 35.8 90.5 130.7 356.1 0.00 0.00 28.4 533.1 192.9387 12/30/95 19:22 21.67 7.42 472.6 0.00 35.8 91.4 131.2 361.8 0.00 0.00 28.0 535.6 197.5388 12/30/95 20:22 20.16 7.36 477.8 0.00 35.8 92.2 131.7 369.7 0.00 0.00 28.8 534.2 201.4389 12130/95 21:22 20.16 7.29 480.4 0.00 35.8 93.0 133.4 345.1 0.00 0.00 28.6 566.9 196.4390 12/30/95 22:22 18.70 7.38 484.8 0.00 36.1 92.2 134.2 355.2 0.00 0.00 30.1 558.2 201.1391 12/30/95 23:22 18.70 7.36 475.7 0.00 35.8 97.1 133.9 352.5 0.00 0.00 29.9 561.3 214.2392 01/11/96 10:20 1.54 7.43 553.5 0.00 34.3 158.8 184.8 387.9 0.00 0.00 51.5 783.9 396.1393 01/16/96 09:20 48.51 7.32 490.4 0.00 34.3 96.3 134.9 322.0 0.00 0.00 29.7 605.8 213.5394 01/16/96 10:20 44.51 7.26 479.6 0.00 33.2 95.1 132.2 306.3 0.00 0.00 29.7 601.7 207.5395 01/16/96 11:20 42.55 7.29 478.3 0.00 33.5 93.4 132.9 310.1 0.00 0.00 29.7 595.0 209.6396 01/16/96 12:20 40.63 7.34 485.7 0.00 34.3 94.2 132.7 318.4 0.00 0.00 30.1 595.2 211.0397 01/16/96 13:20 38.74 7.35 473.9 0.00 33.5 93.4 130.9 302.4 0.00 0.00 28.8 596.0 206.0398 01/16/96 14:20 36.88 7.38 477.8 0.00 33.8 93.8 131.7 315.2 0.00 0.00 28.8 589.8 210.0399 01/16/96 15:20 35.05 7.29 480.4 0.00 33.2 94.2 133.2 320.3 0.00 0.00 30.0 588.2 208.5400 01/16/96 16:20 33.25 7.41 487.0 0.00 33.8 93.8 132.4 329.5 0.00 0.00 29.8 584.2 212.1401 01/16/96 17:20 31.49 7.27 488.3 0.00 33.8 94.2 135.9 333.6 0.00 0.00 30.5 587.8 214.2402 01/16/96 18:20 29.77 7.28 497.4 0.00 33.8 97.1 147.9 333.4 0.00 0.00 29.8 628.2 216.0403 01/16/96 19:20 28.08 7.31 511.3 0.00 34.5 97.9 138.9 353.6 0.00 0.00 31.4 603.0 222.8404 01/16/96 20:20 26.42 7.40 507.0 0.00 34.0 95.9 137.4 348.8 0.00 0.00 30.1 598.7 229.2405 01/16/96 21:20 24.80 7.29 508.7 0.00 34.0 94.2 138.9 355.2 0.00 0.00 30.8 592.3 228.1406 01/16/96 22:20 24.80 7.40 517.0 0.00 34.3 99.2 147.6 370.7 0.00 0.00 31.4 611.3 235.9407 01/16/96 23:20 23.22 7.31 512.6 0.00 33.2 105.8 141.1 364.4 0.00 0.00 31.4 612.5 232.4408 01/17/96 00:20 23.22 7.28 515.7 0.00 33.8 100.0 140.1 367.0 0.00 0.00 31.4 599.9 226.7409 01/17/96 01:20 21.67 7.35 524.8 0.00 34.3 103.7 142.4 377.9 0.00 0.00 32.0 609.3 229.9410 01/17/96 02:20 21.67 7.41 523.5 0.00 33.8 98.8 143.1 377.9 0.00 0.00 32.6 597.9 235.6411 01/17/96 03:20 20.16 7.29 525.7 0.00 33.8 100.8 144.4 387.4 0.00 0.00 33.0 596.5 234.9412 01/17/96 04:20 20.16 7.29 526.1 0.00 33.5 104.9 145.1 389.6 0.00 0.00 33.0 604.1 242.3413 01/17/96 05:20 18.70 7.35 537.4 0.00 34.0 100.8 146.4 396.4 0.00 0.00 35.8 597.8 235.9414 01/17/96 06:20 18.70 7.22 537.8 0.00 34.0 101.2 148.1 401.6 0.00 0.00 37.0 595.0 243.1415 01/17/96 07:20 17.27 7.18 537.8 0.00 33.8 101.6 146.9 402.5 0.00 0.00 36.9 592.4 249.1416 01/17/96 08:20 17.27 7.19 533.5 0.00 33.5 101.6 145.9 395.8 0.00 0.00 36.1 594.1 240.2417 01/18/96 12:40 28.08 7.34 486.1 0.00 33.0 94.2 133.7 322.6 0.00 0.00 29.2 594.0 217.4418 01/18/96 13:40 50.56 7.36 458.7 0.00 33.5 88.1 123.7 284.2 0.00 0.00 26.1 579.4 199.6419 01/18/96 14:40 67.98 7.35 454.3 0.00 33.2 88.1 126.9 283.9 0.00 0.00 26.8 580.2 198.6420 01/18/96 15:40 82.21 7.41 463.0 0.00 33.0 87.7 123.2 294.6 0.00 0.00 26.9 569.4 202.5142
Caspar Creek - Watershed MUN# DATE TIME Streamflow pH Na NH4 K Mg Ca CI NO3 PO4 SO4 HCO3 SiL/s µM µM µM µM µM µM µM µM µM µM µM421 01/18/96 16:40 82.21 7.30 472.6 0.00 33.0 90.1 125.4 312.9 0.00 0.00 28.5 566.9 206.4422 01/18/96 17:40 72.62 7.50 483.5 0.00 33.2 92.2 128.2 328.0 0.00 0.00 29.3 570.9 214.2423 01/18/96 18:40 67.98 7.46 487.4 0:00 33.5 93.0 129.4 345.2 0.00 0.00 30.2 560.3 219.6424 01/18/96 19:40 59.04 7.43 499.6 0.00 34.0 94.7 133.7 347.3 0.00 0.00 30.4 582.1 228.5425 01/18/96 20:40 54.74 7.37 507.8 0,00 33.5 95.5 134.4 353.7 0.00 0.00 30.7 586.1 232.4426 01/18/96 21:40 50.56 7.38 503.9 0.00 33.5 95.5 136.7 359.4 0.00 0.00 30.2 582.0 238.4427 01/18/96 22:40 46.49 7.39 508.7 0.00 33.1 97.1 138.7 365.7 0.00 0.00 30.7 586.3 235.9428 01/18/96 23:40 44.51 7.40 515.7 0.00 32.7 97.9 138.9 366.0 0.00 0.00 31.3 593.5 240.6429 01/19/96 00:40 38.74 7.38 519.1 0.00 33.0 98.4 138.9 370.1 0.00 0.00 30.8 594.9 243.4430 01/19/96 01:40 35.96 7.36 520.9 0.00 32.5 98.8 139.2 375.8 0.00 0.00 30.9 591.7 240.9431 01/19/96 02:40 35.05 7.44 521.3 0.00 32.7 99.6 140.9 380.0 0.00 0.00 31.0 593.0 244.5432 01/19/96 03:40 33.25 7.45 523.0 0.00 33.2 98.4 139.7 387.5 0.00 0.00 31.9 581.0 246.6433 01/19/96 04:40 31.49 7.49 530.9 0.00 33.0 99.6 142.9 382.4 0.00 0.00 31.7 602.9 248.0434 01/19/96 05:40 29.77 7.46 533.9 0.00 33.2 99.6 142.9 385.8 0.00 0.00 32.0 602.3 247.7435 01/19/96 06:40 28.08 7.09 527.4 0.00 33.5 100.4 158.4 389.2 0.00 0.00 32.3 624.6 250.2436 01/19/96 07:40 26.42 7.11 528.7 0.00 33.2 102.1 145.6 394.7 0.00 0.00 32.4 597.8 252.3437 01/19/96 08:40 26.42 7.16 530.0 0.00 33.0 102.1 145.9 393.3 0.00 0.00 32.2 601.3 255.2438 01/19/96 09:40 24.80 7.21 534.8 0.00 33.5 102.5 147.1 394.6 0.00 0.00 31.9 609.1 260.5439 01/19/96 10:40 24.80 7.08 530.0 0.00 33.2 109.9 153.4 389.5 0.00 0.00 31.6 637.1 256.9440 01/23/96 15:16 54.74 7.27 516.5 0.00 32.5 97.5 142.6 360.4 0.05 0.00 34.0 601.0 249.8441 01/23/96 16:16 56.88 7.20 514.8 0.00 32.5 97.9 142.4 354.1 0.00 0.00 34.4 605.0 252.0442 01/23/96 17:16 59.04 7.20 521.7 0.00 32.5 99.2 142.6 346.5 0.00 0.00 35.8 619.9 251.6443 01/23/96 18:16 61.24 7.16 513.5 0.00 32.7 102.5 161.3 352.2 0.00 0.00 35.1 651.6 250.5444 01/23/96 19:16 61.24 7.16 519.6 0.00 33.0 99.2 143.6 352.7 0.00 0.00 34.7 616.2 255.5445 01/23/96 20:16 61.24 7.12 522.2 0.00 33.0 98.8 141.1 355.8 0.00 0.00 43.4 592.5 258.0446 01/23/96 21:16 61.24 7.18 520.9 0.00 32.7 100.4 144.6 355.2 0.00 0.00 34.3 620.0 259.4447 01/23/96 22:16 63.46 7.23 517.8 0.00 31.5 99.6 144.1 350.6 0.00 0.00 34.2 617.7 253.4448 01/23/96 23:16 65.71 7.23 520.9 0.00 32.7 99.6 143.9 354.6' 0.00 0.00 34.5 617.0 255.9449 01/24/96 00:16 65.71 7.27 518.7 0.00 32.5 99.6 143.6 361.2 0.00 0.00 35.7 605.0 257.3450 01/24/96 01:16 67.98 7.27 516.1 0.00 32.0 100.0 142.4 354.1 0.00 0.00 34.4 609.9 255.5451 01/24/96 02:16 77.36 7.08 518.3 0.00 32.2 99.6 142.9 352.6 0.00 0.00 34.3 614.2 251.2452 01/24/96 03:16 92.22 7.21 515.2 0.00 32.2 98.8 142.1 354.5 0.00 0.00 34.1 606.6 248.0453 01/24/96 04:16 97.38 7.13 514.3 0.00 32.0 98.4 141.1 349.3 0.00 0.00 33.0 610.0 246.3454 01/24/96 05:16 107.98 7.18 510.0 0.00 32.2 97.9 140.6 347.0 0.00 0.00 33.6 605.3 245.6455 01/24/96 06:16 130.33 7.26 509.1 0.00 32.2 99.2 145.6 350.2 0.00 0.00 33.9 613.1 242.3456 01/24/96 07:16 142.05 7.24 503.5 0.00 32.0 96.3 138.2 341.4 0.00 0.00 33.1 596.8 243.4457 01/24/96 08:16 160.30 7.14 519.1 0.00 32.5 97.1 136.9 366.7 0.00 0.00 34.5 584.1 247.0458 01/24/96 09:16 172.89 7.33 519.1 0.00 32.0 96.3 136.4 371.4 0.00 0.00 32.8 579.6 243.8459 01/24/96 10:16 172.89 7.26 512.2 0.00 32,0 96.7 134.7 363.8 0.00 0.00 31.4 580.3 244.8460 01/24/96 11:16 166.55 7.19 490.9 0.00 32.5 93.8 129.4 339.5 0.00 0.00 29.6 571.2 229.9461 01/24/96 12:16 151.08 7.00 467.0 0.00 32.5 89.3 123.9 310.0 0.00 0.00 27.2 561.5 210.0462 01/24/96 13:16 145.04 7.27 443.0 0.00 32.7 86.0 120.0 281.6 0.00 0.00 25.3 555.5 196.1463 01/24/96 14:16 139.09 7.28 412.6 0.00 33.5 81.5 110.7 265.7 0.00 0.00 23.9 517.1 179.0464 02/09/96 10:35 6.38 7.06 447.0 0.00 22.4 104.2 160.0 421.1 0.00 0.00 36.2 504.4 277.6465 02/21/96 00:53 21.67 6.91 486.1 0.00 23.8 91.8 139.9 377.8 0.00 0.00 31.4 532.6 237.7466 02/21/96 01:53 21.67 7.02 470.9 0.00 22.0 81.5 134.2 371.9 2.81 0.00 31.5 486.5 223.1467 02/21/96 02:53 54.74 6.96 461.7 0.00 22.3 83.5 131.5 350.6 3.74 0.00 30.2 499.2 212.5468 02/21/6 03:53 65.71 7.02 452.2 0.00 22.3 77.8 128.7 340.1 8.21 0.00 29.8 479.5 208.9469 02/21/96 04:53 77.36 7.08 449.1 0.00 22.3 77.4 128.4 343.9 5.77 0.00 30.3 472.7 206.0470 02/21/96 05:53 102.63 7.03 449.6 0.00 22.5 77.4 126.2 340.3 2.56 0.00 29.3 477.6 205.0471 02/21/96 06:53 102.63 7.01 451.3 0.00 22.5 77.0 126.2 333.1 9.93 0.00 29.7 477.7 202.8472 02/21/96 07:53 102.63 7.03 451.3 0.00 22.0 81.1 131.7 341.9 6.32 0.00 29.9 490.7 206.0473 02/21/96 08:53 102.63 7.00 451.3 0.00 22.3 83.5 135.7 347.1 5.10 0.00 29.9 500.0 205.7474 02/21/96 09:53 103.96 6.98 457.8 0.00 22.3 78.6 135.1 348.1 3.47 0.00 30.3 495.1 213.9475 02/21/96 10:53 103.96 7.04 453.0 0.00 22.0 79.0 134.4 352.1 5.64 0.00 30.5 483.1 216.7476 02/21/96 11:53 105.29 6.83 460.9 0.00 22.3 80.7 133.2 355.1 7.24 0.00 30.2 488.0 221.4477 02/21/96 12:53 105.29 7.10 464.8 0.00 22.3 80.7 132.4 369.6 7.85 0.00 30.1 475.5 246.6478 02/21/96 13:53 106.63 6.67 460.9 0.00 22.0 79.8 132.4 369.0 3.68 0.00 29.4 475.9 223.5479 02/21/96 14:53 106.63 6.88 461.3 0.00 22.0 92.6 157.3 365.1 5.38 0.00 31.9 548.9 224.9480 02/21/96 15:53 107.98 7.00 471.7 0.00 22.3 82.3 133.7 380.5 4.31 0.00 30.4 480.3 234.5481 02/21/96 16:53 107.98 6.54 467.8 0.00 22.3 82.3 132.9 373.7 5.13 0.00 30.6 480.4 228.8482 02/21/96 17:53 109.33 6.98 465.2 0.00 21.7 82.7 132.2 376.6 4.83 0.00 29.9 475.5 224.9483 02/21/96 18:53 110.69 6.80 470.0 0.00 21.7 81.5 134.7 376.8 4.33 0.00 30.4 482.2 230.6484 02121/96 19:53 113.43 6.97 387.4 0.00 21.0 84.0 135.2 385.2 6.66 0.00 32.7 389.3 233.5485 02/21/96 20:53 113.43 7.07 471.3 0.00 22.3 84.4 148.9 386.9 9.23 0.00 31.0 501.9 232.7486 02/21/96 21:53 113.43 7.01 475.2 0.00 21.7 86.0 140.9 388.2 4.50 0.00 31.4 495.4 288.6487 02/21/96 22:53 113.43 7.06 473.9 0.00 25.1 85.2 156.9 386.9 3.36 0.00 30.2 532.4 240.6488 02/21/96 23:53 113.43 7.06 474.8 0.00 22.8 83.1 135.9 395.9 0.00 0.00 32.9 473.9 237.0489 03/19/96 10:10 4.52 7.17 449.6 0.00 21.1 102.6 161.3 411.3 0.00 0.00 38.6 510.1 286.1490 04/03/96 10:20 4.52 7.18 469.8 0.00 21.2 106.8 167.8 422.8 0.00 0.00 43.7 530.2 284.7491 05/07/96 14:48 0.18 7.63 433.7 0.00 21.3 114.7 178.7 416.9 0.00 0.00 53.5 517.7 318.9143
Caspar Creek - Watershed KJE - Pipeflow# ID DATE TIME Flow pH Na NH4 K Mg Ca CI NO3 PO4 SO4 HCO3 SiL/s µM µM µM µM µM µM µM µM µM µM µM1 K201 05/09/91 10:00 0.05 6.68 774.0 0.00 23.0 166.0 194.0 934.0 18.90 0.00 91.0 382.1 miss<strong>in</strong>g2 8201 02/08/92 11:15 0.06 6.69 694.5 0.00 27.2 160.5 153.0 793.7 29.87 0.31 83.2 358.4 324.23 K201 02/10/92 09:55 0.06 6.70 623.0 0.00 27.4 177.5 173.9 786.4 20.96 0.00 83.3 379.4 336.94 K201 02/11/92 12:11 0.48 7.29 430.1 0.00 27.4 123.0 193.9 433.0 13.41 0.25 60.3 524.0 256.65 K201 02/12/92 02:55 1.26 7.11 486.5 0.00 22.8 84.4 85.3 388.4 50.85 0.11 53.7 301.8 217.16 K201 02/12/92 04:35 1.40 7.15 487.9 0.00 24.4 88.1 87.6 372.5 69.47 0.07 50.6 320.4 199.97 K201 02/12/92 08:08 1.77 6.87 502.3 0.00 23.4 84.5 84.5 383.6 78.26 0.00 49.4 302.9 193.48 K201 02/12/92 11:05 1.65 6.68 503.8 0.00 24.2 97.3 90.8 416.9 100.10 0.38 51.8 283.3 205.29 K201 02/12/92 12:05 1.58 7.14 500.6 0.00 32.4 86.3 87.4 387.7 101.82 0.00 51.1 288.6 200.810 K201 02/12/92 13:05 1.40 6.89 520.0 0.00 23.7 87.7 91.6 403.9 103.00 0.10 51.7 291.9 206.811 K201 02/12/92 14:05 1.33 7.13 513.2 0.00 23.9 89.9 93.1 398.5 107.67 0.08 51.6 293.7 206.812 K201 02/12/92 15:05 1.26 7.00 528.1 0.00 24.0 90.7 93.4 428.0 103.14 0.00 52.1 284.9 209.813 K201 02/12/92 16:05 1.18 6.93 517.6 0.00 26.6 92.0 93.2 435.4 107.25 0.35 52.7 266.3 218.514 K201 02/12/92 17:05 1.10 7.00 516.6 0.00 28.0 92.8 94.2 430.0 95.00 0.15 53.5 286.4 215.615 K201 02/12/92 18:05 1.03 8.99 539.8 0.00 23.5 93.0 97.4 412.5 107.59 0.00 52.3 319.5 212.316 K201 02/12/92 19:05 0.98 7.32 528.3 0.00 24.9 95.6 96.9 416.3 110.85 0.37 53.4 303.8 215.417 K201 02/12/92 20:05 0.94 6.98 533.8 0.00 24.3 98.1 101.1 483.8 106.62 0.00 54.2 257.7 217.118 K201 02/12/92 21:05 0.90 6.64 530.0 0.00 24.6 97.3 100.7 439.2 106.60 0.00 54.4 296.2 224.019 K201 02/13/92 13:30 0.75 7.25 558.5 0.00 24.2 105.4 106.2 468.6 81.59 0.00 54.9 346.0 234.120 K201 02/14/92 09:30 0.47 7.41 579.6 0.00 25.5 116.7 113.6 500.0 69.74 0.06 57.6 380.8 247.221 K201 02/16/92 09:46 1.05 7.08 518.9 0.00 24.1 98.4 104.4 456.4 51.03 0.00 57.8 325.8 242.622 K201 02/19/92 16:55 1.87 6.68 487.4 0.00 23.6. 83.6 87.3 386.0 25.15 0.00 53.9 333.8 207.123 K201 02/19/92 17:55 2.24 6.86 479.4 0.00 24.7 78.7 83.1 338.0 36.44 0.00 51.7 349.7 198.224 K201 02/19/92 18:55 2.49 6.94 438.5 0.00 24.0 72.5 79.5 356.8 32.38 0.83 50.7 275.0 196.125 K201 02/19/92 19:55 2.94 6.79 467.8 0.00 25.2 76.4 82.4 332.1 50.27 0.00 49.6 329.0 188.026 K201 02/19/92 21:05 3.16 6.84 467.0. 0.00 25.8 78.9 85.2 329.0 60.08 0.19 49.3 333.1 186.827 K201 02/19/92 21:55 3.11 6.69 478.0 0.00 25.3 78.4 83.2 323.2 67.56 0.06 49.0 337.7 184.528 K201 02/19/92 23:35 2.91 6.67 475.5 0.00 25.1 79.7 85.8 356.7 74.56 0.13 50.0 300.1 204.329 K201 02/20/92 00:35 2.81 6.84 478.9 0.00 25.5 78.8 85.4 382.3 79.78 0.00 49.5 271.5 206.230 K201 02/20/92 01:35 2.63 6.91 498.6 0.00 25.7 79.8 85.9 361.8 78.72 0.00 50.3 314.6 209.631 K201 02/20/92 02:35 2.45 6.92 492.9 0.00 25.7 86.1 86.1 369.4 79.51 0.00 50.6 312.9 200.432 K201 02/20/92 03:35 2.27 6.95 485.6 0.00 25.4 84.2 84.1 360.1 80.59 0.00 51.8 303.1 202.233 K201 02/20/92 05:35 1.91 6.58 490.8 0.00 24.5 95.4 90.1 398.3 83.61 0.47 51.6 300.6 221.734 K201 02/20/92 06:35 1.76 6.66 493.3 0.00 24.4 84.6 89.1 403.8 80.69 0.00 51.5 277.8 199.635 K201 02/20/92 07:35 1.65 6.70 512.7 0.00 23.9 85.5 91.8 360.3 74.59 0.00 52.8 350.9 203.936 K201 02/20/92 08:35 1.53 6.76 499.4 0.00 24.1 87.0 91.5 386.3 86.82 0.00 53.0 301.5 207.237 K201 02/20/92 09:35 1.43 6.85 526.4 0.00 24.4 89.2 95.0 379.9 79.26 0.06 53.1 353.7 207.538 K201 02/20/92 10:35 1.36 6.47 521.8 0.00 24.1 89.3 93.4 436.2 75.12 0.00 53.0 294.2 207.739 K201 02/20/92 11:35 1.29 6.57 522.4 0.00 24.7 90.5 92.8 393.5 81.46 0.00 53.9 330.7 212.640 K201 02/20/92 12:35 1.24 6.62 514.3 0.00 24.3 91.8 94.5 391.5 79.67 0.00 54.2 331.5 211.841 K201 02/20/92 13:35 1.19 6.80 518.3 0.00 23.9 91.2 95.7 409.7 76.60 0.00 56.3 317.0 238.642 K201 02/20/92 14:35 1.11 6.80 526.9 0.00 24.5 92.8 95.9 430.5 61.92 0.00 57.7 324.5 243.744 K201 02/20/92 16:35 1.01 6.95 537.7 0.00 26.4 96.3 99.7 443.2 59.56 0.00 57.5 338.2 225.045 K201 02/22/92 09:55 0.49 6.61 581.5 0.00 25.6 112.9 110.5 525.7 19.31 0.06 64.1 380.6 266.046 K201 02/24/92 12:48 0.19 6.71 628.7 0.00 26.4 124.5 124.0 640.6 22.50 0.00 73.2 342.7 293.147 K201 03/05/92 11:24 0.13 6.98 759.6 0.00 29.5 141.6 169.5 753.0 1.87 0.00 80.8 494.7 326.748 K201 03/12/92 10:34 0.08 7.15 767.7 0.00 30.2 150.0 182.3 762.6 2.60 0.00 82.4 532.3 333.049 K201 03/15/92 11:45 2.14 6.76 538.2 0.00 22.9 73.1 77.0 306.6 0.31 0.08 53.6 447.3 206.650 K201 03/16/92 10:15 2.94 6.97 480.3 0.00 27.4 75.7 78.9 336.8 52.28 0.10 52.8 322.2 198.551 K201 03/16/92 16:34 1.90 6.72 561.3 0.00 24.0 77.6 80.5 348.0 27.32 0.00 53.7 418.9 208.552 K201 03/16/92 18:35 1.60 6.53 506.5 0.00 25.6 81.5 81.3 420.7 52.97 0.00 57.7 268.8 210.753 K201 03/16/92 19:35 1.48 7.18 511.3 0.00 25.6 83.2 84.9 402.3 56.04 0.06 58.0 298.7 215.354 K201 03/16/92 20:35 1.39 6.96 509.0 0.00 26.1 84.9 85.8 400.9 49.25 0.16 77.4 271.3 218.655 K201 03/16/92 21:35 1.30 6.89 559.5 0.00 26.6 87.6 92.3 502.0 47.90 0.15 59.6 234.4 222.957 K201 03/16/92 23:35 1.15 6.97 517.1 0.00 25.6 87.0 88.1 433.2 54.49 0.00 58.5 288.0 223.058 K201 03/17/92 00:35 1.08 7.08 529.5 0.00 25.1 87.3 86.5 454.7 52.26 0.10 58.2 278.9 222.059 K201 03/17/92 01:35 1.02 6.91 566.9 0.00 26.8 92.7 93.2 452.4 42.32 0.07 61.7 347.2 236.660 K201 03/17/92 02:35 0.97 7.03 530.0 0.00 25.7 90.1 83.9 440.0 53.02 0.00 59.7 291.4 223.461 K201 03/17/92 03:35 0.94 6.99 543.2 0.00 25.2 90.3 90.6 458.8 49.18 0.15 59.8 302.5 226.362 K201 03/17/92 04:35 0.89 7.04 533.1 0.00 26.6 89.8 90.9 453.6 44.14 0.09 61.1 301.2 234.363 K201 03/17/92 05:35 0.84 6.79 535.7 0.00 25.6 91.3 94.0 463.8 54.69 0.00 60.4 292.6 226.864 K201 03/17/92 13:24 0.62 7.04 583.8 0.00 25.1 99.3 96.4 455.6 4.08 0.09 60.9 419.1 246.165 K201 03/19/92 14:00 0.18 6.95 620.7 0.00 29.2 124.8 122.0 644.0 1.00 0.00 72.3 354.0 293.166 K201 03/26/92 13:30 0.07 6.81 695.4 0.00 32.0 153.5 145.9 883.0 0.65 0.09 86.3 269.8 330.167 K201 04/02/92 11:55 0.05 6.66 713.0 0.00 29.7 158.4 149.6 881.8 9.59 0.11 80.2 306.8 337.268 K201 04/15/92 11:37 0.06 6.89 823.7 0.00 36.1 174.9 171.5 866.1 0.00 0.21 86.7 512.8 351.169 K201 04/17/92 11:35 0.40 6.82 624.4 0.00 30.3 111.4 116.3 510.0 0.00 0.98 72.8 453.5 285.770 K201 04/22/92 09:50 0.09 6.87 692.5 0.00 30.5 137.6 139.5 719.4 4.25 0.00 85.9 381.7 347.8144
Caspar Creek - Watershed KJE – Pipeflow# ID DATE TIME Flow pH Na NH4 K Mg Ca CI NO3 PO4 SO4 HCO3 SiL/s µM µM µM µM µM µM µM µM µM µM µM71 K201 05/01/92 09:25 0.05 7.00 776.3 0.00 32.9 160.2 160.2 658.3 0.00 0.24 85.2 421.1 354.872 K201 05/07/92 13:20 0.03 7.11 766.0 0.00 24.9 176.8 165.3 870.5 0.00 0.22 84.7 435.1 364.273 K201 05/18/92 11:56 0.03 6.68 766.3 0.00 29.8 170.9 167.0 942.1 0.00 0.00 82.7 364.3 378.174 K201 06/02/92 11:06 0.02 7.02 770.3 0.00 31.2 164.2 165.0 1052.3 0.00 0.00 80.3 246.9 378.875 K201 06/18/92 10:05 0.02 7.04 788.7 0.00 32.0 178.0 174.5 1031.0 0.00 0.18 82.0 330.5 377.076 K201 07/29/92 12:18 0.01 7.46 828.6 0.00 32.0 178.5 176.9 1067.0 0.00 0.00 89.0 326.4 380.677 K201 09/03/92 12:40 0.01 7.20 836.5 0.00 32.6 189.8 187.1 1069.9 0.00 0.00 88.2 376.7 387.778 K201 11/03/92 12:17 0.02 6.87 814.3 0.00 30.7 172.8 168.2 1027.0 0.00 0.00 94.0 311.8 382.779 K201 11/20/92 15:15 0.00 7.42 1013.5 0.00 40.9 189.2 187.1 1110.0 0.00 0.00 110.0 477.1 289.580 K201 11/23/92 12:50 0.02 7.38 817.7 0.00 33.2 185.1 182.1 991.0 0.00 0.00 93.0 408.5 276.481 K201 12/03/92 12:35 0.03 7.52 508.9 0.00 30.7 171.5 159.1 369.0 0.00 0.00 88.0 655.8 327.682 K201 01/05/95 14:00 0.03 6.94 550.2 0.00 21.0 96.3 105.5 361.5 0.00 0.00 81.6 450.1 235.583 K201 01/14/95 10:40 0.03 6.50 399.9 0.00 21.8 65.6 88.6 217.4 0.00 0.00 63.4 385.9 201.884 K201 02/07/95 14:02 0.00 6.39 538.1 0.00 13.2 160.2 124.6 447.6 0.00 0.00 73.0 527.3 310.285 K201 02/20/95 15:10 0.00 6.46 607.4 0.00 23.0 136.4 158.4 642.5 0.00 0.00 88.3 401.1 317.386 K201 03/11/95 17:37 0.04 7.01 468.2 0.00 21.6 92.1 118.7 247.7 0.00 0.00 69.3 525.3 227.587 K102 02/20/95 16:30 miss<strong>in</strong>g 7.08 324.4 0.00 18.3 76.0 114.0 273.7 0.00 0.00 34.6 380.0 283.888 K102 03/11/95 17:20 miss<strong>in</strong>g 7.06 448.5 0.00 20.4 72.2 89.5 152.4 0.00 0.00 24.2 591.4 220.889 K111 02/20/95 16:32 miss<strong>in</strong>g 6.89 302.7 0.00 16.7 72.2 127.1 278.4 0.00 0.00 33.4 372.7 286.690 K112 02/20/95 16:34 miss<strong>in</strong>g 6.82 619.8 0.00 24.0 133.8 148.3 253.9 0.00 0.00 30.3 893.5 301.891 K20110 03/16/92 08:15 3.19 6.52 516.1 0.00 27.9 79.1 82.6 423.7 36.50 0.00 45.0 317.4 198.192 K20112 03/16/92 09:15 3.12 7.03 520.7 0.00 27.1 78.4 81.5 322.6 42.90 0.00 52.2 397.8 196.893 K20116 03/16/92 11:15 2.77 6.31 526.7 0.00 27.9 79.6 80.9 433.7 33.70 0.00 54.4 299.4 200.294 K20118 03/16/92 12:15 2.59 6.77 507,5 0.00 25.3 73.7 75.0 449.5 48.70 0.24 55.0 221.7 199.295 K202 01/05/95 14:00 0.01 6.76 545.5 0.00 21.7 109.9 127.0 377.0 0.00 0.00 86.0 491.9 252.196 K202 01/14/95 10:40 miss<strong>in</strong>g 6.55 420.4 0.00 24.2 82.4 110.5 220.8 0.00 0.00 60.0 489.5 192.697 K202 02/07/95 14:03 0.00 6.44 548.6 0.00 13.3 155.7 116.6 432.0 0.58 0.00 80.3 513.6 335.698 K202 02/20/95 15:13 0.00 6.44 632.4 0.00 24.3 138.6 166.5 678.6 0.00 0.00 76.5 435.3 310.599 K202 03/11/95 17:37 miss<strong>in</strong>g 6.92 474.3 0.00 21.4 92.3 116.3 255.9 0.00 0.00 66.5 523.9 254.1100 K203 12/18/94 14:20 0.00 6.57 567.6 0.00 21.0 118.9 140.5 424.9 1.24 0.00 89.1 503.1 318.5101 K203 01/05/95 14:00 0.01 6.82 564.6 0.00 19.9 105.3 121.0 398.8 0.00 0.00 93.7 451.1 244.0102 K203 01/14/95 10:40 0.03 6.40 423.6 0.00 22.1 84.8 113.8 234.9 1.26 0.00 66.5 473.5 258.9103 K203 02/07/95 14:04 0.00 6.49 556.9 0.00 13.5 165.8 133.8 482.0 0.00 0.26 81.5 524.2 337.7104 K203 02/20/95 15:16 0.00 6.47 799.3 0.00 34.1 169.4 142.3 687.7 0.00 0.00 83.7 601.6 342.4105 K203 03/11/95 17:37 0.02 6.89 642.0 0.00 32.2 120.2 154.1 282.6 0.60 0.87 69.5 799.8 264.6106 1K20102A 12/0692 16:06 0.04 7.09 717.7 0.00 29.3 148.1 149.7 811.0 0.00 2.00 91.0 347.6 278.4107 1K20104A 12/06/92 17:06 0.06 7.04 717.7 0.00 28.5 144.0 142.2 870.0 5.00 1.00 89.0 264.5 293.3108 1K20106A 12/06/92 18:06 0.09 7.02 704.7 0.00 29.9 135.7 137.2 886.0 7.00 2.00 89.0 207.5 284.1109 1K20108A 12/06/92 19:06 0.11 7.03 678.6 0.00 28.1 135.7 137.2 850.0 2.00 0.00 83.0 234.6 282.1110 1K20110A 12/06/92 20:06 0.12 6.98 674.2 0.00 28.9 139.9 139.7 805.0 0.00 0.00 83.0 291.3 283.6111 1K20112A 12/06/92 21:06 0.13 7.02 674.2 0.00 28.1 139.9 142.2 770.0 2.00 0.00 82.0 330.5 289.0112 1K20114A 12/06/92 22:06 0.14 7.11 756.9 0.00 28.1 144.0 147.2 823.0 0.00 1.00 90.0 363.3 285.4113 1K20116A 12/06/92 23:06 0.15 7.08 669.9 0.00 28.1 135.7 139.7 738.0 3.00 0.00 81.0 345.9 278.0114 1K20118A 12/07/92 00:06 0.16 7.08 669.9 0.00 28.1 135.7 139.7 755.0 4.00 0.00 82.0 325.9 282.5115 1K20120A 12/07/92 07:06 0.17 7.02 665.5 0.00 30.7 131.6 159.7 721.0 5.00 0.00 84.0 384.8 286.0116 1K20122A 12/07/92 14:06 0.17 7.06 674.2 0.00 27.1 131.6 149.5 741.0 0.00 1.00 90.0 341.6 287.7117 2K20102 12/07/92 11:55 0.17 7.28 648.1 0.00 25.6 127.5 132.2 699.0 12.00 0.00 85.0 312.2 294.5118 2K20104 12/07/92 12:55 0.17 7.27 635.1 0.00 25.6 123.4 129.7 657.0 9.00 1.00 85.0 329.9 293.6119 2K20106 12/07/92 13:55 0.17 7.23 639.4 0.00 25.6 123.4 129.7 652.0 8.00 0.00 86.0 339.3 293.0120 2K20108 12/07/92 14:55 0.17 7.21 626.4 0.00 25.6 123.4 127.2 658.0 10.00 0.00 83.0 319.2 348.3121 2K20110 12/07/92 15:55 0.17 7.19 630.7 0.00 25.6 123.4 127.2 654.0 12.00 0.00 83.0 325.6 328.3122 2K20112 12/07/92 16:55 0.17 7.24 617.7 0.00 25.6 119.3 124.8 618.0 7.00 1.00 81.0 343.3 286.9123 2K20114 12/07/92 17:55 0.17 7.21 626.4 0.00 25.6 119.3 124.8 662.0 10.00 0.00 83.0 302.0 298.6124 2K20116 12/07/92 18:55 0.17 7.19 639.4 0.00 25.4 119.3 127.2 661.0 9.00 1.00 83.0 320.8 290.1125 2K20118 12/07/92 19:55 0.16 7.14 617.7 0.00 25.6 119.3 122.3 620.0 9.00 0.00 83.0 331.3 291.3126 2K20120 12/07/92 20:55 0.16 7.18 626.4 0.00 25.6 123.4 127.2 607.0 11.00 0.00 83.0 369.2 350.3127 2K20122 12/07/92 21:55 0.16 7.18 626.4 0.00 25.6 123.4 124.8 643.0 11.00 0.00 84.0 326.2 309.1128 2K20124 12/07/92 22:55 0.16 7.13 626.4 0.00 28.1 119.3 124.8 622.0 10.00 0.00 85.0 340.6 304.6129 K20110T 12/08/92 16:35 1.85 6.79 417.6 0.00 23.0 69.9 79.8 350.0 0.00 0.00 64.0 262.1 198.1130 K20112T 12/08/92 17:35 2.41 6.91 391.5 0.00 23.0 65.8 74.9 323.0 4.00 0.00 58.0 252.8 185.6131 K20114T 12/08/92 18:35 2.66 6.85 387.1 0.00 25.6 61.7 72.4 305.0 7.00 0.00 54.0 260.8 176.5132 K20116T 12/08/92 19:35 2.91 6.71 382.8 0.00 25.6 61.7 74.9 294.0 19.00 0.00 53.0 262.5 168.5133 K20118T 12/08/92 20:35 3.15 6.70 387.1 0.00 25.6 61.7 72.4 286.0 20.00 0.00 52.0 270.8 167.4134 K20120T 12/08/92 21:35 3.25 6.78 391.9 0.00 25.6 60.9 73.1 277.0 35.00 0.00 53.0 267.5 164.6135 K20122T 12/08/92 22:35 3.22 6.86 391.5 0.00 24.8 62.1 75.8 270.0 30.00 0.00 53.0 286.2 165.4136 K20124T 12/08/92 23:35 3.02 6.74 389.7 0.00 24.0 62.9 74.4 275.0 42.00 0.00 53.0 265.4 169.5137 3K2012T 12/08/92 12:35 0.41 6.85 508.9 0.00 23.0 94.6 102.3 493.0 1.00 0.00 74.0 283.7 238.4138 3K2014T 12/08/92 13:35 0.60 6.78 500.2 0.00 23.0 90.5 99.8 493.0 1.00 0.00 75.0 259.8 269.2139 3K2016T 12/08/92 14:35 0.90 6.81 474.1 0.00 23.0 86.4 94.8 457.0 0.00 0.00 72.0 258.5 230.4140 3K2018T 12/08/92 15:35 1.35 6.78 439.3 0.00 23.0 78.2 84.8 397.0 3.00 0.00 66.0 256.3 207.8145
Caspar Creek - Watershed KJE – Pipeflow# ID DATE TIME Flow pH Na NH4 K Mg Ca CI NO3 PO4 SO4 HCO3 SiL/s µM µM µM µM µM µM µM µM µM µM µM141 4K20103T 12/09/92 03:05 2.21 6.84 418.9 0.00 26.3 68.3 77.8 285.0 55.00 0.00 55.0 287.5 236.7142 4K20106T 12109/92 06:05 1.80 6.97 430.2 0.00 26.1 71.6 79.8 285.0 54.00 0.00 55.0 310.1 191.0143 4K20109T 12/09/92 09:05 1.60 6.85 435.0 0.00 24.6 73.2 80.6 301.0 55.00 0.00 57.0 297.1 186.8144 4K20112T 12/09/92 12:05 1.47 6.99 444.1 0.00 27.6 75.7 83.6 313.0 52.00 0.00 56.0 313.3 190.5145 4K20115T 12/09/92 15:05 1.33 6.85 438.5 0.00 25.1 75.7 83.1 322.0 46.00 0.00 56.0 301.1 197.3146 4K20118T 12/09/92 18:05 1.18 6.95 458.0 0.00 25.8 79.4 87.8 332.0 47.00 0.00 59.0 321.3 195.6147 4K20121T 12/09/92 21:05 1.29 7.09 458.5 0.00 25.6 79.0 87.6 344.0 45.00 1.00 58.0 311.1 202.5148 4K20124T 12/10/92 00:05 1.48 7.03 446.7 0.00 23.8 77.7 85.3 327.0 39.00 0.00 57.0 316.7 208.3149 5K20103T 12/10/92 19:05 3.30 6.87 403.7 0.00 25.8 68.3 79.1 268.0 44.00 0.00 54.0 304.2 203.8150 5K20106T 12/10/92 22:05 2.42 7.00 412.8 0.00 25.1 70.3 79.6 279.0 42.00 0.00 55.0 306.7 172.0151 5K20109T 12/11/92 01:05 1.74 6.89 423.2 0.00 24.3 73.2 81.8 296.0 39.00 0.00 56.0 310.6 178.7152 5K20112T 12/11/92 04:05 1.41 7.04 436.3 0.00 24.8 75.3 82.8 308.0 34.00 `0.00 57.0 321.3 182.6153 5K20115T 12/11/92 07:05 1.17 7.07 440.6 0.00 25.1 77.3 84.8 319.0 35.00 0.00 58.0 320.0 188.6154 5K20118T 12/11/92 10:05 1.14 6.95 447.6 0.00 24.6 78.6 86.1 344.0 34.00 0.00 59.0 305.4 193.2155 5K20121T 12/11/92 13:05 1.14 6.81 445.8 0.00 24.3 79.4 85.8 324.0 28.00 0.00 59.0 330.6 198.6156 6K20102 12/29/92 16:55 1.29 6.83 532.0 0.00 24.6 79.8 63.9 345.7 20.90 0.00 69.0 339.3 242.4157 6K20104 12/29/92 17:55 1.29 6.63 552.8 0.00 25.3 82.7 91.1 375.1 7.10 0.00 68.6 406.3 231.1158 6K20106 12/29/92 18:55 1.29 6.86 481.5 0.00 22.0 83.1 95.6 360.0 0.00 0.00 67.0 366.8 231.3159 6K20108 12/29/92 19:55 1.28 6.81 485.9 0.00 22.3 82.7 95.3 371.7 0.60 0.00 67.8 356.2 228.2160 6K20110 12/29/92 20:55 1.26 6.75 503.3 0.00 24.0 82.7 91.6 357.2 0.60 0.00 69.0 360.0 241.1161 6K20112 12/29/92 21:55 1.24 6.90 518.1 0.00 23.0 88.4 106.0 366.2 1.00 0.00 69.0 424.8 229.3162 6K20114 12/29/92 22:55 1.22 6.62 448.9 0.00 21.5 81.9 101.3 364.2 0.80 0.00 70.0 331.7 233.7163 6K20116 12/29/92 23:55 1.19 6.64 484.1 0.00 23.0 81.9 95.3 361.0 1.00 0.00 70.0 359.5 232.0164 6K20118 12/30/92 00:55 1.17 6.64 504.6 0.00 22.8 86.0 98.3 373.0 1.70 0.00 69.5 382.2 238.2165 6K20120 12/30/92 01:55 1.12 6.74 493.3 0.00 22.8 85.2 97.1 363.0 0.40 0.00 69.4 378.2 238.2166 6K20122 12/30/92 02:55 1.09 6.76 480.6 0.00 23.0 81.9 92.6 369.2 0.90 0.00 70.3 341.8 245.0167 6K20124 12/30/92 03:55 1.06 6.70 551.1 0.00 24.0 84.7 97.6 365.2 1.60 0.00 70.9 431.1 232.2168 7K20102A 12/30/92 23:42 0.52 6.81 516.3 0.00 22.8 92.6 101.0 395.6 0.00 0.00 68.4 393.9 244.4169 7K20108A 12/31 /92 02:42 0.79 6.79 467.2 0.00 24.0 79.4 91.6 328.6 0.00 0.00 64.1 376.3 216.0170 7K20114A 12/31/92 05:42 2.17 6.78 435.0 0.00 22.5 72.4 88.6 305.0 7.10 0.00 60.2 346.9 207.7171 8K20102T 12/31192 09:15 4.80 6.92 415.8 0.00 25.6 67.5 84.6 271.5 0.60 0.00 58.1 357.2 193.8172 8K20104T 12/31 /92 11:15 5.49 6.96 391.5 0.00 25.8 64.2 80.8 251.4 6.70 0.00 55.5 338.2 168.9173 8K20108T 12/31/92 15:15 6.96 6.94 380.6 0.00 30.9 63.3 80.6 240.6 21.30 0.00 52.7 332.1 158.5174 8K20114T 12/31/92 21:15 5.77 6.95 389.7 0.00 26.6 65.4 84.3 245.1 8.40 0.00 56.4 349.5 168.6175 8K20124T 01/01/93 07:15 2.81 6.89 425.4 0.00 24.0 69.1 85.1 294.7 21.70 0.00 60.2 321.0 192.2176 9K20102 01/01193 17:45 1.36 6.96 456.7 0.00 23.3 78.2 91.3 331.7 16.80 0.00 64.4 341.6 207.4177 9K20108 01/02/93 05:45 0.74 6.94 487.2 0.00 24.8 84.7 97.6 381.8 11.20 0.00 67.6 348.4 223.4178 9K20114 01/02/93 17:45 0.40 6.90 510.2 0.00 24.3 93.4 104.5 400.4 9.60 0.00 69.3 381.8 239.2146
Caspar Creek - Watershed MUN - Pipeflow# ID DATE TIME Flow pH Na NH4 K Mg Ca CI NO3 PO4 SO4 HCO3 SiL/s µM µM µM µM µM µM µM µM µM µM µM1 M106 05/09/91 0.01 6.59 773.0 0.00 34.0 165.0 198.0 958.0 0.00 1.00 96.0 382.0 miss<strong>in</strong>g2 M106 02/08/92 10:30 0.01 6.22 815.0 0.00 39.2 180.5 216.3 774.8 0.28 0.10 83.6 699.4 328.83 M106 02/10/92 09:28 0.01 6.94 826.4 0.00 33.1 179.5 216.1 1171.5. 0.00 0.00 114.8 249.7 325.04 M106 02/11/92 15:35 0.12 7.15 708.5 0.00 30.4 142.5 168.4 905.3 0.00 0.00 100.1 255.0 299.75 M106 02/12/92 03:55 0.57 6.76 608.6 0.00 28.0 115.7 138.9 757.1 0.17 0.00 68.7 251.2 266.66 M106 02/12/92 05:35 0.60 7.05 623.3 0.00 272 113.4 139.3 778.4 0.00 0.00 66.5 244.3 255.97 M106 02/12/92 06:35 0.62 7.02 623.2 0.00 25.9 116.1 136.8 827.9 0.07 2.16 67.2 190.2 260.68 M106 02/12/92 08:35 0.62 7.26 638.9 0.00 27.8 117.9 141.9 809.4 0.00 0.19 66.5 242.6 260.99 M106 02/12/92 09:29 0.60 6.94 634.4 0.00 27.4 116.4 141.2 760.5 0.00 0.00 66.6 283.2 262.410 M106 02/12/92 09:35 0.59 7.00 640.7 0.00 27.5 116.7 137.3 778.4 0.00 3.51 72.0 250.1 267.711 M106 02/12/92 10:35 0.57 7.17 636.9 0.00 28.1 117.3 143.4 816.6 0.11 0.19 66.6 236.3 270.812 M106 02/12/92 12:35 0.53 7.27 631.2 0.00 29.0 119.5 140.9 788.0 0.00 0.17 66.6 259.7 266.313 M106 02/12/92 13:35 0.51 6.80 663.3 0.00 27.9 118.6 144.1 819.0 0.00 0.07 67.5 262.6 267.514 M106 02/12/92 14:35 0.49 7.14 621.9 0.00 26.2 105.3 145.4 828.7 0.77 5.51 68.0 178.6 275.515 M106 02/12/92 15:35 0.46 7.15 638.8 0.00 28.2 120.1 144.8 796.1 0.01 0.00 73.4 254.0 278.716 M106 02/12/92 16:35 0.44 7.17 628.2 0.00 29.5 127.1 199.7 608.6 2.64 0.57 63.9 571.7 255.717 M106 02/13/92 15:07 0.35 7.04 666.8 0.00 27.8 124.4 148.1 820.3 0.00 0.00 68.1 282.9 270.918 M106 02/14/92 11:22 0.44 6.87 632.8 0.00 27.9 121.4 145.6 811.1 0.12 0.00 67.2 249.2 283.219 M106 02/16/92 09:26 0.90 7.01 605.9 0.00 27.9 116.0 137.5 760.7 0.10 0.09 55.0 270.0 271.920 M106 02/19/92 15:56 1.12 7.25 622.6 0.00 27.4 112.3 134.7 732.2 0.00 0.00 52.9 305.7 261.921 M106 02/19/92 16:15 1.28 6.91 601.1 0.00 29.5 107.1 131.9 680.3 0.00 0.15 52.6 323.0 290.422 M106 02/19/92 17:15 1.59 6.90 575.1 0.00 27.1 100.7 120.6 692.8 0.00 0.32 49.7 252.2 258.423 M106 02/19/92 18:15 1.88 6.59 568.0 0.00 26.3 98.5 121.1 696.2 0.00 0.00 47.3 242.7 277.024 M106 02/19/92 19:15 2.01 6.68 570.8 0.00 27.3 98.7 116.1 651.7 0.11 0.00 45.2 285.5 251.125 M106 02/19/92 20:15 2.16 6.33 557.7 0.00 25.7 96.1 113.1 668.3 0.00 0.00 44.0 245.7 247.526 M106 02/19/92 21:15 2.31 6.85 570.7 0.00 27.1 96.9 115.6 641.8 0.00 0.00 43.2 294.4 247.527 M106 02/19/92 22:15 2.64 6.14 561.2 0.00 26.6 94.6 112.6 595.0 1.12 0.00 41.8 322.5 241.528 M706 02/19/92 23:15 3.00 7.04 538.8 0.00 27.4 92.7 109.9 617.3 0.00 0.00 39.0 276.0 232.329 M106 02/20/92 00:15 3.08 6.82 552.4 0.00 27.2 93.3 118.5 632.0 0.00 0.00 37.9 295.3 224.530 M706 02/20/92 01:15 3.09 6.84 562.4 0.00 28.5 96.7 111.6 668.7 0.50 0.00 37.0 264.3 225.831 M106 02/20/92 02:15 3.08 7.08 580.8 0.00 30.4 96.6 114.3 366.0 1.37 0.00 37.8 590.0 239.132 M106 02/20/92 03:15 3.03 6.87 560.5 0.00 26.8 95.4 113.2 615.3 0.00 0.00 38.1 313.0 245.633 M106 02/20/92 03:45 2.98 6.98 541.6 0.00 27.2 92.6 102.2 666.0 0.38 0.24 40.0 211.8 231.634 M106 02/20/92 04:15 2.90 7.09 506.1 0.00 26.6 89.4 109.5 673.7 0.12 0.00 37.6 181.6 226.535 M106 02/20/92 05:15 2.83 6.81 551.5 0.00 27.9 94.2 113.3 697.5 0.00 0.08 37.0 223.0 267.836 M106 02/20/92 06:15 2.79 6.69 541.1 0.00 27.1 96.8 115.5 665.9 0.06 0.00 37.7 251.5 230.037 M106 02/20/92 07:15 2.72 6.56 537.9 0.00 26.5 95.0 112.5 685.3 1.16 0.00 37.0 218.9 231.238 M106 02/20/92 08:15 2.66 6.82 530.0 0.00 26.9 92.8 112.9 685.7 0.07 0.00 37.4 207.8 231.639 M106 02/20/92 09:15 2.60 7.03 526.4 0.00 26.1 91.2 110.7 737.1 0.24 0.08 37.3 144.3 231.740 M106 02/20/92 10:15 2.51 6.25 550.7 0.00 26.6 95.9 110.3 722.2 0.52 0.00 38.1 190.7 234.541 M106 02/20/92 11:45 2.39 6.90 563.4 0.00 28.5 99.3 117.0 682.9 0.00 0.19 38.6 264.4 259.642 M106 02/20/92 12:45 2.31 6.91 524.2 0.00 25.4 94.4 112.2 778.9 0.14 0.31 38.3 107.0 235.443 M106 02/20/92 13:45 2.23 6.65 540.5 0.00 27.0 97.6 118.5 770.0 0.08 0.10 37.4 154.7 264.644 M106 02/20/92 14:45 2.13 6.87 576.2 0.00 28.5 100.5 125.0 712.3 0.00 0.25 39.5 264.2 269.345 M106 02/20/92 15:45 2.04 6.76 584.9 0.00 27.9 103.4 121.0 732.7 0.00 0.14 37.9 253.0 265.346 M106 02/20/92 16:45 1.94 6.84 578.3 0.00 27.8 101.6 124.4 766:0 0.00 0.16 39.7 212.5 265.347 M106 02/20/92 17:45 1.86 6.79 598.8 0.00 27.3 102.0 125.2 775.0 0.00 0.00 38.4 228.6 270.848 M106 02/20/92 18:45 1.78 6.71 578.0 0.00 28.6 103.5 121.6 699.4 0.13 0.19 39.1 278.8 243.649 M106 02/20/92 19:45 1.70 6.23 582.1 0.00 29.2 103.5 122.2 755.4 0.09 0.10 39.1 228. 242.450 M106 02/20/92 20:45 1.62 6.76 562.2 0.00 27.5 103.5 123.2 719.1 0.19 0.14 39.8 244.0 245.651 M106 02/20/92 21:45 1.55 6.58 578.1 0.00 27.1 103.0 123.9 762.5 0.20 0.14 39.8 216.5 243.452 M106 02/20/92 22:45 1.49 6.83 584.3 0.00 28.6 105.4 127.0 777.7 0.00 0.00 39.8 220.4 275.553 M106 02/24/92 14:02 0.22 6.61 708.7 0.00 30.7 134.2 155.6 928.1 0.00 0.17 54.6 281.4 299.354 M106 03/05/92 10:15 0.06 6.96 720.3 0.00 35.2 147.5 173.9 998.7 0.14 0.00 71.6 256.5 329.855 M106 03/13192 10:28 0.04 6.96 736.0 0.00 33.4 159.6 174.8 1019.0 0.34 0.00 79.1 260.7 323.256 M106 03/15/92 11:28 1.22 6.76 642.9 0.00 31.0 104.9 129.3 636.9 0.00 0.00 60.2 384.9 262.257 M106 03/16/92 04:35 2.36 6.30 553.2 0.00 30.5 98.3 102.7 615.5 0.21 0.05 44.7 280.6 239.758 M106 03/16/92 05:35 2.70 6.88 566.2 0.00 29.6 91.8 111.5 599.9 0.10 0.00 42.3 317.8 244.359 M106 03/16/92 06:35 2.86 6.69 623.6 0.00 28.5 105.8 109.8 628.3 0.12 0.00 41.9 371.1 231.360 M106 03/16/92 07:35 2.92 6.83 560.1 0.00 29.8 90.9 112.1 610.4 0.44 0.18 40.7 303.5 240.561 M106 03/16/92 08:35 3.05 6.04 635.6 0.00 27.7 93.0 109.9 577.2 0.14 0.17 38.7 414.3 238.062 M106 03/16/92 09:35 3.31 6.80 555.4 0.00 30.0 90.6 109.0 577.9 1.19 0.00 38.3 328.9 231.663 M106 03/16/92 10:35 3.59 6.73 610.8 0.00 28.9 90.7 109.9 558.3 0.16 0.00 35.8 411.0 225.064 M106 03/16/92 11:35 3.72 6.93 540.5 0.00 29.5 90.8 106.1 638.0 0.00 0.32 36.8 252.0 223.265 M106 03/16/92 12:35 3.76 6.76 555.6 0.00 28.3 92.6 108.9 622.1 1.40 0.00 35.0 293.3 221.366 M106 03/16192 13:35 3.76 6.27 623.1 0.00 28.6 93.1 109.8 606.6 0.10 9.06 34.5 381.5 225.967 M106 03/16/92 14:35 3.72 6.79 559.5 0.00 30.9 91.5 109.9 623.8 0.12 0.00 35.5 298.3 227.568 M106 03/16/92 15:35 3.68 6.83 565.0 0.00 28.3 92.7 109.8 597.3 0.22 0.14 34.7 331.3 228.369 M106 03/16/92 19:25 3.30 6.65 579.0 0.00 31.6 93.9 112.1 657.1 0.21 0.05 35.6 294.0 233.570 M106 03/17/92 15:20 1.58 6.65 634.9 0.00 31.4 105.8 126.4 767.0 0.34 0.09 41.3 280.8 261.8147
Caspar Creek - Watershed MUN - Pipeflow# ID DATE TIME Flow pH Na NH4 K Mg Ca CI NO3 PO4 SO4 HCO3 SiL/s µM µM µM µM µM µM µM µM µM µM µM71 M106 03/19/92 15:40 0.28 6.81 684.7 0.00 30.0 125.7 150.0 864.0 0.15 0.06 49.4 303.1 293.472 M106 03/24/92 14:05 0.06 7.03 695.2 0.00 34.1 147.8 172.2 970.0 0.22 0.00 57.2 284.6 321.773 M106 03/26/92 09:50 0.06 7.02 743.6 0.00 32:7 153.2 179.2 984.0 0.70 0.09 60.3 335.8 329.674 M106 04/02/92 11:00 0.03 7.18 745.9 0.00 34.6 160.3 187.7 1027.0 0.22 0.08 68.4 312.4 333.275 M706 04/15/92 10:05 0.03 6.77 834.2 0.00 39.9 180.1 222.4 998.1 0.00 0.00 83.7 513.7 345.976 M106 04/22/92 09:11 0.06 6.86 816.2 0.00 40.2 158:5 195.9 931.3 0.00 0.00 76.6 480.6 344.277 M106 05/01/92 10:35 0.02 6.85 881.5 0.00 40.3 172.1 214.4 972.2 0.00 0.00 85.4 531.9 355.178 M106 05/07/92 14:20 0.02. 7.02 766.5 0.00 36.4 176.4 213.3 994.2 0.00 0.00 87.1 413.8 368.879 M106 05/18/92 13:40 0.01 6.55 783.3 0.00 36.5 180.1 216.2 1061.8 0.00 0.00 92.1 366.4 372.780 M106 06/01/92 12:40 0.01 6.65 809.4 0.00 37.5 175.8 224.6 1091.1 0.00 0.00 100.4 355.6 381.381 M106 06/18/92 09:26 0.01 7.10 836.5 0.00 37.3 192.0 237.7 1043.4 0.00 0.12 108.0 473.7 364.282 M106 07/29/92 15:00 0.00 7.19 894.7 0.00 99.1 197.9 257.0 1102.0 0.00 0.00 122.0 497.6 385.283 M106 09/03/92 14:00 0.00 6.86 871.0 0.00 44.5 147.1 247.7 1101.2 0.00 0.00 128.0 348.0 373.184 M106 11/03/92 14:30 0.00 6.68 974.3 0.00 42.5 218.0 266.0 1661.0 0.00 0.00 103.0 117.8 353.485 M106 12/30/92 12:52 0.60 6.74 710.7 0.00 30.7 134.1 169.2 897.9 0.00 0.00 59.6 330.9 297.886 M106 05/24/93 11:45 0.04 7.08 908.5 0.00 36.4 195.5 260.2 1024.8 0.00 0.00 71.3 688.7 359.987 M106 12/18/94 11:52 0,00 7.11 782.5 0.00 30.4 155.5 196.4 1066.2 0.00 0.76 101.3 247.2 249.688 M106 01/05/95 11:20 0.00 6.87 763.4 0.00 31.2 147.3 185.1 1043.8 0.00 0.00 103.1 209.5 291.189 M106 02/07/95 12:35 0.01 6.39 725.6 0.00 29.4 212.2 183.0 1067.2 0.00 0.00 42.3 393.5 300.890 M106 02/20/95 11:20 0.00 6.42 559.3 0.00 20.8 155.7 184.8 910.6 0.00 0.00 46,8 256,9 322.291 M106 03/11/95 15:05 miss<strong>in</strong>g 6.76 518.5 0.00 31.6 127.9 183.4 844.6 0.00 0.00 35.7 256.8 255.392 M10604 03/16/92 20:35 3.21 6.52 626.5 0.00 30.5 103.9 118.5 650.7 0.17 0.18 36.4 377.9 226.793 M10606 03/16/92 21:35 3.12 6.80 577.7 0.00 31.2 96.1 116.9 677.8 0.45 0.29 36.0 284.3 237.294 M10608 03/16/92 22:35 3.03 6.82 581.9 0.00 30.9 95.4 115.5 667.2 0.00 0.00 36.0 295.4 225.095 M10610 03/16/92 23:35 2.93 6.81 592.2 0.00 31.4 97.2 118.7 666.7 0.13 0.00 37.3 313.8 239.396 M10612 03/16/92 00:35 2.81 6.69 582.3 0.00 30.6 101.1 120.2 656.7 0.20 0.00 36.8 325.0 233.597 M10616 03/17/92 02:35 2.62 6.92 576.4 0.00 30.8 101.6 125.3 667.1 0.05 0.09 36.6 320.7 234.798 M10618 03/17/92 03:35 2.51 6.79 588.4 0.00 30.8 103.2 121.5 681.6 0.70 0.12 36.8 312.6 237.999 M10620 03/17/92 04:35 2.42 6.85 590.4 0.00 31.8 110.3 126.5 671.6 0.15 0.00 37.2 349.8 236.3100 M10622 03/17/92 05:35 2.32 6.72 588.0 0.00 31.2 103.2 127.0 695.3 0.35 0.11 37.7 308.6 238.2101 M10602 03/16/92 19:35 3.31 6.07 633.5 0.00 29.3 96.9 114.7 616.4 0.14 0.00 35.9 397.8 232.4102 M10614 03/17/92 01:35 2.72 7.06 606.6 0.00 31.2 101.9 118.8 719.9 0.17 0.00 36.5 286.0 239.9103 M10624 03/17/92 06:35 2.23 6.79 604.7 0.00 29.8 104.2 122.8 655.5 0.58 0.49 37.1 357.7 251.9104 01M10602 12/06/93 17:24 0.05 7.21 878.6 0.00 38.4 189.2 234.5 1449.0 0.00 0.00 89.0 137.5 233.4105 01M70604 12106/93 18:24 0.06 7.16 852.5 0.00 46.0 185.1 229.5 1479.0 1.00 0.00 84,0 79.9 299.8106 01M10606 12/06/93 19:24 0.09 7.13 874.3 0.00 40.9 193.3 237.0 1465.0 0.00 0.00 83.0 144.9 306.7107 01M10608 12/06/93 20:24 0.09 7.22 848.2 0.00 40.9 185.1 232.0 1436.0 0.00 0.00 81.0 125.4 302.7108 01M10610 12/06/93 21:24 0.09 7.14 843.8 0.00 38.4 185.1 229.5 1437.0 0.00 1.00 83.0 107.5 339.6109 01M10612 12/06/93 22:24 0.08 7.15 843.8 0.00 40.9 181.0 227.0 1403.0 0.00 0.00 83.0 131.8 307.8110 01M10614 12/06/93 23:24 0.08 7.17 835.1 0.00 38.4 181.0 224.6 1305.0 0.00 0.00 84.0 211.6 321.6111 01M10616 12/07/93 00:24 0.07 7.13 843.8 0.00 38.4 181.0 224.6 1302.0 0.00 0.00 85.0 221.3 310.6112 01M10618 12/07/93 01:24 0.06 7.14 835.1 0.00 35.8 181.0 222.1 1274.0 0.00 0.00 86.0 231.1 312.1113 01M10620 12/07/93 02:24 0.06 7.11 839.5 0.00 38.4 181.0 222.1 1288.0 0.00 1.00 86.0 223.0 307.6114 01M10622 12/07/93 03:24 0.06 7.11 852.5 0.00 38.4 181.0 222.1 1263.0 0.00 0.00 86.0 262.0 317.4115 01M10624 12/07/93 04:24 0.05 7.13 848.2 0.00 38.4 181.0 222.1 1291.0 0.00 0.00 87.0 227.7 313.9116 02M10604 12/07/93 12:24 0.05 6.93 848.2 0.00 35.8 172.8 199.6 1336.5 0.00 1.00 89.0 113.2 202.0117 02M10604 12/07/93 13:24 0.05 6.76 839.5 0.00 35.8 176.9 217.1 1382.0 0.00 1.00 92.0 96.2 329.5118 02M10606 12/07/93 14:24 0.05 5.92 852.5 0.00 38.4 181.0 222.1 1369.0 0.00 1.00 89.0 149.0 329.3119 02M10608 12/07/93 15:24 0.05 6.28 843.8 0.00 38.4 176.9 217.1 1362.0 0.00 0.00 89.0 130.1 316.5120 02M10610 12/07/93 16:24 0.05 6.46 839.5 0.00 38.4 176.9 217.1 1344.0 0.00 0.00 91.0 139.8 354.5121 02M10612 12/07/93 17:24 0.05 6.73 843.8 0.00 38.4 176.9 217.1 1353.0 0.00 0.00 92.0 133.1 317.1122 02M10616 12/07/93 18:24 0.04 6.75 835.1 0.00 35.8 176.9 217.1 1333.0 0.00 0.00 92.0 141.8 358.8123 02M10618 12/07/93 19:24 0.04 6.80 843.8 0.00 35.8 176.9 217.1 336.0 0.00 0.00 93.0 145.5 362.9124 02M10620 12/07/93 20:24 0.04 6.85 843.8 0.00 35.8 176.9 217.1 1334.0 0.00 0.00 93.0 147.5 316.8125 10M10602 12/31/92 14:45 11.00 6.98 423.2 0.00 35.0 84.3 110.0 516.8 0.00 0.00 27.6 275.0 165.5126 10M10606 12/31/92 18:45 12.05 6.79 450.6 0.00 36.3 90.5 118.0 574.7 0.00 0.00 25.2 278.9 172.3127 10M10614 01/01/93 02:45 8.22 6.94 502.8 0.00 35.3 105.3 137.0 682.6 0.00 0.00 25.1 289.9 188.3128 11M10602 01/01/93 11:15 5.16 6.97 545.0 0.00 34.5 111.1 138.2 752.7 0.00 0.00 26.7 272.0 202.5129 11M10608 01/01/93 23:15 2.81 6.82 590.3 0.00 33.2 120.9 153.7 798.0 0.00 0.50 29.9 314.5 227.7130 11M10614 01/02/93 11:15 1.46 6.88 629.4 0.00 32.0 126.7 162.7 836.7 0.00 0.00 33.4 336.6 251.7131 3M10602T 12/08/92 11:45 0.24 6.74 709.9 0.00 37.9 139.4 174.2 1013.0 0.00 1.00 72.0 216.9 296.5132 3M10604T 12/08/92 12:45 0.30 6.79 701.2 0.00 33.0 137.4 172.7 989.0 0.00 0.00 74.0 217.3 276.5133 3M10606T 12/08/92 13:45 0.41 6.87 678.1 0.00 33.5 130.4 163.4 956.0 0.00 0.00 70.0 203.3 275.0134 3M10608T 12/08/92 14:45 0.56 6.86 649.0 0.00 32.0 122.6 154.9 918.0 0.00 0.00 65.0 188.0 277.2135 3M10610T 12/08/92 15:45 0.74 6.85 631.6 0.00 31.2 118.9 148.0 846.0 0.00 0.00 62.0 226.5 260.0136 3M10612T 12/08/92 16:45 0.87 6.81 620.3 0.00 31.5 116.4 143.0 851.0 0.00 0.00 60.0 199.5 248.1137 3M10614T 12/08/92 17:45 1.07 6.78 803.3 0.00 31.2 114.4 140.2 799.0 0.00 0.00 57.0 230.7 247.2138 3M10616T 12/08/92 18:45 1.10 6.83 585.0 0.00 32.5 110.2 136.5 759.0 0.00 0.00 85.0 242.0 234.4139 3M10618T 12/08/92 19:45 1.05 6.84 601.1 0.00 30.7 112.7 139.2 791.0 0.00 0.00 54.0 236.7 233.3140 3M10620T 12/08/92 20:45 0.87 6.80 602.8 0.00 31.2 114.8 140.5 829.0 0.00 0.00 56.0 203.5 231.4141 3M10622T 12/08/92 21:45 0.89 6.75 615.1 0.00 31.7 117.2 143.0 840.0 0.00 0.00 56.0 215.2 238.7142 3M10624T 12/08/92 22:45 0.83 6.74 623.3 0.00 31.5 118.1 143.7 818.0 0.00 0.00 57.0 246.3 240.9148
Caspar Creek - Watershed MUN – Pipeflow# ID DATE TIME Flow pH Na NH4 K Mg Ca Cl NO3 PO4 SO4 HCO3 SiL/s µM µM µM µM µM µM µM µM µM µM µM143 4M10603T 12/09/92 02:05 0.62 6.71 622.4 0.00 34.8 119.7 148.5 844.0 0.00 0.00 59.0 231.5 242.2144 4M10606T 1210092 05:05 0.47 6.61 644.6 0.00 31.5 127.1 157.9 866.0 0.00 0.00 62.0 256.2 244.8145 4M10609T 12/09/92 08:05 0.42 6.57 643.8 0.00 32.5 129.2 160.7 865.0 0.00 0.00 63.0 264.9 256.8146 4M10612T 12/09/92 11:05 0.42 6.65 649.8 0.00 33.0 130.0 160.4 882.0 0.00 0.00 65.0 251.7 260.8147 4M10615T 12/09/92 14:05 0.41 6.64 658.1 0.00 32.7 131.2 162.4 912.0 0.00 0.00 65.0 236.1 267.7148 5M10602T 12/09/92 18:05 0.35 6.77 668.1 0.00 33.2 134.9 163.7 877.0 0.00 0.00 66.0 289.6 266.7149 5M10604T 12/09/92 20:05 0.43 6.68 661.6 0.00 35.8 130.8 159.4 883.0 0.00 0.00 65.0 264.9 273.0150 5M10606T 12/09/92 22:05 0.46 6.67 654.2 0.00 33.2 130.8 158.7 844.0 0.00 0.00 64.0 294.4 266.5151 5M10608T 12/10/92 00:05 0.53 6.64 652.9 0.00 34.5 130.4 158.7 849.0 0.00 0.00 64.0 288.6 265.1152 5M10610T 12/10/92 02:05 0.55 6.60 659.0 0.00 35.8 130.4 157.2 845.0 0.00 0.00 62.0 301.0 269.1153 5M10612T 12/10/92 04:05 0.54 6.90 655.9 0.00 33.0 130.4 158.4 864.0 0.00 0.00 63.0 276.6 263.8154 5M10614T 12/10/92 06:05 0.60 7.06 654.6 0.00 32.7 130.8 157.7 852.0 0.00 0.00 62.0 288.4 266.3155 5M10616T 12/10/92 08:05 0.77 7.03 630.3 0.00 32.5 125.5 151.4 821.0 0.00 0.00 59.0 277.6 265.1156 5M10618T 12/10/92 10:05 2.23 7.30 535.9 0.00 32.0 97.5 125.5 621.0 0.00 0.00 45.0 302.8 259.0157 5M10620T 12110/92 12:05 2.38 7.16 525.9 0.00 31.5 96.7 121.0 605.0 0.00 0.00 42.0 303.7 214.7158 5M10622T 12110/92 14:05 2.33 6.91 536.8 0.00 32.7 100.8 125.7 665.0 0.00 0.00 42.0 273.6 210.6159 5M10624T 12/10/92 16:05 2.29 6.91 547.6 0.00 31.7 103.2 127.0 673.0 0.00 0.00 41.0 284.8 209.4160 5M10603T 12/10/92 20:05 1.94 6.84 567.2 0.00 35.3 105.3 126.5 673.0 0.00 0.00 41.0 311.1 216.0161 5M10606T 12/10/92 23:05 1.61 6.75 581.6 0.00 36.8 109.8 134.0 725.0 0.00 0.00 43.0 295.0 219.0162 5M10609T 12/11/92 02:05 1.39 6.73 585.0 0.00 31.5 111.9 136.5 741.0 0.00 0.00 43.0 286.2 226.0163 5M10612T 12/11/92 05:05 1.18 7.09 594.2 0.00 31.7 115.6 140.5 754.0 0.00 0.00 45.0 294.0 222.8164 5M10615T 12/11/92 08:05 1.05 7.01 599.4 0.00 31.2 116.0 141.2 769.0 0.00 0.00 45.0 286.0 235.5165 7M10602 12/29/92 09:12 0.36 6.83 724.7 0.00 30.7 141.9 181.4 925.2 0.00 0.00 78.3 320.2 307.3166 7M10604 12/29/92 10:12 0.39 6.86 720.3 0.00 30.9 140.3 178.9 899.7 0.00 0.00 78.3 333.3 300.7167 7M10606 12/29/92 11:12 0.41 6.87 690.3 0.00 30.7 131.2 189.9 868.3 0.00 0.00 75.4 344.1 299.3168 7M10608 12/29/92 12:12 0.43 6.86 713.8 0.00 30.4 137.0 173.9 899.0 0.00 0.00 76.3 314.4 295.8169 7M10610 12/29/92 13:12 0.48 6.94 727.3 0.00 31.7 139.0 168.4 893.6 0.00 0.00 75.5 329.3 302.6170 7M10612 12/29/92 14:12 0.52 6.76 700.7 0.00 30.2 135.3 170.7 861.7 0.00 0.00 73.8 333.6 278.1171 7M10614 12/29/92 15:12 0.56 7.07 724.7 0.00 31.7 146.9 187.1 854.3 0.50 0.00 72.8 423.9 300.6172 7M10616 12/29/92 16:12 0.58 6.93 697.7 0.00 29.9 135.3 169.7 841.7 0.00 0.00 71.7 352.5 293.8173 7M10618 12/29/92 17:12 0.61 6.89 781.2 0.00 35.3 134.9 158.7 859.4 0.00 0.00 70.1 404.1 297.3174 7M10620 12/29/92 18:12 0.63 6.95 691.2 0.00 31.5 134.1 169.9 808.0 0.00 0.00 69.7 383.3 287.5175 7M10622 12/29/92 19:12 0.65 6.89 776.4 0.00 33.8 132.0 160.4 826.3 0.00 0.00 68.5 431.8 286.1176 7M10624 12/29/92 20:12 0.67 6.93 745.1 0.00 33.8 141.9 170.4 868.7 0.00 0.00 68.0 398.8 306.8177 8M10602A 12/31/92 03:31 0.92 6.87 662.5 0.00 30.7 126.7 157.7 757.3 0.00 0.00 57.5 389.6 281.3178 8M10606A 12/31/92 05:31 1.51 6.92 631.6 0.00 29.2 115.6 146.0 692.6 0.00 0.00 53.3 384.6 263.8179 9M10604T 12/31/92 08:15 2.38 6.97 575.9 0.00 27.6 106.1 133.0 624.9 0.00 0.00 46.9 363.1 238.7180 9M10608T 12/31/92 10:15 3.43 6.81 533.7 0.00 26.3 95.0 120.8 562.9 0.00 0.00 40.0 348.7 218.4181 9M10612T 12/31/92 12:15 7.64 6.88 429.8 0.00 30.2 81.4 106.3 500.3 0.00 0.00 29.5 276.1 174.3182 M103 01/13/95 10:00 0.13 6.58 577.1 0.00 35.2 113.7 151.5 799.2 0.00 0.00 25.5 292.4 173.4183 M103 01/14/95 10:00 0.32 6.44 559.0 0.00 33.4 102.1 133.4 715.6 0.71 0 00 28.3 290.5 175.4149
Caspar Creek Soil Soluti<strong>on</strong>sCollect Treat Site Depth Date pH Na NH4 K Mg Ca CI NO3 PO4 SO4 Sicm µM µM µM µM µM µM µM µM µM µM1 Forest 1 20 01/08/94 7.52 448.6 0.00 323.7 90.3 197.7 288.7 5.45 0.00 30.8 67.81 Forest 1 20 01/08/94 6.87 443.5 0.00 149.0 115.1 208.3 318.2 1.85 0.00 40.9 105.61 Forest 2 20 01/08/94 7.17 215.9 0.00 116.5 100.4 243.6 577.6 0.67 0.00 31.9 66.61 Forest 2 20 01/08/94 7.14 294.7 0.00 121.0 110.4 237.8 584.4 0.65 0.00 31.6 74.11 Forest 3 20 01/08/94 6.92 201.2 1.00 76.5 90.6 169.4 216.0 1.06 0.54 36.2 96.21 Forest 3 20 01/08/94 6.98 214.0 0.00 56.7 85.1 164.1 164.6 0.35 0.50 24.2 92.71 Forest 1 40 01/08/94 7.32 667.1 '0.00 163.4 121.3 235.2 798.8 0.85 0.00 42.4 71.81 Forest 2 40 01/08/94 7.03 378.1 0.00 95.6 105.8 243.5 720.3 0.39 0.00 20.5 139.71 Forest 3 40 01/08/94 6.70 329.9 0.00 81.5 111.7 185.6 370.8 0.00 0.00 32.3 180.01 Forest 1 60 01/08/94 7.26 453.7 0.00 101.2 90.2 152.2 310.8 8.68 0.00 73.8 108.41 Forest 2 60 01/08/94 7.07 329.8 0.00 79.0 116.8 188.7 320.9 0.00 0.00 43.4 108.61 Forest 3 60 01/08/94 6.83 314.6 0.00 34.0 67.4 139.6 320.6 0.38 0.00 18.1 110.81 Cut 4 20 01/08/94 6.79 235.2 0.00 160.2 122.9 205.7 324.7 0.89 1.99 30.6 70.01 Cut 5 20 01/08/94 6.91 222.5 0.00 585.7 77.4 298.2 365.1 0.85 8.39 16.8 96.51 Cut 5 20 01/08/94 6.70 116.2 0.00 67.3 80.6 194.2 117.5 2.26 0.96 13.4 114.41 Cut 6 20 01/08/94 6.94 308.7 0.00 84.6 88.2 157.4 221.2 0.00 2.08 23.9 80.71 Cut 4 40 01/08/94 7.38 451.6 0.00 56.7 76.2 102.5 156.8 0.00 0.00 36.1 143.61 Cut 5 40 01/08/94 7.28 314.4 0.00 298.1 102.4 201.7 444.7 0.36 14.26 54.1 74.21 Cut 6 40 01/08/94 6.87 127.7 0.00 59.7 45.5 76.5 116.0 0.44 0.00 15.0 65.11 Cut 4 60 01/08/94 7.59 456.3 0.00 33.1 54.9 91.3 142.3 0.43 0.60 16.1 104.01 Cut 5 60 01/08/94 6.87 296.3 0.00 51.6 61.4 79.7 238.0 0.00 0.47 25.3 65.31 Cut 6 60 01/08/94 6.59 124.9 1.34 51.1 45.4 70.3 189.8 0.90 0.00 10.6 160.02 Forest 2 20 01/29/94 6.25 313.6 2.73 136.4 151.2 345.5 1083.1 1.41 0.00 23.5 68.62 Forest 2 20 01/29/94 6.14 256.5 0.00 123.5 124.3 289.0 761.9 6.62 0.00 37.1 65.32 Forest 3 20 01/29/94 6.66 209.2 18.06 58.9 81.5 165.7 239.5 0.87 0.00 22.8 90.82 Forest 2 40 01/29/94 6.64 355.7 12.14 84.1 88.5 211.5 637.5 0.74 0.00 29.8 80.12 Forest 3 40 01/29/94 6.60 349.3 0.00 51.8 74.8 181.0 553.0 0.00 0.00 12.8 139.02 Forest 2 60 01/29/94 6.63 295.7 0.00 70.1 86.0 145.9 311.1 0.83 0.00 23.8 151.02 Forest 3 60 01/29/94 6.91 283.5 12.14 35.8 73.7 133.9 304.9 0.41 0.00 15.9 116.82 Cut 4 20 01/29/94 6.53 283.5 14.29 250.1 101.6 194.0 205.2 24.77 2.30 35.7 60.92 Cut 5 20 01/29/94 6,48 86.6 8.40 55.2 79.0 210.2 103.3 0.00 1.28 9.1 37.72 Cut 5 20 01/29/94 6.55 124.6 50.24 212.1 63.6 234.0 237.2 0.88 11.59 19.1 32.92 Cut 6 20 01/29/94 6.79 79.7 3.41 40.9 42.4 90.7 93.5 3.48 0.00 18.8 44.72 Cut 4 40 01/29/94 6.80 412.3 4.81 41.9 67.2 95.5 234.4 0.70 0.00 26.6 112.72 Cut 5 40 01/29/94 6.55 243.9 3.57 109.0 103.3 213.7 490.0 0.00 4.42 17.3 99.12 Cut 6 40 01/29/94 6.52 99.3 3.04 57.7 49.3 83.9 100.8 2.97 0.00 12.9 56.02 Cut 4 60 01/29/94 6.77 383.4 0.00 19.9 63.8 103.0 186.3 0.85 1.08 10.4 76.92 Cut 5 60 01/29/94 6.50 308.7 1.43 39.9 70.0 80.5 278.2 0.00 0.00 19.3 50.32 Cut 6 60 01/29/94 6.96 128.4 0.00 43.0 49.3 70.5 164.3 0.00 0.00 10.6 45.13 Forest 1 20 02/19/94 7.01 376.6 0.00 104.9 82.3 194.0 174.9 0.62 0.00 32.6 22.43 Forest 1 20 02/19/94 7.19 387.2 0.00 107.4 82.4 203.5 238.2 0.51 0.00 39.9 22.53 Forest 2 20 02/19/94 6.81 183.1 0.00 83.4 65.2 176.0 173.7 0.72 0.00 32.5 1.43 Forest 2 20 02119/94 6.72 122.6 0.00 64.1 49.1 151.8 102,7 0.71 0.00 24.3 0.03 Forest 3 20 02/19194 6.84 137.5 1.86 35.0 57.0 135.1 114.8 0.00 0.00 18.3 8.53 Forest 3 20 02/19/94 6.92 168.7 0.00 36.9 67.3 154.1 132.0 1.11 0.00 12.9 19.43 Forest 1 40 02/19/94 7.18 541.6 0.00 114.9 94.3 210.9 579.3 0.00 0.00 38.4 4.03 Forest 2 40 02/19/94 6.33 231.6 0.00 53.1 49.2 140.7 197.5 0.60 0.00 47.2 67.43 Forest 3 40 02/19/94 6.32 303.6 0.00 40.1 62.0 163.2 449.6 0.95 0.00 15.1 83.53 Forest 1 60 02/19/94 7.05 526.5 0.00 71.4 83.5 169.3 599.8 1.01 0.00 41.1 13.83 Forest 2 60 02/19/94 6.39 254.5 0.00 45,0 74.6 150.8 233.5 0.00 0.00 32.5 18.53 Forest 3 60 02/19/94 6.24 241.8 0.00 25.5 62.0 140.9 180.0 0.00 0.00 21.0 33.33 Cut 4 20 02/19/94 6.82 175.2 0.00 176.0 63.7 139.9 72.4 1.23 0.00 . 14.4 0.03 Cut 5 20 02/19/94 6.32 76.9 0.00 52.0 80.6 221.5 72.5 1.28 0.00 5.4 0.03 Cut 5 20 02/19/94 6.44 97.8 0.00 144.2 53.0 196.2 85.3 0.00 3.85 10.9 0.03 Cut 6 20 02/19/94 6.86 65.7 1.77 33.7 34.8 74.3 45.2 4.62 0.00 18.5 0.03 Cut 4 40 02/19/94 6.59 401.4 0.00 24.3 58.3 88.6 280.0 1.67 0.00 21.2 40.43 Cut 5 40 02/19/94 6.52 179.8 0.00 48.0 74.9 181.4 234.7 0.00 0.00 20.6 1.23 Cut 6 40 02/19/94 6.69 98.0 0.00 52.3 42.9 72.5 78.0 5.95 0.00 15.6 24.53 Cut 4 60 02/19/94 6.90 264.7 1.38 17.0 56.4 97.4 69.0 2.94 0.00 15.2 5.83 Cut 5 60 02/19/94 6.48 244.8 0.00 27.8 53.6 73.5 170.4 0.90 0.00 23.3 10.53 Cut 6 60 02/19/94 6.42 96.0 0.00 32.6 37.3 58.1 72.2 0.73 0.00 14.5 0.0150
Caspar Creek Soil Soluti<strong>on</strong>sCollect Treat Site Depth Date pH Na NH4 K Mg Ca CI NO3 PO4 SO4 Sicm µM µM µM µM µM µM µM µM µM µM4 Forest 1 20 01/05/95 7.35 492.8 2.86 151.9 120.6 276.7 765.2 0.00 0.00 63.0 50.54 Forest 1 20 01/05/95 7.01 578.1 0.00 135.0 156.8 361.3 1175.4 0.00 0.00 51.3 38.94 Forest 2 20 01/05/95 6.58 298.0 0.00 102.8 123.0 336.1 710.6 0.00 0.00 43.5 56.44 Forest 2 20 01/05/95 6.83 275.3 0.00 124.2 126.7 233.3 740.7 0.00 0.00 40.1 43.84 Forest 3 20 01/05/95 6.66 179.2 0.00 41.2 67.9 169.2 338.2 0.00 0.00 15.4 53.44 Forest 3 20 01/05/95 6.80 220.5 0.00 45.0 100.4 278.2 503.0 40.17 1.33 11.1 64.14 Forest 1 40 01/05/95 6.57 737.7 0.00 176.7 133.3 267.0 1301.8 0.00 2.34 28.0 48.54 Forest 3 40 01/05/95 6.04 351.0 0.00 46.0 59.2 166.4 616.3 0.00 0.00 7.4 105.44 Forest 1 60 01/05/95 6.45 555.9 0.00 77.2 86.4 176.2 799.6 0.00 0.00 33.2 61.34 Forest 2 60 01/05/95 7.03 308.0 0.00 58.3 89.7 194.4 535.6 0.00 0.00 25.1 63.64 Forest 3 60 01/05/95 6.11 311.4 0.00 37.6 89.3 189.4 656.6 0.00 0.00 1.5 76.84 Cut 4 20 01/05/95 6.64 70.5 2.14 58.6 83.1 231.3 102.9 4.77 1.14 7.5 25.14 Cut 4 20 01/05/95 7.40 77.0 2.14 188.2 52.3 209.1 113.7 2.92 12.86 4.7 7.14 Cut 5 20 01/05/95 6.71 96.1 0.00 91.1 63.0 107.5 212.5 0.00 0.00 10.3 34.44 Cut 4 40 01/05/95 6.63 168.3 0.00 54.2 71.2 156.7 275.4 0.00 1.05 9.2 36.64 Cut 5 40 01/05/95 6.52 99.2 0.00 61.1 70.4 92.8 148.9 0.00 0.00 7.1 41.54 Cut 6 40 01/05/95 6.72 375.8 0.00 24.3 56.0 78.1 343.9 0.00 0.00 13.2 76.74 Cut 4 60 01/05/95 6.24 221.8 0.00 31.5 37.9 46.9 141.4 0.00 0.00 20.1 57.84 Cut 5 60 01/05/95 6.26 104.4 0.00 44.2 43.6 59.9 119.4 0.00 0.00 8.0 32.25 Forest 1 20 02/07/95 6.52 298.6 0.00 129.5 36.6 159.9 201.2 0.55 0.00 21.4 45.45 Forest 1 20 02/07/95 6.34 312.4 0.00 113.2 36.6 164.0 220.0 0.00 0.00 20.8 63.05 Forest 2 20 02/07/95 6.68 221.9 0.00 81.9 24.0 124.0 83.3 0.85 0.00 10.9 48.95 Forest 2 20 02/07/95 6.69 236.8 0.00 95.3 26.9 124.1 112.7 1.22 0.00 18.6 53.86 Forest 2 20 02/19/95 6.78 157.0 0.00 43.3 34.7 112.0 35.9 6.39 0.00 7.3 26.86 Forest 2 20 02/19/95 6.41 102.8 0.29 39.1 26.7 96.7 138.9 1.98 0.00 15.3 47.06 Forest 3 20 02/19/95 6.15 171.0 3.01 22.0 25.2 90.0 148.4 0.00 0.00 54.4 56.06 Forest 3 20 02/19/95 6.12 148.1 0.00 33.5 48.3 139.7 153.5 5.16 0.81 9.4 70.46 Forest 1 40 02/19/95 5.91 322.1 0.00 82.2 63.0 178.7 527.1 0.00 0.00 46.3 45.46 Forest 2 40 02/19/95 6.54 268.1 0.00 87.8 56.4 106.0 82.9 1.07 0.00 21.5 53.06 Forest 3 40 02/19/95 6.31 254.5 0.00 30.1 64.5 178.9 195.2 0.00 0.00 53.9 72.56 Forest 2 60 02/19/95 6.04 178.9 0,00 37.6 54.8 160.1 327.0 0.00 3.45 17.9 101.06 Forest 3 60 02/19/95 6.10 66.6 2.21 39.2 29.7 64.8 317.0 0.00 0.00 57.1 84.66 Cut 4 20 02/19/95 7.02 62.2 0.00 47.1 58.4 197.4 44.7 53.61 2.02 23.6 17.66 Cut 4 20 02/19/95 7.00 671.9 2.36 22.3 121.1 434.4 41.0 2.67 0.86 3.4 27.56 Cut 5 20 02/19/95 6.26 188.1 0.00 24.5 37.9 49.9 56.5 15.94 1.03 54.0 42.06 Cut 4 40 02/19/95 6.21 134.4 0.79 36.7 50.7 144.0 53.1 0.00 0.00 58.1 42.66 Cut 4 60 02/19/95 6.07 492.2 0.00 25.0 155.5 289.8 100.1 23.85 0.00 54.5 41.67 Forest 1 20 03/11/95 7.06 423.7 0.00 80.0 63.2 168.7 190.5 0.00 0.00 21.4 57.07 Forest 1 20 03/11/95 6.68 426.2 0.00 120.8 80.3 209.4 135.3 0.00 0.00 10.3 63.77 Forest 2 20 03/11/95 6.68 186.9 1.85 76.9 53.1 147.1 44.2 0.71 0.00 7.2 47.97 Forest 2 20 03/11/95 6.90 202.8 0.00 53.2 39.3 123.2 66.8 0.91 0.00 11.0 51.07 Forest 3 20 03/11/95 6.97 186.4 4.78 29.0 30.3 88.8 67.0 0.82 0.00 6.6 45.17 Forest 3 20 03/11/95 6.91 115.1 1.86 31.2 40.3 114.8 59.1 16.47 0.00 6.5 61.27 Forest 1 40 03/11/95 6.84 600.6 0.00 77.2 86.2 181.4 201.6 1.44 0.00 36.3 43.57 Forest 2 40 03/11/95 7.07 195.8 0.00 38.5 41.1 135.7 47.5 0.00 0.00 21.5 56.07 Forest 3 40 03/11/95 7.12 242.8 0.00 27.9 49.0 121.2 129.1 1.83 0.00 15.9 86.27 Forest 1 60 03/11/95 6.61 160.4 0.00 66.5 46.3 143.2 750.3 0.00 0.00 38.4 59.97 Forest 2 60 03/11/95 6.44 150.5 9.86 36.7 52.6 134.5 125.2 0.00 0.00 16.3 44.37 Forest 3 60 03/11/95 6.71 50.3 4.81 101.4 36.2 153.2 159.3 0.00 0.00 19.8 78.77 Cut 5 20 03/11/95 6.63 65.1 3.46 52.7 65.2 193.0 12.1 29.82 1.10 1.5 16.07 Cut 5 20 03/11/95 6.69 175.1 0.00 27.5 35.6 71.1 10.6 3.88 0.00 0.9 30.37 Cut 5 40 03/11/95 6.34 50.0 0.00 30.7 18.2 24.3 28.5 0.72 0.00 5.7 22.87 Cut 5 60 03/11/95 6.30 88.0 0.00 22.4 38.0 105.9 35.6 0.00 0.00 15.1 39.0151
Caspar Creek Soil Soluti<strong>on</strong>sCollect Treat Site Depth Date pH Na NH4 K Mg Ca CI NO3 PO4 SO4 Sicm µM µM µM µM µM µM µM µM µM µM8 Forest 1 20 12/17/95 6.88 270.4 0.00 132.2 137.0 308.5 791.0 0.83 0.00 26.5 41.38 Forest 1 20 12/17/95 6.76 231.3 0.00 118.2 112.3 274.3 563.1 0.36 0.00 43.4 35.68 Forest 2 20 12/17/95 6.87 517.8 0.00 192.1 160.1 369.3 1088.0 2.06 0.00 95.7 39.98 Forest 2 20 12/17/95 6.68 1121.3 0.00 210.2 179.4 392.8 1860.5 0.56 0.00 75.9 45.68 Forest 3 20 12/17/95 6.87 277.4 0.00 84.1 151.4 338.9 869.6 0.00 0.00 5.6 59.48 Forest 3 20 12/77/95 8.99 190.0 0.71 55.2 77.4 3.7 308.7 0.76 0.00 7.9 51.28 Forest 1 40 12/17/95 7.02 350.4 0.00 96.2 85.6 210.5 691.2 0.53 0.00 9.1 52.78 Forest 2 40 12/17/95 7.06 780.4 0.00 146.0 142.0 308.2 1526.3 0.00 0.00 20.0 45.28 Forest 3 40 12/17/95 6.96 373.9 0.00 53:5 61.3 172.3 619.0 0.41 0.00 6.1 81.58 Forest 1 60 12/17/95 6.96 408.3 0.00 79.8 113.2 222.4 697.6 0.00 0.00 16.2 48.48 Forest 2 60 12117/95 7.16 540.0 0.00 78.5 70.4 145.1 477.3 0.45 0.00 40.2 44.88 Forest 3 60 12/17/95 6.54 287.4 0.00 35.8 67.1 147.6 328.7 1.01 0.00 9.6 73.38 Cut 4 20 12/17/95 6.56 262.6 0.00 23.0 88.1 184.3 246.8 0.51 4.46 18.5 22.48 Cut 5 20 12/17/95 6.66 62.2 0.00 63.2 67.9 188.3 59.0 0.69 0.00 3.1 18.98 Cut 5 20 12/17/95 6.78 73.9 0.00 212.5 67.5 256.9 112.5 0.36 5.78 4.2 12.58 Cut 6 20 12/17/95 6.88 82.6 0.71 380.3 80.7 154.6 100.2 0.39 16.16 9.0 13.58 Cut 4 40 12/17/95 6.84 310.0 3.57 24.0 47.7 54.6 297.2 0.41 0.00 16.5 77.28 Cut 5 40 12/17/95 6.65 152.2 5.07 53.2 51.0 132.4 53.8 4.03 0.00 12.1 38.88 Cut 6 40 12/17/95 6.77 109.1 0.00 60.4 65.8 110.5 224.7 0.00 0,00 6.7 30.28 Cut 4 60 12/17/95 7.02 188.3 0.00 19.4 72.8 107.7 114.5 0.72 0.00 5.7 51.28 Cut 5 60 12/17/95 6.66 172.6 0.00 31.2 37.9 57.6 48.4 0.00 0.00 13.9 32.48 Cut 6 60 12/17/95 6.65 142.2 8.57 65.5 35.4 41.9 142.4 0.00 0.00 10.8 31.39 Forest 1 20 01/02/96 6.69 153.9 0.00 68.8 44.9 139.7 112.8 0.84 0.00 16.7 29.59 Forest 1 20 01/02/96 6.77 193.0 0.00 98.0 74.9 187.3 285.8 0.79 0.00 33.0 40.69 Forest 2 20 01/02/96 6.96 347.0 0.00 95.9 82.7 209.7 313.6 0.00 0.00 34.2 37.79 Forest 3 20 01/02/96 6.89 263.9 0.00 75.7 118.5 264.1 663.6 0.00 0.00 7.5 66.59 Forest 3 20 01/02/96 7.02 179.1 2.14 56.8 81.5 188.3 359.3 0.69 0.00 7.9 53.49 Forest 1 40 01/02/96 6.96 283.9 0.00 77.2 64.2 173.1 449.8 0.00 0.00 15.5 51.69 Forest 2 40 01/02/96 6.96 656.5 0.00 113.0 105.8 236.4 793.9 0.00 0.00 24.8 45.29 Forest 3 40 01102/96 6.71 303.0 0.00 43.5 48.1 124.7 424.9 0.00 0.00 8.8 72.29 Forest 1 60 01/02/96 7.01 319.1 0.00 48.8 70.0 125.7 387.9 0.00 0.00 16.4 59.49 Forest 2 60 01/02/96 7.04 624.3 0.00 89.8 84.0 169.6 724.3 0.70 0.00 35.3 51.29 Forest 3 60 01/02196 6.68 302.6 0.00 34.3 69.1 152.4 339.4 0.00 0.00 10.5 82.69 Cut 4 20 01/02/96 6.85 253.9 0.00 216.4 85.6 161.1 78.3 10.41 4.37 7.4 23.59 Cut 5 20 01/02/96 6.71 52.6 0.00 57.8 58.4 174.8 57.1 0.73 0.00 3.4 16.09 Cut 5 20 01/02/96 6.83 54.3 0.00 142.5 46.9 187.3 61.2 2.02 0.00 3.8 10.09 Cut 6 20 01/02/96 6.69 115.7 0.00 34.8 37.9 61.1 125.4 0.00 0.00 8.0 34.59 Cut 4 40 01/02/96 6.89 351.7 0.00 27.6 56.8 80.3 324.4 0.00 0.00 11.7 81.59 Cut 5 40 01/02/96 6.76 43.9 1.43 14.3 20.2 59.1 27.7 20.00 0.00. 1.8 0.79 Cut 6 40 01/02/96 6.84 76.1 1.43 44.2 45.7 83.3 166.0 7.58 0.00 6.8 30.29 Cut 4 60 01/02/96 6.99 185.2 0.00 20.2 78.2 107.2 120.0 0.00 0.00 5.3 51.29 Cut 5 60 01/02/96 6.81 172.6 0.00 26.9 35.4 49.6 59.4 0.00 0.00 13.1 30.29 Cut 6 60 01/02/96 6.76 76.5 0.00 82.9 34.2 64.3 97.5 0.00 0.00 4.4 21.410 Forest 1 20 01/20196 6.65 186.5 0.00 77.5 59.7 126.9 92.3 1.01 0.00 11.7 49.110 Forest 1 20 01/20/96 6.92 192.6 0.00 86.7 64.6 144.4 78.4 0.88 0.00 22.2 58.710 Forest 2 20 01/20/96 7.01 436.1 0.00 132.7 104.9 231.4 194.4 0.00 0.00 20.3 59.110 Forest 2 20 01/20/96 7.04 450.0 0.00 95.9 89.7 206.5 187.9 3.24 0.00 22.0 58.710 Forest 3 20 01/20/96 7.06 217.8 0.00 65.5 86.0 184.0 191.2 0.00 0.00 9.0 81.910 Forest 3 20 01/20/96 7.13 197.4 0.00 55.5 77.8 149.6 177.2 0.74 0.00 9.6 78.310 Forest 1 40 01/20/96 6.92 251.3 0.00 66.0 56.0 116.2 126.3 0.00 0.00 20.8 65.510 Forest 2 40 01/20/96 6.99 653.0 0.00 94.1 85.6 180.0 303.8 0.00 0.00 33.1 62.610 Forest 3 40 01/20/96 6.86 340.0 0.00 47.6 51.4 103.7 281.8 0.00 0.00 11.7 100.410 Forest 1 60 01/20/96 7.17 379.6 0.00 50.1 73.3 107.0 254.3 0.00 0.00 18.2 79.010 Forest 2 60 01/20196 7.09 740.4 0.00 82.9 89.7 156.1 717.1 0.00 0.00 31.9 69.410 Forest 3 60 01/20/96 7.00 363.0 0.00 44.5 74.5 135.4 241.3 0.00 0.00 12.3 108.210 Cut 4 20 01/20/96 7.02 193.5 0.00 190.8 74.5 133.9 36.1 36.08 1.75 5.4 57.310 Cut 5 20 01/20/96 7.06 80.4 0.00 148.1 74.9 199.5 25.3 5.58 0.00 2.5 30.610 Cut 5 20 01/20/96 7.06 78.7 0.00 67.5 64.6 181.3 31.2 2.61 0.00 3.0 37.410 Cut 6 20 01/20/96 6.62 91.7 0.00 44.0 36.6 68.6 52.1 5.67 0.00 7.5 51.610 Cut 4 40 01/20/96 6.90 387.4 0.00 29.9 70.0 84.8 238.2 0.00 0.00 11.0 107.110 Cut 5 40 01/20/96 7.24 173.0 0.00 49.6 66.3 122.4 46.9 31.47 0.00 6.3 53.410 Cut 6 40 01120/96 6.70 93.0 0.00 63.7 40.3 58.9 49.0 1.48 0.00 2.5 46.310 Cut 4 60 01/20/96 7.11 203.0 0.00 30.2 88.9 107.5 55.4 1.40 0.00 5.9 80.110 Cut 5 60 01/20/96 6.46 190.9 0.00 35.3 57.6 61.1 48.5 0.00 0.00 11.4 50.210 Cut 6 60 01/20/96 6.65 127.4 0.00 40.4 35.8 59.4 63.9 0.00 0.00 9.5 59.4152
Caspar Creek Soil Soluti<strong>on</strong>sCollect Treat Site Depth Date pH Na NH4 K M Ca CI N03 P04 S04 Sicm µM µM µM µM µM µM µM µM µM µM11 Forest 1 20 02/11/96 6.85 181.3 0.00 74.7 51.9 128.2 118.7 0.74 0.00 9.3 40.611 Forest 1 20 02/11/96 6.68 188.3 0.00 84.4 55.1 142.1 98.2 1.10 0.00 15.7 66.911 Forest 2 20 02/11/96 7.09 387.0 0.00 95.7 87.2 194.3 195.4 2.39 0.00 15.5 49.811 Forest 2 20 02/11/96 6.83 481.3 0.00 160.1 100.8 224.9 249.8 1.86 0.00 17.2 55.511 Forest 3 20 02/11/96 7.02 170.0 0.00 51.4 84.4 133.9 125.1 0.00 0.00 9.1 55.911 Forest 3 20 02/11/96 7.20 186.5 0.00 63.2 6_9.1 166.6 122.8 0.00 0.00 7.2 66.511 Forest 1 40 02/11/96 6.94 233.0 0.00 62.1 51.9 122.2 111.7 0.00 0.00 19.2 59.811 Forest 2 40 02/11/96 7.07 570.9 0.00 88.7 96.7 166.3 180.1 0.00 0.00 20.2 50.511 Forest 3 40 02/11/96 6.41 261.7 0.00 43.5 43.6 98.8 191.1 0.00 0.00 11.9 86.811 Forest 1 60 02/11/96 6.95 329.6 0.00 48.6 72.4 102.2 224.6 0.00 0.00 19.0 71.211 Forest 2 60 02/11/96 7.06 723.5 0.00 98.5 81.9 143.1 35.7 0.00 0.00 7.7 7.511 Forest 3 60 02/11/96 6.90 311.7 0.00 43.0 68.3 133.7 178.0 0.00 0.00 13.4 92.511 Cut 4 20 02/11/96 6.81 157.8 0.00 155.5 68.3 113.5 79.2 10.84 0.00 4.2 37.411 Cut 5 20 02/11/96 6.66 92.2 0.00 44.5 56.0 73.3 59.3 3.21 0.00 7.1 36.311 Cut 5 20 02/11/96 6.61 132.2 0.00 39.4 51.9 65.6 45.3 0.00 0.00 11.7 35.211 Cut 6 20 02/11196 6.99 81.7 0.00 65.7 42.4 1 191.0 48.01 0.00 0.00 1.9 28.111 Cut 4 40 02/11/96 7.03 318.3 0.00 32.5 69.1 79.3 191.7 0.00 0.00 12.4 90.011 Cut 5 40 02/11/96 6.55 94.8 0.00 59.6 47.7 61.3 68.7 0.00 0.00 6.2 35.211 Cut 6 40 02/11/96 7.04 82.2 0.00 142.7 45.3 197.3 48.1 10.76 1.30 2.0 21.711 Cut 4 60 02/11/96 7.09 190.4 0.00 29.9 72.8 107.5 46.6 0.00 0.00 5.7 65.811 Cut 5 60 02111/96 6.48 148.3 0.00 42.2 57.6 68.3 74.5 0.00 0.00 0.0 48.811 Cut 6 60 02/11/96 7.22 163.9 0.00 47.8 39.5 53.1 53.3 32.67 0.00 6.8 38.412 Forest 1 20 03/17/96 6.91 183.9 0.00 84.7 54.7 147.9 109.4 1.11 0.00 12.8 5.712 Forest 1 20 03/17/96 6.81 175.7 0.00 73.9 43.6 133.7 111.2 1.66 0.00 9.1 0.012 Forest 2 20 03/117/96 7.05 370.0 0.00 94.6 79.0 207.5 220.0 3.65 0.00 13.1 1.412 Forest 2 20 03117/96 7.03 343.5 0.00 137.9 88.1 227.7 190.5 0.00 0.00 115.0 2.812 Forest 3 20 03117/96 6.73 190.9 0.60 59.8 60.9 161.8 146.4 1.22 0.00 7.2 29.212 Forest 3 20 03117/96 6.91 154.8 0.00 43.7 49.8 131.9 129.6 0.00 0.00 9.7 9.612 Forest 1 40 03/17/96 6.99 223.5 0.00 59.3 40.3 118.7 100.3 0.00 0.00 18.7 11.712 Forest 2 40 03/17/96 6.93 502.2 0.00 77.0 62.1 186.3 193.0 0.00 0.00 30.4 2.812 Forest 3 40 03/17/96 6.36 233.5 0.00 30.7 28.0 87.8 173.9 0.00 0.00 12.3 45.912 Forest 1 60 03/17/96 6.84 281.7 0.00 39.9 54.3 100.7 164.6 0.00 0.00 20.1 16.712 Forest 2 60 03/17/96 6.89 544.8 0.00 59.8 54.7 127.7 377.2 0.00 0.00 47.1 9.312 Forest 3 60 03/17/96 6.40 273.0 0.00 33.0 49.8 121.4 157.2 0.00 0.00 13.6 47.3112 Cut 4 20 03/17/96 6.71 155.7 0.00 158.6 55.6 127.2 64.2 34.53 1.98 4.3 0.012 Cut 5 20 03/17/96 6.87 72.2 0.00 64.2 64.2 198.3 54.3 0.00 0.00 1.3 0.012 Cut 5 20 03117/96 6.65 67.4 0.00 139.6 46.1 190.8 41.6 20.70 0.00 1.4 0.012 Cut 6 20 03/17/96 6.66 69.1 0.00 38.4 33.3 69.1 52.9 1.80 0.00 4.5 0.012 Cut 4 40 03/17/96 6.68 180.9 0.00 19.7 73.3 110.2 47.7 0.00 0.00 5.8 19.212 Cut 5 40 03117/96 6.49 160.4 0.00 26.9 39.1 61.8 43,8 0.00 0.00 11.8 0.012 Cut 6 40 03/17/96 6.21 76.5 0.00 51.9 29.6 55.9 91.5 11.18 0.00 6.5 0.012 Cut 4 60 03/17/96 6.77 274.8 0.00 22.3 42.8 68.1 161.4 1.05 0.00 13.4 44.812 Cut 5 60 03117/96 6.92 137.8 0.00 38.4 49.8 137.7 47.9 3.95 0.00 3.9 0.012 Cut 6 60 03/17/96 6.37 110.9 0.00 32.7 34.2 54.6 73.5 0.00 0.00 11.0 0.413 Forest 1 20 06/20/96 6.97 158.2 0.00 86.8 64.2 166.7 202.9 2.55 0.00 13.9 50.513 Forest 1 20 06/20/96 6. 68 148.5 0.00 77.1 47.4 143.5 174.6 4.18 0.00 11.8 53.013 Forest 2 20 06/20/96 6.85 317.8 0.00 94.2 92.1 222.1 545.7 9.45 17.0 47.313 Forest 2 20 06/20/96 7.18 310.5 0.00 141.9 102.9 240.3 482.9 0.00 0.00 22.9 50.513 Forest 3 20 06/20/96 7.07 132.9 0.00 46.9 61.8 156.0 178.5 2.01 0.00 7.8 73.713 Forest 3 20 06/20/96 6.89 166.7 0.00 68.0 72.0 181.6 190.0 2.80 1.71 4.1 67.513 Forest 1 40 06/20/96 6.97 201.2 0.00 64.1 45.2 136.3 124.0 0.00 0.00 17.0 60.513 Forest 2 40 06/20/96 6.94 468.8 0.00 84.7 73.0 175.2 414.8 0.00 7.47 25.2 50.513 Forest 3 40 06/20196 6.72 203.5 0.00 35.1 27.9 95.2 195.4 0.00 0.00 9.8 79.713 Forest 1 60 06/20/96 6.73. 191.7 0.00 45.41 55.4 112.0 189.1 0.00 0.00 14.0 35.613 Forest 2 60 06/20/96 7.17 440.8 0.00 59.7 52.1 118.1 341.3 0.00 0.00 52.6 53.413 Forest 3 60 06/20/96 6.93 224.4 0.00 30.2 52.4 127.4 157.6 0.00 0.00 10.4 83.613 Cut 5 20 06/20/96 6.88 56.9 0.00 146.6 50.2 204.0 25.4 8.96 0.00 0.6 23.113 Cut 5 20 06/20/96 7.10 58.0 0.00 65.3 65.6 191.7 50.4 12.02 0.00 1.9 26.713 Cut 6 20 06/20/96 6.54 46.1 0.00 30.5 29.4 65.7 30.3 6.57 0.00 4.8 36.713 Cut 4 40 06/20/96 7.01 215.0 0.00 16.2 39.5 61.1 149.8 0.00 0.00 12.0 80.813 Cut 5 40 06/20/96 6.85 109.6 0.00 40.0 50.6 132.8 32.9 40.93 1.46 3.6 41.613 Cut 6 40 06/20/96 6.42 61.9 0.00 49.3 31.9 76.3 54.9 10.15 1.52 5.1 43.413 Cut 4 60 06120/96 6.91 144.9 0.00 18.5 72.7 104.8 54.8 0.97 2.53 4.8 62.613 Cut 5 60 06/20/96 6.46 129.3 0.00 31.0 47.2 75.6 47.3 0.00 2.17 9.2 70.113 Cut 6 60 06/20/96 6.46 80.9 0.00 36.0 33.5 53.5 51.8 0.00 2.24 8.7 47.0153