More important informationSalary sacrificeThe Commonwealth <strong>Government</strong> hasexpanded the definition of income sothat from 1 July <strong>2009</strong>, salary sacrificecontributions will now be includedwhen calculating your income for superco‐contribution purposes.Preservation cashing conditionsPreservation cashing conditions pertaining<strong>to</strong> the Defined Benefit and Accumulationaccounts provide for the release ofbenefits upon persons becoming <strong>to</strong>tallyand permanently disabled (TPD). Onceassessed as TPD, persons must first ceaseemployment prior <strong>to</strong> claiming a benefit.Consistent with amendments <strong>to</strong>Commonwealth superannuation legislation,<strong>QSuper</strong> now provides for persons <strong>to</strong> accesstheir accrued superannuation benefitswhere they have been certified as sufferingfrom a terminal medical condition. Wherea member meets this condition of release,benefits which have accrued up <strong>to</strong> thattime and any benefits which accrue duringthe certification period (twelve months)may be accessed (conditions apply).Income protectionIn some circumstances, <strong>members</strong> maybecome entitled <strong>to</strong> an income protectionbenefit if they are temporarily disabled andhave been on sick leave without salary fora continuous period of 14 calendar days.<strong>QSuper</strong>’s rules now provide that <strong>members</strong>must exhaust all paid sick leave prior <strong>to</strong>becoming entitled <strong>to</strong> an income protectionbenefit.Contributions for <strong>members</strong>aged over 65Members aged between 65 and 75 arerequired <strong>to</strong> meet a minimum work test inorder <strong>to</strong> make contributions. <strong>QSuper</strong> returnscontributions, within 30 days of receipt, inrespect of <strong>members</strong> who do not meet thework test, consistent with Commonwealthsuperannuation legislation.14 | <strong>QSuper</strong> <strong>Annual</strong> <strong>report</strong> <strong>to</strong> <strong>members</strong>Member identificationrequirementsThe Anti-Money Laundering andCounter‐Terrorism Financing Act 2006(the AML/CTF Act) was introduced bythe Commonwealth <strong>Government</strong> in 2006<strong>to</strong> combat money laundering and thefinancing of terrorism.The AML/CTF Act requires superannuationfunds <strong>to</strong> comply with certain obligationswhen providing services. This includes‘know your cus<strong>to</strong>mer’ obligations, whichverify the identification of a member orthe agent of a member.<strong>QSuper</strong> has changed all forms affectedby the AML/CTF Act <strong>to</strong> help <strong>members</strong>meet the new identification requirements.Members can download the latest formsfrom the <strong>QSuper</strong> website.In addition, <strong>QSuper</strong> is continuing <strong>to</strong>implement due diligence and moni<strong>to</strong>ring,in line with the AML/CTF Act, <strong>to</strong> ensurethat our <strong>members</strong> and their fundsare protected.Family law and same-sexlegislation changesThe Commonwealth <strong>Government</strong> passedlegislation in late 2008 <strong>to</strong> eliminatediscrimination against same-sex couplesand children of same-sex relationships.The Commonwealth <strong>Government</strong> hasamended legislation <strong>to</strong> allow:• the splitting of a superannuationinterest between de fac<strong>to</strong> couples(including same-sex couples) as part ofa family law property settlement;• same-sex couples <strong>to</strong> make spousecontributions (and claim a taxdeduction if within prescribed limits);• the same-sex partner of a deceasedperson <strong>to</strong> receive a superannuationdeath benefit; removing the need<strong>to</strong> demonstrate an interdependentrelationship or financial dependence onthe deceased;• superannuation contributions splittingbetween same-sex couples; and• the children of each partner in ade fac<strong>to</strong> relationship (includingsame-sex) <strong>to</strong> receive a death benefit,removing the need <strong>to</strong> demonstrate aninterdependent relationship.The <strong>QSuper</strong> Deed has been amended <strong>to</strong>allow for contribution splitting betweensame-sex couples. Changes <strong>to</strong> the <strong>QSuper</strong>Deed providing for the extension ofchildren’s pensions <strong>to</strong> include the childof each partner in a de fac<strong>to</strong> relationship(including same-sex relationships) will takeeffect in the <strong>2009</strong>/2010 financial year.SurchargeThe superannuation surcharge wasabolished from 1 July 2005. Any existingsurcharge liabilities remain payable <strong>to</strong>the ATO and will generally be deducedfrom your entitlements when you claim abenefit from <strong>QSuper</strong> or if you roll over <strong>to</strong>another complying superannuation fund.To find out if you have a surcharge liabilityrecorded for your account, please see yourbenefit statement.Enquiries and complaints<strong>QSuper</strong> has procedures in place <strong>to</strong> ensureany enquiries or complaints are dealtwith fairly and promptly. The Fund has90 days <strong>to</strong> deal with complaints. You candownload <strong>QSuper</strong>’s Enquiry and complaintsprocedure fact sheet from the <strong>QSuper</strong>website, or call us and we’ll send you one.If you have a complaint about <strong>QSuper</strong>,write <strong>to</strong> the Enquiries and ComplaintsOfficer, <strong>QSuper</strong>, GPO Box 200, BrisbaneQld 4001, and mark your letter ‘Notice ofenquiry or complaint’.If you are not satisfied with the outcome ofyour complaint, you can take the matter <strong>to</strong>the Superannuation Complaints Tribunal(SCT), an independent body set up by theCommonwealth <strong>Government</strong> <strong>to</strong> assist<strong>members</strong> only after they have made useof their superannuation fund’s internalcomplaints procedure.If you want <strong>to</strong> find out whether the SCTis able <strong>to</strong> deal with your complaint, youshould contact them on 1300 780 808, orvisit their website at www.sct.gov.au.
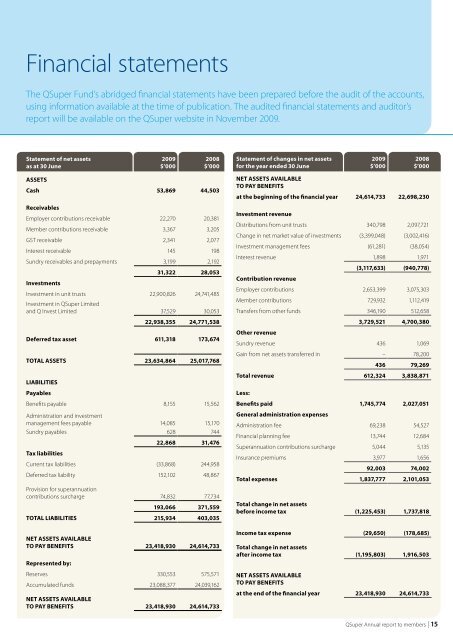
Financial statementsThe <strong>QSuper</strong> Fund’s abridged financial statements have been prepared before the audit of the accounts,using information available at the time of publication. The audited financial statements and audi<strong>to</strong>r’s<strong>report</strong> will be available on the <strong>QSuper</strong> website in November <strong>2009</strong>.Statement of net assetsas at 30 June<strong>2009</strong>$’0002008$’000Statement of changes in net assetsfor the year ended 30 June<strong>2009</strong>$’0002008$’000ASSETSCash 53,869 44,503ReceivablesEmployer contributions receivable 22,270 20,381Member contributions receivable 3,367 3,205GST receivable 2,341 2,077Interest receivable 145 198Sundry receivables and prepayments 3,199 2,19231,322 28,053InvestmentsInvestment in unit trusts 22,900,826 24,741,485Investment in <strong>QSuper</strong> Limitedand Q Invest Limited 37,529 30,05322,938,355 24,771,538Deferred tax asset 611,318 173,674TOTAL ASSETS 23,634,864 25,017,768LIABILITIESPayablesBenefits payable 8,155 15,562Administration and investmentmanagement fees payable 14,085 15,170Sundry payables 628 74422,868 31,476Tax liabilitiesCurrent tax liabilities (33,868) 244,958Deferred tax liability 152,102 48,867Provision for superannuationcontributions surcharge 74,832 77,734193,066 371,559TOTAL LIABILITIES 215,934 403,035NET ASSETS AVAILABLETO PAY BENEFITS 23,418,930 24,614,733Represented by:Reserves 330,553 575,571Accumulated funds 23,088,377 24,039,162NET ASSETS AVAILABLETO PAY BENEFITS 23,418,930 24,614,733NET ASSETS AVAILABLETO PAY BENEFITSat the beginning of the financial year 24,614,733 22,698,230Investment revenueDistributions from unit trusts 340,798 2,097,721Change in net market value of investments (3,399,048) (3,002,416)Investment management fees (61,281) (38,054)Interest revenue 1,898 1,971(3,117,633) (940,778)Contribution revenueEmployer contributions 2,653,399 3,075,303Member contributions 729,932 1,112,419Transfers from other funds 346,190 512,6583,729,521 4,700,380Other revenueSundry revenue 436 1,069Gain from net assets transferred in – 78,200436 79,269Total revenue 612,324 3,838,871Less:Benefits paid 1,745,774 2,027,051General administration expensesAdministration fee 69,238 54,527Financial planning fee 13,744 12,684Superannuation contributions surcharge 5,044 5,135Insurance premiums 3,977 1,65692,003 74,002Total expenses 1,837,777 2,101,053Total change in net assetsbefore income tax (1,225,453) 1,737,818Income tax expense (29,650) (178,685)Total change in net assetsafter income tax (1,195,803) 1,916,503NET ASSETS AVAILABLETO PAY BENEFITSat the end of the financial year 23,418,930 24,614,733<strong>QSuper</strong> <strong>Annual</strong> <strong>report</strong> <strong>to</strong> <strong>members</strong> | 15


![[PDF] Making a Binding Death Benefit Nomination - QSuper](https://img.yumpu.com/51120548/1/184x260/pdf-making-a-binding-death-benefit-nomination-qsuper.jpg?quality=85)
![[PDF] Employee rewards and benefits - QSuper](https://img.yumpu.com/50770119/1/184x260/pdf-employee-rewards-and-benefits-qsuper.jpg?quality=85)


![[PDF] Providing Proof of Identity factsheet - QSuper](https://img.yumpu.com/48792920/1/184x260/pdf-providing-proof-of-identity-factsheet-qsuper.jpg?quality=85)

![[PDF] Information Collection form - QSuper](https://img.yumpu.com/48024629/1/184x260/pdf-information-collection-form-qsuper.jpg?quality=85)
![[PDF] Defined Benefit Account Disability Claim - QSuper - Queensland](https://img.yumpu.com/43464395/1/184x260/pdf-defined-benefit-account-disability-claim-qsuper-queensland.jpg?quality=85)


![[PDF] Allocated pension notes booklet v1.indd - QSuper](https://img.yumpu.com/42513025/1/184x260/pdf-allocated-pension-notes-booklet-v1indd-qsuper.jpg?quality=85)

![[PDF] Investment Choice Guide - QSuper - Queensland Government](https://img.yumpu.com/42079288/1/184x260/pdf-investment-choice-guide-qsuper-queensland-government.jpg?quality=85)
