Heat capacity measurements of amine-water solutions used for Post ...
Heat capacity measurements of amine-water solutions used for Post ...
Heat capacity measurements of amine-water solutions used for Post ...

You also want an ePaper? Increase the reach of your titles
YUMPU automatically turns print PDFs into web optimized ePapers that Google loves.
<strong>Heat</strong> <strong>capacity</strong> <strong>measurements</strong> <strong>of</strong> <strong>amine</strong>-<strong>water</strong> <strong>solutions</strong> <strong>used</strong> <strong>for</strong> <strong>Post</strong>Combustion Carbon dioxide applicationsJohanna KuuselaDepartment <strong>of</strong> Chemical Engineering at Lund University, Department <strong>of</strong> Chemical and BiochemicalEngineering at Technical University <strong>of</strong> Denmark (2010)AbstractGrowing consumption <strong>of</strong> fossil fuel leads to increased emissions <strong>of</strong> the greenhouse gas carbon dioxide,which contributes in a major way to the global warming. It is believed that fossil fuels will continue to bethe main important source <strong>of</strong> energy <strong>for</strong> the near future. There<strong>for</strong>e ways are investigated <strong>for</strong> removingCO 2 from the flue gases from fossil fuel power plants. Natural gas- and coal fired power plants stands <strong>for</strong>40 % <strong>of</strong> world’s anthropogenic CO 2 emissions and consequently ef<strong>for</strong>ts are placed on finding ways <strong>of</strong>reducing emissions from these plants.One method <strong>of</strong> cleaning the flue gases is post combustion carbon dioxide capture (PCC) where the gas isscrubbed with a <strong>water</strong> based solution <strong>of</strong> <strong>amine</strong> or other solvent which can react with CO 2 . To correctlybe able to dimension heat exchangers in the PCC process thermodynamic data such as heat capacities<strong>for</strong> the <strong>amine</strong>-<strong>water</strong> <strong>solutions</strong> are needed. <strong>Heat</strong> <strong>capacity</strong> data <strong>for</strong> several <strong>amine</strong>s are scarce or there canbe a lack <strong>of</strong> data in literature. The aim <strong>of</strong> this study was to experimentally investigate heat capacities <strong>for</strong><strong>amine</strong>-<strong>water</strong> <strong>solutions</strong> with different amounts <strong>of</strong> carbon dioxide. The <strong>solutions</strong> investigated were 10 wt% MEA-, 30 wt % MEA-, 10 wt % AMP- and 30 wt % AMP-<strong>water</strong> <strong>solutions</strong> respectively. Differentconcentrations <strong>of</strong> carbon dioxide gas were injected to each sample to investigate its effect on the heat<strong>capacity</strong> <strong>of</strong> the <strong>solutions</strong>.IntroductionTo reduce the carbon dioxide emissions to theenvironment from fossil fuel power plants thereare three different methods <strong>of</strong> capturing carbondioxide: Oxy Fuel combustion capture, precombustion capture and post combustioncapture (1). In the PCC method differentabsorbents, mostly <strong>amine</strong>s, in <strong>water</strong> solutionare <strong>used</strong> to scrub carbon dioxide from the fluegas after the combustion process (1). The postcombustion carbon dioxide capture processsimply described consists <strong>of</strong> an absorptioncolumn, a desorption column and a heatexchanger between the columns. Where CO 2rich solvent from the absorber is heatexchanged against the lean and warmer solventfrom the desorber. The <strong>amine</strong> solution reactswith CO 2 mainly through two different reactionpaths (2):Reaction path <strong>for</strong> primary and secondary<strong>amine</strong>s:→←1
→←→←Reaction path <strong>for</strong> tertiary <strong>amine</strong>s and stericallyhindered primary and secondary <strong>amine</strong>s:→←→←In the first reaction path two moles <strong>of</strong> <strong>amine</strong>are consumed per mole <strong>of</strong> CO 2 , making it haveless <strong>capacity</strong> than the second reaction pathwhere only one mole <strong>amine</strong> is consumed permole <strong>of</strong> CO 2 . The reaction rate is faster <strong>for</strong> thefirst reaction path while tertiary <strong>amine</strong>s moreeasily desorb the CO 2 .Amines chosen <strong>for</strong> this studyFor this study the <strong>amine</strong>s MEA and AMP werechosen to make the heat <strong>capacity</strong><strong>measurements</strong>. <strong>Heat</strong> <strong>capacity</strong> data <strong>for</strong> MEA<strong>water</strong> <strong>solutions</strong> with different concentrations <strong>of</strong>CO 2 are available in literature (3). MEA wasthere<strong>for</strong>e chosen <strong>for</strong> the experiments to be ableto compare experimental heat <strong>capacity</strong> valueswith literature values and by that way evaluatethe reliability <strong>of</strong> the experimental method <strong>used</strong>.Investigations have previously been made onthe ability <strong>of</strong> AMP to react with CO 2 in theabsorption reaction (4). These experimentsshowed a good ability <strong>for</strong> AMP to be <strong>used</strong> inPCC applications. <strong>Heat</strong> <strong>capacity</strong> data <strong>for</strong> AMP<strong>water</strong><strong>solutions</strong> however, have not been foundin literature and <strong>for</strong> these two reasons AMP waschosen <strong>for</strong> the heat <strong>capacity</strong> experiments madein this study.ChemicalsThe chemicals <strong>used</strong> in this study are:99% pure Monoethanol <strong>amine</strong> (MEA)from Sigma-Aldrich99% pure 2-amono -2-methyl-1-propanol (AMP) from Sigma-AldrichBoiled distilled <strong>water</strong>Experimental methodTo determine the heat capacities <strong>for</strong> the <strong>amine</strong><strong>water</strong><strong>solutions</strong> with different amounts <strong>of</strong> CO 2 ,a method with micro calorimetry has been<strong>used</strong>. The principle <strong>of</strong> the method is to measureheat flow from the sample to the environment.The micro calorimeter <strong>used</strong> <strong>for</strong> theseexperiments is the Bio Activity Monitor 2277BAM (5).A sample from the <strong>amine</strong> solution(approximately 1.5 g) was put in to a smallstainless steel vessel and lowered in to themicro calorimeter.The carbon dioxide gas was allowed to flow into the sample vessel through a small tube <strong>for</strong>which a port was opened. The tube wasconnected from the small carbon dioxide flaskto the sample vessel inside the calorimeter.A constant heat supply (300 µW) was applied tothe sample inside the calorimeter until constanttemperature was reached in the sample. Thiswas per<strong>for</strong>med at least two times to get somereplicate <strong>measurements</strong>.An experimental data set <strong>of</strong> heat flow from thesample as a function <strong>of</strong> time was obtained.Calculations on the experimental data weremade in Excel. A program with the extendedUNIQUAC (6) model was <strong>used</strong> to calculate theheat <strong>capacity</strong> data <strong>for</strong> the <strong>solutions</strong>. The results2
given by UNIQUIAC were compared with thecalculated results from the experimental data.Theory <strong>for</strong> the <strong>measurements</strong>When a constant heat supply is applied to thesample, some <strong>of</strong> the heat is stored by thesample while the rest is transferred from thesample to the environment via two thermoelements where the heat flow is detected. Theheat equation can be described according toequation 1.Equation 1Where P(t) supplied is the constant heat flowsupplied to the sample cup, P(t) transferred is theheat not absorbed by the sample and there<strong>for</strong>eflowing to the heat sink and P(t) absorbed is theabsorbed heat by the sample.Since and the equationabove can also be expressed according toequation 2 below.Equation 2Equation 3( )Equation 4 below is the solution to equation 3.Equation 4In equation 4 is the current temperature<strong>of</strong> the sample, is the temperature <strong>of</strong> thesample at a stage where a constant uppertemperature during the heat supply has beenreached, is the constant temperature <strong>of</strong> thesample when no heat is supplied and t is thetime during the experiment. The parameter τ isa curve constant obtained from the plot <strong>of</strong> heatflowing from the sample to the environmentagainst the time during the experiment.Both sides <strong>of</strong> equation 4 are subtracted with T 0and multiplied with B transferred to get amathematical function <strong>for</strong> the powertransferred from the sample to theenvironment.Equation 5Where m and C p are constants in the <strong>for</strong>m <strong>of</strong>mass and specific heat <strong>capacity</strong> <strong>of</strong> the sample,B transferred is a constant that has to do with thethermal properties <strong>of</strong> the apparatus and has theunit W/°C. In equation 2, m*C p is set to theconstant C 1 , the constant B transferred is set to C 2and P(t) supplied is set to the constant C 3 .According to this, equation 3 below is obtainedwhich can be solved as a differential equation.In equation 5is the heat flow fromthe sample to the environment and is thehighest value <strong>for</strong> this heat flow obtained, whichis a constant value when the sample hasreached its maximum heat absorption <strong>capacity</strong>.In equation 5 above and are theactual values. But measurement is alwaysconnected with a measurement error which hasto be taken in to account. In this case the erroris that the baseline at the lower steady state <strong>of</strong>the power curve should be zero when no poweris flowing to the sample but this was not thecase during the <strong>measurements</strong>. Instead thelower steady state <strong>of</strong> the power curve had a3
P(t) µWvalue somewhat above zero. The power at thelower steady state <strong>of</strong> the power curve and thusthe deviation from zero will be called .There<strong>for</strong>e the measured value <strong>of</strong> the powertransferred to the heat sink and the power atthe upper steady state <strong>of</strong> the power curve canbe written according to equations 6 and 7below.15001000500073000-50078000 83000 88000Equation 6-1000time (s)Figure 1. Experimental data <strong>of</strong> heat flow from the sampleas a function <strong>of</strong> timeEquation 7Equations 6 and 7 expresses that the measuredvalue is equal to the actual value plus ameasurement error.In equation 7,is a mathematicalfunction <strong>for</strong> the measured heat flow from thesample to the environment and representsthe measured constant heat flow from thesample when the maximum heat absorption<strong>capacity</strong> is reached.Equation 7 was <strong>used</strong> in Excel to make acalculated curve <strong>for</strong> the heat flow to becompared with the experimental data <strong>for</strong> theheat flow.An example <strong>of</strong> a power curve where theexperimental data <strong>of</strong> heat flow is plotted as afunction <strong>of</strong> time can be seen in figure 1 below.In figure 1 to replicate <strong>measurements</strong> wasmade.Calculations on the experimentaldataThe heat <strong>capacity</strong> <strong>for</strong> the sample is obtainedfrom the <strong>measurements</strong> by recognizing that theτ value <strong>for</strong> each sample is proportional to theproduct <strong>of</strong> its mass and heat <strong>capacity</strong>.To obtain a τ value <strong>for</strong> the sample, a leastsquares fitting <strong>of</strong> the experimental data to themathematical function was per<strong>for</strong>med. A sum<strong>of</strong> squares error was calculated according toequation 8.Equation 8∑By minimizing the sum <strong>of</strong> squares errorbetween experimental and calculated heatflows, a τ value <strong>for</strong> equation 7 above wasobtained in Excel.Each specific sample has its own τ value. A heatflow measurement was also made <strong>for</strong> an emptyvessel to be able to eliminate the vessel’scontribution to the heat <strong>capacity</strong>. A4
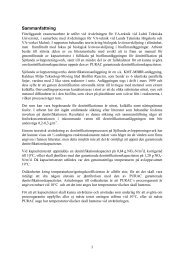
Cp (kJ/kgK)765432100 0,5 1 1,5extendedUNIQUACmodel heat<strong>capacity</strong> <strong>for</strong>30wt% MEAsolution(kJ/kgK)experimentalheat <strong>capacity</strong>values <strong>for</strong>30wt% MEAsolution(kJ/kgK)Figure 4. Comparison between extended UNIQUAC modelCp values and Cp values from this study <strong>for</strong> 30 wt% MEAsolutionThe extended UNIQUAC model shows an upperdip in the heat <strong>capacity</strong> values <strong>for</strong> 30 wt% MEAsolution as can be seen in figure 4 above, thisoccurs at a loading in the region <strong>of</strong> 0.1.Moreover the heat <strong>capacity</strong> values calculatedwith the model are larger than the experimentalvalues. The odd replicate heat <strong>capacity</strong> value <strong>of</strong>2.789 at the loading 0.21 <strong>for</strong> the experimental30 % MEA solution has been left out in figure 4.Table 3. <strong>Heat</strong> Capacity (kJ/kg K) at 25 °C <strong>for</strong> CO 2 loaded10wt% and 30 wt % AMP-<strong>water</strong> <strong>solutions</strong> from presentstudyLoading 10wt% AMP 30wt% AMP(mol/mol)0 4.440, 3.753, 3.057, 3.142.9030.11 4.021 3.070.14 3.7030.27 3.4600.32 3.0290.42 4.4890.46 3.5280.52 3.9920.53 3.275The three heat <strong>capacity</strong> values <strong>for</strong> 10 wt% AMPat the loading 0 in table 3 are <strong>measurements</strong>made <strong>for</strong> different samples from the samesolution.The results from the present study <strong>for</strong> 10 and30 wt% AMP <strong>solutions</strong> are plotted in figures 5and 6 below.54,543,5Table 3 below is a list <strong>of</strong> the heat <strong>capacity</strong>measurement results <strong>for</strong> 10 and 30 wt % AMPat different CO 2 -loadings.32,520 0,2 0,4 0,6loading (mol CO2/mol AMP)Figure 5. Experimental Cp-values <strong>for</strong> 10% AMP solutionfrom present study7
Cp (kJ/kgK)3,83,63,43,232,82,62,42,220 0,1 0,2 0,3 0,4 0,5loading (mol CO2/mol AMP)Figure 6. Experimental Cp-values <strong>for</strong> 30% AMP solutionfrom present studyAs can be seen in figures 5 and 6 above, bothAMP <strong>solutions</strong> have a minimum <strong>for</strong> heat<strong>capacity</strong> roughly at the loading <strong>of</strong> 0.3. In the 10wt% solution the minimum value is situatedsomewhat lower and in the 30 wt% solution it isat a slightly higher loading than 0.3. Figure 5also shows a large variation in the threereplicates at the loading 0. The replicate valuesin figure 5 span over the whole plotted area inthe graph.The expected result <strong>for</strong> all the <strong>measurements</strong>made in this study was that the heat <strong>capacity</strong>would decrease with increasing carbon dioxideloading. A simple reason <strong>for</strong> the expected resultis that the mass <strong>of</strong> the sample gets larger withincreasing CO 2 concentration.Why decreasing heat <strong>capacity</strong> with increasingCO 2 concentration is not the observed result inall the <strong>measurements</strong> could have many reasons.In principal the fluctuating measurement resultscould depend on the apparatus <strong>used</strong> or that the<strong>solutions</strong> in fact differed in composition.A replicate measurement was made <strong>for</strong> 30 %MEA solution at a CO 2 loading <strong>of</strong> 0.21 a dayafter the first measurement on the exact samesample (table 2 and figure 2).If it is assumed that the bio activity monitor hadthe same per<strong>for</strong>mance, this could mean thatequilibrium in the solution was in fact notestablished be<strong>for</strong>e the first measurement. Thecarbon dioxide might have needed a longertime to get absorbed by the solutionIn the <strong>measurements</strong> which involved carbondioxide injection in to the sample an errorsource could also be the accuracy with whichthe CO 2 content in the sample was measured(CO 2 gas flask was weighed be<strong>for</strong>e and after theinjection).For the 10 % AMP solution three <strong>measurements</strong>were made with zero CO 2 in the sample (table 3figure 5). These <strong>measurements</strong> were made <strong>for</strong>different samples taken from the sameprepared solution. Since the <strong>amine</strong> is soluble in<strong>water</strong> it is more questionable if these differingresults depends on not reaching equilibrium.Furthermore each measurement result <strong>for</strong> heat<strong>capacity</strong> shown above is a mean valuecalculated from at least two replicate<strong>measurements</strong>. The replicate <strong>measurements</strong>were made <strong>for</strong> the same sample approximatelyone hour apart.From all the replicate <strong>measurements</strong> made itcould be seen that some <strong>of</strong> the <strong>measurements</strong>deviated a great amount from each otherdespite the short time difference.These results could in fact question theper<strong>for</strong>mance <strong>of</strong> the apparatus <strong>used</strong>.The bioactivity monitor was originally designedto measure heat flow from living systems likecells and living organisms. This makes it8
extremely sensitive (it can detect heat flowsdown to 0.1 µW).The sensitivity <strong>of</strong> the bio activity monitor BAM2277 could also be a reason <strong>for</strong> differingmeasurement results if it was <strong>for</strong> exampleexposed to external vibrations or other kind <strong>of</strong>disturbance during the measurement.ConclusionsFor many reasons which were discussed in thesection above, more experiments would havebeen needed to be able to evaluate thereliability <strong>of</strong> the measurement results <strong>of</strong> heat<strong>capacity</strong> <strong>for</strong> the different <strong>amine</strong> <strong>solutions</strong>.The method <strong>used</strong> could be improved by moreaccurately measuring the concentrations <strong>of</strong>different components in the sample solution.For example the concentration <strong>of</strong> CO 2 could bedetermined by titrating instead <strong>of</strong> weighing.It is necessary to be certain that the solutionhas reached equilibrium be<strong>for</strong>e starting themeasurement.In summary, further investigation <strong>of</strong> the <strong>amine</strong>solution heat capacities would be interestingand necessary in the future.AcknowledgmentsThank you Ingemar Odenbrand at the department <strong>of</strong>Chemical Engineering at Lund University <strong>for</strong> helpfulsupervision and encouragement during this work.Thank you Kaj Thomsen , Philip Loldrup Fosbøl andErling H. Stenby at the department <strong>of</strong> Chemical andBiochemical Engineering at Technical University <strong>of</strong>Denmark <strong>for</strong> help and guidance during this study.Thank you Zacarias Tecle <strong>for</strong> technical instructionsconcerning the Bio Activity Monitor and guidance inthe laboratoryThank you Karin Petersen <strong>for</strong> safety instructions inthe laboratory.Thank you Willy wan Well at Dong Energy <strong>for</strong>contacting me with the people at the department <strong>of</strong>Chemical and Biochemical Engineering at TechnicalUniversity <strong>of</strong> Denmark.Finally I thank all you people at the department <strong>of</strong>Chemical and Biochemical Engineering at TechnicalUniversity <strong>of</strong> Denmark <strong>for</strong> making me feel welcome.References(1) Jochen Oexmann, Christian Hensel, AlfonsKather, 2008, "<strong>Post</strong> combustion CO2 capture fromcoal fired power plants: Preliminary evaluation <strong>of</strong> anintegrated chemical absorption process withpiperazine- promoted potassium carbonate" inInternational journal <strong>of</strong> greenhouse gas control, 2,541-544(2) Graeme Puxty, Robert Rowland, 2009, “CarbonDioxide <strong>Post</strong>combustion Capture: A Novel ScreeningStudy <strong>of</strong> the Carbon Dioxide AbsorptionPer<strong>for</strong>mance <strong>of</strong> 76 Amines”, CSIRO EnergyTechnology, CSIRO Molecular and healthtechnologies, The University <strong>of</strong> Newcastle, 43, 6427-6433(3) Ralph h. Weiland, John C. Dingman, 1997, “<strong>Heat</strong>Capacity <strong>of</strong> Aqueous Monoethanol<strong>amine</strong>,Diethanol<strong>amine</strong>, N-Methyldiethanol<strong>amine</strong>, and N-Methyldiethanol<strong>amine</strong> Based Blends with CarbonDioxide”, Chem. Eng. Data, 42, 1004-1006(4) Mohammad R.M. Abu-Zahra, Paul H.M. Feron,2009, “New process concepts <strong>for</strong> CO 2 postcombustioncapture process integrated with coproduction<strong>of</strong> hydrogen”, International journal <strong>of</strong>hydrogen energy, 34, 3992-4004(5) Instruction manual <strong>for</strong> Bio Activity MonitorBAM 2277(6) Leila Faramarzi, Georgios M. Kontogeorgis, KajThomsen, Erling H. Stenby, 2009, “ExtendedUNIQUAC model <strong>for</strong> thermodynamic modeling <strong>of</strong>CO 2 absorption in aqueous alkanol<strong>amine</strong> <strong>solutions</strong>”,Fluid Phase Equilibria, 282, 121-1329