Control of membrane fouling by Hydrogen Sulfide (H2S) diffusion ...
Control of membrane fouling by Hydrogen Sulfide (H2S) diffusion ...
Control of membrane fouling by Hydrogen Sulfide (H2S) diffusion ...
You also want an ePaper? Increase the reach of your titles
YUMPU automatically turns print PDFs into web optimized ePapers that Google loves.
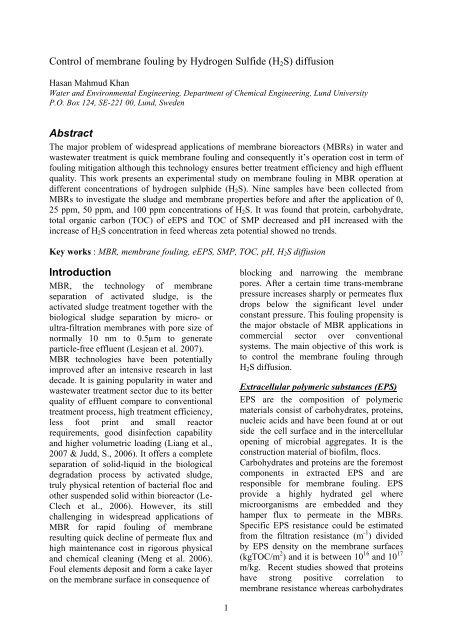
<strong>Control</strong> <strong>of</strong> <strong>membrane</strong> <strong>fouling</strong> <strong>by</strong> <strong>Hydrogen</strong> <strong>Sulfide</strong> (H 2 S) <strong>diffusion</strong>Hasan Mahmud KhanWater and Environmental Engineering, Department <strong>of</strong> Chemical Engineering, Lund UniversityP.O. Box 124, SE-221 00, Lund, SwedenAbstractThe major problem <strong>of</strong> widespread applications <strong>of</strong> <strong>membrane</strong> bioreactors (MBRs) in water andwastewater treatment is quick <strong>membrane</strong> <strong>fouling</strong> and consequently it’s operation cost in term <strong>of</strong><strong>fouling</strong> mitigation although this technology ensures better treatment efficiency and high effluentquality. This work presents an experimental study on <strong>membrane</strong> <strong>fouling</strong> in MBR operation atdifferent concentrations <strong>of</strong> hydrogen sulphide (H 2 S). Nine samples have been collected fromMBRs to investigate the sludge and <strong>membrane</strong> properties before and after the application <strong>of</strong> 0,25 ppm, 50 ppm, and 100 ppm concentrations <strong>of</strong> H 2 S. It was found that protein, carbohydrate,total organic carbon (TOC) <strong>of</strong> eEPS and TOC <strong>of</strong> SMP decreased and pH increased with theincrease <strong>of</strong> H 2 S concentration in feed whereas zeta potential showed no trends.Key works : MBR, <strong>membrane</strong> <strong>fouling</strong>, eEPS, SMP, TOC, pH, H 2 S <strong>diffusion</strong>IntroductionMBR, the technology <strong>of</strong> <strong>membrane</strong>separation <strong>of</strong> activated sludge, is theactivated sludge treatment together with thebiological sludge separation <strong>by</strong> micro- orultra-filtration <strong>membrane</strong>s with pore size <strong>of</strong>normally 10 nm to 0.5µm to generateparticle-free effluent (Lesjean et al. 2007).MBR technologies have been potentiallyimproved after an intensive research in lastdecade. It is gaining popularity in water andwastewater treatment sector due to its betterquality <strong>of</strong> effluent compare to conventionaltreatment process, high treatment efficiency,less foot print and small reactorrequirements, good disinfection capabilityand higher volumetric loading (Liang et al.,2007 & Judd, S., 2006). It <strong>of</strong>fers a completeseparation <strong>of</strong> solid-liquid in the biologicaldegradation process <strong>by</strong> activated sludge,truly physical retention <strong>of</strong> bacterial floc andother suspended solid within bioreactor (Le-Clech et al., 2006). However, its stillchallenging in widespread applications <strong>of</strong>MBR for rapid <strong>fouling</strong> <strong>of</strong> <strong>membrane</strong>resulting quick decline <strong>of</strong> permeate flux andhigh maintenance cost in rigorous physicaland chemical cleaning (Meng et al. 2006).Foul elements deposit and form a cake layeron the <strong>membrane</strong> surface in consequence <strong>of</strong>blocking and narrowing the <strong>membrane</strong>pores. After a certain time trans-<strong>membrane</strong>pressure increases sharply or permeates fluxdrops below the significant level underconstant pressure. This <strong>fouling</strong> propensity isthe major obstacle <strong>of</strong> MBR applications incommercial sector over conventionalsystems. The main objective <strong>of</strong> this work isto control the <strong>membrane</strong> <strong>fouling</strong> throughH 2 S <strong>diffusion</strong>.Extracellular polymeric substances (EPS)EPS are the composition <strong>of</strong> polymericmaterials consist <strong>of</strong> carbohydrates, proteins,nucleic acids and have been found at or outside the cell surface and in the intercellularopening <strong>of</strong> microbial aggregates. It is theconstruction material <strong>of</strong> bi<strong>of</strong>ilm, flocs.Carbohydrates and proteins are the foremostcomponents in extracted EPS and areresponsible for <strong>membrane</strong> <strong>fouling</strong>. EPSprovide a highly hydrated gel wheremicroorganisms are embedded and theyhamper flux to permeate in the MBRs.Specific EPS resistance could be estimatedfrom the filtration resistance (m -1 ) divided<strong>by</strong> EPS density on the <strong>membrane</strong> surfaces(kgTOC/m 2 ) and it is between 10 16 and 10 17m/kg. Recent studies showed that proteinshave strong positive correlation to<strong>membrane</strong> resistance whereas carbohydrates1
have moderate correlation due to lowamount. According to the currentresearches, proteins are the most importantfactor <strong>of</strong> <strong>membrane</strong> <strong>fouling</strong> (Meng et al.,2006).Soluble microbial product (SMP)SMP are the large amount <strong>of</strong> solubleorganic substances that are produced frombacterial populations in bioreators. SMPlevel is extremely important for biologicaltreatment process as treatment efficiencyand effluent quality highly depends on SMPamount in treatment reactors. It is wellestablished that majority <strong>of</strong> soluble organicsubstances come from SMP in effluent inbiological treatment systems and itsconcentration set up the discharge level <strong>of</strong>chemical oxygen demand (COD) and totalorganic carbon (TOC) in effluent.Furthermore, some SMP have certaincharacteristic like toxicity and metalchelating properties which affect themetabolic activities <strong>of</strong> microorganisms bothin receiving water and in treatment process.In some case, it lessens the specificrespiration rate <strong>of</strong> microorganisms.Therefore, for better efficiency <strong>of</strong> treatmentsystems, less concentration <strong>of</strong> SMP isdesirable (Liang et al., 2007).SMP could be again categorized into two asutilization associated products and biomassassociated products. Although humicsubstances (humic and fulvic acids),carbohydrates and proteins have beenidentified successfully as major components<strong>of</strong> SMP, it is still unclear <strong>of</strong> its precisecomposition (Liang et al., 2007).However, most <strong>of</strong> previous studiesconcentrated on SMP in conventionalbiological treatment plants but fewer havebeen focused to grasp the impact <strong>of</strong> SMP inMBR. It is found from study that depending<strong>of</strong> the operation condition SMP are liablefrom 26 to 52% <strong>of</strong> <strong>membrane</strong> <strong>fouling</strong> inmicr<strong>of</strong>iltration and ultrafiltration<strong>membrane</strong>s (Liang et al., 2007).Materials and Method<strong>Hydrogen</strong> Sulphide (H 2 S) <strong>diffusion</strong>Air and mixture <strong>of</strong> air & H 2 S was sprayedinto sludge for getting differentconcentration <strong>of</strong> H 2 S in sludge. Pressure andflow rate were 2 bars and 400 ml per minrespectively and was aerated for 15 min andafter then kept it for 10 min forhomogeneous distribution <strong>of</strong> H 2 S in sludge.High concentration <strong>of</strong> H 2 S (2000 mg/l) hasbeen diluted <strong>by</strong> mixing <strong>of</strong> compressed air toget a certain concentration <strong>of</strong> H 2 S. Two gasflow meters were used to control the air andH 2 S gas flow and connected to the gascylinder <strong>by</strong> plastic tube line. This mixture <strong>of</strong>gases has been applied to feed <strong>by</strong> diffuserwhich was connected at the end <strong>of</strong> sourcetube. Concentration <strong>of</strong> 25 ppm (0.075 mgH 2 S/g biomass), 50 ppm (0.15 mg H 2 S/gbiomass) and 100 ppm (0.3 mg H 2 S/gbiomass) <strong>of</strong> H 2 S were sprayed in threesamples with flow rate <strong>of</strong> 400 ml/min andeach sample is amount <strong>of</strong> 2 liters. Only airwas pumped into the sludge to get zeroconcentration H 2 S sample for same durationwith flow rate 400 ml/l. These samples wereanalyzed for eEPS, SMP, ZP and pH.<strong>H2S</strong> TankAir TankRegulatorRegulator<strong>H2S</strong>FlowmeterAirFlowmeter2 mtubeline2 L Glass CylinderFigure 1: Schematic setup for H 2 S <strong>diffusion</strong>Dead End FiltrationThe whole experiment was consisted <strong>of</strong>dead end filtration cell, reservoir,compressed air and computer program formeasuring weight <strong>of</strong> collected permeate.Around one liter <strong>of</strong> aerated sludge is pouredin about 2 l volume closed feed reservoirand pump to dead end filtration cell (110 mlvolume capacity, 1.59 X 10 -3 m 2 <strong>membrane</strong>2
area). PVDF <strong>membrane</strong> (0.189 cm 2 ) withpore size <strong>of</strong> 0.22 µm is placed at on porousmedia at the end <strong>of</strong> cell and rubber circularring is placed on the <strong>membrane</strong> to preventleakage. Dead end cell is completely airtight and connected to feed tank <strong>by</strong> rubbertube. Compressed air cylinder is connectedto the tank through pressure gauge andpressure stabilizer for pumping sludge fromtank to cell. Applied air pressure iscontrolled <strong>by</strong> EL PRESS P-702CM pressuretransducer installed in the line tubing, whichis then connected to an EL PRESSelectronic regulator for a more accuratecontrol <strong>of</strong> pressure. Filtrated supernatantweight is measured every 60s <strong>by</strong> computerlinked balance and computer programcalculate the flux rate.Air tankAutomatic pressureregulatorPressure <strong>Control</strong>lerReservoirDead-endfiltration cellMass balanceFig 2: Dead-end filtration set-upPermeat eComputerSource <strong>of</strong> biomassBiomass has been collected from NorthHead MBR and Malabar MBR which wasoriginally from North Head’s MBR. Bothsewages go to MBR after primary treatmentand are a mixture <strong>of</strong> municipal andindustrial waste. Sludge age <strong>of</strong> Malabar is20 days and about 13L <strong>of</strong> sludge is wastedeach day to keep the sludge age at 20 daysand hydraulic retention time (HRT) is about10 hours. Volume <strong>of</strong> MBR is 250 l and thetotal <strong>membrane</strong> area is 2 m 2 with constantflux at 12 l/h.Nine samples have been used for theexperiment marked from A to I. Sampleshave been randomly selected for differenttests and observed the effect <strong>of</strong> H 2 S on thisparticular sludge characteristic.3SMP and EPS extractionHeating method has been followed toextract SMP and EPS. Sample is centrifugedfirst at 2000 rpm and supernatant is filtratedthrough 1.2 µm pore size filter paper forSMP extraction. The suspension was dilutedwith 0.98% NaCl solution, mixed for 5 minand kept it 80 0 C temperature for 10 min.This temperature has been controlled <strong>by</strong>high pressure stream sterilizer (ES-315).After then it was centrifuged at 2500 rpmand supernatant was again filtrated using 1.2µm pore size filter and collected for EPSextraction.Carbohydrate analysisPhono-Sulfuric acid method proposed <strong>by</strong>Hanson and Philips, 1981 was used todetermine the carbohydrate concentration <strong>of</strong>SMP and extracted EPS. In presence <strong>of</strong>sulfuric acid, phenol and carbohydrate formcolored aromatic compounds and measuredit as an absorbance at 480 nm wave length<strong>by</strong> spectrophotometer. Concentration <strong>of</strong>carbohydrate then was determined from thevalue <strong>of</strong> absorbance using carbohydratecalibration curve which was developed fromstandard solution.Concentration, mg/lCarbohydrate Calibration353025y = 93.487xR 2 = 0.9891201510500 0.05 0.1 0.15 0.2 0.25 0.3 0.35Absorbance at 480 nmFig 3: Carbohydrate calibr. curve at 480 nmProtein analysisModified Lowry method has been used tomeasure the concentration <strong>of</strong> protein <strong>of</strong>SMP and extracted EPS from filtrate whichwas modified <strong>by</strong> Peterson (Peterson, 1977).In this method, bonded proteins react tolowry reagent which contains copper ionsand Folic-Ciocalteu reagent composed <strong>of</strong>phosphomolybdate and phosphotungstate.When lowey reagent is added to the filtrate,copper ions together with protein form a
complex alkaline solution, BuiretChromophore and further addition <strong>of</strong> Folin-Ciocalteu reagent reacted protein developsblue color that is detectable <strong>by</strong>spectrophotometer under the wavelengthfrom 500 to 750 nm. Protein concentrationis then calculated from calibration curve.mg/L Proteins150100500Protein calibrationy = 253.11xR 2 = 0.93260 0.1 0.2 0.3 0.4Absorbance 650Fig 4: Protein calibration curve at 650 nmZeta Potential (ZP)ZP is the electrical double layer that issurroundings the particles in a colloidalsolution or suspension (Lindquist, 2003).Ionic characteristics and dipolar features <strong>of</strong>the colloidal particles dispersed in thesolution are the causes <strong>of</strong> their electricallycharged. Particles are surrounded <strong>by</strong> theopposite charges which is called fixed layerand outside <strong>of</strong> fixed layer there is the cloudarea composed <strong>of</strong> positive and negativeions. This cloud area is called diffuse doublelayer. ZP is considered to be the electricpotential <strong>of</strong> this inner area including thisconceptual "sliding surface". As this electricpotential approaches zero, particles tend toaggregate.It has been measured <strong>of</strong> new and foul<strong>membrane</strong> <strong>by</strong> PAAR EKA-Electro KineticAnalyzer RV 4.31C at different pH value.Total Organic Carbon (TOC)Sludge is centrifuged and filtrated through<strong>membrane</strong> with nominal pore size 0.45 µmin order to get particle free clear sample.Few drops <strong>of</strong> 98% H 2 SO 4 are added toremove any inorganic carbon fromsupernatant and TOC is then measured <strong>by</strong>total organic carbon analyzer (TOC-5000A).4Results and DiscussionEffect <strong>of</strong> H 2 S on ChemicalCharacteristics:pHpH876543210Effect <strong>of</strong> H 2 S on pHA C E F GSampleFig 5: Variation <strong>of</strong> pHNo <strong>H2S</strong> sparging25 ppm <strong>H2S</strong>sparging50 ppm <strong>H2S</strong>sparging100 ppm <strong>H2S</strong>spargingWastewater treatment process largelydepends on pH <strong>of</strong> biomass. It is observedfrom obtained result that pH valuemoderately increased with increase <strong>of</strong> H 2 Sconcentration. This elevation <strong>of</strong> pH valuemight be able to contribute positively on<strong>membrane</strong> <strong>fouling</strong> propensity when originalpH <strong>of</strong> biomass is low. It is well known thatdrop <strong>of</strong> pH under certain level makes thewastewater treatment process difficult.Therefore, removal <strong>of</strong> H 2 S from activatedsludge could decrease the pH <strong>of</strong> sludge andmight lead higher <strong>fouling</strong> in MBR becausethe living species could not work properly atlow pH.Zeta Potential (ZP)ZP <strong>of</strong> <strong>membrane</strong> represents the surfacecharge <strong>of</strong> <strong>membrane</strong>. It is found from study,it has strong negative correlation with<strong>fouling</strong> resistance. Resistance increase whenZP drop and it plays a significant role in<strong>membrane</strong> <strong>fouling</strong> (Meng et al., 2006).ZP <strong>of</strong> virgin and fouled <strong>membrane</strong> has beendetermined and results show that ZP <strong>of</strong>fouled <strong>membrane</strong> is higher than virgin<strong>membrane</strong> but it was not found any impact<strong>of</strong> H 2 S that influence the ZP <strong>of</strong> <strong>membrane</strong>surface.From test result, it could be said that <strong>fouling</strong>definitely affect the ZP <strong>of</strong> <strong>membrane</strong>surface because clear difference has been
found between the virgin and all fouled<strong>membrane</strong>s but the effect <strong>of</strong> H 2 S in differentconcentration is ambiguous. ZP unevenlyvaries with H 2 S concentration.Effect <strong>of</strong> H 2 S on BiopolymericComposition <strong>of</strong> Biomass:Extracellular Polymeric Substances (EPS)Extracellular polymeric substances areconsisting <strong>of</strong> protein, carbohydrate andcarbon compound that are mainly liable for<strong>membrane</strong> <strong>fouling</strong>. Four samples have beentested to determine the concentration <strong>of</strong>protein, carbohydrate and total organiccarbon in extracted EPS. The results whichwere found from lab test are given below:ProteinProtein Concentration,mg/l300250200150100500Effect <strong>of</strong> H 2 S on eEPSpC D F GSampleNo <strong>H2S</strong> sparging25 ppm <strong>H2S</strong>sparging50 ppm <strong>H2S</strong>sparging100 ppm <strong>H2S</strong>spargingFig 6: Protein conc in eEPS at different H 2 SFrom the bar chart it is found that proteinconcentration <strong>of</strong> one set <strong>of</strong> sample (D) doesnot give any correlation with differentconcentration <strong>of</strong> H 2 S <strong>diffusion</strong> but in otherthree set <strong>of</strong> samples protein concentrationdecreases with increase <strong>of</strong> H 2 S <strong>diffusion</strong> insludge. According to Meng et al. (2006)<strong>fouling</strong> resistance increase with increase <strong>of</strong>protein concentration, sparging <strong>of</strong> H 2 S insludge could lead to decrease the <strong>fouling</strong>resistance and consequently increase thefilterability <strong>of</strong> <strong>membrane</strong>. As there is nostandard method for extraction <strong>of</strong> EPS, theobtained result might not be quite accuratebut in general it could be said that <strong>diffusion</strong><strong>of</strong> H 2 S in activated sludge could enhancethe permeability <strong>of</strong> <strong>membrane</strong>. Dissolvedmatter is mainly responsible for irreversible<strong>fouling</strong> (Yamato et al 2006) so thatapplication <strong>of</strong> H 2 S might lead to reduce theirreversible <strong>fouling</strong>.5CarbohydrateCarbohydrateConcentration, mg/l80706050403020100Effect <strong>of</strong> H 2 S on eEPScC D F GSampleNo <strong>H2S</strong> sparging25 ppm <strong>H2S</strong>sparging50 ppm <strong>H2S</strong>sparging100 ppm <strong>H2S</strong>spargingFig 7: Carbohydrate <strong>of</strong> eEPS at differentH 2 S conc.Concentration <strong>of</strong> carbohydrate in threesamples out <strong>of</strong> four samples dropped whenH 2 S was sparged in higher concentration.Carbohydrate has poor correlation with<strong>fouling</strong> resistance (Meng et al., 2006) sothat H 2 S <strong>diffusion</strong> is less effective techniqueto reduce the <strong>membrane</strong> resistance in term<strong>of</strong> carbohydrate. However, results give thepositive sign <strong>of</strong> filterability improvementwhen H 2 S was sparged in sludge.Total Organic CarbonTOC, mg/l250200150100500Effect <strong>of</strong> H 2 S on TOCD F GSampleNo <strong>H2S</strong> sparging25 ppm <strong>H2S</strong>sparging50 ppm <strong>H2S</strong>sparging100 ppm <strong>H2S</strong>spargingFig 8: TOC <strong>of</strong> eEPS at different H 2 S concConstituents <strong>of</strong> TOC like polysaccharides,humics are adsorbed on the <strong>membrane</strong>surface and increase the <strong>fouling</strong> resistance<strong>by</strong> reducing the pore size. Adsorptiontendency is 46% for polysaccharides and16% for humics in the feed (Huber, 1998).It was found from lab results thatconcentration <strong>of</strong> TOC slightly drops withincrease <strong>of</strong> H 2 S <strong>diffusion</strong> in feed water.According to Huber’s (1998) study, it couldbe concluded that sparging <strong>of</strong> H 2 S improvethe permeability <strong>of</strong> <strong>membrane</strong> as it reducesTOC in feed.
Soluble Microbial Products (SMP)SMP is soluble EPS in feed water. It ismainly composed <strong>of</strong> protein, carbohydrateand total organic carbon. In our experiment,four samples were used to determine theconcentration protein and carbohydrate andfive samples for total organic carbon.Obtained results are given below:ProteinTable 1: Protein conc. (mg/l) in SMPRun C D F GNo H 2 S 38.8 8.3 0 025 ppm H 2 S 25.3 4.3 1.5 4.250 ppm H 2 S 46.3 0 0 0100 ppm H 2 S 33.8 0 14.1 0Concentration <strong>of</strong> protein in SMP has beendetermined after sparing <strong>of</strong> H 2 S in fourdifferent concentrations. Most results showthat protein concentration is very low and itdoes not vary with H 2 S concentration.CarbohydrateTable 2: Carbohydrate conc. (mg/l) in SMPRun C D F GNo H 2 S 0 7.3 6.2 23.625 ppm H 2 S 10.8 11.0 4.8 14.450 ppm H 2 S 8.3 10.9 10.3 14.8100 ppm H 2 S 12.2 13.9 13.9 16.2After <strong>diffusion</strong> <strong>of</strong> H 2 S it was not found asignificant variation <strong>of</strong> carbohydrateconcentration in SMP sample and accordingto obtained result, effect <strong>of</strong> H 2 S onconcentration <strong>of</strong> carbohydrate in SMP is notcountable.Total Organic CarbonTOC, mg/l180160140120100806040200Effect <strong>of</strong> H 2 S on TOCD F G H ISampleNo <strong>H2S</strong> sparging25 ppm <strong>H2S</strong>sparging50 ppm <strong>H2S</strong>sparging100 ppm <strong>H2S</strong>spargingTOC has been measured for five set <strong>of</strong>samples and in two test results, TOC wasnot vary significantly when applied H 2 S insludge but other three set <strong>of</strong> results showthat TOC decreases with the increase <strong>of</strong> H 2 S<strong>diffusion</strong>. As total organic carbon play animportant role <strong>of</strong> in <strong>fouling</strong> resistance,application <strong>of</strong> H 2 S in feed water deduce theTOC and consequently help to increase thefilterability <strong>of</strong> <strong>membrane</strong> in MBRs.ConclusionThis research works have focused on theimpact <strong>of</strong> H 2 S <strong>diffusion</strong> on <strong>membrane</strong><strong>fouling</strong> in MBR operation. ZP, pH, SMP,eEPS have been used to investigate theeffect <strong>of</strong> H 2 S application on <strong>membrane</strong><strong>fouling</strong> behavior. From the obtained result,following specific conclusions could bedrawn out:1. Application <strong>of</strong> H 2 S in feed waterassisted significantly to decrease theconcentration <strong>of</strong> eEPS and SMP TOCin sludge. It was found other studiesthat eEPS and SMP have a vital roleto enlarge the <strong>fouling</strong> resistance(Liang et al., 2007). Therefore,<strong>diffusion</strong> <strong>of</strong> H 2 S enhancedpermeability <strong>of</strong> <strong>membrane</strong> in MBRoperation <strong>by</strong> limiting <strong>fouling</strong>resistance as it reduced theconcentration <strong>of</strong> eEPS and SMPcompounds.2. It is quite clear from obtained resultsthat pH <strong>of</strong> biomass increased withthe increase <strong>of</strong> H 2 S concentration.This elevated pH value facilitates theactivities <strong>of</strong> the livingmicroorganisms which couldimprove the whole treatmentperformance.3. ZP <strong>of</strong> virgin <strong>membrane</strong> is lower thanthe <strong>fouling</strong> <strong>membrane</strong> but the effect<strong>of</strong> H 2 S application on zeta potentialis dubious because it unevenlyvaried with different concentration<strong>of</strong> H 2 S.Fig 9: TOC <strong>of</strong> SMP at different H 2 S conc6
List <strong>of</strong> AbbreviationsCOD - Chemical oxygen demandeEPS - Extracted extracellular polymericsubstancesHRT - Hydraulic retention timeMBR - Membrane bioreactorPVDF - Polyvinylidene fluorideSMP - Soluble microbial productsTOC - Total organic carbonZP - Zeta Potential<strong>fouling</strong> in MBRs (MBRs) caused <strong>by</strong> <strong>membrane</strong>polymer materials, Journal <strong>of</strong> MembraneScience, 280, 911–919http://nition.com/en/products/zeecom_s.htm,(2007, June 10)AcknowledgementsI would like to thank to University <strong>of</strong> NewSouth Wales, Australia for assistance andmaterials support, and to Lund University,Sweden for partial financial and sincereacademic support to carry out this researchwork.ReferencesHuber S. A. (1998). Evidence for <strong>membrane</strong><strong>fouling</strong> <strong>by</strong> specific TOC constituents,Desalination 119, 229-234.Judd, S. (2006). The MBR Book: Principles andApplications <strong>of</strong> Membrane Bioreactors in Waterand Wastewater Treatment, Elsevier, Oxford.Le-Clech, P., Chen, V. and Fane, T.A.G. (2006).Fouling in MBRs used in wastewater treatment,Journal <strong>of</strong> Membrane Science 284, 17–53.Lesjean, B. and Judd, S. (2007). MBR Network,Facts on MBR tech, (online)Available:http://www.mbr-network.eu/mbrprojects/index.php(2007, February 04).Liang, S., Liu, C. and Song, L (2007). Solublemicrobial products in MBR operation:Behaviors, characteristics, and <strong>fouling</strong> potential,Water Research 41, 95 – 101.Lindquist, A. (2003). About Water Treatment,Helsingborg, Sweden : Kemira Kemwater.Meng, F., Zhang, H., Yang, F., Zhang, S., Li, Y.and Zhang, X. (2006). Identification <strong>of</strong> activatedsludge properties affecting <strong>membrane</strong> <strong>fouling</strong> insubmerged MBRs, Separation and PurificationTechnology 51, 95–103Yamato, N., Kimura, K., Miyoshi, T. andWatanabe, Y. (2006). Difference in <strong>membrane</strong>7


