local governance and community development programme - LGCDP
local governance and community development programme - LGCDP
local governance and community development programme - LGCDP

You also want an ePaper? Increase the reach of your titles
YUMPU automatically turns print PDFs into web optimized ePapers that Google loves.
Table of ContentsPageList of AbbreviationFew WordsMaps1. Background 6‐81.1 Objectives of the Performance Measures Based Grant System1.2 Minimum Conditions (MCs)1.3 Performance Measures (PMs)2. Analysis of MCPMs assessment of DDCs 8 ‐282.1 Indicators of MCs2.2 Indicators of PMs2.2.1 Analysis of Assessment of Minimum Conditions (MCs) of DDCs2.2.2 Analysis of Performance Measures (PMs) assessment during the period of 2007/08<strong>and</strong> 2008/093 Analysis of MCPMs result of Municipalities in 2008/09 assessment 28‐353. Analysis of MCs result of all VDCs (FY 2064/65) (2007/08)3.1: Overview of Minimum Conditions (MCs)3.2: Overview of Performance Measures (PMs)4 Analysis of MCs results of all VDCs in 2008/09 assessment. 36‐434.1 Overview of the MCs4.2 Indicators of Minimum Conditions (MCs)4.3: Result Analysis of MCs5 Block Grant Allocation to LBs 43‐436 Issues on Performance Measures 44‐447 Lessons Learned 44‐448 Conclusion 45‐45References 46‐46Annexes 47‐70Annex 1: The MCPMs Assessment toolAnnex 2: The list of MCPMs conducted districts in 2005/06: 20 districtsAnnex 3: The list of Second MCPMs assessment districts on pilot basis ( 2006/07): 55 DDCsAnnex 4. Status of MCPMs assessment during the period 2005/06‐2009/10 in NepalAnnex 5 : Result of Performance Measures (PMs) of all DDCs for the FY 2007/08 & 2008/09Annex 6. Analysis of PMs Result of all MunicipalitiesAnnex 7: Overall results of Minimum Conditions (MCs) of VDCs4
Districts with MCs non complying VDCs (2008/09 assessment)Districts with MCs non comply (2008/09 assessment)5
A BRIEF OVERVIEW OF MINIMUM CONDITIONS ANDPERFORMANCE MEASURES (MCPMS) IN LOCAL BODY OF NEPAL 11. BackgroundThe Government of Nepal (GoN) has implemented the system of allocation minimum grants <strong>and</strong>additional grants to Local Bodies (LBs) in order to carry out assigned duties according to clause236 of the Local Self Governance Act (LSGA), 1999 , sine 2007/08 based on the result of MCPMsof DDCs. The system has replicated in VDCs <strong>and</strong> municipalities from 2009/10. As per them<strong>and</strong>ate <strong>and</strong> spirit of the LSGA, District Development Committees (DDCs), Village DevelopmentCommittees (VDCs), <strong>and</strong> Municipalities are recognized as LBs <strong>and</strong> are responsible in deliveringservices to the people at <strong>local</strong> level.The LSGA also mentions providing an additional grant based on population, level of<strong>development</strong>, possibility <strong>and</strong> capability of mobilizing revenues, degree of the resource gap,adequacy <strong>and</strong> quality of financial transactions, audit reports, <strong>and</strong> so on. Similarly, rule 273“Gha” of the Local Self‐Governance Regulation (LSGR), 1999 provides for a performance basedgrant system to LBs. According to these provisions the Ministry of Local Development (MLD), onrecommendation of the Local Bodies Fiscal Commission (LBFC) can develop minimum conditions<strong>and</strong> performance indicators for LBs <strong>and</strong> link the size of the capital <strong>development</strong> grant to theperformance of the LBs. Under this system, the grants for LBs can be disbursed on the basis ofthe LBs performance. The grant under this system is based on the performance of the LB.The performance‐based grant system was initiated in 20 districts (assessment in 2005/6, nameof districts in annex 2) by MLD with the support of Decentralized Financing <strong>and</strong> DevelopmentProgramme (DFDP). In November 2006, the Government of Nepal decided to roll out theperformance based grant system 2 in all 75 districts through the LBFC, as per the budget speechof FY 2006/07.The Local Governance <strong>and</strong> Community Development Programme (<strong>LGCDP</strong>) has implementedperformance based grant system to provide additional grant to DDCs from the fiscal year2008/2009 <strong>and</strong> for VDCs <strong>and</strong> municipalities from the FY 2009/10.After approving the separate manuals of Minimum Conditions <strong>and</strong> Performance Measures(MCPMs) of all LBs, the Local Body Fiscal Commission (LBFC) is operating the MCPM <strong>programme</strong>on this same basis. In accordance to this program, the country wide assessment of DDCs <strong>and</strong>municipalities has started from the fiscal year 2007/08 <strong>and</strong> 2008/09 respectively. Likewise, theMCs system was also initiated in all VDCs from FY 2008/09. The system of MCPM assessmenthas been linked with the capital grants to be provided by the GoN to DDCs <strong>and</strong> additional blockgrants available from the <strong>LGCDP</strong>. The result of the MCPMs of the previous two years directlyaffects the capital grants of the current fiscal year (the MCPMs assessment tool <strong>and</strong> secondMCPMs assessment on pilot basis are presented in annex 1 <strong>and</strong> 3 respectively).Minimum conditions (MCs) must be met by LBs to be entitled to receive the unconditionalcapital grants. All minimum conditions refer to statutory requirements already in place in Nepal.Performance Measures (PMs) are necessary developing a method of measuring an1 The analysis of the results is the author’s personal findings which do not necessarily reflect the views of MLD/LBFC/<strong>LGCDP</strong>.2 Nepal is the first country in the world to roll out such a performance based grant system to all Local Bodies. The result of all three LocalBodies’ performances has been presented here. These are presented analytically in tabular form. Each <strong>and</strong> every table itself present thefindings. There would have been a great achievement if these findings <strong>and</strong> issues can be addressed officially.6
organizations performance with the purpose of external comparison to other organizations orfor internal use as a way of monitoring improvement, efficiency or similar.As said, the first annual nation‐wide MCPMs assessment (with budget implications for FY2008/09) was conducted in June 2008 (assessment for 2007/8). Forty‐seven out of the 75 DDCscompleted all the indicators of MCs, <strong>and</strong> all DDCs were adjusted accordingly in the grantallocation from the GoN unconditional capital grants. RS 148 million were allocated asentitlement (even for the non‐compliant DDCs) <strong>and</strong> Rs 223 million were allocated based on theactual performance of the DDCs on the MCPM scale. The 47 DDCs which complied with all MCsalso received the topping up capital grant (for FY 2008/09) from <strong>LGCDP</strong>.The second nation‐wide MCPMs assessment (with implications for FY 2009/10) was carried outfrom March – June 2009 (assessment for 2007/8). In this assessment the number of DDCs,which complied with the MCs, increased to 67 DDCs <strong>and</strong> the performance of the DDCs within allcomposite performance areas improved significantly from previous years. As in the previous FY,the block grant schemes (GoN block grants <strong>and</strong> the topping‐up grants) was not blended due todelays in the approval of the joint financing arrangements with DPs. The 67 compliant DDCshave received extra topping‐up grant.The MCPMs assessment for the municipalities was conducted by using the same procedure asfor the DDCs (ie. open competition to select an independent consultant) in May <strong>and</strong> June 2009(assessment for 2007/8). Two municipalities, Kathm<strong>and</strong>u <strong>and</strong> Khadbari, could not comply withthe MCs. The topping up budget of approximately Rs 350 Million was allocated to the MCscomply 56 municipalities.The MCs assessment of the VDCs (assessment for 2007/8) was organized for the first time Mayto July 2009 (impact on the topping up allocations in FY 2009/10). The assessment wascontracted out to <strong>local</strong> firms by the DDCs. MCs assessment of VDCs was carried out in all thedistricts with the exception Mahotari (76 VDCs) <strong>and</strong> partially Sarlahi (9 VDCs) district, all districtswere able to assess the MCs. Out of MCs assessed 3,830 VDCs, 3409 VDCs were passed in MCsto the given 5 indicators. The topping up budget Rs 1.2 billion was allocated to MCs comply2749 VDCs with the DAG mapping (4 <strong>and</strong> 3). Status of MCPMs assessment during the period2005/06‐2009/10 in Nepal is presented in annex 4.1.1 Objectives of Performance Based Grant System7• To improve <strong>local</strong> <strong>governance</strong>/bodies performance through a penalty <strong>and</strong> incentivesmechanism• To adapt the size of the grants to the expenditure <strong>and</strong> performance capacity in thekey functional areas• To identify the capacity gaps of LGs in different functional areas• To strengthen the general monitoring <strong>and</strong> evaluation (M/E) system through theannual assessmentThe performance based grant allocation system was introduced to put pressure on the LBs forthe compliance with rules/regulations, to improve service delivery <strong>and</strong> to improveaccountability, transparency, good <strong>governance</strong>, etc. The system provides incentives to LGs forthe improvement of institutional performance, change in functions, systems <strong>and</strong> procedures
<strong>and</strong> enhance accountability to citizens. The performances of LBs are assessed on the basis ofindicators of Minimum Conditions (MCs) <strong>and</strong> Performance Measures (PMs).1.2 Minimum Conditions (MCs)Minimum conditions are such indicators by which the LBs are assessed to see whether theyobserved the laws which are compulsory to them. The amount of grants receivable by the LBsshall be determined on the basis of MCs assessment. They are the minimum safeguards forproper utilization of public resources <strong>and</strong> for identifying the basic absorption capacity followedby financial discipline. Indicators for MCs are statutory requirements of LBs as provisioned inthe Local Self‐Governance Act 1999 (LSGA) <strong>and</strong> associated rules <strong>and</strong> regulations. Indicators forMCs are core service delivery functional areas of LBs such as planning <strong>and</strong> budgeting, financialmanagement, functioning of various committees, transparency, accountability etc. In order toreceive annual unconditional capital <strong>development</strong> grant, LBs must have meet all indicators ofMCs. In case the LBs cannot fulfill the minimum conditions, there shall be reduction in grantsreceivable by them. The responsible officer <strong>and</strong> staffs may be awarded if additional grant isreceived, or sanctioned if allocated grant is deducted.1.3 Performance Measures (PMs)Performance Measures (PMs) are designed to create incentives for LGs to improve theirperformance. PMs provide a range of score in different functional areas that help to assess theservice delivery capacity <strong>and</strong> efficiency. LBs annual grant will depend on the scores achieved inPMs. The indicator of the performance evaluates the procedures, result <strong>and</strong> quality of thedifferent working areas of the LB. These indicators direct the LBs to monitor its own function, toimprove internal working capacity <strong>and</strong> to compare its activities with other LBs.The assessment of MCs <strong>and</strong> PMs of LBs helps to establish data on service delivery status,accountability to citizens <strong>and</strong> also identified the capacity gap in various functional areas. Suchinformation is used for developing a strategic <strong>and</strong> pragmatic capacity building <strong>programme</strong>.Furthermore, regular assessment of MCs <strong>and</strong> PMs will strengthen the general M/E system ofLBs that promotes annual progress in various service delivery functions, responsibility <strong>and</strong>ensure that accountability can be measured.2. Analysis of MCPMs assessment of DDCs2.1 Indicators of MCsThe MCPMs assessment manual consists of 15 MCs indicators, which covers four functionalareas. However, only 13 indicators within three functional areas have been applied. Otherindicators would not be applicable unless political representatives are in place in DDCs. Thefunctional areas <strong>and</strong> indicators of MCs are as follows.81. Planning <strong>and</strong> Management1.1 Approved annual plan <strong>and</strong> budget for the current year by District Council in previousFinance Year (LSGA, Art. 188, 195, 197 <strong>and</strong> LSGR Art. 199).
1.2 Annual budget ceiling <strong>and</strong> planning guidelines provided to Municipalities <strong>and</strong> VDCs (cf.LGSR, Art. 199) by DDC to all VDCs. In case central government did not provide suchguidelines <strong>and</strong> ceilings to DDCs, even then the DDC should have provided them from itsinternal resources.1.3 DDC has publicly informed the Municipalities, VDCs <strong>and</strong> relevant stakeholders(inhabitants) about the approved annual budget <strong>and</strong> programs (LSGA Art. 202, 2 (i)) ofthe previous FY.1.4 Annual Progress Review of the previous year conducted by the DDC as per LSGA 211.The review workshop of the previous year has been conducted within the first 6 monthsof the current FY.1.5 DDC has submitted its reports as per the provision mentioned in grant guideline. Being aTrigger MCs, grant to DDC could be stopped in the middle of a FY if not complied with.2. Financial Management2.1 Accounts from previous FY but one completed <strong>and</strong> submitted for final audit (LBFAR 203).2.2 DDC has prepared the annual statement of income <strong>and</strong> expenditures of DistrictDevelopment Fund (DDF) <strong>and</strong> financial statements for the previous FY (LBFAR 196).2.3 DDC must release the budget or grant from DDF (non‐operating account to) VDCs,Municipalities, sectors <strong>and</strong> other organizations as per approved work plans <strong>and</strong> budgets.No transfer should be made in the operating account prior to council approval.2.4 Internal Audit Section established (LSGA art. 232) <strong>and</strong> functioning in accordance with(LBFAR art. 57 <strong>and</strong> 58) (to be complied by the end of Baisakh 2065).2.5 Due <strong>and</strong> timely response have been made upon comments <strong>and</strong> reactions made in theOffice of the Auditor's General Report. DDC must have had to respond on comments ofAudit report within the given time or 35 days from the date of received report (LBFAR205 ‐1).2.6 Cumulative Records of unsettled irregularities documented <strong>and</strong> updated (LBFAR 60Annex 75)2.7 DDC appoints final auditors to audit last FY of the last FY of VDCs final accounts 3 .3. Transparency3.1 Information <strong>and</strong> records centre keeps all information <strong>and</strong> records as specified (LSGA Art.212)3 Simply revised in the second amendment,20099
2.2 Indicators of PMsA total of 62 indicators covering eight functional areas have been fixed for PMs. Out of that 57indicators representing eight functional areas have been applied. Out of remaining 5 indicatorscan be applied only after the appointment of political representatives in DDCs.Table 1.1: Summary of PM indicators <strong>and</strong> ScorePerformance areas1. Planning <strong>and</strong> ProgramManagementNumber ofindicatorsMaximumScoreMinimum ScoreRequired8 15 62. Budget Management 6 11 43. Financial Management 9 15 64. Fiscal Capacity 6 11 45. Budget release <strong>and</strong> ProgramExecution6. Communication <strong>and</strong>Transparency7 12 48 14 57. Monitoring <strong>and</strong> Evaluation 5 10 38. Organization, Service Delivery<strong>and</strong> Property Management8 12 4Total 57 100 36In order to receive allocated full capital grant, each DDC must have had to pass all indicators ofMCs <strong>and</strong> also have to achieve minimum score in all functional areas of PMs in order not to besanctioned. 20% sanction on allocated grant will be applied if DDCs fail to achieve minimumscore in any one of the functional areas of PMs. The functional areas <strong>and</strong> indicators of PMs areas follows.1. Planning & Programme Management1.1 Budget ceiling <strong>and</strong> planning guidelines issued by the DDC to the VDCs, municipalities <strong>and</strong>sector agencies should mention pro‐poor policy, national <strong>and</strong> district <strong>development</strong>priorities, criteria for selecting projects (cf. LSGA 1999).1.2 Participatory planning process followed (cf. LSGA 197, <strong>and</strong> LSGR, Art. 199)1.3 Compliance with the procedures <strong>and</strong> checklists for selection of investment proposals areapplied as an integral part of the planning cycle1.4 Annual plan is prepared, using the resource map <strong>and</strong> poverty information <strong>and</strong> districtsectoral plans.1.5 Representatives from NGOs, civil society <strong>and</strong> organization related with women <strong>and</strong>children <strong>and</strong> disabled groups are invited in the sectoral meeting of plan formulationcommittee meeting10
1.6 Pre‐feasibility of projects are done before plan approval. (Applicable in case of largerprojects bigger than Rs 1.5 million) This ceiling is decided as per as per budget guidelineby MoF, 2007.1.7 Plan <strong>and</strong> budget is clearly linked, especially in terms of infrastructure projects(Limited to infrastructure projects that have total cost of Rs 500 thous<strong>and</strong> or more)1.8 The plan specifies O & M arrangements (responsible body, costs, funding source etc.) forall projects.(Limited to those approved projects larger than Rs 1.5 million)2. Budget Management2.1 Percentage (%) of infrastructure projects completed within the approved cost estimate<strong>and</strong> budget.2.2 Percentage of previous Fiscal Year’s internal revenues collected against budgetedrevenues.2.3 Budget for target groups considers the need <strong>and</strong> concerns of DAG, ethnic groups,disabled <strong>and</strong> old people.2.4 Annual plan allocate budget directly benefiting for women <strong>and</strong> children from internalresource. More emphasis is given to allocate resources for women <strong>and</strong> children frominternal source.2.5 All eight Special fund accounts established <strong>and</strong> budget provision has been ensuredaccording to LBFAR 54 (ka).2.6 DDC has deposited matching fund as per agreement with GON <strong>and</strong> other donorssupported programs/projects3. Financial Management3.1 Status of outst<strong>and</strong>ing advances at the end of the FY.3.2 DDCs provide economic support or donation within the limit as mentioned in thefinancial rules/regulation.3.3 Quality of audit report for the previous FY.3.4 Volume of cumulative audit irregularities up to the end of previous year but one, settledduring the previous fiscal year.3.5 Liabilities of previous fiscal year not paid within the same FY as compared to totalexpenditure of that FY (these liabilities will impact on the next FY).3.6 DDCs prepared annual procurement plan.3.7 Utilization status of deposit account.3.8 Computer accounting package installed <strong>and</strong> financial report prepared.3.9 Document all recoverable amount as recommended by the OAG in the audit report <strong>and</strong>made due effort to recover such amount.11
4. Fiscal Resource Mobilization Capacity4.1 DDC has done study/estimation of potential internal revenue sources <strong>and</strong> projectionsare done accordingly. All possible internal revenue sources are identified <strong>and</strong> estimationhas been done considering the capacity of the DDC to mobilize them.4.2 Fiscal Effort: Percent increase in the internal revenue (tax, service charge, rent, sale, feelevied) as per LSGA <strong>and</strong> LBFAR compared to previous year (except for the revenueshared by the central government).4.3 Adherence to the regulations on transfer of funds to Municipalities <strong>and</strong> VDCs of theapplicable internal revenue sources.4.4 Budget arrangement is done for the <strong>development</strong> <strong>and</strong> sustainability of the internalrevenue sources.4.5 Revenues shared by the central government are spent on those priority sectors (fromwhere such revenue are obtained).4.6 DDC has established internal revenue section <strong>and</strong> it is functional5. Budget Release <strong>and</strong> Programme Execution5.1 Percentage of actual expenditure on against planned <strong>development</strong> budget in theprevious FY.5.2 Percentage of actual capital <strong>development</strong> expenditure against capital <strong>development</strong>budget in the previous year.5.3 Expenditure made on programs addressing the need <strong>and</strong> concerns of women, children,DAG, ethnic groups, disabled <strong>and</strong> old people.5.4 DDC has complied with the limit regarding administrative/regular expenses as specifiedby law.5.5 Income received from revenue sharing is not spend for administrative purpose.5.6 Expenditures on Operational <strong>and</strong> maintenance of larger investments (projects largerthan Rs 1.5 million) made as per budget.5.7 Inventory of projects (larger than Rs 500 thous<strong>and</strong>) completed in the past 3 consecutiveyears maintained.6. Communication And Transparency6.1 DDC provides information to the public about project selection criteria, <strong>and</strong> approvedannual plan <strong>and</strong> budget.6.2 DDC provides information to the public about the DDC’s annual statements of incomes<strong>and</strong> expenditures.6.3 Project Information board/hoarding boards are maintained at project sites in projectsexceeding Rs 300 thous<strong>and</strong>.6.4 Reports of Auditor General submitted to the Council <strong>and</strong> decision is made.12
6.5 Information/record/documentation centre operational (LSGA 212) <strong>and</strong> opened to thepublic (access).6.6 Public hearing system implemented about the services <strong>and</strong> <strong>development</strong> activities ofDDC.6.7 DDC should publish the results of the MC/PM‐assessment result through media, noticeboards or public meetings.6.8 Social Audit conducted within four months after the end of FY.7. Monitoring <strong>and</strong> Evaluation7.1 Implementation status of Monitoring <strong>and</strong> Evaluation System.7.2 Reporting: Submission of monthly <strong>and</strong> annual statement of income <strong>and</strong> expenditurewithin the time limit <strong>and</strong> specified format.7.3 Final inspections <strong>and</strong> clearance by DDC of projects within one month after completionreport is received.7.4 Impact studies/analysis of the DDC level projects about their implications on the poor.7.5 DDC has carried out annual review about the status <strong>and</strong> budget of programs/projectsimplemented with donor support within first trimester of the FY.7.6 Functioning of DDC supervision <strong>and</strong> monitoring sub‐committee.8. Organizations, Service Delivery <strong>and</strong> Property Management8.1 DDC has carried out study about organization <strong>development</strong> (OD).8.2 DDC has prepared <strong>and</strong> updated the inventory/record of its assets/property.8.3 Inspection (physical verification) of stores carried out during the previous year.8.4 Internal control <strong>and</strong> audit procedures elaborated, disseminated <strong>and</strong> enforced.8.5 Establishment <strong>and</strong> functioning of staff recruitment committee.8.6 DDCs organize regular staff meeting.8.7 Provision of help‐desk in the DDCs.8.8 Capacity building plan of DDC is formulated.13
2.2 .1 Analysis of Assessment of Minimum Conditions (MCs) of DDCsThe first annual nation‐wide MCPMs assessment (with budget implications for FY 2008/09)was conducted in June 2008 (assessment for 2007/8). Forty‐seven out of the 75 DDCscompleted all the indicators of MCs, <strong>and</strong> all DDCs were adjusted accordingly in the grantallocation from the GoN unconditional capital grants. RS 148 million were allocated asentitlement (even for the non‐compliant DDCs) <strong>and</strong> Rs 223 million were allocated based onthe actual performance of the DDCs on the MCPM scale. The 47 DDCs which complied withall MCs also received the topping up capital grant (for FY 2008/09) from <strong>LGCDP</strong>.The second nation‐wide MCPMs assessment (with implications for FY 2009/10) was carriedout from March – June 2009 (assessment for 2007/8). In this assessment the number ofDDCs, which complied with the MCs, increased to 67 DDCs <strong>and</strong> the performance of theDDCs within all composite performance areas improved significantly from previous years. Asin the previous FY, the block grant schemes (GoN block grants <strong>and</strong> the topping‐up grants)was not blended due to delays in the approval of the joint financing arrangements with DPs.The 67 compliant DDCs have received extra topping‐up grant. Detail result of PerformanceMeasures (PMs) of all DDCs for the FY 2007/08 & 2008/09 is analyzed in annex 5.Table 2.1: Overall MCs result in 2007/8 <strong>and</strong> 2008/9 assessmentAreas <strong>and</strong> IndicatorsNo of NotMCsIndicator noComplyingdistricts1. Planning <strong>and</strong> BudgetingName of districts not complying MCs2007/08 2008/091.1 63 (Panchathar, Kathm<strong>and</strong>u &Rauthahat)3 (Saptari, Sarlahi & Bara)1.2 2321 (Ilam, Panchathar,Shankhuwasabha, Bhojpur,Sunsari, Saptari, Siraha,Mahottari, Sarlahi, Rautahat,Palpa, Kaski, Baglung, Mustang,2 (Sirha & Mahottari)Dolpa, Humla, Kalikot, Pyuthan,Dailekh, Dadeldhura &Kanchanpur)1.3 3 Rauthahat Mahottari & Sarlahi1.4 1716 (Ilam, Panchathar, Bhojpur,Saptari, Siraha, Mahottari,Kathm<strong>and</strong>u, Rautahat, Palpa,Kaski, Manang, Mustang, Myagdi,SaptariPyuthan, Dadeldhura &Kanchanpur)1.5 2 ‐ Mahottari & Sarlahi2. Financial Management14
Areas <strong>and</strong> IndicatorsName of districts not complying MCsIndicator noNo of NotMCsComplying2007/08 2008/09districts2.1 0 ‐ ‐2.2 0 ‐ ‐2.3 0 ‐ ‐2.4 149 (Ilam, Bhojpur, Sunsari, Saptari,5 (Saptari, Siraha, Sarlahi,Siraha, Sarlahi, Lamjunj, Kalikot &Mugu & Bardia)Mugu)8 (Panchathar, Bhojpur, Sunsari,2.5 9 Parsa, Rautahat, Baglunj, MustanjSiraha,& Dailekh)2.6 86 (Siraha, Mahottari, Sarlahi,Palpa, Mustang & Dolpa)Siraha &Sarlahi2.7 5 ‐5 (Siraha, Bara, Kapilbastu,Bardia & Mugu)3. Transparency3.1 5Panchathar, Kathm<strong>and</strong>u &RauthatSaptari & SarlahiTable 2.2: Name of Districts which could not comply with MCs in two times in the sameindicatorIndicator Area DistrictsAnnual budget ceilings <strong>and</strong>planning guidelines Planning & Budgeting Sirha & MahottariAnnual progress review done Planning & Budgeting SaptariInternal Audit section established<strong>and</strong> functioningSaptari,Siraha,Sarlahi &MuguFinancial ManagementDDC updated document ofirregularities (not settled) amountshown in the Auditor's Report Financial Management Siraha & SarlaiIt is expected that the MLD <strong>and</strong> other concerned authorities would think seriously about these DDCs forthe improvements in the above areas <strong>and</strong> indicators.15
Table 2.3: Name of Districts complying MCs in 2007/08 but could not comply in 2008/09Failed Indicator Area DistrictApproved annual plan <strong>and</strong> budget Planning & Budgeting BaraDDC timely appoints final auditors to auditBara & KapilbastuVDCs accountsFinancial ManagementInternal Audit Section established <strong>and</strong>functioning Financial Management BardiaIt is of concern where DDCs previously passed assessments <strong>and</strong> now have failed. It is very essential tofind out the reality why these DDCs failed in the last assessment.Table 2.4: Name of Districts not comply MCs in 2008/09 assessmentThe number of DDCs which could not comply the MCs along with number of indicators in FY2008/09 assessment are: Mugu (2), Bardia (2), Kapilbastu ( 1), Bara(2), Sarlai(6),Mahotari(3), Saptari(4) <strong>and</strong> Siraha(5). Non complying areas <strong>and</strong> indicators are given asfollows:Non Complying Indicators Area DistrictsApproved annual plan <strong>and</strong> budget Planning & Budgeting Saptari,Sarlahi & BaraAnnual budget ceilings <strong>and</strong> planningguidelinesPlanning & Budgeting Sirha & MahottariPublicly information about the approved<strong>programme</strong>s <strong>and</strong> projectsPlanning & Budgeting Mahottari &SarlahiAnnual progress review done Planning & Budgeting SaptariReporting compliance to MLD Planning & Budgeting Mahottari & SarlahiInternal Audit section established <strong>and</strong>Saptari,Siraha,Sarlahi,Mugu,Financial ManagementfunctioningBardiaReactions on the audit reports. Financial Management SirahaDDC updated document of irregularities(not settled) amount shown in the Auditor's Financial Management Siraha &SarlahiReportDDC timely appoints final auditors to auditSiraha,Bara,Kapilbastu,BardiFinancial ManagementVDCs accountsa &MuguInformation <strong>and</strong> records centre established<strong>and</strong> keeps information/records as specifiedTransparencySaptari & SarlahiThe above table shows that all DDCs that could not comply MCs are in the Terai region except Mugu.This is most likely due to the poor security/political situation in the Terai. However, taking this intoaccount it is required to find out the reason behind the none complying the MCs.Mugu is only one district which could not comply MCs in all assessments. The MLD <strong>and</strong> political partiesneed to give due attention <strong>and</strong> take action to improve the performance of Mugu district.16
Table 2.5: The Major areas <strong>and</strong> indicators for not complying MCsIndicatorsInternal Audit section established <strong>and</strong> functioningDDC timely appoints final auditors to audit VDCs accountsApproved annual plan <strong>and</strong> budgetPublicly information about the approved <strong>programme</strong>s <strong>and</strong>projectsReporting compliance to MLDInformation <strong>and</strong> records centre established <strong>and</strong> keepsinformation/records as specifiedDDC updated document of irregularities (not settled) amountshown in the Auditor's ReportReactions on the audit reports.Annual progress review doneAreasFinancial ManagementFinancial ManagementPlanning & BudgetingPlanning & BudgetingPlanning & BudgetingTransparencyFinancial ManagementFinancial ManagementPlanning & Budgeting17
2.2.2 Analysis of Performance Measures (PMs) assessment during the period of 2007/08 <strong>and</strong>2008/09Table 2.6: Result of Performance Measures (PMs)ZoneMechiKoshiSagarmathaJanakpurBagmatiNarayaniLumbiniG<strong>and</strong>akiDistrictsMCsScore of PMs2007/08 2008/09 2007/08 2008/09Average ScoreIllam Not met Met 51 69 60.00Jhapa Met Met 61 73 67.00Taplejung Met Met 52 67 59.50Panchthar Not met Met 34 69 51.50Dhankuta Met Met 67 85 76.00Shankhuwasabha Not met Met 36 86 61.00Bhojpur Not met Met 49 51 50.00Morang Met Met 63 84 73.50Sunsari Not met Met 56 69 62.50Terhathum Met Met 70 82 76.00Khotang Met Met 67 83 75.00Saptari Not met Not met 49 59 54.00Solukhumbhu Met Met 53 52 52.50Udayapur Met Met 71 81 76.00Siraha Not met Not met 58 55 56.50Okhaldhunga Met Met 47 45 46.00Dhanusha Met Met 35 68 51.50Dolakha Met Met 60 61 60.50Mahottari Not met Not met 39 51 45.00Ramechap Met Met 70 66 68.00Sarlahi Not met Not met 44 50 47.00Sindhuli Met Met 45 44 44.50Bhaktapur Met Met 66 66 66.00Dhading Met Met 77 93 85.00Kathm<strong>and</strong>u Not met Met 80 56 68.00Kavrepalanchok Met Met 79 81 80.00Lalitpur Met Met 66 52 59.00Nuwakot Met Met 55 77 66.00Rashuwa Not met Met 43 69 56.00Sindhupalchok Met Met 60 67 63.50Bara Met Not met 46 55 50.50Chitwan Met Met 51 69 60.00Makwanpur Met Met 68 73 70.50Parsa Not met Met 43 52 47.50Rautahat Not met Met 18 54 36.00Arghakhanchi Met Met 66 67 66.50Gulmi Met Met 50 81 65.50Kapilvastu Met Not met 69 61 65.00Nawalparasi Met Met 67 75 71.00Palpa Not met Met 57 83 70.00Rup<strong>and</strong>ehi Met Met 53 49 51.00Gorkha Met Met 47 65 56.00Kaski Not met Met 54 82 68.00Lamjung Not met Met 60 74 67.00Manang Not met Met 43 71 57.0018
ZoneDhaulagiriKarnaliRaptiBheriSetiMahakaliDistrictsMCsScore of PMs2007/08 2008/09 2007/08 2008/09Average ScoreSyangja Met Met 58 81 69.50Tanahun Met Met 64 83 73.50Baglung Not met Met 49 74 61.50Mustang Not met Met 42 53 47.50Myagdi Not met Met 45 63 54.00Parbat Met Met 40 73 56.50Dolpa Not met Met 41 58 49.50Humla Not met Met 62 70 66.00Jumla Met Met 56 74 65.00Kalikot Not met Met 38 65 51.50Mugu Not met Not met 51 44 47.50Dang Met Met 64 68 66.00Pyuthan Not met Met 67 64 65.50Rolpa Met Met 58 55 56.50Rukum Met Met 67 58 62.50Salyan Met Met 77 78 77.50Banke Met Met 50 66 58.00Bardia Met Not met 49 49 49.00Dailekh Not met Met 42 62 52.00Jajarkot Met Met 69 62 65.50Surkhet Met Met 54 61 57.50Achham Met Met 59 50 54.50Bajhang Met Met 71 71 71.00Bajura Met Met 63 67 65.00Doti Met Met 59 66 62.50Kailali Met Met 59 62 60.50Baitadi Met Met 54 66 60.00Dadeldhura Not met Met 52 59 55.50Darchula Met Met 61 77 69.00Kanchanpur Not met Met 58 58 58.00Total marks in PMs 4174 4959 4567Average 55.65 66.12 60.89The above table shows that the average performance score of DDCs have increased by 18.81percent to the previous year assessment <strong>and</strong> the average score for the two year is 60.89percent. This indicated that the performance rate of DDCs is satisfactory.19
Table 2.7: Criteria of grant allocation based on MCPMs assessmentPerformance “rating” <strong>and</strong>Staff Incentives based onReward/ SanctionconditionsDDCs PerformanceMC not met Loose all grant amount ‐MC met but failed in any one ofthe areas of PMsloose by 20 % ‐MC met & received 36‐50 marksin PMsStatic ‐MC met & received 51‐65 marksin PMsBonus by 20 %Rs. 100 thous<strong>and</strong>MC met & received 66‐80 marksin PMsBonus by 25 %Rs. 125 thous<strong>and</strong>MC met & received 80 + marksin PMsBonus by 30 %Rs. 150 thous<strong>and</strong>Table 2.8: Distribution of districts receiving <strong>and</strong> non receiving grants for two yearsFYLoose AllLoose Bonus Bonus BonusStaticGrants20 % 20 % 25% 30%2008/09 28 6 7 19 15 02009/10 8 3 4 18 29 13Table 2.9: Top nine districts in average performance rate in the last two year’s assessmentDistrict Average score Score in 2007/8 Score in 2008/9Dhading 85 77 93Kavrepalanchok 80 79 81Salyan 77.5 77 78Udayapur 76 71 81Dhankuta 76 67 85Terhathum 76 70 82Khotang 75 67 83Tanahun 73.5 64 83Morang 73.5 63 8420
Table 2.10: Last nine districts in average performance rate for the last two year’s assessmentDistrict Average score Score in 2007/8 Score in 2008/9Rautahat 36 18 54Sindhuli 44.5 45 44Mahottari 45 39 51Okhaldhunga 46 47 45Sarlahi 47 44 50Mugu 47.5 51 44Parsa 47.5 43 52Mustang 47.5 42 53Bardia 49 49 49The above two tables show that Dhading district is in the number one position <strong>and</strong>Rauthat the last one in the performance rate in the last 2 years’ assessment. However, thefollowing table shows that Rautahat district falls in the number one position in growthrate that increased the score from 18 to 54. While Kathm<strong>and</strong>u district decreased its scorefrom 80 to 56 i.e. declined by 30 percent.Table 2.11: Top ten districts in growth rate for the last two year’s assessment.Districts Average score Score in 2007/8 Score in 2008/9IncreasedScore in %Rautahat 36 18 54 200Shankhuwasabha 61 36 86 139Panchathar 51.5 34 69 103Dhanusha 51.5 35 68 94Parbat 56.5 40 73 83Kalikot 51.5 38 65 71Manang 57 43 71 65Gulmi 65.5 50 81 62Rashuwa 56 43 69 60Kaski 68 54 82 52Table 2.12: Last ten districts in growth rate for the last two year’s assessmentDistrictDecreasedAverage score Score in 2007/8 Score in 2008/9 score in %Kathm<strong>and</strong>u 68 80 56 ‐30.00Lalitpur 59 66 52 ‐21.21Achham 54.5 59 50 ‐15.25Mugu 47.5 51 44 ‐13.73Rukum 62.5 67 58 ‐13.43Kapilvastu 65 69 61 ‐11.59Jajarkot 65.5 69 62 ‐10.14Rup<strong>and</strong>ehi 51 53 49 ‐7.55Ramechap 68 70 66 ‐5.71Siraha 56.5 58 55 ‐5.1721
Table 2.13: The Mean <strong>and</strong> St<strong>and</strong>ard deviation of the score of PMs in the last 2 year’sassessmentFY Mean SD Minimum Maximum2007/8 55.65 11.87 18 802008/9 66.12 11.49 44 93The above table shows that the DDCs have increased their performance rate by comparing withthe previous year’s assessment.Table 2.14: Aggregate Performance rate for the last 2 year’s assessmentPMs AreasNumberofindicatorsFull marksMarksPass marksMarksReceived1.Planning & ProgrammeManagement8 15 6 10.15 67.672.Budget Management 6 11 4 7.33 66.643.Financial Management 9 15 6 8.63 57.534.Fiscal Resource MobilizationCapacity6 11 4 5.98 54.365.Budget Release <strong>and</strong>Programme Execution7 12 4 6.15 51.256.Communication AndTransparency8 14 5 8.43 60.217.Monitoring <strong>and</strong> Evaluations 5 10 3 5.91 59.108.Organizations, ServiceDelivery <strong>and</strong> Property8 12 4 8.38 69.83Management57 100 36 60.96 60.96Out of eight functional areas, organizations, service delivery <strong>and</strong> property managementlist highest score while budget release <strong>and</strong> <strong>programme</strong> execution received lowest score.Table 2.15: List of Indicators with good performance in the last 2 year’s assessmentIndicatorMarksFull markAreasNoreceived%Financial Management 3.5 2 1.89 94.67Organizations, Service Delivery &Property Management8.5 1 0.94 94.00Communication & Transparency 6.5 2 1.84 92.00Planning & Programme Management 1.2 2 1.83 91.67Fiscal resource Mobilization Capacity 4.6 1 0.90 90.00Monitoring & Evaluation 7.2 2 1.78 89.00budget release & Programme Execution 2.1 2 1.76 88.00budget release & Programme Execution 2.6 2 1.69 84.33Financial Management 3.7 2 1.68 84.00%22
IndicatorNoFull markMarksreceivedAreasOrganizations, Service Delivery &Property Management8.7 1 0.84 84.00Organizations, Service Delivery &Property Management8.2 2 1.65 82.67Planning & Programme Management 1.5 2 1.64 82.00Financial Management 3.8 1 0.82 82.00Organizations, Service Delivery &8.6 1 0.81 81.33Property ManagementOrganizations, Service Delivery &Property Management8.1 2 1.57 78.33budget release & Programme Execution 5.5 1 0.76 76.00budget release & Programme Execution 5.7 1 0.76 76.00Communication & Transparency 6.2 2 1.43 71.67Planning & Programme Management 1.1 2 1.43 71.33Organizations, Service Delivery &8.3 2 1.43 71.33Property ManagementPlanning & Programme Management 1.7 2 1.41 70.67budget release & Programme Execution 2.2 2 1.40 70.00Communication & Transparency 6.1 2 1.39 69.67Monitoring & Evaluation 7.5 2 1.37 68.33Fiscal resource Mobilization Capacity 4.2 2 1.36 68.00Monitoring & Evaluation 7.3 2 1.35 67.33Planning & Programme Management 1.3 2 1.33 66.67budget release & Programme Execution 5.1 2 1.29 64.33Planning & Programme Management 1.4 2 1.28 64.00Communication & Transparency 6.4 1 0.63 63.33Financial Management 3.1 2 1.20 60.00Financial Management 3.2 2 1.19 59.33budget release & Programme Execution 5.2 2 1.19 59.33Communication & Transparency 6.3 2 1.06 53.00Organizations, Service Delivery &8.4 1 0.53 52.67Property Managementbudget release & Programme Execution 2.3 2 1.05 52.33Monitoring & Evaluation 7.1 2 1.04 52.00Fiscal resource Mobilization Capacity 4.3 2 1.03 51.67budget release & Programme Execution 2.4 1 0.51 51.33Communication & Transparency 6.7 2 1.02 51.00Fiscal resource Mobilization Capacity 4.4 2 1.01 50.67Indicators 3.5 <strong>and</strong> 3.3 which belongs to the same functional area (Financial Management)have placed in very good (94.67 %) <strong>and</strong> very bad (18.67 %) positions respectively.%23
Table 2.16: List of Indicators with bad performance in the last 2 year’s assessmentAreasIndicator Full MarksNo mark received%Financial Management 3.3 2 0.37 18.67Monitoring & Evaluation 7.4 2 0.38 19.00Budget release & Programme Execution 5.4 2 0.41 20.67Financial Management 3.6 1 0.27 27.33Organizations, Service Delivery & PropertyManagement8.8 2 0.61 30.67Communication & Transparency 6.8 1 0.31 31.33Communication & Transparency 6.6 2 0.74 37.00Financial Management 3.9 1 0.37 37.33Fiscal resource Mobilization Capacity 4.1 2 0.77 38.33Planning & Programme Management 1.6 1 0.39 39.33budget release & Programme Execution 5.6 2 0.80 40.00Planning & Programme Management 1.8 2 0.83 41.33Financial Management 3.4 2 0.83 41.67Fiscal resource Mobilization Capacity 4.5 2 0.91 45.33Table 2.17: Top 12 <strong>and</strong> last 12 districts with good <strong>and</strong> bad performance in planning &Development in the last 2 year’s assessmentFull Marks: 15, Pass Marks: 6Top 12 Last 12District Marks District MarksKavrepalanchok 15 Sarlahi 3.5Morang 13.5 Rautahat 3.5Salyan 13.5 Mahottari 5.5Udayapur 13 Dhanusha 6Bhaktapur 12.5 Okhaldhunga 7Dhading 12.5 Panchathar 7.5Nuwakot 12.5 Rup<strong>and</strong>ehi 7.5Makwanpur 12.5 Mugu 7.5Nawalparasi 12.5 Dailekh 7.5Lamjung 12.5 Sunsari 8Tanahun 12.5 Mustang 8Baglung 12.5 Parbat 824
Table 2.18: Top 5 <strong>and</strong> last 6 districts with good <strong>and</strong> bad performance in budget managementFull Marks: 11, Pass Marks: 4Top 5 Last 6District Marks District MarksDhankuta 10.5 Dolpa 3.5Morang 10.5 Solukhumbhu 4Khotang 10 Bardia 4Tanahun 10 Sindhuli 5Kavrepalanchok 10 Chitwan 5Rukum 5Table 2.19: Top 8 <strong>and</strong> last 8 districts with good <strong>and</strong> bad Performance in financial managementFull Marks: 15, Pass Marks: 6Top 8 Last 8District Marks District MarksSalyan 13 Rolpa 4Terhathum 13 Parsa 4.5Jumla 12.5 Bara 5.5Sarlahi 12 Sindhuli 6Dhankuta 12 Rukum 6Nuwakot 11.5 Rup<strong>and</strong>ehi 6Sunsari 11.5 Bhojpur 6Udayapur 11.5 Mugu 6Table 2.20: Top 5 <strong>and</strong> last 5 districts with good <strong>and</strong> bad performance in fiscal resourcemobilization capacity in the last 2 year’s assessmentFull Marks: 11, Pass Marks: 4Top 8 Last 8District Marks District MarksUdayapur 10 Dailekh 2Dhading 10 Illam 3Nawalparasi 9.5 Rautahat 3Kapilvastu 9 Bardia 3.5Banke 9 Rolpa 3.525
Table 2.21: Top 8 <strong>and</strong> last 6 districts with good <strong>and</strong> bad performance in budget release <strong>and</strong><strong>programme</strong> execution in the last 2 year’s assessmentFull Marks: 12, Pass Marks: 4Top 8 Last 6District Marks District MarksDhading 10.5 Rautahat 3Darchula 9 Mustang 3Illam 8.5 Bara 3.5Jhapa 8.5 Kalikot 3.5Palpa 8.5 Rashuwa 3.5Syangja 8.5 Lalitpur 3.5Khotang 8.5Nawalparasi 8.5Table 2.22: Top 9 <strong>and</strong> last 10 districts with good <strong>and</strong> bad performance in communication <strong>and</strong>transparency in the last 2 year’s assessmentFull Marks: 14, Pass Marks: 6Top 9 Last 10District Marks District MarksSalyan 14 Sarlahi 3Morang 12.5 Rautahat 3.5Dang 12 Mahottari 3.5Dhankuta 12 Bhojpur 4.5Udayapur 12 Sindhuli 5Terhathum 12 Dhanusha 5Makwanpur 12 Mugu 5Kavrepalanchok 12 Okhaldhunga 5.5Dhading 12 Dolpa 5.5Panchathar 5.5Table 2.23: Top 7 <strong>and</strong> last 7 districts with good <strong>and</strong> bad performance in monitoring <strong>and</strong>evaluation in the last 2 year’s assessmentFull Marks: 10, Pass Marks: 3Top 7 Last 7District Marks District MarksRamechap 8.5 Rautahat 3Dhading 8.5 Mahottari 3.5Kaski 8 Solukhumbhu 3.5Khotang 8 Sindhuli 4Kavrepalanchok 8 Dolpa 4Salyan 8 Dailekh 4Nawalparasi 7.5 Parsa 426
Table 2.24: Top 5 <strong>and</strong> last 6 districts with good <strong>and</strong> bad performance in organizations, servicedelivery <strong>and</strong> property management in the last 2 year’s assessmentFull Marks: 12, Pass Marks: 4Top 7 Last 7District Marks District MarksDhading 12 Bardia 4Dang 11.5 Sarlahi 5Rukum 11 Okhaldhunga 5Terhathum 11 Sindhuli 5.5Salyan 11 Mugu 5.5Siraha 5.5Graph 2.1 Districts with highest <strong>and</strong> lowest marks in each functional area in the last 2 year’sassessment151310.5103.53.542KavrepalanchokSarlahiDhankutaDolpaSalyanRolpaUdayapurDailekhPlanning &DevelopmentBudget Management Financial ManagementFiscal ResourceMobilzation Capacity27
Graph 2.2 Districts with highest <strong>and</strong> lowest marks in each functional area in the last 2 year’sassessment1410.5128.53334DhadingRautahatSalyanSarlahiRamechapRautahatDhadingBardiaBudget Release <strong>and</strong>Programme ExecutionCommunication AndTransperancyMonitoring <strong>and</strong>EvalutionService Delivery <strong>and</strong>Property Mangement3 Analysis of MCPMs result of Municipalities in 2008/09 assessment3.1: Overview of Minimum Conditions (MCs)Minimum conditions are such indicators by which the municipalities are assessed to seewhether they observed the laws which are compulsory to them. Currently, 15 indicatorsunder 4 performance areas are included as an minimum conditions. For the purpose ofinternalizing the “Minimum Condition”, 13 out of 15 indicators will be accounted <strong>and</strong> it shallbe regarded fulfilled if, any 7 out of 15 “Minimum Condition” are met for first phase.Similarly, at least any 10 in second year <strong>and</strong> all indicators of “Minimum Condition” in thirdyear should be fulfilled.Table 3.1: Working areas <strong>and</strong> number of indicators of MCsNo ofWorking areasIndicatorsLocal Self‐ Governance 2Financial Management 6Service Delivery <strong>and</strong> Transparency 3Formation <strong>and</strong> Function of Committees 4Total 1528
The MCPMs assessment for the municipalities was conducted in May 2009 (assessment for2007/8). Two municipalities, Kathm<strong>and</strong>u <strong>and</strong> Khadbari, could not comply with the MCs. Thetopping up budget of approximately Rs 350 Million was allocated to the MCs comply 56municipalities. The detail result of performance measures of municipalities is tabulated in annex6.Working AreasIndicators No. →Municipalities↓Table 3.2: Analysis of the MCs result1. LocalSelf‐Governance2. Financial Management3. ServiceDelivery <strong>and</strong>Transparency4.Formation<strong>and</strong>Function ofCommittees1 2 3 4 5 6 7 8 9 10 11 13 15MCmetMCnotmetOverallResultRatnanagar x √ √ √ √ √ √ √ √ √ √ √ √ 12 1 PassBanepa x √ √ √ √ √ √ √ √ √ √ √ √ 12 1 PassBaglung x √ √ √ √ √ √ √ √ √ √ √ √ 12 1 PassBharatpur x √ √ √ √ √ √ √ √ √ √ √ √ 12 1 PassDamak √ √ √ √ x x √ √ √ √ √ √ √ 11 2 PassSiraha √ √ √ x x √ √ √ √ √ √ √ √ 11 2 PassHetauda x √ √ √ √ x √ √ √ √ √ √ √ 11 2 PassBidur √ x √ √ √ x √ √ √ √ √ √ √ 11 2 PassLekhnath x √ √ √ √ x √ √ √ √ √ √ √ 11 2 PassTansen √ √ √ √ √ x √ √ √ √ √ x √ 11 2 PassDhangadhi x √ √ √ x √ √ √ √ √ √ √ √ 11 2 PassItahari x √ √ √ √ x √ √ √ √ √ √ x 10 4 PassDhankuta x √ √ √ √ x x √ √ √ √ √ √ 10 3 PassInaruwa x x √ √ √ x √ √ √ √ √ √ √ 10 3 PassKalaiya x x √ √ √ √ √ √ √ √ √ √ x 10 3 PassWaling x x √ √ √ x √ √ √ √ √ √ √ 10 3 PassGhorahi x √ √ x √ x √ √ √ √ √ √ √ 10 3 PassGulariya √ x √ √ √ x x √ √ √ √ √ √ 10 3 PassNarayan √ x √ x √ x √ √ √ √ √ √ x 9 4 PassBhadrapur x x √ √ x x √ √ √ √ √ √ √ 9 4 PassDharan x x √ √ x x √ √ √ √ √ √ √ 9 4 PassBiratnagar √ x √ √ x x √ x √ √ √ √ √ 9 4 PassTriyuga √ x √ √ x x √ √ √ √ √ x √ 9 4 PassKamalamai x x √ √ √ x √ √ √ √ √ x √ 9 4 PassKirtipur √ √ √ √ x x x √ √ √ √ x √ 9 4 PassPanauti x x √ √ √ x √ √ √ √ √ x √ 9 4 PassBhimeshwor x x √ √ x √ √ √ √ √ x √ √ 9 4 PassGorkha x x √ √ √ x x √ √ √ √ √ √ 9 4 PassByas x x √ √ √ x x √ √ √ √ √ √ 9 4 PassPokhara x x √ √ √ x x √ √ √ √ √ √ 9 4 PassTulshipur x x √ x √ x √ √ √ √ √ √ √ 9 4 PassMechinagar x x √ √ x x √ √ √ √ x √ √ 8 5 PassLahan √ x √ x x x √ √ √ √ √ x √ 8 5 PassJanakpur x x √ √ x x √ x √ √ √ √ √ 8 5 PassJaleshwor x x √ √ x x √ x √ √ √ √ √ 8 5 Pass29
Working Areas1. LocalSelf‐Governance2. Financial Management3. ServiceDelivery <strong>and</strong>Transparency4.Formation<strong>and</strong>Function ofCommitteesMCmetMCnotmetOverallResultIndicators No. → 1 2 3 4 5 6 7 8 9 10 11 13 15Municipalities↓Gaur x x x √ x x √ √ √ √ √ √ √ 8 5 PassBhaktapur x x √ √ √ x √ √ √ √ x x √ 8 5 PassMadhyapur- Thimi x x √ √ √ x √ √ √ √ x x √ 8 5 PassPutalibazar x x √ √ x x √ √ √ √ √ x √ 8 5 PassRamgram x x x √ √ x x √ √ √ √ √ √ 8 5 PassSiddharthanagar x x √ x √ x x √ √ √ √ √ √ 8 5 PassKapilbastu x x x x √ x √ √ √ √ √ √ √ 8 5 PassBirendranagar x √ √ x x x √ √ √ √ √ x √ 8 5 PassNepalgunj √ x √ x x √ x √ √ √ √ x √ 8 5 PassTikapur x √ √ √ x x x x √ √ √ √ √ 8 5 PassDipayal-Silgadhi x √ √ x x x x √ √ √ √ √ √ 8 5 PassBhimdatta x x √ x √ x √ x √ √ √ √ √ 8 5 PassIlam x x √ √ x x √ x √ √ √ √ x 7 6 PassRajbiraj x x √ √ √ x √ √ √ √ x x x 7 6 PassMalangawa x x x √ x x √ √ √ √ √ x √ 7 6 PassBirjung x x √ √ x x √ x √ √ √ x √ 7 6 PassLalitpur x x √ √ √ x x √ √ √ x x √ 7 6 PassDhulikhel x x √ √ x x √ √ √ √ x x √ 7 6 PassButwal x x x x x x √ √ √ √ √ √ √ 7 6 PassAmargadhi √ x √ x x x x √ √ √ √ x √ 7 6 PassDashrathch<strong>and</strong> x x √ x √ x x √ √ x √ √ √ 7 6 PassKathm<strong>and</strong>u x x √ x x x √ x √ √ √ x √ 6 7 FailKhadbari x x √ x x x x x √ √ √ √ x 5 8 FailTotal Fail 46 41 5 16 27 49 15 9 0 1 7 18 6It is clear from the above table that the performance rate of municipalities are weaker in,”procurement planning” <strong>and</strong> “ planning <strong>and</strong> budget approval” <strong>and</strong> stronger in , “citizen charter “<strong>and</strong> “provision of building permit “ respectively.Indicators of MCs are as followsLocal Self‐Governance1. Planning <strong>and</strong> Budget approval2. Progress AssessmentFinancial Management3. Municipality Fund4. Detail Record of Tax <strong>and</strong> Income Sources5. Auditing System6. Procurement Planning7. Inventory Management30
8. Financial Irregularities <strong>and</strong> Action for ClearanceService Delivery <strong>and</strong> Transparency9. Citizen Charter10. Provision of Building Permit11. Publicizing the Income‐Expenditure <strong>and</strong> Rates of Tax <strong>and</strong> DutiesFormation <strong>and</strong> Function of Committees12. Formation <strong>and</strong> Function of Accounts Committee.13. Formation <strong>and</strong> Function of Municipal level Revenue Advisory Committee14. Formation <strong>and</strong> Function of Supervisor <strong>and</strong> Monitoring Committee15. Formation <strong>and</strong> Function of Vacancy Fulfillment Committee31
32Table 3.3: Overall MCs result in terms of functional <strong>and</strong> indicators of Municipalities in2008/09 assessmentAreas <strong>and</strong> IndicatorsLocal Self‐Governance1Planning <strong>and</strong> BudgetApprovalNon MCscomplianceMunicipalities462 Progress Assessment 41Financial ManagementName of Failed MunicipalitiesRatnanagar, Banepa, Baglung, Bharatpur, Hetauda, Lekhnath,Dhangadhi, Itahari, Dhankuta, Inaruwa, Kalaiya, Waling, Ghorahi,Bhadrapur, Dharan, Kamalamai, Panauti, Bhimeshwor, Gorkha,Byas, Pokhara, Tulshipur, Mechinagar, Janakpur, Jaleshwor, Gaur,Bhaktapur, Madhyapur‐Thimi, Putalibazar, Ramgram,Siddharthanagar, Kapilbastu, Birendranagar, Tikapur, Dipayal‐Silgadhi, Bhimdatta, Ilam, Rajbiraj, Malangawa, Birjung, Lalitpur,Dhulikhel, Butwal, Dashrathch<strong>and</strong>, Kathm<strong>and</strong>u, Khadbari.Bidur, Inaruwa, Kalaiya, Waling, Gulariya, Bhadrapur, Dharan,Biratnagar, Triyuga, Kamalamai, Panauti, Bhimeshwor, Gorkha,Byas, Pokhara, Tulshipur, Mechinagar, Lahan, Janakpur,Jaleshwor, Gaur, Bhaktapur, Madhyapur‐Thimi, Putalibazar,Ramgram, Siddharthanagar, Kapilbastu, Nepalgunj, Bhimdatta,Ilam, Rajbiraj, Malangawa, Birjung, Lalitpur, Dhulikhel, Butwal,Amargadhi, Dashrathch<strong>and</strong>, Kathm<strong>and</strong>u, Khadbari.3 Municipality Fund 5 Gaur, Ramgram, Kapilbastu, Malangawa, Butwal.4Detail Record of Tax<strong>and</strong> Income Sources165 Auditing System 276 Procurement Planning 4977. InventoryManagement1588. FinancialIrregularities <strong>and</strong>Action for Clearance9Service Delivery <strong>and</strong>Transparency9 Citizen Charter 010 Provision of Building 1 Dashrathch<strong>and</strong>Siraha, Narayan, Ghorahi, Tulshipur, Lahan, Siddharthanagar,Kapilbastu, Birendranagar, Nepalgunj, Dipayal‐Silgadhi,Bhimdatta, Butwal, Amargadhi, Dashrathch<strong>and</strong>, Kathm<strong>and</strong>u,Khadbari.Damak, Siraha, Dhangadhi, Bhadrapur, Dharan, Biratnagar,Triyuga, Kirtipur, Bhimeshwor, Mechinagar, Lahan, Janakpur,Jaleshwor, Gaur, Putalibazar, Birendranagar, Nepalgunj, Tikapur,Dipayal‐Silgadhi, Ilam, Malangawa, Birjung, Dhulikhel, Butwal,Amargadhi, Kathm<strong>and</strong>u, Khadbari.Damak, Hetauda, Bidur, Lekhnath, Tansen, Narayan, Itahari,Dhankuta, Inaruwa, Waling, Ghorahi, Gulariya, Bhadrapur,Dharan, Biratnagar, Triyuga, Kamalamai, Kirtipur, Panauti, Gorkha,Byas, Pokhara, Tulshipur, Mechinagar, Lahan, Janakpur,Jaleshwor, Gaur, Bhaktapur, Madhyapur‐Thimi, Putalibazar,Ramgram, Siddharthanagar, Kapilbastu, Birendranagar, Tikapur,Dipayal‐Silgadhi, Bhimdatta, Ilam, Rajbiraj, Malangawa, Birjung,Lalitpur, Dhulikhel, Butwal, Amargadhi, Dashrathch<strong>and</strong>,Kathm<strong>and</strong>u, Khadbari.Dhankuta, Gulariya, Kirtipur, Gorkha, Byas, Pokhara, Ramgram,Siddharthanagar, Nepalgunj, Tikapur, Dipayal‐Silgadhi, Lalitpur,Amargadhi, Dashrathch<strong>and</strong>, Khadbari.Biratnagar, Janakpur, Jaleshwor, Tikapur, Bhimdatta, Ilam, Birguj,Kathm<strong>and</strong>u, Khadbari.
Areas <strong>and</strong> IndicatorsPermitPublicizing theIncome‐Expenditure11<strong>and</strong> Rates of Tax <strong>and</strong>DutiesFormation <strong>and</strong> Function ofCommitteesFormation <strong>and</strong>Function of Municipal13level RevenueAdvisory CommitteeFormation <strong>and</strong>15 Function of VacancyFulfillment CommitteeNon MCscomplianceMunicipalities718Name of Failed MunicipalitiesBhimeshwor, Mechinagar, Bhaktapur, Madhyapur‐Thimi, Rajbiraj,Lalitpur, Dhulikhel.Tansen, Triyuga, Kamalamai, Kirtipur, Panauti, Lahan, Bhaktapur,Madhyapur‐Thimi, Putalibazar, Birendranagar, Nepalgunj,Rajbiraj, Malangawa, Birjung, Lalitpur, Dhulikhel, Amargadhi,Kathm<strong>and</strong>u.6 Narayan, Itahari, Kalaiya, Ilam, Rajbiraj, Khadbari.3.2: Overview of Performance Measures (PMs)For the measurement of the performance, five working areas consisting 40 indicators have beenfixed; the total weighting score of which shall be 100. The details of the indicators <strong>and</strong> obtainablescore under each of the working areas categories are as follows:Table 3.4: Working areas <strong>and</strong> number of indicators of PMsWorking areasNo ofIndicators weighting scoreLocal Self‐ Governance 9 22Financial Management 11 28Planning <strong>and</strong> Program Management 7 18Organization <strong>and</strong> Human Resource <strong>development</strong> 6 14Urban Basic Service Management 7 18Total 40 100In the Performance Measure indicators, each has given 2, 1 <strong>and</strong> 0 score, <strong>and</strong> each of theindicators have given weight by virtue of its importance. The score obtainable in each indicatorshall be determined from the result of multiplication of designated weight with designated score.On the basis of this score, the performance shall be measured <strong>and</strong> allocated grant may beexp<strong>and</strong>ed or reduced. The name of indicators <strong>and</strong> detail analysis of PMs is highlighted in theannex 6.33
Table 3.5: Score in each functional areas of PMs.S.NMunicipalities1. Local Self‐Governance2. FinancialManagement3. Planning <strong>and</strong>ProgramManagement4. Organization <strong>and</strong>Human ResourceDevelopment5. Urban BasicServiceManagementTotal MarksFM : 22 FM :28 FM : 18 FM : 14 FM = 18 1001 Ratnanagar 11 19 10 10 15 652 Tansen 18 11 6 14 14 633 Damak 12 18 4 12 16 624 Bhimdatta 15 13 5 14 14 615 Hetauda 12 9 7 14 18 606 Ghorahi 15 15 4 11 15 607 Dharan 10 16 5 12 16 598 Baglung 13 14 8 10 14 599 Tikapur 16 8 9 12 14 5910 Dhankuta 13 14 3 12 16 5811 Waling 14 14 6 12 12 5812 Mechinagar 6 20 6 10 15 5713 Birendranagar 16 13 7 11 10 5714 Bhimeshwor 11 18 5 11 11 5615 Tulshipur 14 13 8 9 12 5616 Dhangadhi 9 8 9 14 16 5617 Kalaiya 10 15 8 12 10 5518 Putalibazar 13 17 4 8 13 5519 Narayan 15 14 7 8 11 5520 Bhadrapur 9 16 4 12 13 5421 Janakpur 11 10 11 10 11 5322 Jaleshwor 15 8 7 12 10 5223 Lahan 10 8 9 13 11 5124 Bhaktapur 9 12 6 11 13 5125 Dhulikhel 7 15 4 11 14 5126 Itahari 8 14 2 12 14 5027 Bidur 12 10 4 14 10 5028 Banepa 9 12 5 11 13 5029 Lekhnath 10 11 5 10 13 4930 Byas 8 11 3 10 16 4831 Pokhara 10 14 2 8 14 4832 Kapilbastu 11 12 3 8 14 4833 Bharatpur 8 16 6 6 11 4734 Panauti 8 12 2 12 13 4735 Butwal 10 13 3 6 15 4736 Amargadhi 11 9 4 10 12 4637 Dipayal‐Silgadhi 13 8 4 9 12 4638 Ilam 11 10 4 7 13 4539 Birjung 11 7 6 8 13 4540 Biratnagar 7 13 4 6 14 4441 Triyuga 12 10 3 11 8 4442 Siraha 10 9 9 9 7 4443 Kirtipur 7 8 5 10 14 4444 Lalitpur 9 8 5 8 14 4445 Gulariya 11 11 3 7 12 4446 Kamalamai 13 11 2 6 11 4334
S.NMunicipalities1. Local Self‐Governance2. FinancialManagement3. Planning <strong>and</strong>ProgramManagement4. Organization <strong>and</strong>Human ResourceDevelopment5. Urban BasicServiceManagementTotal MarksFM : 22 FM :28 FM : 18 FM : 14 FM = 18 10047 Nepalgunj 5 7 6 11 14 4348 Dashrathch<strong>and</strong> 10 12 2 11 8 4349 Gorkha 9 12 2 10 9 4250 Ramgram 12 13 1 7 8 4151 Madhyapur‐ Thimi 6 8 5 10 11 4052 Gaur 11 8 2 7 10 3853 Kathm<strong>and</strong>u 11 7 1 6 13 3854 Malangawa 13 7 1 5 11 3755 Siddharthanagar 9 9 2 3 14 3756 Inaruwa 9 9 3 4 10 3557 Khadbari 3 9 1 6 9 2858 Rajbiraj 5 5 4 2 10 26Graph 3.1: Municipalities with highest <strong>and</strong> lowest score in each working areas183Municipalities having highest <strong>and</strong> lowest marks ineach working areas205111142187TansenKhadbariMechinagarRajbirajJanakpurKhadbariJanakpurSiddharthanagarDamakTansen1. Local Self‐Governance2. FinancialManagement3. Planning <strong>and</strong>ProgramManagement4. Organization<strong>and</strong> HumanResource5. Urban BasicServiceMangement35
4. Analysis of MCs results of all VDCs in 2008/09 assessment.4.1 Overview of the MCsThe Village Development Committee, under the Local Body, is the very closest body of thepeople, so this body is directly participated <strong>and</strong> involved in the task of delivering services<strong>and</strong> daily activities of the people. As the functions performed by the VDCs reflect theattitude of the people towards the government, so it is essential that there are uniformity,transparency, accountability <strong>and</strong> expertise in the tasks of these bodies. In this context, theindicators of the Minimum Conditions have been prepared by deeming the areas offunctions, to be performed by the Village Development Committee, on the basis of thevarious provisions mentioned in the Local Self Governance Act, Local Self GovernanceRegulation, the Local Body Fiscal Administration Regulation, the Village DevelopmentCommittee Grant Operation Guideline, <strong>and</strong> the Social Security Program OperationGuideline.Eleven indicators have been included for assessing the Minimum Conditions.Provided that, the current condition of the absence of elected representatives <strong>and</strong> theresults of evaluation immediately affect the distribution of topping up grants, so only a totalof five indicators were applied to assess the Minimum Conditions in the fiscal year2008/09. Eight indicators would be effective in 2009/10 <strong>and</strong> the remaining 3 indicators in2010/11. The indicators of MCs are given as follows:8.1 Indicators of Minimum Conditions (MCs)1. The Village Council must have approved previous year’s VDC plan, <strong>programme</strong> <strong>and</strong>budget.2. VDC must have conducted annual review of previous year’s <strong>programme</strong>s <strong>and</strong> projects.(This indicator will be effective in MCs assessment of 2008/09)3. VDC must have used at least 80% of the total VDC Grant (capital) allocated by GoN oflast FY.4. VDC must have planned <strong>and</strong> budgeted for a certain amount of VDC grant to thetargeted groups as instructed by the VDC Grant Guidelines. (This indicator will beeffective in MCs assessment of 2009/10)36
5. VDC must have publicized last year’s income <strong>and</strong> expenditure statement. (This indicatorwill be effective in MCs assessment of 2008/9)6. Final audit of VDC account of the year before last year must have been completed. Theaudit report shall have to disseminate publicly by the auditor 4 .7. VDC must have documented its all income –expenditure information in the givenformat 5 . (This indicator will be effective in MC assessment of 2008/09)8. VDC must have maintained account of its cash receipts, expenditure <strong>and</strong> revenue ledgerbooks, <strong>and</strong> advance ledger book, movable, immovable <strong>and</strong> other assets. (This indicatorwill be effective in MCs assessment of 2009/10 )9. VDC must have updated list of people getting social security allowances every fiscal year.10. VDC must have kept an account of Vital Registration <strong>and</strong> submitted a report of it to DDC.11. VDC must have prepared Village Profile. ( This indicator will be effective in MCassessment of 2009/10 )4.3: Result Analysis of MCsThe MCs assessment of the VDCs (assessment for 2007/8) was organized for the firsttime May to July 2009 (impact on the topping up allocations in FY 2009/10). Theassessment was contracted out to <strong>local</strong> firms by the DDCs. MCs assessment of VDCs wascarried out in all the districts with the exception Mahotari (76 VDCs) <strong>and</strong> partially Sarlahi(9 VDCs) district, all districts were able to assess the MCs. Out of MCs assessed 3,830VDCs, 3409 VDCs were passed in MCs to the given 5 indicators. The topping up budgetRs 1.2 billion was allocated to MCs comply 2749 VDCs with the DAG mapping (4 <strong>and</strong> 3).The overall result of Minimum Conditions (MCs) of VDCs is presented in annex 7.Table 4.1: VDC non‐compliance with MCsNo.DistrictNo of VDCscomplying withMCsNo of VDCsfailing tocomply withMCs1 Panchthar 41 02 Ilam 48 03 Jhapa 47 0NotesAll VDCs qualify ‐ 33DistrictsTotal no of VDCs notcomplying with MCs04 Simply revised in the first amendment,20095 imply revised in the first amendment,200937
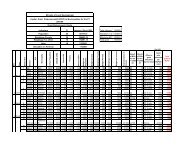
No.38DistrictNo of VDCscomplying withMCsNo of VDCsfailing tocomply withMCs4 Terhathum 32 05 Dhankuta 35 06 Morang 65 07 Sunsari 49 08 Khotang 76 09 Dhading 50 010 Kathm<strong>and</strong>u 57 011 Bhaktapur 16 012 Makwanpur 43 013 Chitwan 36 014 Manang 13 015 Lamjung 61 016 Kaski 43 017 Tanahun 46 018 Gulmi 79 019 Arghakhanchi 42 020 Mustang 16 021 Myagdi 41 022 Rukum 43 023 Rolpa 51 024 Salyan 47 025 Dolpa 23 026 Mugu* 24 027 Kalikot 30 028 Dailekh 55 029 Surkhet 50 030 Achham 75 031 Doti 50 032 Kailali 42 033 Kanchanpur 19 034 Rasuwa 17 135 Jajarkot 29 136 Dang 38 137 Udaypur 43 138 Pyuthan 48 139 Parbat 54 140 Nuwakot 60 141 Baitadi 61 142 Palpa 64 143 Nawalparasi 72 144 Kavre 86 145 Rautahat 95 146 Jumla 28 247 Dadeldhura 17 348 Lalitpur 38 349 Siraha** 103 350 Humla 23 451 Bajhang 43 452 Bardiya* 26 553 Darchula 36 554 Banke 41 5NotesOne VDC failed tocomply ‐ 12 Districts2‐5 VDCs failed tocomply ‐ 11 DistrictsTotal no of VDCs notcomplying with MCs1244
No.DistrictNo of VDCscomplying withMCsNo of VDCsfailing tocomply withMCs55 Taplejung 45 556 Syangja 55 557 Dolakha 45 658 Baglung 53 659 Sindhupalchok 73 660 Sankhuwasabha 26 761 Sindhuli 42 1162 Rup<strong>and</strong>ehi 58 1163 Bajura 15 1264 Gorkha 54 1265 Parsa 69 1366 Kapilbastu* 56 2167 Saptari** 92 2268 Ramechhap 27 2869 Okhaldhunga 27 2970 Solukhumbu 1 3371 Bara* 65 3372 Bhojpur 28 3573 Sarlahi** 60 3074 Dhanusha 51 5075 Mahottari** ‐ 763,409 497Notes:Notes6‐10 VDCs failed tocomply ‐ 4 Districts11‐20 VDCs failed tocomply ‐ 5 Districts> 21 VDCs failed tocomply ‐ 10 DistrictsTotal no of VDCs notcomplying with MCs‐ Districts in * failed to comply with DDC‐level MCs in 2008/09 assessment‐ Districts in ** failed to comply with DDC‐level MCs in both 2007/08 <strong>and</strong> 2008/09 assessments.‐ Not assessed VDCs have been included in not met category255935739
Table 4.2: DAG 6 category VDCs <strong>and</strong> MCs resultDAG CategoryNumber ofVDCsCompliance(eligible for topup grants )MCsNon‐compliance or notassessed (not eligiblefor “top up” grants)% of MCsCompliance DAGVDCs4 602 489 113 81.233B 1480 1261 219 85.23A 1129 999 130 88.49Total 3211 2749 7 462 85.61Table 4.3: Distribution of VDCs failing to comply with MCsNo of VDCs per DDC failing tocomply with MCsNo of DistrictsTotal no. of VDCs failing tocomply with MCsNone 33 01 12 122‐5 11 446‐10 4 2511‐15 5 5916‐20 0 0≥ 21 10 357TOTALS 75 4976 These ranking indicators are generated from analysis of the findings of the participatory DAG (Disadvantaged Group)mapping by MLD. As with the participatory indicators used in DAG mapping, these ranking indicators combine botheconomic <strong>and</strong> socio‐cultural dimensions of DAG‐ness. They are used together as a set to rank VDCs (or wards).Information is collected from readily available secondary sources. Criteria used are:1. HHs with food sufficient
Table 4.4: No of VDCs that non comply with MCs: Indicator wiseMinimum ConditionVillage Council must have approved previous year’sVDC plan, <strong>programme</strong> <strong>and</strong> budget.VDC must have used at least 80% of the total VDCGrant (capital) allocated by GoN in the last FYFinal audit of VDC account of the year before last yearmust have been completed. The audit report shouldhave been disseminate publicly by the auditorVDC must have updated list of people receiving socialsecurity allowances every fiscal year.Number of VDCsnon comply withMCs% of VDCsnot able tocomply withMCs to totalassessedVDCs% of VDCs notable to complywith MCs tototal notcomply VDCs83 2.17 19.71154 4.02 36.5887 2.27 20.67VDC must have kept an account of Vital Registration<strong>and</strong> submitted a report of it to DDC.Total number of assessed 3,830Total number of VDCs failing to qualify for top‐upgrant 421110 2.87 26.13269 7.02 63.9010.99The above table provides a summary of the number of VDCs which failed to comply with specific MCs.Accordingly, indicators no 10 (Vital registration) <strong>and</strong> 9 (Social security) have poor performance in the VDCs. Itis recommended that the GON/MLD should focus to solve the issues of vital registration <strong>and</strong> social security.The table below shows that the documentation of vital registration of Solukhumbhu district is the worst. Outof 34 VDCs 33 have failed in this indicator <strong>and</strong> risk loose their topping up block grant.41
Table 4.5: Detailed Information about the MCs non Compliance VDCsS.N.DistrictNo of VDCs<strong>and</strong> nonComplianceof MCsVDCsNon Complianceof MCs% of non compliance VDCsIndicatorsVillage Council must haveapproved previous year’sVDC plan, <strong>programme</strong> <strong>and</strong>budget.VDC must have used at least80% of the total VDC Grant(capital) allocated by GoN oflast FY.Final audit of VDC account ofthe year before last yearmust have been completed.The audit report shall have todisseminate publicly by theauditor.VDC must have updated listof people getting socialsecurity allowances everyfiscal year.VDC must have kept anaccount of Vital Registration<strong>and</strong> submitted a report of itto DDC.1 Solukhumbu 34 33 97.06 0 0 0 0 332 Bhojpur 63 35 55.56 3 8 3 9 353 Okhaldhunga 56 29 51.79 0 0 0 0 294 Ramechhap 55 28 50.91 2 0 1 4 255 Dhanusha 101 50 49.50 38 26 26 21 296 Bajura 27 12 44.44 0 7 0 6 07 Bara 98 33 33.67 10 11 24 9 98 Sarlahi 99 30 30.30 1 30 1 1 29 Kapilbastu 78 21 26.92 0 13 0 7 1610 Sankhuwasabha 33 7 21.21 7 0 0 0 111 Sindhuli 53 11 20.75 2 1 0 4 1112 Saptari 114 22 19.30 5 13 11 9 913 Rup<strong>and</strong>ehi 58 11 18.97 0 11 0 0 614 Gorkha 66 12 18.18 0 3 1 8 615 Bardiya 31 5 16.13 0 4 2 1 016 Parsa 82 13 15.85 0 10 0 5 217 Dadeldhura 20 3 15.00 0 2 1 1 118 Humla 27 4 14.81 3 1 2 4 119 Darchula 41 5 12.20 5 1 0 0 120 Dolakha 51 6 11.76 0 0 0 1 621 Banke 46 5 10.87 3 3 3 4 322 Baglung 59 6 10.17 0 2 0 4 323 Taplejung 50 5 10.00 0 2 1 2 024 Bajhang 47 4 8.51 0 1 1 0 225 Syangja 60 5 8.33 0 0 5 0 426 Sindhupalchok 79 6 7.59 0 0 0 3 627 Lalitpur 41 3 7.32 0 0 0 2 128 Jumla 30 2 6.67 0 0 0 0 229 Rasuwa 18 1 5.56 1 1 1 1 1630 Jajarkot 30 1 3.33 0 0 0 0 131 Siraha 106 3 2.83 0 1 0 0 232 Udayapur 44 1 2.27 1 0 0 0 033 Dang 47 1 2.13 0 0 0 1 134 Pyuthan 49 1 2.04 0 0 1 0 035 Parbat 55 1 1.82 1 1 1 1 136 Nuwakot 61 1 1.64 0 0 0 0 237 Baitadi 62 1 1.61 0 0 1 0 138 Palpa 65 1 1.54 0 0 0 1 039 Nawalparasi 73 1 1.37 0 0 0 0 140 Kavrepalanchowk 87 1 1.15 0 1 0 0 041 Rautahat 96 1 1.04 1 1 1 1 1Total 421 83 154 87 110 26942
Table 4.6: Total no. of non compliance VDCsIndicatorno136910IndicatorsVillage Council must have approved previousyear’s VDC plan, <strong>programme</strong> <strong>and</strong> budget.VDC must have used at least 80% of the totalVDC Grant (capital) allocated by GoN in thelast FYFinal audit of VDC account of the year beforelast year must have been completed. Theaudit report should have been disseminatepublicly by the auditorVDC must have updated list of peoplereceiving social security allowances everyfiscal year.VDC must have kept an account of VitalRegistration <strong>and</strong> submitted a report of it toDDC.Non Compliance VDCsDistrictVDCs15 8324 15419 8725 11034 2695. Block Grant Allocation to LBsTable 5.1: Topping up grant to LBs in 2009/10LBs Budget ,000 Number of LBsRs $ ( 1 $=Rs 75)DDCs 855000 11554 67VDCs 1200000 16216 2749Municipalities 347910 4701 56Total 2402910 32472 2872Table 5.2: Summary of MCPMs results ( 2008/9 assessment) <strong>and</strong> grant allocationLBs Number MCs met %MCsnotmetMCPM relatedAssessmentblock grant (cost (,000) %Million)Rs $ Rs $DDCs 75 67 89.33 8 6040 81 17 1402 19VDCs 3915 8 3409 89 421 25851 345 71 1200 16Municipalities 58 56 97 2 4649 62 13 350 5Total 4048 3532 92 431 36539 487 100 2952 9 398 Out of 3915 VDCs the MCs assessed VDCs is only 3830.9 The GON budget to LBs , DDCs=Rs 2.08 billion, VDC Rs 7.83 billion <strong>and</strong> Rs 350 Ml to Municipalities ( Rs 2 billion of LocalDevelopment Fees).Out of Rs 2.08 billion budget of DDCs the performance based budget is Rs 547 Ml. Until now, the other LBs,GON budget has not been linked with performance based. As per MCPMs manual of municipalities the municipalities’ grantwould be linked with performance based from the FY 2067/68.43
6. Issues on Performance MeasuresThere is no alternative to performance based grant system in Nepal. This system has beeninstitutionalized in the country. As a result of successful implementation of MCPMs, the generalpublic concerned is that if the LBs could perform in a better way the government would givemore grants. There is a competition among LBs to improve the performance to receiveadditional grants. However, there are some issues to effectively implement this system, whichare:1. Capacity Issues• Inadequate capacity in the implementation process• Lack of sufficient capacity building programs of LBs to those who do not comply withthe MCPM <strong>and</strong> remain failure.• Inadequate orientation about the MCPM manuals to LBs.2. Administrative/ Management Issues• Lack of effectively implementation of reward/punishment system to responsiblestaff, etc.• Vacant position of VDCs secretaries• Frequent transfer of staffs• Delay releases/authorization of budget3. Political/ Security Issues• Absence of elected representatives• Threats from unidentified groups especially in the Terai <strong>and</strong> eastern hill• Political rivalry among the political parties4. Monitoring/Evaluation Issues• Inadequate monitoring from central authority• Poor Quality Assurance/control• Inadequate dissemination of the results.7. Lessons Learned• Performance based funding systems enhances transparency <strong>and</strong> accountability. Peoplehave become more aware <strong>and</strong> have been pressurizing LBs to deliver better services. Ithas helped LBs to be more accountable, conscious <strong>and</strong> efficient.• Objective performance based system helps institution building <strong>and</strong> motivates betterperformance. Institutionalization <strong>and</strong> capacity building is visible in many respects, forinstance planning processes, documentation, information centers <strong>and</strong> real workperformance of the LBs.• The MCPMs process has helped in creating awareness <strong>and</strong> ownership at <strong>community</strong> <strong>and</strong>beneficiary levels.• The LBs can meet their basic requirements <strong>and</strong> enhance capacity to achieve certain levelof performance with some strategic <strong>and</strong> meaningful support <strong>and</strong> continuous supervision<strong>and</strong> monitoring.44
• Some clear guidelines, strict enforcement of rules regarding “reward” <strong>and</strong> “punishment”do have strong positive impacts on the performance of the DDCs <strong>and</strong> Municipalities.• Imparting requisite <strong>and</strong> need based trainings to the LBs staff may help to improve theperformance.As stated above, the overall efficacy of the procedures <strong>and</strong> systems envisaged under thismethod are highly noteworthy <strong>and</strong> encouraging.8. ConclusionThe overall assessment indicates that LBs are showing eagerness as well as capability toimprove their performance. The progress is also visible from the sharp decline in penaltydistricts <strong>and</strong> ability of more <strong>and</strong> more districts to receive bonus. Non compliance districts havecome down to 8 from 28 . Similarly, districts able to secure different category of bonus haverisen from 2007/8 to 2008/9. This is a very encouraging outcome towards the effort to improvebasic service delivery <strong>and</strong> establish transparency <strong>and</strong> accountability in LBs. Another notablefactor is the perceived success of criteria based financing of <strong>LGCDP</strong> prompting many otherdonors to think in similar lines. Out of assessed VDCs, 80 percent VDCs have complied with therequirement of MCs. Similar situation appears with Municipalities. The performance rate ofDDCs <strong>and</strong> municipalities is 61 <strong>and</strong> 49 percent respectively. The overall results of theperformance based funding system have significantly improved in the planning, budgeting,financial management, transparency, etc system of LBs. Finally, the overall performance of LBsst<strong>and</strong>s at average level. Therefore, there is a need to scale up the performance of LBs byimproving their actual operation of their activities in the days to come.45
Referencesa) Block Grant Allocation ( including topping up) to LBs for the FY 2065/66 <strong>and</strong> FY 2066/67b) <strong>LGCDP</strong> program document, 2008c) Manual for MCPMs assessment of DDCs, 2008 (Second amendment)d) Manual for MCs assessment of VDCs, 2066 (first amendment)e) Manual for MCPMs assessment of Municipalities, 2066f) MCPMs reports ( DDCs, Municipalities) submitted by consultants to LBFCg) MCs reports submitted by DDCs to LBFCh) Minutes of LBFCs 20 & 21 st meeting decisioni) Steffensen Jesper <strong>and</strong> Devkota Khim Lal, Review <strong>and</strong> Refinement of Fiscal TransferMechanism for LBs ( DDCs <strong>and</strong> VDCs),October, 200946
AnnexesAnnex 1: The MCPMs Assessment toolMCPMs Assessment= FYt=e.g.=FY 2009/10 (2066/67)MCPMs Assessed= FYt− 1=e.g.=FY 2008/09(2065/66)Effects on Grant allocation= FYt + 1=e.g. =FY 2010/11 (2067/68)Annex 2: The list of MCPMs conducted districts in 2005/06: 20 districtsAchham Jumla Salyan Kavre Baitadi Mugu DolakhaBajhang Humla Rup<strong>and</strong>ehi Udayapur Darchula Rukum DhanushaTehrathum Kailali Jajarkot Taplejung Kaski SolukhumbuAnnex 3: The list of Second MCPMs assessment districts on pilot basis ( 2006/07):55 DDCsBajura, Bardyia, Doti, Kanchanpur, Dadeldhura,Dailekh, Surkhet, Banke, Dolpa,Kalikot,DangPyuthan, Rolpa, Arghakhachi, Nawalparasi, Kapilbastu,Gulmi, Palpa, Syangia,Parbat, Baglung, Myagdi, Mustang, Manang, Gorakha, Lamjung, Tanahu,Dhading,Kathm<strong>and</strong>u, Lalitpur, Bhaktapur, Sindhupalchok, Nuwakot, Rasuwa,Chitawan, Makawanpur, Parsa, Bara, Rautahat, Sarlahi,Sindhuli, Ramechhap,Siraha, Mahottari, Saptari, Bhojpur, Khotang, Sankhuwashabha, Okhaldhunga,Sunsari,Panchthar, Ilam, Jhapa, Dhakuta, Morang47
Annex 4. Status of MCPMs assessment during the period 2005/06‐2009/10 in NepalDDCsAssessmentfor NoAssessmentYearNo of MCsfailed DDCsPMsscore Remarks2004/5 20 2005/6 3 54.5 DFDP assessment2005/6 55 2006/7 45 42.47 LBFC assessment on Pilot1st nation‐ wide assessment <strong>and</strong> linked2006/7 75 2007/8 28 55.65 with block grant allocation2007/8 75 2008/9 8 66.122nd nation‐ wide assessment <strong>and</strong> linkedwith block grant allocation2008/9 75 2009/10 Assessment is in progress 3rd nation‐wide assessmentMunicipalitiesAssessmentfor NoAssessmentYearNo of MCsfailedMunicipalitiesPMsscore Remarks2006/7 16 2007/8 15 47.69 LBFC/UDLE assessment on Pilot2007/8 58 2008/9 2 491st assessment of all municipalities <strong>and</strong>linked with topping up grant2008/9 58 2009/10 Assessment is in progress 2nd assessment of all municipalitiesVDCsAssessmentforNoAssessmentYearNo of MCsfailed VDCsPMsscoreRemarksRolled out to country wide. Not assessedDDCs: Mahotari all VDCs (76) <strong>and</strong> Sarlai 9.2007/8 3830 2008/9 421No PMsindicatorsTotal not assessed VDCs=85. Linked withtopping up grant2008/9 3915 209/10 Assessment is in progress 2nd nation‐ wide assessment48
Annex 5.1 : Result of Performance Measures (PMs) of all DDCs for the FY 2007/08 & 2008/09: First four functional areas1.Planning & Programme Management 2.Budget Management 3.Financial Management 4.Fiscal Resource Mobilization CapacityResult of Indicators Result of Indicators Result of Indicators Result of IndicatorsTotal Indicators : 9 , Active : 8, Full Marks : 15,Pass Marks : 6Total Indicators : 6, Full Marks : 11,Pass Marks : 4Total Indicators : 10 Active :9, Full Marks : 15, PassMarks : 6Total Indicators : 6, FullMarks : 11, Pass Marks : 4IllamJhapaTaplejungPanchatharDhankutaShankhuwasabhaBhojpurMorangSunsariTerhathumIndicatorNo.→1.1 1.2 1.31.4 1.5 1.61.71.8Total2.12.2 2.32.42.52.6Total3.13.23.33.43.53.63.7 3.83.9Total4.14.24.34.44.54.6 TotalFull 2 2 2 2 2 1 2 22 2 2 1 2 22 2 2 2 2 1 2 1 12 2 2 2 2 1Mark→FY↓151115112007/8 0 2 2 2 2 0 0 0 8 2 0 2 1 1 2 8 2 0 2 2 2 0 2 1 0 11 0 0 0 0 0 1 12008/9 1 2 2 2 2 0 2 2 13 2 2 2 1 2 2 11 2 2 0 0 2 0 2 1 0 9 2 2 0 0 0 1 50.10.1.Average 5 2 2 2 2 0 1 1 5 2 1 2 1 5 2 9.5 2 1 1 1 2 0 2 1 0 10 1 1 0 0 0 1 32007/8 2 2 2 2 2 0 0 2 12 2 0 2 1 0 2 7 1 0 0 1 2 0 2 1 0 7 0 2 0 1 2 1 62008/9 2 2 1 2 2 0 2 1 12 2 2 2 0 0 2 8 2 2 0 0 2 1 2 1 1 11 0 2 2 2 0 1 71.0.1.0. 0.0.1.Average 2 2 1.5 2 2 0 1 5 12 2 1 2 5 0 2 7.5 5 1 0 5 2 5 2 1 5 9 0 2 1 5 1 1 6.52007/8 1 2 2 1 1 0 0 0 7 2 0 1 1 0 2 6 1 2 1 2 2 0 1 0 0 9 0 0 2 2 0 0 42008/9 1 2 2 1 2 1 2 2 13 2 2 2 1 0 2 9 1 0 0 1 2 1 1 1 0 7 0 2 0 2 0 1 50. 1. 0.0.Average 1 2 2 1 1.5 0.5 1 1 10 2 1 1.5 1 0 2 7.5 1 1 5 5 2 5 1 0.5 0 8 0 1 1 2 0 5 4.52007/8 0 1 1 1 0 0 0 0 3 2 0 2 1 0 2 7 1 2 0 0 2 0 2 0 0 7 0 0 0 2 0 0 22008/9 1 2 1 1 2 1 2 2 12 2 2 1 0 0 2 7 2 2 1 0 1 1 2 0 0 9 0 2 2 2 0 1 70.0.1. 0. 1. 0.0.Average 5 1.5 1 1 1 0.5 1 1 7.5 2 1 1.5 5 0 2 7 5 2 5 0 5 5 2 0 0 8 0 1 1 2 0 5 4.52007/8 2 2 1 1 1 1 0 1 9 2 2 2 1 1 2 10 2 2 0 1 2 1 2 1 1 12 1 0 2 1 1 1 62008/9 2 2 2 2 2 0 0 2 12 2 2 2 1 2 2 11 2 2 2 0 2 1 2 1 0 12 0 2 2 2 2 1 91.1. 10.1. 10.0.0. 0.1. 1.Average 2 2 1.5 5 1.5 0.5 0 5 5 2 2 2 1 5 2 5 2 2 1 5 2 1 2 1 5 12 5 1 2 5 5 1 7.52007/8 0 2 1 1 2 0 2 0 8 1 2 0 0 2 2 7 0 2 0 0 2 0 1 0 0 5 0 0 0 0 0 0 02008/9 2 2 2 2 2 0 2 2 14 2 2 2 0 2 2 10 2 2 2 0 2 0 1 1 1 11 2 2 0 2 1 1 81.1.0.0. 0.Average 1 2 1.5 5 2 0 2 1 11 5 2 1 0 2 2 8.5 1 2 1 0 2 0 1 0.5 5 8 1 1 0 1 5 5 42007/8 0 2 1 1 1 1 2 0 8 2 2 0 0 0 2 6 2 2 1 0 2 0 1 0 0 8 0 2 2 0 0 0 42008/9 0 2 2 1 2 0 2 2 11 2 1 0 0 0 2 5 1 0 0 0 2 0 1 0 0 4 0 2 2 0 0 0 41.1. 0.Average 0 2 1.5 1 1.5 0.5 2 1 9.5 2 5 0 0 0 2 5.5 5 1 5 0 2 0 1 0 0 6 0 2 2 0 0 0 42007/8 2 2 2 2 2 0 2 0 12 2 2 1 1 2 2 10 2 0 0 0 2 0 1 1 0 6 1 2 0 2 0 1 62008/9 2 2 2 2 2 1 2 2 15 2 2 2 1 2 2 11 0 2 0 1 2 0 1 1 0 7 2 2 0 2 2 1 913.10.0.1.Average 2 2 2 2 2 0.5 2 1 5 2 2 1.5 1 2 2 5 1 1 0 5 2 0 1 1 0 6.5 5 2 0 2 1 1 7.52007/8 0 2 1 2 1 0 0 1 7 2 1 2 1 1 2 9 2 2 1 1 2 1 2 1 1 13 0 0 0 2 2 1 52008/9 2 2 2 1 2 0 0 0 9 2 2 2 1 0 2 9 2 0 0 2 2 0 2 1 1 10 2 2 2 2 2 1 111.0.1.0.0. 1. 0.11.Average 1 2 1.5 5 1.5 0 0 5 8 2 5 2 1 5 2 9 2 1 5 5 2 5 2 1 1 5 1 1 1 2 2 1 82007/8 2 2 2 1 1 1 0 1 10 2 2 0 0 2 2 8 1 2 0 2 2 1 2 1 1 12 0 2 2 0 0 1 52008/9 2 2 2 2 2 0 0 2 12 2 2 2 1 2 2 11 2 2 1 2 2 1 2 1 1 14 0 2 0 2 2 1 71.1.0.1. 0.Average 2 2 2 5 1.5 0.5 0 5 11 2 2 1 5 2 2 9.5 5 2 5 2 2 1 2 1 1 13 0 2 1 1 1 1 649
1.Planning & Programme Management 2.Budget Management 3.Financial Management 4.Fiscal Resource Mobilization CapacityResult of Indicators Result of Indicators Result of Indicators Result of IndicatorsTotal Indicators : 9 , Active : 8, Full Marks : 15,Pass Marks : 6Total Indicators : 6, Full Marks : 11,Pass Marks : 4Total Indicators : 10 Active :9, Full Marks : 15, PassMarks : 6Total Indicators : 6, FullMarks : 11, Pass Marks : 4IndicatorNo.→FullMark→FY↓1.1.1. 1.1 1.2 1.3 4 1.5 1.6 7 82 2 2 2 2 1 2 2Total152. 2. 2. 2. 2.1 2 2.3 4 5 62 2 2 1 2 2Total113. 3. 3. 3. 3. 3. 3. 3.1 2 3 4 5 6 7 3.8 92 2 2 2 2 1 2 1 1Total154. 4. 4. 4. 4. 4.1 2 3 4 5 6 Total2 2 2 2 2 12007/8 1 2 1 1 2 0 2 0 9 2 0 2 1 2 2 9 2 2 0 1 2 0 2 1 0 10 2 2 2 2 2 1 11Khotang 2008/9 2 2 2 2 2 1 2 2 15 2 2 2 1 2 2 11 1 2 2 0 2 0 2 1 1 11 0 1 0 2 0 1 4Average1.5 2 1.51.5 2 0.5 2 1 12 2 1 2 1 2 2 101.5 2 10.5 2 0 2 10.510.5 11.5 1 2 1 1 7.52007/8 0 1 1 1 0 0 2 2 7 1 0 2 1 2 2 8 2 2 0 0 2 0 2 0 0 8 2 0 0 0 0 1 3Saptari2008/9 2 2 2 2 2 0 0 0 10 2 1 1 0 2 2 8 0 2 0 1 2 0 2 0 0 7 1 2 0 2 0 1 61.1. 0. 0.0.1.Average 1 1.5 1.5 5 1 0 1 1 8.5 5 5 1.5 5 2 2 8 1 2 0 5 2 0 2 0 0 7.5 5 1 0 1 0 1 4.52007/8 1 2 2 1 0 1 2 0 9 2 0 0 0 0 2 4 2 2 0 2 2 0 1 1 1 11 0 2 2 0 0 1 5Solukhumb 2008/9 2 2 2 1 2 0 2 0 11 2 0 1 1 0 0 4 1 0 0 2 2 0 2 1 0 8 0 0 2 0 2 1 5huAverage1.5 2 2 1 1 0.5 2 0 10 2 0 0.50.5 0 1 41.5 1 0 2 2 01.5 10.5 9.5 0 1 2 0 1 1 52007/8 2 2 1 1 2 0 2 2 12 2 1 1 0 1 2 7 2 2 1 2 2 0 2 1 0 12 2 2 2 2 1 1 10Udayapur2008/9 2 2 2 2 2 0 2 2 14 2 2 2 1 2 2 11 2 2 0 1 2 1 2 1 0 11 1 2 2 2 2 1 101.1. 0. 1.0. 1. 0.11. 1.1.Average 2 2 1.5 5 2 0 2 2 13 2 5 1.5 5 5 2 9 2 2 5 5 2 5 2 1 0 5 5 2 2 2 5 1 102007/8 0 2 2 1 2 0 2 2 11 0 2 1 0 2 2 7 0 2 0 0 2 0 2 0 0 6 2 2 0 2 2 1 9Siraha2008/9 2 2 2 1 0 0 2 2 11 2 0 2 1 2 2 9 0 2 0 2 2 0 1 0 0 7 0 0 0 0 0 1 10.1.Average 1 2 2 1 1 0 2 2 11 1 1 1.5 5 2 2 8 0 2 0 1 2 0 5 0 0 6.5 1 1 0 1 1 1 52007/8 1 2 1 1 0 1 0 0 6 2 2 2 0 0 2 8 2 0 0 2 2 0 1 1 0 8 0 2 2 0 0 0 4Okhaldhung 2008/9 1 1 1 1 2 0 2 0 8 2 2 0 1 0 0 5 2 0 1 0 2 0 2 0 0 7 0 2 1 0 0 1 4aAverage 1 1.5 1 1 1 0.5 1 0 7 2 2 10.5 0 1 6.5 2 00.5 1 2 01.5 0.5 0 7.5 0 21.5 0 00.5 42007/8 1 2 0 0 1 0 0 0 4 2 1 0 0 0 2 5 0 0 0 0 2 0 2 1 0 5 0 2 1 1 1 1 6Dhanusha2008/9 2 1 2 1 0 0 2 0 8 2 1 2 1 0 2 8 2 0 0 1 2 0 2 1 0 8 1 2 2 2 2 1 101.0.0.0.0. 1. 1. 1.Average 5 1.5 1 5 0.5 0 1 0 6 2 1 1 5 0 2 6.5 1 0 0 5 2 0 2 1 0 6.5 5 2 5 5 5 1 82007/8 1 2 1 1 2 1 2 1 11 2 1 2 1 1 2 9 1 2 0 1 2 0 1 1 0 8 0 1 2 0 2 1 6Dolakha2008/9 1 2 1 2 2 0 2 1 11 2 2 2 1 0 2 9 0 0 0 1 2 0 1 1 1 6 0 2 0 2 0 1 51.1.0.0.0.1.Average 1 2 1 5 2 0.5 2 1 11 2 5 2 1 5 2 9 5 1 0 1 2 0 1 1 5 7 0 5 1 1 1 1 5.52007/8 2 2 1 1 0 0 0 0 6 0 2 1 1 0 2 6 2 0 0 0 2 0 2 0 0 6 0 2 0 0 1 1 4Mahottari2008/9 0 1 0 1 0 0 2 1 5 2 0 1 1 0 2 6 0 0 2 2 2 0 2 0 1 9 0 2 2 1 2 1 80.0.0. 1.Average 1 1.5 0.5 1 0 0 1 5 5.5 1 1 1 1 0 2 6 1 0 1 1 2 0 2 0 5 7.5 0 2 1 5 5 1 62007/8 2 2 1 1 2 1 2 1 12 2 1 2 1 1 1 8 2 2 2 1 2 0 2 1 0 12 0 2 2 0 1 1 6Ramechap2008/9 1 2 1 2 2 0 2 1 11 2 2 2 1 0 2 9 1 0 0 1 2 0 2 1 0 7 0 2 0 2 0 1 51.1.11. 1.0. 1. 1.0.Average 5 2 1 5 2 0.5 2 1 5 2 5 2 1 5 5 8.5 5 1 1 1 2 0 2 1 0 9.5 0 2 1 1 5 1 5.5Sarlahi 200607/8 1 1 0 0 0 0 0 0 2 2 0 1 1 1 2 7 2 2 2 2 1 0 2 1 1 13 1 0 2 2 2 0 71150
1.Planning & Programme Management 2.Budget Management 3.Financial Management 4.Fiscal Resource Mobilization CapacityResult of Indicators Result of Indicators Result of Indicators Result of IndicatorsTotal Indicators : 9 , Active : 8, Full Marks : 15,Pass Marks : 6Total Indicators : 6, Full Marks : 11,Pass Marks : 4Total Indicators : 10 Active :9, Full Marks : 15, PassMarks : 6Total Indicators : 6, FullMarks : 11, Pass Marks : 4SindhuliBhaktapurDhadingKathm<strong>and</strong>uKavrepalanchokLalitpurNuwakotRashuwaSindhupalchokBaraIndicatorNo.→1.1 1.2 1.31.4 1.5 1.61.71.8Total2.12.2 2.32.42.52.6Total3.13.23.33.43.53.63.7 3.83.9Total4.14.24.34.44.54.6 TotalFull 2 2 2 2 2 1 2 22 2 2 1 2 22 2 2 2 2 1 2 1 12 2 2 2 2 1Mark→FY↓151115112008/9 2 1 2 0 0 0 0 0 5 2 1 0 0 0 2 5 0 2 2 2 2 0 2 1 0 11 0 2 2 2 1 1 81.0. 0. 0.1.0. 0.1. 0.Average 5 1 1 0 0 0 0 0 3.5 2 5 0.5 5 5 2 6 1 2 2 2 5 0 2 1 5 12 5 1 2 2 5 5 7.52007/8 1 2 1 1 2 0 1 1 9 2 0 0 0 0 2 4 2 0 0 0 2 0 1 1 0 6 0 0 1 1 1 1 42008/9 2 2 1 2 2 0 2 0 11 1 1 2 1 0 1 6 1 0 0 0 2 1 1 1 0 6 1 2 0 0 0 1 41.1.1. 0. 1. 0. 0. 1. 1.0.0. 0. 0. 0.Average 5 2 1 5 2 0 5 5 10 5 5 1 5 0 5 5 5 0 0 0 2 5 1 1 0 6 5 1 5 5 5 1 42007/8 2 2 2 1 2 1 2 1 13 2 2 0 0 2 2 8 2 2 0 2 2 0 1 1 1 11 2 2 0 2 0 1 72008/9 1 2 1 1 2 1 2 2 12 2 1 1 0 1 2 7 2 2 0 1 2 0 2 1 0 10 2 0 1 2 0 1 61.1. 12. 1.1.1.1. 0. 10.0.Average 5 2 1.5 1 2 1 2 5 5 2 5 0.5 0 5 2 7.5 2 2 0 5 2 0 5 1 5 5 2 1 5 2 0 1 6.52007/8 1 1 1 1 2 1 2 1 10 2 2 0 0 2 2 8 0 2 0 2 2 1 2 1 0 10 1 2 2 2 2 1 102008/9 2 2 2 2 2 1 2 2 15 2 2 1 1 2 2 10 1 2 0 2 2 1 2 1 0 11 2 2 2 1 2 1 101.1.1. 12.0.0.10. 1.1.Average 5 1.5 1.5 5 2 1 2 5 5 2 2 0.5 5 2 2 9 5 2 0 2 2 1 2 1 0 5 5 2 2 5 2 1 102007/8 2 2 2 1 2 1 2 2 14 2 2 2 1 2 2 11 2 0 2 1 2 1 2 1 1 12 1 0 2 2 1 1 72008/9 2 2 2 0 1 0 2 0 9 2 1 2 0 1 2 8 2 0 0 1 2 0 2 1 0 8 2 0 1 2 0 1 60.11. 1. 0. 1.0.0. 1. 1. 0.Average 2 2 2 5 1.5 0.5 2 1 5 2 5 2 5 5 2 9.5 2 0 1 1 2 5 2 1 5 10 5 0 5 2 5 1 6.52007/8 2 2 2 2 2 1 2 2 15 2 0 2 1 2 2 9 1 0 1 2 2 1 2 1 1 11 1 0 1 2 2 1 72008/9 2 2 2 2 2 1 2 2 15 2 2 2 1 2 2 11 1 2 0 1 2 1 2 1 0 10 0 1 2 2 2 1 80. 1.0. 10. 0. 0. 1.Average 2 2 2 2 2 1 2 2 15 2 1 2 1 2 2 10 1 1 5 5 2 1 2 1 5 5 5 5 5 2 2 1 7.52007/8 2 2 1 2 1 1 2 0 11 2 2 0 0 0 2 6 1 0 0 1 2 1 2 1 1 9 2 2 0 2 2 1 92008/9 1 2 0 2 1 0 2 0 8 2 1 1 0 1 2 7 2 0 0 1 2 0 2 1 0 8 2 1 0 2 0 1 61.1.0.1.0.0.1.Average 5 2 0.5 2 1 0.5 2 0 9.5 2 5 0.5 0 5 2 6.5 5 0 0 1 2 5 2 1 5 8.5 2 5 0 2 1 1 7.52007/8 1 2 1 1 2 1 2 1 11 0 2 0 0 1 2 5 1 2 0 2 2 0 2 1 0 10 2 2 0 0 2 1 72008/9 2 2 1 2 2 1 2 2 14 2 2 0 0 0 2 6 2 2 1 1 2 1 2 1 1 13 2 2 1 1 2 1 91.1.1. 12.0.1. 0. 1. 0.0. 11.0. 0.Average 5 2 1 5 2 1 2 5 5 1 2 0 0 5 2 5.5 5 2 5 5 2 5 2 1 5 5 2 2 5 5 2 1 82007/8 1 1 1 1 1 0 1 0 6 2 1 1 0 0 2 6 1 2 1 1 1 0 2 1 0 9 0 0 2 1 0 1 42008/9 1 2 1 2 2 1 2 1 12 2 0 0 0 2 2 6 2 2 2 1 2 0 2 1 1 13 1 1 2 0 2 1 71.1. 0.0.1. 1. 1.0. 0. 0. 0.Average 1 1.5 1 5 1.5 0.5 5 5 9 2 5 0.5 0 1 2 6 5 2 5 1 5 0 2 1 5 11 5 5 2 5 1 1 5.52007/8 1 1 1 1 1 0 1 0 6 2 2 2 1 1 2 10 2 2 0 0 2 0 2 1 0 9 1 0 2 0 0 1 42008/9 2 2 1 2 2 0 2 2 13 2 0 2 1 2 2 9 0 0 0 2 2 0 1 1 0 6 2 2 0 0 1 1 61.1.1.1.1.1.0.Average 5 1.5 1 5 1.5 0 5 1 9.5 2 1 2 1 5 2 9.5 1 1 0 1 2 0 5 1 0 7.5 5 1 1 0 5 1 52007/8 1 2 1 1 1 0 2 0 8 2 2 0 0 1 2 7 0 0 0 0 2 0 2 1 0 5 1 2 0 1 1 1 62008/9 1 2 1 1 2 1 2 0 10 2 0 0 0 0 2 4 0 0 0 0 2 1 1 1 1 6 0 0 0 1 0 1 2Average 1 2 1 1 1.5 0.5 2 0 9 2 1 0 0 0. 2 5.5 0 0 0 0 2 0. 1. 1 0. 5.5 0. 1 0 1 0. 1 451
1.Planning & Programme Management 2.Budget Management 3.Financial Management 4.Fiscal Resource Mobilization CapacityResult of Indicators Result of Indicators Result of Indicators Result of IndicatorsTotal Indicators : 9 , Active : 8, Full Marks : 15,Pass Marks : 6Total Indicators : 6, Full Marks : 11,Pass Marks : 4Total Indicators : 10 Active :9, Full Marks : 15, PassMarks : 6Total Indicators : 6, FullMarks : 11, Pass Marks : 452IndicatorNo.→FullMark→FY↓1.1.1. 1.1 1.2 1.3 4 1.5 1.6 7 82 2 2 2 2 1 2 2Total152. 2. 2. 2. 2.1 2 2.3 4 5 62 2 2 1 2 2Total3. 3. 3. 3. 3. 3. 3. 3.1 2 3 4 5 6 7 3.8 92 2 2 2 2 1 2 1 1Total4. 4. 4. 4. 4. 4.1 2 3 4 5 6 Total2 2 2 2 2 111155 5 5 5 5 52007/8 1 2 1 1 1 0 2 0 8 2 1 0 0 1 2 6 1 2 0 2 2 0 2 1 0 10 0 0 2 2 0 1 5Chitwan2008/9 2 2 1 2 2 1 2 2 14 2 0 0 0 1 1 4 0 2 0 0 2 0 2 1 0 7 0 1 2 2 2 1 81.1.0.1. 0.0.Average 5 2 1 5 1.5 0.5 2 1 11 2 5 0 0 1 5 5 5 2 0 1 2 0 2 1 0 8.5 0 5 2 2 1 1 6.52007/8 2 2 2 2 2 0 2 0 12 2 0 2 1 1 2 8 0 2 0 0 2 0 2 1 0 7 1 2 1 2 2 1 9Makwanpur2008/9 2 2 1 2 2 0 2 2 13 2 2 2 1 1 0 8 0 2 0 0 2 0 1 1 0 6 2 2 0 2 1 1 812.1.1. 0. 1.Average 2 2 1.5 2 2 0 2 1 5 2 1 2 1 1 1 8 0 2 0 0 2 0 5 1 0 6.5 5 2 5 2 5 1 8.52007/8 1 2 1 1 1 0 2 0 8 2 2 1 0 0 2 7 0 0 0 0 2 0 2 1 0 5 1 0 2 2 0 1 6Parsa2008/9 2 2 2 1 2 0 0 2 11 2 0 1 0 1 1 5 0 0 0 0 2 0 1 1 0 4 2 2 0 0 0 1 51.0. 1.1.1.Average 5 2 1.5 1 1.5 0 1 1 9.5 2 1 1 0 5 5 6 0 0 0 0 2 0 5 1 0 4.5 5 1 1 1 0 1 5.52007/8 0 0 0 0 0 0 0 0 0 2 1 0 0 0 2 5 0 0 0 0 2 0 1 0 1 4 0 0 0 0 0 1 1Rautahat2008/9 1 2 1 0 1 0 2 0 7 2 0 2 1 2 2 9 2 2 0 2 2 0 1 1 0 10 0 2 1 1 0 1 50.0. 0.0.0. 0.Average 5 1 0.5 0 0.5 0 1 0 3.5 2 5 1 5 1 2 7 1 1 0 1 2 0 1 0.5 5 7 0 1 5 5 0 1 32007/8 2 2 1 1 2 0 1 1 10 2 2 0 0 1 2 7 2 2 0 1 2 0 2 1 1 11 1 2 2 0 2 0 7Arghakhanc 2008/9 2 2 1 2 2 0 2 2 13 2 2 0 0 1 2 7 1 0 0 0 1 0 2 1 1 6 1 2 0 2 2 1 8hiAverage 2 2 11.5 2 01.51.511.5 2 2 0 0 1 2 71.5 1 00.51.5 0 2 1 1 8.5 1 2 1 1 20.5 7.52007/8 0 2 1 1 2 0 2 0 8 2 0 0 0 0 2 4 2 0 1 2 2 0 2 1 0 10 0 2 0 0 1 1 4Gulmi2008/9 2 2 2 2 2 0 1 2 13 2 2 2 1 2 2 11 2 0 1 2 2 0 2 1 1 11 0 1 2 2 1 1 71.1. 10.0.0. 10. 1.Average 1 2 1.5 5 2 0 5 1 5 2 1 1 5 1 2 7.5 2 0 1 2 2 0 2 1 5 5 0 5 1 1 1 1 5.52007/8 1 2 1 1 2 1 1 1 10 2 1 0 1 0 2 6 2 2 0 1 2 0 2 1 1 11 1 2 2 2 2 1 10Kapilvastu2008/9 2 2 1 2 1 0 2 0 10 2 2 1 0 0 2 7 1 2 0 1 2 1 2 1 0 10 0 2 2 2 1 1 81.1.1. 0.1. 0.1.0.0. 10. 0.1.Average 5 2 1 5 1.5 0.5 5 5 10 2 5 0.5 5 0 2 6.5 5 2 0 1 2 5 2 1 5 5 5 2 2 2 5 1 92007/8 2 2 1 2 2 1 1 0 11 2 1 2 1 1 2 9 1 2 0 1 2 0 2 1 0 9 2 2 2 1 1 1 9Nawalparasi2008/9 2 2 1 2 2 1 2 2 14 2 2 1 1 1 2 9 0 2 1 1 2 0 2 1 0 9 1 2 2 2 2 1 101. 12. 1.0. 0.1.1. 1.Average 2 2 1 2 2 1 5 1 5 2 5 1.5 1 1 2 9 5 2 5 1 2 0 2 1 0 9 5 2 2 5 5 1 9.52007/8 1 0 1 2 2 0 2 2 10 2 2 2 1 1 2 10 2 2 0 0 2 0 2 1 0 9 0 2 0 0 2 1 5Palpa2008/9 2 2 2 2 2 1 1 2 14 2 0 2 1 2 2 9 0 2 1 0 2 1 2 1 0 9 2 0 2 2 2 1 91.1.1.0.0.Average 5 1 1.5 2 2 0.5 5 2 12 2 1 2 1 5 2 9.5 1 2 5 0 2 5 2 1 0 9 1 1 1 1 2 1 72007/8 2 1 1 1 1 0 1 1 8 2 2 0 0 1 2 7 1 0 0 1 1 0 1 1 1 6 1 2 1 0 2 0 6Rup<strong>and</strong>ehi2008/9 2 2 1 1 1 0 0 0 7 1 0 0 0 1 2 4 0 0 0 1 1 0 2 1 1 6 2 2 2 2 2 1 110. 0. 1.0.1.1. 1.0.Average 2 1.5 1 1 1 0 5 5 7.5 5 1 0 0 1 2 5.5 5 0 0 1 1 0 5 1 1 6 5 2 5 1 2 5 8.5Gorkha 2007/8 1 2 1 1 2 0 0 0 7 0 2 0 0 1 2 5 1 2 0 0 2 0 2 1 0 8 1 0 0 0 2 1 411
1.Planning & Programme Management 2.Budget Management 3.Financial Management 4.Fiscal Resource Mobilization CapacityResult of Indicators Result of Indicators Result of Indicators Result of IndicatorsTotal Indicators : 9 , Active : 8, Full Marks : 15,Pass Marks : 6Total Indicators : 6, Full Marks : 11,Pass Marks : 4Total Indicators : 10 Active :9, Full Marks : 15, PassMarks : 6Total Indicators : 6, FullMarks : 11, Pass Marks : 4KaskiLamjungManangSyangjaTanahunBaglungMustangMyagdiparbatDolpaIndicatorNo.→1.1 1.2 1.31.4 1.5 1.61.71.8Total2.12.2 2.32.42.52.6Total3.13.23.33.43.53.63.7 3.83.9Total4.14.24.34.44.54.6 TotalFull 2 2 2 2 2 1 2 22 2 2 1 2 22 2 2 2 2 1 2 1 12 2 2 2 2 1Mark→FY↓151115112008/9 1 2 2 2 2 1 2 1 13 2 2 0 0 0 2 6 0 2 0 0 1 0 2 1 0 6 0 2 2 0 2 1 71.0.0.0.1.0.Average 1 2 1.5 5 2 0.5 1 5 10 1 2 0 0 5 2 5.5 5 2 0 0 5 0 2 1 0 7 5 1 1 0 2 1 5.52007/8 0 2 1 1 2 0 0 2 8 2 2 0 0 2 2 8 2 0 0 2 2 0 2 1 0 9 0 0 2 0 2 1 52008/9 2 2 2 1 2 1 2 2 14 2 2 2 1 2 2 11 0 0 0 1 2 1 2 1 0 7 2 2 2 2 2 1 110.1. 0.Average 1 2 1.5 1 2 0.5 1 2 11 2 2 1 5 2 2 9.5 1 0 0 5 2 5 2 1 0 8 1 1 2 1 2 1 82007/8 2 2 2 2 2 0 0 2 12 2 2 0 0 1 0 5 2 2 0 2 2 0 1 1 1 11 0 0 2 0 2 1 52008/9 2 2 2 2 2 1 2 0 13 2 2 0 0 1 2 7 2 0 2 0 2 0 2 1 1 10 0 2 2 0 2 1 712.1.10.Average 2 2 2 2 2 0.5 1 1 5 2 2 0 0 1 1 6 2 1 1 1 2 0 5 1 1 5 0 1 2 0 2 1 62007/8 2 2 1 0 2 0 0 0 7 1 0 0 0 0 2 3 0 2 0 2 2 0 2 0 1 9 0 0 2 0 2 1 52008/9 2 2 2 1 2 1 2 2 14 2 2 0 0 0 2 6 2 0 0 0 2 1 2 1 1 9 2 0 2 0 2 1 71.10. 1.0.Average 2 2 1.5 5 2 0.5 1 1 5 5 1 1 0 0 2 4.5 1 1 0 1 2 5 2 0.5 1 9 1 0 2 0 2 1 62007/8 1 2 1 1 2 0 2 0 9 2 2 2 1 0 2 9 0 0 0 2 2 0 2 1 0 7 2 0 0 0 2 1 52008/9 2 2 2 2 2 1 2 2 15 2 1 2 1 2 2 10 1 0 0 1 2 1 2 1 0 8 2 2 2 2 0 1 91.1.1.0.1. 0.Average 5 2 1.5 5 2 0.5 2 1 12 2 5 2 1 1 2 9.5 5 0 0 5 2 5 2 1 0 7.5 2 1 1 1 1 1 72007/8 2 2 2 2 2 0 2 0 12 2 0 2 1 2 2 9 0 0 0 1 2 0 2 1 0 6 2 0 2 2 0 1 72008/9 2 2 2 2 2 1 2 0 13 2 2 2 1 2 2 11 2 0 0 2 2 1 2 1 1 11 2 2 2 1 1 1 912.1. 0.0.1. 0.Average 2 2 2 2 2 0.5 2 0 5 2 1 2 1 2 2 10 1 0 0 5 2 5 2 1 5 8.5 2 1 2 5 5 1 82007/8 1 2 1 1 2 1 2 1 11 2 2 1 1 1 0 7 2 0 0 0 2 0 1 1 0 6 0 2 0 0 2 1 52008/9 2 2 2 2 2 1 2 1 14 2 2 0 0 1 2 7 2 2 2 0 2 1 2 1 1 13 0 0 0 2 1 1 41.1.12.0.0. 1. 0.1.Average 5 2 1.5 5 2 1 2 1 5 2 2 0.5 5 1 1 7 2 1 1 0 2 5 5 1 5 9.5 0 1 0 1 5 1 4.52007/8 0 1 1 1 1 0 2 0 6 2 2 0 0 1 2 7 2 2 0 1 2 0 1 0 0 8 0 2 0 0 2 1 52008/9 1 2 1 1 2 1 2 0 10 2 1 0 0 0 2 5 0 2 0 1 2 0 1 0 0 6 2 0 2 0 0 1 50.1.0.Average 5 1.5 1 1 1.5 0.5 2 0 8 2 5 0 0 5 2 6 1 2 0 1 2 0 1 0 0 7 1 1 1 0 1 1 52007/8 1 2 1 1 2 0 2 2 11 2 1 1 0 0 1 5 1 0 0 0 2 0 2 1 0 6 0 2 0 0 0 1 32008/9 2 2 1 1 2 1 1 2 12 2 2 0 1 1 1 7 0 0 0 0 2 1 2 1 1 7 1 0 2 0 2 1 61.1. 11. 1. 0. 0.0.0.0. 0.Average 5 2 1 1 2 0.5 5 2 5 2 5 0.5 5 5 1 6 5 0 0 0 2 5 2 1 5 6.5 5 1 1 0 1 1 4.52007/8 1 0 1 1 0 0 0 0 3 2 2 0 0 0 0 4 0 2 0 0 2 0 2 1 1 8 1 0 0 0 1 1 32008/9 2 2 2 2 2 1 2 0 13 2 2 0 0 1 2 7 0 2 0 0 2 1 2 1 1 9 0 2 2 0 2 1 71.1.0.0.0.1.Average 5 1 1.5 5 1 0.5 1 0 8 2 2 0 0 5 1 5.5 0 2 0 0 2 5 2 1 1 8.5 5 1 1 0 5 1 52007/8 0 2 1 1 2 0 2 0 8 0 1 0 0 0 0 1 1 2 0 0 2 0 2 0 0 7 0 0 2 2 2 1 72008/9 2 1 1 1 1 0 2 0 8 2 0 2 0 0 2 6 1 2 0 2 2 1 2 0 0 10 2 2 0 0 2 1 7Average 1 1.5 1 1 1.5 0 2 0 8 1 0. 1 0 0 1 3.5 1 2 0 1 2 0. 2 0 0 8.5 1 1 1 1 2 1 753
1.Planning & Programme Management 2.Budget Management 3.Financial Management 4.Fiscal Resource Mobilization CapacityResult of Indicators Result of Indicators Result of Indicators Result of IndicatorsTotal Indicators : 9 , Active : 8, Full Marks : 15,Pass Marks : 6Total Indicators : 6, Full Marks : 11,Pass Marks : 4Total Indicators : 10 Active :9, Full Marks : 15, PassMarks : 6Total Indicators : 6, FullMarks : 11, Pass Marks : 454IndicatorNo.→FullMark→FY↓1.1.1. 1.1 1.2 1.3 4 1.5 1.6 7 82 2 2 2 2 1 2 2Total152. 2. 2. 2. 2.1 2 2.3 4 5 62 2 2 1 2 2Total3. 3. 3. 3. 3. 3. 3. 3.1 2 3 4 5 6 7 3.8 92 2 2 2 2 1 2 1 1115 5Total154. 4. 4. 4. 4. 4.1 2 3 4 5 6 Total2 2 2 2 2 12007/8 2 2 2 2 2 1 2 0 13 2 2 0 0 1 2 7 2 0 1 0 2 0 1 1 0 7 1 1 0 0 2 1 5Humla2008/9 2 2 1 1 1 1 2 1 11 1 2 2 2 0 1 8 2 2 0 2 2 1 2 1 1 13 2 2 0 2 2 1 91.0. 1.0. 1.0.0. 1. 0. 1. 1.Average 2 2 1.5 5 1.5 1 2 5 12 5 2 1 1 5 5 7.5 2 1 5 1 2 5 5 1 5 10 5 5 0 1 2 1 72007/8 1 2 0 1 2 0 2 0 8 0 1 2 0 1 0 4 2 2 0 2 2 1 2 1 0 12 2 2 2 0 2 1 9Jumla2008/9 2 2 2 0 2 0 2 0 10 2 2 2 1 2 2 11 2 2 1 1 2 1 2 1 1 13 2 2 0 0 0 1 51.0.1. 0. 1.0. 1.0. 12.Average 5 2 1 5 2 0 2 0 9 1 5 2 5 5 1 7.5 2 2 5 5 2 1 2 1 5 5 2 2 1 0 1 1 72007/8 2 2 1 1 2 0 0 0 8 2 1 0 0 0 0 3 0 0 0 2 2 0 1 1 1 7 0 2 2 0 0 1 5Kalikot2008/9 2 2 1 1 1 1 2 2 12 2 2 0 0 2 2 8 2 2 0 0 2 0 2 1 1 10 2 1 0 0 0 1 41.1.1.Average 2 2 1 1 1.5 0.5 1 1 10 2 5 0 0 1 1 5.5 1 1 0 1 2 0 5 1 1 8.5 1 5 1 0 0 1 4.52007/8 1 2 2 0 2 0 0 0 7 2 2 2 1 0 2 9 0 0 0 1 2 0 2 1 0 6 0 2 2 0 0 1 5Mugu2008/9 1 2 1 1 0 1 2 0 8 2 2 0 0 0 2 6 1 0 1 0 2 0 2 0 0 6 1 2 0 0 0 1 40.0.0. 0. 0.0.Average 1 2 1.5 5 1 0.5 1 0 7.5 2 2 1 5 0 2 7.5 5 0 5 5 2 0 2 0.5 0 6 5 2 1 0 0 1 4.52007/8 0 2 2 2 2 0 2 0 10 2 2 2 1 1 0 8 2 2 0 0 2 0 0 1 1 8 0 0 2 0 0 1 3Dang2008/9 1 2 1 1 2 0 0 2 9 0 1 2 1 1 2 7 1 2 0 1 2 0 1 1 1 9 0 2 0 2 2 1 70.1.1.1.0.0.Average 5 2 1.5 5 2 0 1 1 9.5 1 5 2 1 1 1 7.5 5 2 0 5 2 0 5 1 1 8.5 0 1 1 1 1 1 52007/8 2 2 2 2 2 1 2 0 13 2 1 0 0 2 0 5 0 0 0 0 2 1 1 1 1 6 0 2 2 0 0 0 4Pyuthan2008/9 2 2 1 1 2 0 2 0 10 2 2 2 1 2 1 10 1 2 0 1 2 0 1 1 1 9 0 2 0 2 0 1 51.11. 1. 0. 0. 0.0. 0.0.Average 2 2 1.5 5 2 0.5 2 0 5 2 5 1 5 2 5 7.5 5 1 0 5 2 5 1 1 1 7.5 0 2 1 1 0 5 4.52007/8 2 1 2 1 2 0 2 0 10 2 0 0 0 2 0 4 0 0 0 0 2 0 1 1 0 4 0 0 2 0 0 0 2Rolpa2008/9 2 1 1 1 2 0 2 0 9 2 2 2 1 1 2 10 0 0 0 0 2 0 1 1 0 4 0 2 0 2 0 1 50. 1.0.Average 2 1 1.5 1 2 0 2 0 9.5 2 1 1 5 5 1 7 0 0 0 0 2 0 1 1 0 4 0 1 1 1 0 5 3.52007/8 2 2 1 2 2 0 2 2 13 2 2 0 0 0 2 6 1 2 0 0 2 0 1 0 0 6 2 2 2 0 0 1 7Rukum2008/9 1 2 1 1 2 0 2 2 11 2 0 0 0 2 0 4 1 0 0 0 2 1 1 1 0 6 0 2 2 0 2 1 71.1.0.Average 5 2 1 5 2 0 2 2 12 2 1 0 0 1 1 5 1 1 0 0 2 5 1 0.5 0 6 1 2 2 0 1 1 72007/8 2 2 2 1 2 0 2 2 13 2 2 1 0 1 2 8 2 2 0 2 2 1 2 1 1 13 0 2 0 2 0 1 5Salyan2008/9 2 2 2 2 2 1 2 1 14 2 1 1 0 2 0 6 2 2 1 1 2 1 2 1 1 13 0 0 2 2 1 1 61.1. 13. 1.1.0. 1.0.Average 2 2 2 5 2 0.5 2 5 5 2 5 1 0 5 1 7 2 2 5 5 2 1 2 1 1 13 0 1 1 2 5 1 5.52007/8 0 1 1 2 2 0 0 0 6 0 2 0 0 1 2 5 2 2 0 0 2 0 1 1 0 8 2 2 0 2 2 1 9Banke2008/9 2 2 1 1 2 0 2 0 10 2 2 2 1 0 2 9 1 2 0 0 2 1 1 1 0 8 2 0 2 2 2 1 91.0. 0.1.0.Average 1 1.5 1 5 2 0 1 0 8 1 2 1 5 5 2 7 5 2 0 0 2 5 1 1 0 8 2 1 1 2 2 1 9Bardia 2007/8 2 2 0 0 2 0 2 0 8 1 0 0 0 2 2 5 2 0 0 1 2 1 2 0 1 9 1 2 0 0 0 1 411
1.Planning & Programme Management 2.Budget Management 3.Financial Management 4.Fiscal Resource Mobilization CapacityResult of Indicators Result of Indicators Result of Indicators Result of IndicatorsTotal Indicators : 9 , Active : 8, Full Marks : 15,Pass Marks : 6Total Indicators : 6, Full Marks : 11,Pass Marks : 4Total Indicators : 10 Active :9, Full Marks : 15, PassMarks : 6Total Indicators : 6, FullMarks : 11, Pass Marks : 4DailekhJajarkotSurkhetAchhamBajhangBajuraDotiKailaliBaitadiDadeldhuraIndicatorNo.→1.1 1.2 1.31.4 1.5 1.61.71.8Total2.12.2 2.32.42.52.6Total3.13.23.33.43.53.63.7 3.83.9Total4.14.24.34.44.54.6 TotalFull 2 2 2 2 2 1 2 22 2 2 1 2 22 2 2 2 2 1 2 1 12 2 2 2 2 1Mark→FY↓151115112008/9 2 2 1 1 1 1 2 2 12 0 2 0 0 1 0 3 0 2 1 1 2 1 2 0 1 10 0 0 0 0 2 1 30.0.1.0.0.Average 2 2 0.5 5 1.5 0.5 2 1 10 5 1 0 0 5 1 4 1 1 5 1 2 1 2 0 1 9.5 5 1 0 0 1 1 3.52007/8 0 2 1 1 2 0 0 0 6 2 1 0 0 0 0 3 2 2 2 2 2 0 2 1 0 13 0 0 0 0 0 0 02008/9 2 2 1 0 2 0 2 0 9 2 1 2 1 1 2 9 1 2 1 0 2 0 2 1 0 9 1 0 0 2 0 1 40.0. 0.1. 1.0.0.Average 1 2 1 5 2 0 1 0 7.5 2 1 1 5 5 1 6 5 2 5 1 2 0 2 1 0 11 5 0 0 1 0 5 22007/8 2 2 1 1 2 0 2 2 12 2 2 2 1 1 2 10 2 2 0 2 2 0 2 1 1 12 0 2 2 0 0 1 52008/9 1 2 1 2 2 0 2 1 11 2 2 0 0 0 0 4 2 2 0 0 2 1 1 1 1 10 0 1 2 0 1 1 51.1.1. 11.0. 0.0. 1.1.0.Average 5 2 1 5 2 0 2 5 5 2 2 1 5 5 1 7 2 2 0 1 2 5 5 1 1 11 0 5 2 0 5 1 52007/8 2 2 1 1 2 0 0 0 8 2 1 1 0 0 2 6 1 0 0 0 2 0 2 1 1 7 2 2 0 0 1 1 62008/9 1 2 2 2 2 1 2 0 12 0 2 1 0 1 2 6 2 2 0 1 1 0 2 1 0 9 2 2 0 2 0 1 71.1.1.0.1.0. 1.0.0.Average 5 2 1.5 5 2 0.5 1 0 10 1 5 1 0 5 2 6 5 1 0 5 5 0 2 1 5 8 2 2 0 1 5 1 6.52007/8 2 2 2 1 2 0 0 0 9 0 2 1 1 0 2 6 2 0 2 1 2 0 2 1 0 10 0 2 0 0 0 1 32008/9 2 2 2 1 1 1 0 0 9 0 2 1 1 0 1 5 2 0 0 0 2 0 2 1 1 8 2 0 0 2 0 1 51.0.0.Average 2 2 2 1 1.5 0.5 0 0 9 0 2 1 1 0 5 5.5 2 0 1 5 2 0 2 1 5 9 1 1 0 1 0 1 42007/8 1 2 1 1 2 1 1 0 9 2 2 1 1 2 1 9 0 2 1 2 2 0 2 1 1 11 2 2 0 2 1 0 72008/9 1 2 1 1 2 1 1 2 11 2 2 0 1 2 2 9 2 2 1 0 0 1 1 1 0 8 0 2 2 0 0 1 51.0. 1. 0.0. 0.Average 1 2 1 1 2 1 1 1 10 2 2 0.5 1 2 5 9 1 2 1 1 1 5 5 1 5 9.5 1 2 1 1 5 5 62007/8 1 2 1 2 2 1 2 2 13 2 1 0 0 1 2 6 1 2 0 0 1 0 2 0 0 6 0 2 2 0 0 1 52008/9 2 2 2 1 2 1 0 1 11 2 2 2 1 1 2 10 0 2 0 0 2 0 2 1 0 7 0 2 2 0 0 1 51.1.1.1. 0.0.1.Average 5 2 1.5 5 2 1 1 5 12 2 5 1 5 1 2 8 5 2 0 0 5 0 2 0.5 0 6.5 0 2 2 0 0 1 52007/8 1 2 1 2 2 1 2 1 12 2 2 2 1 0 2 9 2 0 0 1 2 0 1 0 1 7 2 2 0 0 0 1 52008/9 2 2 2 0 2 1 0 1 10 2 2 2 1 0 2 9 2 0 2 1 0 0 2 1 1 9 0 2 0 2 0 1 51.1.Average 5 2 1.5 1 2 1 1 1 11 2 2 2 1 0 2 9 2 0 1 1 1 0 5 0.5 1 8 1 2 0 1 0 1 52007/8 1 2 1 1 1 1 2 0 9 2 1 0 1 1 2 7 0 2 0 2 2 1 1 1 0 9 0 2 0 2 0 1 52008/9 1 2 1 2 2 1 1 1 11 1 2 2 1 1 2 9 2 2 0 0 2 0 2 1 1 10 0 2 0 1 0 1 41.1. 0. 1. 1.0. 1. 0.1.Average 1 2 1 5 1.5 1 5 5 10 5 5 1 1 1 2 8 1 2 0 1 2 5 5 1 5 9.5 0 2 0 5 0 1 4.52007/8 1 1 1 1 1 0 1 0 6 0 2 0 0 1 2 5 0 2 0 0 1 0 2 1 0 6 2 2 0 2 2 1 92008/9 2 2 2 1 2 1 0 2 12 2 2 0 0 2 2 8 2 2 0 0 2 0 1 1 0 8 0 2 2 0 0 1 51.0.1.1. 1.Average 5 1.5 1.5 1 1.5 0.5 5 1 9 1 2 0 0 5 2 6.5 1 2 0 0 5 0 5 1 0 7 1 2 1 1 1 1 72007/8 1 1 1 1 1 0 2 0 7 2 2 2 0 0 2 8 2 0 2 1 2 0 1 0 0 8 0 2 2 1 0 0 52008/9 2 2 1 2 2 0 1 1 11 2 2 2 1 0 2 9 1 0 0 1 2 0 2 1 0 7 1 2 0 2 0 0 5Average 1. 1.5 1 1. 1.5 0 1. 0. 9 2 2 2 0. 0 2 8.5 1. 0 1 1 2 0 1. 0.5 0 7.5 0. 2 1 1. 0 0 555
1.Planning & Programme Management 2.Budget Management 3.Financial Management 4.Fiscal Resource Mobilization CapacityResult of Indicators Result of Indicators Result of Indicators Result of IndicatorsTotal Indicators : 9 , Active : 8, Full Marks : 15,Pass Marks : 6Total Indicators : 6, Full Marks : 11,Pass Marks : 4Total Indicators : 10 Active :9, Full Marks : 15, PassMarks : 6Total Indicators : 6, FullMarks : 11, Pass Marks : 4DarchulaKanchanpurIndicatorNo.→FullMark→FY↓1.1.1. 1.1 1.2 1.3 4 1.5 1.6 7 82 2 2 2 2 1 2 2Total2. 2. 2. 2. 2.1 2 2.3 4 5 62 2 2 1 2 2Total3. 3. 3. 3. 3. 3. 3. 3.1 2 3 4 5 6 7 3.8 92 2 2 2 2 1 2 1 1Total4. 4. 4. 4. 4. 4.1 2 3 4 5 6 Total2 2 2 2 2 11511155 5 5 5 5 5 5 5 52007/8 2 2 1 0 2 0 2 0 9 0 2 2 1 1 0 6 2 2 1 1 1 0 2 1 0 10 1 1 1 0 0 1 42008/9 1 2 2 1 2 1 0 2 11 2 2 1 1 1 2 9 2 2 1 0 1 0 2 1 1 10 0 2 2 2 2 1 9Average1.5 2 1.50.5 2 0.5 1 1 10 1 2 1.5 1 1 1 7.5 2 2 10.5 1 0 2 10.5 100.51.51.5 1 1 1 6.52007/8 1 1 1 1 1 0 2 1 8 2 2 1 1 1 1 8 2 2 0 0 2 0 1 0 0 7 0 0 2 2 0 1 52008/9 2 2 1 1 2 1 1 1 11 2 2 2 1 0 2 9 1 0 0 1 2 0 1 1 0 6 0 1 0 2 0 1 41.1.0. 1. 1.0.0.Average 5 1.5 1 1 1.5 0.5 5 1 9.5 2 2 1.5 1 5 5 8.5 5 1 0 5 2 0 1 0.5 0 6.5 0 5 1 2 0 1 4.511DistrictsIllamJhapaTaplejungPanchatharAnnex 5.2: Result of Performance Measures (PMs) of all DDCs for the FY 2007/8 <strong>and</strong> 2008/9: remaining four functional areas <strong>and</strong> total score56IndicatorNo.→FullMark→FY↓5.Budget Release <strong>and</strong> Programme Execution 6.Communication And Transperancy 7.Monitoring <strong>and</strong> Evalution8.Organizations, Service Delivery <strong>and</strong> PropertyMangementResult of Indicators Result of Indicators Result of Indicators Result of IndicatorsTotal Indicators : 7, Full Marks : 12, Pass Marks :45.5.5.1 2 5.3 5.4 5.5 5.6 72 2 2 2 1 2 1Total Indicators : 9 Active : 8, FullMarks : 14, Pass Marks : 6Tot6. 6. 6. 6.al 6.1 6.2 3 4 6.5 6 7 6.82 2 2 1 2 2 2 1Total Indicators : 7, Active : 5,Full Marks : 10, Pass Marks : 3Tot7. 7.al 7.1 7.2 3 7.4 52 2 2 2 2TotalTotal Indicators : 8, Active : 7, Full Marks : 12,Pass Marks : 48 88.. .Tot1 8.2 8.3 4 8.5 6 8.7 8.9 al2 2 2 1 1 1 1 2121410122007/8 2 2 2 0 1 0 1 8 1 1 0 0 2 0 1 0 5 0 1 1 1 0 3 2 1 1 1 0 1 1 0 7 512008/9 2 2 1 0 1 2 1 9 2 2 0 1 2 0 2 0 9 0 2 2 0 2 6 2 1 1 1 1 0 1 0 7 690600.1.1..Average 2 2 1.5 0 1 1 1 8.5 1.5 1.5 0 5 2 0 5 0 7 0 1.5 5 0.5 1 4.5 2 1 1 1 0.5 5 1 0 72007/8 2 2 1 0 1 2 1 9 1 1 0 1 2 0 2 0 7 0 0 2 0 2 4 2 2 2 0 1 1 1 0 9 612008/9 2 2 1 2 1 0 0 8 2 2 0 1 2 1 2 0 10 1 2 2 0 2 7 2 2 2 1 1 1 1 0 10 730670.0..Average 2 2 1 1 1 1 5 8.5 1.5 1.5 0 1 2 5 2 0 8.5 0.5 1 2 0 2 5.5 2 2 2 5 1 1 1 0 9.52007/8 2 1 2 0 1 0 1 7 2 1 0 1 1 0 0 0 5 1 2 2 0 1 6 2 2 1 0 1 1 1 0 8 522008/9 1 1 2 2 1 0 1 8 1 1 2 1 2 0 2 0 9 1 2 2 0 1 6 2 2 2 1 1 1 1 0 10 67059.5.Average 1.5 1 2 1 1 0 1 7.5 1.5 1 1 1 1.5 0 1 0 7 1 2 2 0 1 6 2 2 1.5 5 1 1 1 0 92007/8 2 2 2 0 1 0 0 7 0 0 0 0 0 2 0 0 2 0 0 2 0 0 2 0 2 1 0 1 0 0 0 4 342008/9 2 1 0 2 1 2 1 9 2 2 0 1 1 1 2 0 9 1 2 2 0 2 7 1 2 2 1 1 1 1 0 9 691.0.0. 1.0.0 051.5Average 2 5 1 1 1 1 5 8 1 1 0 5 0.5 5 1 0 5.5 0.5 1 2 0 1 4.5 5 2 1.5 . 1 . 0.5 0 6.5OverallTotal100
DistrictsDhankutaShankhuwasabhaBhojpurMorangSunsariTerhathumKhotangSaptariSolukhumbhuIndicatorNo.→5.Budget Release <strong>and</strong> Programme Execution 6.Communication And Transperancy 7.Monitoring <strong>and</strong> Evalution8.Organizations, Service Delivery <strong>and</strong> PropertyMangementResult of Indicators Result of Indicators Result of Indicators Result of IndicatorsTotal Indicators : 7, Full Marks : 12, Pass Marks :45.15.2 5.3 5.4 5.5 5.65.7Total 6.1 6.2Total Indicators : 9 Active : 8, FullMarks : 14, Pass Marks : 66.36.4 6.56.66.7 6.8Total Indicators : 7, Active : 5,Full Marks : 10, Pass Marks : 3Total 7.1 7.27.3 7.47.5TotalTotal Indicators : 8, Active : 7, Full Marks : 12,Pass Marks : 48 88.. .Tot1 8.2 8.3 4 8.5 6 8.7 8.9 al5 52007/8 1 1 1 0 1 1 1 6 2 2 2 0 2 1 1 1 11 1 1 1 0 1 4 1 2 2 0 1 1 1 1 9 672008/9 1 2 1 0 1 0 1 6 2 2 2 1 2 2 2 0 13 2 2 2 2 2 10 2 2 2 1 1 1 1 2 12 85Average 11.5 1 0 1 0.5 1 6 2 2 20.5 21.51.5 0.5 12 1.5 1.51.5 11.5 71.5 2 20.5 1 1 1 1.5 11762007/8 0 0 0 0 0 2 1 3 1 1 0 0 2 0 0 0 4 0 1 0 1 0 2 1 2 1 0 1 1 0 1 7 362008/9 2 2 2 2 1 2 1 12 2 1 0 1 2 2 2 1 11 2 2 2 1 2 9 2 2 2 0 1 1 1 2 11 860.1.61Average 1 1 1 1 0.5 2 1 7.5 1.5 1 0 5 2 1 1 0.5 7.5 1 1.5 1 1 1 5.5 5 2 1.5 0 1 1 0.5 1.5 92007/8 1 1 0 0 1 2 1 6 1 1 0 0 2 0 0 0 4 0 2 2 1 1 6 1 2 1 0 1 1 1 0 7 492008/9 2 2 0 0 1 2 1 8 1 1 0 0 2 0 1 0 5 0 2 2 1 1 6 1 2 2 0 1 1 1 0 8 511.0.50Average 1.5 5 0 0 1 2 1 7 1 1 0 0 2 0 5 0 4.5 0 2 2 1 1 6 1 2 1.5 0 1 1 1 0 7.52007/8 1 1 0 0 1 2 1 6 2 2 0 1 2 2 2 0 11 0 2 0 1 1 4 1 2 2 1 1 1 0 0 8 632008/9 1 1 2 2 1 0 1 8 2 2 2 1 2 2 2 1 14 2 2 2 0 2 8 2 2 2 1 1 1 1 2 12 841. 1.73.5Average 1 1 1 1 1 1 1 7 2 2 1 1 2 2 2 0.5 13 1 2 1 0.5 5 6 5 2 2 1 1 1 0.5 1 102007/8 1 1 2 0 1 2 1 8 1 1 1 0 1 0 0 1 5 0 2 1 1 0 4 1 1 2 0 1 0 0 0 5 562008/9 2 1 2 0 1 0 1 7 2 2 1 1 2 0 1 0 9 0 2 1 1 2 6 1 2 2 0 1 1 1 0 8 69062.50.0..Average 1.5 1 2 0 1 1 1 7.5 1.5 1.5 1 5 1.5 0 5 0.5 7 0 2 1 1 1 5 1 1.5 2 0 1 5 0.5 0 6.52007/8 1 1 2 0 1 1 1 7 2 2 1 1 2 1 1 1 11 1 2 2 0 1 6 2 2 2 0 1 1 1 2 11 702008/9 1 1 0 2 1 0 1 6 2 2 2 1 2 2 2 0 13 2 2 2 0 2 8 2 2 1 1 1 1 1 2 11 820761.1. 1.1..Average 1 1 1 1 1 0.5 1 6.5 2 2 5 1 2 5 5 0.5 12 1.5 2 2 0 5 7 2 2 1.5 5 1 1 1 2 112007/8 2 2 2 0 1 0 1 8 1 1 2 0 2 0 0 0 6 0 2 2 1 1 6 1 2 2 0 1 1 1 0 8672008/9 2 2 2 0 0 2 1 9 2 2 2 1 2 2 2 1 14 2 2 2 2 2 10 2 2 1 1 1 1 1 0 9 830750.1. 1..Average 2 2 2 0 0.5 1 1 8.5 1.5 1.5 2 5 2 1 1 0.5 10 1 2 2 1.5 5 8 5 2 1.5 5 1 1 1 0 8.52007/8 0 0 2 0 1 0 1 4 1 1 2 0 2 0 0 1 7 2 2 0 1 0 5 2 1 1 0 1 1 1 0 7 492008/9 1 1 2 2 1 0 1 8 1 1 1 1 2 0 0 1 7 2 2 2 0 2 8 2 2 1 0 0 0 0 0 5 590540.1. 0..Average 0.5 5 2 1 1 0 1 6 1 1 5 5 2 0 0 1 7 2 2 1 0.5 1 6.5 2 1.5 1 0 0.5 5 0.5 0 62007/8 1 1 0 0 1 0 1 4 1 1 1 1 2 0 1 1 8 1 2 0 0 1 4 1 2 2 1 1 0 1 0 8 532008/9 1 1 2 0 1 0 1 6 1 2 1 1 2 0 2 0 9 0 2 1 0 0 3 2 2 1 1 0 0 0 0 6 521.0. 0. 1.52.5Average 1 1 1 0 1 0 1 5 1 1.5 1 1 2 0 5 0.5 8.5 0.5 2 5 0 5 3.5 5 2 1.5 1 0.5 0 0.5 0 7Udayapur 2007/8 1 1 0 2 1 0 1 6 1 1 2 1 2 2 1 1 11 2 2 0 1 1 6 1 1 2 0 1 1 1 0 7 71OverallTotal57
DistrictsSirahaOkhaldhungaDhanushaDolakhaMahottariRamechapSarlahiSindhuliBhaktapur5.Budget Release <strong>and</strong> Programme Execution 6.Communication And Transperancy 7.Monitoring <strong>and</strong> Evalution8.Organizations, Service Delivery <strong>and</strong> PropertyMangementResult of Indicators Result of Indicators Result of Indicators Result of IndicatorsTotal Indicators : 7, Full Marks : 12, Pass Marks :4Total Indicators : 9 Active : 8, FullMarks : 14, Pass Marks : 6Total Indicators : 7, Active : 5,Full Marks : 10, Pass Marks : 3Total Indicators : 8, Active : 7, Full Marks : 12,Pass Marks : 4Ove8 8rallIndicatorNo.→ 5.15.2 5.3 5.4 5.5 5.65.7Total 6.1 6.26.36.4 6.56.66.7 6.8Total 7.1 7.27.3 7.47.5Total8.1 8.2 8.3.4 8.5.6 8.7 8.9TotalTotal2008/9 1 1 2 0 1 0 1 6 2 2 2 1 2 2 2 0 13 0 2 2 0 2 6 2 2 2 1 1 1 1 0 10 810761.1. 1..Average 1 1 1 1 1 0 1 6 1.5 1.5 2 1 2 2 5 0.5 12 1 2 1 0.5 5 6 5 1.5 2 5 1 1 1 0 8.52007/8 0 0 2 2 1 0 1 6 1 1 2 1 0 0 1 1 7 0 2 2 1 0 5 2 1 1 0 1 1 1 0 7 582008/9 0 2 2 0 1 0 1 6 2 2 2 0 2 0 2 1 11 0 2 2 0 2 6 1 2 1 0 0 0 0 0 4 55056.50.1.1..Average 0 1 2 1 1 0 1 6 1.5 1.5 2 5 1 0 5 1 9 0 2 2 0.5 1 5.5 5 1.5 1 0 0.5 5 0.5 0 5.52007/8 1 1 1 0 0 2 0 5 2 1 0 0 1 1 0 0 5 1 2 2 0 1 6 0 2 1 0 1 1 0 0 5 472008/9 1 1 0 0 1 0 1 4 1 1 1 0 2 0 1 0 6 1 2 2 0 1 6 0 2 1 0 0 1 1 0 5 450.0.0. 0.46Average 1 1 0.5 0 0.5 1 5 4.5 1.5 1 5 0 1.5 5 5 0 5.5 1 2 2 0 1 6 0 2 1 0 0.5 1 0.5 0 52007/8 2 2 0 0 1 0 0 5 0 0 0 0 1 0 0 0 1 0 2 2 1 0 5 1 1 0 0 1 0 0 1 4 352008/9 2 2 1 0 1 1 1 8 1 1 2 1 2 0 1 1 9 2 2 2 0 1 7 2 2 0 1 1 1 1 2 10 680 051.50.0.0.0. 1.. .Average 2 2 0.5 0 1 0.5 5 6.5 0.5 0.5 1 5 1.5 0 5 0.5 5 1 2 2 0.5 5 6 5 1.5 0 5 1 5 0.5 1.5 72007/8 2 1 2 0 0 0 1 6 1 1 1 1 1 1 1 1 8 1 2 1 0 1 5 2 1 1 0 1 1 1 0 7 602008/9 1 1 0 0 0 2 1 5 1 1 1 1 2 2 2 1 11 1 2 2 1 1 7 1 1 2 0 1 1 1 0 7 611. 1.1.1.60.5Average 1.5 1 1 0 0 1 1 5.5 1 1 1 1 1.5 5 5 1 9.5 1 2 5 0.5 1 6 5 1 1.5 0 1 1 1 0 72007/8 1 2 1 0 1 0 0 5 1 1 0 0 1 0 0 0 3 1 2 0 1 0 4 1 1 0 1 1 0 0 1 5 392008/9 2 2 2 0 1 1 1 9 0 1 0 1 1 0 1 0 4 0 1 0 0 2 3 2 2 1 1 1 0 0 0 7 510.0.0.1.45Average 1.5 2 1.5 0 1 0.5 5 7 0.5 1 0 5 1 0 5 0 3.5 0.5 1.5 0 0.5 1 3.5 5 1.5 0.5 1 1 0 0 0.5 62007/8 1 1 2 0 0 1 1 6 1 2 1 1 2 2 2 1 12 2 2 2 0 2 8 1 1 1 0 1 1 1 0 6 702008/9 0 1 2 0 0 2 1 6 1 2 1 1 2 1 2 1 11 2 2 2 1 2 9 1 2 2 0 1 1 1 0 8 661.68Average 0.5 1 2 0 0 1.5 1 6 1 2 1 1 2 5 2 1 12 2 2 2 0.5 2 8.5 1 1.5 1.5 0 1 1 1 0 72007/8 1 1 2 0 0 0 0 4 0 1 0 0 1 0 0 0 2 0 2 2 1 0 5 1 1 0 0 1 0 0 1 4 442008/9 1 1 1 2 1 0 0 6 1 1 0 1 1 0 0 0 4 1 1 2 0 1 5 2 0 0 0 1 1 0 2 6 500470.0. 1..Average 1 1 1.5 1 0.5 0 0 5 0.5 1 0 5 1 0 0 0 3 0.5 1.5 2 0.5 5 5 5 0.5 0 0 1 5 0 1.5 52007/8 2 2 0 0 0 0 1 5 1 1 1 0 1 0 0 1 5 1 2 1 0 1 5 1 0 1 0 1 1 1 2 7 452008/9 1 1 2 0 0 0 1 5 1 1 1 1 1 0 0 0 5 0 0 2 0 1 3 0 0 1 1 1 1 0 0 4 44044.51.0.1.0..Average 1.5 5 1 0 0 0 1 5 1 1 1 5 1 0 0 0.5 5 0.5 1 5 0 1 4 5 0 1 5 1 1 0.5 1 5.52007/8 2 2 0 0 1 0 1 6 2 2 0 0 2 0 2 0 8 0 2 2 1 0 5 2 2 1 0 1 1 1 0 8 662008/9 1 1 1 0 1 2 0 6 1 2 2 1 2 0 1 0 9 1 2 1 2 2 8 2 2 1 0 1 1 1 0 8 661.0.0.1.1.66Average 1.5 5 0.5 0 1 1 5 6 1.5 2 1 5 2 0 5 0 8.5 0.5 2 5 1.5 1 6.5 2 2 1 0 1 1 1 0 858
DistrictsDhadingKathm<strong>and</strong>uKavrepalanchokLalitpurNuwakotRashuwaSindhupalchokBaraChitwanMakwanpur5.Budget Release <strong>and</strong> Programme Execution 6.Communication And Transperancy 7.Monitoring <strong>and</strong> Evalution8.Organizations, Service Delivery <strong>and</strong> PropertyMangementResult of Indicators Result of Indicators Result of Indicators Result of IndicatorsTotal Indicators : 7, Full Marks : 12, Pass Marks :4Total Indicators : 9 Active : 8, FullMarks : 14, Pass Marks : 6Total Indicators : 7, Active : 5,Full Marks : 10, Pass Marks : 3Total Indicators : 8, Active : 7, Full Marks : 12,Pass Marks : 4Ove8 8rallIndicatorNo.→ 5.15.2 5.3 5.4 5.5 5.65.7Total 6.1 6.26.36.4 6.56.66.7 6.8Total 7.1 7.27.3 7.47.5Total8.1 8.2 8.3.4 8.5.6 8.7 8.9TotalTotal2007/8 2 2 1 2 1 1 1 10 1 1 2 1 2 2 1 0 10 1 2 2 1 1 7 2 2 2 1 1 1 1 2 12 772008/9 2 1 2 2 1 2 1 11 2 2 2 1 2 2 2 1 14 2 2 2 2 2 10 2 2 2 1 1 1 1 2 12 931.1.1.85Average 2 5 1.5 2 1 1.5 1 11 1.5 1.5 2 1 2 2 5 0.5 12 1.5 2 2 1.5 5 8.5 2 2 2 1 1 1 1 2 122007/8 1 0 2 0 1 2 1 7 2 2 2 0 2 0 2 0 10 1 2 2 2 2 9 2 2 2 1 1 1 1 0 10 802008/9 0 0 2 2 1 0 0 5 2 1 2 1 2 0 0 0 8 0 2 1 0 2 5 2 1 1 0 1 1 1 0 7 560680.0.1..Average 0.5 0 2 1 1 1 5 6 2 1.5 2 5 2 0 1 0 9 0.5 2 5 1 2 7 2 1.5 1.5 5 1 1 1 0 8.52007/8 2 0 2 0 1 2 1 8 2 2 0 1 2 2 2 0 11 2 2 2 0 2 8 2 2 2 1 1 1 1 0 10 792008/9 2 2 1 0 1 2 0 8 2 2 2 1 2 2 2 0 13 2 2 0 2 2 8 2 2 1 0 1 1 1 0 8 810800..Average 2 1 1.5 0 1 2 5 8 2 2 1 1 2 2 2 0 12 2 2 1 1 2 8 2 2 1.5 5 1 1 1 0 92007/8 0 0 0 0 1 1 1 3 2 2 2 1 2 2 2 0 13 0 2 2 0 2 6 2 2 1 1 1 1 1 0 9 662008/9 1 1 1 0 1 0 0 4 2 1 0 1 2 1 0 0 7 1 2 0 0 2 5 2 1 1 0 1 1 1 0 7 520590.0.1..Average 0.5 5 0.5 0 1 0.5 5 3.5 2 1.5 1 1 2 5 1 0 10 0.5 2 1 0 2 5.5 2 1.5 1 5 1 1 1 0 82007/8 1 2 0 0 1 0 0 4 1 1 2 0 2 0 0 0 6 0 2 2 0 1 5 2 1 2 0 1 0 1 0 7 552008/9 1 2 0 0 1 2 1 7 1 2 2 0 2 0 2 0 9 2 2 2 1 2 9 2 2 2 1 1 1 1 0 10 770 0660.1.. .Average 1 2 0 0 1 1 5 5.5 1 1.5 2 0 2 0 1 0 7.5 1 2 2 0.5 5 7 2 1.5 2 5 1 5 1 0 8.52007/8 1 1 0 0 0 0 0 2 1 1 0 0 2 0 0 0 4 0 2 0 0 1 3 1 2 2 0 1 1 1 1 9 432008/9 2 2 0 0 0 0 1 5 2 2 2 1 2 0 0 0 9 1 2 2 0 2 7 1 2 2 1 1 1 1 1 10 690561.0.0.1..Average 1.5 5 0 0 0 0 5 3.5 1.5 1.5 1 5 2 0 0 0 6.5 0.5 2 1 0 5 5 1 2 2 5 1 1 1 1 9.52007/8 2 2 2 0 0 0 1 7 2 2 1 0 1 1 2 1 10 1 2 2 0 1 6 2 2 1 0 1 1 1 0 8 602008/9 1 1 2 0 1 0 1 6 1 2 1 1 2 1 1 1 10 2 2 2 0 2 8 2 2 2 0 1 1 1 0 9 671.0.1.1.63.5Average 1.5 5 2 0 0.5 0 1 6.5 1.5 2 1 5 1.5 1 5 1 10 1.5 2 2 0 5 7 2 2 1.5 0 1 1 1 0 8.52007/8 1 1 0 0 1 0 1 4 1 1 1 0 2 0 1 0 6 0 1 1 0 1 3 1 1 2 0 1 1 1 0 7 462008/9 1 0 0 0 1 0 1 3 2 2 1 1 2 1 2 0 11 2 1 2 2 2 9 2 2 2 0 1 0 1 2 10 55050.50.0. 0. 1.1. 1. 1..Average 1 5 0 0 1 0 1 3.5 1.5 1.5 1 5 2 5 5 0 8.5 1 1 5 1 5 6 5 1.5 2 0 1 5 1 1 8.52007/8 1 1 0 0 1 0 1 4 2 2 1 0 2 0 1 0 8 0 1 0 1 1 3 1 2 2 0 1 0 1 0 7 512008/9 1 2 2 0 1 2 1 9 2 2 1 1 2 0 2 1 11 1 2 2 1 2 8 1 2 2 0 1 0 1 1 8 691.0.1.1.60Average 1 5 1 0 1 1 1 6.5 2 2 1 5 2 0 5 0.5 9.5 0.5 1.5 1 1 5 5.5 1 2 2 0 1 0 1 0.5 7.52007/8 0 0 2 0 1 0 1 4 2 2 2 0 2 2 2 0 12 2 1 2 0 2 7 1 2 2 1 1 1 1 0 9 682008/9 2 0 1 2 1 2 1 9 2 2 1 1 2 1 2 1 12 1 2 1 1 2 7 2 2 1 0 1 1 1 2 10 7359
DistrictsParsaRautahatArghakhanchiGulmiKapilvastuNawalparasiPalpaRup<strong>and</strong>ehiGorkhaIndicatorNo.→5.Budget Release <strong>and</strong> Programme Execution 6.Communication And Transperancy 7.Monitoring <strong>and</strong> Evalution8.Organizations, Service Delivery <strong>and</strong> PropertyMangementResult of Indicators Result of Indicators Result of Indicators Result of IndicatorsTotal Indicators : 7, Full Marks : 12, Pass Marks :45.15.2 5.3 5.4 5.5 5.65.7Total 6.1 6.2Total Indicators : 9 Active : 8, FullMarks : 14, Pass Marks : 66.36.4 6.56.66.7 6.8Total Indicators : 7, Active : 5,Full Marks : 10, Pass Marks : 3Total 7.1 7.27.3 7.47.5TotalTotal Indicators : 8, Active : 7, Full Marks : 12,Pass Marks : 48 88.. .Tot1 8.2 8.3 4 8.5 6 8.7 8.9 al01..5 2 1.5 5 1 1 1 1 9.5Average 1 0 1.5 1 1 1 1 6.5 2 21.50.5 21.5 2 0.5 12 1.5 1.51.5 0.5 2 72007/8 1 1 0 0 1 0 1 4 1 1 1 0 1 1 1 0 6 0 1 1 0 1 3 1 1 1 0 1 0 0 0 4 432008/9 1 0 0 0 1 2 1 5 2 2 1 1 2 0 1 0 9 1 2 1 0 1 5 1 1 1 2 1 1 1 0 8 52047.50.0. 0..Average 1 5 0 0 1 1 1 4.5 1.5 1.5 1 5 1.5 5 1 0 7.5 0.5 1.5 1 0 1 4 1 1 1 1 1 5 0.5 0 62007/8 1 0 0 0 0 0 0 1 0 0 0 0 1 0 0 0 1 1 1 0 0 0 2 2 0 0 0 1 0 0 1 4 182008/9 1 1 2 0 0 0 1 5 1 1 2 0 2 0 0 0 6 0 1 2 0 1 4 2 2 1 0 1 1 1 0 8 540360.0.0..Average 1 5 1 0 0 0 5 3 0.5 0.5 1 0 1.5 0 0 0 3.5 0.5 1 1 0 5 3 2 1 0.5 0 1 5 0.5 0.5 62007/8 2 2 0 0 1 2 0 7 2 1 1 1 2 1 1 0 9 1 2 2 0 1 6 2 1 2 0 1 1 1 1 9 662008/9 2 1 0 0 1 2 1 7 2 2 2 1 2 1 1 0 11 1 2 2 0 1 6 2 1 2 0 1 1 1 1 9 671.0.1.66.5Average 2 5 0 0 1 2 5 7 2 1.5 5 1 2 1 1 0 10 1 2 2 0 1 6 2 1 2 0 1 1 1 1 92007/8 2 2 0 0 0 0 1 5 1 1 0 1 2 0 1 0 6 1 2 2 0 0 5 2 2 1 0 1 0 1 1 8 502008/9 2 2 2 0 1 2 1 10 2 2 0 1 2 2 2 1 12 1 2 2 0 2 7 2 2 2 1 1 1 1 0 10 810 065.51.. .Average 2 2 1 0 0.5 1 1 7.5 1.5 1.5 0 1 2 1 5 0.5 9 1 2 2 0 1 6 2 2 1.5 5 1 5 1 0.5 92007/8 2 2 0 2 1 2 0 9 1 2 1 1 2 2 0 0 9 1 2 1 0 2 6 2 1 1 0 1 1 1 1 8 692008/9 1 1 0 2 1 0 1 6 2 2 0 0 2 1 0 0 7 1 2 0 0 2 5 2 1 1 1 1 1 1 0 8 610651.0.0. 0. 1.0..Average 1.5 5 0 2 1 1 5 7.5 1.5 2 5 5 2 5 0 0 8 1 2 5 0 2 5.5 2 1 1 5 1 1 1 0.5 82007/8 2 2 0 0 1 2 1 8 1 1 1 1 2 0 0 0 6 2 1 2 0 2 7 2 1 1 1 1 1 1 0 8 672008/9 1 1 2 2 1 2 0 9 1 1 1 1 2 0 1 0 7 2 1 2 1 2 8 2 1 2 1 1 1 1 0 9 751.0.0.71Average 1.5 5 1 1 1 2 5 8.5 1 1 1 1 2 0 5 0 6.5 2 1 2 0.5 2 7.5 2 1 1.5 1 1 1 1 0 8.52007/8 2 2 2 0 1 0 0 7 1 1 0 0 2 0 1 0 5 1 1 0 1 0 3 2 2 1 0 1 0 1 1 8 572008/9 2 2 2 0 1 2 1 10 2 2 2 1 2 1 2 0 12 2 2 2 2 2 10 2 2 2 1 1 1 1 0 10 830 0700.0. 0. 1.. .Average 2 2 2 0 1 1 5 8.5 1.5 1.5 1 5 2 5 5 0 8.5 1.5 1.5 1 1.5 1 6.5 2 2 1.5 5 1 5 1 0.5 92007/8 1 1 0 2 1 1 0 6 2 2 1 0 2 0 0 0 7 1 2 0 0 2 5 1 2 1 0 1 1 1 1 8 532008/9 0 0 0 2 1 0 0 3 2 2 0 0 2 0 0 0 6 1 1 2 0 2 6 2 1 0 0 1 1 1 0 6 490.0.1.51Average 0.5 5 0 2 1 0.5 0 4.5 2 2 5 0 2 0 0 0 6.5 1 1.5 1 0 2 5.5 5 1.5 0.5 0 1 1 1 0.5 72007/8 1 1 0 0 1 0 1 4 1 1 1 1 2 0 0 0 6 1 2 0 0 1 4 2 2 2 0 1 1 1 0 9 472008/9 1 1 0 0 1 2 1 6 1 2 2 1 2 1 0 0 9 2 2 2 0 1 7 2 2 2 0 1 1 1 2 11 651.0.56Average 1 1 0 0 1 1 1 5 1 1.5 5 1 2 5 0 0 7.5 1.5 2 1 0 1 5.5 2 2 2 0 1 1 1 1 10OverallTotal70.560
DistrictsKaskiLamjungManangSyangjaTanahunBaglungMustangMyagdiparbatDolpa5.Budget Release <strong>and</strong> Programme Execution 6.Communication And Transperancy 7.Monitoring <strong>and</strong> Evalution8.Organizations, Service Delivery <strong>and</strong> PropertyMangementResult of Indicators Result of Indicators Result of Indicators Result of IndicatorsTotal Indicators : 7, Full Marks : 12, Pass Marks :4Total Indicators : 9 Active : 8, FullMarks : 14, Pass Marks : 6Total Indicators : 7, Active : 5,Full Marks : 10, Pass Marks : 3Total Indicators : 8, Active : 7, Full Marks : 12,Pass Marks : 4Ove8 8rallIndicatorNo.→ 5.15.2 5.3 5.4 5.5 5.65.7Total 6.1 6.26.36.4 6.56.66.7 6.8Total 7.1 7.27.3 7.47.5Total8.1 8.2 8.3.4 8.5.6 8.7 8.9TotalTotal2007/8 1 1 1 0 1 0 1 5 1 1 1 0 2 0 0 0 5 1 2 2 1 0 6 2 2 1 0 1 0 1 1 8 542008/9 2 2 2 0 1 2 1 10 2 1 2 1 2 2 0 0 10 2 2 2 2 2 10 2 2 2 0 1 1 1 0 9 820681.1. 0..Average 1.5 5 1.5 0 1 1 1 7.5 1.5 1 5 5 2 1 0 0 7.5 1.5 2 2 1.5 1 8 2 2 1.5 0 1 5 1 0.5 8.52007/8 1 0 0 0 1 1 1 4 2 2 0 0 2 1 1 0 8 0 1 2 0 2 5 2 2 1 0 1 1 1 2 10 602008/9 1 1 0 0 1 2 1 6 2 2 2 1 2 1 2 0 12 2 2 2 1 1 8 2 2 1 1 1 1 1 2 11 740670.0.1.1..Average 1 5 0 0 1 1.5 1 5 2 2 1 5 2 1 5 0 10 1 1.5 2 0.5 5 6.5 2 2 1 5 1 1 1 2 112007/8 0 0 0 2 0 1 1 4 1 1 1 1 2 0 0 0 6 1 1 0 0 0 2 1 1 1 1 1 1 1 0 7 432008/9 2 2 0 0 0 2 2 8 2 2 2 1 2 0 2 0 11 2 2 2 1 1 8 1 2 1 1 1 1 1 0 8 711.57Average 1 1 0 1 0 1.5 1 6 1.5 1.5 5 1 2 0 1 0 8.5 1.5 1.5 1 0.5 1 5 1 1.5 1 1 1 1 1 0 7.52007/8 2 2 0 0 0 2 1 7 1 1 0 1 2 0 1 0 6 1 2 2 0 1 6 2 2 1 0 1 1 1 1 9 582008/9 2 2 2 0 1 2 1 10 2 2 2 1 2 1 1 0 11 2 2 2 0 2 8 2 2 2 1 1 1 1 0 10 81069.50.1..Average 2 2 1 0 0.5 2 1 8.5 1.5 1.5 1 1 2 5 1 0 8.5 1.5 2 2 0 5 7 2 2 1.5 5 1 1 1 0.5 9.52007/8 0 0 2 0 0 1 1 4 2 2 2 1 2 2 1 0 12 2 1 0 0 2 5 2 1 0 1 1 1 1 2 9 642008/9 1 2 2 0 1 2 1 9 2 2 2 1 2 0 2 0 11 2 2 2 1 2 9 2 2 2 1 1 1 1 0 10 831.73.5Average 0.5 1 2 0 0.5 1.5 1 6.5 2 2 2 1 2 1 5 0 12 2 1.5 1 0.5 2 7 2 1.5 1 1 1 1 1 1 9.52007/8 1 1 0 0 0 1 1 4 1 1 0 0 2 0 1 0 5 0 2 2 0 1 5 2 1 0 1 1 1 0 0 6 492008/9 1 0 0 0 1 2 1 5 2 2 2 0 2 2 2 0 12 1 2 2 0 2 7 2 2 2 1 1 1 1 2 12 740.1.1.61.5Average 1 5 0 0 0.5 1.5 1 4.5 1.5 1.5 1 0 2 1 5 0 8.5 0.5 2 2 0 5 6 2 1.5 1 1 1 1 0.5 1 92007/8 1 1 0 0 0 0 0 2 1 1 0 0 1 0 1 0 4 1 2 0 0 0 3 1 2 1 1 1 0 1 0 7 422008/9 1 2 0 0 0 0 1 4 2 2 1 0 2 0 1 0 8 1 2 2 0 2 7 1 2 1 1 1 1 1 0 8 53047.51.0.0..Average 1 5 0 0 0 0 5 3 1.5 1.5 5 0 1.5 0 1 0 6 1 2 1 0 1 5 1 2 1 1 1 5 1 0 7.52007/8 1 0 0 0 0 2 1 4 1 1 0 0 2 0 1 0 5 1 2 0 0 1 4 1 1 2 1 1 0 1 0 7 452008/9 1 1 2 0 0 2 0 6 1 2 1 1 2 1 2 0 10 1 2 1 0 2 6 1 1 2 1 1 1 1 1 9 630540.0.0. 0. 0. 1.0. 1..Average 1 5 1 0 0 2 5 5 1 1.5 5 5 2 5 5 0 7.5 1 2 5 0 5 5 1 1 2 1 1 5 1 0.5 82007/8 1 2 0 0 0 0 1 4 1 1 1 0 2 1 1 0 7 0 2 0 0 1 3 2 2 1 1 1 0 1 0 8 402008/9 2 1 0 0 1 0 1 5 2 2 2 1 2 2 2 0 13 2 2 2 0 2 8 2 2 2 1 1 1 1 1 11 73056.51.1. 0. 1. 1.1..Average 1.5 5 0 0 0.5 0 1 4.5 1.5 1.5 5 5 2 5 5 0 10 1 2 1 0 5 5.5 2 2 1.5 1 1 5 1 0.5 9.52007/8 2 2 2 0 0 0 0 6 1 1 0 0 2 0 0 0 4 0 1 0 0 1 2 1 1 1 1 1 1 0 0 6 412008/9 1 1 2 0 1 0 0 5 1 1 0 1 2 1 1 0 7 1 2 2 0 1 6 2 2 1 1 1 1 1 0 9 5861
DistrictsHumlaJumlaKalikotMuguDangPyuthanRolpaRukumSalyan5.Budget Release <strong>and</strong> Programme Execution 6.Communication And Transperancy 7.Monitoring <strong>and</strong> Evalution8.Organizations, Service Delivery <strong>and</strong> PropertyMangementResult of Indicators Result of Indicators Result of Indicators Result of IndicatorsTotal Indicators : 7, Full Marks : 12, Pass Marks : Total Indicators : 9 Active : 8, Full Total Indicators : 7, Active : 5, Total Indicators : 8, Active : 7, Full Marks : 12,4Marks : 14, Pass Marks : 6Full Marks : 10, Pass Marks : 3Pass Marks : 4Ove8 8rallIndicatorNo.→ 5.15.2 5.3 5.4 5.5 5.65.7Total 6.1 6.26.36.4 6.56.66.7 6.8Total 7.1 7.27.3 7.47.5Total8.1 8.2 8.3.4 8.5.6 8.7 8.9TotalTotal1.0. 0. 0.1.49.5Average 1.5 5 2 0 0.5 0 0 5.5 1 1 0 5 2 5 5 0 5.5 0.5 1.5 1 0 1 4 5 1.5 1 1 1 1 0.5 0 7.52007/8 1 1 0 0 1 0 1 4 1 1 2 1 2 1 1 1 10 1 2 2 0 2 7 1 2 2 1 1 1 1 0 9 622008/9 2 2 2 0 1 0 1 8 2 2 0 1 1 2 1 0 9 1 2 1 0 1 5 1 2 2 0 1 1 0 0 7 700661.1.1. 1..Average 1.5 5 1 0 1 0 1 6 1.5 1.5 1 1 1.5 5 1 0.5 9.5 1 2 5 0 5 6 1 2 2 5 1 1 0.5 0 82007/8 1 1 2 0 1 0 1 6 1 2 0 0 2 0 0 1 6 1 1 0 0 1 3 2 1 1 0 1 1 1 1 8 562008/9 1 1 2 0 1 0 1 6 1 1 1 1 2 2 2 0 10 2 2 2 0 2 8 2 1 2 1 1 1 1 2 11 740650. 0.1..Average 1 1 2 0 1 0 1 6 1 1.5 5 5 2 1 1 0.5 8 1.5 1.5 1 0 5 5.5 2 1 1.5 5 1 1 1 1.5 9.52007/8 0 0 0 0 1 0 1 2 1 1 0 1 2 0 1 0 6 0 2 0 0 1 3 0 1 0 1 1 0 1 0 4 382008/9 1 1 0 0 1 1 1 5 1 1 1 1 2 1 1 1 9 2 2 2 1 2 9 1 2 1 1 1 1 1 0 8 65051.50.0.0.1. 0..Average 0.5 5 0 0 1 0.5 1 3.5 1 1 5 1 2 5 1 0.5 7.5 1 2 1 0.5 5 6 5 1.5 0.5 1 1 5 1 0 62007/8 2 1 0 0 1 2 0 6 1 1 0 1 2 0 0 1 6 0 2 0 0 2 4 1 2 2 0 1 1 1 0 8 512008/9 2 2 0 2 1 0 1 8 1 1 0 1 1 0 0 0 4 1 2 1 0 1 5 0 0 2 0 0 0 0 1 3 44047.51.0.0. 1. 0..Average 2 5 0 1 1 1 5 7 1 1 0 1 1.5 0 0 0.5 5 0.5 2 5 0 5 4.5 5 1 2 0 0.5 5 0.5 0.5 5.52007/8 2 0 2 0 1 0 0 5 2 2 1 1 1 2 2 1 12 1 2 2 0 2 7 2 2 2 1 1 1 1 1 11 642008/9 1 0 2 0 0 2 1 6 2 2 2 1 2 2 1 0 12 1 2 0 1 2 6 2 2 2 1 1 1 1 2 12 680.1.1.66Average 1.5 0 2 0 0.5 1 5 5.5 2 2 5 1 1.5 2 5 0.5 12 1 2 1 0.5 2 6.5 2 2 2 1 1 1 1 1.5 122007/8 2 1 0 2 1 0 1 7 2 2 1 1 2 2 2 1 13 2 2 2 0 2 8 1 2 2 1 1 1 1 2 11 672008/9 2 0 2 2 1 0 1 8 2 2 2 0 2 1 0 0 9 1 2 0 0 2 5 0 2 2 1 1 1 1 0 8 640.1. 0. 1.0.65.5Average 2 5 1 2 1 0 1 7.5 2 2 5 5 2 5 1 0.5 11 1.5 2 1 0 2 6.5 5 2 2 1 1 1 1 1 9.52007/8 2 2 0 0 0 0 1 5 2 2 2 1 2 2 2 1 14 2 2 2 0 2 8 2 2 1 1 1 1 1 2 11 582008/9 2 2 2 0 0 0 0 6 1 1 2 0 2 0 1 0 7 1 2 0 0 2 5 0 2 1 1 1 1 1 2 9 550.0.1.56.5Average 2 2 1 0 0 0 5 5.5 1.5 1.5 2 5 2 1 5 0.5 11 1.5 2 1 0 2 6.5 1 2 1 1 1 1 1 2 102007/8 2 2 0 0 0 2 1 7 1 1 2 1 2 1 1 0 9 2 2 2 0 2 8 2 2 1 1 1 1 1 2 11 672008/9 1 1 0 0 1 2 1 6 2 2 1 0 2 0 2 0 9 2 2 0 0 0 4 2 2 2 0 1 1 1 2 11 58062.51.1. 0. 0. 1..Average 1.5 5 0 0 0.5 2 1 6.5 1.5 1.5 5 5 2 5 5 0 9 2 2 1 0 1 6 2 2 1.5 5 1 1 1 2 112007/8 1 1 1 0 1 0 1 5 2 2 2 1 2 2 2 1 14 2 2 2 0 2 8 2 2 2 1 1 1 1 1 11 772008/9 1 1 1 0 1 1 1 6 2 2 2 1 2 2 2 1 14 2 2 2 0 2 8 2 2 2 0 1 1 1 2 11 78077.5.Average 1 1 1 0 1 0.5 1 5.5 2 2 2 1 2 2 2 1 14 2 2 2 0 2 8 2 2 2 5 1 1 1 1.5 1162
DistrictsBankeBardiaDailekhJajarkotSurkhetAchhamBajhangBajuraDotiKailali5.Budget Release <strong>and</strong> Programme Execution 6.Communication And Transperancy 7.Monitoring <strong>and</strong> Evalution8.Organizations, Service Delivery <strong>and</strong> PropertyMangementResult of Indicators Result of Indicators Result of Indicators Result of IndicatorsTotal Indicators : 7, Full Marks : 12, Pass Marks :4Total Indicators : 9 Active : 8, FullMarks : 14, Pass Marks : 6Total Indicators : 7, Active : 5,Full Marks : 10, Pass Marks : 3Total Indicators : 8, Active : 7, Full Marks : 12,Pass Marks : 4Ove8 8rallIndicatorNo.→ 5.15.2 5.3 5.4 5.5 5.65.7Total 6.1 6.26.36.4 6.56.66.7 6.8Total 7.1 7.27.3 7.47.5Total8.1 8.2 8.3.4 8.5.6 8.7 8.9TotalTotal2007/8 1 1 2 0 1 0 0 5 1 0 0 0 2 0 1 1 5 0 2 0 0 1 3 2 2 2 0 1 1 0 1 9 502008/9 1 1 1 0 1 0 1 5 1 1 0 1 2 1 2 0 8 2 2 2 0 2 8 2 2 2 1 0 1 1 0 9 660580.0. 0. 1.1..Average 1 1 1.5 0 1 0 5 5 1 0.5 0 5 2 5 5 0.5 6.5 1 2 1 0 5 5.5 2 2 2 5 0.5 1 0.5 0.5 92007/8 1 1 0 0 1 0 1 4 0 1 2 0 2 1 2 0 8 1 2 1 0 2 6 1 1 0 0 1 1 1 0 5 492008/9 1 2 0 0 1 0 1 5 2 1 0 1 1 0 0 1 6 1 2 0 2 2 7 0 1 0 0 0 1 1 0 3 491.0. 0.0.0.49Average 1 5 0 0 1 0 1 4.5 1 1 1 5 1.5 5 1 0.5 7 1 2 5 1 2 6.5 5 1 0 0 0.5 1 1 0 42007/8 2 0 0 0 1 0 1 4 1 1 0 0 2 1 0 0 5 0 2 0 0 1 3 1 2 1 1 1 1 1 0 8 422008/9 2 2 2 0 1 0 1 8 1 1 1 1 2 2 1 0 9 0 2 2 0 1 5 2 2 1 0 1 1 1 1 9 620520. 0. 1. 0.1..Average 2 1 1 0 1 0 1 6 1 1 5 5 2 5 5 0 7 0 2 1 0 1 4 5 2 1 5 1 1 1 0.5 8.52007/8 1 1 1 0 0 0 1 4 1 1 2 1 2 0 1 0 8 2 2 2 0 2 8 2 2 2 1 1 1 0 1 10 692008/9 2 2 0 0 1 1 1 7 1 2 0 1 2 0 2 0 8 0 2 2 0 2 6 2 2 2 0 1 1 1 2 11 62065.51.1..Average 1.5 5 0.5 0 0.5 0.5 1 5.5 1 1.5 1 1 2 0 5 0 8 1 2 2 0 2 7 2 2 2 5 1 1 0.5 1.5 112007/8 1 0 1 0 0 2 1 5 1 1 1 1 2 0 0 0 6 1 2 2 0 1 6 2 2 1 1 1 1 1 1 10 542008/9 1 2 1 0 1 0 1 6 1 1 1 1 2 1 1 0 8 0 2 1 0 0 3 2 2 2 1 1 1 0 1 10 610. 0.1. 0.57.5Average 1 1 1 0 0.5 1 1 5.5 1 1 1 1 2 5 5 0 7 0.5 2 5 0 5 4.5 2 2 1.5 1 1 1 0.5 1 102007/8 2 2 0 0 1 0 1 6 1 1 2 1 2 1 0 1 9 2 1 2 0 2 7 1 1 1 1 1 1 1 2 9 592008/9 1 1 2 2 1 0 0 7 1 2 0 0 2 0 0 0 5 2 2 0 0 1 5 1 1 1 0 1 1 1 0 6 50054.51.0.0. 0.1..Average 1.5 5 1 1 1 0 5 6.5 1 1.5 1 5 2 5 0 0.5 7 2 1.5 1 0 5 6 1 1 1 5 1 1 1 1 7.52007/8 1 1 1 2 1 0 1 7 2 2 2 1 2 1 1 1 12 1 2 1 0 2 6 2 2 2 1 1 1 1 0 10 712008/9 1 1 1 2 1 2 1 9 1 1 2 1 2 2 1 0 10 2 2 2 1 1 8 2 2 2 1 1 1 1 1 11 711.1. 1.71Average 1 1 1 2 1 1 1 8 1.5 1.5 2 1 2 5 1 0.5 11 1.5 2 5 0.5 5 7 2 2 2 1 1 1 1 0.5 112007/8 2 2 0 0 1 2 1 8 2 1 2 0 2 0 0 1 8 1 2 2 0 1 6 1 2 2 1 1 1 1 2 11 632008/9 0 0 2 2 1 0 1 6 1 2 2 1 2 2 1 1 12 0 2 2 0 2 6 1 2 2 1 0 1 1 2 10 670.0.1.65Average 1 1 1 1 1 1 1 7 1.5 1.5 2 5 2 1 5 1 10 0.5 2 2 0 5 6 1 2 2 1 0.5 1 1 2 112007/8 0 0 1 0 1 1 1 4 1 1 1 0 2 0 0 1 6 2 2 2 0 1 7 1 2 2 1 1 1 1 0 9 592008/9 1 1 1 2 1 2 1 9 2 2 2 0 2 0 1 1 10 2 2 0 0 2 6 2 2 1 0 1 1 1 0 8 66062.50.1.0.1. 1..Average 0.5 5 1 1 1 1.5 1 6.5 1.5 1.5 5 0 2 0 5 1 8 2 2 1 0 5 6.5 5 2 1.5 5 1 1 1 0 8.52007/8 1 2 0 0 1 0 0 4 1 1 1 1 2 1 1 1 9 2 1 1 1 1 6 2 2 1 1 1 0 1 2 10 592008/9 2 1 0 2 1 1 0 7 1 1 1 0 2 0 1 0 6 1 2 0 0 1 4 2 2 2 1 1 1 1 1 11 62Average 1.5 1. 0 1 1 0.5 0 5.5 1 1 1 0. 2 0. 1 0.5 7.5 1.5 1.5 0. 0.5 1 5 2 2 1.5 1 1 0 1 1.5 11 60.563
DistrictsBaitadiDadeldhuraDarchulaKanchanpur5.Budget Release <strong>and</strong> Programme Execution 6.Communication And Transperancy 7.Monitoring <strong>and</strong> Evalution8.Organizations, Service Delivery <strong>and</strong> PropertyMangementResult of Indicators Result of Indicators Result of Indicators Result of IndicatorsTotal Indicators : 7, Full Marks : 12, Pass Marks : Total Indicators : 9 Active : 8, Full Total Indicators : 7, Active : 5, Total Indicators : 8, Active : 7, Full Marks : 12,4Marks : 14, Pass Marks : 6Full Marks : 10, Pass Marks : 3Pass Marks : 4Ove8 8rallIndicatorNo.→ 5.15.2 5.3 5.4 5.5 5.65.7Total 6.1 6.26.36.4 6.56.66.7 6.8Total 7.1 7.27.3 7.47.5Total8.1 8.2 8.3.4 8.5.6 8.7 8.9TotalTotal5 5 5 5 .52007/8 2 2 0 0 1 0 0 5 2 2 2 1 2 1 1 1 12 1 1 0 0 2 4 2 0 1 1 1 1 1 0 7 542008/9 1 1 0 2 1 2 1 8 1 2 1 1 2 1 1 0 9 1 2 1 1 1 6 2 2 2 1 1 1 1 0 10 661.0.1.0. 1.60Average 1.5 5 0 1 1 1 5 6.5 1.5 2 5 1 2 1 1 0.5 11 1 1.5 5 0.5 5 5 2 1 1.5 1 1 1 1 0 8.52007/8 2 1 2 0 0 0 0 5 1 1 1 1 2 1 0 1 8 1 1 1 1 1 5 2 1 1 0 1 0 1 0 6 522008/9 1 2 0 0 0 2 0 5 0 1 1 1 2 0 2 1 8 2 2 0 0 2 6 2 2 1 0 1 1 1 0 8 59055.51.0.0. 1..Average 1.5 5 1 0 0 1 0 5 0.5 1 1 1 2 5 1 1 8 1.5 1.5 5 0.5 5 5.5 2 1.5 1 0 1 5 1 0 72007/8 2 2 2 0 0 2 1 9 1 2 2 0 2 1 1 1 10 0 1 2 0 2 5 1 2 2 1 1 1 0 0 8 612008/9 1 1 2 2 0 2 1 9 2 1 2 1 2 1 2 0 11 1 2 2 1 1 7 2 2 2 1 1 1 1 1 11 771.0.1.1. 1.69Average 1.5 5 2 1 0 2 1 9 1.5 1.5 2 5 2 1 5 0.5 11 0.5 1.5 2 0.5 5 6 5 2 2 1 1 1 0.5 0.5 9.52007/8 2 1 1 0 1 0 0 5 2 1 1 1 2 1 1 1 10 2 1 2 1 0 6 2 1 2 1 1 0 1 1 9 582008/9 1 1 0 0 1 1 0 4 2 1 1 0 2 2 0 0 8 1 2 1 0 2 6 2 2 2 1 1 1 1 0 10 5858Average 1.5 1 0.5 0 1 0.5 0 4.5 2 1 10.5 21.50.5 0.5 9 1.5 1.51.5 0.5 1 6 2 1.5 2 1 10.5 1 0.5 9.564
Annex 6. Analysis of PMs Result of all MunicipalitiesWorking Areas 1. Local Self‐Governance 2. Financial Management3. Planning <strong>and</strong> Program 4. Organization <strong>and</strong> Human 5. Urban Basic ServiceManagementResource DevelopmentManagementIndicator No. 1 2 3 4 5 6 7 8 9 10 11 12 13 14 15 16 17 18 19 20 21 22 23 24 25 26 27 28 29 30 31 32 33 34 35 3 3 3 36 7 8 9Score →Municipalities↓4 2 2 2 4 2 2 2 2 4 4 2 4 2 2 2 2 2 2 2 2 2 4 2 4 2 2 4 2 2 2 2 2 4 2 2 2 2 4 2 100Ilam 0 0 0 0 4 2 2 2 1 2 0 2 2 2 0 0 0 0 0 2 1 0 2 1 0 0 0 0 0 2 2 2 1 2 2 2 2 1 2 2 45Mechinagar 0 0 0 2 0 0 2 2 0 4 0 2 4 2 2 2 0 2 0 2 0 0 2 2 2 0 0 2 2 2 0 2 2 4 2 2 2 1 2 2 57Bhadrapur 0 0 0 2 2 2 2 1 0 2 0 2 4 2 0 0 0 2 2 2 0 0 2 1 0 1 0 4 2 2 2 0 2 4 1 2 2 0 2 2 54Damak 0 0 2 2 2 2 2 2 0 4 0 2 4 2 0 2 0 2 0 2 1 0 0 2 0 1 0 2 2 2 2 2 2 4 1 2 2 1 4 2 62Itahari 0 0 2 2 0 0 2 1 1 2 0 2 2 2 2 0 0 2 0 2 0 0 0 2 0 0 0 2 2 2 2 2 2 4 1 2 1 2 2 2 50Dharan 0 0 0 2 4 0 2 1 1 2 0 2 4 2 2 0 0 2 0 2 2 0 0 1 2 0 0 2 2 2 2 2 2 4 1 2 1 2 4 2 59Dhankuta 0 1 2 2 4 1 2 1 0 4 0 0 2 2 2 0 0 2 0 2 0 0 0 1 2 0 0 2 2 2 2 2 2 4 1 2 1 2 4 2 58Khadbari 0 0 0 1 0 0 1 1 0 0 0 0 2 2 1 0 0 2 0 2 0 0 0 1 0 0 0 0 2 1 0 2 1 2 1 0 0 2 2 2 28Biratnagar 0 0 0 2 2 0 2 1 0 4 0 0 4 0 2 0 0 1 0 2 1 0 0 1 2 0 0 2 0 2 2 0 0 4 1 2 1 2 2 2 44Inaruwa 2 0 0 2 0 0 2 2 1 0 0 0 2 2 2 0 0 0 1 2 0 0 0 1 2 0 0 0 2 0 2 0 0 2 1 0 1 2 2 2 35Rajbiraj 0 0 0 2 0 0 1 2 0 0 0 0 2 0 0 0 0 1 0 2 1 0 0 1 2 0 0 0 0 0 0 2 0 2 0 2 0 2 2 2 26Triyuga 2 0 0 2 4 0 2 1 1 0 0 0 2 2 0 0 0 2 2 2 0 0 0 1 0 2 0 2 2 2 2 2 1 4 1 0 1 0 0 2 44Siraha 4 0 0 2 0 0 2 2 0 0 2 1 2 0 0 2 0 2 0 0 2 0 2 2 2 1 0 2 2 1 2 2 0 2 1 0 1 1 0 2 44Lahan 2 0 0 2 2 0 2 2 0 0 0 2 2 1 1 0 0 0 0 2 2 2 0 2 2 1 0 4 2 1 2 2 2 2 1 2 1 1 2 2 51Janakpur 2 1 0 1 2 0 2 2 1 2 0 2 4 0 0 0 0 2 0 0 2 2 2 2 2 1 0 2 2 1 2 2 1 2 1 2 1 1 2 2 53Jaleshwor 4 0 0 2 4 0 2 2 1 0 0 2 4 0 0 0 0 0 0 2 2 0 0 2 2 1 0 4 2 1 2 2 1 2 0 2 1 1 2 2 52Malangawa 2 0 0 2 4 0 2 2 1 0 0 1 2 2 0 0 0 2 0 0 0 0 0 1 0 0 0 0 1 0 2 2 0 2 1 2 1 1 2 2 37Gaur 0 0 0 2 4 0 2 2 1 0 0 2 2 0 0 0 0 2 0 2 0 0 0 1 0 1 0 0 2 0 2 2 1 2 1 2 1 0 2 2 38Kamalamai 2 0 0 2 4 0 2 2 1 0 2 0 2 2 0 0 0 2 1 2 0 0 0 2 0 0 0 0 1 1 2 2 0 2 1 2 1 1 2 2 43Birjung 2 0 0 1 2 0 2 2 2 0 2 2 2 0 0 0 0 1 0 0 0 1 2 2 0 1 0 2 2 0 2 2 0 2 2 2 1 2 2 2 45Kalaiya 2 0 0 2 2 0 2 2 0 2 2 2 2 2 0 0 0 2 1 2 0 1 2 2 2 1 0 2 2 2 2 2 2 2 0 1 1 2 2 2 55Ratnanagar 2 0 0 2 2 0 2 2 1 4 2 2 4 2 1 0 0 2 2 0 0 2 2 2 2 2 0 4 2 0 0 2 2 4 2 2 1 2 2 2 65Bharatpur 2 0 0 1 2 0 2 1 0 4 2 2 2 2 2 0 0 2 0 0 0 1 0 2 2 1 0 2 1 0 2 0 1 2 1 2 0 2 2 2 47Kathm<strong>and</strong>u 0 0 0 2 4 1 2 2 0 0 0 0 0 0 2 0 2 1 0 2 0 0 0 1 0 0 0 0 0 2 2 2 0 4 2 2 0 1 2 2 38Kirtipur 0 0 0 2 0 1 2 2 0 0 0 0 2 0 2 0 0 2 0 2 1 2 0 2 0 0 0 4 2 2 0 0 2 4 2 2 0 2 2 2 44Hetauda 0 0 0 2 4 1 2 2 1 0 0 0 2 0 2 0 1 2 0 2 0 1 0 2 4 0 0 4 2 2 2 2 2 4 2 2 2 2 4 2 60Lalitpur 0 0 0 2 4 0 2 1 0 2 0 1 1 0 2 0 1 1 0 0 0 2 0 2 0 1 0 0 0 2 2 2 2 4 2 2 0 2 2 2 44Bhaktapur 2 0 0 2 2 0 2 1 0 2 0 2 2 0 2 0 0 1 1 2 1 2 0 1 2 0 0 2 1 2 2 2 2 4 1 2 0 2 2 2 51Madhyapur‐ Thimi 0 0 0 2 2 0 2 0 0 2 0 0 2 0 0 0 0 1 1 2 0 2 0 2 0 1 0 2 1 2 2 2 1 4 1 0 0 2 2 2 40Bidur 2 0 0 2 4 0 2 2 0 2 0 2 2 1 0 0 0 2 1 0 0 2 0 2 0 0 0 4 2 2 2 2 2 2 0 0 2 2 2 2 50Dhulikhel 0 0 0 2 2 0 2 1 0 0 0 2 4 2 2 0 0 2 1 2 0 0 2 2 0 0 0 2 2 2 2 2 1 4 2 2 1 1 2 2 51Banepa 2 0 0 1 2 1 2 1 0 0 0 2 2 2 0 0 0 2 2 2 1 0 0 2 0 2 0 2 2 2 2 2 1 2 2 2 1 2 2 2 50Panauti 0 0 0 2 2 0 2 2 0 2 0 2 2 2 0 0 0 2 0 2 0 0 0 2 0 0 0 4 2 1 2 2 1 2 0 2 1 2 4 2 47Bhimeshwor 2 0 0 2 2 1 2 2 0 2 4 2 2 2 1 0 0 2 1 2 0 0 0 2 2 1 0 2 2 2 2 2 1 2 1 2 1 1 2 2 56Gorkha 2 0 1 0 2 0 2 1 1 2 0 0 2 1 2 0 0 2 1 2 0 0 0 2 0 0 0 0 2 2 2 2 2 4 0 2 1 0 0 2 42Byas 2 0 0 1 2 0 2 1 0 2 0 0 2 2 2 0 0 2 1 0 1 0 0 2 0 0 0 0 2 2 2 2 2 4 1 2 1 2 4 2 48Lekhnath 2 1 2 0 2 0 2 1 0 2 4 0 1 0 1 0 0 2 1 0 1 0 0 2 0 2 0 0 2 2 2 2 2 4 1 2 0 2 2 2 49Pokhara 2 0 1 0 4 0 2 1 0 4 0 0 4 0 2 0 0 2 2 0 0 0 0 2 0 0 0 0 2 0 2 2 2 4 2 2 0 2 2 2 48Baglung 2 0 0 2 4 0 2 2 1 2 0 2 4 0 2 0 0 2 0 2 0 0 4 2 0 2 0 2 2 0 2 2 2 2 1 2 1 2 4 2 596540TotalMarks
Working Areas 1. Local Self‐Governance 2. Financial Management3. Planning <strong>and</strong> Program 4. Organization <strong>and</strong> Human 5. Urban Basic ServiceManagementResource DevelopmentManagementIndicator No. 1 2 3 4 5 6 7 8 9 10 11 12 13 14 15 16 17 18 19 20 21 22 23 24 25 26 27 28 29 30 31 32 33 34 35 3 3 3 36 7 8 9Score →Municipalities↓4 2 2 2 4 2 2 2 2 4 4 2 4 2 2 2 2 2 2 2 2 2 4 2 4 2 2 4 2 2 2 2 2 4 2 2 2 2 4 2 100Putalibazar 2 0 0 2 4 0 2 2 1 2 2 2 4 2 0 0 0 2 1 2 0 0 2 1 0 1 0 0 2 1 2 2 1 2 1 2 1 1 4 2 55Waling 4 0 0 2 4 0 2 2 0 2 0 2 4 0 1 0 0 1 2 2 1 0 0 2 2 1 0 2 2 2 2 2 2 2 1 2 1 2 2 2 58Tansen 4 2 2 2 4 0 2 2 0 0 0 2 2 2 1 0 0 2 0 2 2 0 0 2 0 2 0 4 2 2 2 2 2 4 2 2 1 1 2 2 63Butwal 0 0 0 2 4 0 2 2 0 2 0 0 2 2 2 0 2 1 0 2 2 0 0 1 0 0 0 0 0 2 2 2 0 4 2 0 1 2 4 2 47Ramgram 2 0 2 2 2 0 2 2 0 2 0 0 2 2 2 0 0 2 1 2 0 0 0 0 0 1 0 0 1 2 2 2 0 2 1 0 0 2 2 1 41Siddharthanagar 2 0 0 2 2 0 2 1 0 0 0 1 2 0 2 0 0 1 1 2 1 0 0 1 0 0 0 0 0 1 0 2 0 4 1 2 0 1 4 2 37Kapilbastu 2 0 1 2 2 0 2 2 0 2 0 0 2 2 0 0 0 2 2 2 2 0 0 1 0 0 0 0 2 2 2 2 0 2 1 2 1 2 4 2 48Ghorahi 2 1 1 2 4 0 2 2 1 2 2 0 2 2 2 0 0 2 1 2 0 0 2 2 0 0 0 2 2 2 2 2 1 4 2 2 1 2 2 2 60Tulshipur 2 0 1 2 4 0 2 2 1 2 2 0 2 1 2 0 0 1 1 2 1 2 2 2 0 1 0 2 2 2 2 0 1 2 1 2 1 2 2 2 56Birendranagar 2 2 2 2 4 0 2 2 0 2 0 0 2 2 2 0 0 2 1 2 0 2 2 2 0 1 0 2 2 2 2 2 1 2 1 0 1 2 2 2 57Narayan 2 1 2 2 4 0 2 2 0 2 4 0 2 2 0 0 0 2 0 2 0 2 2 2 0 1 0 2 2 1 0 2 1 2 1 2 1 1 2 2 55Nepalgunj 0 0 0 2 0 0 2 1 0 0 0 0 2 2 0 0 0 1 0 2 2 0 0 1 2 1 0 2 2 1 2 2 2 2 1 2 1 2 4 2 43Gulariya 4 1 0 1 2 0 1 2 0 0 0 2 2 0 1 0 0 2 2 2 0 0 0 2 0 1 0 2 2 0 0 2 1 2 2 2 1 1 2 2 44Tikapur 4 1 1 2 4 1 1 2 0 0 0 1 2 0 2 0 0 1 0 2 1 0 2 2 2 2 0 2 2 2 2 2 2 4 1 2 1 2 2 2 59Dhangadhi 2 0 0 2 2 1 1 1 0 0 0 1 2 2 1 0 0 0 0 2 2 0 4 2 0 1 0 4 2 2 2 2 2 4 1 2 1 2 4 2 56Amargadhi 4 0 0 2 0 0 2 2 1 2 0 0 2 2 0 0 1 2 0 0 0 0 0 2 0 2 0 4 2 1 0 2 1 2 1 2 1 2 2 2 46Dipayal‐Silgadhi 4 0 0 2 2 0 2 2 1 0 0 2 2 0 1 0 1 2 0 0 0 0 0 2 0 2 0 2 1 1 2 2 1 2 0 2 1 1 4 2 46Dashrathch<strong>and</strong> 4 0 0 2 0 0 2 2 0 2 2 2 2 0 0 0 1 2 1 0 0 0 0 2 0 0 0 4 2 0 2 2 1 2 1 0 0 1 2 2 43Bhimdatta 4 0 0 2 4 0 2 2 1 0 0 2 2 2 2 0 1 2 0 2 0 0 2 2 0 1 0 4 2 2 2 2 2 2 1 2 1 2 4 2 61Functional areas <strong>and</strong> indicators of Performance MeasuresLocal Self‐Governance 15. Public Private Partnership Organization <strong>and</strong> Human Resource Development1. Participatory Town Planning Formulation 16. Abiding by the optimum limitation of Administrative 28. Organization <strong>and</strong> Capacity Development2. Gender Equality <strong>and</strong> Social Inclusion Expenses29. Employees‐Terms of Reference (TOR)3. Social Mobilization <strong>and</strong> Urban Poverty Reduction 17. Accrual/Corporate Accounting System 30. Bylaws, Working Procedure <strong>and</strong> Directives4. Regulatory Service Management 18. Status of Security/Deposit Accounts 31. Monthly Staff Meeting5. Management Information System <strong>and</strong> Transparency 19. Accounting Quality <strong>and</strong> Status of Advance Payment 32. Employees Welfare Fund6. Code of Conduct <strong>and</strong> Property Detail 20. Abiding by the Limitation of Financial Assistance Expenses 33. Service Contract Management7. Implementation of Social Security Programmes8. Abiding by policy <strong>and</strong> directives, <strong>and</strong> report9. Social Audit <strong>and</strong> Public Hearing Planning <strong>and</strong> Program Management Urban Basic Service Management21. Thematic Area Master plan 34. Sanitation <strong>and</strong> Solid Waste ManagementFinancial Management 22. Feasibility Study 35. Park, Greenery <strong>and</strong> Environment Management10. Feasibility Study on Revenue Potentiality <strong>and</strong> its Projection 23. Annual Work Plan/ Calendar 36. Vehicle Parking Management11. Actual Income/Expenditure <strong>and</strong> Budget Implementation 24. Final Clearance <strong>and</strong> Settlement 37. Slaughter House Management12. Assets/ Property Management 25. Provision of Repairs <strong>and</strong> Maintenance 38. Public Health Promotion13. Revenue Administration Management 26. Public Audit 39. Emergency Service/ Disaster Management14 Integrated Property Tax 27. Impact Evaluation 40. Vital Registration Management6640TotalMarks
Annex 7: Overall results of Minimum Conditions (MCs) of VDCsS.N.Name of DDCNo ofVDCMetMCsNotMetName of non MCs compliance VDCs1 Taplejung 50 45 5 Tellok, Chaksibote, Fawakhola, Tapethok, Fakumba2 Panchthar 41 41 03 Ilam 48 48 04 Jhapa 47 47 05 Sankhuwasabha 33 26 76 Terhathum 32 32 07 Bhojpur 63 28 358 Dhankuta 35 35 09 Morang 65 65 010 Sunsari 49 49 011 Solukhumbu 34 1 3312 Khotang 76 76 013 Okhaldhunga 56 27 29Chainpur, Mamiling, Chepuwa, Hatiya, Nundhaki, Mawadin,NumKhatamla, Domane, Mulpani, Helauchha, Yangpang, Pyauli,Charambi, Jarayotar, Yaku, Shyamsila, Amtek, Chyange,Sanodumma, Thulodumpa, Timma, Kot, Gauyane, Lekharka,Okhe, Dalgaun, Bhulke, Dhedlekhani, Uyun, Basithapu,Ranibas, Homtang, Sindrang, Patlepani, Hasanpur,Dummana, Pawala, Pancha, Walakha, Thindikha, DewantarTaksindu, Beni, Salleri, Khumjung, Namche, Charikharka,Juving, Payai, Baku, Kaku, Basa, Gudel, Bung, Sotang,Chheskam, Garma, Nele, Deusa, Mukli, Lokhim, Jubu,Kangel, Panchan, Tingla, Salyan, Nechabatase,Nechabetagha, Tapting, Kerung, Gorakhani, Goli,Chaulakharka, BhakanjeKuibhir, Pokhare, Diyale, Shreechaur, Prapcha, Harkpur,Biguwatar, Ragadeep, Jantarkhani, Patlu, Ragani,Khijich<strong>and</strong>eswari, Pokal, Bil<strong>and</strong>u, Fediguth, Kalikadevi, Flapu,Sisneri, Balkhu, Toksel, Thakle, Manebhanjyang, Madhavpur,Ubu, Baksa, Moli, Kettuke, Betini, Tarkerabari14 Udaypur 44 43 1 Hadiya15 Saptari 114 92 22Banaula, Boriya, Bhardaha, Bishariya, Bodebarsain,Chhinnamasta, Dadha, Gobargadha, Hanumannagar, ItahariBishnupur, Jamunimadhepura, Khadgapur, Madhawapur,Mahadewa, Mainakderi, Maleth, Manraja, Patairwa, Raypur,Simarasingiyaun, Terhauta, Tikuliya16 Siraha 106 103 3 Bariyarpatti, Belhi, Kalyanpur Kalabanjar17 Dolakha 51 45 6Jungu, Namdu, Chyama, D<strong>and</strong>akharka, Katakuti,Tamchetududh18 Ramechhap 55 27 28Gumdel, Bamti, Kubukasthali, Those, Betali, Priti,Gupteswar, Bhuji, Duragaun, Saipu, Deurali, Saghutar,Rampur, Okhani, Sunarpani, Kathjor, Bhaluwajor, Pakarbas,Bhirpani, Rakathum, Majhuwa, Makadum, Khaniyapani,Hildevi, Gunsi, Lakhanpur, Puranagaun, Pingkhuri19 Sindhuli 53 42 11Ratnawati, Solpathana, Sirthauli, Bhuwaneswari, Bitijor,Jalkanya, Hariharpurgadhi, Harshadi, Ladabhir, Dudhauli,Nipane67
S.N.Name of DDCNo ofVDCMetMCsNotMet20 Dhanusha 101 51 50Name of non MCs compliance VDCsKhajurichinha, Nanupatti, Chakkar, Bafai, HansapurKathputla, Suga Nikas, Mithileswar Nikas, Kajara Ramaul,Kurtha, Binhi, Begashivpur, Paudeswar, Prakhemuhuwa,Inarwa, Yagyabhumi, Umaprempur, Dubarkot Hathaletawa,Patnuka, Ekrahi, Thadhijhijha, Bhuchakrapur, Hariharpur,Tulasi, Pushpalpur, Laxmi Nikas, Dhanushdham, Baramjhiya,Raghunathpur, Dhanusha Govindapur, Satoshar, Makhnaha,Sapahi, Samdaiya Bhawadi, Gopalpur, SakhuwaMahendranagar, Lagma Gadha Gadhi, Auarahi, JhajhiKataiya, Kharihani, Chorakoyalpur, Hathipur Hadwada,Yadukoha, Balabakhar, Dhanauji, Dhabauli, Bahuharwa,Balha Saghara, Gothkoyalpur, Harine, Bisarbhaora21 Mahottari 10 76 0 76 Not assessed22 Sarlahi 11 99 60 30Narayankhola, Atrali, Ghurkauli, Mohanpur, Farhadwa,Chhartauna, Salempur, Babargunj, Bhadsar, Harkathwa,Bhawanipur, Gaurishankar, Batraul, Bramhapuri, Fulparasi,Godaita, Baraudhoran, Nokailwa, Khutauna, Basantapur,Motipur, Arnaha, Rajghat, Simara, Narayanpur, DhankaulapPa, Ramban, Sisautiya, Sudama, Dhankaulap pu.23 Rasuwa 18 17 1 Yarsa24 Dhading 50 50 025 Nuwakot 61 60 1 Thanapati26 Kathm<strong>and</strong>u 57 57 027 Bhaktapur 16 16 028 Lalitpur 41 38 3 Nallu, Chhampi, Luvu29 Kavre 87 86 1 Pokharichauri30 Sindhupalchok 79 73 6Sunkhani, Kunchok, Sipapokhare, Selang, Sindhukot,Duwachaur31 Makwanpur 43 43 032 Rautahat 96 95 1 Dumariya33 Bara 98 65 33Pipara Basatpur, Bisunpurwa, Tedhakatti, Pathara,Inarwamal, Paterwa, Bhagwanpur, Laxmipur Kotwali,Shreenagar Bairiya, Golagunj, Kachorwa, Kakadi, Prasauna,Umjan, Gadahal, Narahi, Bisanpur, Baghawan, PiparpatiJabdi, Da. Bhitkaiya, Amlekhgunj, Pipapra Simara, RampurTokani, Buniyad, Feta, Inarwasira, Khutbajabdi, Purainiya,Dahiyar, Kudwa, Sinhasani, Prasauni, Bhaluhi Bharbaliya34 Parsa 82 69 13Nirmalbasti, Mahadevpati, Bijabaniya, Janakitola,Ghaoddaudapipra, Sabaithawa, Kauwabankataiya,Mahuwan, Ramnagari, Amarpati, Bahurwabhatha,Bindabasini, Madhubanmathbal35 Chitwan 36 36 036 Gorkha 66 54 12Hansapur, T<strong>and</strong>rang, Baguwa, Panchkhuwa, Tanlichok,Ghyalchok, Dhawa, Thumi, Aruchnaute, Taklung, Ghaurung,Kerabari10 Not assessed of all VDCs11 Not assessed VDCs; Pidari, Hemapur,Jamunia, Mahinaphapur, Kaudena, Aurahi, Khoria, Haripurwa, <strong>and</strong> LaxmipurChukhachaina ( 9 )68
S.N.69Name of DDCNo ofVDCMetMCsNotMet37 Manang 13 13 038 Lamjung 61 61 039 Kaski 43 43 040 Tanahun 46 46 0Name of non MCs compliance VDCs41 Syangja 60 55 5 Wangsing, Aruchaur, Malyangkot, Nibuwakharka, Pidikhola42 Gulmi 79 79 043 Palpa 65 64 1 Archale44 Arghakhanchi 42 42 045 Nawalparasi 73 72 1 Ramnagar46 Rup<strong>and</strong>ehi 69 58 11Chho Ramnagar, SiKtahan, Patkhauli, Bogadi, Lumbini,Raypur, Farena, Asuraina, Silautiya, Majhgawa, Aama47 Kapilbastu 77 56 21Abhirao, Ajigra, Bahadurgunj, Balarampur, Baluhawa,Bedauli, Bhagawanpur, Bhaluwari, Bithuwa, Dhankauli,Harnampur, Hardaina, Hathihawa, Kajarhawa, Lawani,Patthardehiya, Sauraha, Sirsihawa, Somdih, Titirkhi,Bidyanagar48 Mustang 16 16 049 Myagdi 41 41 050 Baglung 59 53 651 Parbat 55 54 1 Bhorle52 Rukum 43 43 053 Rolpa 51 51 054 Pyuthan 49 48 1 Okharkot55 Salyan 47 47 056 Dang 39 38 1 Koilabas57 Dolpa 23 23 058 Mugu 24 24 0Malma, P<strong>and</strong>avkhani, Rajkut, Darling, Bhinggithe,Gwalichuar59 Jumla 30 28 2 Depalgaun, Bumramadichaur60 Kalikot 30 30 061 Humla 27 23 4 Muchu, lali, Saya, Gothi62 Jajarkot 30 29 1 Majkot63 Dailekh 55 55 064 Surkhet 50 50 065 Banke 46 41 5 Baijapur, Kalafanta, Kachanapur, Fattepur, Bankatawa66 Bardiya 31 26 5 Bagnaja, Patabhar, Gola, Pashupatinagar, Thakurdwara67 Bajura 27 15 12Kotila, Jaganath, Gatri, Sappata, Badhu, Rugin, BichchhiyaKolti, P<strong>and</strong>usain, Jayabageswari, Toli, Chhatara68 Achham 75 75 069 Bajhang 47 43 4 Chaudhari, Kafalseri, Parakatne, Gadaraya70 Doti 50 50 071 Kailali 42 42 0