like plasmon resonances of single gold nanowires in the mid infrared
like plasmon resonances of single gold nanowires in the mid infrared
like plasmon resonances of single gold nanowires in the mid infrared

You also want an ePaper? Increase the reach of your titles
YUMPU automatically turns print PDFs into web optimized ePapers that Google loves.
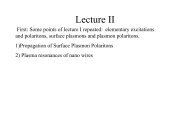
Antenna-<strong>like</strong> <strong>plasmon</strong> <strong>resonances</strong><strong>of</strong> <strong>s<strong>in</strong>gle</strong> <strong>gold</strong> <strong>nanowires</strong> <strong>in</strong> <strong>the</strong><strong>mid</strong>-<strong>in</strong>fraredSERS roundtable 2006Frank NeubrechKirchh<strong>of</strong>f-Institut für PhysikUniversität Heidelberg
Outl<strong>in</strong>e IntroductionExperimental setupNano-antennas Experimental results Outlook Summary
Outl<strong>in</strong>e IntroductionExperimental setupNano-antennas Experimental results Outlook Summary
Introduction:experimental setupSpectroscopic IR-microscopy at <strong>the</strong> synchrotron lightsource ANKA [ * ]IR-microscope (Bruker IRscope II):optical path <strong>of</strong> <strong>the</strong> synchrotron-beamcameraapertureMCT“Schwarz-schild”-objective(N.A. 0.52)[* ] ANKA : Angströmsource Karlsruhe,Forschungszentrum KarlsruheFTIR-spectrometerlight source (visible)samplepolarizer
Introduction:measurement pr<strong>in</strong>ciplesynchrotronlight sourceIR beam8µm spotsizeRelative transmittance measurementsMCT detector<strong>nanowires</strong>ubstratetransmittance T0.0200.0150.0100.0050.000wavelength [µm]10.00 5.00 3.33 2.50 2.00 1.67 1.43sample1000 2000 3000 4000 5000 6000 7000wavenumber [cm -1 ]spectrometer1.02wavelength [µm]10.00 5.00 3.33 2.50 2.00 1.67 1.430.020wavelength [µm]10.00 5.00 3.33 2.50 2.00 1.67 1.43relative transmittance ( T / T 0)1.000.980.960.941000 2000 3000 4000 5000 6000 7000wavenumber [cm -1 ]diameter D = 100nm,length L = 1.4µm,substrate: ZnStransmittance T 00.0150.0100.0050.000reference1000 2000 3000 4000 5000 6000 7000wavenumber [cm -1 ]
Introduction: nano-antennasλEasiest model: macroscopic ideal antenna L = j ⋅ e.g. ω λ / 2=From measurements [ * ] 2⋅nand light scatter<strong>in</strong>g simulations <strong>of</strong> <strong>gold</strong><strong>nanowires</strong> <strong>in</strong> <strong>the</strong> visible spectral range deviations are observedπcj ⋅L ⋅ nL ≈λ3Boundary element method (BEM) simulations [#]Deviations due to retardation, sk<strong>in</strong> effect, <strong>in</strong>fluence <strong>of</strong> substrate andsurround<strong>in</strong>g material⎛ D ⎞⎛ D ⎞ πc⎛ D ⎞ωres⎜L, neff, ⎟ = ωλ / 2( L,neff) ⋅ R⎜⎟ = ⋅ R⎜⎟⎝ L ⎠⎝ L ⎠ L ⋅ n ⎝ L ⎠eff[* ] G. Schider, J. R. Krenn et al., Phys. Rev. B 68, 155427 (2003); [#] J. Aizpurua, G.W Bryant et al., Phys. Rev. B 71, 235420 (2005)
Outl<strong>in</strong>e IntroductionExperimental setupNano-antennas Experimental results Outlook Summary
Experimental resultsMeasured relative transmittance spectra <strong>of</strong> <strong>s<strong>in</strong>gle</strong> <strong>nanowires</strong>with different lengths and diameters on different substrates [ * ]Picture <strong>of</strong> a nanowiretaken with <strong>the</strong> IRmicroscope<strong>in</strong> <strong>the</strong>visible mode10µm x 10µm[ * ] F. Neubrech, T. Kolb, R. Lovr<strong>in</strong>cic, G. Fahsold, J. Aizpurua, S. Karim, T. W. Cornelius,M. E. Toimil-Molares, R. Neumann and A.Pucci, Applied Physics Letters (submitted)
Experimental results:Resonance wavelength (Γ)Influence <strong>of</strong> <strong>the</strong> substrateEffective medium:resonance wavelength [µm]1412108642D = 200nm (exp.)D = 210nm (exp.)dipole (n = 1)dipole (n = n eff= 1.29)substrate:KBr1.0 1.5 2.0 2.5 3.0 3.5 4.0 4.5 5.0wire length [µm][ * ] Kreibig, U. und M. Vollmer: Optical properties <strong>of</strong> metal clusters. Spr<strong>in</strong>ger, 1995 Rough approximation [ * ] :substrateLeff( ε ε )1ε ≈ + 2subsurModified λ/2- relation=Γ2⋅neffε < ε < εair,effneffnanowire≈subεeff
Experimental results:Resonance wavelength (Γ) Resonance wavelength (Γ) vs. wire length (L) [ * ]resonance wavelength [µm]14 BEM calculations (D = 200nm, n = 1)BEM calculations (D = 200nm, n eff= 1.29)dipole (n = 1)12dipole (n = n eff= 1.29)D = 200nm (exp.)10D = 210nm (exp.)86421.0 1.5 2.0 2.5 3.0 3.5 4.0 4.5 5.0wire length [µm][ * ] F. Neubrech, T. Kolb, R. Lovr<strong>in</strong>cic, G. Fahsold, J. Aizpurua, S. Karim, T. W. Cornelius,M. E. Toimil-Molares, R. Neumann and A.Pucci, Applied Physics Letters (submitted)Light scatter<strong>in</strong>gsimulations (performedby J. Aizpurua) <strong>of</strong> <strong>gold</strong><strong>nanowires</strong> consider<strong>in</strong>g wire aspect ratio material propertiesn eff=1 (air)Scatter<strong>in</strong>g simulations<strong>in</strong> consider<strong>in</strong>g n eff are <strong>in</strong>good accordance withour measured data
Experimental results:surround<strong>in</strong>g medium Influence <strong>of</strong> <strong>the</strong> surround<strong>in</strong>g medium on ω resbefore evaporat<strong>in</strong>g paraff<strong>in</strong>after evaporat<strong>in</strong>g paraff<strong>in</strong>1sample referencesample referencenanowire2paraff<strong>in</strong><strong>nanowires</strong>ubstrate (ZnS)substrate (ZnS)surround<strong>in</strong>g medium: airsurround<strong>in</strong>g medium: paraff<strong>in</strong>
Experimental results:surround<strong>in</strong>g mediumShift <strong>of</strong> ω res due to <strong>the</strong> polarizability <strong>of</strong> paraff<strong>in</strong>relative transmittance1.000.960.9210 7 5 4 3 3 3diameter D = 100nm, length L = 1.4µm, substrate ZnSparω resω res2850 cm -12919 cm -1before evaporationafter evaporationEstimation <strong>of</strong> <strong>the</strong> ratiopar ⎛ D ⎞parπc/( Lneff) ⋅ R⎜⎟ωnresL=⎝ ⎠=ωresair ⎛ D ⎞ nπc/( Lneff) ⋅ R⎜⎟⎝ L ⎠us<strong>in</strong>gsystem 1systemεeff≈ ( εsub+ εsur), neff≈2aireffpareffεsystemeff1000 1500 2000 2500 3000 3500 4000wavenumber [cm -1 ]Exp. Value: 0.92 +/- 0.03ω⇒ωparresres=nnaireffpareff= 0.92ε ZnS4 .84, ε = 2.02=par
Experimental results:ext<strong>in</strong>ction cross sectionFrom relative transmittance to <strong>the</strong> ext<strong>in</strong>ction crosssection related to <strong>the</strong> geometric cross section1.0030relative transmittance0.950.900.85diameter D = 210 nmlength L = 2.37 µmparallel polarizationσ ext(ω) / σ geo(ω)25201510diameter 210 nm, length 2.37 µmmeasurement (p-polarized)0.801000 1500 2000 2500 3000 3500 4000 4500wavenumber [cm -1 ]5σσextgeo= A ⋅(1−T( ω))⋅01LD⋅(1 + n2sub)0500 1000 1500 2000 2500 3000 3500 4000 4500wavenumber [cm -1 ]spot sizeext<strong>in</strong>ctiongeometriccross sectionsubstrate effect
Experimental results:ext<strong>in</strong>ction cross sectionσ ext(ω) / σ geo25201510Enhancement <strong>of</strong> <strong>the</strong> ext<strong>in</strong>ction cross sectionwavelength [µm]20.0 10.0 6.67 5.00 4.00 3.33 2.86 2.50 2.2230diameter D = 210 nm,length L = 2.37 µm,p-polarized,substrate: KBrRatio σ ext / σ geo <strong>of</strong> a<strong>s<strong>in</strong>gle</strong> nanowire at <strong>the</strong>resonance maximum:/ ≈ 25σ extσ geo50500 1000 1500 2000 2500 3000 3500 4000 4500wavenumber [cm -1 ] Indication <strong>of</strong> localfieldenhancement <strong>in</strong><strong>the</strong> vic<strong>in</strong>ity <strong>of</strong> <strong>the</strong> wire
Experimental results:ext<strong>in</strong>ction cross sectionLight scatter<strong>in</strong>g simulationswavelength [µm]σ ext(ω) / σ geo20,0 10,0 6,67 5,00 4,00 3,33 2,86 2,50 2,223025201510Ekdiameter 210 nm, length 2.37 µmmeasurement (p-polarized)BEM calculation (n eff=1.29)Light scatter<strong>in</strong>gsimulations (boundaryelement method (BEM))performed by J.Aizpurua n eff = 1.2950500 1000 1500 2000 2500 3000 3500 4000 4500wavenumber [cm -1 ] Good accordance withlight scatter<strong>in</strong>gsimulations performedby J. Aizpurua
Outl<strong>in</strong>e IntroductionExperimental setupNano-antennas Experimental results Outlook Summary
Outlook: SEIRASurface enhanced <strong>in</strong>frared absorptionOccurs for adsorbates on rough films, island films,<strong>nanowires</strong>,…Enhancement due to electrical ‘field enhancement’(<strong>in</strong> <strong>the</strong> near field <strong>of</strong> metal nanostructures),…SEIRA-studies <strong>of</strong> arrays <strong>of</strong> <strong>gold</strong> <strong>nanowires</strong>SEIRA-studies <strong>of</strong> slits <strong>in</strong> <strong>gold</strong> <strong>nanowires</strong>Enhancement up to a factor <strong>of</strong> 200 000 isexpected [ * ][ * ] J. Aizpurua, G.W Bryant et al., Phys. Rev. B 71, 235420 (2005)
Outlookfirst SEIRA measurementsAdsorbate: octadecanthiol (ODT) with characteristic CHstretch<strong>in</strong>g vibration bands (2848 cm -1 and 2915 cm -1 [ * ] ) Adsorbent: <strong>s<strong>in</strong>gle</strong> <strong>gold</strong> nanowire deposited on CaF 2ODT(1 monolayer)<strong>nanowires</strong>ubstrate (CaF 2)samplereference[* ] D. Enders and A.Pucci, Applied Physics Letters, 88, 184104 (2006)
OutlookFirst SEIRA measurementsRelative transmittance spectra6.67 5.00 4.00 3.33 2.86 2.50 2.22 2.00relative transmittance1.000.980.960.940.922850 cm -12919 cm -10.4 %diameter D = 100nmlength L = 1.7µmsubstrate: CaF 2no polarizer used1500 2000 2500 3000 3500 4000 4500 5000--wavenumber [cm -1 ]
OutlookFirst SEIRA measurementsRelative transmittance spectra6.67 5.00 4.00 3.33 2.86 2.50 2.22 2.00relative transmittance1.000.980.960.940.922850 cm -12919 cm -10.4 %diameter D = 100nmlength L = 1.7µmsubstrate: CaF 2no polarizer used0.4 %2850 cm -12919 cm -11500 2000 2500 3000 3500 4000 4500 5000--wavenumber [cm -1 ]2800 2900 3000wavenumber [cm -1 ] Possible enhancement
Outl<strong>in</strong>e IntroductionExperimental setupNano-antennas Experimental results Outlook Summary
SummarySpectroscopic IR–microscopy at <strong>s<strong>in</strong>gle</strong> <strong>gold</strong><strong>nanowires</strong>: <strong>resonances</strong>ω res , Γ : <strong>in</strong>fluenced by shape, substrate andsurround<strong>in</strong>g mediumσ ext / σ geo : Enhanced far-field cross section,which <strong>in</strong>dicates an enhanced local field<strong>in</strong> <strong>the</strong> vic<strong>in</strong>ity <strong>of</strong> <strong>the</strong> nanowireSEIRA We performed primarily SEIRA studies <strong>of</strong> ODT (1monolayer) on <strong>s<strong>in</strong>gle</strong> <strong>gold</strong> <strong>nanowires</strong> In order to maximize <strong>the</strong> SEIRA, several SEIRAmeasurements with <strong>gold</strong> <strong>nanowires</strong> are planned
AcknowledgementKirchh<strong>of</strong>f-Institute for physicsOur Group, Kirchh<strong>of</strong>f-Institut für Physik, Universität Heidelberg, GermanyA. Pucci (group leader)G. Fahsold (former member)T. Kolb (former member)O. SkibbeR. Lovr<strong>in</strong>cicM. KlevenzF. MengM. B<strong>in</strong>derMaterials Research Department, GSI, Darmstadt, GermanyR. Neumann (group leader)E. Toimil-Molares (former member)S. KarimT. CorneliusDonostia International Physics Center, San Sebastian, Spa<strong>in</strong>J. AizpuruaEmployees at <strong>the</strong> ANKA IR-beaml<strong>in</strong>e, Forschungszentrum Karlsruhe,GermanyY.L. MathisM. Suepfle
END
Introduction: preparationThe <strong>gold</strong> nano-wires are prepared by electrochemicaldeposition <strong>in</strong> polymeric etched ion track membranes at<strong>the</strong> Material Research Department at <strong>the</strong> GSI [ * ]Preparation process:irradiation etch<strong>in</strong>g metallic layer electro-deposition dissolution[* ] GSI : Gesellschaft fürSchwerionenforschung, DarmstadtL ~ 1.7µmSEM image <strong>of</strong> a <strong>gold</strong>nano-wire (diameterD=100nm, lengthL=1.7µm substrate:silicon)
SEM imagesAu- <strong>nanowires</strong> (100nm) at SiHRTEM and SAED images50 nm 20 nmLiu, J., Karim. S et al. Syn<strong>the</strong>sis <strong>of</strong> <strong>gold</strong> <strong>nanowires</strong> <strong>in</strong>nanoporous ion track membranesL ~ 1.7µmInvestigated <strong>nanowires</strong>• 1-5µm long• diameter 80-200 nm• <strong>s<strong>in</strong>gle</strong>- and polycristall<strong>in</strong>e
EM- Scatter<strong>in</strong>g at small particlesconsider a small spherical particle with D
Quasistatic LimitωωPLDaspectratio q=L/D13nanoparticle(Mie resonance)1 L/D ∝Bohren, C. und D. Huffmann: Absorption an scatter<strong>in</strong>g <strong>of</strong>light by small particles. John Wiley and Sons, 1983.No longer quasistatic, we have to regard retardation
Introduction: nano-antennasλπEasiest model: macroscopic ideal antenna L = j ⋅ e.g. ω λ / 2= j ⋅2⋅nL ⋅From measurements and light scatter<strong>in</strong>g simulations <strong>of</strong> <strong>nanowires</strong> <strong>in</strong><strong>the</strong> visible spectral range deviations are observedcnL = λ2 ⋅nLkEMeasurements at <strong>gold</strong> nano-rods [ * ]Boundary element method (BEM) simulations [#]Deviations due to retardation, sk<strong>in</strong> effect, <strong>in</strong>fluence <strong>of</strong> substrate andsurround<strong>in</strong>g material⎛ D ⎞⎛ D ⎞ πc⎛ D ⎞ωres⎜L, neff, ⎟ = ωλ / 2( L,neff) ⋅ R⎜⎟ = ⋅ R⎜⎟⎝ L ⎠⎝ L ⎠ L ⋅ n ⎝ L ⎠eff[* ] G. Schider, J. R. Krenn et al., Phys. Rev. B 68, 155427 (2003); [#] J. Aizpurua, G.W Bryant et al., Phys. Rev. B 71, 235420 (2005)
Experimental results:ext<strong>in</strong>ction cross sectionσ ext(ω) / σ geoEnhancement <strong>of</strong> <strong>the</strong> ext<strong>in</strong>ction cross section20.0 10.0 6.67 5.00 4.00 3.33 2.86 2.50 2.2250403020100Ekdiameter 210 nm, length 2.37 µmmeasurement (p-polarized)MWS calculation (p. c. cyl<strong>in</strong>der)MWS calculation (lossy metal)BEM calculation (n = 1)BEM calculation (n eff=1.29)BEM calculation (L = 2.15 µm,neff= 1.29)500 1000 1500 2000 2500 3000 3500 4000 4500wavenumber [cm -1 ]F<strong>in</strong>ite difference timedoma<strong>in</strong> (FDTD)simulationslight scatter<strong>in</strong>gsimulations (boundaryelement method (BEM))performed by J. Aizpurua n eff = 1 (vacuum) n eff = 1.29 different lengths Good accordance with exact light scatter<strong>in</strong>g simulations performed by J. Aizpurua
Basics: Experimental determ<strong>in</strong>ation <strong>of</strong> opticalproperties - th<strong>in</strong> filmsrelative transmittance at normal <strong>in</strong>cidence:T film/substrateT substrateε film− ε ∞=≈1– 2⋅d⋅ω⋅Imε IIfilm(ω)c⋅(1+n substrate )iσ( ω)ωε 0For films much th<strong>in</strong>ner than <strong>the</strong> wavelength <strong>in</strong> <strong>the</strong> material d
Resonance width (ω Γ )width ω Γ[cm -1 ]700600500400300200100 nm (Au@ZnS)160 nm (Au@CaF)330 nm (Au@CaF)100 nm (Cu@KBr)200 nm (Cu@KBr)80 nm (Au@KBr)100 nm (Au@KBr)200 nm (Au@KBr)210 nm (Au@KBr)200 nm Sim (pc. cyl.)100 nm Sim (pc. cyl.)100600 800 1000 1200 1400 1600 1800 2000 2200 2400resonance frequency [cm -1 ]• <strong>in</strong> accordance with RCS- calculations (scatter<strong>in</strong>g at a perfect conduct<strong>in</strong>g wire)• no difference between Au and Cu wires materialproperties are not dom<strong>in</strong>ant
Polarisationeffectsexperimental setup:polarizernanowireMCTideal case: (not this wire)E Per1.00substratE Par1 µmrel. transmittance0.950.900.85parallel polarizedperpendicular polarizedreal case: (not this wire)5 µm0.801000 1500 2000 2500 3000wavenumber [cm -1 ]SEM images: Au- <strong>nanowires</strong> at Si done by S. Karim
What is SEIRA?Surface enhanced <strong>in</strong>frared absorption,enhancement up to a factor <strong>of</strong> 2000observed, much more is <strong>the</strong>oreticallypredictedAnalogous to SERS and <strong>in</strong> certa<strong>in</strong> casescomplementary (because <strong>of</strong> differentselection rules)
What is SEIRA?Occurs for adsorbates on metal nanostructures(rough nan<strong>of</strong>ilms, island films, grids,...)Enhancement due to“field enhancement” (<strong>in</strong> <strong>the</strong> nearfield <strong>of</strong> metalparticles, at “hot spots” <strong>of</strong> disordered metal-islandfilms, at <strong>plasmon</strong> <strong>resonances</strong> <strong>of</strong> periodic structures -see photonics,...)“chemical effect” (<strong>in</strong>crease <strong>in</strong> polarizability byadsorption)“first layer effect” (non-adiabatic <strong>in</strong>teraction betweenvibrations and electron-hole-pair excitations)
SEIRA EffectThe phenomenon surface enhanced IR absorption (SEIRA) concernsmolecules adsorbed on metal surfaces IR absorption,2µ 2 2∂A ~ E ∂ Qcos•Enhancement mechanism:-Electromagnetic field enhancement: Incident photon <strong>in</strong>teraction withmetal surface enhances local electric field E localat surfaceθ;Eµ =Q==ElectricDipoleNormalfieldmomentCoord<strong>in</strong>ateJ.P.Kottmann, O.J.F. Mart<strong>in</strong>,OPTICS EXPRESS 8 (2001) 655
SEIRA:enhancement factor0.4 %2850 cm -12919 cm -12800 2900 3000wavenumber [cm -1 ] Our case: ~500
Resonance enhancend IR-spectroscopy– <strong>the</strong> ideaIR- spectra <strong>of</strong> a <strong>s<strong>in</strong>gle</strong> <strong>gold</strong> nanowire:nearfield calculation:E(1666cm -1 )/E 0(1666cm -1 )relative transmittance1.000.950.900.85diameter 210 nmlength 2.37 µmL=3.0µm, D=50nm0.801000 1500 2000 2500 3000 3500 4000wavenumber [cm -1 ]absorptionbands <strong>of</strong> paraff<strong>in</strong> (measured at anka):x [µm]model:y [µm]yxthickness: unknown<strong>the</strong> absorptionbands <strong>of</strong>paraff<strong>in</strong> have to be <strong>in</strong> <strong>the</strong>range <strong>of</strong> <strong>the</strong> resonancefrequency <strong>of</strong> <strong>the</strong> nanowire
Resonance enhanced IR- spectroscopyexperimentalsetupexperimental setup:IR- spectra:NW,parpar,KBrKBrparaff<strong>in</strong><strong>nanowires</strong>ubstrate (KBr)procedure:1. rel. Transmisionmeasurement at position[nw, par] and [par,KBr]2. calcutate <strong>the</strong> ratio p =I(1470cm -1 ) / I(2930cm -1 )3. comparison between p[nw,par] and p [nw,KBr] we are not able to detect any enhancement
Resonance enhanced IR- spectroscopyel. Field enhancement is spacial limitedL=3µm, D=50nmE(1667cm -1 ) /E 0 (1667cm -1 )ratio <strong>of</strong> enhanced signal tobackground signal is small(~7%)L=2.7µmD=200nmA spot=54.4µm 2 only a small fraction <strong>of</strong> <strong>the</strong> evaporatedparaff<strong>in</strong> perceive <strong>the</strong> enhanced field only a small fraction <strong>of</strong><strong>the</strong> signal is enhancend we are not able to detect any enhancement with this experimental setup
At <strong>the</strong> sharp nanowire ends and particularly <strong>in</strong> a small gap betweensuch ends a huge nearfield-field enhancement is expected.CO adsorption on Cu films at 100KSEIRAIsland-film example:Ep vibG. Fahsold, M. S<strong>in</strong><strong>the</strong>r, A. Priebe, S. Diez, and A. Pucci, Phys.Rev B 70 (2004) 115406E local enhanced