Finding probabilities involving Z scores
Finding probabilities involving Z scores
Finding probabilities involving Z scores

You also want an ePaper? Increase the reach of your titles
YUMPU automatically turns print PDFs into web optimized ePapers that Google loves.
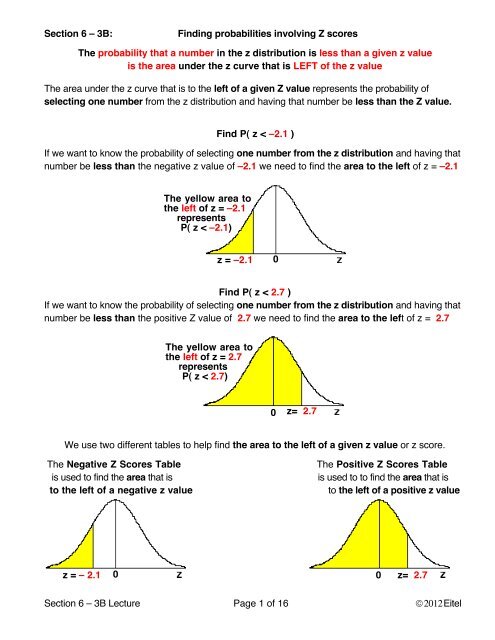
Section 6 – 3B:<strong>Finding</strong> <strong>probabilities</strong> <strong>involving</strong> Z <strong>scores</strong>The probability that a number in the z distribution is less than a given z valueis the area under the z curve that is LEFT of the z valueThe area under the z curve that is to the left of a given Z value represents the probability ofselecting one number from the z distribution and having that number be less than the Z value.Find P( z < –2.1 )If we want to know the probability of selecting one number from the z distribution and having thatnumber be less than the negative z value of –2.1 we need to find the area to the left of z = –2.1The yellow area tothe left of z = –2.1representsP( z < –2.1)z = –2.10Find P( z < 2.7 )If we want to know the probability of selecting one number from the z distribution and having thatnumber be less than the positive Z value of 2.7 we need to find the area to the left of z = 2.7The yellow area tothe left of z = 2.7representsP( z < 2.7)0z= 2.7We use two different tables to help find the area to the left of a given z value or z score.The Negative Z Scores Table The Positive Z Scores Tableis used to find the area that isis used to to find the area that isto the left of a negative z valueto the left of a positive z valuez = – 2.1 0 0 z= 2.7Section 6 – 3B Lecture Page 1 of 16 © 2012 Eitel
Example 1A<strong>Finding</strong> the area to the left of a negative Z scoreFind P( z < – 1.86 )The area under the z curve that is to the left of a given z value represents the probability ofselecting one number from the z distribution and having that number be less than the z value.If we want to find the probability of selecting one number from the z distribution and having thatnumber be less than the z value of – 1.86 we need to find the area to the LEFT of z = – 1.86The number at the intersection of the –1.8 row and the 0.06 column is 0.0314Negative Z ScoresStandard Normal (Z) Distribution: Cumulative Area to the LEFT of ZZ 0.00 0.01 0.02 0.03 0.04 0.05 0.06 0.07 0.08 0.09–1.8 0.0359 0.0351 0.0344 0.0336 0.0329 0.0322 0.0314 0.0307 0.0301 0.0294This means that the area to the left of z = – 1.86 is 0.0314the area to the left ofz = – 1.86 is .0314left tail area= .0314z = – 1.86 0negativevalueIf the area to the left of z = – 1.86 is .0314 thenP( z < – 1.86 ) = 0.0314Section 6 – 3B Lecture Page 3 of 16 © 2012 Eitel
Example 1B<strong>Finding</strong> the area to the Right of a negative Z scoreFind P( z > – 1.86 )The area under the z curve that is to the right of a given z value represents the probability ofselecting one number from the z distribution and having that number be more than the z value.If we want to find the probability of selecting one number from the z distribution and having thatnumber be more than the z value of – 1.86 we need to find the area to the RIGHT of z = – 1.86The number at the intersection of the –1.8 row and the 0.06Negative Z Scorescolumn is 0.0314Standard Normal (Z) Distribution: Cumulative Area to the LEFT of ZZ 0.00 0.01 0.02 0.03 0.04 0.05 0.06 0.07 0.08 0.09–1.8 0.0359 0.0351 0.0344 0.0336 0.0329 0.0322 0.0314 0.0307 0.0301 0.0294This means that the area to the LEFT of z = – 1.86 is 0.0314The vertical line drawn at the value of z divides the area under the z curve into two areas. The yellowarea is to the left of the z value and the white area is to the right of the z value.the area to the left of z = – 1.86is .0314The total of the yellow and white areas is 1the area to the right of z = – 1.86is 1– .0314 = .9686left tail area= .0314right tail area= .9686z = – 1.86 0soIf the area to the Left of Z = – 1.86 is .0314then the area to the Right of Z = – 1.86 is 1 – .0314 = .9686P( z > – 1.86 ) = 1 –0.0314 = .9686Section 6 – 3B Lecture Page 4 of 16 © 2012 Eitel
Example 2AFind the area to the left of a negative Z scoreFind P( z < – 1.02 )The area under the z curve that is to the left of a given z value represents the probability ofselecting one number from the z distribution and having that number be less than the z value.If we want to find the probability of selecting one number from the z distribution and having thatnumber be less than the z value of – 1.02 we need to find the area to the LEFT of z = – 1.02The number at the intersection of the –1.0 row and the 0.02 column is 0.1539Negative Z ScoresStandard Normal (Z) Distribution: Cumulative Area to the LEFT of ZZ 0.00 0.01 0.02 0.03 0.04 0.05 0.06 0.07 0.08 0.09–1.0 0.1587 0.1562 0.1539 0.1515 0.1492 0.1469 0.1446 0.1423 0.1401 0.1379This means that the area to the left of z = –1.02 is 0.1539the area to the left ofz = – 1.02 is .1539left tail area= .1539z = – 1.02negativevalue0If the area to the left of z = – 1.86 is .1539 thenP( z < – 1.02 ) = 0.1539Section 6 – 3B Lecture Page 5 of 16 © 2012 Eitel
Example 2B<strong>Finding</strong> the area to the Right of a negative Z scoreFind P( z > – 1.02 )The area under the z curve that is to the right of a given z value represents the probability ofselecting one number from the z distribution and having that number be more than the z value.If we want to find the probability of selecting one number from the z distribution and having thatnumber be more than the z value of – 1.02 we need to find the area to the RIGHT of z = – 1.02the area to the left of z = – 1.02is .1539the area to the right of z = – 1.02is 1– .1539 = .8461left tail area= .1539right tail area= .8461z = – 1.02 0If the area to the Left of Z = – 1.02 is 0.1539then the area to the Right of Z = – 1.02 is 1 – .1539P( z > – 1.02 ) = 1 – 0.1539 = .8461Section 6 – 3B Lecture Page 6 of 16 © 2012 Eitel
Example 3Find the area to the left of a negative Z scoreA Special Case for z = – 2.575P( z < – 2.575 )If we want to find the probability of selecting one number from the z distribution and having thatnumber be less than the z value of – 2.575 we need to find the area to the left of z = – 2.575Two negative Z <strong>scores</strong> with 3 decimal places are used in this course. These two 3 decimal placevalues and the areas to the left of them are listed separately at the bottom of the table.Negative Z ScoresThe cells at the bottom of the negative z <strong>scores</strong> table show thatthe area to the left of Z = –2.575 is 0.0050Standard Normal (Z) Distribution: Cumulative Area to the LEFT of ZZ 0.00 0.01 0.02 0.03 0.04 0.05 0.06 0.07 0.08 0.09–2.5 0.0062 0.0060 0.0059 0.0057 0.0055 0.0054 0.0052 0.0051 0.0049 0.0048Z <strong>scores</strong> of –3.5 or less use .0001 AREA Z Score AREA Z Score0.0500 –1.645 0.0050 –2.575This means that the area to the LEFT of z = – 1.86 is 0.0050P( z < – 2.575 ) = 0.0050<strong>Finding</strong> the area to the Right of a negative Z scoreP( z > – 2.575 )If we want to find the probability of selecting one number from the z distribution and having thatnumber be greater than the z value of – 2.575 we need to find the area to the right of z = – 2.575If the area to the Left of Z = – 1.02 is 0.0050then the area to the Right of Z = – 2.575 is 1 – .0050 = .9950P( z > – 2.575 ) = 1 – 0.0050 = .9950Section 6 – 3B Lecture Page 7 of 16 © 2012 Eitel
Example 4Find the area to the left of a negative Z scoreA Special Case for z = – 1.645P( z < – 1.654 )If we want to find the probability of selecting one number from the z distribution and having thatnumber be less than the z value of – 1.654 we need to find the area to the left of z = – 1.654Negative Z ScoresThe cells at the bottom of the negative z <strong>scores</strong> table show thatthe area to the left of Z = –1.645 is 0.0500Standard Normal (Z) Distribution: Cumulative Area to the LEFT of ZZ 0.00 0.01 0.02 0.03 0.04 0.05 0.06 0.07 0.08 0.09–2.5 0.0062 0.0060 0.0059 0.0057 0.0055 0.0054 0.0052 0.0051 0.0049 0.0048Z <strong>scores</strong> of –3.5 or less use .0001 AREA Z Score AREA Z Score0.0500 –1.645 0.0050 –2.575This means that the area to the left of z = –1.645 is 0.0500P( z < – 1.654 ) = 0.0500<strong>Finding</strong> the area to the Right of a negative Z scoreP( z > – 1.654 )If we want to find the probability of selecting one number from the z distribution and having thatnumber be greater than the z value of – 1.654 we need to find the area to the right of z = – 1.654If the area to the Left of Z = – 1.645 is 0.0500then the area to the Right of Z = – 1.645 is 1 – .0500 = .9500P( z > – 1.654 ) 1 –0.0500 = .9500Section 6 – 3B Lecture Page 8 of 16 © 2012 Eitel
The Positive Z Scores TableThe Positive Z Scores Table is used to find the area that is to the left of a positive z value.z = 2.1The vertical line in the middle of the graph divides the total area of 1 in half. The area to the left of thisline is .5000. All the shaded areas to the left of a positive z value will be more than .5000The 2 decimal place z scoreis the positive 1 decimal place z value from the left column (in red)with an additional decimal place from the row on top (in red)The 4 decimal place number in yellow at theintersection of the left column z value (in red) and top row z value (in red)stands for the area to the LEFT of that given z scoreThe Z Table only gives areas to the left of a Z value.Positive Z ScoresStandard Normal (Z) Distribution: Area to the LEFT of ZZ 0.00 0.01 0.02 0.03 0.04 0.05 0.06 0.07 0.08 0.090.0 0.5000 0.5040 0.5080 0.5120 0.5160 0.5199 0.5239 0.5279 0.5319 0.53590.1 0.5398 0.5438 0.5478 0.5517 0.5557 0.5596 0.5636 0.5675 0.5714 0.57530.2 0.5793 0.5832 0.5871 0.5910 0.5948 0.5987 0.6026 0.6064 0.6103 0.61410.3 0.6179 0.6217 0.6255 0.6293 0.6331 0.6368 0.6406 0.6443 0.6480 0.65170.4 0.6554 0.6591 0.6628 0.6664 0.6700 0.6736 0.6772 0.6808 0.6844 0.68790.5 0.6915 0.6950 0.6985 0.7019 0.7054 0.7088 0.7123 0.7157 0.7190 0.72240.6 0.7257 0.7291 0.7324 0.7357 0.7389 0.7422 0.7454 0.7486 0.7517 0.75490.7 0.7580 0.7611 0.7642 0.7673 0.7704 0.7734 0.7764 0.7794 0.7823 0.78520.8 0.7881 0.7910 0.7939 0.7967 0.7995 0.8023 0.8051 0.8078 0.8106 0.81330.9 0.8159 0.8186 0.8212 0.8238 0.8264 0.8289 0.8315 0.8340 0.8365 0.83891.0 0.8413 0.8438 0.8461 0.8485 0.8508 0.8531 0.8554 0.8577 0.8599 0.86211.1 0.8643 0.8665 0.8686 0.8708 0.8729 0.8749 0.8770 0.8790 0.8810 0.88301.2 0.8849 0.8869 0.8888 0.8907 0.8925 0.8944 0.8962 0.8980 0.8997 0.9015This is only a portion of the entire Positive z Score tableSection 6 – 3B Lecture Page 9 of 16 © 2012 Eitel
Example 5<strong>Finding</strong> the area to the left of a positive Z scoreP( z < 1.41 )If we want to find the probability of selecting one number from the z distribution and having thatnumber be less than the z value of 1.41 we need to find the area to the LEFT of z = 1.41The number at the intersection of the 1.4 row and the 0.01Positive Z Scorescolumn is 0.9207Standard Normal (Z) Distribution: Cumulative Area to the LEFT of ZZ 0.00 0.01 0.02 0.03 0.04 0.05 0.06 0.07 0.08 0.091.4 0.9192 0.9207 0.9222 0.9236 0.9251 0.9265 0.9279 0.9292 0.9306 0.9319This means that the area to the left of z = 1.41 is 0.9207the area to the left ofz = 1.41 is .9207left tail area= .1539left tail area= .92070z =1.41positivevalueP( z < 1.41 ) = 0.9207<strong>Finding</strong> the area to the Right of a positive Z scoreP( z > 1.41 )If we want to find the probability of selecting one number from the z distribution and having thatnumber be more than the z value of 1.41 we need to find the area to the RIGHT of z = 1.41The total of the yellow and white areas is 1 so the right area (in white) = 1 – the left areaIf the area to the Left of Z = 1.41 is 0.9207then the area to the Right of Z = 1.41 is 1 – .9207 = .0793P( z > 1.41 ) = 1 –0.9207 = .0793Example 6Section 6 – 3B Lecture Page 10 of 16 © 2012 Eitel
<strong>Finding</strong> the area to the left of a positive Z scoreP( z < 2.33 )If we want to find the probability of selecting one number from the z distribution and having thatnumber be less than the z value of 2.33 we need to find the area to the LEFT of z = 2.33The number at the intersection of the 2.3 row and the 0.03 column is 0.9901Positive Z ScoresStandard Normal (Z) Distribution: Cumulative Area to the LEFT of ZZ 0.00 0.01 0.02 0.03 0.04 0.05 0.06 0.07 0.08 0.092.3 0.9893 0.9896 0.9898 0.9901 0.9904 0.9906 0.9909 0.9911 0.9913 0.9916This means that the area to the left of z = 2.33 is 0.9901the area to the left ofz = 2.33 is .9901left tail area= .1539left tail area= .99010z = 2.33positivevalueP( z < 2.33 )= 0.9901<strong>Finding</strong> the area to the Right of a positive Z scoreP( z > 2.33 )If we want to find the probability of selecting one number from the z distribution and having thatnumber be more than the z value of 2.33 we need to find the area to the RIGHT of z = 2.33If the area to the Left of Z = 2.33 is .9901then the area to the Right of Z = 2.33 is 1 – .9901= .0099P( z > 2.33 ) = 1 – 0.9901 = .0099Section 6 – 3B Lecture Page 11 of 16 © 2012 Eitel
Example 7<strong>Finding</strong> the area to the left of a positive Z scoreA Special Case for z = 1.645P( z < 1.645 )If we want to find the probability of selecting one number from the z distribution and having thatnumber be less than the z value of 1.645 we need to find the area to the LEFT of z = 1.645Positive Z ScoresThe cells at the bottom of the positive z <strong>scores</strong> table show thatthe area to the left of Z = 1.645 is 0.9500Standard Normal (Z) Distribution: Cumulative Area to the LEFT of ZZ 0.00 0.01 0.02 0.03 0.04 0.05 0.06 0.07 0.08 0.091.6 0.9452 0.9463 0.9474 0.9484 0.9495 0.9505 0.9515 0.9525 0.9535 0.9545Z <strong>scores</strong> of 3.5 or more use .9999 AREA Z Score AREA Z Score0.9500 1.645 0.9950 2.575This means that the area to the left of z = 1.645 is 0.9500left tail area = .9500right tail area= .05000z= 1.645P( z < 1.645 ) = .9500<strong>Finding</strong> the area to the Right of a positive Z scoreP( z > 1.645 )If the area to the Left of Z = 1.645 is .9500then the area to the Right of Z = 1.645 is 1 – .9500 = .0500P( z > 1.645 ) = 1 –0.9500 = .0500Section 6 – 3B Lecture Page 12 of 16 © 2012 Eitel
<strong>Finding</strong> the area in yellow between two Z <strong>scores</strong>P( z 1< Z < z 2)z 1z 2z 1subtract theblue area tothe left of z 1from theyellow area tothe left of z 2 z 2subtract theblue area tothe left of z 1from theyellow area toz z the left of z1 2 2 z 1z 2The area in yellow between Two Z <strong>scores</strong> z 1and z 2P( z 1< Z < z 2) =the Area to the left of z 2– the area to the left of z 1Section 6 – 3B Lecture Page 13 of 16 © 2012 Eitel
Example 8Find the area between z = –2.48 and z = 2.87P( –2.48 < z < 2.87 )If we want to find the probability of selecting one number from the z distribution and having thatnumber be BETWEEN the z value of –2.48 the z value of 2.87 we need to find the areaBETWEEN z = 2.87 and z = 2.87Positive Z Scoresz = –2.48z =2.87Standard Normal (Z) Distribution: Cumulative Area to the LEFT of ZZ 0.00 0.01 0.02 0.03 0.04 0.05 0.06 0.07 0.08 0.092.8 0.9974 0.9975 0.9976 0.9977 0.9977 0.9978 0.9979 0.9979 0.9980 0.9981Positive Z ScoresStandard Normal (Z) Distribution: Cumulative Area to the LEFT of ZZ 0.00 0.01 0.02 0.03 0.04 0.05 0.06 0.07 0.08 0.09–2.4 0.0082 0.0080 0.0078 0.0075 0.0073 0.0071 0.0069 0.0068 0.0066 0.0064If the area to the left of Z = 2.87 is 0.9979and the area to the left of Z = –2.48 is 0.0066then the area BETWEEN Z = 2.87 and Z = –2.48 is.9979 – .0066 = .9913P( –2.48 < z < 2.87 ) = .9913Section 6 – 3B Lecture Page 14 of 16 © 2012 Eitel
Example 9Find the area between Z = –1.75 and Z = 1.88P( –1.75 < z < 1.88 )If we want to find the probability of selecting one number from the z distribution and having thatnumber be BETWEEN the z value of –1.75 the z value of 1.88 we need to find the areaBETWEEN z = 1.75 and z = 1.88Positive Z Scoresz = –1.75z =1.88Standard Normal (Z) Distribution: Cumulative Area to the LEFT of ZZ 0.00 0.01 0.02 0.03 0.04 0.05 0.06 0.07 0.08 0.091.8 0.9641 0.9649 0.9656 0.9664 0.9671 0.9678 0.9686 0.9693 0.9699 0.9706Negative Z ScoresStandard Normal (Z) Distribution: Cumulative Area to the LEFT of ZZ 0.00 0.01 0.02 0.03 0.04 0.05 0.06 0.07 0.08 0.09–1.7 0.0446 0.0436 0.0427 0.0418 0.0409 0.0401 0.0392 0.0384 0.0375 0.0367If the area to the left of Z = 2.87 is 0.9699and the area to the left of Z = –2.48 is 0.0401then the area BETWEEN Z = –1.75 and Z = 1.88 is.9699 – .0401 = .9298P( –1.75 < z < 1.88 ) = .9298Section 6 – 3B Lecture Page 15 of 16 © 2012 Eitel
Example 10Find the area between Z = –2.51 and Z = 2.575P( –2.51 < z < 2.575If we want to find the probability of selecting one number from the z distribution and having thatnumber be BETWEEN the z value of –2.51 the z value of 2.575 we need to find the areaBETWEEN z = 2.51 and z = 2.575z = –2.51z = 2.575Positive Z Scoresthe area to the left of Z = 2.575 is .9950Standard Normal (Z) Distribution: Cumulative Area to the LEFT of ZZ <strong>scores</strong> of 3.5 or more use .9999 AREA Z Score AREA Z Score0.9500 1.645 0.9950 2.575Negative Z Scoresthe area to the left of Z = –2.51 is .0060Standard Normal (Z) Distribution: Cumulative Area to the LEFT of ZZ 0.00 0.01 0.02 0.03 0.04 0.05 0.06 0.07 0.08 0.09–2.5 0.0062 0.0060 0.0059 0.0057 0.0055 0.0054 0.0052 0.0051 0.0049 0.0048If the area to the left of Z = 2.575 is 0.9950and the area to the left of Z = –2.51 is 0.0060then the area BETWEEN Z = 2.575 and Z = –2.51 is.9950 – .0060= .9890P( –2.51 < z < 2.575 ) = .9890Section 6 – 3B Lecture Page 16 of 16 © 2012 Eitel