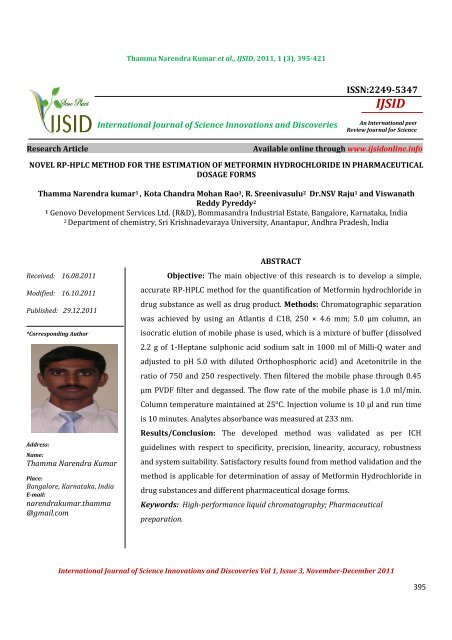
NOVEL RP-HPLC METHOD FOR THE ... - Ijsidonline.info
NOVEL RP-HPLC METHOD FOR THE ... - Ijsidonline.info
NOVEL RP-HPLC METHOD FOR THE ... - Ijsidonline.info
You also want an ePaper? Increase the reach of your titles
YUMPU automatically turns print PDFs into web optimized ePapers that Google loves.
Thamma Narendra Kumar et al., IJSID, 2011, 1 (3), 395-421MATERIALS AND <strong>METHOD</strong>SChemicals and reagentsTablets and Standards components were supplied by Medreich India limited. All solvents were <strong>HPLC</strong> gradeand High purity water was prepared by using Millipore Milli-Q plus water purification system (Millipore, Milford,MA, USA).Equipment:The Shimadzu and agilent make <strong>HPLC</strong> systems were used for this study and these instruments consists of apump, auto sampler and a PDA detector. The output signal was monitored and processed by using WatersEmpower software.Chromatographic conditionsThe method was developed using an Atlantis dC18, 250 × 4.6 mm; 5.0 µm column. An isocratic elution ofmobile phase is used, which is a mixture of buffer (dissolved 2.2 g of 1-Heptane sulphonic acid sodium salt in 1000ml of Milli-Q water and adjusted to pH 5.0 with diluted Orthophosphoric acid) and Acetonitrile in the ratio of 750and 250 respectively. Then filtered the mobile phase through 0.45 µm PVDF filter and degassed. The flow rate ofthe mobile phase was 1.0 ml/min. The column temperature was maintained at 25 o C and the wavelength wasmonitored at 233 nm. The injection volume was 10 µl. The run time is fixed to 10 minutes.Preparation of standard solutionsA stock solution was prepared by transferring accurately weighed about 85 mg of MetforminHydrochloride working standard into a 100 ml volumetric flask, added 40 ml of Methanol, sonicated for 5 min todissolve, then made up to the volume with purified water and mixed well. Transferred 5 ml of above standardstock solution into a 50 ml volumetric flask and made up to the volume with purified water.Preparation of sample solutionsTwenty tablets were weighed, and then crushed in to a fine powder using a mortar and pestle. Weighedabout 1650 mg of tablet powder (equivalent to 850 mg of Metformin Hydrochloride) then transferred in to a 500ml volumetric flask, 200 ml of Methanol was added, sonicated for 20 min, then added 150 ml of purified water,sonicated for 15 minutes with intermittent shaking by maintaining bath temperature 20°C to 28°C, cooled it, thenmade up to the volume with purified water and mixed well. This solution was centrifuged at 3000 rpm for 10 minand collected the supernatant clear solution. Transferred 5 ml of supernatant solution into a 100 ml volumetricflask and made up to the volume with purified water.Calculation of % analyte:Calculation for % Metformin Hydrochloride:TR W 5 500 100 P-----------x-----------x-----------x-----------x-----------x-----------x ASR 100 50 TW 5 LInternational Journal of Science Innovations and Discoveries Vol 1, Issue 3, November-December 2011397
Thamma Narendra Kumar et al., IJSID, 2011, 1 (3), 395-421Where, TR = Metformin peak response from test preparation; SR = Metformin peak average response fromstandard preparation; W = Metformin Hydrochloride working standard weight in mg, for standard preparation; P =Metformin Hydrochloride working standard purity in %, on as such basis; L = Label claim of MetforminHydrochloride; A = Average weight of test sample and TW = Test weight taken in mg.RESULTS AND DISCUSSIONMethod development and optimizationIn pharmacopeial method for Metformin Hydrochloride assay by potentiometric titration method wasavailable. The main objective of this method development is to provide a suitable stability indicating assay methodfor quantification of Metformin Hydrochloride from different dosage forms. Method development trials wereperformed with different buffer salts, organic modifiers and columns. Finally the separation was achieved with Ionpairing buffer and acetonitrile with simple isocratic program (reported in materials and methods).Trial-1:The trial was performed using Waters Spherisorb SCX-10µ, 250 × 4.6 mm; 5.0 µm column. An isocraticelution of mobile phase is used, which is prepared by dissolving 17.0 g of Ammonium dihydrogen phosphate in 900ml of Acetonitrile and water mixture in the ratio 10:90, made up to 1000 ml with the same mixture and adjusted topH 3.0 with diluted Orthophosphoric acid. Then filtered the mobile phase through 0.45 µm PVDF filter anddegassed. The flow rate of the mobile phase was 2.0 ml/min. The column temperature was maintained at 25 o C andthe wavelength was monitored at 233 nm. The injection volume was 20 µl. The run time is fixed to 10 minutes.Diluent fixed as mixture of water and methanol in the ratio of 60:40.Observation:Blank interference was observed at the retention time of Metformin. Metformin peak and its impuritypeaks (Cyanoguanidine and Melamine) are not eluted at same retention time and concluded that can not beseparated by change in pH of the mobile phase.Trial-2:The second trial was performed using an Atlantis dC18, 250 × 4.6 mm; 5.0 µm column. The flow rate of themobile phase was 1.0 ml/min. The column temperature was maintained at 25 o C and the wavelength wasmonitored at 233 nm. The injection volume was 10 µl. The run time is fixed to 10 minutes. Diluent fixed as mixtureof water and methanol in the ratio of 60:40.An isocratic elution of mobile phase is used, which is a mixture of buffer (dissolved 2.2 g of 1-Heptanesulphonic acid sodium salt in 1000 ml of Milli-Q water and adjusted to pH 5.0 with diluted Orthophosphoric acid)and Acetonitrile.Trial-2(a):Taken mixture of buffer and acetonitrile in the ratio of 825 and 175 respectively. Then filtered the mobilephase through 0.45 µm PVDF filter and degassed.International Journal of Science Innovations and Discoveries Vol 1, Issue 3, November-December 2011398
Thamma Narendra Kumar et al., IJSID, 2011, 1 (3), 395-421Trial-2(b):Taken mixture of buffer and acetonitrile in the ratio of 800 and 200 respectively. Then filtered the mobilephase through 0.45 µm PVDF filter and degassed.Trial-2(c):Taken mixture of buffer and acetonitrile in the ratio of 750 and 250 respectively. Then filtered the mobilephase through 0.45 µm PVDF filter and degassed.Observation:From Trial-2(a) Metformin peak retention time was found more. With slight modification of composition inTrial-2(b) Metformin peak retention time was found lesser than previous trial. But in Trial-2(c) Metformin peakretention time was found less. Found no interference in blank and placebo chromatograms. All impurities werewell separated from active peak where as the peak shape, resolution and tailing factor were also within the limit.Different brand of <strong>HPLC</strong> columns were tried for getting the symmetrical peak of Metformin. In these trailsfound that Atlantis dC18, 250 × 4.6 mm; 5.0 µm column is the best suitable for the peak shape as well as forresponse of the Metformin. By this column obtained superior peak shape and separation because of the uniqueproperty of fully porous silica support with bonded phase of C12 with TMS end capping. This column is the bestsuite for the separation of basic compounds. Diluent was optimized based on the physical properties of the activesto get the better stability in the solution form with superior extraction of the actives from excipients in to thesolution form.Figure-2: Blank ChromatogramInternational Journal of Science Innovations and Discoveries Vol 1, Issue 3, November-December 2011399
Thamma Narendra Kumar et al., IJSID, 2011, 1 (3), 395-421Figure-3: Standard ChromatogramFigure-4: Melamine spiked Metformin Hydrochloride solution ChromatogramFigure-5: Cyanoguanidine ChromatogramInternational Journal of Science Innovations and Discoveries Vol 1, Issue 3, November-December 2011400
Thamma Narendra Kumar et al., IJSID, 2011, 1 (3), 395-421Figure-6: Blank ChromatogramFigure-7: Standard ChromatogramFigure-8: Standard ChromatogramInternational Journal of Science Innovations and Discoveries Vol 1, Issue 3, November-December 2011401
Thamma Narendra Kumar et al., IJSID, 2011, 1 (3), 395-421Figure-9: Standard solution ChromatogramFigure-10: Test solution ChromatogramFigure-11: Placebo solution ChromatogramInternational Journal of Science Innovations and Discoveries Vol 1, Issue 3, November-December 2011402
Thamma Narendra Kumar et al., IJSID, 2011, 1 (3), 395-421Figure-12: Cyanoguanidine impurity solution ChromatogramSystem suitabilityFigure-13: Melamine impurity solution ChromatogramSystem suitability parameters were established by injecting the freshly prepared standard solution (sixreplicate injections) in to the chromatographic system. Calculated the percentage relative standard deviation forpeak area and results found to be satisfactory. System suitability chromatograms represented in figure-2, 3 andtabulated the results in table-1.Table–1: System Suitability ResultsStandard inj N°Metformin Peak area1 39757302 39832213 39823684 39839415 39865266 3968755Mean 3980090%RSD 0.2Theoretical Plate count 4518Tailing Factor 1.2International Journal of Science Innovations and Discoveries Vol 1, Issue 3, November-December 2011403
Validation of the MethodThamma Narendra Kumar et al., IJSID, 2011, 1 (3), 395-421Specificity: Specificity is the ability of the method to measure the analyte response in the presence of itsdegradants. The specificity of the developed method was carried in the presence of its degradants. Stress studieswere performed on dosage form to provide an indication of the stability-indicating property and specificity of theproposed method. Intentional degradation was attempted with stress condition of UV light (200 watts h/m 2 ), Sunlight (1.2 Million Lux Hours), Humidity (90% RH at 25°C about 7 days), Dry heat (105 o C), Acid (2N HCl), Base (2NNaOH) and Oxidation (5% H 2O 2) to evaluate the ability of the proposed method to separate Metformin from itsdegradation products. For heat, study period was 48 hrs whereas for hydrolytic, acid, base and oxidation studyperiod was about 1 hr. Peak purity test was carried out by using PDA detector in stress samples. In the stressedsamples % degradant products were calculated and reported in table-2.A study was conducted to demonstrate the effective separation of degradants from the active ingredient.Drug product and placebo were subjected to the following stress conditions to induce degradation.Table–2: Stress study conditions and resultsStress Study Stress Condition % DegradationAcid Hydrolysis 2N HCl solution for about 1 hr at 60°C 1.0Base Hydrolysis 2N NaOH solution for about 1 hr at 60°C 6.2Oxidation 5% H2O2 for 1 hr at 60°C 0.1Aqueous Hydrolysis Purified water for about 1 hr at 60°C 0.3Fluorescent Light Exposure Sun-light of 1.2 Million Lux Hours 0.3UV Light Exposure UV-light of 200 Watts h/m 2 1.1Thermal Dry heat at 105°C for 48 hrs 3.9Humidity 90% RH at 25°C for 7 days 4.6For active peak, peak purity was evaluated by using the Photodiode array detector and purity of peak in allstressed conditions was passed.Figure-14: Blank chromatogramInternational Journal of Science Innovations and Discoveries Vol 1, Issue 3, November-December 2011404
Thamma Narendra Kumar et al., IJSID, 2011, 1 (3), 395-421Figure-15: Standard chromatogramFigure-16: Placebo chromatogramFigure-17: Test sample chromatogramInternational Journal of Science Innovations and Discoveries Vol 1, Issue 3, November-December 2011405
Thamma Narendra Kumar et al., IJSID, 2011, 1 (3), 395-421Figure-18: Impurity-Cyanoguanidine chromatogramFigure-19: Impurity–Melamine chromatogramFigure-20: Impurity mixture chromatogramInternational Journal of Science Innovations and Discoveries Vol 1, Issue 3, November-December 2011406
Thamma Narendra Kumar et al., IJSID, 2011, 1 (3), 395-421Figure-21: Impurity spiked sample for peak purity evaluationFigure-22: Purity plot of MetforminFigure-23: Drug product chromatogram from Acid hydrolysis studyInternational Journal of Science Innovations and Discoveries Vol 1, Issue 3, November-December 2011407
Thamma Narendra Kumar et al., IJSID, 2011, 1 (3), 395-421Figure-24: Purity plot of Metformin from Acid hydrolysis studyFigure-25: Placebo chromatogram from Acid hydrolysis studyFigure-26: Drug product chromatogram from Base hydrolysis studyInternational Journal of Science Innovations and Discoveries Vol 1, Issue 3, November-December 2011408
Thamma Narendra Kumar et al., IJSID, 2011, 1 (3), 395-421Figure-27: Purity plot of Metformin from Base hydrolysis studyFigure-28: Placebo chromatogram from Base hydrolysis studyFigure-29: Drug product chromatogram from Peroxide Oxidation studyInternational Journal of Science Innovations and Discoveries Vol 1, Issue 3, November-December 2011409
Thamma Narendra Kumar et al., IJSID, 2011, 1 (3), 395-421Figure-30: Purity plot of Metformin from Peroxide oxidation studyFigure-31: Placebo chromatogram from Peroxide Oxidation studyFigure-32: Drug product chromatogram from Aqueous hydrolysis studyInternational Journal of Science Innovations and Discoveries Vol 1, Issue 3, November-December 2011410
Thamma Narendra Kumar et al., IJSID, 2011, 1 (3), 395-421Figure-33: Purity plot of Metformin from Aqueous hydrolysis studyFigure-34: Placebo chromatogram from Aqueous hydrolysis studyFigure-35: Drug product chromatogram from Sun-Light exposure studyInternational Journal of Science Innovations and Discoveries Vol 1, Issue 3, November-December 2011411
Thamma Narendra Kumar et al., IJSID, 2011, 1 (3), 395-421Figure-36: Purity plot of Metformin from Sun-Light exposure studyFigure-37: Placebo chromatogram from Sun-Light exposure studyFigure-38: Drug product chromatogram from UV-Light exposure studyInternational Journal of Science Innovations and Discoveries Vol 1, Issue 3, November-December 2011412
Thamma Narendra Kumar et al., IJSID, 2011, 1 (3), 395-421Figure-39: Purity plot of Metformin from UV-Light exposure studyFigure-40: Placebo chromatogram from UV-Light exposure studyFigure-41: Drug product chromatogram from Dry-Heat stress studyInternational Journal of Science Innovations and Discoveries Vol 1, Issue 3, November-December 2011413
Thamma Narendra Kumar et al., IJSID, 2011, 1 (3), 395-421Figure-42: Purity plot of Metformin from Dry-Heat stress studyFigure-43: Placebo chromatogram from Dry-Heat stress studyFigure-44: Drug product chromatogram from Humidity stress studyInternational Journal of Science Innovations and Discoveries Vol 1, Issue 3, November-December 2011414
Thamma Narendra Kumar et al., IJSID, 2011, 1 (3), 395-421Figure-45: Purity plot of Metformin from Humidity stress studyFigure-46: Placebo chromatogram from Humidity stress studyPrecision: The precision of the method verified by Repeatability and Intermediate precision. Repeatability waschecked by injecting six individual preparations of Metformin Hydrochloride Tablet powder. % RSD of assayresults was calculated. The intermediate precision of the assay method was evaluated by different analysts andperforming the analysis on different days and with different <strong>HPLC</strong> instruments and columns.The % RSD of assay of Metformin Hydrochloride during the assay method precision study was 1.0 %. The% RSD of the assay results obtained in the intermediate precision study was within the limit (1.1) conforming goodrepeatability of the method. The % RSD values were represented in table-3.International Journal of Science Innovations and Discoveries Vol 1, Issue 3, November-December 2011415
Thamma Narendra Kumar et al., IJSID, 2011, 1 (3), 395-421Table-3: Precision resultsPrecision Results (% RSD of % assay)Sample N°Metformin Hydrochloride1 99.72 100.73 98.84 98.35 99.66 98.0Mean 99.2%RSD 1.0Comparison b/n Precision Intermediate Precision Results (Response % RSD)%RSDMetformin HydrochloridePrecision 1.0Intermediate Precision 1.1Accuracy: Accuracy of the assay method was evaluated with dosage form equivalent to about 25% to 200% of thetarget assay of the Metformin Hydrochloride. The percentages of recovery at each level were calculated. Thepercentage recovery of Metformin Hydrochloride was ranged from 98.3 to 99.8%. The % recovery values forMetformin Hydrochloride were represented in table-4.Table –4: %Recovery of active ingredients - summary tableLevelMetformin Hydrochloride% Recovery % RSD25% 99.2 0.350% 99.4 0.3100% 99.8 0.4120% 98.8 0.1150% 98.3 0.2200% 98.9 0.2Linearity:Linearity of test solutions for the assay method was verified in the range of Metformin Hydrochloride at 21,43, 85, 102, 128 and 170 µg/ml respectively. The peak area versus concentration data was treated by least-squareslinear regression analysis.Linearity calibration plot for the assay method was obtained over the calibration ranges tested, i.e. 21 – 170µg/ml and correlation coefficient obtained was greater than 0.999. The result shows that an excellent correlationexisted between the peak area and concentration of the analyte. The linearity chromatograms and results wererepresented in figure-47, 48, 49 and table-5.International Journal of Science Innovations and Discoveries Vol 1, Issue 3, November-December 2011416
Thamma Narendra Kumar et al., IJSID, 2011, 1 (3), 395-421Figure-47: Linearity chromatogramsLinearitySolutionsResponseRegressionResultsFigure-48: Linearity chromatograms at each levelsTable –5: Linearity Regression Summary TableActive ingredient nameMetforminHydrochlorideLevel – 1 (25%) 1039056Level – 2 (50%) 2074798Level – 3 (100%) 4125356Level – 4 (120%) 4945678Level – 5 (150%) 6185494Level – 6 (200%) 8212326Slope 48004.2263Intercept 21959.2073Correlation Coefficient 0.999995Standard Error 9539.260International Journal of Science Innovations and Discoveries Vol 1, Issue 3, November-December 2011417
Thamma Narendra Kumar et al., IJSID, 2011, 1 (3), 395-421Response (mAU)Robustness:9000000800000070000006000000500000040000003000000200000010000000Linearity Plot for Metformin Hydrochloride0.000 20.000 40.000 60.000 80.000 100.000 120.000 140.000 160.000 180.000Concentration (µg/ml)Figure-49: Linearity graphsTo determine the robustness of the developed method, experimental conditions were deliberately altered.The flow rate of the mobile phase was 1.0 ml/min, to study the effect of flow rate; flow was changed by 0.1 unitsfrom 0.9 to1.l ml/min. The effect of the column temperature was studied at 20 and 30 o C instead of 25 o C. The effectof the mobile phase organic composition was studied using 90% and 110% organic phase composition instead of100% organic phase composition. The effect of the buffer pH in mobile phase was studied using mobile phase withpH 4.90 buffer and pH 5.10 buffer instead of mobile phase with pH 5.00 buffer. The effect of filters was conductedusing two different filters namely, 0.45µm PVDF filter and 0.45µm Nylon filter.In all the deliberate varied chromatographic conditions (flow rate, column temperature, mobile phaseorganic composition and buffer pH in mobile phase), the tailing factor of Metformin peak was less than 2.0 and thetheoretical plate count was more than 2000. 0.45 µm PVDF filter and 0.45 µm Nylon filters are found suitable forfiltration. The robustness results were represented in table-6, 7, 8, 9 and 10.Table –6: Robustness Parameter Summary table – Flow rate variationFlow Rate Variation (± 0.1 mL/min)Peak Name Low (0.9 mL/min) Actual (1.0 mL/min) High (1.1 mL/min)TF %RSD TF %RSD TF %RSDMetformin 1.2 0.1 1.2 0.2 1.4 0.1Table –7: Robustness Parameter Summary table – Column oven temperature variationColumn oven temperature variation (± 5°C)Peak NameLow (20°C) Actual (25°C) High (30°C)TF %RSD TF %RSD TF %RSDMetformin 1.3 0.0 1.3 0.0 1.4 0.0International Journal of Science Innovations and Discoveries Vol 1, Issue 3, November-December 2011418
Thamma Narendra Kumar et al., IJSID, 2011, 1 (3), 395-421Table –8: Robustness Parameter Summary table – Mobile phase organic composition variationMobile phase organic composition variation (± 10%)Peak NameLow (90%) Actual (100%) High (110%)TF %RSD TF %RSD TF %RSDMetformin 1.3 0.0 1.3 0.0 1.4 0.0Table –9: Robustness Parameter Summary table – Buffer pH variation in mobile phaseBuffer pH variation in mobile phase (± pH 0.10)Peak NameLow (pH 4.90) Actual (pH 5.00) High (pH 5.10)TF %RSD TF %RSD TF %RSDMetformin 1.3 0.1 1.3 0.0 1.3 0.1TF signifies the tailing factor of peak, %RSD signifies the % relative standard deviation of peak response from sixreplicate injectionsTable –10: Filter validation parameter Summary tableFilter validationSimilarity factor for standard solutionSample N° 0.45 µm PVDF Filter 0.45 µm Nylon Filter1 1.00 1.002 1.00 1.00Similarity factor for test solutionSample N° 0.45 µm PVDF Filter 0.45 µm Nylon Filter1 1.00 1.002 1.00 1.00Solution stability:Solution stability in the assay method was carried out by leaving both the test solution of sample andreference standard in tightly capped volumetric flasks at room temperature for 1 day and after 2 days.The % RSD of the assay of actives during solution stability experiments were within 1%. No significantchanges were observed in the content during solution stability experiments. The solution stability experiment dataconfirms that the sample solutions used during assay were stable for 2 days.CONCLUSIONThe simple reverse phase LC method developed for quantitative analysis of Metformin Hydrochloride inpharmaceutical dosage forms is precise, accurate, linear, robust and specific. Satisfactory results were obtainedfrom validation of the method. The method is stability indicating and can be used for routine analysis of productionsamples and stability samples of actives in pharmaceutical dosage forms.REFERENCES1. Lord JM, Flight IHK, Norman RJ. Metformin in polycystic ovary syndrome: systematic review and metaanalysis.BMJ. 2003;327(7421):951–3.2. Marchesini G, Brizi M, Bianchi G, Tomassetti S, Zoli M, Melchionda N. Metformin in non-alcoholicsteatohepatitis.Lancet. 2001;358(9285):893–4. báñez L, Ong K, Valls C, Marcos MV, Dunger DB, de Zegher F.Metformin treatment to prevent early puberty in girls with precocious pubarche. J Clin Endocrinol Metab.2006;91(8):2888–91.International Journal of Science Innovations and Discoveries Vol 1, Issue 3, November-December 2011419
Thamma Narendra Kumar et al., IJSID, 2011, 1 (3), 395-4213. Nair S, Diehl AM, Wiseman M, Farr GH Jr, Perrillo <strong>RP</strong>. Metformin in the treatment of non-alcoholicsteatohepatitis: a pilot open label trial. Aliment Pharmacol Ther. 2004;20(1):23–28.4. Angelico F, Burattin M, Alessandri C, Del Ben M, Lirussi F.Drugs improving insulin resistance for non-alcoholicfatty liver disease and/or non-alcoholic steatohepatitis. Cochrane Database Syst Rev. 2007;24(1):CD005166.5. Socha P, Horvath A, Vajro P, Dziechciarz P, Dhawan A, Szajewska H. Pharmacological interventions fornonalcoholic fatty liver disease in adults and in children: a systematic review.J Pediatr Gastroenterol Nutr.2009;48(5):587–96.6. Effect of intensive blood-glucose control with metformin on complications in overweight patients with type 2diabetes (UKPDS 34). UK Prospective Diabetes Study (UKPDS) Group.Lancet. 1998;352(9131):854–65.7. Holman RR, Paul SK, Bethel MA, Matthews DR, Neil HA. 10-year follow-up of intensive glucose control in type 2diabetes.N Engl J Med. 2008;359(15):1577–89.8. Selvin E, Bolen S, Yeh HC, et al. Cardiovascular outcomes in trials of oral diabetes medications: a systematicreview. Arch Intern Med. 2008;168(19):2070–80.9. Saeedi R, Parsons HL, Wambolt RB, et al. Metabolic actions of metformin in the heart can occur by AMPKindependentmechanisms. Am J Physiol Heart Circ Physiol. 2008;294(6):H2497–506.10. Werner E, Bell J. The preparation of methylguanidine, and of ββ-dimethylguanidine by the interaction ofdicyanodiamide, and methylammonium and dimethylammonium chlorides respectively. J Chem Soc,Transactions. 1921;121:1790–5.11. Shapiro SL, Parrino VA, Freedman L. Hypoglycemic Agents. I Chemical Properties of β-Phenethylbiguanide. ANew Hypoglycemic Agent. J Am Chem Soc. 1959;81(9):2220–5.12. Bharatam PV, Patel DS, Iqbal P,. Pharmacophoric Features of Biguanide Derivatives: An Electronic andStructural Analysis. J Med Chem. 2005;48(24):7615–7622.13. Patel DS, Bharatam PV. Novel N(L)2 species with two lone pairs on nitrogen: systems isoelectronic tocarbodicarbenes.Chem Commun. 2009;(9):1064–6.14. Heller JB. Metformin overdose in dogs and cats.Veterinary Medicine. 2007;(April):231–233.15. Garry G. Graham, Jeroen Punt, Manit Arora, Richard O. Day, Matthew P. Doogue, Janna K. Duong, Timothy J.Furlong, Jerry R. Greenfield, Louise C. Greenup, Carl M. Kirkpatrick, John E. Ray, Peter Timmins and Kenneth M.Williams. Clinical Pharmacokinetics of Metformin. Clin Pharmacokinet 2011; 50 (2): 81-9816. Robert F, Fendri S, Hary L, Lacroix C, Andréjak M, Lalau JD.Kinetics of plasma and erythrocyte metformin afteracute administration in healthy subjects. Diabetes Metab. 2003;29(3):279–83.17. See Chemical Abstracts, v.23, 42772 (1929) Werner E, Bell J. Uber Biguanide. II. Die BlutzuckersenkendeWirkung der Biguanides. Berichte der Deutschen Chemischen Gesellschaft B: Abhandlungen. 1929;62:1398–1405.International Journal of Science Innovations and Discoveries Vol 1, Issue 3, November-December 2011420
Thamma Narendra Kumar et al., IJSID, 2011, 1 (3), 395-42118. Campbell IW. Metformin—life begins at 50: A symposium held on the occasion of the 43rd Annual Meeting ofthe European Association for the Study of Diabetes, Amsterdam, The Netherlands, September 2007. The BritishJournal of Diabetes & Vascular Disease. 2007;7:247–252.19. Dawes GS, Mott JC. Circulatory and respiratory reflexes caused by aromatic guanidines. Br J PharmacolChemother. 1950;5(1):65–76.20. About Eusebio Y. Garcia, see: Carteciano J. Philippines Department of Science and Technology. Search for DOST-NRCP Dr. Eusebio Y. Garcia Award; 2005 [cited 2009-12-05].21. Quoted from Chemical Abstracts, v.45, 24828 (1951) Garcia EY. Fluamine, a new synthetic analgesic and antifludrug. J Philippine Med Assoc. 1950;26:287–93.22. Quoted from Chemical Abstracts, v.49, 74699 (1955)Supniewski J, Krupinska, J. [Effect of biguanide derivativeson experimental cowpox in rabbits.]. Bulletin de l'Academie Polonaise des Sciences, Classe 3: Mathematique,Astronomie, Physique, Chimie, Geologie et Geographie. 1954;2(Classe II):161–5. French.23. Hadden DR. Goat's rue – French lilac – Italian fitch – Spanish sa<strong>info</strong>in: gallega officinalis and metformin: theEdinburgh connection. J R Coll Physicians Edinb. 2005;35(3):258–60.International Journal of Science Innovations and Discoveries Vol 1, Issue 3, November-December 2011421


