- Page 1 and 2: UNIVERSITY OF CALIFORNIASanta Barba
- Page 3 and 4: DEDICATIONWhen we first embarked on
- Page 5 and 6: GREENING UCSB: DEVELOPMENT OF AN AS
- Page 7 and 8: • Universities have a responsibil
- Page 9 and 10: Building DesignSince the establishm
- Page 11 and 12: established an integrated pest mana
- Page 13 and 14: efficient technologies generally ha
- Page 15 and 16: 3.4.2 Environmental Impact ........
- Page 17 and 18: 7.2.1 Water .......................
- Page 19 and 20: 1. INTRODUCTIONThe accelerating for
- Page 21 and 22: 1.2. Role of Universities in Sustai
- Page 23 and 24: Principles of SustainabilityMinimiz
- Page 25 and 26: 1.3.3 Policy FrameworkThe policy fr
- Page 27 and 28: 2.3. Site HistoryBefore World War I
- Page 29 and 30: 3. BUILDING DESIGN AND CONSTRUCTION
- Page 31 and 32: educed, and flooding and water poll
- Page 33 and 34: particularly high health risk, sinc
- Page 35 and 36: Kevin Kaboli and others. All data i
- Page 37 and 38: comply with. The Office of Environm
- Page 39 and 40: 3.4.3 Institutional FrameworkGreen
- Page 41 and 42: technologies. The designers of Bren
- Page 43 and 44: 3.6. Recommendations:3.6.1 Infrastr
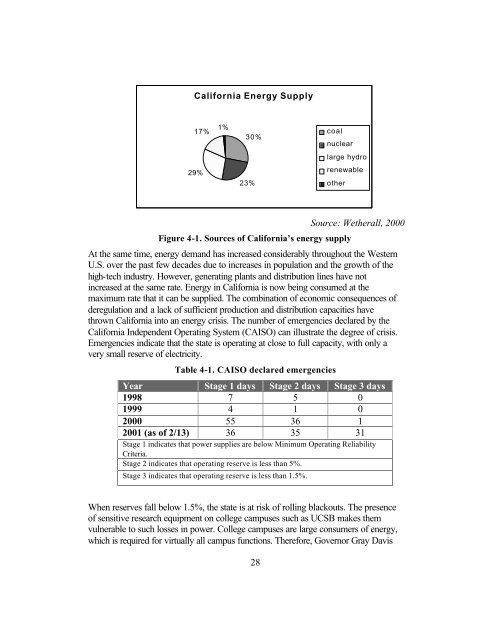
- Page 45: 4. ENERGY USE AT UCSB4.1. Introduct
- Page 49 and 50: five years, and is likely to contin
- Page 51 and 52: The amount of emissions from the bu
- Page 53 and 54: Gritt, and from Facilities Maintena
- Page 55 and 56: efficiencies of individual power pl
- Page 57 and 58: Therms x10^5160140120100806040200Be
- Page 59 and 60: According to the Strategic Energy P
- Page 61 and 62: KWH/total campuspopulation40003500F
- Page 63 and 64: Therms/total campuspopulation120100
- Page 65 and 66: and begun a series of conservation
- Page 67 and 68: ack onto the grid at market price.
- Page 69 and 70: 4.5. Environmental Report CardQuest
- Page 71 and 72: • Use high efficiency lighting an
- Page 73 and 74: ReduceReuseRecycleFigure 5-1. Princ
- Page 75 and 76: not fully understood. An overall as
- Page 77 and 78: Municipal Solid WasteWaste collecti
- Page 79 and 80: non-renewable resources may be less
- Page 81 and 82: Table 5-1. Types of waste at UCSBMa
- Page 83 and 84: 8. Has the campus initiated a hazar
- Page 85 and 86: Material Tons Recycled in Cost of R
- Page 87 and 88: University Bookstore: Paper product
- Page 89 and 90: Legislative IssuesMany terms of reg
- Page 91 and 92: also provides educational outreach
- Page 93 and 94: Associated Student RecyclingThe Ass
- Page 95 and 96: Facilities ManagementFacilities man
- Page 97 and 98:
Table 5-5. Hazardous waste disposal
- Page 99 and 100:
epresents the majority of hazardous
- Page 101 and 102:
and educational outreach are also e
- Page 103 and 104:
expensive to purchase than traditio
- Page 105 and 106:
Has solid waste generated per capit
- Page 107 and 108:
consumer recycled materials?Total:
- Page 109 and 110:
5.5.3 Recycling Efforts• Establis
- Page 111 and 112:
• Convert department ordering thr
- Page 113 and 114:
prevent approximately 15,000 premat
- Page 115 and 116:
setting, attract poachers and facil
- Page 117 and 118:
They also cause acid deposition tha
- Page 119 and 120:
information was obtained from membe
- Page 121 and 122:
LocationTable 6-2. Estimated emissi
- Page 123 and 124:
only one car can actually display t
- Page 125 and 126:
6.4. Analysis of Results6.4.1 Curre
- Page 127 and 128:
6.4.3 Institutional FrameworkTransp
- Page 129 and 130:
eserves should be substantially dec
- Page 131 and 132:
Is a substantial portion (>50%) of
- Page 133 and 134:
6.6.2 Air Quality• Continue to re
- Page 135 and 136:
involved in water management: water
- Page 137 and 138:
7%Environmental18% Urban75%Agricult
- Page 139 and 140:
Inputs: We use water for waste remo
- Page 141 and 142:
Beyond the realm of economic effici
- Page 143 and 144:
important for campuses to consider.
- Page 145 and 146:
Table 7-4. Potable and reclaimed wa
- Page 147 and 148:
6,0005,000Gallons of Wastewater4,00
- Page 149 and 150:
Gallons of Water10,0009,0008,0007,0
- Page 151 and 152:
7.4.4 Financial IssuesWater is purc
- Page 153 and 154:
7.6. Recommendations7.6.1 Water Use
- Page 155 and 156:
Ecosystems are being threatened by
- Page 157 and 158:
services at any price (Hawken, 1997
- Page 159 and 160:
staff. For example, Texas Southern
- Page 161 and 162:
The majority of landscaping is mana
- Page 163 and 164:
Campus Lagoon from roads, parking a
- Page 165 and 166:
educational resource for the campus
- Page 167 and 168:
8.3.6 Community/EducationThere is c
- Page 169 and 170:
9. POLICY FRAMEWORKThe final compon
- Page 171 and 172:
1. The minimization of resource con
- Page 173 and 174:
EcosystemWell-BeingSustainabilityHu
- Page 175 and 176:
• Provide a campus community revi
- Page 177 and 178:
In addition, a new UC campus will b
- Page 179 and 180:
• Compile and publish data on sus
- Page 181 and 182:
Recycled-content products are made
- Page 183 and 184:
11.9 lbs CO 2 /therm * 3,031,218 th
- Page 185 and 186:
APPENDIX C: DRAFT POLICY ONSUSTAINA
- Page 187 and 188:
Enhance natural areas on and around
- Page 189 and 190:
4. Create programs to develop the c
- Page 191 and 192:
California Energy Commission (2001)
- Page 193 and 194:
Gibbs, Dennis (2001). “Santa Barb
- Page 195 and 196:
Phillips, J.A. (1998). Managing Ame
- Page 197 and 198:
--- (2000a). “Country Analysis Br
- Page 199 and 200:
Institute for Sustainable Developme