Audit of Substance Abuse Treatment Facilities in ... - SA HealthInfo
Audit of Substance Abuse Treatment Facilities in ... - SA HealthInfo
Audit of Substance Abuse Treatment Facilities in ... - SA HealthInfo
- No tags were found...

Create successful ePaper yourself
Turn your PDF publications into a flip-book with our unique Google optimized e-Paper software.
Alcohol & Drug <strong>Abuse</strong> Research UnitMedical Research Council<strong>Audit</strong> <strong>of</strong> <strong>Substance</strong> <strong>Abuse</strong><strong>Treatment</strong> <strong>Facilities</strong> <strong>in</strong> Free State,Limpopo, Mpumalanga, NorthWest and Northern Cape(2007-2008):Technical ReportNuraan Fakier & Bronwyn MyersAlcohol and Drug <strong>Abuse</strong> Research UnitMedical Research Council (MRC)December 2008
TABLE OF CONTENTSEXECUTIVE SUMMARY..…………………………………………………………...7PART 1: BACKGROUND……………………………………………………..…101.1 The need for substance abuse treatment.…….…………………...101.2 The value <strong>of</strong> substance abuse treatment....………………………..101.3 <strong>Substance</strong> abuse treatment services <strong>in</strong> South Africa.…..………...111.3.1 Limited availability <strong>of</strong> services <strong>in</strong> relation to need…………121.3.2 Racial <strong>in</strong>equities <strong>in</strong> access to health and social services……131.3.3 Factors associated with disparities <strong>in</strong> access to substanceabuse treatment……………………………………………….141.4 <strong>Substance</strong> abuse treatment <strong>in</strong> South Africa: Prior research andthe way forward…………………………………………………….161.5 Term<strong>in</strong>ology…………………………………………………………18PART 2:METHOD………………………………………………………..……...202.1 Aims…………………………………………………………………202.2 Objectives…………………………………………………………...202.3 Design………………………………………………………………..212.4 Sample……………………………………………………………….212.5 <strong>Treatment</strong> Services <strong>Audit</strong> (T<strong>SA</strong>) Questionnaire………………….222.6 Data collection………………………………………………………232.7 Data analysis………………………………………………………..242.8 Data considerations………………………………………………...242.8.1 Response rates………………………………………………..242.8.2 Quality assurance and item non-response………………….242.8.3 Further data considerations and limitations……………….25PART 3:KEY RESULTS.…………….………………..………………………..263.1 Characteristics <strong>of</strong> substance abuse treatment facilities <strong>in</strong>Free State, Limpopo, Mpumalanga, North West and NorthernCape……………………………………...........................................263.1.1 <strong>Treatment</strong> facility pr<strong>of</strong>ile by <strong>in</strong>tensity <strong>of</strong> care……………...262
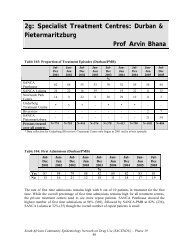
3.1.2 <strong>Treatment</strong> facility pr<strong>of</strong>ile by facility ownership…...……….273.1.3 <strong>Treatment</strong> facility pr<strong>of</strong>ile by state affiliation...……………..283.1.4 <strong>Treatment</strong> facility pr<strong>of</strong>ile by <strong>in</strong>tensity <strong>of</strong> care and facilityownership……………………………………………………...283.2 Pr<strong>of</strong>ile <strong>of</strong> clients served by substance abuse treatment facilities<strong>in</strong> Free State, Limpopo, Mpumalanga, North West and NorthernCape …………………………………...............................................303.2.1 Demographic pr<strong>of</strong>ile <strong>of</strong> clients at treatment facilities <strong>in</strong>Free State, Limpopo, Mpumalanga, North West andNorthern Cape ………………………………........................303.3 <strong>Treatment</strong> capacity and service utilisation……………………….343.3.1 Average number <strong>of</strong> clients treated per month <strong>in</strong> Free State,Limpopo, Mpumalanga, North West and Northern Cape...343.3.2 <strong>Treatment</strong> capacity at substance abuse treatmentfacilities……………………………………………………….353.3.3 <strong>Substance</strong> abuse treatment occupancy rates………………353.3.4 Wait<strong>in</strong>g period for treatment services at substance abusefacilities <strong>in</strong> Free State, Limpopo, Mpumalanga, NorthWest and Northern Cape.…………………..........................353.3.5 Rates <strong>of</strong> client retention <strong>in</strong> treatment………………………363.4 Staff and staff-related issues………………………………………363.4.1 Characteristics <strong>of</strong> staff at substance abuse treatmentfacilities……………………………………………………….373.4.2 Staff participation <strong>in</strong> pr<strong>of</strong>essional developmentactivities…..…………………….…………………………….383.4.3 Resources to support staff development at treatmentfacilities………………………………………………………393.5 Organisational environment and management practices………403.5.1 Management practices at treatment facilities……………..403.6 Pr<strong>of</strong>ile <strong>of</strong> services provided by substance abuse treatmentfacilities……………………………………………………………..423.6.1 Pr<strong>of</strong>ile <strong>of</strong> treatment services <strong>of</strong>fered…………………….....433
3.6.2 Provision <strong>of</strong> assessment services……………………………443.6.3 <strong>Substance</strong> abuse counsell<strong>in</strong>g services………………………443.6.4 Provision <strong>of</strong> family services…………………………………463.6.5 Provision <strong>of</strong> health and medical services…………………...473.7 Address<strong>in</strong>g barriers to treatment entry for vulnerable groups…493.7.1 Practices that improve awareness <strong>of</strong> substance abusetreatment options……………………………………………493.7.2 Practices that address logistical and affordability barriersto treatment entry……………………………………………523.7.3 Practices that address cultural and l<strong>in</strong>guistic barriers totreatment entry………………………………………………533.8 Address<strong>in</strong>g barriers to engagement and retention <strong>in</strong> treatmentfor vulnerable groups………………………………………………543.8.1 Cultural and l<strong>in</strong>guistic sensitivity and appropriateness<strong>of</strong> treatment…………………………………………………..543.8.2 Gender sensitivity and appropriateness <strong>of</strong> treatment……..553.8.3 Age appropriateness <strong>of</strong> treatment services…………………573.9 Monitor<strong>in</strong>g and evaluation activities for substance abusetreatment facilities………………………………………………….593.9.1 Monitor<strong>in</strong>g <strong>of</strong> clients’ progress dur<strong>in</strong>g the course <strong>of</strong>treatment……………………………………………………..603.9.2 Monitor<strong>in</strong>g <strong>of</strong> clients’ progress post-treatment…………….613.9.3 Formal treatment programme evaluation………………….63PART 4:DISCUSSION OF KEY FINDINGS ………………………………....654.1 Availability <strong>of</strong> substance abuse treatment services……………...654.1.1 Availability <strong>of</strong> treatment services…………………………...654.1.2 Utilisation <strong>of</strong> and demand for available treatment slots…..654.1.3 Effective use <strong>of</strong> available treatment slots…………………..664.2 Range and diversity <strong>of</strong> services provided………………………..664.2.1 Provision <strong>of</strong> ancillary mental health services……………...674.2.2 Provision <strong>of</strong> ancillary health services………………………684
4.3 Target<strong>in</strong>g barriers to treatment entry, engagement andretention for clients from underserved groups………………….694.3.1 The extent to which services are accessible tounderserved groups…………………………………………694.3.2 Access to treatment: Target<strong>in</strong>g barriers to treatmententry…………………………………………………………..71Awareness-related barriers to treatment entry………………..71Logistic and affordability barriers to treatment entry………...71Cultural and l<strong>in</strong>guistic barriers to treatment entry……………734.3.3 Target<strong>in</strong>g barriers to treatment retention: Theappropriateness <strong>of</strong> services………………………………….74Cultural and l<strong>in</strong>guistic appropriateness <strong>of</strong> services …………..74Gender appropriateness <strong>of</strong> services …………………………..75Age appropriate services ……………………………………...764.4 Monitor<strong>in</strong>g and evaluation <strong>in</strong> substance abuse treatmentfacilities……………………………………………………………..764.5 Recommendations…………………………………………………78To improve the availability and utilisation <strong>of</strong> substance abusetreatment facilities ..………………………………………………78Availability <strong>of</strong> treatment services ………………………………….78Improv<strong>in</strong>g treatment capacity…………………………………….…79To improve the diversity <strong>of</strong> services and range <strong>of</strong> servicesprovided through <strong>in</strong>creas<strong>in</strong>g access to ancillary health andmental health services…………………………………………….79Unmet mental health needs…………………………………………79Unmet medical needs………………………………………………..80Case management ………………………………………………….80To address barriers to treatment entry for underservedgroups ……………………………………………………………..81Logistic and affordability barriers ………………………………...81Awareness barriers ………………………………………………..81Cultural and l<strong>in</strong>guistic barriers …………………………………...815
Improv<strong>in</strong>g the cultural, gender and age appropriateness <strong>of</strong>services…………………………………………………………….82Cultural and l<strong>in</strong>guistic appropriateness <strong>of</strong> services ……….……..82Gender appropriateness <strong>of</strong> services ………………………………82Age appropriateness <strong>of</strong> services…………………………………...82To improve treatment service plann<strong>in</strong>g and delivery throughresearch and monitor<strong>in</strong>g and evaluation activities..……………83National audit……………………………………………………...83National prevalence study <strong>of</strong> substance use disorders and unmettreatment need……………………………………………….…….83Monitor<strong>in</strong>g and evaluation ……………………………………….84REFERENCES………………………………………………………………………856
EXECUTIVE SUMMARYA cross-sectional audit <strong>of</strong> substance abuse treatment facilities <strong>in</strong> Free State, Limpopo,Mpumalanga, North West and Northern Cape was conducted from October 2007 toFebruary 2008. A revised version <strong>of</strong> the <strong>Treatment</strong> Services <strong>Audit</strong> (T<strong>SA</strong>) Questionnairewas used to collect <strong>in</strong>formation from a number <strong>of</strong> doma<strong>in</strong>s <strong>in</strong>clud<strong>in</strong>g the organisationalcharacteristics <strong>of</strong> the treatment facility (such as ownership status, <strong>in</strong>tensity <strong>of</strong> careprovided, and organisational resources); the type <strong>of</strong> services provided; the pr<strong>of</strong>ile <strong>of</strong>clients served; the organisational environment <strong>of</strong> facilities, barriers to treatment entry forclients from underserved groups; the cultural, gender, and age appropriateness <strong>of</strong>services, and monitor<strong>in</strong>g and evaluation activities.<strong>Substance</strong> abuse treatment services <strong>in</strong> Free State, Limpopo, Mpumalanga, North Westand Northern Cape are provided predom<strong>in</strong>antly by private, non-pr<strong>of</strong>it facilities. Privatenon-pr<strong>of</strong>it facilities also serve the highest number <strong>of</strong> clients from underserved groups.Consequently, it is recommended that state fund<strong>in</strong>g to these facilities be <strong>in</strong>creased.Furthermore, despite a high demand for substance abuse treatment services, treatmentfacilities are under-utilised. It is thus recommended that <strong>in</strong>terventions which target thefactors underp<strong>in</strong>n<strong>in</strong>g this under-utilisation <strong>of</strong> services are designed and implemented.The range <strong>of</strong> treatment services provided by substance abuse treatment facilities <strong>in</strong> FreeState, Limpopo, Mpumalanga, North West and Northern Cape is limited, with fewfacilities provid<strong>in</strong>g comprehensive services that <strong>in</strong>tegrate ancillary medical and mentalhealth services with core addiction services. This audit found that facilities are morelikely to conduct medical assessments than provide clients with substitution medicationand/or detoxification services. Case management techniques may help facilitate thedelivery <strong>of</strong> <strong>in</strong>tegrated and comprehensive services so that clients have access to ancillarymedical and mental health services.In addition, f<strong>in</strong>d<strong>in</strong>gs suggest that Black/African and female substance abusers rema<strong>in</strong>under-represented <strong>in</strong> substance abuse treatment facilities. In terms <strong>of</strong> activities that targetbarriers to treatment entry for historically underserved population groups; while a7
significant proportion <strong>of</strong> facilities perform outreach activities aimed at improv<strong>in</strong>gawareness <strong>of</strong> treatment options, there is still room for improvement.In terms <strong>of</strong> logistic and affordability barriers, many facilities report provid<strong>in</strong>g f<strong>in</strong>ancialassistance for the direct costs <strong>of</strong> treatment <strong>in</strong> terms <strong>of</strong> reduced fees; however, reducedfees are <strong>of</strong>ten unaffordable to <strong>in</strong>digent clients. This raises a concern about theavailability <strong>of</strong> affordable treatment options to poorer communities. In addition, fewfacilities address the <strong>in</strong>direct costs associated with treatment entry, such as the costs <strong>of</strong>transport and childcare services. Recommendations are made to address logistic barriers.These <strong>in</strong>clude shift<strong>in</strong>g from facility-based outpatient service provision to the use <strong>of</strong>mobile cl<strong>in</strong>ics located <strong>in</strong> disadvantaged, high-need areas. This will also help address thecosts <strong>of</strong> transport to facility-based services.In terms <strong>of</strong> l<strong>in</strong>guistic barriers to treatment entry, the majority <strong>of</strong> facilities reportemploy<strong>in</strong>g multil<strong>in</strong>gual staff and African language-speak<strong>in</strong>g therapists. This study foundthat although all facilities report provid<strong>in</strong>g treatment programmes <strong>in</strong> multiple languages,a smaller proportion <strong>of</strong> facilities provide counsell<strong>in</strong>g that is culturally-appropriate and useculturally-appropriate assessment tools. This potentially <strong>in</strong>hibits Black/African personsfrom be<strong>in</strong>g reta<strong>in</strong>ed <strong>in</strong> treatment.In terms <strong>of</strong> the appropriateness <strong>of</strong> treatment services, f<strong>in</strong>d<strong>in</strong>gs po<strong>in</strong>t to the need fortreatment facilities to receive ongo<strong>in</strong>g tra<strong>in</strong><strong>in</strong>g <strong>in</strong> order to ensure that their treatmentprogrammes are culturally, gender and age appropriate. Several recommendations aremade to <strong>in</strong>crease the cultural, gender and age appropriateness <strong>of</strong> services.F<strong>in</strong>d<strong>in</strong>gs po<strong>in</strong>t to the need for substance abuse treatment facilities <strong>in</strong> these prov<strong>in</strong>ces to<strong>in</strong>troduce rout<strong>in</strong>e, systematic client monitor<strong>in</strong>g systems as well as the need for substanceabuse treatment programmes to be comprehensively evaluated. In addition, as part <strong>of</strong> themonitor<strong>in</strong>g <strong>of</strong> the quality <strong>of</strong> substance abuse treatment services and the extent to whichthese services have transformed to address historical <strong>in</strong>equities <strong>in</strong> service provision, anational treatment audit should be conducted on a regular basis. F<strong>in</strong>d<strong>in</strong>gs from thisnational audit should be used to <strong>in</strong>form decision-mak<strong>in</strong>g about the allocation <strong>of</strong> fund<strong>in</strong>gand other resources to exist<strong>in</strong>g facilities, based on the extent to which they provide8
services to historically underserved groups as well as the degree to which they providecomprehensive services <strong>of</strong> good quality.9
PART 1:BACKGROUND1.1. THE NEED FOR SUBSTANCE ABUSE TREATMENTIn South Africa, changes <strong>in</strong> the pattern <strong>of</strong> substance use over time highlight the need foraccessible treatment services. Dur<strong>in</strong>g the apartheid era, the country’s physical andeconomic isolation, strict monitor<strong>in</strong>g <strong>of</strong> external borders, and str<strong>in</strong>gent <strong>in</strong>ternal controlsrestricted access to and availability <strong>of</strong> most k<strong>in</strong>ds <strong>of</strong> illicit drugs, with locally cultivatedcannabis, Mandrax tablets, and prescription drugs be<strong>in</strong>g the only drugs widely availableto South Africans. However, changes <strong>in</strong> global drug markets, such as improved drugsupply- and demand-reduction strategies <strong>in</strong> Europe and the U<strong>SA</strong>, have forced traffickersto seek alternative routes and markets. South Africa, due to its geographical location, is aconvenient trans-shipment po<strong>in</strong>t for illicit drugs from drug-produc<strong>in</strong>g countries to drugmarkets. Socio-political changes that followed the collapse <strong>of</strong> apartheid, such as thereduction <strong>in</strong> <strong>in</strong>ternal and external border controls, the <strong>in</strong>crease <strong>in</strong> land and air travel,<strong>in</strong>creased trade, and the poorly resourced law enforcement agencies; together with thecountry’s advanced bank<strong>in</strong>g, transport, and communication systems have also made thecountry an attractive new market for drug cartels. With these changes South Africansnow have access to a broad range <strong>of</strong> illicit drugs (Parry et al., 2002a). Supply anddemand <strong>in</strong>dicators suggest that the domestic drug market is expand<strong>in</strong>g, with drug pricesdecreas<strong>in</strong>g, availability <strong>in</strong>creas<strong>in</strong>g, and treatment demand for substance-related problemson the rise (Parry et al., 2002a/b). This expansion <strong>of</strong> the domestic drug market has placedsubstance abuse treatment facilities under <strong>in</strong>creased pressure to provide effective andaccessible treatment services.1.2. THE VALUE OF SUBSTANCE ABUSE TREATMENTYet, there is strong evidence that substance abuse treatment helps reduce the harmsassociated with substance abuse and benefits both the <strong>in</strong>dividual and broader society.Although few treatment outcome studies have been conducted <strong>in</strong> South Africa,<strong>in</strong>ternational research, conducted across a variety <strong>of</strong> treatment sett<strong>in</strong>gs and clientpopulations, has provided considerable evidence <strong>of</strong> the benefits <strong>of</strong> substance abusetreatment (e.g. Gossop, Marsden, Stewart & Teacy, 2001; Simpson, Joe & Brown, 1997).In general, these studies reported positive outcomes, <strong>in</strong>clud<strong>in</strong>g reductions <strong>in</strong> substance10
use, reductions <strong>in</strong> crim<strong>in</strong>al activity, improvements <strong>in</strong> physical and psychological health,and improvements <strong>in</strong> social function<strong>in</strong>g.In develop<strong>in</strong>g countries <strong>in</strong> general (Arif & Westermeyer, 1998), and South Africa <strong>in</strong>particular, few treatment outcome studies have been conducted. Despite methodologicallimitations (such as low follow-up rates), prelim<strong>in</strong>ary evidence po<strong>in</strong>ts to the benefits <strong>of</strong>substance abuse treatment <strong>in</strong> these sett<strong>in</strong>gs. For example, De Silva, Peris, Samaras<strong>in</strong>ghe andEllawala (1992) reported that 36% <strong>of</strong> 234 patients attend<strong>in</strong>g a treatment centre <strong>in</strong> SriLanka were abst<strong>in</strong>ent two years post-treatment. In addition, significant reductions <strong>in</strong>substance use were reported among patients <strong>in</strong> treatment centres <strong>in</strong> Thailand, with 50% <strong>of</strong>patients abst<strong>in</strong>ent from amphetam<strong>in</strong>e-type substances and 27% abst<strong>in</strong>ent from opiates 6months post treatment (Perngpam & Porncharoen, 2001). Only two substance abusetreatment outcome studies have been conducted <strong>in</strong> South Africa. Coetzee (2001) reportedan abst<strong>in</strong>ence rate <strong>of</strong> 55% among 58 patients attend<strong>in</strong>g an outpatient substance abusetreatment centre <strong>in</strong> 2000. In the second study <strong>of</strong> 89 patients attend<strong>in</strong>g a private <strong>in</strong>patientfacility, Coetzee (2004) reported an abst<strong>in</strong>ence rate <strong>of</strong> 48% one year post-treatment. Thisemerg<strong>in</strong>g evidence po<strong>in</strong>ts to the potential value <strong>of</strong> substance abuse treatment services <strong>in</strong>South Africa.1.3. SUBSTANCE ABUSE TREATMENT SERVICES IN SOUTH AFRICAAnecdotal reports from treatment service providers and communities po<strong>in</strong>t to an<strong>in</strong>creased demand for substance abuse treatment services, with wait<strong>in</strong>g lists for treatmentslots <strong>in</strong>creas<strong>in</strong>g and communities mobilis<strong>in</strong>g around drug-related issues. This <strong>in</strong>creaseddemand has placed treatment facilities under pressure to <strong>in</strong>crease their coverage andprovision <strong>of</strong> services to a greater number <strong>of</strong> users. Despite this pressure, little is knownabout the structure and function<strong>in</strong>g <strong>of</strong> the substance abuse treatment system <strong>in</strong> thecountry. This study attempts to address this gap <strong>in</strong> knowledge by exam<strong>in</strong><strong>in</strong>g substanceabuse treatment services <strong>in</strong> the Free State, Limpopo, Mpumalanga, North West andNorthern Cape.Free State is the fourth largest prov<strong>in</strong>ce <strong>in</strong> South Africa (Statistics South Africa, 2006a)and constitutes about seven per cent <strong>of</strong> the population <strong>of</strong> South Africa (Statistics SouthAfrica, 1998a). In l<strong>in</strong>e with the national pattern, Black/Africans 1 form the largest11
population group (84%) <strong>in</strong> the Free State, followed by Whites (13%) while Colouredsand Asians/Indians constitute less than three per cent <strong>of</strong> the population <strong>of</strong> the Free State(Statistics South Africa, 1998a). Limpopo has a similar racial composition to the FreeState. Limpopo is one <strong>of</strong> the least urbanised prov<strong>in</strong>ces as the majority <strong>of</strong> its populationlive <strong>in</strong> non-urban areas (Statistics South Africa, 2006b). The majority <strong>of</strong> Limpopo’spopulation is Black/African, account<strong>in</strong>g for 97.2% <strong>of</strong> its population, which is the highestpercentage for a prov<strong>in</strong>ce <strong>in</strong> the country (Statistics South Africa, 2006b). Limpopo hasthe lowest percentage <strong>of</strong> other population groups, namely White (2.4%), Coloured (0.2%)and Asian/Indian (0.2%) (Pauw, 2005). Similarly, the population <strong>of</strong> Mpumalanga consistspredom<strong>in</strong>antly <strong>of</strong> Black/Africans, account<strong>in</strong>g for 92% <strong>of</strong> its total population <strong>in</strong> 2001,followed by Whites (6.5%), Coloureds (0.7%) and Indians/Asians (0.4%) (StatisticsSouth Africa, 2006c). Less than half <strong>of</strong> the total population <strong>of</strong> Mpumalanga lives <strong>in</strong> urbanareas. In 1995, Statistics South Africa estimated that North West was the sixth mostpopulated prov<strong>in</strong>ce (Statistics South Africa, 1998b). The vast majority <strong>of</strong> the population<strong>in</strong> North West is Black/African (90%), fewer than one <strong>in</strong> ten is White (8%) and therema<strong>in</strong>der consists <strong>of</strong> Coloured (1%) and Indian (0.3%) (Statistics South Africa, 1998b).Similar to Mpumalanga, less than half <strong>of</strong> the population <strong>in</strong> North West lives <strong>in</strong> urbanareas. North West, Free State, Limpopo and Mpumalanga have similar racialcompositions; however, the population distribution <strong>in</strong> Northern Cape is not typical <strong>of</strong>South Africa as a whole. The majority <strong>of</strong> the population <strong>in</strong> Northern Cape is Coloured(54%) followed by the Black/African population (30%) and Whites (16%) (StatisticsSouth Africa, 1998c). This is contrary to the population distribution picture observable <strong>in</strong>all the other prov<strong>in</strong>ces (except Western Cape) and nationally, where Black/Africans arethe majority. Northern Cape is the largest prov<strong>in</strong>ce but had the smallest population <strong>in</strong>both the 1996 and 2001 censuses (Statistics South Africa, 1998c). More than 80% <strong>of</strong> thetotal population <strong>in</strong> Northern Cape lived <strong>in</strong> urban areas <strong>in</strong> 2001 (Statistics South Africa,2006d).1.3.1. Limited availability <strong>of</strong> services <strong>in</strong> relation to needAccess to substance abuse treatment rema<strong>in</strong>s limited <strong>in</strong> these prov<strong>in</strong>ces, partly due to thelimited availability <strong>of</strong> treatment services.12
Despite high levels <strong>of</strong> substance abuse <strong>in</strong> these prov<strong>in</strong>ces, substance abuse has beenafforded relatively low priority. In general, prov<strong>in</strong>cial departments <strong>of</strong> SocialDevelopment have focused their resources on prevention, early <strong>in</strong>tervention and statutoryactivities rather than the provision <strong>of</strong> treatment services. At present, there is only onestate-run treatment facility for substance abuse <strong>in</strong> Free State and one <strong>in</strong> Mpumalanga.Although there are other treatment facilities <strong>in</strong> these prov<strong>in</strong>ces that are subsidised by thestate, fund<strong>in</strong>g to these facilities rema<strong>in</strong>s problematic. In addition, the number <strong>of</strong> bedsavailable <strong>in</strong> state-funded general and psychiatric hospitals for patients with substance usedisorders has decreased <strong>in</strong> these prov<strong>in</strong>ces. These factors have contributed to longwait<strong>in</strong>g periods for affordable treatment slots at state-funded facilities. These wait<strong>in</strong>gperiods may have a negative impact on motivation to change, treatment retention andtreatment outcomes (Mejita & Bokos, 1997).1.3.2. Racial <strong>in</strong>equities <strong>in</strong> access to health and social servicesWhile the limited availability <strong>of</strong> substance abuse treatment restricts access to treatmentfor all South Africans, substance abuse treatment seems to be relatively more difficult toaccess for poor Black/African and Coloured South Africans historically disadvantageddur<strong>in</strong>g the apartheid regime. For these racially def<strong>in</strong>ed social groups, several sociopoliticalfactors restricted access to services (<strong>in</strong>clud<strong>in</strong>g substance abuse treatmentservices) under the apartheid system <strong>of</strong> governance. Firstly, fund<strong>in</strong>g to substance abusetreatment facilities was generally <strong>in</strong>adequate and treatment facilities were poorlydistributed, with services be<strong>in</strong>g concentrated <strong>in</strong> urban areas that were historicallyreserved for Whites. Major disparities also existed between the racially-def<strong>in</strong>ed socialgroups <strong>in</strong> terms <strong>of</strong> the allocation <strong>of</strong> resources to and the quality <strong>of</strong> substance abusetreatment services, with treatment facilities serv<strong>in</strong>g White South Africans be<strong>in</strong>g relativelybetter resourced and provid<strong>in</strong>g more comprehensive services than those facilities serv<strong>in</strong>gBlack 1 South Africans (Myers, 2004; Myers & Parry, 2005).S<strong>in</strong>ce South Africa’s transition to democracy <strong>in</strong> 1994, the health and social service sectorhas worked hard to improve service delivery and reverse racial disparities <strong>in</strong> serviceprovision (National Department <strong>of</strong> Health, 1997; National Department <strong>of</strong> Social1 The term “Black South African” refers to all groups who were historically disadvantaged under theapartheid regime <strong>in</strong>clud<strong>in</strong>g ethnic Black/African, Coloureds <strong>of</strong> mixed race descent and Indian/Asians.13
Development, 1997; 2006). Despite this, concerns about disparities <strong>in</strong> health and socialwelfare service provision between the socially advantaged and the socially disadvantagedrema<strong>in</strong>; with socio-economic disadvantage still associated with race <strong>in</strong> South Africa -despite a grow<strong>in</strong>g Black middle class (Sanders & Chopra, 2006). Given these <strong>in</strong>equities,it is plausible that similar racial <strong>in</strong>equities exist <strong>in</strong> the substance abuse treatment sector.To some extent, these concerns seem justified. Accord<strong>in</strong>g to recent f<strong>in</strong>d<strong>in</strong>gs from theSouth African Community Epidemiology Network on Alcohol and Drug <strong>Abuse</strong>(<strong>SA</strong>CENDU) (Myers, 2004; Myers & Parry, 2005) and audits <strong>of</strong> specialist substanceabuse treatment facilities <strong>in</strong> Cape Town (Myers & Parry, 2003) and Gauteng andKwaZulu-Natal (Myers & Fakier, 2007), the race pr<strong>of</strong>ile <strong>of</strong> clients at specialist treatmentfacilities does not reflect the demographics <strong>of</strong> the general population. Throughout thecountry, there has been an under-representation <strong>of</strong> Black and an over-representation <strong>of</strong>White South Africans <strong>in</strong> treatment facilities. This pattern <strong>of</strong> service utilisation reflectsthe limited extent to which Black South Africans have access to substance abusetreatment rather than lower levels <strong>of</strong> substance use by these racially-def<strong>in</strong>ed social groups(Myers, 2004; Myers & Parry, 2005; Myers & Fakier, 2007) and highlights theimportance <strong>of</strong> rout<strong>in</strong>ely exam<strong>in</strong><strong>in</strong>g service system factors associated with access tosubstance abuse treatment.1.3.3. Factors associated with disparities <strong>in</strong> access to substance abuse treatment• Availability <strong>of</strong> public servicesDebate about the accessibility <strong>of</strong> services for historically disadvantaged groups hascentred on structural and environmental factors that restrict access to services forBlack South Africans. More specifically, concerns have been raised about the limitedavailability <strong>of</strong> affordable substance abuse treatment facilities. In South Africa, themajority <strong>of</strong> the population (80%) are without medical <strong>in</strong>surance and rely heavily on thestate sector to provide health and social welfare services (Goosen, Bowley, Degiannis, &Plani, 2003) <strong>in</strong>clud<strong>in</strong>g substance abuse treatment. As with other services, the un<strong>in</strong>suredare disproportionately represented by poor, Black South Africans (Goosen et al., 2003).For this sector <strong>of</strong> the population, there are few state-funded substance abuse treatmentfacilities and access to these facilities is hampered by lengthy wait<strong>in</strong>g lists <strong>of</strong> up to sixmonths (Myers, 2004; Myers & Parry, 2003).14
Despite the apparent availability <strong>of</strong> substance abuse treatment services <strong>in</strong> each prov<strong>in</strong>ce,for the un<strong>in</strong>sured the availability <strong>of</strong> affordable substance abuse treatment has decreased <strong>in</strong>recent years, with the number <strong>of</strong> beds allocated for substance abuse <strong>in</strong> state hospitalsdecreas<strong>in</strong>g. For the rema<strong>in</strong><strong>in</strong>g state-subsidised treatment facilities, state fund<strong>in</strong>g hasdecreased <strong>in</strong> real terms, limit<strong>in</strong>g their capacity to expand services to historicallyunderserved areas (Myers & Parry, 2003; Myers & Parry, 2005). This has been partly dueto the diversion <strong>of</strong> funds from tertiary level substance abuse treatment services to primaryhealth (National Department <strong>of</strong> Health, 1997) and community-based social services(National Department <strong>of</strong> Social Development, 1997). While the policy <strong>of</strong> <strong>in</strong>tegrat<strong>in</strong>gsubstance abuse services <strong>in</strong>to exist<strong>in</strong>g primary health care (PHC) networks has been anattempt to improve the accessibility (and equitable distribution) <strong>of</strong> health and socialservices for historically underserved communities, <strong>in</strong> reality implementation has beenslow with few substance abuse treatment services be<strong>in</strong>g <strong>of</strong>fered at a community level(Myers & Parry, 2005). Poor <strong>in</strong>frastructure, limited capacity, and multiple demandsplaced on PHC nurses and community-based social workers have been some <strong>of</strong> thereasons given for the slow pace <strong>of</strong> service delivery (Goosen et al., 2003; Sanders &Chopra, 2006). Whatever the reasons, an un<strong>in</strong>tended consequence <strong>of</strong> these policy changeshas been that access to substance abuse treatment has become even more restricted forpoor South Africans.• Availability <strong>of</strong> private servicesThe shortage <strong>of</strong> publicly funded substance abuse treatment centres, together with the<strong>in</strong>creased demand for substance abuse treatment, has given rise to a grow<strong>in</strong>g privatetreatment sector. Compared to the state treatment system, the private for-pr<strong>of</strong>ittreatment sector has relatively more resources, shorter wait<strong>in</strong>g lists, more evidence-basedtreatment programmes, more experienced staff, and provides relatively better treatmentenvironments (Myers & Parry, 2003; Myers, 2004). Although these facilities fill animportant gap <strong>in</strong> the market, they have been criticised for serv<strong>in</strong>g mostly Whitecommunities (given that they are largely unaffordable to the un<strong>in</strong>sured and that Whitesmay have wealthier social networks that can be drawn upon to co-fund treatment), hav<strong>in</strong>glimited skills for deal<strong>in</strong>g with the socio-cultural and language context <strong>of</strong> historically15
disadvantaged communities, and for be<strong>in</strong>g located <strong>in</strong> suburban areas and thus be<strong>in</strong>g<strong>in</strong>accessible to the majority <strong>of</strong> the population (Myers & Parry, 2005).There has also been a proliferation <strong>of</strong> private, non-pr<strong>of</strong>it treatment facilities. Althoughmany <strong>of</strong> these are pr<strong>of</strong>essionally run accredited facilities with solid treatmentprogrammes, <strong>in</strong> recent years several facilities have been started by well-mean<strong>in</strong>gcommunity members with little knowledge <strong>of</strong> how to treat substance abuse and fewresources. Often these community-based facilities operate illegally and are unregulatedby the state. Although private non-pr<strong>of</strong>it facilities are relatively more accessible to BlackSouth Africans than for-pr<strong>of</strong>it services, the quality <strong>of</strong> services provided by these facilitiesis <strong>of</strong>ten variable and wait<strong>in</strong>g lists at the better-resourced facilities are lengthy. Inaddition, many <strong>of</strong> the accredited non-pr<strong>of</strong>it facilities require clients to make some form <strong>of</strong>f<strong>in</strong>ancial contribution towards their treatment (Myers, 2004). Quality <strong>of</strong> services, wait<strong>in</strong>glists, and co-payment fees all restrict access to treatment for poor substance users.1.4. SUBSTANCE ABUSE TREATMENT IN SOUTH AFRICA: PRIORRESEARCH AND THE WAY FORWARDIn South Africa, national, prov<strong>in</strong>cial, and local governments control the allocation <strong>of</strong>resources for substance abuse services. For the state to plan and deliver substance abusetreatment services that ensure appropriate and adequate provision <strong>of</strong> services to thecommunity (through address<strong>in</strong>g current and projected treatment needs, target<strong>in</strong>g high-riskgroups, and improv<strong>in</strong>g accessibility for all sectors <strong>of</strong> the population), access to quality<strong>in</strong>formation about local treatment needs, exist<strong>in</strong>g treatment services, patterns <strong>of</strong> serviceutilisation, and service performance are required. This necessitates the development <strong>of</strong> asystem for monitor<strong>in</strong>g substance abuse treatment services (Grant & Petrie, 2001).Yet, treatment service plann<strong>in</strong>g is hampered <strong>in</strong> South Africa by the lack <strong>of</strong> a monitor<strong>in</strong>gsystem that rout<strong>in</strong>ely collects <strong>in</strong>formation on substance abuse treatment services. Whilethe South African Community Epidemiology Network on Drug Use (<strong>SA</strong>CENDU) projectdoes collect descriptive <strong>in</strong>formation about the pr<strong>of</strong>ile <strong>of</strong> clients served at treatmentcentres <strong>in</strong> all n<strong>in</strong>e prov<strong>in</strong>ces <strong>in</strong> the country on a six-monthly basis and although thissystem provides essential <strong>in</strong>formation that should be collected as part <strong>of</strong> a nationalmonitor<strong>in</strong>g system; it does not collect <strong>in</strong>formation on the type, <strong>in</strong>tensity or quality <strong>of</strong>16
treatment services provided. At present, only limited <strong>in</strong>formation is collected on thefacilities that provide substance abuse treatment services. This <strong>in</strong>formation, typicallyconta<strong>in</strong>ed <strong>in</strong> resource directories, generally consists <strong>of</strong> a brief description <strong>of</strong> the types <strong>of</strong>clients served and services provided.Exceptions to this <strong>in</strong>clude two local-level audits <strong>of</strong> specialist substance abuse treatmentfacilities <strong>in</strong> Cape Town and Gauteng, conducted <strong>in</strong> 2002 and 2004, respectively (Myers &Parry, 2003; Myers, 2004). These audits reported on treatment facility characteristics, thepr<strong>of</strong>ile <strong>of</strong> clients served, the type and range <strong>of</strong> treatment services provided, theaccessibility <strong>of</strong> treatment services to clients from historically underserved groups, andtreatment service monitor<strong>in</strong>g and evaluation processes. In addition, these auditsrecommended that a national audit <strong>of</strong> substance abuse treatment facilities occur on aregular basis to facilitate the collection <strong>of</strong> quality <strong>in</strong>formation on substance abusetreatment services (Myers & Parry, 2003; Myers, 2004). In 2007, an attempt was made toaddress this gap by audit<strong>in</strong>g all known substance abuse treatment facilities <strong>in</strong> Gautengand KwaZulu-Natal prov<strong>in</strong>ces (Myers & Fakier, 2007). This report represents anotherattempt to provide miss<strong>in</strong>g <strong>in</strong>formation on current treatment services <strong>in</strong> the follow<strong>in</strong>gprov<strong>in</strong>ces: Free State, Limpopo, Mpumalanga, North West and the Northern Cape. Assuch, the current project represents a partial response to earlier recommendations andgoes some way towards develop<strong>in</strong>g a national monitor<strong>in</strong>g system <strong>of</strong> substance abusetreatment services.In a context where there is an <strong>in</strong>creas<strong>in</strong>g demand for scarce health and social welfareresources due to the burden caused by poverty, TB, HIV/AIDS and other <strong>in</strong>fectiousdiseases (Freeman, 2000), a study that describes the structure <strong>of</strong> the substance abusetreatment system, describes the extent to which this system adheres to norms andstandards for treatment, and provides evidence as to whether barriers to access<strong>in</strong>gexist<strong>in</strong>g services exist with<strong>in</strong> this system is useful. Through identify<strong>in</strong>g gaps <strong>in</strong> currentservice delivery, this study could help guide the design <strong>of</strong> policies to improve servicedelivery and could also assist plann<strong>in</strong>g and decision-mak<strong>in</strong>g around substance abusetreatment services by suggest<strong>in</strong>g ways <strong>in</strong> which treatment service delivery can beimproved (Th<strong>in</strong>d & Andersen, 2003).17
The nature <strong>of</strong> scientific <strong>in</strong>quiry also requires generalisability and applicability <strong>of</strong> researchf<strong>in</strong>d<strong>in</strong>gs across widely diverse population groups. Although previous audits <strong>of</strong> treatmentservices have been conducted (Myers & Parry, 2003; Myers, 2004), these audits did notallow for comparisons to be made across prov<strong>in</strong>ces. However, the audit <strong>in</strong> 2007 (Myers& Fakier, 2007) compared Gauteng and KwaZulu-Natal prov<strong>in</strong>ces. The current studyallows for comparisons to be made across five prov<strong>in</strong>ces <strong>in</strong> the country. Thiscomparative research allows for similarities and differences across sites to be identifiedso that <strong>in</strong>terventions can be targeted to specific sites (<strong>in</strong> this case: prov<strong>in</strong>cial treatmentsystems). This approach recognises that the structur<strong>in</strong>g <strong>of</strong> substance abuse treatmentsystems will be <strong>in</strong>fluenced by contextual and environmental factors <strong>in</strong>herent to eachprov<strong>in</strong>ce.1.5. TERMINOLOGYThe follow<strong>in</strong>g terms are used throughout this report:• Facility ownership refers to the type <strong>of</strong> entity own<strong>in</strong>g or responsible for theoperation <strong>of</strong> the facility. In South Africa, private for-pr<strong>of</strong>it, private non-pr<strong>of</strong>it,and state (government) facilities comprise the ma<strong>in</strong> types <strong>of</strong> ownership. The statealso provides fund<strong>in</strong>g for several private, non-pr<strong>of</strong>it facilities.• <strong>Treatment</strong> sett<strong>in</strong>g refers to the environment <strong>in</strong> which a facility is located. InSouth Africa these <strong>in</strong>clude mental health sett<strong>in</strong>gs such as psychiatric hospitals,general health sett<strong>in</strong>gs, stand-alone substance abuse treatment facilities,correctional (crim<strong>in</strong>al justice) sett<strong>in</strong>gs, religious sett<strong>in</strong>gs, and welfare sett<strong>in</strong>gs.• Intensity <strong>of</strong> treatment is def<strong>in</strong>ed as the amount <strong>of</strong> and level at which treatmentservices are provided. In South Africa, substance abuse treatment occurs at one <strong>of</strong>several <strong>in</strong>tensity levels: primary care at an <strong>in</strong>patient/residential level, outpatient,secondary <strong>in</strong>patient care, and stepped down care that comb<strong>in</strong>es <strong>in</strong>patient andoutpatient services.♦ Inpatient/Residential <strong>Treatment</strong>: where clients reside temporarily or on a longer-termbasis <strong>in</strong> a facility that is not their home or usual place <strong>of</strong> residence. The treatmentprogramme provides diagnosis, treatment and rehabilitation for clients with substance18
use disorders whose physical and emotional status does not allow them to function <strong>in</strong>their usual environments.♦ Outpatient <strong>Treatment</strong> refers to non-residential programmes that provide diagnosis,treatment and rehabilitation for clients with substance use disorders whose physicaland emotional status allows them to function with support <strong>in</strong> their usualenvironments. Compared to <strong>in</strong>patient programmes, services are provided at a lowerlevel <strong>of</strong> <strong>in</strong>tensity.♦ Secondary <strong>in</strong>patient treatment refers to a residential treatment facility for alcohol anddrug abuse clients who have received prior treatment <strong>in</strong> a primary care programme. Atreatment regimen <strong>of</strong> <strong>in</strong>dividual and group therapy as well as other activities aimed atthe physical, psychological and social recovery <strong>of</strong> the addicted <strong>in</strong>dividual iscont<strong>in</strong>ued. The programme <strong>of</strong>fered at these facilities is <strong>of</strong> a lower <strong>in</strong>tensity than thatprovided at the <strong>in</strong>itial (primary) <strong>in</strong>patient facility. Often these are referred to ashalfway houses.♦ Comb<strong>in</strong>ed <strong>in</strong>patient and outpatient services: Also referred to as stepped-down care.All clients <strong>in</strong>itially receive <strong>in</strong>patient services. Hav<strong>in</strong>g completed the residentialprogramme, clients move to a lower level <strong>of</strong> care - outpatient services - to ensure thatthe client is smoothly re<strong>in</strong>tegrated back <strong>in</strong>to society and to provide aftercare supportand follow-up.• Facility affiliation refers to the type <strong>of</strong> state registration that a facility has obta<strong>in</strong>ed.In South Africa, substance abuse treatment facilities can be registered with either theDepartment <strong>of</strong> Health or the Department <strong>of</strong> Social Development; with some facilitieshav<strong>in</strong>g dual registration. Each department has different requirements for registration,a discussion <strong>of</strong> which is beyond the scope <strong>of</strong> this report.• Retention refers to the extent to which clients rema<strong>in</strong> <strong>in</strong> treatment and complete thetreatment programme.• Attrition refers to the extent to which clients leave or drop out <strong>of</strong> treatment before theagreed upon date for treatment completion.19
PART 2:METHOD2.1. AIMS• To ga<strong>in</strong> an understand<strong>in</strong>g <strong>of</strong> the characteristics <strong>of</strong> substance abuse treatment facilities<strong>in</strong> Free State, Limpopo, Mpumalanga, North West and Northern Cape;• To ga<strong>in</strong> an understand<strong>in</strong>g <strong>of</strong> the pr<strong>of</strong>ile <strong>of</strong> clients served by substance abuse treatmentfacilities <strong>in</strong> Free State, Limpopo, Mpumalanga, North West and Northern Cape;• To <strong>in</strong>crease knowledge about the nature <strong>of</strong> substance abuse treatment service delivery<strong>in</strong> Free State, Limpopo, Mpumalanga, North West and Northern Cape;• To <strong>in</strong>crease knowledge about the accessibility <strong>of</strong> substance abuse treatment <strong>in</strong> FreeState, Limpopo, Mpumalanga, North West and Northern Cape;• To compare five prov<strong>in</strong>cial substance abuse treatment systems: Free State, Limpopo,Mpumalanga, North West and Northern Cape;• To serve as a feasibility study for the development and implementation <strong>of</strong> an annual,national audit <strong>of</strong> substance abuse treatment services;• To use this <strong>in</strong>formation to <strong>in</strong>form current substance abuse treatment service plann<strong>in</strong>gand delivery at the local, prov<strong>in</strong>cial and national level;• To use this <strong>in</strong>formation to <strong>in</strong>form substance abuse treatment policy at a prov<strong>in</strong>cial andnational level2.2. OBJECTIVES• To describe and compare the characteristics <strong>of</strong> substance abuse treatment facilities <strong>in</strong>Free State, Limpopo, Mpumalanga, North West and Northern Cape (e.g. <strong>in</strong>tensity <strong>of</strong>care <strong>of</strong>fered, type <strong>of</strong> facility ownership, treatment sett<strong>in</strong>g, and facility affiliation);• To describe and compare the demographic pr<strong>of</strong>ile <strong>of</strong> clients served at substance abusetreatment facilities <strong>in</strong> Free State, Limpopo, Mpumalanga, North West and NorthernCape by facility characteristics (<strong>in</strong>tensity <strong>of</strong> care and type <strong>of</strong> facility ownership);• To describe and compare substance abuse treatment service delivery for treatmentfacilities <strong>in</strong> Free State, Limpopo, Mpumalanga, North West and Northern Cape on anumber <strong>of</strong> variables, namely: facility characteristics; treatment factors (number <strong>of</strong>clients served, treatment capacity, utilisation <strong>of</strong> treatment capacity, delay <strong>in</strong> service20
delivery, treatment retention, and treatment attrition), staff<strong>in</strong>g characteristics, andtreatment services <strong>of</strong>fered;• To describe and compare activities conducted by substance abuse treatment facilities<strong>in</strong> Free State, Limpopo, Mpumalanga, North West and Northern Cape that targetbarriers to access<strong>in</strong>g treatment for clients from underserved groups by facilitycharacteristics;• To describe and compare activities conducted by substance abuse treatment facilities<strong>in</strong> Free State, Limpopo, Mpumalanga, North West and Northern Cape to improvetreatment retention for clients from underserved groups by facility characteristics;• To describe and compare monitor<strong>in</strong>g and evaluation activities conducted by substanceabuse treatment facilities <strong>in</strong> Free State, Limpopo, Mpumalanga, North West andNorthern Cape by facility characteristics;• Based on these f<strong>in</strong>d<strong>in</strong>gs, to describe the extent to which these facilities meet SouthAfrican m<strong>in</strong>imum norms and standards for treatment services as well as <strong>in</strong>ternationalbest practice guidel<strong>in</strong>es;• To make recommendations that <strong>in</strong>form substance abuse treatment service policy,plann<strong>in</strong>g and delivery <strong>in</strong> Free State, Limpopo, Mpumalanga, North West andNorthern Cape;• To dissem<strong>in</strong>ate the <strong>in</strong>formation collected, through a variety <strong>of</strong> mechanisms to local,prov<strong>in</strong>cial and national stakeholders.2.3. DESIGNA cross-sectional survey <strong>of</strong> substance abuse treatment facilities was conducted <strong>in</strong> the FreeState, Limpopo, Mpumalanga, North West and Northern Cape prov<strong>in</strong>ces, South Africafrom October 2007 to February 2008.2.4. <strong>SA</strong>MPLEThe sample consisted <strong>of</strong> the total population <strong>of</strong> substance abuse treatment facilities <strong>in</strong>Free State, Limpopo, Mpumalanga, North West and Northern Cape. This study def<strong>in</strong>edsubstance abuse treatment facilities as those facilities that deliver one or more specialisedsubstance abuse treatment services to people with substance use disorders (Torres et al.,1995). These services <strong>in</strong>clude detoxification, rehabilitation programmes and21
psychological treatments. Us<strong>in</strong>g this def<strong>in</strong>ition, self-help groups and facilities thatprovide only <strong>in</strong>formation, education, crisis <strong>in</strong>tervention, aftercare and/or preventionservices are not classified as substance abuse treatment facilities. In addition, solopractitioners and facilities that provide general health and social services, <strong>in</strong>clud<strong>in</strong>gsubstance abuse-related services (e.g. psychologists, social workers, and generalhospitals) are not <strong>in</strong>cluded <strong>in</strong> the sample. As the <strong>Treatment</strong> Services <strong>Audit</strong> Questionnaire(T<strong>SA</strong>) is designed to collect data from each physical location where treatment servicesare provided, a “facility” is def<strong>in</strong>ed as the po<strong>in</strong>t <strong>of</strong> delivery <strong>of</strong> substance abuse treatmentservices (i.e. the physical location).The sample frame was constructed from the list <strong>of</strong> known treatment facilities madeavailable by the Central Drug Authority (CDA) resource directory on alcohol and drugrelated services (CDA, 2003) and the <strong>SA</strong>CENDU database <strong>of</strong> treatment facilities.Snowball sampl<strong>in</strong>g was used to expand upon these databases. In other words, thesefacilities were contacted telephonically and asked to identify other specialist substanceabuse treatment facilities <strong>in</strong> Free State, Limpopo, Mpumalanga, North West and NorthernCape that were not <strong>in</strong> the CDA’s resource directory. At the time <strong>of</strong> the audit, there were6 facilities <strong>in</strong> Free State, 2 <strong>in</strong> Limpopo, 4 <strong>in</strong> Mpumalanga, 1 <strong>in</strong> North West and 4facilities <strong>in</strong> Northern Cape that satisfied the criteria used by this study for the def<strong>in</strong>ition<strong>of</strong> “substance abuse treatment facility”.2.5. TREATMENT SERVICES AUDIT (T<strong>SA</strong>) QUESTIONNAIREThe <strong>Treatment</strong> Services <strong>Audit</strong> (T<strong>SA</strong>) Questionnaire (revised version) was used to collectself-report <strong>in</strong>formation from substance abuse treatment facilities <strong>in</strong> Free State, Limpopo,Mpumalanga, North West and Northern Cape. The T<strong>SA</strong> was designed for the purposes<strong>of</strong> audit<strong>in</strong>g substance abuse treatment facilities <strong>in</strong> South Africa. The construction <strong>of</strong> theorig<strong>in</strong>al T<strong>SA</strong> was based loosely on the Unified Facility Data Set Questionnaire (UFDS)(Carise, McLellan, & Gifford, 2000) that has been used to collect one-day census<strong>in</strong>formation on the population <strong>of</strong> substance abuse treatment facilities <strong>in</strong> the U<strong>SA</strong>. Thequestions conta<strong>in</strong>ed <strong>in</strong> the orig<strong>in</strong>al version <strong>of</strong> the T<strong>SA</strong> were discussed <strong>in</strong> focus groups <strong>of</strong>substance abuse treatment experts to ensure applicability to the South African context. Apilot version <strong>of</strong> the orig<strong>in</strong>al T<strong>SA</strong> was then used at two treatment facilities <strong>in</strong> Cape Townand necessary changes were made to problematic items. The orig<strong>in</strong>al T<strong>SA</strong> was used to22
audit substance abuse treatment facilities <strong>in</strong> Cape Town <strong>in</strong> 2002 (Myers & Parry, 2003).Subsequent to this, the T<strong>SA</strong> was revised to reflect South African m<strong>in</strong>imum norms andstandards for <strong>in</strong>patient treatment centres. This revised version was used to audittreatment facilities <strong>in</strong> Gauteng <strong>in</strong> 2003 as well as Gauteng and KwaZulu-Natal <strong>in</strong>2006/2007.In order to m<strong>in</strong>imise non-response and to <strong>in</strong>clude areas <strong>of</strong> emerg<strong>in</strong>g <strong>in</strong>terest (such asquestions about service delivery); several adjustments have been made to the revisedversion <strong>of</strong> the T<strong>SA</strong>. These changes <strong>in</strong>cluded additional questions about the organisationand work environment that relate to human resources and govern<strong>in</strong>g body procedures,additional questions about the types <strong>of</strong> treatment services <strong>of</strong>fered (especially substanceabuse counsell<strong>in</strong>g, medical and family services).The T<strong>SA</strong> (revised version) is a six-page questionnaire with 41 questions, many <strong>of</strong> whichrequire multiple responses. Information is collected from a number <strong>of</strong> doma<strong>in</strong>s <strong>in</strong>clud<strong>in</strong>gtreatment facility characteristics, service delivery characteristics, types <strong>of</strong> treatmentservices <strong>of</strong>fered, services to improve access to and retention <strong>in</strong> treatment, characteristics<strong>of</strong> clients served, staff<strong>in</strong>g characteristics, organisational environment, and monitor<strong>in</strong>g andevaluation activities. The T<strong>SA</strong> is directed at key <strong>in</strong>formants from treatment programmes,such as cl<strong>in</strong>ical/treatment programme managers or treatment directors. The T<strong>SA</strong> collectsself-report <strong>in</strong>formation <strong>in</strong> English and takes approximately 30 m<strong>in</strong>utes to complete.2.6. DATA COLLECTIONThe field period ran from October 2007 to February 2008. <strong>Treatment</strong> programmemanagers and/or facility directors <strong>of</strong> all the treatment facilities <strong>in</strong> the sampl<strong>in</strong>g framewere contacted telephonically, <strong>in</strong>formed about the study, and asked to participate. Datacollection packets, <strong>in</strong>clud<strong>in</strong>g the T<strong>SA</strong>, a two-page guidel<strong>in</strong>e for completion <strong>of</strong> the T<strong>SA</strong>,and a cover<strong>in</strong>g letter expla<strong>in</strong><strong>in</strong>g the purpose <strong>of</strong> the audit, were sent via post, fax, or emailto the identified key <strong>in</strong>formants at participat<strong>in</strong>g facilities <strong>in</strong> October 2007. Questionnairepacks were mailed with self-addressed, stamped return envelopes. Dur<strong>in</strong>g the datacollection phase, the pr<strong>in</strong>cipal <strong>in</strong>vestigator was available to answer facilities’ questionsabout the audit. Telephone calls were made to all facilities to check whether they hadreceived the T<strong>SA</strong>. Thereafter, rem<strong>in</strong>der and follow-up telephone calls were made to all23
non-respond<strong>in</strong>g facilities. Follow-up calls to non-respond<strong>in</strong>g facilities and for correction<strong>of</strong> miss<strong>in</strong>g data cont<strong>in</strong>ued through February 2008. Non-respondents were followed uptelephonically on at least four occasions.2.7. DATA ANALYSISStatistics for this study were computed us<strong>in</strong>g the Statistical Package for the SocialSciences (Norusis/SPSS Inc., 2005). Descriptive statistics were calculated for alltreatment service-, service delivery-, client-, staff-, and access-oriented variables. Wherepossible, facilities were stratified by prov<strong>in</strong>ce.2.8. DATA CONSIDERATIONS2.8.1. Response ratesQuestionnaires were sent to 17 facilities <strong>in</strong> Free State, Limpopo, Mpumalanga, NorthWest and Northern Cape believed to <strong>of</strong>fer substance abuse treatment services. Of thesefacilities, 5.9% (1) was found to be <strong>in</strong>eligible for the survey as they did not meet thecriteria for <strong>in</strong>clusion and a further 11.8% (2) had closed down. Through snowball<strong>in</strong>g, 3(17.6%) new centres were identified that fit the criteria for <strong>in</strong>clusion <strong>in</strong> the study. In total,17 facilities were eligible for participation <strong>in</strong> the study, <strong>of</strong> which 14 facilities (82.4%)returned the T<strong>SA</strong> questionnaire. The f<strong>in</strong>al sample (N = 14) <strong>in</strong>cluded 6 facilities <strong>in</strong> FreeState, 2 <strong>in</strong> Limpopo, 3 <strong>in</strong> Mpumalanga, 1 <strong>in</strong> North West and 2 <strong>in</strong> Northern Cape. Despitenumerous attempts over a 6 month period <strong>in</strong> contact<strong>in</strong>g and <strong>of</strong>fer<strong>in</strong>g assistance with thequestionnaire, one facility, surrounded by controversy, <strong>in</strong>dicated that the T<strong>SA</strong> was “toodifficult to complete”. Concrete feedback <strong>in</strong> terms <strong>of</strong> difficulties with specific questionswas not forthcom<strong>in</strong>g. Flexible dates for return <strong>of</strong> the T<strong>SA</strong> were ma<strong>in</strong>ta<strong>in</strong>ed <strong>in</strong> order toencourage participation <strong>in</strong> the audit and accommodate the schedules <strong>of</strong> <strong>in</strong>dividualscomplet<strong>in</strong>g the T<strong>SA</strong>.2.8.2. Quality assurance and item non-responseAll questionnaires were reviewed for <strong>in</strong>consistencies and miss<strong>in</strong>g data. Telephone callswere made to facilities to obta<strong>in</strong> miss<strong>in</strong>g data and to clarify unclear responses. Carefuledit<strong>in</strong>g and extensive follow-up greatly reduced item non-response.24
2.8.3. Further data considerations and limitationsCerta<strong>in</strong> procedural considerations and data limitations must be taken <strong>in</strong>to account when<strong>in</strong>terpret<strong>in</strong>g data from this audit:• This audit attempted to obta<strong>in</strong> responses from all known treatment facilities <strong>in</strong> FreeState, Limpopo, Mpumalanga, North West and Northern Cape. It is; however, avoluntary survey and no adjustment was made for facilities that did not respond.• This audit provides <strong>in</strong>formation on the substance abuse treatment system and itsclients for the specified reference period only (i.e. the 12 months preced<strong>in</strong>g the audit).Client counts reported here are estimated counts only and do not represent annualtotals.• The T<strong>SA</strong> collects data about treatment facilities and not about <strong>in</strong>dividual clients.Data on clients represent an aggregate <strong>of</strong> clients <strong>in</strong> treatment for each participat<strong>in</strong>gfacility.• Multiple responses were allowed for certa<strong>in</strong> variables (e.g. type <strong>of</strong> services provided).• The T<strong>SA</strong> collects self-report data from key <strong>in</strong>formants at participat<strong>in</strong>g facilities.Social desirability processes and political concerns about ways <strong>in</strong> which f<strong>in</strong>d<strong>in</strong>gs willbe used may have <strong>in</strong>fluenced facility responses on specific items. The T<strong>SA</strong> (revisedversion) <strong>in</strong>corporates a number <strong>of</strong> validity checks. For example, several differentlyworded questions are used to exam<strong>in</strong>e client retention rates.25
PART 3: KEY RESULTS3.1. CHARACTERISTICS OF SUBSTANCE ABUSE TREATMENTFACILITIES IN FREE STATE, LIMPOPO, MPUMALANGA, NORTHWEST AND NORTHERN CAPE<strong>Treatment</strong> services research has shown that the organisational features <strong>of</strong> treatmentfacilities impact on the types <strong>of</strong> services available and the quality <strong>of</strong> services provided toclients (Lee et al., 2001). The follow<strong>in</strong>g section describes a number <strong>of</strong> organisationalfeatures <strong>in</strong>clud<strong>in</strong>g <strong>in</strong>tensity <strong>of</strong> treatment provided, ownership status, and facilityaffiliation.3.1.1. <strong>Treatment</strong> facility pr<strong>of</strong>ile by <strong>in</strong>tensity <strong>of</strong> careCore f<strong>in</strong>d<strong>in</strong>gs:• 37.5% <strong>of</strong> facilities <strong>in</strong> Free State, Limpopo, Mpumalanga, North West andNorthern Cape provide primarily <strong>in</strong>patient treatment services• 87.5% <strong>of</strong> facilities <strong>in</strong> Free State, Limpopo, Mpumalanga, North West andNorthern Cape <strong>of</strong>fer ma<strong>in</strong>ly outpatient treatment services<strong>Substance</strong> abuse treatment facilities <strong>in</strong> South Africa provide services at different levels <strong>of</strong><strong>in</strong>tensity. These <strong>in</strong>clude <strong>in</strong>patient / residential treatment and outpatient programmes.There are no <strong>in</strong>patient programmes <strong>in</strong> Northern Cape and Limpopo (Figure 1). Overall,the majority <strong>of</strong> facilities <strong>in</strong> the various prov<strong>in</strong>ces provide outpatient services (Figure 2).26
Figure 1. Inpatient <strong>in</strong>tensity <strong>of</strong> care by prov<strong>in</strong>ce (%).0%24%Free StateLimpopo0%Mpumalanga57%North West19%Northern CapeFigure 2. Outpatient <strong>in</strong>tensity <strong>of</strong> care by prov<strong>in</strong>ce (%).22%19%Free StateLimpopoMpumalanga22%22%North WestNorthern Cape15%3.1.2. <strong>Treatment</strong> facility pr<strong>of</strong>ile by facility ownershipCore f<strong>in</strong>d<strong>in</strong>gs:• 85.7% <strong>of</strong> facilities are privately owned• Of the privately-owned facilities, 100.0% have non-pr<strong>of</strong>it status• 14.3% <strong>of</strong> facilities are state owned – 1 <strong>in</strong> Free State and 1 <strong>in</strong> Mpumalanga27
Facility ownership (understood <strong>in</strong> terms <strong>of</strong> pr<strong>of</strong>it status and public / private orientation)has been shown to impact on access to substance abuse treatment (Lee et al., 2001). Most<strong>of</strong> the facilities (85.7%) that participated <strong>in</strong> this study are privately owned. Of the 12privately owned facilities, 100.0% have non-pr<strong>of</strong>it ownership status. There are no forpr<strong>of</strong>itfacilities located <strong>in</strong> these prov<strong>in</strong>ces. The rema<strong>in</strong><strong>in</strong>g 2 facilities (14.3%) are stateownedfacilities – 1 <strong>in</strong> Free State and the other <strong>in</strong> Mpumalanga. The majority <strong>of</strong> nonpr<strong>of</strong>itfacilities are located <strong>in</strong> Free State (Figure 3).Figure 3. Non-pr<strong>of</strong>it status by prov<strong>in</strong>ce (%).403535.73025201514.3 14.314.3107.150Free State Limpopo Mpumalanga North West Northern Cape3.1.3. <strong>Treatment</strong> facility pr<strong>of</strong>ile by state affiliationCore f<strong>in</strong>d<strong>in</strong>gs:• The majority <strong>of</strong> facilities are registered with the Department <strong>of</strong> Social Development• Overall, only 14.3% <strong>of</strong> facilities are not registeredOverall, 85.7% (12) <strong>of</strong> the treatment facilities are registered with the Department <strong>of</strong>Social Development (DoSD) and 14.3% (2) are not registered. Both unregistered facilitiesare <strong>in</strong> the Free State.3.1.4. <strong>Treatment</strong> facility pr<strong>of</strong>ile by <strong>in</strong>tensity <strong>of</strong> care and facility ownershipCore f<strong>in</strong>d<strong>in</strong>gs:• Overall, the majority <strong>of</strong> facilities are private non-pr<strong>of</strong>it facilities provid<strong>in</strong>g outpatienttreatment28
S<strong>in</strong>ce there is a large overlap between the <strong>in</strong>tensity <strong>of</strong> care provided and ownership status,a new variable was created that comb<strong>in</strong>ed these <strong>in</strong>dividual variables. The majority(64.3%; 9) are private, non-pr<strong>of</strong>it facilities <strong>of</strong>fer<strong>in</strong>g outpatient services, 7.1% (1) areprivate, non-pr<strong>of</strong>it facilities provid<strong>in</strong>g <strong>in</strong>patient treatment, 14.3% (2) are private nonpr<strong>of</strong>itfacilities provid<strong>in</strong>g <strong>in</strong>patient and outpatient services, 7.1% (1) are state outpatientfacilities and 7.1% (1) are state <strong>in</strong>patient facilities (Figure 4).Figure 4. Intensity <strong>of</strong> care and ownership for the total sample (%).7%7%Non-pr<strong>of</strong>it outpatient14%Non-pr<strong>of</strong>it <strong>in</strong>patientNon-pr<strong>of</strong>it <strong>in</strong> and outpatient7%65%State <strong>in</strong>patientState outpatientOrganisational characteristics (comb<strong>in</strong>ed ownership and <strong>in</strong>tensity <strong>of</strong> care) were comparedacross prov<strong>in</strong>ces (Table 1). In Free State, private non-pr<strong>of</strong>it outpatient services accountfor the highest proportion <strong>of</strong> facilities.29
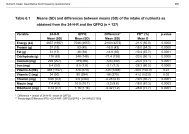
Table 1. Facility ownership and <strong>in</strong>tensity <strong>of</strong> care by prov<strong>in</strong>ce.Facility ownership Free State Limpopo Mpumalanga North West Northern Cape/Intensity <strong>of</strong> careN % N % N % N % N %Private non-pr<strong>of</strong>it 3 50.0 2 100.0 2 66.7 -- -- 2 100.0outpatientPrivate non-pr<strong>of</strong>it 1 16.7 -- -- -- -- -- -- -- --<strong>in</strong>patientPrivate non-pr<strong>of</strong>it 1 16.7 -- -- -- -- 1 100.0 -- --<strong>in</strong>patient &outpatientState outpatient 1 16.7 -- -- -- -- -- -- -- --State <strong>in</strong>patient -- -- -- -- 1 33.3 -- -- -- --Total 6 100.0 2 100.0 3 100.0 1 100.0 2 100.03.2. PROFILE OF CLIENTS SERVED BY SUBSTANCE ABUSETREATMENT FACILITIES IN FREE STATE, LIMPOPO,MPUMALANGA, NORTH WEST AND NORTHERN CAPEThis section describes the demographic pr<strong>of</strong>ile <strong>of</strong> the clients served, <strong>in</strong> the 12 monthsprior to the audit, by substance abuse treatment facilities <strong>in</strong> Free State, Limpopo,Mpumalanga, North West and Northern Cape.3.2.1. Demographic pr<strong>of</strong>ile <strong>of</strong> clients at treatment facilities <strong>in</strong> Free State, Limpopo,Mpumalanga, North West and Northern CapeCore f<strong>in</strong>d<strong>in</strong>gs:• <strong>Treatment</strong> facilities provide services to more males than females• Compared to other age cohorts, clients treated at substance abuse treatment facilities aremost likely to be between 20 and 29 years <strong>of</strong> age• Black/African clients are underrepresented and White clients are overrepresented atsubstance abuse treatment facilities <strong>in</strong> all participat<strong>in</strong>g prov<strong>in</strong>ces – except Northern CapeFor the overall sample, the estimated proportion <strong>of</strong> male clients ranges from 20.0% to100.0% <strong>of</strong> the total client population (χ = 72.1, SD = 18.7). In contrast, the estimatedproportion <strong>of</strong> female clients ranges from 0.0% to 80.0% (χ = 27.9, SD = 18.7) (Table 2).In terms <strong>of</strong> race, the estimated proportion <strong>of</strong> White clients ranges from 3.0% to 70.0% <strong>of</strong>30
the total client population (χ = 43.3, SD = 18.9) followed by the estimated proportion <strong>of</strong>Black/African clients rang<strong>in</strong>g from 0.0% to 70.0% (χ = 34.3, SD = 20.2). Overall, clientstreated at substance abuse treatment facilities were most likely to be between 20 and 29years <strong>of</strong> age (χ = 35.6, SD = 17.3).Table 2. Demographic pr<strong>of</strong>ile <strong>of</strong> clients at substance abuse treatment facilities.Free State(N = 7)Limpopo(N = 2)Mpumalanga(N = 3)North West(N = 2)NorthernCapeOverall(N = 16)(N = 2)χ SD χ SD χ SD χ SD χ SD χ SD% <strong>of</strong> clients by genderMales 70.1 27.2 71.0 12.7 75.9 8.7 71.0 0 75.5 20.5 72.1 18.7Females 29.9 27.2 29.0 12.7 24.1 8.7 29.0 0 24.5 20.5 27.9 18.7% <strong>of</strong> clients by age
Figure 5.Comparison <strong>of</strong> race pr<strong>of</strong>ile <strong>of</strong> clients at treatment facilities with censusdata (1995 3 ) for Free State (%).90808470605040302010050.631.717.5132.70.2 0Black/African White Coloured Asian/IndianIn treatmentCensus3 Statistics South Africa (1998a)Figure 6.Comparison <strong>of</strong> race pr<strong>of</strong>ile <strong>of</strong> clients at treatment facilities with censusdata (2006 4 ) for Limpopo (%).12010097.380604048442002.4 4.5 3.50.2 0.2Black/African White Coloured Asian/IndianIn treatmentCensus4 Statistics South Africa (2006b)32
Figure 7.Comparison <strong>of</strong> race pr<strong>of</strong>ile <strong>of</strong> clients at treatment facilities with censusdata (2001 5 ) for Mpumalanga (%).1009092.48070605048.5 46.64030201006.53.70.7 1.2 0.4Black/African White Coloured Asian/IndianIn treatmentCensus5 Statistics South Africa (2006c)Figure 8.Comparison <strong>of</strong> race pr<strong>of</strong>ile <strong>of</strong> clients at treatment facilities with censusdata (1995 6 ) for North West (%).1009091.4807060504940302010031146.761.6 0.3Black/African White Coloured Asian/IndianIn treatmentCensus6 Statistics South Africa (1998b)33
Figure 9.Comparison <strong>of</strong> race pr<strong>of</strong>ile <strong>of</strong> clients at treatment facilities with censusdata (1997 6 ) for Northern Cape (%).90808170605450403020100301611.56.51 0Black/African White Coloured Asian/IndianIn treatmentCensus7 Statistics South Africa (1998c)3.3. TREATMENT CAPACITY AND SERVICE UTILI<strong>SA</strong>TIONThis section describes the number <strong>of</strong> clients treated <strong>in</strong> a typical month, treatmentcapacity, and the extent to which capacity is utilised.Core f<strong>in</strong>d<strong>in</strong>gs:• <strong>Facilities</strong> <strong>in</strong> Mpumalanga treat a greater number <strong>of</strong> clients and have more treatment capacity thanfacilities <strong>in</strong> other prov<strong>in</strong>ces• North West and Limpopo have the highest treatment occupancy rates• North West has the highest proportion <strong>of</strong> clients that complete treatment – 78.0%3.3.1. Average number <strong>of</strong> clients treated per month <strong>in</strong> Free State, Limpopo,Mpumalanga, North West and Northern CapeOverall, the typical number <strong>of</strong> clients receiv<strong>in</strong>g substance abuse treatment per month overthe past year ranges from 6 to 721 (χ = 105.4, SD = 172.9). Of these facilities, 18.8%treat less than 20 clients per month, with the majority <strong>of</strong> facilities (38.0%) treat<strong>in</strong>g morethan 50 clients per month.When prov<strong>in</strong>cial data are considered separately, the typical number <strong>of</strong> clients receiv<strong>in</strong>gsubstance abuse services per month <strong>in</strong> Free State ranges from 6 to 165 (χ = 69.0, SD =64.2). In Limpopo, the typical number <strong>of</strong> clients receiv<strong>in</strong>g substance abuse treatment34
services per month ranges from 13 to 50 (χ = 32.0, SD = 26.2). In Mpumalanga, thetypical number <strong>of</strong> clients receiv<strong>in</strong>g substance abuse treatment services per month rangesfrom 33 to 721 (χ = 268.0, SD = 392.4). In North West, the typical number <strong>of</strong> clientsreceiv<strong>in</strong>g substance abuse treatment services per month is 33 (χ = 33.0, SD = 0.0). F<strong>in</strong>ally<strong>in</strong> Northern Cape, the typical number <strong>of</strong> clients receiv<strong>in</strong>g substance abuse treatmentservices per month ranges from 96 to 175 (χ = 136.0, SD = 55.9).3.3.2. <strong>Treatment</strong> capacity at substance abuse treatment facilitiesIn this study, treatment capacity refers to the number <strong>of</strong> treatment slots available to treatclients. For the overall sample, annual treatment capacity ranges from 10 to 862 slots (χ= 225.2, SD = 243.5). When prov<strong>in</strong>cial data are considered separately, annual treatmentcapacity ranges from 10 to 120 slots <strong>in</strong> Free State (χ = 62.6, SD = 43.2); from 48 to 105slots <strong>in</strong> Limpopo (χ = 76.5, SD = 40.3); from 180 to 862 slots <strong>in</strong> Mpumalanga (χ = 479.0,SD = 348.7); and 450 slots <strong>in</strong> both North West and Northern Cape (χ = 450.0, SD = 0.0).3.3.3. <strong>Substance</strong> abuse treatment occupancy ratesFor the overall sample, the average proportion <strong>of</strong> occupied treatment slots ranges from12.0% to 100.0% (χ = 69.4, SD = 27.8). North West has the highest average proportion <strong>of</strong>occupied treatment slots, 97.0% (χ = 97.0, SD = 0.0) (Table 4).Table 4. Proportion <strong>of</strong> treatment slots occupied by prov<strong>in</strong>ce (%).Prov<strong>in</strong>ce M<strong>in</strong>. Max. χ SDFree State 12 100 67.4 28.0Limpopo 90 90 90.0 0.0Mpumalanga 25 60 38.3 18.9North West 97 97 97.0 0.0Northern Cape 80 80 80.0 0.03.3.4. Wait<strong>in</strong>g period for treatment services at substance abuse facilities <strong>in</strong> FreeState, Limpopo, Mpumalanga, North West and Northern CapeFor the overall sample, 46.7% (7) facilities use a wait<strong>in</strong>g list when full to capacity (1facility did not provide a response). When wait<strong>in</strong>g lists were exam<strong>in</strong>ed by prov<strong>in</strong>ce, <strong>in</strong>Free State, 42.9% (3) <strong>of</strong> facilities use a wait<strong>in</strong>g list; 50.0% (1) <strong>in</strong> Limpopo; 33.3% (1) <strong>in</strong>35
Mpumalanga; and 100.0% (2) <strong>in</strong> North West. None <strong>of</strong> the facilities <strong>in</strong> the Northern Cape(1 no response) use a wait<strong>in</strong>g list.For the overall sample, the number <strong>of</strong> <strong>in</strong>dividuals currently on the wait<strong>in</strong>g list rangesfrom 4 to 8 (χ = 5.7, SD = 2.0). For <strong>in</strong>dividuals on the wait<strong>in</strong>g list, the wait for atreatment slot / bed ranges from 1 to 21 days (χ = 6.4, SD = 6.5).3.3.5. Rates <strong>of</strong> client retention <strong>in</strong> treatmentFor the overall sample, the estimated client retention rate ranges from 30.0% to 93.0% (χ= 70.2, SD = 17.9). When prov<strong>in</strong>cial data are considered separately, North West has thehighest proportion <strong>of</strong> clients that complete the treatment programme, namely 78.0% (χ =78.0, SD = 0.0) (Table 5).Table 5. Client retention rates by prov<strong>in</strong>ce (%).Prov<strong>in</strong>ce M<strong>in</strong>. Max. χ SDFree State 60 93 74.6 15.0Limpopo 60 75 67.5 10.6Mpumalanga 30 90 60.0 42.4North West 78 78 78.0 0.0Northern Cape 50 50 50.0 0.03.4. STAFF AND STAFF-RELATED ISSUESThis section describes the characteristics <strong>of</strong> staff employed by substance abuse treatmentfacilities <strong>in</strong> Free State, Limpopo, Mpumalanga, North West and Northern Cape. This<strong>in</strong>cludes a description <strong>of</strong> staff qualifications, pr<strong>of</strong>essional development activities, andstaff-related resources.Core f<strong>in</strong>d<strong>in</strong>gs:• <strong>Facilities</strong> <strong>in</strong> North West and Mpumalanga had the highest mean number <strong>of</strong> cl<strong>in</strong>ical staff (full-time)compared to facilities <strong>in</strong> other prov<strong>in</strong>ces• <strong>Facilities</strong> <strong>in</strong> Free State and North West did not have non-pr<strong>of</strong>essional full-time staff• <strong>Facilities</strong> <strong>in</strong> Free State and North West were more likely to have access to and employ doctors andnurses than facilities <strong>in</strong> other prov<strong>in</strong>ces36
3.4.1. Characteristics <strong>of</strong> staff at substance abuse treatment facilitiesVariations <strong>in</strong> the mean number <strong>of</strong> staff by staff<strong>in</strong>g category for the overall sample and byprov<strong>in</strong>ce are presented <strong>in</strong> Table 6. For the overall sample, the number <strong>of</strong> full-timepr<strong>of</strong>essional staff (i.e. staff responsible for treatment services) ranges from 0 to 20 people(χ = 5.4, SD = 5.2) and the total number <strong>of</strong> non-pr<strong>of</strong>essional full-time staff (such assupport staff, adm<strong>in</strong>istrators and clean<strong>in</strong>g staff) ranges from 0 to 11 (χ = 2.5, SD = 3.8).In addition to full-time staff, many facilities employ sessional pr<strong>of</strong>essionals on a parttimebasis. For the overall sample, the number <strong>of</strong> part-time staff per facility ranges from0 to 10 (χ = 2.9, SD = 3.4).Table 6. Mean number <strong>of</strong> staff per staff<strong>in</strong>g category.Staff category Free State(N = 7)Limpopo(N = 2)Mpumalanga(N = 3)North West(N = 2)Northern Cape(N = 2)Overall(N = 16)χ SD χ SD χ SD χ SD χ SD χ SDPr<strong>of</strong>essional (full-time) 3.7 3.1 1.5 0.7 10.0 8.7 11.0 0.0 3.0 1.4 5.4 5.2Non-pr<strong>of</strong>essional 0.0 0.0 0.5 0.7 3.5 0.7 0.0 0.0 0.5 0.7 2.5 3.8(full-time)Part-time staff 5.3 4.0 0.0 0.0 1.3 0.6 2.0 0.0 0.5 0.7 2.9 3.4The total number <strong>of</strong> full-time pr<strong>of</strong>essional staff ranges from 0 to 8 (χ = 3.7, SD = 3.1) <strong>in</strong>Free State; from 1 to 2 (χ = 1.5, SD = 0.7) <strong>in</strong> Limpopo; from 4 to 20 (χ = 10.0, SD = 8.7)<strong>in</strong> Mpumalanga; 11 (χ = 11.0, SD = 0.0) <strong>in</strong> North West; and from 2 to 4 (χ = 3.0, SD =1.4) <strong>in</strong> Northern Cape. The number <strong>of</strong> non-pr<strong>of</strong>essional full-time staff per facility rangesfrom 0 to 1 (χ = 0.5, SD = 0.7) <strong>in</strong> Limpopo; from 3 to 4 (χ = 3.5, SD = 0.7) <strong>in</strong>Mpumalanga; and from 0 to 1 (χ = 0.5, SD = 0.7) <strong>in</strong> Northern Cape. <strong>Facilities</strong> <strong>in</strong> FreeState and North West do not employ non-pr<strong>of</strong>essional staff on a full-time basis. Thenumber <strong>of</strong> part-time staff per facility ranges from 0 to 10 (χ = 5.3, SD = 4.0) <strong>in</strong> FreeState; from 1 to 2 (χ = 1.3, SD = 0.6) <strong>in</strong> Mpumalanga; 2 (χ = 2.0, SD = 0.0) <strong>in</strong> NorthWest; and from 0 to 1 (χ = 0.5, SD = 0.7) <strong>in</strong> Northern Cape. <strong>Facilities</strong> <strong>in</strong> Limpopo do notemploy part-time staff.Table 7 presents the mean number <strong>of</strong> staff per staff<strong>in</strong>g category for the overall sampleand by prov<strong>in</strong>ce. Few facilities employ pr<strong>of</strong>essional staff, such as psychologists andpsychiatrists. <strong>Facilities</strong> <strong>in</strong> Free State and North West are more likely to have access to37
and employ doctors and nurses than facilities <strong>in</strong> other prov<strong>in</strong>ces. Mpumalanga has thehighest mean number <strong>of</strong> support / addiction counsellors (χ = 5.3, SD = 8.4) employed atfacilities.Table 7. Mean number <strong>of</strong> staff per staff<strong>in</strong>g category.Staff categories Free State(N = 7)Limpopo(N = 2)Mpumalanga(N = 3)North West(N = 2)Northern Cape(N = 2)Overall(N = 16)χ SD χ SD χ SD χ SD χ SD χ SDPsychologists 1.2 1.5 0.0 0.0 0.7 0.6 1.0 0.0 0.0 0.0 0.7 1.0Social workers 1.9 2.2 1.0 0.0 2.7 0.6 3.0 0.0 1.5 0.7 2.0 1.5Social auxillary 0.0 0.0 0.0 0.0 0.3 0.6 2.0 0.0 1.5 0.7 0.5 0.8workersSupport/addiction 1.0 1.4 0.0 0.0 5.3 8.4 1.0 0.0 1.0 1.4 1.7 3.7counsellorsOccupational 0.0 0.0 0.0 0.0 0.0 0.0 0.0 0.0 0.0 0.0 0.0 0.0therapistsRegistered nurses 2.0 2.2 0.5 0.7 1.7 0.6 4.0 0.0 0.0 0.0 1.8 1.8Auxillary nurses 0.0 0.0 0.0 0.0 0.0 0.0 1.0 0.0 0.0 0.0 0.1 0.3Religious0.3 0.5 0.0 0.0 0.3 0.6 0.0 0.0 0.0 0.0 0.2 0.4consultantsDoctors 1.0 1.0 0.0 0.0 0.7 0.6 1.0 0.0 0.0 0.0 0.7 0.8Psychiatrists 0.4 0.5 0.0 0.0 0.0 0.0 0.0 0.0 0.0 0.0 0.2 0.4Adm<strong>in</strong>istrators 1.0 0.6 0.5 0.7 1.7 2.1 0.0 0.0 0.5 0.7 0.9 1.0Note. Numbers <strong>in</strong>clude full-time and part-time staff.3.4.2. Staff participation <strong>in</strong> pr<strong>of</strong>essional development activitiesCore f<strong>in</strong>d<strong>in</strong>gs:• A high proportion <strong>of</strong> facilities provide treatment staff with cont<strong>in</strong>uous pr<strong>of</strong>essionaldevelopment tra<strong>in</strong><strong>in</strong>g• Few facilities provide staff with external supervisionFigure 10 reflects treatment facility staff participation <strong>in</strong> pr<strong>of</strong>essional developmentactivities for the overall sample, and separately by prov<strong>in</strong>ce. A high proportion <strong>of</strong>facilities report that treatment staff participates <strong>in</strong> cont<strong>in</strong>uous pr<strong>of</strong>essional development(CPD) activities, receive ongo<strong>in</strong>g tra<strong>in</strong><strong>in</strong>g <strong>in</strong> substance abuse, and receive <strong>in</strong>ternal38
supervision. In contrast, a much smaller proportion <strong>of</strong> facilities provide treatment staffwith external supervision, which does not take place at all <strong>in</strong> Limpopo and Mpumalanga.Figure 10.120Extent to which facility staff participate <strong>in</strong> pr<strong>of</strong>essional development activities(%).10086100 100 100100 100 100 100 100 100 100 100888688948060505050 5040272014000Internal supervision External supervision CPD activities Ongo<strong>in</strong>g tra<strong>in</strong><strong>in</strong>g <strong>in</strong> substanceabuseFree State Limpopo Mpumalanga North West Northern Cape Overall3.4.3. Resources to support staff development at treatment facilitiesCore f<strong>in</strong>d<strong>in</strong>gs:• Overall, less than 30.0% <strong>of</strong> facilities provide staff with access to a substance abuse library orresource centre• A high proportion <strong>of</strong> facilities provide staff with computers and <strong>in</strong>ternet accessFigure 11 reflects the extent to which facilities provide resources to facilitate staffdevelopment for the overall sample, and separately by prov<strong>in</strong>ce. A high proportion <strong>of</strong>facilities report provid<strong>in</strong>g computers for staff use and <strong>in</strong>ternet access to staff (Figure 11).A smaller proportion <strong>of</strong> facilities provided a substance abuse-related resource centre orlibrary for staff – these resources are absent <strong>in</strong> Limpopo, North West and Northern Cape.39
Figure 11. Proportion <strong>of</strong> facilities that provide resources to support staff development (%).120100100 100 100 100100 100 100 10094 94868060402043 4333 3325 255000 0 0 0 0 0Library Resource centre Computers for staff use Internet access for staffFree State Limpopo Mpumalanga North West Northern Cape Overall3.5. ORGANI<strong>SA</strong>TIONAL ENVIRONMENT AND MANAGEMENTPRACTICESCore f<strong>in</strong>d<strong>in</strong>gs:• Overall, treatment facilities adhere to good governance practices, such as hold<strong>in</strong>g regularmanagement and staff meet<strong>in</strong>gs• 93.8% <strong>of</strong> facilities have a govern<strong>in</strong>g body or external management committee• Mpumalanga was the only prov<strong>in</strong>ce where all facilities did not compile an annual report and bus<strong>in</strong>essplan or have a govern<strong>in</strong>g body / external management committeeWe also exam<strong>in</strong>ed the proportion <strong>of</strong> facilities that implemented management practicesprescribed by the m<strong>in</strong>imum norms and standards for <strong>in</strong>patient and outpatient treatmentcentres.3.5.1. Management practices at treatment facilitiesOverall, 93.8% <strong>of</strong> treatment facilities have a govern<strong>in</strong>g body or external managementcommittee (Figure 12). The extent to which facilities implement other good governanceand management practices are displayed <strong>in</strong> Figure 12.40
In terms <strong>of</strong> client record-keep<strong>in</strong>g, while all facilities report keep<strong>in</strong>g client records, not allfacilities have staff confidentiality agreements regard<strong>in</strong>g client data. <strong>Facilities</strong> <strong>in</strong> allprov<strong>in</strong>ces have confidential <strong>in</strong>terview<strong>in</strong>g rooms (Figure 12).In terms <strong>of</strong> good governance and management practices, all facilities report keep<strong>in</strong>grecords on staff, provide staff with job descriptions, hold regular staff meet<strong>in</strong>gs, and holdregular management meet<strong>in</strong>gs (Figure 12). Despite the legal requirements <strong>of</strong> do<strong>in</strong>g so,not all facilities report compil<strong>in</strong>g an annual budget (94.0% <strong>of</strong> the sample), or develop abus<strong>in</strong>ess plan for the facility (94.0% <strong>of</strong> the sample). All facilities; however, report theannual audit<strong>in</strong>g <strong>of</strong> f<strong>in</strong>ances.Figure 12. Proportion <strong>of</strong> facilities report<strong>in</strong>g specific management practices (%).Govern<strong>in</strong>g body/externalmanagement committee94Confidential <strong>in</strong>terview rooms100Staff-client confidentialityagreements94Patient/client records100Human resource policies100Staff records100Job descriptions for staff<strong>Audit</strong>ed yearly reports onf<strong>in</strong>ances100100Yearly bus<strong>in</strong>ess plan94Compile an annual report94Regular staff meet<strong>in</strong>gs100Regular management meet<strong>in</strong>gs10091 92 93 94 95 96 97 98 99 100 101OverallBy prov<strong>in</strong>ce, the extent to which facilities implement other good governance andmanagement practices are displayed <strong>in</strong> Table 8.41
Table 8. Management practices by prov<strong>in</strong>ce.Management practicesFree State(N = 7)Limpopo(N = 2)Mpumalanga(N = 3)North West(N = 2)NorthernCapeOverall(N = 16)(N = 2)N % N % N % N % N % N %Regular management meet<strong>in</strong>gs 7 100.0 2 100.0 3 100.0 2 100.0 2 100.0 16 100.0Regular staff meet<strong>in</strong>gs 7 100.0 2 100.0 3 100.0 2 100.0 2 100.0 16 100.0Compile an annual report 7 100.0 2 100.0 2 66.7 2 100.0 2 100.0 15 93.8Yearly bus<strong>in</strong>ess plan 7 100.0 2 100.0 2 66.7 2 100.0 2 100.0 15 93.8<strong>Audit</strong>ed yearly reports on 7 100.0 2 100.0 3 100.0 2 100.0 2 100.0 16 100.0f<strong>in</strong>ancesJob descriptions for staff 7 100.0 2 100.0 3 100.0 2 100.0 2 100.0 16 100.0Staff records 7 100.0 2 100.0 3 100.0 2 100.0 2 100.0 16 100.0Human resource policies 7 100.0 2 100.0 3 100.0 2 100.0 2 100.0 16 100.0Patient/client records 7 100.0 2 100.0 3 100.0 2 100.0 2 100.0 16 100.0Staff-client confidentiality 7 100.0 2 100.0 3 100.0 2 100.0 1 50.0 15 93.8agreementsConfidential <strong>in</strong>terview rooms 7 100.0 2 100.0 3 100.0 2 100.0 2 100.0 16 100.0Govern<strong>in</strong>g body/externalmanagement committee7 100.0 2 100.0 2 66.7 2 100.0 2 100.0 15 93.83.6. PROFILE OF SERVICES PROVIDED BY SUBSTANCE ABUSETREATMENT FACILITIESThis section describes the types <strong>of</strong> treatment services provided by facilities <strong>in</strong> Free State,Limpopo, Mpumalanga, North West and Northern Cape. We focus on both treatmentservices proper and ancillary health and welfare services. Ancillary services are thoseservices directed towards problems that are associated with substance dependence (e.g.psychological dysfunction), whereas treatment services proper focuses on elim<strong>in</strong>at<strong>in</strong>g orreduc<strong>in</strong>g the substance use disorder.42
Core f<strong>in</strong>d<strong>in</strong>gs:• Compared to the provision <strong>of</strong> core addiction services, a smaller proportion <strong>of</strong> facilities provide ancillary mentalhealth or medical services• Just over half <strong>of</strong> the facilities conduct psychological evaluations and less than 15.0% conduct psychiatricassessments <strong>of</strong> clients• A small proportion <strong>of</strong> facilities <strong>of</strong>fer mental health-related counsell<strong>in</strong>g services• Almost all facilities <strong>of</strong>fer family therapy and family education services• A quarter <strong>of</strong> facilities rout<strong>in</strong>ely test clients for hepatitis and other <strong>in</strong>fectious diseases or conduct harm-reduction<strong>in</strong>terventions target<strong>in</strong>g <strong>in</strong>jection drug users3.6.1. Pr<strong>of</strong>ile <strong>of</strong> treatment services <strong>of</strong>feredAll facilities (100.0%) <strong>of</strong>fer some form <strong>of</strong> addiction counsell<strong>in</strong>g service, with a smallerpercentage (68.8%) <strong>of</strong>fer<strong>in</strong>g some type <strong>of</strong> post-treatment aftercare service (Figure 13). Incontrast, only half <strong>of</strong> the facilities (50.0%) provide detoxification services. Only 1facility (6.3%) provides psychiatric services.By prov<strong>in</strong>ce, 3 (42.9%) facilities <strong>in</strong> Free State, 1 (50.0%) <strong>in</strong> Limpopo, 2 (66.7%) <strong>in</strong>Mpumalanga and 2 (100.0%) <strong>in</strong> North West provide detoxification services. The onlyfacility provid<strong>in</strong>g psychiatric services is located <strong>in</strong> the Free State. Aftercare services areavailable at 5 (71.4%) facilities <strong>in</strong> the Free State, 1 (50.0%) facility <strong>in</strong> Limpopo, 2(66.7%) <strong>in</strong> Mpumalanga, 2 (100.0%) <strong>in</strong> North West and 1 (50.0%) <strong>in</strong> Northern Cape.Figure 13. Proportion <strong>of</strong> treatment facilities provid<strong>in</strong>g treatment services (%).1201001008069605040200Detoxification Counsell<strong>in</strong>g Psychiatric services Aftercare6Overall43
3.6.2. Provision <strong>of</strong> assessment servicesWhen assessment services were considered, more than 80.0% <strong>of</strong> facilities complete achemical history for each new client (Figure 14). Overall, 81.3% <strong>of</strong> facilities complete abio-psychosocial history for each client. In contrast, just over half <strong>of</strong> the facilities(56.3%) conduct psychological evaluations and 12.5% <strong>of</strong> facilities assess clients forpsychiatric disorders (Figure 14).By prov<strong>in</strong>ce, 6 (85.7%) facilities <strong>in</strong> Free State, 2 (100.0%) <strong>in</strong> Limpopo, 3 (100.0%) <strong>in</strong>Mpumalanga, 2 (100.0%) <strong>in</strong> North West and 1 (50.0%) <strong>in</strong> Northern Cape complete achemical history for each new client. In terms <strong>of</strong> complet<strong>in</strong>g a bio-psychosocial historyfor each client, 6 (85.7%) facilities <strong>in</strong> Free State, 1 (50.0%) <strong>in</strong> Limpopo, 3 (100.0%) <strong>in</strong>Mpumalanga, 2 (100.0%) <strong>in</strong> North West and 1 (50.0%) <strong>in</strong> Northern Cape do so.Psychological evaluations are conducted <strong>in</strong> 3 <strong>of</strong> the prov<strong>in</strong>ces, namely 6 (85.7%) <strong>of</strong> thefacilities <strong>in</strong> Free State, 1 (50.0%) <strong>in</strong> Limpopo and 2 (100.0%) <strong>in</strong> North West. In contrast,psychiatric assessments are only conducted by 2 facilities <strong>in</strong> Free State (28.6%).Figure 14. Proportion <strong>of</strong> treatment facilities provid<strong>in</strong>g assessment services (%).10080604020088815613Chemical history Bio-psychosocial history Psychological evaluation Psychiatric assessmentsOverall3.6.3. <strong>Substance</strong> abuse counsell<strong>in</strong>g servicesAll <strong>of</strong> the facilities (100.0%) report provid<strong>in</strong>g one-to-one/<strong>in</strong>dividual substance abusecounsell<strong>in</strong>g services, substance abuse counsell<strong>in</strong>g services <strong>in</strong> a group format as well aslife skills development services (Figure 15). A smaller proportion <strong>of</strong> facilities providepsychoeducational lectures (87.5%) and <strong>of</strong>fer mental health-related counsell<strong>in</strong>g services(68.8%). When specific substance abuse treatment modalities used by facilities dur<strong>in</strong>gsubstance abuse counsell<strong>in</strong>g were considered, we found that 37.5% <strong>of</strong> facilities report44
us<strong>in</strong>g 12-step approaches, 75.0% report us<strong>in</strong>g cont<strong>in</strong>gency management, 93.8% reportus<strong>in</strong>g motivational <strong>in</strong>terview<strong>in</strong>g techniques, and 50.0% report us<strong>in</strong>g cognitivebehavioural therapy (CBT) techniques (Figure 15). A small proportion <strong>of</strong> facilities (6.3%)<strong>of</strong>fer alternative therapies (such as aromatherapy), provide self-help/support groups(37.5%) (for example Narcotics Anonymous [NA] and Alcoholics Anonymous [AA]) andprovide occupational therapy (31.3%).Figure 15.Proportion <strong>of</strong> treatment facilities provid<strong>in</strong>g substance abuse counsell<strong>in</strong>gservices (%).Occupational therapy31Self-help/support groups38Alternative therapies6Life skills100Mental health counsell<strong>in</strong>g69Psychoeducational lectures88Cont<strong>in</strong>gency management7512-step counsell<strong>in</strong>g38Motivational <strong>in</strong>terview<strong>in</strong>g94CBT counsell<strong>in</strong>g50Group counsell<strong>in</strong>gIndividual counsell<strong>in</strong>g1001000 20 40 60 80 100 120OverallOverall, equal proportions <strong>of</strong> facilities (37.5%) use 12-step approaches and provide selfhelp/supportgroups; however, the distribution <strong>of</strong> these facilities across prov<strong>in</strong>ces is notthe same (Table 9). <strong>Facilities</strong> <strong>in</strong> 2 prov<strong>in</strong>ces report us<strong>in</strong>g 12-step approaches, namely FreeState (71.4%) and Mpumalanga (33.3%) whereas self-help/support groups are available<strong>in</strong> Free State (57.1%) and Limpopo (100.0%). <strong>Facilities</strong> <strong>in</strong> Free State, Limpopo andMpumalanga provide mental health-related counsell<strong>in</strong>g services. Compared to facilities<strong>in</strong> other prov<strong>in</strong>ces, alternative therapies and occupational therapy are only available <strong>in</strong> theFree State. <strong>Facilities</strong> <strong>in</strong> Limpopo and Northern Cape do not provide CBT counsell<strong>in</strong>g.45
Table 9. Proportion <strong>of</strong> facilities provid<strong>in</strong>g counsell<strong>in</strong>g services by prov<strong>in</strong>ce.Types <strong>of</strong> counsell<strong>in</strong>gservices: Format andFree State(N = 7)Limpopo(N = 2)Mpumalanga(N = 3)North West(N = 2)NorthernCapeOverall(N = 16)modalities(N = 2)N % N % N % N % N % N %Individual suds counsell<strong>in</strong>g 7 100.0 2 100.0 3 100.0 2 100.0 2 100.0 16 100.0Group suds counsell<strong>in</strong>g 7 100.0 2 100.0 3 100.0 2 100.0 2 100.0 16 100.0CBT counsell<strong>in</strong>g 5 71.4 0 0 1 33.3 2 100.0 0 0 8 50.0Motivational <strong>in</strong>terview<strong>in</strong>g 7 100.0 2 100.0 3 100.0 2 100.0 1 50.8 15 93.812-step counsell<strong>in</strong>g 5 71.4 0 0 1 33.3 0 0 0 0 6 37.5Cont<strong>in</strong>gency management 6 85.7 2 100.0 2 66.7 2 100.0 0 0 12 75.0Psychoeducational lectures 6 85.7 2 100.0 3 100.0 2 100.0 1 50.0 14 87.5Mental health counsell<strong>in</strong>g 7 100.0 2 100.0 2 66.7 0 0 0 0 11 68.8Life skills 7 100.0 2 100.0 3 100.0 2 100.0 2 100.0 16 100.0Alternative therapies 1 14.3 0 0 0 0 0 0 0 0 1 6.3Self-help/support groups 4 57.1 2 100.0 0 0 0 0 0 0 6 37.5Occupational therapy 5 71.4 0 0 0 0 0 0 0 0 5 31.33.6.4. Provision <strong>of</strong> family servicesAlmost all facilities <strong>of</strong>fer family therapy (93.8%) and family education services (93.8%)to their clients (Figure 16). For the most part, family therapy consists <strong>of</strong> one familysession and is used to gather collateral <strong>in</strong>formation on the present<strong>in</strong>g client or educate thefamily about addiction. These family <strong>in</strong>terventions tend not to address familydysfunction. A smaller proportion <strong>of</strong> facilities also <strong>of</strong>fer family assessment services(81.3%), or marital and couple counsell<strong>in</strong>g services (87.5%).By prov<strong>in</strong>ce, all facilities provide family therapy services, with the exception <strong>of</strong> 1 facility<strong>in</strong> Northern Cape (50.0%). Similarly, all facilities provide family education services, withthe exception <strong>of</strong> 1 facility <strong>in</strong> Free State (14.3%). One facility <strong>in</strong> Northern Cape (50.0%)and 1 facility <strong>in</strong> Free State (14.3%) do not <strong>of</strong>fer marital and couple counsell<strong>in</strong>g services.Family assessments are conducted <strong>in</strong> Free State (71.4%), Limpopo (50.0%), Mpumalanga(100.0%), North West (100.0%) and Northern Cape (100.0%).46
Figure 16. Proportion <strong>of</strong> treatment facilities provid<strong>in</strong>g family services (%).9594 9490888580817570Marital therapy Family therapy Family education Family assessmentOverall3.6.5. Provision <strong>of</strong> health and medical servicesWith regard to ancillary medical services, a large proportion <strong>of</strong> facilities conduct a fullmedical history <strong>of</strong> clients (81.3%) (Figure 17). A smaller proportion conduct physicalexam<strong>in</strong>ations <strong>of</strong> clients (62.5%); provide clients with psychiatric medication (50.0%);provide clients with substitution medications such as methadone, subutex and antabuse(37.5%); or <strong>of</strong>fer detoxification services (56.3%).Regard<strong>in</strong>g medical harm-reduction <strong>in</strong>terventions, a quarter <strong>of</strong> facilities rout<strong>in</strong>ely testclients for hepatitis and other <strong>in</strong>fectious diseases or conduct harm-reduction <strong>in</strong>terventionsamong <strong>in</strong>jection drug users (IDU) (Figure 17). Only 37.5% <strong>of</strong> facilities provide HIV riskreduction <strong>in</strong>terventions (such as test<strong>in</strong>g and counsell<strong>in</strong>g) onsite.47
Figure 17.908180Proportion <strong>of</strong> substance abuse treatment facilities provid<strong>in</strong>g health services(%).7060506356504038383025 2520100Medical historyPhysicalexam<strong>in</strong>ationDetoxificationProvision <strong>of</strong>psychiatricmedicationProvision <strong>of</strong>substitutionmedicationHarm reduction(IDU)Test<strong>in</strong>g for<strong>in</strong>fectiousdiseasesHIV test<strong>in</strong>g andcounsell<strong>in</strong>gOverallBy prov<strong>in</strong>ce, facilities <strong>in</strong> the Northern Cape do not provide ancillary medical services ormedical harm-reduction <strong>in</strong>terventions (Table 10). Harm reduction <strong>in</strong>terventions among<strong>in</strong>jection drug users are only conducted <strong>in</strong> Free State. Test<strong>in</strong>g for hepatitis and other<strong>in</strong>fectious diseases rout<strong>in</strong>ely occurs <strong>in</strong> Free State and Mpumalanga.Table 10. Proportion <strong>of</strong> facilities provid<strong>in</strong>g medical services by prov<strong>in</strong>ce.Types <strong>of</strong> ancillary healthservices providedFree State(N = 7)Limpopo(N = 2)Mpumalanga(N = 3)North West(N = 2)NorthernCapeOverall(N = 16)(N = 2)N % N % N % N % N % N %Medical history 6 85.7 2 100.0 3 100.0 2 100.0 0 0 13 81.3Physical exam<strong>in</strong>ation 5 71.4 0 0 3 100.0 2 100.0 0 0 10 62.5Detoxification services 3 42.9 2 100.0 2 66.7 2 100.0 0 0 9 56.3Psychiatric medication 4 57.1 1 50.0 1 33.3 2 100.0 0 0 8 50.0Substitution medication 4 57.1 1 50.0 1 33.3 0 0 0 0 6 37.5Harm reduction (IDU) 4 57.1 0 0 0 0 0 0 0 0 4 25.0Test for <strong>in</strong>fectious diseases 3 42.9 0 0 1 33.3 0 0 0 0 4 25.0HIV test<strong>in</strong>g/counsell<strong>in</strong>g 2 28.6 1 50.0 3 100.0 0 0 0 0 6 37.548
3.7. ADDRESSING BARRIERS TO TREATMENT ENTRY FORVULNERABLE GROUPSThis section describes the extent to which substance abuse treatment facilities targetbarriers to treatment entry for clients from historically underserved groups. Theseactivities are grouped <strong>in</strong>to (i) practices that improve awareness <strong>of</strong> substance abusetreatment options, (ii) practices that address logistical barriers such as f<strong>in</strong>ance ortransport, and (iii) practices that address cultural and l<strong>in</strong>guistic barriers to treatment entry.For parts (i) and (ii) responses were grouped <strong>in</strong>to four categories, namely: never, rarely(once or twice per year), sometimes (once every 3-4 months) and rout<strong>in</strong>ely (at least oncea month).Core f<strong>in</strong>d<strong>in</strong>gs:• Outreach <strong>in</strong> disadvantaged areas is rout<strong>in</strong>ely conducted by 87.5% <strong>of</strong> facilities• <strong>Facilities</strong> <strong>in</strong> Mpumalanga and North West are the most likely to conduct any form <strong>of</strong>outreach• In terms <strong>of</strong> logistic barriers, most treatment facilities do not provide transport services• <strong>Facilities</strong> <strong>in</strong> Free State are more likely to provide transport services both to the client andfamily• In terms <strong>of</strong> affordability barriers, 75.0% <strong>of</strong> facilities rout<strong>in</strong>ely have free treatmentslots/beds available• In terms <strong>of</strong> cultural and l<strong>in</strong>guistic barriers, 81.3% <strong>of</strong> facilities employ African languagespeak<strong>in</strong>gtherapists3.7.1. Practices that improve awareness <strong>of</strong> substance abuse treatment optionsOverall, 43.8% <strong>of</strong> facilities report conduct<strong>in</strong>g awareness campaigns relat<strong>in</strong>g to substanceabuse on a rout<strong>in</strong>e basis (at least once a month) and 56.3% report rout<strong>in</strong>ely distribut<strong>in</strong>g<strong>in</strong>formation and other materials relat<strong>in</strong>g to substance abuse treatment (Figure 18).Although 87.5% <strong>of</strong> facilities rout<strong>in</strong>ely conduct substance abuse-related outreach amongvulnerable groups and with<strong>in</strong> disadvantaged areas, the <strong>in</strong>ner city areas were relativelyneglected, with only 56.3% <strong>of</strong> facilities rout<strong>in</strong>ely operat<strong>in</strong>g <strong>in</strong> these areas. In addition,12.5% <strong>of</strong> facilities report that they never conduct outreach <strong>in</strong> the <strong>in</strong>ner city areas and6.3% never distribute materials related to substance abuse treatment.49
Figure 18.Proportion <strong>of</strong> substance abuse treatment facilities that target awareness-relatedbarriers to treatment entry for vulnerable clients for the overall sample (%).1009088 888070605040302010013 130 0 0 0Outreach-vulnerablegroups13131956 56Outreach-disadv areas Outreach-<strong>in</strong>ner cities Distribution <strong>of</strong> material Awareness campaigns66310193844Never Rarely Sometimes Rout<strong>in</strong>elyMpumalanga and North West are the only prov<strong>in</strong>ces where all facilities rout<strong>in</strong>ely conductoutreach among vulnerable groups, with<strong>in</strong> disadvantaged areas and <strong>in</strong>ner city areas aswell as distribute substance abuse-related materials and <strong>in</strong>formation (Table 11).50
Table 11. Proportion <strong>of</strong> facilities that address lack <strong>of</strong> awareness <strong>of</strong> treatment options byprov<strong>in</strong>ce.Awareness rais<strong>in</strong>g activities Free State(N = 7)Limpopo(N = 2)Mpumalanga(N = 3)NorthWestNorthernCapeOverall(N = 16)(N = 2) (N = 2)N % N % N % N % N % N %Outreach: vulnerable groups -- -- -- -- -- -- -- -- -- -- -- --Never 0 0 0 0 0 0 0 0 0 0 0 0Rarely 0 0 0 0 0 0 0 0 0 0 0 0Sometimes 1 14.3 1 50.0 0 0 0 0 0 0 2 12.5Rout<strong>in</strong>ely 6 85.7 1 50.0 3 100.0 2 100.0 2 100.0 14 87.5Outreach <strong>in</strong> disadv areas -- -- -- -- -- -- -- -- -- -- -- --Never 0 0 0 0 0 0 0 0 0 0 0 0Rarely 0 0 0 0 0 0 0 0 0 0 0 0Sometimes 1 14.3 1 50.0 0 0 0 0 0 0 2 12.5Rout<strong>in</strong>ely 6 85.7 1 50.0 3 100.0 2 100.0 2 100.0 14 87.5Outreach <strong>in</strong> <strong>in</strong>ner cities -- -- -- -- -- -- -- -- -- -- -- --Never 1 14.3 0 0 0 0 0 0 1 50.0 2 12.5Rarely 0 0 2 100.0 0 0 0 0 0 0 2 12.5Sometimes 3 42.9 0 0 0 0 0 0 0 0 3 18.8Rout<strong>in</strong>ely 3 42.9 0 0 3 100.0 2 100.0 1 50.0 9 56.3Distribution <strong>of</strong> materials -- -- -- -- -- -- -- -- -- -- -- --Never 1 14.3 0 0 0 0 0 0 0 0 1 6.3Rarely 0 0 1 50.0 0 0 0 0 0 0 1 6.3Sometimes 4 57.1 1 50.0 0 0 0 0 0 0 5 31.3Rout<strong>in</strong>ely 2 28.6 0 0 3 100.0 2 100.0 2 100.0 9 56.3Awareness campaigns -- -- -- -- -- -- -- -- -- -- -- --Never 0 0 0 0 0 0 0 0 0 0 0 0Rarely 2 28.6 1 50.0 0 0 0 0 0 0 3 18.8Sometimes 1 14.3 1 50.0 1 33.3 2 100.0 1 50.0 6 37.5Rout<strong>in</strong>ely 4 57.1 0 0 2 66.7 0 0 1 50.0 7 43.851
3.7.2. Practices that address logistical and affordability barriers to treatment entryAll facilities <strong>in</strong>dicate that they provide treatment to clients who have no medical aidcoverage or are unable to pay for treatment. In terms <strong>of</strong> costs barriers, 68.8% <strong>of</strong> facilitiesrout<strong>in</strong>ely <strong>of</strong>fer reduced fees to <strong>in</strong>digent clients while 75.0% <strong>of</strong> facilities rout<strong>in</strong>ely havefree treatment beds/slots available (Figure 19). For the overall sample, the averagenumber <strong>of</strong> free treatment slots/beds available per year ranges from 5 to 120 (χ = 60.8, SD= 47.0). By prov<strong>in</strong>ce, the average number <strong>of</strong> free treatment slots/beds available per yearranges from 8 to 100 (χ = 56.3, SD = 40.8) <strong>in</strong> Free State, 5 to 25 (χ = 15.0, SD = 14.1) <strong>in</strong>Limpopo and 120 (χ = 120.0, SD = 0.0) <strong>in</strong> North West. <strong>Facilities</strong> <strong>in</strong> Mpumalanga andNorthern Cape did not provide figures for the availability <strong>of</strong> treatment slots/beds.In terms <strong>of</strong> transport barriers, only 12.5% rout<strong>in</strong>ely provide clients with transport to thefacility and provide transport to the client’s family so that they can participate <strong>in</strong> thetreatment programme (Figure 19).Figure 19.Proportion <strong>of</strong> substance abuse treatment facilities that target logisticbarriers to treatment entry (%).807060504030201007569693825 252519 1913 13 130 0 0 0Transport for client Transport for family Reduced fees Free treatmentNever Rarely Sometimes Rout<strong>in</strong>elyBy prov<strong>in</strong>ce, only facilities <strong>in</strong> Free State rout<strong>in</strong>ely provide transport for clients whereastransport for the family to participate <strong>in</strong> the treatment programme is available <strong>in</strong> FreeState (14.3%) and Northern Cape (50.0%) (Table 12).52
Table 12. Proportion <strong>of</strong> facilities address<strong>in</strong>g logistical barriers to treatment entry byprov<strong>in</strong>ce.Activities that addresslogistical barriersFree State(N = 7)Limpopo(N = 2)Mpumalanga(N = 3)NorthWestNorthernCapeOverall(N = 16)(N = 2) (N = 2)N % N % N % N % N % N %Transport for client-- -- -- -- -- -- -- -- -- -- -- --Never 3 42.9 2 100.0 1 33.3 0 0 0 0 6 37.5Rarely 1 14.3 0 0 1 33.3 0 0 2 100.0 4 25.0Sometimes 1 14.3 0 0 1 33.3 2 100.0 0 0 4 25.0Rout<strong>in</strong>ely 2 28.6 0 0 0 0 0 0 0 0 2 12.5Transport for family-- -- -- -- -- -- -- -- -- -- -- --Never 6 85.7 2 100.0 2 66.7 0 0 1 50.0 11 68.8Rarely 0 0 0 0 0 0 0 0 0 0 0 0Sometimes 0 0 0 0 1 33.3 2 100.0 0 0 3 18.8Rout<strong>in</strong>ely 1 14.3 0 0 0 0 0 0 1 50.0 2 12.5Reduced fees-- -- -- -- -- -- -- -- -- -- -- --Never 0 0 0 0 1 33.3 0 0 1 50.0 2 12.5Rarely 0 0 0 0 0 0 0 0 0 0 0 0Sometimes 2 28.6 1 50.0 0 0 0 0 0 0 3 18.8Rout<strong>in</strong>ely 5 71.4 1 50.0 2 66.7 2 100.0 1 50.0 11 68.8Free treatment-- -- -- -- -- -- -- -- -- -- -- --Never 0 0 1 50.0 2 66.7 0 0 1 50.0 4 25.0Rarely 0 0 0 0 0 0 0 0 0 0 0 0Sometimes 0 0 0 0 0 0 0 0 0 0 0 0Rout<strong>in</strong>ely 7 100.0 1 50.0 1 33.3 2 100.0 1 50.0 12 75.03.7.3. Practices that address cultural and l<strong>in</strong>guistic barriers to treatment entryIn terms <strong>of</strong> cultural and l<strong>in</strong>guistic barriers, all facilities report employ<strong>in</strong>g multi-l<strong>in</strong>gualstaff while 81.3% <strong>of</strong> facilities employ African language-speak<strong>in</strong>g therapists. Byprov<strong>in</strong>ce, only a small proportion <strong>of</strong> facilities <strong>in</strong> Free State (57.1%) employ Africanlanguage-speak<strong>in</strong>g counsellors while all facilities <strong>in</strong> the other 4 prov<strong>in</strong>ces employ Africanlanguage-speak<strong>in</strong>g counsellors.53
3.8 ADDRESSING BARRIERS TO ENGAGEMENT AND RETENTION INTREATMENT FOR VULNERABLE GROUPSThis section describes the extent to which treatment facilities target barriers toengagement and retention <strong>in</strong> treatment for clients from historically underserved groups;particularly Black South Africans, women and young people. Retention activities aregrouped <strong>in</strong>to activities relat<strong>in</strong>g to (i) the cultural-sensitivity and appropriateness <strong>of</strong>treatment, (ii) the gender-sensitivity and appropriateness <strong>of</strong> treatment, and (iii) the agesensitivityand appropriateness <strong>of</strong> treatment.Core f<strong>in</strong>d<strong>in</strong>gs:• All facilities <strong>of</strong>fer treatment services <strong>in</strong> multiple languages• Half <strong>of</strong> the facilities use culturally appropriate assessment tools• Only 43.8% <strong>of</strong> facilities provide child care services/facilities• Half <strong>of</strong> the facilities provide staff with special tra<strong>in</strong><strong>in</strong>g <strong>in</strong> gender-related issues• Three quarter <strong>of</strong> facilities employ staff tra<strong>in</strong>ed to work with young people• A small proportion <strong>of</strong> facilities (37.5%) provide adolescent-focused/adolescent-onlytreatment services3.8.1. Cultural and l<strong>in</strong>guistic sensitivity and appropriateness <strong>of</strong> treatmentOverall, all facilities report provid<strong>in</strong>g treatment programmes and materials <strong>in</strong> multiplelanguages, 87.5% provide counsell<strong>in</strong>g that is culturally appropriate, and only half reportus<strong>in</strong>g culturally appropriate assessment tools (Figure 20). Just over half <strong>of</strong> facilities(56.3%) have assessment <strong>in</strong>struments and programme materials translated <strong>in</strong>to multiplelanguages.54
Figure 20.Proportion <strong>of</strong> substance abuse treatment facilities <strong>of</strong>fer<strong>in</strong>g culturally andl<strong>in</strong>guistically appropriate services (%).120100808810060505640200Culturally appropriateassessment toolsTranslated <strong>in</strong>strumentsCulturally appropriatetherapyProgrammes <strong>in</strong> multiplelanguagesOverallNone <strong>of</strong> the facilities <strong>in</strong> Northern Cape report attempt<strong>in</strong>g to improve the culturalsensitivity and appropriateness <strong>of</strong> their programmes or provide culturally appropriatetherapy (Table 13). <strong>Facilities</strong> <strong>in</strong> Limpopo do not provide translated materials.Table 13. Proportion <strong>of</strong> facilities that address cultural and l<strong>in</strong>guistic appropriateness<strong>of</strong> services by prov<strong>in</strong>ce.Activities to improve cultural andl<strong>in</strong>guistic appropriateness <strong>of</strong>Free State(N = 7)Limpopo(N = 2)Mpumalanga(N = 3)NorthWestNorthernCapeOverall(N = 16)treatment(N = 2) (N = 2)N % N % N % N % N % N %Culturally appropriate3 42.9 2 100.0 1 33.3 2 100.0 0 0 8 50.0assessment toolsTranslated materials 4 57.1 0 0 2 66.7 2 100.0 1 50.0 9 56.3Culturally appropriate therapy 7 100.0 2 100.0 3 100.0 2 100.0 0 0 14 87.5Programmes: multiple languages 7 100.0 2 100.0 3 100.0 2 100.0 2 100.0 16 100.03.8.2. Gender sensitivity and appropriateness <strong>of</strong> treatmentThree quarter <strong>of</strong> facilities provide gender-appropriate therapy and sensitive counsell<strong>in</strong>gservices (Figure 21), with 68.8% <strong>of</strong> facilities provid<strong>in</strong>g services that address women’sissues, such as power, trauma and violence. In addition, 68.8% <strong>of</strong> facilities use genderappropriate assessment <strong>in</strong>struments and procedures for adm<strong>in</strong>istration. Only 1 facility55
(6.3%) provides women-focused/women-only treatment services. Half <strong>of</strong> the facilitiesprovide staff with special tra<strong>in</strong><strong>in</strong>g <strong>in</strong> gender-related issues that may be pert<strong>in</strong>ent totreatment (such as domestic violence). Clients have access to child care services <strong>in</strong> lessthan half <strong>of</strong> facilities (43.8%).Figure 21.Proportion <strong>of</strong> substance abuse treatment facilities <strong>of</strong>fer<strong>in</strong>g gender appropriateservices (%).Child careservices/facilities44Tra<strong>in</strong> staff <strong>in</strong> genderrelatedissues50Services address<strong>in</strong>gwomen's issues69Women-focusedtreatment services6Gender appropriatetherapy75Gender appropriateassessment tools690 10 20 30 40 50 60 70 80OverallThe only facility provid<strong>in</strong>g women-focused treatment services is <strong>in</strong> Mpumalanga (Table14). <strong>Facilities</strong> <strong>in</strong> Mpumalanga and North West do not provide staff with tra<strong>in</strong><strong>in</strong>g <strong>in</strong>gender-related issues. Child care facilities are not available <strong>in</strong> Mpumalanga and Limpopo.56
Table 14. Proportion <strong>of</strong> facilities that address the gender appropriateness <strong>of</strong> servicesby prov<strong>in</strong>ce.Activities to improve genderappropriateness <strong>of</strong> treatmentFree State(N = 7)Limpopo(N = 2)Mpumalanga(N = 3)NorthWestNorthernCapeOverall(N = 16)(N = 2) (N = 2)N % N % N % N % N % N %Gender appropriate assessment 3 42.9 2 100.0 2 66.7 2 100.0 2 100.0 11 68.8Gender appropriate therapy 6 85.7 1 50.0 2 66.7 2 100.0 1 50.0 12 75.0Women-focused treatment 0 0 0 0 1 33.3 0 0 0 0 1 6.3servicesServices address<strong>in</strong>g women’s 6 85.7 2 100.0 1 33.3 0 0 2 100.0 11 68.8issuesTra<strong>in</strong><strong>in</strong>g: gender-related issues 4 57.1 2 100.0 0 0 0 0 2 100.0 8 50.0Child care services/facilities 3 42.9 0 0 0 0 2 100.0 2 100.0 7 43.83.8.3. Age appropriateness <strong>of</strong> treatment servicesThree quarter <strong>of</strong> the facilities report us<strong>in</strong>g age appropriate assessment <strong>in</strong>struments, andemploy staff tra<strong>in</strong>ed to work with adolescents and young people (Figure 22). More than80.0% <strong>of</strong> the facilities report provid<strong>in</strong>g counsell<strong>in</strong>g services that are age anddevelopmentally appropriate, and conduct family-focused <strong>in</strong>terventions. Just over half <strong>of</strong>facilities provide family reunification services for adolescent clients (56.3%), and adaptthe facility environment to ensure the safety <strong>of</strong> young people (56.3%) (Figure 22). Asmall proportion <strong>of</strong> facilities provide adolescent-focused/adolescent-only treatmentservices (37.5%).57
Figure 22.Proportion <strong>of</strong> substance abuse treatment facilities <strong>of</strong>fer<strong>in</strong>g age appropriateservices (%).Family reunification for adolescents56Adapt facilities for the safety <strong>of</strong> young people56Employ staff tra<strong>in</strong>ed to work with adolescents75Conduct family-focused <strong>in</strong>terventions88Adolescent-focused treatment services38Age appropriate therapy88Age appropriate assessment tools750 10 20 30 40 50 60 70 80 90 100OverallBy prov<strong>in</strong>ce, facilities <strong>in</strong> Limpopo and North West do not provide adolescent-focusedtreatment services (Table 15). Similar proportions <strong>of</strong> facilities <strong>in</strong> all 5 prov<strong>in</strong>ces providefamily reunification services and adapt facilities for the safety <strong>of</strong> young people.58
Table 15. Proportion <strong>of</strong> facilities that address age appropriateness <strong>of</strong> services byprov<strong>in</strong>ce.Activities provided to improveage appropriateness <strong>of</strong> treatmentFree State(N = 7)Limpopo(N = 2)Mpumalanga(N = 3)NorthWestNorthernCapeOverall(N = 16)(N = 2) (N = 2)N % N % N % N % N % N %Age appropriate assessment 5 71.4 2 100.0 2 66.7 2 100.0 1 50.0 12 75.0Age appropriate therapy 6 85.7 2 100.0 3 100.0 2 100.0 1 50.0 14 87.5Adolescent-focused treatment 4 57.1 0 0 1 33.3 0 0 1 50.0 6 37.5servicesFamily-focused <strong>in</strong>terventions 6 85.7 2 100.0 2 66.7 2 100.0 2 100.0 14 87.5Staff tra<strong>in</strong>ed to work with 5 71.4 2 100.0 1 33.3 2 100.0 2 100.0 12 75.0adolescentsAdapt facilities for the safety <strong>of</strong> 4 57.1 1 50.0 1 33.3 2 100.0 1 50.0 9 56.3young peopleFamily reunification services 4 57.1 1 50.0 1 33.3 2 100.0 1 50.0 9 56.33.9. MONITORING AND EVALUATION ACTIVITIES FOR SUBSTANCEABUSE TREATMENT FACILITIESThis section describes the extent to which substance abuse treatment facilities <strong>in</strong> FreeState, Limpopo, Mpumalanga, North West and Northern Cape conduct monitor<strong>in</strong>g andevaluation (M & E) activities.Core f<strong>in</strong>d<strong>in</strong>gs:• Most facilities have structures that allow for the with<strong>in</strong>-treatment monitor<strong>in</strong>g <strong>of</strong> clients• Over half <strong>of</strong> the facilities report post-discharge monitor<strong>in</strong>g <strong>of</strong> clients• Overall, the average proportion <strong>of</strong> clients monitored once they complete treatment is45.8 (SD = 33.1)• Just over half <strong>of</strong> facilities monitor clients on an ad hoc basis or on request <strong>of</strong> familymembers• Less than half <strong>of</strong> the facilities had conducted an outcome evaluation <strong>of</strong> their treatmentprogramme• Equal proportions <strong>of</strong> facilities <strong>in</strong> all 5 prov<strong>in</strong>ces had conducted a process evaluation <strong>of</strong>their treatment programme/s as well as evaluated the quality <strong>of</strong> their treatmentprogrammes59
3.9.1. Monitor<strong>in</strong>g <strong>of</strong> clients’ progress dur<strong>in</strong>g the course <strong>of</strong> treatmentAdm<strong>in</strong>istrative and procedural structures and activities that facilitate the monitor<strong>in</strong>g <strong>of</strong>client progress dur<strong>in</strong>g the course <strong>of</strong> treatment were explored. These structures andactivities are important as they help facilitate the monitor<strong>in</strong>g <strong>of</strong> client outcomes posttreatment.Overall, all facilities report develop<strong>in</strong>g <strong>in</strong>dividualised treatment plans for eachclient and keep documented notes <strong>of</strong> clients’ progress dur<strong>in</strong>g treatment (Figure 23). Aslightly smaller percentage <strong>of</strong> facilities have formal discharge plans for each client(68.8%), collect collateral records from various sources (e.g. case conferences, nurs<strong>in</strong>grecords, assessments for each client) (81.3%) and ma<strong>in</strong>ta<strong>in</strong> a formal management<strong>in</strong>formation system (e.g. client database) that conta<strong>in</strong>s all client records (81.3%).Figure 23.Proportion <strong>of</strong> substance abuse treatment facilities report<strong>in</strong>g monitor<strong>in</strong>g <strong>of</strong>clients with<strong>in</strong> treatment (%).12010080100 1006981 816040200Individualisedtreatment plansDocumented progressnotesDocumented dischargeplansDocumented collateralcontactsManagement<strong>in</strong>formation systemOverallBy prov<strong>in</strong>ce, 6 facilities <strong>in</strong> Free State (85.7%), 1 <strong>in</strong> Limpopo (50.0%), 2 <strong>in</strong> Mpumalanga(66.7%), 2 <strong>in</strong> North West (100.0%) and none <strong>in</strong> Northern Cape keep documented<strong>in</strong>dividualised discharge plans. Compared to facilities <strong>in</strong> other prov<strong>in</strong>ces, one facility <strong>in</strong>Limpopo (50.0%) and none <strong>of</strong> the facilities <strong>in</strong> Northern Cape have documented recordsfrom collateral sources. A formal management <strong>in</strong>formation system is ma<strong>in</strong>ta<strong>in</strong>ed by 6facilities <strong>in</strong> Free State (85.7%), 2 facilities <strong>in</strong> Limpopo (100.0%), 2 facilities <strong>in</strong>Mpumalanga (66.7%), 2 facilities <strong>in</strong> North West (100.0%) and 1 facility <strong>in</strong> NorthernCape (50.0%).60
3.9.2. Monitor<strong>in</strong>g <strong>of</strong> clients’ progress post-treatmentWe also exam<strong>in</strong>ed the extent to which facilities monitored client progress post-treatment.When facilities were asked about post-discharge monitor<strong>in</strong>g and regular post-dischargefollow-up <strong>of</strong> all clients, only 62.5% <strong>of</strong> facilities reported track<strong>in</strong>g client progress oncethey had completed treatment (Figure 24).However, when asked about specific post-treatment monitor<strong>in</strong>g activities, a relativelylarge proportion <strong>of</strong> facilities report monitor<strong>in</strong>g clients’ progress telephonically (93.8%)and monitor<strong>in</strong>g clients’ progress dur<strong>in</strong>g follow-up counsell<strong>in</strong>g sessions (93.8%) (Figure24). In addition, 43.8% <strong>of</strong> facilities report the use <strong>of</strong> blood tests and/or ur<strong>in</strong>alysis tomonitor clients’ substance use and only 18.8% <strong>of</strong> facilities use structured follow-upquestionnaires to track clients’ progress post-treatment.Figure 24.Proportion <strong>of</strong> substance abuse treatment facilities report<strong>in</strong>g monitor<strong>in</strong>g <strong>of</strong>clients post-treatment (%).100908070605040302010063Post-dischargemonitor<strong>in</strong>g andfollow-up9444Telephone follow-up Blood/ur<strong>in</strong>e test Follow-up counsell<strong>in</strong>g Follow-upquestionnaireOverall9419By prov<strong>in</strong>ce, 4 facilities <strong>in</strong> Free State (57.1%), 1 <strong>in</strong> Limpopo (50.0%), 2 <strong>in</strong> Mpumalanga(66.7%), 2 <strong>in</strong> North West (100.0%) and 1 <strong>in</strong> Northern Cape (50.0%) conduct postdischargemonitor<strong>in</strong>g and regular post-discharge follow-up <strong>of</strong> all clients. All facilitiesreport monitor<strong>in</strong>g clients’ progress telephonically, with the exception <strong>of</strong> 1 facility <strong>in</strong>Northern Cape (50.0%). Similarly, all facilities report monitor<strong>in</strong>g clients’ progress dur<strong>in</strong>gfollow-up counsell<strong>in</strong>g sessions, with the exception <strong>of</strong> 1 facility <strong>in</strong> Limpopo (50.0%). Theonly prov<strong>in</strong>ces report<strong>in</strong>g us<strong>in</strong>g blood tests and/or ur<strong>in</strong>alysis to monitor clients’ substanceuse are Free State (42.9%), Limpopo (100.0%) and North West (100.0%). In addition,61
Free State (14.3%) and North West (100.0%) are the only prov<strong>in</strong>ces us<strong>in</strong>g structuredfollow-up questionnaires to track clients’ progress post-treatment.Overall, the average proportion <strong>of</strong> clients monitored once they complete the treatmentprogramme ranges from 0 to 100 (χ = 45.8, SD = 33.1). By prov<strong>in</strong>ce, the averageproportion <strong>of</strong> clients monitored post-treatment ranges from 20 to 100 (χ = 50.0, SD =30.3) <strong>in</strong> Free State, 40 (χ = 40.0, SD = 0.0) <strong>in</strong> Limpopo, 0 to 10 (χ = 3.7, SD = 5.5) <strong>in</strong>Mpumalanga, 70 (χ = 70.0, SD = 0.0) <strong>in</strong> North West, and 50 to 100 (χ = 75.0, SD = 35.4)<strong>in</strong> Northern Cape.A small proportion <strong>of</strong> facilities monitor clients for the first month (12.5%), first threemonths (12.5%) and first six months (18.8%). Just over half <strong>of</strong> the facilities (56.3%)monitor clients on an ad hoc basis or on request <strong>of</strong> family members while half <strong>of</strong> thefacilities report monitor<strong>in</strong>g clients for the first year (Figure 25).Figure 25.Proportion <strong>of</strong> substance abuse treatment facilities monitor<strong>in</strong>g clients posttreatmentby period (%).605050564030201013 13190First month First three months First six months First year Ad hoc basis/ request<strong>of</strong> family membersOverallNorthern Cape is the only prov<strong>in</strong>ce monitor<strong>in</strong>g clients for the first month post-treatmentas well as monitor<strong>in</strong>g clients on an ongo<strong>in</strong>g basis, namely for the first three months, firstsix months, first year and on an ad hoc basis (Table 16). <strong>Facilities</strong> <strong>in</strong> North West monitorclients for the first year only.62
Table 16. Proportion <strong>of</strong> facilities monitor<strong>in</strong>g clients post-treatment by prov<strong>in</strong>ce.Monitor<strong>in</strong>g: Period <strong>of</strong> time Free State(N = 7)Limpopo(N = 2)Mpumalanga(N = 3)NorthWestNorthernCapeOverall(N = 16)(N = 2) (N = 2)N % N % N % N % N % N %For the first month 0 0 0 0 0 0 0 0 2 100.0 2 12.5For the first three months 0 0 1 50.0 0 0 0 0 1 50.0 2 12.5For the first six months 1 14.3 1 50.0 0 0 0 0 1 50.0 3 18.8For the first year 2 28.6 1 50.0 2 66.7 2 100.0 1 50.0 8 50.0Ad hoc basis / request <strong>of</strong> familymembers4 57.1 0 0 3 100.0 0 0 2 100.0 9 56.33.9.3. Formal treatment programme evaluationThe proportion <strong>of</strong> substance abuse treatment facilities that have conducted formalevaluations <strong>of</strong> their treatment programmes and the types <strong>of</strong> evaluations conducted wasalso exam<strong>in</strong>ed. Overall, less than half <strong>of</strong> the facilities (43.8%) surveyed report hav<strong>in</strong>gconducted a treatment outcomes evaluation <strong>of</strong> their programme (Figure 26). Half <strong>of</strong> thefacilities have conducted a process evaluation <strong>of</strong> their treatment programme/s as well asevaluated the quality <strong>of</strong> their treatment programmes. A slightly larger proportion <strong>of</strong>facilities (62.5%) have exam<strong>in</strong>ed client satisfaction with treatment services provided(Figure 26). Similarly, 62.5% <strong>of</strong> facilities have participated <strong>in</strong> a Department <strong>of</strong> SocialServices evaluation for fund<strong>in</strong>g and 68.8% <strong>of</strong> facilities have evaluation reports available.63
Figure 26.Proportion <strong>of</strong> substance abuse treatment facilities conduct<strong>in</strong>g formalevaluations <strong>of</strong> their treatment programmes (%).7063 6360504450 50403020100Outcome evaluation Process evaluation Evaluation:programme qualityEvaluation: clientsatisfactionEvaluation:Department <strong>of</strong> SocialServices for fund<strong>in</strong>gOverallBy prov<strong>in</strong>ce, 57.1% (4) <strong>of</strong> facilities <strong>in</strong> Free State, 100.0% (2) <strong>in</strong> North West and 50.0%(1) <strong>in</strong> Northern Cape reported hav<strong>in</strong>g conducted a treatment outcomes evaluation <strong>of</strong> theirprogramme. Equal proportions <strong>of</strong> facilities <strong>in</strong> all 5 prov<strong>in</strong>ces had conducted a processevaluation <strong>of</strong> their treatment programme/s as well as evaluated the quality <strong>of</strong> theirtreatment programmes: 42.9% (3) <strong>in</strong> Free State, 50.0% (1) <strong>in</strong> Limpopo, 33.3% (1) <strong>in</strong>Mpumalanga, 100.0% (2) <strong>in</strong> North West and 50.0% (1) <strong>in</strong> Northern Cape. An evaluation<strong>of</strong> client satisfaction with services was performed <strong>in</strong> 57.1% (4) <strong>of</strong> facilities <strong>in</strong> Free State,50.0% (1) <strong>in</strong> Limpopo, 66.7% (3) <strong>in</strong> Mpumalanga, 100.0% (2) <strong>in</strong> North West and 50.0%(1) <strong>in</strong> Northern Cape. In terms <strong>of</strong> participat<strong>in</strong>g <strong>in</strong> a Department <strong>of</strong> Social Servicesevaluation for fund<strong>in</strong>g, 71.4% (5) <strong>of</strong> facilities <strong>in</strong> Free State, 33.3% (1) <strong>in</strong> Mpumalanga,100.0% (2) <strong>in</strong> both North West and Northern Cape had done so. Evaluation reports areavailable <strong>in</strong> Free State (6 facilities), Limpopo (1 facility), Mpumalanga (2 facilities) andNorthern Cape (2 facilities).64
PART 4: DISCUSSION OF KEY FINDINGSWhile substance abuse treatment facilities <strong>in</strong> Free State, Limpopo, Mpumalanga, NorthWest and Northern Cape <strong>of</strong>fer a range <strong>of</strong> services to clients, this audit shows that accessto services varies extensively among facilities. The follow<strong>in</strong>g sections describe theavailability <strong>of</strong> substance abuse treatment, the range <strong>of</strong> services provided, and the extent towhich barriers to enter<strong>in</strong>g, engag<strong>in</strong>g and be<strong>in</strong>g reta<strong>in</strong>ed <strong>in</strong> treatment for clients fromhistorically underserved groups are addressed by treatment facilities. Variations <strong>in</strong> thesecomponents <strong>of</strong> access are discussed <strong>in</strong> the light <strong>of</strong> facility characteristics, <strong>in</strong>clud<strong>in</strong>gstaff<strong>in</strong>g resources and the organisational environment; as well as <strong>in</strong> the light <strong>of</strong> m<strong>in</strong>imumnorms and standards for treatment facilities. F<strong>in</strong>ally, recommendations are made forimprov<strong>in</strong>g the accessibility and quality <strong>of</strong> treatment services.4.1. AVAILABILITY OF SUBSTANCE ABUSE TREATMENT SERVICESThis study exam<strong>in</strong>ed the availability <strong>of</strong> substance abuse treatment services (<strong>in</strong> terms <strong>of</strong>treatment capacity), the extent to which available treatment slots are utilised (<strong>in</strong> terms <strong>of</strong>treatment occupancy rates), the demand for treatment services (<strong>in</strong> terms <strong>of</strong> wait<strong>in</strong>g lists),and the extent to which available treatment slots are effectively used (<strong>in</strong> terms <strong>of</strong> clientretention rates). Availability <strong>of</strong> services is an important variable to exam<strong>in</strong>e as lowavailability may act as a barrier to access<strong>in</strong>g services; even when there are high levels <strong>of</strong>perceived need (Appel et al., 2004).4.1.1. Availability <strong>of</strong> treatment servicesThe availability <strong>of</strong> substance abuse treatment services appears to be greater <strong>in</strong>Mpumalanga, with f<strong>in</strong>d<strong>in</strong>gs suggest<strong>in</strong>g that facilities <strong>in</strong> Mpumalanga have moretreatment slots available and treat greater numbers <strong>of</strong> clients than facilities <strong>in</strong> the FreeState, Limpopo, North West and Northern Cape.4.1.2. Utilisation <strong>of</strong> and demand for available treatment slotsWe also exam<strong>in</strong>ed the extent to which available treatment slots are utilised. For theoverall sample, just over half <strong>of</strong> the available treatment slots are occupied on an annualbasis. Although this occupancy rate is relatively high, the f<strong>in</strong>d<strong>in</strong>g that a third <strong>of</strong> slotsrema<strong>in</strong> unoccupied is still cause for concern given the high demand for substance abusetreatment services. This demand for treatment services is reflected <strong>in</strong> the f<strong>in</strong>d<strong>in</strong>g that 765
facilities have wait<strong>in</strong>g lists, with an average <strong>of</strong> 6 clients wait<strong>in</strong>g for an available treatmentslot. On average, the wait<strong>in</strong>g period for a treatment slot / bed is 6 days. It should be notedthat none <strong>of</strong> the facilities <strong>in</strong> the Northern Cape reported us<strong>in</strong>g a wait<strong>in</strong>g list.Despite the fact that these wait<strong>in</strong>g periods are much shorter than those identified <strong>in</strong> otherprov<strong>in</strong>ces, such as Gauteng and KwaZulu-Natal (Myers & Fakier, 2007), the presence <strong>of</strong>wait<strong>in</strong>g lists is still worrisome as they may act as a barrier to access<strong>in</strong>g substance abusetreatment (Grant, 1997; Hser et al., 1998; Tucker et al., 2004). Timely access is importantfor facilitat<strong>in</strong>g treatment entry as many substance abusers are ambivalent about seek<strong>in</strong>gtreatment and may have little tolerance for wait<strong>in</strong>g for the next available treatment slot(Kaplan & Johri, 2000).F<strong>in</strong>d<strong>in</strong>gs reflect that facilities <strong>in</strong> Mpumalanga have the lowest treatment occupancy rates,with these facilities operat<strong>in</strong>g, on average, at 38.3% <strong>of</strong> their capacity.4.1.3. Effective use <strong>of</strong> available treatment slotsIn this study, the effective use <strong>of</strong> available treatment slots is <strong>in</strong>dicated by the degree towhich clients are reta<strong>in</strong>ed <strong>in</strong> treatment. Client retention rates differ broadly acrossfacilities, with some facilities report<strong>in</strong>g retention rates as low as 30.0%. On average,facilities reta<strong>in</strong> about 70.2% <strong>of</strong> their clients <strong>in</strong> treatment. The large variation <strong>in</strong> theseretention rates po<strong>in</strong>ts to significant room for service improvement, especially as clientretention is an important proxy <strong>in</strong>dicator <strong>of</strong> service effectiveness and positive treatmentoutcomes.4.2. RANGE AND DIVERSITY OF SERVICES PROVIDEDDespite grow<strong>in</strong>g evidence <strong>of</strong> an association between the availability <strong>of</strong> ancillarytreatment services (e.g. psychological and medical care) and treatment outcomes, andevidence-based practice guidel<strong>in</strong>es that emphasise the need to <strong>in</strong>tegrate ancillary medicaland mental health services with core addiction services (Durk<strong>in</strong>, 2002; Lee et al., 2001),f<strong>in</strong>d<strong>in</strong>gs suggest that substance abuse treatment facilities <strong>in</strong> South Africa generally fail tomeet this standard. In Free State, Limpopo, Mpumalanga, North West and NorthernCape, clients are provided with ancillary medical and mental health-oriented servicesmuch less frequently than core addiction services. This is similar to f<strong>in</strong>d<strong>in</strong>gs from66
previous audits <strong>of</strong> specialist substance abuse treatment facilities <strong>in</strong> Cape Town (Myers &Parry, 2003); Gauteng (Myers, 2004) as well as Gauteng and KwaZulu-Natal (Myers &Fakier, 2007).4.2.1. Provision <strong>of</strong> ancillary mental health servicesIn all 5 prov<strong>in</strong>ces, substance abuse treatment facilities focus primarily on treat<strong>in</strong>g the coresubstance abuse problem and rarely provide ancillary psychiatric services that targetpsychiatric disorders and other mental health problems that are associated with, anoutcome <strong>of</strong>, and/or contributed to the development <strong>of</strong> the substance use disorder. Morespecifically, only 1 facility <strong>in</strong> Free State provides psychiatric services.In addition, only a m<strong>in</strong>ority <strong>of</strong> facilities assess clients for psychiatric disorders. <strong>Facilities</strong><strong>in</strong> Free State (28.6%) are the only facilities assess<strong>in</strong>g whether clients have co-occurr<strong>in</strong>gpsychiatric disorders. This rema<strong>in</strong>s a cause for concern; especially as <strong>in</strong>ternationalresearch po<strong>in</strong>ts to the high prevalence <strong>of</strong> co-occurr<strong>in</strong>g psychiatric disorders among<strong>in</strong>dividuals with substance use disorders, which, if left undetected, negatively impact ontreatment outcomes (Teesson et al., 2005).F<strong>in</strong>d<strong>in</strong>gs from previous research also suggest that <strong>in</strong>dividuals with co-occurr<strong>in</strong>g disordershave more complex treatment needs than persons with substance use disorders only(Durk<strong>in</strong>, 2002; Teesson et al., 2005). These f<strong>in</strong>d<strong>in</strong>gs suggest that <strong>in</strong> order to <strong>in</strong>crease thechance <strong>of</strong> positive treatment outcomes for <strong>in</strong>dividuals with co-occurr<strong>in</strong>g disorders,psychiatric disorders need to be detected and managed dur<strong>in</strong>g the course <strong>of</strong> treatment(Teesson et al., 2005). Despite this, f<strong>in</strong>d<strong>in</strong>gs from this study show that a smallerproportion <strong>of</strong> facilities <strong>of</strong>fer counsell<strong>in</strong>g focused on mental health problems, relative tocounsell<strong>in</strong>g focused on substance abuse and/or family issues. In addition, only half <strong>of</strong> thefacilities provide clients with psychiatric medication to manage their co-occurr<strong>in</strong>g moodand/or anxiety disorders.The availability <strong>of</strong> speciality staff<strong>in</strong>g resources may help account for the shortage <strong>of</strong>mental health services <strong>in</strong> Free State, Limpopo, Mpumalanga, North West and NorthernCape. Prior research suggests that the availability <strong>of</strong> mental health services is stronglyassociated with the proportion <strong>of</strong> staff (employed by facilities) tra<strong>in</strong>ed to deliver these67
speciality services (Durk<strong>in</strong>, 2002; Friedman, Alexander, & D’Aunno, 1999). F<strong>in</strong>d<strong>in</strong>gsfrom this study tend to confirm this explanation with only 43.8% <strong>of</strong> facilities employ<strong>in</strong>g apsychologist and 18.8% <strong>of</strong> facilities with a psychiatrist on staff.4.2.2. Provision <strong>of</strong> ancillary health servicesIn comparison to the proportion <strong>of</strong> facilities provid<strong>in</strong>g core addiction and aftercareservices, a smaller proportion <strong>of</strong> facilities provide ancillary medical and health services.Although this is <strong>in</strong> keep<strong>in</strong>g with f<strong>in</strong>d<strong>in</strong>gs from previous audits <strong>of</strong> substance abusetreatment facilities (Myers & Fakier, 2007; Myers, 2004; Myers & Parry, 2003), thesef<strong>in</strong>d<strong>in</strong>gs are cause for concern as many substance-abus<strong>in</strong>g <strong>in</strong>dividuals experiencesubstance-related health concerns. The provision <strong>of</strong> ancillary health services (<strong>of</strong> both apalliative and preventative nature) is thus an important aspect <strong>of</strong> quality substance abusetreatment (Friedman, Alexander, & D’Aunno, 1999).Similar to f<strong>in</strong>d<strong>in</strong>gs from previous studies, facilities are more likely to conduct medicalassessments than provide clients with substitution medication and/or detoxificationservices. More specifically, less than 40.0% <strong>of</strong> facilities provide clients with access tosubstitution medication - despite the evidence that substitution medication is<strong>in</strong>ternationally acknowledged to be a useful tool for limit<strong>in</strong>g the harms <strong>of</strong> substance abuseand for reta<strong>in</strong><strong>in</strong>g clients <strong>in</strong> treatment. The provision <strong>of</strong> substitution medication is also<strong>in</strong>ternationally recognised as one <strong>of</strong> the key pr<strong>in</strong>ciples <strong>of</strong> effective substance abusetreatment (NIDA, 2006). Similarly, only 56.3% <strong>of</strong> facilities report provid<strong>in</strong>g clients withon-site detoxification services. The limited availability <strong>of</strong> these services with<strong>in</strong> treatmentfacilities is cause for concern as treatment facilities that do not provide detoxificationservices <strong>of</strong>ten require clients to have completed a hospital-based detoxification prior toenter<strong>in</strong>g treatment. This acts as a barrier to treatment entry due to the scarcity <strong>of</strong>hospital-based detoxification services (Myers, 2007).F<strong>in</strong>d<strong>in</strong>gs also show that only a small proportion <strong>of</strong> facilities conduct <strong>in</strong>terventions toreduce the health risks associated with cont<strong>in</strong>ued substance use. For example, a quarter<strong>of</strong> the facilities test for and conduct <strong>in</strong>terventions to reduce the risks <strong>of</strong> substance-related<strong>in</strong>fectious disease (such as hepatitis) or conduct <strong>in</strong>terventions to reduce the health risksassociated with <strong>in</strong>jection drug use. While the latter may be due to the fact that only a68
small proportion <strong>of</strong> South African drug users are <strong>in</strong>jection drug users (Dew<strong>in</strong>g et al.,2006), <strong>in</strong>jection drug users still face many health risks that can be ameliorated throughtimeous <strong>in</strong>terventions. In addition, less than half <strong>of</strong> the facilities test for and conduct<strong>in</strong>terventions to reduce the risk <strong>of</strong> HIV. This f<strong>in</strong>d<strong>in</strong>g is <strong>of</strong> greater concern, especiallygiven the strong association between substance abuse and risky sexual practices(Wechsberg, Craddock, & Hubbard, 1998) and South Africa’s high HIV prevalence rate.4.3. TARGETING BARRIERS TO TREATMENT ENTRY, ENGAGEMENTAND RETENTION FOR CLIENTS FROM UNDERSERVED GROUPSInternational pr<strong>in</strong>ciples <strong>of</strong> effective treatment for substance use disorders (NIDA, 2006)and South African norms and standards for <strong>in</strong>patient and outpatient treatment emphasisethat substance abuse treatment services should be (i) accessible to <strong>in</strong>dividuals who needand want services and (ii) appropriate for different cultural, age and gender groups.Despite these standards and widespread concern about the accessibility andappropriateness <strong>of</strong> exist<strong>in</strong>g treatment services for clients from historically underservedgroups (Myers & Parry, 2005), South African substance abuse treatment facilitiesgenerally fail to meet these standards. The follow<strong>in</strong>g sections describe the accessibilityand appropriateness <strong>of</strong> substance abuse treatment services with particular reference tohistorically underserved population groups; namely Black/African substance users andwomen.4.3.1. The extent to which services are accessible to underserved groupsF<strong>in</strong>d<strong>in</strong>gs show that <strong>in</strong> Free State, Limpopo, Mpumalanga and North West, Black/Africanclients cont<strong>in</strong>ue to be under-represented <strong>in</strong> substance abuse treatment facilities. AlthoughBlack/African persons comprise about 84.0% <strong>of</strong> the general population <strong>of</strong> Free State(Statistics South Africa, 1998a), they comprise only 31.7% <strong>of</strong> the client population atsubstance abuse treatment facilities <strong>in</strong> this prov<strong>in</strong>ce. Similarly, while Black/Africanpersons comprise about 97.3% <strong>of</strong> the general population <strong>in</strong> Limpopo (Statistics SouthAfrica, 2006b), they comprise about 48.0% <strong>of</strong> the client population at substance abusetreatment facilities <strong>in</strong> this prov<strong>in</strong>ce. In Mpumalanga, Black/African persons compriseabout 92.4% <strong>of</strong> the general population (Statistics South Africa, 2006c) while only 48.5%<strong>of</strong> the client population are <strong>in</strong> treatment for substance abuse. Black/African personscomprise about 91.4% <strong>of</strong> the general population <strong>of</strong> North West (Statistics South Africa,69
1998b) and comprise only 31.0% <strong>of</strong> the client population at substance abuse treatmentfacilities. In contrast, White South Africans cont<strong>in</strong>ue to be over-represented <strong>in</strong> substanceabuse treatment facilities, relative to the demographic pr<strong>of</strong>ile <strong>of</strong> the general population.These f<strong>in</strong>d<strong>in</strong>gs are <strong>in</strong> keep<strong>in</strong>g with f<strong>in</strong>d<strong>in</strong>gs from previous audits <strong>of</strong> treatment facilities <strong>in</strong>Gauteng and KwaZulu-Natal (Myers & Fakier, 2007), Gauteng (Myers, 2004) and CapeTown (Myers & Parry, 2003).As substance abuse treatment need has not been properly <strong>in</strong>vestigated <strong>in</strong> South Africa, itis unclear whether there are disparities <strong>in</strong> the need for substance abuse treatment servicesamong the racially def<strong>in</strong>ed social groups. Despite this gap, emerg<strong>in</strong>g evidence suggeststhat poor Black/African communities may be especially vulnerable to substance usedisorders, due to the psychological stress associated with rapid urbanisation, poverty,neighbourhood social dysfunction, and a lack <strong>of</strong> basic <strong>in</strong>frastructure (Flisher & Charlton,2001; Kalichman et al., 2006; Latk<strong>in</strong>, Williams, Wang, & Curry, 2005) - factors that<strong>of</strong>ten characterise these communities. Anecdotal reports <strong>of</strong> <strong>in</strong>creas<strong>in</strong>g levels <strong>of</strong> substanceuse among Black/African communities also suggest that this pattern <strong>of</strong> service utilisationreflects the limited extent to which Black/African South Africans have access tosubstance abuse treatment rather than lower levels <strong>of</strong> substance use by these raciallydef<strong>in</strong>ed social groups (Myers et al., 2004; Myers & Parry, 2005).In terms <strong>of</strong> gender, f<strong>in</strong>d<strong>in</strong>gs show that women are also under-represented <strong>in</strong> substanceabuse treatment facilities. Although women comprise at least half <strong>of</strong> the generalpopulation (Statistics South Africa, 2005), on average less than 30.0% <strong>of</strong> the recipients <strong>of</strong>substance abuse treatment services <strong>in</strong> Free State, Limpopo, Mpumalanga, North West andNorthern Cape are women. This f<strong>in</strong>d<strong>in</strong>g is <strong>in</strong> keep<strong>in</strong>g with f<strong>in</strong>d<strong>in</strong>gs from previous audits<strong>of</strong> substance abuse treatment facilities <strong>in</strong> Cape Town; Gauteng as well as KwaZulu-Nataland Gauteng (Myers, 2004; Myers & Parry, 2003; Myers & Fakier, 2007) and<strong>in</strong>ternational research which po<strong>in</strong>ts to the under-representation <strong>of</strong> women <strong>in</strong> treatment(Schober & Annis, 1996; Zule, Lam, & Wechsberg, 2003). However, this pattern <strong>of</strong>treatment service utilisation by women probably reflects the limited extent to whichwomen have access to substance abuse treatment rather than lower levels <strong>of</strong> substanceuse by women; especially given research which suggests that similar proportions <strong>of</strong> menand women dr<strong>in</strong>k at risky levels <strong>in</strong> South Africa (Parry et al., 2005) and that po<strong>in</strong>ts to70
high levels <strong>of</strong> substance use among women <strong>in</strong> Cape Town (Sawyer, Wechsberg, &Myers, 2006).4.3.2. Access to treatment: Target<strong>in</strong>g barriers to treatment entrySeveral studies have identified barriers that h<strong>in</strong>der access to treatment for clients fromunderserved groups. In South Africa, these barriers <strong>in</strong>clude awareness <strong>of</strong> treatmentservices; logistic barriers <strong>in</strong>clud<strong>in</strong>g access to transport; affordability barriers relat<strong>in</strong>g tothe costs <strong>of</strong> services; and l<strong>in</strong>guistic barriers, relat<strong>in</strong>g to the language <strong>in</strong> which services areprovided (Myers, 2007). These barriers, if unaddressed, may negatively impact ontreatment-seek<strong>in</strong>g behaviour (Beardsley et al., 2003; Joe et al., 2002). This studyexam<strong>in</strong>ed the extent to which substance abuse treatment facilities address these keybarriers to treatment entry for clients from historically underserved groups.Awareness-related barriers to treatment entryLimited knowledge and awareness about where to seek help for substance use disordersand how to access help <strong>in</strong>hibits entry <strong>in</strong>to substance abuse treatment (Hser et al., 1998),particularly for poor Black/African substance users (Myers, 2007). Less than half <strong>of</strong>facilities attempt to address this barrier by conduct<strong>in</strong>g rout<strong>in</strong>e awareness campaigns (atleast once a month) that provide <strong>in</strong>formation about substance abuse treatment options.Just over half <strong>of</strong> facilities report rout<strong>in</strong>ely distribut<strong>in</strong>g <strong>in</strong>formation and materialsperta<strong>in</strong><strong>in</strong>g to substance abuse and available treatment options. Over 80.0% <strong>of</strong> facilitiesrout<strong>in</strong>ely conduct outreach among vulnerable groups and conduct outreach <strong>in</strong>disadvantaged areas. In comparison, the <strong>in</strong>ner city areas are relatively neglected, with justover 50.0% <strong>of</strong> facilities rout<strong>in</strong>ely target<strong>in</strong>g these high-risk areas.The important role that outreach can play <strong>in</strong> address<strong>in</strong>g awareness-related barriers amongunderserved Black/African communities (and <strong>in</strong> facilitat<strong>in</strong>g treatment entry) is reflected<strong>in</strong> f<strong>in</strong>d<strong>in</strong>gs that facilities which conduct outreach activities <strong>in</strong> disadvantaged areas treatsignificantly more Black/African clients than facilities without these services.Logistic and affordability barriers to treatment entryAffordability and other logistic barriers (such as access to transport) also hamper entry<strong>in</strong>to treatment for South African substance abus<strong>in</strong>g populations (Myers, 2007). For71
example, several studies report that “lack <strong>of</strong> transportation” is a barrier to substanceabuse treatment entry (Hser et al., 1998), especially for low-<strong>in</strong>come groups who have lessaccess to private transportation and who may not be able to afford public transport(Allard, Tolman, & Rosen, 2003). Although research <strong>in</strong>dicates that provid<strong>in</strong>g clients withtransport <strong>in</strong>creases substance abusers’ use <strong>of</strong> treatment services (Booth et al., 2000;Friedmann, Lemon, & Ste<strong>in</strong>, 2001; Hser et al., 1998), only12.5% <strong>of</strong> facilitiesparticipat<strong>in</strong>g <strong>in</strong> this study rout<strong>in</strong>ely provide clients with transport to their treatmentfacility. Similarly, 12.5% <strong>of</strong> facilities rout<strong>in</strong>ely provide clients’ families with transport totheir facilities. This lack <strong>of</strong> transportation may limit the extent to which poorer familiesare able to participate <strong>in</strong> the treatment process. This is cause for concern as familyparticipation <strong>in</strong> treatment is an essential <strong>in</strong>gredient <strong>of</strong> effective treatment, particularly foradolescent clients (NIDA, 2006) and because a lack <strong>of</strong> participation may limit theirknowledge <strong>of</strong> how to provide a supportive social environment to their family member – akey <strong>in</strong>gredient for positive treatment outcomes (Joe et al., 2002).Affordability factors have also been identified as significant obstacles to substance abusetreatment entry (Hser et al., 1998; Myers, 2007; Tucker, Vuch<strong>in</strong>ich, & Rippens, 2004).These factors <strong>in</strong>clude the direct costs <strong>of</strong> treatment as well as <strong>in</strong>direct costs associated withtransport to treatment facilities, replacement <strong>of</strong> wages, and child care (Myers, 2007;Tucker, Vuch<strong>in</strong>ich, & Rippens, 2004). Cost barriers seem highest for substance userswithout health <strong>in</strong>surance (Sturm & Sherbourne, 2001), which <strong>in</strong> South Africa consistslargely <strong>of</strong> Black/African persons (Goosen, et al., 2003). F<strong>in</strong>d<strong>in</strong>gs from this study showthat few treatment facilities address the cost barriers that restrict poorer clients fromenter<strong>in</strong>g treatment. Although more than half <strong>of</strong> facilities report rout<strong>in</strong>ely <strong>of</strong>fer<strong>in</strong>g <strong>in</strong>digentclients reduced fees, <strong>of</strong>ten these reduced fees are still unaffordable to <strong>in</strong>digent clients.Three quarter <strong>of</strong> the facilities rout<strong>in</strong>ely have free treatment slots available for clients whocannot afford to pay for treatment. In terms <strong>of</strong> the <strong>in</strong>direct costs <strong>of</strong> enter<strong>in</strong>g treatment,less than half <strong>of</strong> the facilities have child care services available to clients participat<strong>in</strong>g <strong>in</strong>their treatment programmes. As affordability considerations are one <strong>of</strong> the mostimportant predictors <strong>of</strong> treatment entry among South African substance abusers (Myers,2007), it is vital that facilities consider <strong>in</strong>novative ways <strong>in</strong> which the costs associated withtreatment can be reduced for clients from underserved groups; particularly as address<strong>in</strong>g72
these barriers appears to significantly improve entry <strong>in</strong>to substance abuse treatment(Friedmann, Lemon, & Ste<strong>in</strong>, 2001).Cultural and l<strong>in</strong>guistic barriers to treatment entryHistorically, one <strong>of</strong> the major barriers to enter<strong>in</strong>g substance abuse treatment forBlack/African persons has been the lack <strong>of</strong> cultural and l<strong>in</strong>guistically appropriateservices, with most treatment services be<strong>in</strong>g provided <strong>in</strong> English or Afrikaans and byWhite or Coloured treatment staff (Myers, 2004; Myers et al., 2005). Although research<strong>in</strong>dicates that provid<strong>in</strong>g clients with treatment services <strong>in</strong> their home language andmatch<strong>in</strong>g clients and counsellors on ethnicity and gender dimensions <strong>in</strong>creases substanceabusers’ use <strong>of</strong> treatment services (Appel et al., 2004; Tucker, Vuch<strong>in</strong>ich, & Rippens,2004), only a small proportion <strong>of</strong> facilities actively address these cultural and l<strong>in</strong>guisticbarriers to treatment entry for Black/African clients.Although all facilities report employ<strong>in</strong>g multil<strong>in</strong>gual staff and staff from ethnicallydiverse backgrounds, further question<strong>in</strong>g revealed that only 81.3% <strong>of</strong> facilities employAfrican language-speak<strong>in</strong>g counsellors. This potentially <strong>in</strong>hibits Black/African personsfrom seek<strong>in</strong>g treatment, with Black/African clients be<strong>in</strong>g more likely to seek treatment atfacilities that actively address the cultural/l<strong>in</strong>guistic barriers they experience. Forexample, facilities that employ African language-speak<strong>in</strong>g counsellors treat asignificantly greater proportion <strong>of</strong> Black/African clients, than facilities without thesecounsellors. Although treatment facilities may serve a higher proportion <strong>of</strong> Black/Africanclients because they actively target l<strong>in</strong>guistic barriers to treatment entry, it is also possiblethat certa<strong>in</strong> facilities employ African language-speak<strong>in</strong>g counsellors because a highproportion <strong>of</strong> their clientele are Black/African. To fully understand these f<strong>in</strong>d<strong>in</strong>gs,further <strong>in</strong>vestigation <strong>in</strong>to the relationships among demographic pr<strong>of</strong>ile, treatment needs,and factors facilitat<strong>in</strong>g treatment entry for recipients <strong>of</strong> substance abuse treatment isrequired.In summary, it seems that treatment facilities <strong>in</strong> Free State, Limpopo, Mpumalanga,North West and Northern Cape have not adequately addressed key affordability,logistical and l<strong>in</strong>guistic barriers to treatment entry for substance abusers fromunderserved communities. These f<strong>in</strong>d<strong>in</strong>gs mirror those found <strong>in</strong> previous audits <strong>of</strong>73
treatment facilities <strong>in</strong> Cape Town (Myers & Parry, 2003); Gauteng (Myers, 2004) andGauteng and KwaZulu-Natal (Myers & Fakier, 2007). If <strong>in</strong>equities <strong>in</strong> treatment serviceutilisation are to be addressed, these barriers need to be targeted as a matter <strong>of</strong> urgency.4.3.3. Target<strong>in</strong>g barriers to treatment retention: The appropriateness <strong>of</strong> servicesIn South Africa few facilities provide age, gender and culturally sensitive treatmentprogrammes (Myers & Parry, 2003; Myers, 2004). This is a concern as the absence <strong>of</strong>appropriate services for groups such as women and cultural m<strong>in</strong>orities and concernsabout the cultural and gender appropriateness <strong>of</strong> services have been identified as barriersto substance abuse treatment utilisation (Appel et al., 2004; Tucker, Vuch<strong>in</strong>ich, &Rippens, 2004). The follow<strong>in</strong>g sections describe the extent to which treatment facilitiesprovide culturally, gender and age-sensitive treatment services.Cultural and l<strong>in</strong>guistic appropriateness <strong>of</strong> servicesConcerns about the cultural and l<strong>in</strong>guistic appropriateness <strong>of</strong> South African treatmentservices have also been an obstacle to treatment retention for clients from underservedgroups, particularly Black/African substance abusers. This study found that although allfacilities report provid<strong>in</strong>g treatment programmes <strong>in</strong> multiple languages, a smallerproportion <strong>of</strong> facilities provide counsell<strong>in</strong>g that is culturally-appropriate, use culturallyappropriateassessment tools, and translate programme materials <strong>in</strong>to multiple languages.These factors potentially <strong>in</strong>hibit Black/African persons from be<strong>in</strong>g reta<strong>in</strong>ed <strong>in</strong> treatment,with Black/African clients be<strong>in</strong>g more likely to rema<strong>in</strong> <strong>in</strong> facilities that provide culturaland l<strong>in</strong>guistically appropriate services. Although treatment facilities may serve a higherproportion <strong>of</strong> Black/African clients because they attempt to ensure that their services areculturally and l<strong>in</strong>guistically appropriate, it is also possible that certa<strong>in</strong> facilities exam<strong>in</strong>ethe appropriateness <strong>of</strong> their services because a high proportion <strong>of</strong> their clientele areBlack/African. To fully understand these f<strong>in</strong>d<strong>in</strong>gs, further <strong>in</strong>vestigation <strong>in</strong>to therelationships among demographic pr<strong>of</strong>ile, treatment needs, and factors facilitat<strong>in</strong>gtreatment retention for recipients <strong>of</strong> substance abuse treatment is required.In summary, this study suggests that the demographic pr<strong>of</strong>ile <strong>of</strong> persons seek<strong>in</strong>gtreatment may <strong>in</strong>fluence whether facilities provide culturally and l<strong>in</strong>guistically74
appropriate services for Black/African substance abusers. This is <strong>in</strong> keep<strong>in</strong>g with f<strong>in</strong>d<strong>in</strong>gsfrom previous audits <strong>of</strong> substance abuse treatment facilities (Myers & Parry, 2003;Myers, 2004; Myers & Fakier, 2007).Gender appropriateness <strong>of</strong> servicesAlthough substance abuse treatment services are under-utilised by women (Myers, Parry,& Plüddemann, 2004), few facilities <strong>in</strong> Free State, Limpopo, Mpumalanga, North Westand Northern Cape provide services aimed at address<strong>in</strong>g some <strong>of</strong> the barriers that preventwomen from engag<strong>in</strong>g and be<strong>in</strong>g reta<strong>in</strong>ed <strong>in</strong> treatment. These barriers <strong>in</strong>clude limitedresources to arrange for <strong>in</strong>dependent childcare (Booth & McLaughl<strong>in</strong>, 2000), and the lack<strong>of</strong> women-sensitive treatment programmes that focus on the special needs <strong>of</strong> women(such as domestic violence and sexual assault) (Booth & McLaughl<strong>in</strong>, 2000).This study found that although three quarter <strong>of</strong> facilities report provid<strong>in</strong>g genderappropriateand sensitive counsell<strong>in</strong>g services, a smaller proportion <strong>of</strong> facilities provideservices that address women’s issues (such as trauma and violence) and use genderappropriate assessment tools. Only 1 facility (<strong>in</strong> Mpumalanga) provides womenfocused/women-onlytreatment services. Only half <strong>of</strong> the facilities provide staff withspecial tra<strong>in</strong><strong>in</strong>g <strong>in</strong> gender-related issues that may be pert<strong>in</strong>ent to treatment (such asdomestic violence). It should be noted that even though facilities may report theprovision <strong>of</strong> women-sensitive services, this lack <strong>of</strong> tra<strong>in</strong><strong>in</strong>g <strong>in</strong> gender-related issues mayaffect the extent to which these services effectively address gender-specific issues, andultimately the retention <strong>of</strong> female substance abusers <strong>in</strong> treatment.While these f<strong>in</strong>d<strong>in</strong>gs represent an improvement on f<strong>in</strong>d<strong>in</strong>gs from previous audits <strong>of</strong>substance abuse treatment facilities <strong>in</strong> Gauteng (Myers, 2004), they are still cause forconcern as previous research has identified treatment facilities’ failure to have a gendersensitivetreatment approach as a factor that limits female clients engagement andretention <strong>in</strong> treatment (Booth & McLaughl<strong>in</strong>, 2000). In addition, these f<strong>in</strong>d<strong>in</strong>gs highlightthe need to provide treatment staff with tra<strong>in</strong><strong>in</strong>g on topics such as domestic violence,victimisation, and trauma that may be pert<strong>in</strong>ent to female substance abusers as well as theneed to provide staff with tra<strong>in</strong><strong>in</strong>g on gender-sensitive treatment approaches.75
Age appropriate servicesAccess to age and developmentally appropriate services is a key <strong>in</strong>gredient <strong>of</strong> effectivetreatment for young people (NIDA, 2006). F<strong>in</strong>d<strong>in</strong>gs show that a relatively largeproportion <strong>of</strong> facilities report us<strong>in</strong>g age appropriate assessment tools, provide counsell<strong>in</strong>gservices that are age and developmentally appropriate, conduct family-focused<strong>in</strong>terventions, and employ staff tra<strong>in</strong>ed to work with adolescents and young people. Incomparison, just over half <strong>of</strong> the facilities provide family reunification services foradolescents as well as adapt their facility environment to ensure the safety <strong>of</strong> youngpeople. However, a very small proportion <strong>of</strong> facilities provide adolescentfocused/adolescent-onlytreatment services. The latter f<strong>in</strong>d<strong>in</strong>g is surpris<strong>in</strong>g <strong>in</strong> relation tothe reported staff capacity tra<strong>in</strong>ed to work with adolescents and young people.In addition, this factor potentially <strong>in</strong>hibits young people from be<strong>in</strong>g reta<strong>in</strong>ed <strong>in</strong> treatment,with young clients be<strong>in</strong>g more likely to rema<strong>in</strong> <strong>in</strong> facilities that provide age appropriateservices. For example, facilities which provide family-focused <strong>in</strong>terventions and whichadapt facility environments to make them suitable for young people treat a significantlygreater proportion <strong>of</strong> clients younger than 20 years <strong>of</strong> age than facilities without theseservices. Although treatment facilities may serve a higher proportion <strong>of</strong> adolescent clientsbecause they provide age appropriate services, it is also possible that certa<strong>in</strong> facilitiesexam<strong>in</strong>e the appropriateness <strong>of</strong> their services because a high proportion <strong>of</strong> their clientsare adolescents. To fully understand these f<strong>in</strong>d<strong>in</strong>gs, further <strong>in</strong>vestigation <strong>in</strong>to therelationships among demographic pr<strong>of</strong>ile, treatment needs, and factors facilitat<strong>in</strong>gtreatment retention for recipients <strong>of</strong> substance abuse treatment is needed.4.4. MONITORING AND EVALUATION IN SUBSTANCE ABUSETREATMENT FACILITIESResearch has emphasised the importance <strong>of</strong> monitor<strong>in</strong>g and evaluat<strong>in</strong>g (M & E) theprocess and outcomes <strong>of</strong> substance abuse treatment, not only because M & E helpsidentify areas <strong>in</strong> which treatment programmes and service delivery can be improved, butalso because evidence <strong>of</strong> treatment effectiveness can be used to <strong>in</strong>form decision-mak<strong>in</strong>gabout the rational distribution <strong>of</strong> human and f<strong>in</strong>ancial resources to substance abusetreatment services (Cole, 1999). This study exam<strong>in</strong>ed M & E activities that facilitate (i)the monitor<strong>in</strong>g <strong>of</strong> clients’ progress dur<strong>in</strong>g the course <strong>of</strong> treatment, (ii) the monitor<strong>in</strong>g <strong>of</strong>76
clients progress post-treatment, and (iii) the evaluation <strong>of</strong> substance abuse treatmentprogrammes.This study exam<strong>in</strong>ed adm<strong>in</strong>istrative and procedural structures and activities that facilitatethe monitor<strong>in</strong>g <strong>of</strong> client progress dur<strong>in</strong>g the course <strong>of</strong> treatment. F<strong>in</strong>d<strong>in</strong>gs show that mosttreatment facilities report hav<strong>in</strong>g good adm<strong>in</strong>istrative systems and structures thatfacilitate the monitor<strong>in</strong>g <strong>of</strong> clients with<strong>in</strong>-treatment and more than half <strong>of</strong> the facilitiesreport monitor<strong>in</strong>g clients post-treatment. While all treatment facilities report develop<strong>in</strong>g<strong>in</strong>dividualised treatment plans for each client and keep notes <strong>of</strong> clients’ progress dur<strong>in</strong>gtreatment; a smaller percentage <strong>of</strong> facilities obta<strong>in</strong> collateral <strong>in</strong>formation from varioussources; have formal discharge plans for each client and ma<strong>in</strong>ta<strong>in</strong> a formal management<strong>in</strong>formation system; and only 62.5% <strong>of</strong> facilities track clients’ progress once theycomplete treatment. These f<strong>in</strong>d<strong>in</strong>gs are similar to f<strong>in</strong>d<strong>in</strong>gs from previous audits <strong>of</strong>treatment facilities <strong>in</strong> Gauteng and KwaZulu-Natal (Myers & Fakier, 2007), Gauteng(Myers, 2004) and Cape Town (Myers & Parry, 2003).F<strong>in</strong>d<strong>in</strong>gs suggest a discrepancy between the proportion <strong>of</strong> facilities that systematicallymonitor clients’ progress post-treatment and the (large) proportion <strong>of</strong> facilities that reportmonitor<strong>in</strong>g clients’ progress post-treatment via telephone and dur<strong>in</strong>g follow-upcounsell<strong>in</strong>g sessions. A possible explanation for this apparent discrepancy may lie <strong>in</strong> thefact that telephonic monitor<strong>in</strong>g and monitor<strong>in</strong>g dur<strong>in</strong>g follow-up counsell<strong>in</strong>g sessions arerelatively <strong>in</strong>formal and unstructured ways <strong>of</strong> track<strong>in</strong>g clients’ progress; whereas postdischargemonitor<strong>in</strong>g refers to a more formalised system <strong>of</strong> monitor<strong>in</strong>g where self-reportquestionnaires and/or blood and ur<strong>in</strong>e tests are used to establish the extent to whichclients have achieved and ma<strong>in</strong>ta<strong>in</strong>ed treatment goals. This explanation seems to besupported by the f<strong>in</strong>d<strong>in</strong>gs that only 43.8% <strong>of</strong> facilities report the use <strong>of</strong> blood tests and/orur<strong>in</strong>alysis to monitor clients’ substance use and only 18.8% <strong>of</strong> facilities use structuredfollow-up questionnaires to track clients’ progress post-treatment. In addition, just overhalf <strong>of</strong> the facilities monitor clients on an ad hoc basis or on request <strong>of</strong> family members.These f<strong>in</strong>d<strong>in</strong>gs mirror f<strong>in</strong>d<strong>in</strong>gs from audits <strong>of</strong> substance abuse treatment facilities <strong>in</strong> CapeTown (Myers & Parry, 2003), Gauteng (Myers, 2004) as well as Gauteng and KwaZulu-Natal (Myers & Fakier, 2007).77
In terms <strong>of</strong> activities relat<strong>in</strong>g to programme evaluation, f<strong>in</strong>d<strong>in</strong>gs show that few facilities<strong>in</strong> Free State, Limpopo, Mpumalanga, North West and Northern Cape have conductedformal evaluations <strong>of</strong> their treatment programmes. More specifically, less than half <strong>of</strong> thefacilities surveyed report hav<strong>in</strong>g conducted a treatment outcomes evaluation <strong>of</strong> theirprogramme; half <strong>of</strong> the facilities have conducted a process evaluation <strong>of</strong> theirprogramme/s; with a similar proportion hav<strong>in</strong>g evaluated the quality <strong>of</strong> their treatmentservices. Despite this, many treatment facilities make statements about their treatment“success rate.” This is cause for concern as it is impossible to make accurate claims abouttreatment “success rates” without hav<strong>in</strong>g conducted an outcome evaluation.It should be noted that the costs <strong>of</strong> conduct<strong>in</strong>g formal programme evaluations are <strong>of</strong>tenhigh, and facilities that rely on public fund<strong>in</strong>g for f<strong>in</strong>ancial susta<strong>in</strong>ability may not havef<strong>in</strong>ancial resources available for research and evaluation. [All <strong>of</strong> the facilities thatparticipated <strong>in</strong> this study have non-pr<strong>of</strong>it status.] Nonetheless, as f<strong>in</strong>d<strong>in</strong>gs fromprogramme evaluations can be used to both improve service quality (and client outcomes)and to motivate fund<strong>in</strong>g agencies for additional treatment resources, it is vital that nonpr<strong>of</strong>itfacilities afford greater priority to programme evaluation activities.F<strong>in</strong>ally, many facilities displayed poor understand<strong>in</strong>gs <strong>of</strong> the terms “monitor<strong>in</strong>g” and“evaluation.” This reflects a need for substance abuse practitioners to be tra<strong>in</strong>ed <strong>in</strong> i) theimportance <strong>of</strong> monitor<strong>in</strong>g and evaluation for programme plann<strong>in</strong>g and serviceimprovement, ii) basic pr<strong>in</strong>ciples <strong>of</strong> monitor<strong>in</strong>g and evaluation (such as the identification<strong>of</strong> suitable <strong>in</strong>dicators for monitor<strong>in</strong>g and evaluat<strong>in</strong>g substance abuse treatmentprogrammes), and iii) systems for the rout<strong>in</strong>e monitor<strong>in</strong>g <strong>of</strong> clients with<strong>in</strong> and posttreatment.4.5. RECOMMENDATIONSTo improve the availability and utilisation <strong>of</strong> substance abuse treatment facilitiesAvailability <strong>of</strong> treatment services• In general, the availability <strong>of</strong> affordable treatment options needs to be <strong>in</strong>creased. Acost-effective way <strong>of</strong> achiev<strong>in</strong>g this would be to <strong>in</strong>crease the number <strong>of</strong> state-fundedoutpatient facilities.78
• The number <strong>of</strong> state facilities for substance abuse treatment needs to be <strong>in</strong>creased.The establishment <strong>of</strong> more state-funded outpatient facilities may be a means <strong>of</strong>provid<strong>in</strong>g cost-effective substance abuse treatment services that are accessible to allsectors <strong>of</strong> the population. This should be considered for Limpopo, Mpumalanga,North West and Northern Cape, given that there are no state outpatient facilities <strong>in</strong>these prov<strong>in</strong>ces. In addition, there are no state <strong>in</strong>patient facilities <strong>in</strong> Free State,Limpopo, North West and Northern Cape.• The occupancy rates <strong>of</strong> available treatment facilities need to be maximised,specifically <strong>in</strong> Free State and Mpumalanga. Research that identifies the factorsunderp<strong>in</strong>n<strong>in</strong>g the under-utilisation <strong>of</strong> substance abuse treatment facilities (such asclient loads, staff competencies, and facility resources) needs to be conducted. Basedon the f<strong>in</strong>d<strong>in</strong>gs <strong>of</strong> this research, <strong>in</strong>terventions that target the factors underp<strong>in</strong>n<strong>in</strong>g thisunder-utilisation should be designed, implemented and evaluated.Improv<strong>in</strong>g treatment capacity• <strong>Treatment</strong> capacity needs to be <strong>in</strong>creased at exist<strong>in</strong>g facilities.• One way <strong>of</strong> improv<strong>in</strong>g capacity would be to <strong>in</strong>crease the number <strong>of</strong> pr<strong>of</strong>essional staffat treatment facilities. Additional fund<strong>in</strong>g needs to be earmarked for this purpose.To improve the diversity <strong>of</strong> services and range <strong>of</strong> services provided through<strong>in</strong>creas<strong>in</strong>g access to ancillary health and mental health services• A comprehensive, <strong>in</strong>tegrated range <strong>of</strong> services that <strong>in</strong>cludes access to ancillarymedical and mental health treatment services should be accessible at all treatmentfacilities.Unmet mental health needs• All clients should be assessed for co-occurr<strong>in</strong>g mental health disorders and ancillaryhealth problems.• All clients who require detoxification services should have access to these services -either directly or <strong>in</strong>directly through referral to state hospital detoxificationprogrammes.79
• To ensure that clients have access to detoxification services, the availability <strong>of</strong>detoxification services with<strong>in</strong> the public health services sector needs to be prioritised.This is important, as access to detoxification is a major barrier to treatment entry.• <strong>Facilities</strong> should be encouraged to <strong>in</strong>corporate health risk-reduction <strong>in</strong>terventions <strong>in</strong>totheir treatment programmes. These <strong>in</strong>terventions should focus on HIV prevention(i.e. reduc<strong>in</strong>g substance use-related sexual risks) and harm reduction <strong>in</strong>terventions for<strong>in</strong>jection drug users.• The number <strong>of</strong> staff provid<strong>in</strong>g mental health services (such as psychologists andpsychiatrists) needs to be <strong>in</strong>creased. Fund<strong>in</strong>g needs to be made available for thispurpose.Unmet medical needs• All clients should be assessed for co-occurr<strong>in</strong>g health disorders and health-relatedrisks, such as risk for HIV and other <strong>in</strong>fectious disease.• Research, which exam<strong>in</strong>es the extent to which clients at outpatient facilities haveunmet mental health needs, should occur as a matter <strong>of</strong> urgency. If there are unmetmental health needs at these facilities, <strong>in</strong>terventions should focus on improv<strong>in</strong>g accessto ancillary mental health services at outpatient facilities.Case management• While it is not always f<strong>in</strong>ancially feasible to provide on-site access to ancillary andmental health treatment services, facilities should be encouraged to provide eitherdirect on-site access or <strong>in</strong>direct access via referral to agencies specialis<strong>in</strong>g <strong>in</strong> mentalhealth-related problems.• Where facilities do not directly provide access to ancillary services, a casemanagement approach should ensure that clients receive the ancillary services asplanned. The role <strong>of</strong> the case manager should be to ensure that clients are l<strong>in</strong>ked toexternal service providers and that they are able to access these services.80
• Another way <strong>of</strong> ensur<strong>in</strong>g (<strong>in</strong>direct) access to ancillary services is through precontract<strong>in</strong>gexternal service providers to ensure that they are available to provideancillary services when these services are required.To address barriers to treatment entry for underserved groups• Awareness should be raised among treatment providers about the importance <strong>of</strong>address<strong>in</strong>g barriers to treatment entry for clients from historically underserved groups.Logistic and affordability barriers• Logistic barriers to treatment can be addressed through the <strong>in</strong>direct costs associatedwith treatment (e.g. transport and child care). These <strong>in</strong>direct costs may preventpoorer clients from seek<strong>in</strong>g treatment.• Although it is not feasible to provide transport services to all poor clients, transportrelatedbarriers can be ameliorated by ensur<strong>in</strong>g that new services are geographicallyaccessible to poor communities. One way <strong>of</strong> meet<strong>in</strong>g this standard is through the<strong>in</strong>troduction <strong>of</strong> mobile outpatient services that travel from community to communityrather than be<strong>in</strong>g purely facility-based.Awareness barriers• Awareness-related barriers should cont<strong>in</strong>ue to be addressed among vulnerable anddisadvantaged communities.• To facilitate this, facilities should be encouraged to employ dedicated outreachworkers who can focus on rais<strong>in</strong>g awareness <strong>of</strong> services and distribut<strong>in</strong>g <strong>in</strong>formationand materials among at-risk communities.• Although headway has been made <strong>in</strong> improv<strong>in</strong>g awareness <strong>of</strong> substance abuse,facilities need to give <strong>in</strong>creased attention to outreach <strong>in</strong> <strong>in</strong>ner city areas.Cultural and l<strong>in</strong>guistic barriers• Cultural and l<strong>in</strong>guistic barriers to treatment entry, engagement and retention amongBlack/African clients should be addressed as a matter <strong>of</strong> urgency, especially <strong>in</strong> theNorthern Cape.81
Improv<strong>in</strong>g the cultural, gender and age appropriateness <strong>of</strong> servicesCultural and l<strong>in</strong>guistic appropriateness <strong>of</strong> services• The cultural and l<strong>in</strong>guistic appropriateness <strong>of</strong> services needs to be improved.• L<strong>in</strong>guistic factors can be addressed through <strong>of</strong>fer<strong>in</strong>g treatment services <strong>in</strong> a number <strong>of</strong>languages (when the clients served speak a number <strong>of</strong> languages), employ<strong>in</strong>gmultil<strong>in</strong>gual staff as members <strong>of</strong> the cl<strong>in</strong>ical/treatment team, employ<strong>in</strong>g Africanlanguage-speak<strong>in</strong>g therapists, and ensur<strong>in</strong>g that treatment programme materials areavailable <strong>in</strong> a number <strong>of</strong> languages.• Tra<strong>in</strong><strong>in</strong>g programmes should also be developed that <strong>in</strong>crease the cultural sensitivity <strong>of</strong>exist<strong>in</strong>g treatment programmes and materials. For example, these tra<strong>in</strong><strong>in</strong>gprogrammes can explore the cultural mean<strong>in</strong>gs and understand<strong>in</strong>gs associated withalcohol and drug use and substance use disorders.Gender appropriateness <strong>of</strong> services• The proportion <strong>of</strong> women treated at exist<strong>in</strong>g treatment facilities needs to be improved.• The extent to which exist<strong>in</strong>g services are sensitive to the needs <strong>of</strong> female substanceabusers needs to be improved.• This can be addressed through <strong>of</strong>fer<strong>in</strong>g treatment services for women-only andthrough the provision <strong>of</strong> counsell<strong>in</strong>g services that are sensitive to the multiple needs<strong>of</strong> female substance users, <strong>in</strong>clud<strong>in</strong>g the need for <strong>in</strong>terventions relat<strong>in</strong>g to sexualabuse histories, domestic violence and PTSD.• Tra<strong>in</strong><strong>in</strong>g programmes should also be developed that <strong>in</strong>crease the gender sensitivity <strong>of</strong>exist<strong>in</strong>g treatment programmes and materials. For example, these tra<strong>in</strong><strong>in</strong>gprogrammes can explore the multiple needs <strong>of</strong> substance us<strong>in</strong>g women, key barriersto their treatment process, and effective treatment strategies for women.Age appropriateness <strong>of</strong> services• The extent to which exist<strong>in</strong>g services are age and developmentally appropriate foradolescents and young people needs to be exam<strong>in</strong>ed.82
• The age appropriateness <strong>of</strong> services can be improved through adapt<strong>in</strong>g programmesdirected for adults to the developmental needs <strong>of</strong> young people as well as through<strong>in</strong>troduc<strong>in</strong>g evidence-based treatment models that target adolescents specifically, suchas multisystemic family therapy (NIDA, 2006).• In order to ensure the appropriateness <strong>of</strong> services for young people, facilities shouldalso be encouraged to <strong>in</strong>clude family members <strong>in</strong> the treatment process. This can bedone by provid<strong>in</strong>g family reunification services as well as by provid<strong>in</strong>g familyfocusedcounsell<strong>in</strong>g services.To improve treatment service plann<strong>in</strong>g and delivery through research andmonitor<strong>in</strong>g and evaluation activitiesNational audit• As part <strong>of</strong> the monitor<strong>in</strong>g <strong>of</strong> the quality <strong>of</strong> substance abuse treatment services, and toensure that facilities endorsed by the state deliver adequate and appropriate services, anational treatment audit should be conducted on a regular basis (at least once everytwo years).• F<strong>in</strong>d<strong>in</strong>gs from this national audit should be used to <strong>in</strong>form decision-mak<strong>in</strong>g about (i)the allocation <strong>of</strong> fund<strong>in</strong>g and other resources to exist<strong>in</strong>g facilities and (ii) thedevelopment <strong>of</strong> new services. This decision-mak<strong>in</strong>g should be <strong>in</strong>formed by the extentto which facilities provide services to historically underserved groups.National prevalence study <strong>of</strong> substance use disorders and unmet treatment need• To prevent duplication <strong>of</strong> services and enable maximisation <strong>of</strong> scarce resources, anational survey exam<strong>in</strong><strong>in</strong>g the prevalence <strong>of</strong> substance use disorders and theprevalence <strong>of</strong> unmet need for substance abuse treatment services should be conductedon a regular basis (at least once every two years). F<strong>in</strong>d<strong>in</strong>gs from this survey will helpidentify underserved communities where there is the greatest need for services andfacilitate the rational allocation <strong>of</strong> new treatment resources.83
Monitor<strong>in</strong>g and evaluation• <strong>Substance</strong> abuse treatment facilities should, as a condition <strong>of</strong> registration and fund<strong>in</strong>g,conduct comprehensive evaluations <strong>of</strong> their treatment programmes once every fiveyears.• To cover the costs <strong>of</strong> these evaluations, 10% <strong>of</strong> all grant monies and public fund<strong>in</strong>gallocated to substance abuse treatment facilities should be r<strong>in</strong>g-fenced for programmeevaluation purposes. This should be a condition <strong>of</strong> public fund<strong>in</strong>g.• Capacity to conduct client monitor<strong>in</strong>g and programme evaluations with<strong>in</strong> substanceabuse treatment facilities needs to be developed. The state should consider provid<strong>in</strong>gpublicly funded treatment facilities with <strong>in</strong>troductory courses to client monitor<strong>in</strong>g andprogramme evaluation that <strong>in</strong>clude the provision <strong>of</strong> basic tools to facilitate theseactivities. The World Health Organisation has developed a framework forprogramme evaluation with<strong>in</strong> substance abuse treatment services that may serve as auseful start<strong>in</strong>g po<strong>in</strong>t.• Research which evaluates the relative efficacy <strong>of</strong> treatment programmes that providecomprehensive services (that is, core addiction treatment services and ancillarymental health and medical treatment services) and programmes that provide coreaddiction services only is required. F<strong>in</strong>d<strong>in</strong>gs from this research may providejustification for the provision <strong>of</strong> a more comprehensive range <strong>of</strong> services at substanceabuse treatment facilities.84
REFERENCE<strong>SA</strong>llard, S.W., Tolman, R.M., & Rosen, D. (2003). The geography <strong>of</strong> need: Spatial distribution <strong>of</strong>barriers to employment <strong>in</strong> Metropolitan Detroit. The Policy Studies Journal, 31: 293-306.Appel, P.W., Ellison, A.A., Jansky, H.K., & Oldak, R. (2004). Barriers to enrollment <strong>in</strong> drugabuse treatment and suggestions for reduc<strong>in</strong>g them: Op<strong>in</strong>ions <strong>of</strong> drug <strong>in</strong>ject<strong>in</strong>g street outreachclients and other system stakeholders. American Journal <strong>of</strong> Drug & Alcohol <strong>Abuse</strong>, 30: 129–153.Arif, A., & Westermeyer, A. (1998). A manual for drug and alcohol abuse: Guidel<strong>in</strong>es forteach<strong>in</strong>g. Plenum Press: New York.Beardsley, K., Wish, E.D., Fitzelle, D.B., O’Grady, K., & Arria, A.M. (2003). Distance travelledto outpatient drug treatment and client retention. Journal <strong>of</strong> <strong>Substance</strong> <strong>Abuse</strong> <strong>Treatment</strong>, 25: 279-285.Booth, B.M., & McLaughl<strong>in</strong>, Y.S. (2000). Barriers to and need for alcohol services for women<strong>in</strong> rural populations. Alcoholism: Cl<strong>in</strong>ical & Experimental Research, 24: 1267-1275.Carise, D., McLellan, A.T., & Gifford, LS. (2002). Develop<strong>in</strong>g a national addiction treatment<strong>in</strong>formation system. Unpublished manuscript.Central Drug Authority (CDA) (2003). Annual report: 2003. National Department <strong>of</strong> SocialDevelopment: Pretoria.Coetzee, P. (2001). Evaluation <strong>of</strong> Cape Town Drug Counsell<strong>in</strong>g Centre. Unpublished master’sthesis, University <strong>of</strong> Cape Town, Cape Town.Coetzee, P. (2004). Stepp<strong>in</strong>g Stones evaluation. In A. Plüddemann, S. Hon, A. Bhana, N.Harker., & H. Potgieter (Eds.), South African Community Epidemiology Network on Drug Use(<strong>SA</strong>CENDU). Monitor<strong>in</strong>g alcohol and drug abuse trends <strong>in</strong> South Africa, 2004 (pp. 124-128).South African Medical Research Council: Cape Town.Cole, G.E. (1999). Advanc<strong>in</strong>g the development and application <strong>of</strong> theory-based evaluation <strong>in</strong> thepractice <strong>of</strong> public health. American Journal <strong>of</strong> Evaluation, 20: 453-471.De Silva, H.J., Peris, M., Samaras<strong>in</strong>ghe, D.S., & Ellawala, N.S. (1992). A 2-year follow upstudy <strong>of</strong> alcohol dependent men rehabilitated at a special unit <strong>in</strong> a develop<strong>in</strong>g country. BritishJournal <strong>of</strong> Addiction, 87: 1409-1414.Dew<strong>in</strong>g, S., Plüddemann, A., Myers, B.J., & Parry, C.D.H. (2006). Review <strong>of</strong> <strong>in</strong>jection drug use<strong>in</strong> six African countries: Egypt, Kenya, Mauritius, Nigeria, South Africa and Tanzania. Drugs:Education, Prevention & Policy, 13: 121-137.Durk<strong>in</strong>, E.M. (2002). An organisational analysis <strong>of</strong> psychosocial and medical services <strong>in</strong>outpatient drug abuse treatment programs. Social Service Review, 406-429.Flisher, A.J., & Chalton, D.O. (2001). Adolescent contraceptive non-use and covariation amongrisk behaviors. Journal <strong>of</strong> Adolescent Health, 28: 235-241.Freeman, M. (2000). Us<strong>in</strong>g all opportunities for improv<strong>in</strong>g mental health. Examples from SouthAfrica. Bullet<strong>in</strong> <strong>of</strong> the World Health Organization, 78: 508-10.85
Friedmann, P.D., Lemon, S.C., & Ste<strong>in</strong>, M.D. (2001). Transportation and retention <strong>in</strong> outpatientdrug abuse treatment programmes. Journal <strong>of</strong> <strong>Substance</strong> <strong>Abuse</strong> <strong>Treatment</strong>, 21: 97-103.Friedmann, P.D., Alexander, J.A., & D’Aunno, T.A. (1999). Organisational correlates <strong>of</strong> accessto primary care and mental health services <strong>in</strong> drug abuse treatment units. Journal <strong>of</strong> <strong>Substance</strong><strong>Abuse</strong> <strong>Treatment</strong>, 16: 71-80.Goosen, J., Bowley, D.M., Degiannis, E., & Plani, F. (2003). Trauma care systems <strong>in</strong> SouthAfrica. Injury, 34: 704-8.Gossop, M., Marsden, J., Stewart, D., & Treacy, S. (2001). Outcomes after methadonema<strong>in</strong>tenance and methadone reduction treatments: Two-year follow-up results from the National<strong>Treatment</strong> Outcome Research Study. Drug & Alcohol Dependence, 62: 255-64.Grant, B., & Petrie, M. (2001). Alcohol and other drug treatment services. Development <strong>of</strong> anational m<strong>in</strong>imum data set. Australian Institute <strong>of</strong> Health and Welfare: Canberra.Grant, B.F. (1997). Barriers to alcoholism treatment: Reasons for not seek<strong>in</strong>g treatment <strong>in</strong> ageneral population sample. Journal <strong>of</strong> Studies on Alcohol, 58: 365–371.Hser, Y.I., Maglione, M., Pol<strong>in</strong>sky, M.L., & Angl<strong>in</strong>, D. (1998). Predict<strong>in</strong>g drug treatment entryamong treatment-seek<strong>in</strong>g <strong>in</strong>dividuals. Journal <strong>of</strong> <strong>Substance</strong> <strong>Abuse</strong> <strong>Treatment</strong>, 15: 213–220.Kalichman, S.C., Simbayi, L.C., Kagee, A., Toefy, Y., Jooste, S., Ca<strong>in</strong>, D., & Cherry, C. (2006).Associations <strong>of</strong> poverty, substance use, and HIV transmission risk behaviors <strong>in</strong> three SouthAfrican communities. Social Science & Medic<strong>in</strong>e, 62: 1641-1649.Kaplan, E. H., & Johri, M. (2000). <strong>Treatment</strong> on demand: An operational model. Health CareManagement Science, 3: 171–183.Joe, G.W., Broome, K.M., Rowan-Szal, G.A., & Dwayne Simpson, D. (2002). Measur<strong>in</strong>g patientattributes and engagement <strong>in</strong> treatment. Journal <strong>of</strong> <strong>Substance</strong> <strong>Abuse</strong> <strong>Treatment</strong>, 22: 183-196.Latk<strong>in</strong>, C.A., Williams, C., Wang, J., & Curry, A.D. (2005). Neighborhood social disorder as adeterm<strong>in</strong>ant <strong>of</strong> drug <strong>in</strong>jection behaviors: A structural equation model<strong>in</strong>g approach. HealthPsychology, 24: 96-100.Lee, M.T., Reif, S., Ritter, G.A., Lev<strong>in</strong>e, H. J., & Horgan, C.M. (2001). Access to services <strong>in</strong>the substance abuse treatment system. In Glanater, M. (ed). Alcoholism. Volume 15: Servicesresearch <strong>in</strong> the era <strong>of</strong> managed care. Organisation, access, economics, outcome (pp. 137-156).Kluwer Academics: New York.Mejita, C., & Bokos, P.R. (1997). Improv<strong>in</strong>g substance abuse treatment access and retentionus<strong>in</strong>g a case management approach. Journal <strong>of</strong> Drug Issues, 27: 1-9.Myers, B. (2004). Report on audit <strong>of</strong> substance abuse treatment facilities <strong>in</strong> Gauteng (2003).Medical Research Council: Parow.Myers, B. (2007). Access to substance abuse treatment for historically disadvantagedcommunities <strong>in</strong> Cape Town. Medical Research Council: Parow.86
Myers, B., & Fakier, N. (2007). Report on audit <strong>of</strong> substance abuse treatment facilities <strong>in</strong>Gauteng and KwaZulu-Natal (2006-2007). Medical Research Council: Parow.Myers, B., & Parry, C.D.H. (2003). Report on audit <strong>of</strong> substance abuse treatment facilities <strong>in</strong>Cape Town (2002). Medical Research Council: Parow.Myers, B., & Parry, C.D.H. (2005). Access to substance abuse treatment for Black SouthAfricans: F<strong>in</strong>d<strong>in</strong>gs from audits <strong>of</strong> specialist substance abuse treatment facilities. South AfricanPsychiatry Review, 8: 15-19.Myers, B., Parry, C.D.H., & Plüddemann, A. (2004). Indicators <strong>of</strong> substance abuse treatmentdemand <strong>in</strong> Cape Town, South Africa: 1997-2001. Curationis, 27: 27-31.National Department <strong>of</strong> Health (1997). White paper on the transformation <strong>of</strong> the health system,April 1997. South African Department <strong>of</strong> Health: Pretoria.National Department <strong>of</strong> Social Development (1997). White paper on the transformation <strong>of</strong> thesocial welfare system. South African Department <strong>of</strong> Social Development: Pretoria.National Department <strong>of</strong> Social Development (2006). Draft: Revised prevention and treatment <strong>of</strong><strong>Substance</strong> <strong>Abuse</strong> Act. South African Department <strong>of</strong> Social Development: Pretoria.National Institute on Drug <strong>Abuse</strong> (2006). Pr<strong>in</strong>ciples <strong>of</strong> drug addiction treatment: A researchbasedguide. National Institute <strong>of</strong> Health: Wash<strong>in</strong>gton.Parry, C.D.H., Bhana, A., Myers, B., Plüddemann, A., Flisher, A.J., Peden, M., & Morojele, N.K.(2002a). Alcohol use <strong>in</strong> South Africa: F<strong>in</strong>d<strong>in</strong>gs from The South African CommunityEpidemiology Network on Drug Use (<strong>SA</strong>CENDU) Project. Journal <strong>of</strong> Studies on Alcohol, 63:430-435.Parry, C.D.H., Bhana, A., Plüddemann, A., Myers, B., Siegfried, N., Morojele, N.K., Flisher,A.J., & Kozel, N. (2002b). The South African Community Epidemiology Network on Drug Use(<strong>SA</strong>CENDU): Description, f<strong>in</strong>d<strong>in</strong>gs (1997-1999), and policy implications. Addiction, 97: 969-976.Parry, C.D.H., Plüddemann, A., Steyn, K., Bradshaw, D., Norman, R., & Laubsher R. (2005).Alcohol use <strong>in</strong> South Africa: F<strong>in</strong>d<strong>in</strong>gs from the first demographic and health survey (1998).Journal <strong>of</strong> Studies on Alcohol, 66: 91-97.Pauw, K. (2005). A pr<strong>of</strong>ile <strong>of</strong> the Limpopo prov<strong>in</strong>ce: Demographics, poverty, <strong>in</strong>equality, andunemployment. Provide Project: Elsenburg.Perngpam, U., & Porncharoen,W. (2001). An evaluation <strong>of</strong> government run substance misusetreatment centres. World Health Organisation: Bangkok, Thailand.Sanders, D., & Chopra, M. (2006). Key challenges to achiev<strong>in</strong>g health for all <strong>in</strong> an <strong>in</strong>equitablesociety: The case <strong>of</strong> South Africa. American Journal <strong>of</strong> Public Health, 96: 73-78.Sawyer, K. M., Wechsberg, W. M., & Myers, B. (2006). Cultural similarities and differencesbetween a sample <strong>of</strong> Black/African and Coloured women <strong>in</strong> South Africa: Convergence <strong>of</strong> riskrelated to substance use, sexual behaviour, and violence. Women & Health, 43: 73-92.87
Schober, R., & Annis, H.M. (1996). Barriers to help-seek<strong>in</strong>g for change <strong>in</strong> dr<strong>in</strong>k<strong>in</strong>g: A genderfocusedreview <strong>of</strong> the literature. Addictive Behaviors, 21: 81–92.Simpson, D. D., Joe, G. W., & Brown, B. S. (1997). <strong>Treatment</strong> retention and follow-up outcomes<strong>in</strong> the Drug <strong>Abuse</strong> <strong>Treatment</strong> Outcome Study (DATOS). Psychology <strong>of</strong> Addictive Behaviors, 11:294-307.Statistics South Africa (1998a). Liv<strong>in</strong>g <strong>in</strong> Free State. Statistics South Africa: Pretoria.Statistics South Africa (1998b). Liv<strong>in</strong>g <strong>in</strong> North West. Statistics South Africa: Pretoria.Statistics South Africa (1998c). Liv<strong>in</strong>g <strong>in</strong> Northern Cape. Statistics South Africa: Pretoria.Statistics South Africa (2005). Mid-year population estimates, South Africa 2005. StatisticsSouth Africa: Pretoria.Statistics South Africa (2006a). Prov<strong>in</strong>cial pr<strong>of</strong>ile Free State: 2004. Statistics South Africa:Pretoria.Statistics South Africa (2006b). Prov<strong>in</strong>cial pr<strong>of</strong>ile Limpopo: 2004. Statistics South Africa:Pretoria.Statistics South Africa (2006c). Prov<strong>in</strong>cial pr<strong>of</strong>ile Mpumalanga: 2004. Statistics South Africa:Pretoria.Statistics South Africa (2006d). Prov<strong>in</strong>cial pr<strong>of</strong>ile Northern Cape: 2004. Statistics South Africa:Pretoria.Sturm R., & Sherbourne, C.D. (2001). Are barriers to mental health and substance abuse care stillris<strong>in</strong>g? Journal <strong>of</strong> Behavioral Health Services Research, 28: 81-88.Teesson, M., Havard, A., Fairbairn, S., Ross, J., Lynskey, M., & Darke, S. (2005). Depressionamong entrants to treatment for hero<strong>in</strong> dependence <strong>in</strong> the Australian <strong>Treatment</strong> Outcome Study(ATOS): Prevalence, correlates and treatment seek<strong>in</strong>g. Drug & Alcohol Dependence, 78: 309-315.Th<strong>in</strong>d, A., & Andersen, R. (2003). Respiratory illness <strong>in</strong> the Dom<strong>in</strong>ican Republic: What are thepredictors for health services utilization <strong>of</strong> young children? Social Science & Medic<strong>in</strong>e, 56:1173-1182.Torres, M. I., Mattick, R. P., Chen R., & Baillie, A. (1995). Clients <strong>of</strong> treatment service agencies:March 1995 census f<strong>in</strong>d<strong>in</strong>gs. Australian Government Publish<strong>in</strong>g Service: Canberra.Tucker, J.A., Vuch<strong>in</strong>ich, R.E., & Rippens, P.D. (2004). A factor analytic study <strong>of</strong> <strong>in</strong>fluences onpatterns <strong>of</strong> help-seek<strong>in</strong>g among treated and untreated alcohol dependent persons. Journal <strong>of</strong><strong>Substance</strong> <strong>Abuse</strong> <strong>Treatment</strong>, 26: 237–242.Wechsberg, W.M., Craddock, S.G., & Hubbard, R.L. (1998). How are women who entersubstance abuse treatment different from men. A gender comparison from the Drug <strong>Abuse</strong><strong>Treatment</strong> Outcome Study (DATOS). Drugs & Society, 13: 97-115.88
Zule, W.A., Lam, W.K., & Wechsberg, W.M. (2003). <strong>Treatment</strong> read<strong>in</strong>ess among out-<strong>of</strong>treatmentAfrican-American crack users. Journal <strong>of</strong> Psychoactive Drugs, 35: 503-510.89