Report on the State of Physical Infrastructure in Hawaii
Report on the State of Physical Infrastructure in Hawaii
Report on the State of Physical Infrastructure in Hawaii

Create successful ePaper yourself
Turn your PDF publications into a flip-book with our unique Google optimized e-Paper software.
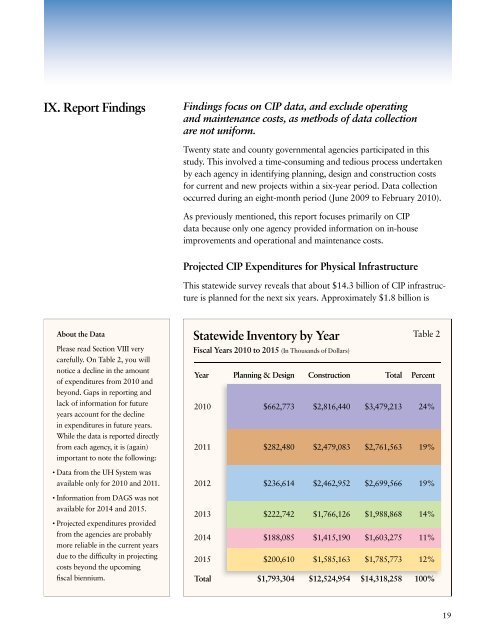
IX. <str<strong>on</strong>g>Report</str<strong>on</strong>g> F<strong>in</strong>d<strong>in</strong>gsF<strong>in</strong>d<strong>in</strong>gs focus <strong>on</strong> CIP data, and exclude operat<strong>in</strong>gand ma<strong>in</strong>tenance costs, as methods <strong>of</strong> data collecti<strong>on</strong>are not uniform.Twenty state and county governmental agencies participated <strong>in</strong> thisstudy. This <strong>in</strong>volved a time-c<strong>on</strong>sum<strong>in</strong>g and tedious process undertakenby each agency <strong>in</strong> identify<strong>in</strong>g plann<strong>in</strong>g, design and c<strong>on</strong>structi<strong>on</strong> costsfor current and new projects with<strong>in</strong> a six-year period. Data collecti<strong>on</strong>occurred dur<strong>in</strong>g an eight-m<strong>on</strong>th period (June 2009 to February 2010).As previously menti<strong>on</strong>ed, this report focuses primarily <strong>on</strong> CIPdata because <strong>on</strong>ly <strong>on</strong>e agency provided <strong>in</strong>formati<strong>on</strong> <strong>on</strong> <strong>in</strong>-houseimprovements and operati<strong>on</strong>al and ma<strong>in</strong>tenance costs.Projected CIP Expenditures for <strong>Physical</strong> <strong>Infrastructure</strong>This statewide survey reveals that about $14.3 billi<strong>on</strong> <strong>of</strong> CIP <strong>in</strong>frastructureis planned for <strong>the</strong> next six years. Approximately $1.8 billi<strong>on</strong> isAbout <strong>the</strong> DataPlease read Secti<strong>on</strong> VIII verycarefully. On Table 2, you willnotice a decl<strong>in</strong>e <strong>in</strong> <strong>the</strong> amount<strong>of</strong> expenditures from 2010 andbey<strong>on</strong>d. Gaps <strong>in</strong> report<strong>in</strong>g andlack <strong>of</strong> <strong>in</strong>formati<strong>on</strong> for futureyears account for <strong>the</strong> decl<strong>in</strong>e<strong>in</strong> expenditures <strong>in</strong> future years.While <strong>the</strong> data is reported directlyfrom each agency, it is (aga<strong>in</strong>)important to note <strong>the</strong> follow<strong>in</strong>g:• Data from <strong>the</strong> UH System wasavailable <strong>on</strong>ly for 2010 and 2011.<strong>State</strong>wide Inventory by YearTable 2Fiscal Years 2010 to 2015 (In Thousands <strong>of</strong> Dollars)Year Plann<strong>in</strong>g & Design C<strong>on</strong>structi<strong>on</strong> Total Percent2010 $662,773 $2,816,440 $3,479,213 24%2011 $282,480 $2,479,083 $2,761,563 19%2012 $236,614 $2,462,952 $2,699,566 19%• Informati<strong>on</strong> from DAGS was notavailable for 2014 and 2015.• Projected expenditures providedfrom <strong>the</strong> agencies are probablymore reliable <strong>in</strong> <strong>the</strong> current yearsdue to <strong>the</strong> difficulty <strong>in</strong> project<strong>in</strong>gcosts bey<strong>on</strong>d <strong>the</strong> upcom<strong>in</strong>gfiscal biennium.2013 $222,742 $1,766,126 $1,988,868 14%2014 $188,085 $1,415,190 $1,603,275 11%2015 $200,610 $1,585,163 $1,785,773 12%Total $1,793,304 $12,524,954 $14,318,258 100%19