Report on the State of Physical Infrastructure in Hawaii
Report on the State of Physical Infrastructure in Hawaii
Report on the State of Physical Infrastructure in Hawaii

Create successful ePaper yourself
Turn your PDF publications into a flip-book with our unique Google optimized e-Paper software.
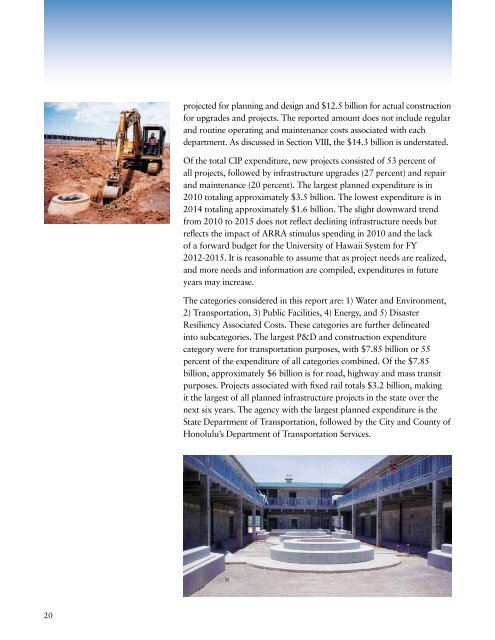
projected for plann<strong>in</strong>g and design and $12.5 billi<strong>on</strong> for actual c<strong>on</strong>structi<strong>on</strong>for upgrades and projects. The reported amount does not <strong>in</strong>clude regularand rout<strong>in</strong>e operat<strong>in</strong>g and ma<strong>in</strong>tenance costs associated with eachdepartment. As discussed <strong>in</strong> Secti<strong>on</strong> VIII, <strong>the</strong> $14.3 billi<strong>on</strong> is understated.Of <strong>the</strong> total CIP expenditure, new projects c<strong>on</strong>sisted <strong>of</strong> 53 percent <strong>of</strong>all projects, followed by <strong>in</strong>frastructure upgrades (27 percent) and repairand ma<strong>in</strong>tenance (20 percent). The largest planned expenditure is <strong>in</strong>2010 total<strong>in</strong>g approximately $3.5 billi<strong>on</strong>. The lowest expenditure is <strong>in</strong>2014 total<strong>in</strong>g approximately $1.6 billi<strong>on</strong>. The slight downward trendfrom 2010 to 2015 does not reflect decl<strong>in</strong><strong>in</strong>g <strong>in</strong>frastructure needs butreflects <strong>the</strong> impact <strong>of</strong> ARRA stimulus spend<strong>in</strong>g <strong>in</strong> 2010 and <strong>the</strong> lack<strong>of</strong> a forward budget for <strong>the</strong> University <strong>of</strong> <strong>Hawaii</strong> System for FY2012-2015. It is reas<strong>on</strong>able to assume that as project needs are realized,and more needs and <strong>in</strong>formati<strong>on</strong> are compiled, expenditures <strong>in</strong> futureyears may <strong>in</strong>crease.The categories c<strong>on</strong>sidered <strong>in</strong> this report are: 1) Water and Envir<strong>on</strong>ment,2) Transportati<strong>on</strong>, 3) Public Facilities, 4) Energy, and 5) DisasterResiliency Associated Costs. These categories are fur<strong>the</strong>r del<strong>in</strong>eated<strong>in</strong>to subcategories. The largest P&D and c<strong>on</strong>structi<strong>on</strong> expenditurecategory were for transportati<strong>on</strong> purposes, with $7.85 billi<strong>on</strong> or 55percent <strong>of</strong> <strong>the</strong> expenditure <strong>of</strong> all categories comb<strong>in</strong>ed. Of <strong>the</strong> $7.85billi<strong>on</strong>, approximately $6 billi<strong>on</strong> is for road, highway and mass transitpurposes. Projects associated with fixed rail totals $3.2 billi<strong>on</strong>, mak<strong>in</strong>git <strong>the</strong> largest <strong>of</strong> all planned <strong>in</strong>frastructure projects <strong>in</strong> <strong>the</strong> state over <strong>the</strong>next six years. The agency with <strong>the</strong> largest planned expenditure is <strong>the</strong><strong>State</strong> Department <strong>of</strong> Transportati<strong>on</strong>, followed by <strong>the</strong> City and County <strong>of</strong>H<strong>on</strong>olulu’s Department <strong>of</strong> Transportati<strong>on</strong> Services.20