View - Renato Zenobi
View - Renato Zenobi
View - Renato Zenobi

Create successful ePaper yourself
Turn your PDF publications into a flip-book with our unique Google optimized e-Paper software.
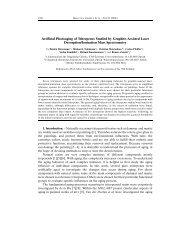
Figure 1. Schematic diagram of adjustable source region, showing(a) sample/ repeller plate, (b) two-stage extraction source, (c) threeplateEinzel lens, and (d) motors for rotation of the entire assembly.Ion trajectory shown with dotted arrow. The entire assembly isadjustable around depicted axes to focus ion packet onto smalldetector surface.of the source region while acquiring mass spectral data. Thesoftware then provides the user with a visual depiction of the ionintensity for each angular position of the source allowing easyfocusing of the ion beam onto the detector, as shown in Figure 2.From this figure it can be seen that the optimal angles of thesource were y )-6mmandx ) 0 mm, which provided thehighest number of ion counts. The ion optics test was also usedto determine a width of 2-3 mm (fwhm) for the ion beam at thedetector by sweeping the ion optics and knowing the overall areacovered by the detector, 1 mm. It has been found that after thesepositions are optimized the optimal angles remain fixed unlessthe laser or source is physically adjusted (which is uncommon).This alignment procedure is crucial for increasing analyticalsensitivity by directing the ion beam onto the relatively smalldetector.Ion Separation and Detection. For time-of-flight separationof ions, a 1.5-m linear drift region is utilized. The macromizer hasa deflection plate located within the flight tube that can be usedto move ions either onto or away from the detector for advancedion/neutral experiments. At the end of the drift region is a valveto separate the mass spectrometer region from the cryostat/detector region during maintenance and nonoperational times. Atthe entrance to the cryostat region that houses the detector, a1.5-mm-square aperture is located. This aperture helps to shieldthe low-temperature detector region from excess laser light andinfrared radiation emitted from the room-temperature walls of theflight and source chambers.The detector is a STJ array designed in a collaboration betweenVTT (VTT Technical Research Centre of Finland, Espoo, Finland)and Comet AG. Several different types of cryodetector techniqueshave been proposed, but only STJs provide adequate speed andcan be fabricated in an array fashion. It was pointed out by Franket al. that “to use a detector composed of a closely packed arrayof relatively small detector pixels, each read out by its ownelectronics” may be the ideal solution to increase the effectivearea of the detectors. 27 The macromizer instrument described inthis publication is the first to demonstrate the cryodetector arrayconcept for mass spectrometry. The detector is composed of 16Figure 2. Ion optics test conducted by rotating source region along x- and y-axis and measuring ion intensity to find optimal source position(y )-6 mm; x ) 0 mm shown). The x- and y-scales depict the distance moved on the detector surface when adjusting the ion optics. Thez-axis scale represents the number of ion events measured at each position. Relative size of detector is depicted on the side of the figure,demonstrating why ion focusing is required.Analytical Chemistry, Vol. 77, No. 14, July 15, 2005 4331