View - Renato Zenobi
View - Renato Zenobi
View - Renato Zenobi

Create successful ePaper yourself
Turn your PDF publications into a flip-book with our unique Google optimized e-Paper software.
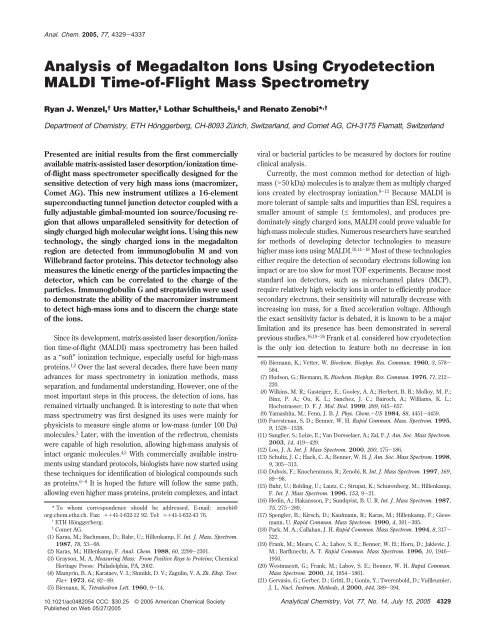
Anal. Chem. 2005, 77, 4329-4337Analysis of Megadalton Ions Using CryodetectionMALDI Time-of-Flight Mass SpectrometryRyan J. Wenzel, † Urs Matter, ‡ Lothar Schultheis, ‡ and <strong>Renato</strong> <strong>Zenobi</strong>* ,†Department of Chemistry, ETH Hönggerberg, CH-8093 Zürich, Switzerland, and Comet AG, CH-3175 Flamatt, SwitzerlandPresented are initial results from the first commerciallyavailable matrix-assisted laser desorption/ionization timeof-flightmass spectrometer specifically designed for thesensitive detection of very high mass ions (macromizer,Comet AG). This new instrument utilizes a 16-elementsuperconducting tunnel junction detector coupled with afully adjustable gimbal-mounted ion source/focusing regionthat allows unparalleled sensitivity for detection ofsingly charged high molecular weight ions. Using this newtechnology, the singly charged ions in the megadaltonregion are detected from immunoglobulin M and vonWillebrand factor proteins. This detector technology alsomeasures the kinetic energy of the particles impacting thedetector, which can be correlated to the charge of theparticles. Immunoglobulin G and streptavidin were usedto demonstrate the ability of the macromizer instrumentto detect high-mass ions and to discern the charge stateof the ions.Since its development, matrix-assisted laser desorption/ionizationtime-of-flight (MALDI) mass spectrometry has been hailedas a “soft” ionization technique, especially useful for high-massproteins. 1,2 Over the last several decades, there have been manyadvances for mass spectrometry in ionization methods, massseparation, and fundamental understanding. However, one of themost important steps in this process, the detection of ions, hasremained virtually unchanged. It is interesting to note that whenmass spectrometry was first designed its uses were mainly forphysicists to measure single atoms or low-mass (under 100 Da)molecules. 3 Later, with the invention of the reflectron, chemistswere capable of high resolution, allowing high-mass analysis ofintact organic molecules. 4,5 With commercially available instrumentsusing standard protocols, biologists have now started usingthese techniques for identification of biological compounds suchas proteins. 6-8 It is hoped the future will follow the same path,allowing even higher mass proteins, protein complexes, and intact* To whom correspondence should be addressed. E-mail: zenobi@org.chem.ethz.ch. Fax: ++41-1-632-12 92. Tel: ++41-1-632-43 76.†ETH Hönggerberg.‡Comet AG.(1) Karas, M.; Bachmann, D.; Bahr, U.; Hillenkamp, F. Int. J. Mass. Spectrom.1987, 78, 53-68.(2) Karas, M.; Hillenkamp, F. Anal. Chem. 1988, 60, 2299-2301.(3) Grayson, M. A. Measuring Mass: From Positive Rays to Proteins; ChemicalHeritage Press: Philadelphia, PA, 2002.(4) Mamyrin, B. A.; Karataev, V. I.; Shmikk, D. V.; Zagulin, V. A. Zh. Eksp. Teor.Fiz+ 1973, 64, 82-89.(5) Biemann, K. Tetrahedron Lett. 1960, 9-14.viral or bacterial particles to be measured by doctors for routineclinical analysis.Currently, the most common method for detection of highmass(>50 kDa) molecules is to analyze them as multiply chargedions created by electrospray ionization. 9-13 Because MALDI ismore tolerant of sample salts and impurities than ESI, requires asmaller amount of sample (e femtomoles), and produces predominatelysingly charged ions, MALDI could prove valuable forhigh-mass molecule studies. Numerous researchers have searchedfor methods of developing detector technologies to measurehigher mass ions using MALDI. 10,14-18 Most of these technologieseither require the detection of secondary electrons following ionimpact or are too slow for most TOF experiments. Because moststandard ion detectors, such as microchannel plates (MCP),require relatively high velocity ions in order to efficiently producesecondary electrons, their sensitivity will naturally decrease withincreasing ion mass, for a fixed acceleration voltage. Althoughthe exact sensitivity factor is debated, it is known to be a majorlimitation and its presence has been demonstrated in severalprevious studies. 16,19-26 Frank et al. considered how cryodetectionis the only ion detection to feature both no decrease in ion(6) Biemann, K.; Vetter, W. Biochem. Biophys. Res. Commun. 1960, 3, 578-584.(7) Hudson, G.; Biemann, K. Biochem. Biophys. Res. Commun. 1976, 71, 212-220.(8) Wilkins, M. R.; Gasteiger, E.; Gooley, A. A.; Herbert, B. R.; Molloy, M. P.;Binz, P. A.; Ou, K. L.; Sanchez, J. C.; Bairoch, A.; Williams, K. L.;Hochstrasser, D. F. J. Mol. Biol. 1999, 289, 645-657.(9) Yamashita, M.; Fenn, J. B. J. Phys. Chem.-US 1984, 88, 4451-4459.(10) Fuerstenau, S. D.; Benner, W. H. Rapid Commun. Mass. Spectrom. 1995,9, 1528-1538.(11) Sanglier, S.; Leize, E.; Van Dorsselaer, A.; Zal, F. J. Am. Soc. Mass Spectrom.2003, 14, 419-429.(12) Loo, J. A. Int. J. Mass Spectrom. 2000, 200, 175-186.(13) Schultz, J. C.; Hack, C. A.; Benner, W. H. J. Am. Soc. Mass Spectrom. 1998,9, 305-313.(14) Dubois, F.; Knochenmuss, R.; <strong>Zenobi</strong>, R. Int. J. Mass Spectrom. 1997, 169,89-98.(15) Bahr, U.; Rohling, U.; Lautz, C.; Strupat, K.; Schurenberg, M.; Hillenkamp,F. Int. J. Mass Spectrom. 1996, 153, 9-21.(16) Hedin, A.; Hakansson, P.; Sundqvist, B. U. R. Int. J. Mass Spectrom. 1987,75, 275-289.(17) Spengler, B.; Kirsch, D.; Kaufmann, R.; Karas, M.; Hillenkamp, F.; Giessmann,U. Rapid Commun. Mass Spectrom. 1990, 4, 301-305.(18) Park, M. A.; Callahan, J. H. Rapid Commun. Mass Spectrom. 1994, 8, 317-322.(19) Frank, M.; Mears, C. A.; Labov, S. E.; Benner, W. H.; Horn, D.; Jaklevic, J.M.; Barfknecht, A. T. Rapid Commun. Mass Spectrom. 1996, 10, 1946-1950.(20) Westmacott, G.; Frank, M.; Labov, S. E.; Benner, W. H. Rapid Commun.Mass Spectrom. 2000, 14, 1854-1861.(21) Gervasio, G.; Gerber, D.; Gritti, D.; Gonin, Y.; Twerenbold, D.; Vuilleumier,J. L. Nucl. Instrum. Methods, A 2000, 444, 389-394.10.1021/ac0482054 CCC: $30.25 © 2005 American Chemical Society Analytical Chemistry, Vol. 77, No. 14, July 15, 2005 4329Published on Web 05/27/2005
Figure 1. Schematic diagram of adjustable source region, showing(a) sample/ repeller plate, (b) two-stage extraction source, (c) threeplateEinzel lens, and (d) motors for rotation of the entire assembly.Ion trajectory shown with dotted arrow. The entire assembly isadjustable around depicted axes to focus ion packet onto smalldetector surface.of the source region while acquiring mass spectral data. Thesoftware then provides the user with a visual depiction of the ionintensity for each angular position of the source allowing easyfocusing of the ion beam onto the detector, as shown in Figure 2.From this figure it can be seen that the optimal angles of thesource were y )-6mmandx ) 0 mm, which provided thehighest number of ion counts. The ion optics test was also usedto determine a width of 2-3 mm (fwhm) for the ion beam at thedetector by sweeping the ion optics and knowing the overall areacovered by the detector, 1 mm. It has been found that after thesepositions are optimized the optimal angles remain fixed unlessthe laser or source is physically adjusted (which is uncommon).This alignment procedure is crucial for increasing analyticalsensitivity by directing the ion beam onto the relatively smalldetector.Ion Separation and Detection. For time-of-flight separationof ions, a 1.5-m linear drift region is utilized. The macromizer hasa deflection plate located within the flight tube that can be usedto move ions either onto or away from the detector for advancedion/neutral experiments. At the end of the drift region is a valveto separate the mass spectrometer region from the cryostat/detector region during maintenance and nonoperational times. Atthe entrance to the cryostat region that houses the detector, a1.5-mm-square aperture is located. This aperture helps to shieldthe low-temperature detector region from excess laser light andinfrared radiation emitted from the room-temperature walls of theflight and source chambers.The detector is a STJ array designed in a collaboration betweenVTT (VTT Technical Research Centre of Finland, Espoo, Finland)and Comet AG. Several different types of cryodetector techniqueshave been proposed, but only STJs provide adequate speed andcan be fabricated in an array fashion. It was pointed out by Franket al. that “to use a detector composed of a closely packed arrayof relatively small detector pixels, each read out by its ownelectronics” may be the ideal solution to increase the effectivearea of the detectors. 27 The macromizer instrument described inthis publication is the first to demonstrate the cryodetector arrayconcept for mass spectrometry. The detector is composed of 16Figure 2. Ion optics test conducted by rotating source region along x- and y-axis and measuring ion intensity to find optimal source position(y )-6 mm; x ) 0 mm shown). The x- and y-scales depict the distance moved on the detector surface when adjusting the ion optics. Thez-axis scale represents the number of ion events measured at each position. Relative size of detector is depicted on the side of the figure,demonstrating why ion focusing is required.Analytical Chemistry, Vol. 77, No. 14, July 15, 2005 4331
individual STJ detector elements arranged in a 4-by-4 array on asingle silicon wafer. Each element is composed of two niobiumfilms separated by a thin (1.5 nm) aluminum oxide layer.The detector used here has 16 elements of 110 µm by110µmand covers an overall area of 1 mm 2 . Gaps between the individualelements create a usable area of only 20% of this area, or 0.2 mm 2of active area. Detectors designed with 200 µm by 200 µmelements have been tested and are in use in newer versions ofthe macromizer instrument, and 300 µm by300µm elements arecurrently being tested. The 300-µm size increases the effectivearea and thereby increases the sensitivity by ∼10-fold due to thefact that the ion beam is larger than the detector.Although it is theoretically possible to increase the detectorarea even further, there are several problems that limit utilizinglarger detector elements, such as manufacturing difficulties,decreased stability, increased noise, and loss of energy resolution.27 The entire detector is housed inside a magnetic field coil,which is present to suppress Cooper pair tunneling and othereffects such as Fiske resonances. 34 Each detector element is wireddirectly to its own preamplifier and data acquisition system, whichwas designed specifically for the macromizer. The sampling rateused is 20 MHz. The dynamic range is mainly limited by theanalog amplifier of the detector and is of the order of 80. Thecost and complexity of such data systems tend to limit the numberof elements within the array. It is of note that even the wirestransmitting the electrical signal must be made of an ultrathinshielded brass with superconducting niobium tips. These materialsare used because the wires must be attached directly to thedetector elements, which must be maintained at superconductingtemperatures, therefore cannot transmit excess heat and yet mustbe able of transmitting very low signals.Cryostat. Because the STJ detector measures thermal currentsand because the materials rely upon superconducting principlesto operate, it is necessary to cool the detector to temperaturesmuch below the material’s critical temperature. To maintain thesetemperatures, the detector is housed within a multistage sorptioncooler (Janis Research Co., Inc.; Wilmington, MA). The systemwas chosen because it is a closed recirculating cryostat thateliminates daily filling or maintenance and can be completelycontrolled by software. The outside shell of the cryostat is thevacuum housing, which is at room temperature. The first stageis cooled to ∼30 K using the first stage of a Gifford-McMahon(GM) cryocooler (Sumitomo Heavy Industries, Ltd., Tokyo,Japan). The next stage is attached to the second stage of the GMcold head and maintained at ∼3 K. Finally, the detector is attachedto a coldfinger and is maintained at a temperature of ∼350 mK.The coldfinger works through 3 He evaporative cooling, which isthen trapped onto charcoal. Since there is a limited amount of3He held within the coldfinger, it is necessary to regenerate thissystem every night by warming the system slightly and forcingthe liquid 3 He from the charcoal back to the coldfinger. Thisprocess takes ∼3 h and is done automatically by the computerevery night without user interference. It should be mentioned thatsmaller systems are being designed at Comet, requiring regenerationonly after several days of operation.Software and Peak Determination. A computer server thatcontrols all the operation of the macromizer instrument and(34) Fiske, M. D.; Giaever, I. P IEEE 1964, 52, 1155.archives all data is located within the lower chassis of theinstrument. To control the instrument, the user logs on to theserver via an Internet connection using the Java-based systemcontrol software. This feature also allows remote service andsupport of the instrument. The computer also controls the coolingcycle for the cryostat regeneration process and all valve and motoroperation. During experiments, the software adjusts all lasertiming, sample alignment, setting of the voltages, data acquisition,and calibration without any user intervention.Another key factor for STJ detection of ions is an algorithmfor precisely determining the time of flight and impact kineticenergy from the signal acquired by the detector. The inherentslowness of cryodetectors (peak widths of 500-600 ns) comparedto MCP detection makes it necessary to use advanced algorithmsfor determining these parameters. The algorithm used is the“turning point” method, which is specifically designed to preventdead time caused from overshoot during electronic integration.This method allows for the determination of an ion’s impact pointby applying a nine-point curve fit to the digitally differentiatedvoltage pulse. Then by first determining where the first derivativeof this curve has its maximum, the zero point can be calculated.This zero point is the turning point of the rising slope of thevoltage pulse and has a slight offset from the actual ion impacttime; however, because all pulses have a similar shape, the offsetis constant and can be accounted for in the calibration. Thecorrected zero point is used as the ion’s time of flight, which isused to calculate the m/z. The intensity can then be calculatedfrom the height of the voltage pulse, which corresponds to thekinetic energy. Laboratory measurements have shown that theoverall time resolution of the macromizer to measure moleculesof the same mass is (25 ns (based on fwhm using Ag+ isotopes,data not shown). This, in conjunction with the fact that high-massions often have large inherent spread in m/z and relatively slowdrift times (∼350 µs for 150 kDa), which allows for time-of-flightpeak resolution similar to MCP detection for masses greater than20 kDa. 35Sample Preperation. A 1 mg/mL sample of immunoglobulinG (IgG) from bovine serum (Sigma-Aldrich, Buchs, Switzerland)was dissolved in H 2 O/0.5% trifluoroacetic acid (TFA). The matrixwas sinapinic acid at 40 mg/mL in H 2 O, and the spot was layeredwith 1 µL each of matrix/sample/matrix and dried with room air.A 400 µg/mL concentration of immunoglobulin M (IgM) (BMA,Biomedicals AG; Augst, Switzerland) in H 2 O was used andprepared with the same three-layer method, using a matrix of 40mg/mL 2,6-dihydroxyacetophenone dissolved in 50% acetone/0.05% TFA, and then the spot was recrystallized using formic acid.The streptavidin sample (Sigma, Buchs) was prepared asa1mg/mL aqueous solution, mixed 1:10 with ferulic acid (40 mg/mL inethanol), and then applied as a 1-µL droplet to the sample plate.Cytochrome c (1 mg/mL, Sigma, Buchs) was measured using a1-µL layer method in sinapic acid (10 mg/mL in acetonitrile/0.1%TFA). The von Willebrand factor (vWF) was donated by Dr.Johanna Kremer Hovinga (Hemostasis Research Laboratory,University of Bern). It was purified from human blood to 80 µg/mL and analyzed after mixing 1:1 with 15 mg/mL ferulic acidmatrix.(35) Chaurand, P.; Hayn, G.; Matter, U.; Caprioli, R. M. In Proceedings of the52nd ASMS Conference on Mass Spectrometry and Allied Topics; May 23-27, Nashville, TN, 2004.4332 Analytical Chemistry, Vol. 77, No. 14, July 15, 2005
Figure 3. (a) Scatterplot of individual ion events showing time of ion impact time versus the kinetic energy of each impact. (b) A mass spectrumof IgG calculated from scatterplot a by binning points over time scale and converting time of flight to mass to charge.RESULTSFigure 3 shows an example of typical data acquired using themacromizer instrument. Figure 3a shows the data displayed asnormalized kinetic energy versus time-of-flight in microseconds(which is easily converted into mass-to-charge ratio). The y-axisvalue is created by using the voltage from each detector elementnormalized to the value for singly charged ions from that element,creating a normalized kinetic energy measurement for eachchannel. One can see that the majority of the ion signal pulseheights lie within a band between 0.8 and 1.2, corresponding tosingly charged ion events. Ions are also seen arriving in a secondintense band at a higher energy (between 1.3 and 1.8). Thesehigher kinetic energy events can be composed of either doublycharged molecules impacting the detector or pile-up (coincidence)events. In Figure 3a, there is even an intense area (at approximately210 µs and 2.2 normalized kinetic energy) that stemsfrom triply charged monomers impacting the detector at higherkinetic energies. By binning the ion signals over the mass-to-Analytical Chemistry, Vol. 77, No. 14, July 15, 2005 4333
Figure 4. Mass spectrum showing the multimers of streptavidin obtained under soft ionization conditions. The kinetic energy distributions ofthe ions that make up each peak are shown below. The kinetic energy is used to make proper identification of the charge state of the peaks inthe mass spectrum shown.charge axis, a typical mass spectrum can also be generated asshown in Figure 3b. Major peaks for intact species are labeledwithin the figure; other smaller peaks and low kinetic energycontributions to the labeled peaks are most likely due to fragmentspecies of the IgG. Under routine operating conditions, we wereable to easily obtain a sensitivity for IgG in the tens of femtomolerange (S/N g 10, data not shown). This is in agreement withprevious macromizer data for IgG showing sensitivity of below 1fmol, which far exceeds any previous IgG MALDI measurements,and maintains comparable resolution above 20 kDa. 35 It is alsoimportant to note that, due to the sensitivity enhancements of themacromizer, it was only necessary to sum 250 shots, in comparisonto previous cryodetector publications often requiring severalthousand shots. 20,36By summing the counts along the kinetic energy axis acrossa specific mass to charge range the kinetic energy of a specificpeak can be determined. Shown in Figure 4 is the kinetic energydistribution for streptavidin multimers. Streptavidin is a homotetramericcompound that requires nondenaturing matrix solventand instrumental conditions for detection of native multimers. Thisparticular sample was measured by only collecting signals fromthe first shot at each laser position, as shown with previous MALDImeasurements of noncovalent complexes. 37-39 One benefit of using(36) Rutzinger, S.; Christ, P.; Probst, F.; Seidel, W.; Uchaikin, S.; Stark, M. Nucl.Instrum. Methods, A 2004, 520, 625-627.(37) Farmer, T. B.; Caprioli, R. M. J. Mass Spectrom. 1998, 33, 697-704.a STJ detector when analyzing noncovalent complexes such asstreptavidin is that there is no need to account for detectorsensitivity when comparing ion signal between two peaks ofdifferent mass because the STJ displays mass-independent sensitivity.Also, when using standard detectors under normalconditions, there is no possibility of distinguishing singly chargedmonomers from doubly charged dimers, triply charged trimers,or multiply charged multimers in general. The kinetic energydistribution of the STJ detectors can be used to discern the chargestate of the ions impacting the detector. Here ions are predominatelyas singly charged (between 0.8 and 1.2) with doublycharged events arriving at higher energies (between 1.3 and 1.8).The STJ detectors are in fact nonlinear in the kinetic energymeasurement due to the so-called self-recombination rate (i.e.,two excess quasi-particles combine with each other to re-form aCooper pair). This gives the ability to specifically identify thecharge state of the ions that make up a given m/z peak. Signalscan also be seen in a lower charged state (normalized kineticenergy between 0 and 0.5), which are believed to be created frommetastable ion fragments having less mass, therefore less kineticenergy, when impacting the detector. By adjusting variables suchas laser power, extraction voltages and times, vacuum conditions,(38) Rosinke, B.; Strupat, K.; Hillenkamp, F.; Rosenbusch, J.; Dencher, N.; Kruger,U.; Galla, H. J. J. Mass Spectrom. 1995, 30, 1462-1468.(39) Cohen, L. R. H.; Strupat, K.; Hillenkamp, F. J. Am. Soc. Mass Spectrom. 1997,8, 1046-1052.4334 Analytical Chemistry, Vol. 77, No. 14, July 15, 2005
Figure 5. Spectrum of cytochrome c demonstrating resolution exceeding 1000 (fwhm). These data were recorded with the delayed extractionsetting optimized for m/z ) 12 000 Da.and sample preparation, one can influence the ratio of ion chargestates, as has been shown briefly in previous works 40 and will bediscussed further in forthcoming publications.The unusually large peak width at the mass of the tetramer isbelieved to be partially due to chemical heterogeneity/posttranslationalmodifications of the monomeric building blocks. Anothercontribution is the setting of the delayed extraction (4 µs), whichwas probably not ideal for the mass of 60 kDa. Using optimizedsettings, much narrower peaks can be obtained. An example of alower mass sample that demonstrates the macromizer’s massresolving power is shown in Figure 5. Here we see a spectrum ofcytochrome c, demonstrating resolution exceeding 1000 (fwhm).Even alkali and matrix adducts can be resolved beside the majorpeak.To demonstrate the high-mass capabilities of the cryodetector,two high-mass proteins were analyzed: IgM and vWF in Figure6. The mass spectra in Figure 6 demonstrate the largest molecularweight of singly charged ions analyzed using MALDI. Obtainingmass calibrants for such a high-mass range can be a challengeby itself. The mass calibration for the data shown here is hencedetermined by extrapolation from lower mass compounds. Althoughour group was unable to detect IgM using a standardcommercial MALDI instrument, high-mass biomolecules havebeen detected using other instruments, 27,41,42 though underextraordinary instrumental circumstances, and at much lowersignal-to-noise levels. Signal can be seen corresponding to IgMat 1 MDa, doubly charged IgM at 500 kDa, triply charged IgM,and even IgM 4+ (Figure 6a). Although these peaks are not wellresolved, there are several possible explanations; most notable isthat the sample was used directly from the supplier with no furtherpurification. Such high-mass proteins are isolated from natural(40) Hilton, G. C.; Martinis, J. M.; Wollman, D. A.; Irwin, K. D.; Dulcie, L. L.;Gerber, D.; Gillevet, P. M.; Twerenbold, D. Nature 1998, 391, 672-675.(41) Nelson, R. W.; Dogruel, D.; Williams, P. Rapid Commun. Mas. Spectrom.1995, 9, 625-625.(42) Berkenkamp, S.; Menzel, C.; Karas, M.; Hillenkamp, F. Rapid Commun.Mass Spectrom. 1997, 11, 1399-1406.sources and may exhibit a considerable degree of chemicalheterogeneity. This is the first commercial instrument capable ofdirectly analyzing singly charged molecules within the megadaltonrange, and there is difficulty obtaining samples that can providenarrow peak widths at such high masses.Another example of the superior capability of the macromizerto detect high-mass ion signals is seen in Figure 6b from a sampleof vWF protein. This sample is an extract of human blood fromvon Willebrand diseased (vWD) patients. vWD patients have anabnormally low multimeric distribution of vWF protein found intheir blood, with vWF protein masses predominately below 10MDa, compared to normal patients, who have distributions of vWFprotein masses between 5 and 20 MDa. 43-45 The vWF is a 550-kDa disulfide-linked homopolymer of two 270-kDa disulfide-linkedmonomers. These dimers then link to form the multimers aidingin blood clotting. Using electrospray ionization, it would bevirtually impossible to distinguish different highly charged vWFoligomers. Figure 6b shows an intense signal at 260 kDa fromthe single vWF protein, a strong signal at 510 kDa from thedisulfide linked dimer, a weaker signal at ∼1 MDa from twodimers, an even weaker signal at 1.5 MDa, and a barely visiblesignal at ∼2 MDa. By accurately distinguishing the multimericdistribution of diseased from normal samples, it is hoped that themacromizer instrument could provide high-throughput analysisof challenging clinical problems using MALDI.CONCLUSIONSA new MALDI mass spectrometer is described for detectinghigh-mass ions. Utilizing the new multichannel array cryodetector,coupled with the ion optics and data acquisition systems incorporatedin the macromizer instrument, the ability to sensitivelydetect high-mass ions is demonstrated. The capability to sensi-(43) Bernardo, A.; Bergeron, A. L.; Sun, C. W.; Guchhait, P.; Cruz, M. A.; Lopez,J. A.; Dong, J. F. J. Thromb. Haemost. 2004, 2, 660-669.(44) Furlan, M. Ann. Hematol. 1996, 72, 341-348.(45) Ohmori, K.; Fretto, L. J.; Harrison, R. L.; Switzer, M. E. P.; Erickson, H. P.;Mckee, P. A. J. Cell Biol. 1982, 95, 632-640.Analytical Chemistry, Vol. 77, No. 14, July 15, 2005 4335
Figure 6. Mass spectra of two high molecular weight proteins, (a) immunoglobulin M at 1 MDa and (b) von Willenbrand factor at 1.5 MDa.tively detect IgG and discern the charge state of the ions wasshown. IgM, a megadalton-sized protein, which cannot be easilydetected using other MALDI instrumentation, is shown.While this work demonstrates several interesting and promisingapplications for this new technology, there are still manyunanswered questions. Ionization of high-mass molecules withoutfragmentation or dissociation has proven challenging. Findinghigh-mass calibrants and matrixes is also not well researched.Even the true initial velocity spread of the ions and the effect ofdelayed extraction on these high masses is not known. 46,47 This(46) Berkenkamp, S.; Menzel, C.; Hillenkamp, F.; Dreisewerd, K. J. Am. Soc.Mass Spectrom. 2002, 13, 209-220.(47) Bahr, U.; StahlZeng, J.; Gleitsmann, E.; Karas, M. J. Mass Spectrom. 1997,32, 1111-1116.4336 Analytical Chemistry, Vol. 77, No. 14, July 15, 2005