An ultra-high precision, high bandwidth torque sensor - Harvard ...
An ultra-high precision, high bandwidth torque sensor - Harvard ...
An ultra-high precision, high bandwidth torque sensor - Harvard ...

You also want an ePaper? Increase the reach of your titles
YUMPU automatically turns print PDFs into web optimized ePapers that Google loves.
2011 IEEE/RSJ International Conference onIntelligent Robots and SystemsSeptember 25-30, 2011. San Francisco, CA, USA<strong>An</strong> <strong>ultra</strong>-<strong>high</strong> <strong>precision</strong>, <strong>high</strong> <strong>bandwidth</strong> <strong>torque</strong> <strong>sensor</strong> formicrorobotics applicationsBenjamin M. Finio, Kevin C. Galloway and Robert J. WoodAbstract— Motivated by the need for <strong>torque</strong> sensing in theµNm range for experiments with insect-sized flapping-wingrobots, we present the design, fabrication and testing of acustom single-axis <strong>torque</strong> <strong>sensor</strong>. The micorobots in questionare too large for MEMS force/<strong>torque</strong> <strong>sensor</strong>s used for smallerlive insects such as fruit flies, but too small to produce<strong>torque</strong>s within the dynamic range of commercially availableforce/<strong>torque</strong> <strong>sensor</strong>s. Our <strong>sensor</strong> consists of laser-machined Invarsheets that are assembled into a three dimensional beam. Acapacitive displacement <strong>sensor</strong> is used to measure displacementof a target plate when the beam rotates, and the output voltageis correlated to applied <strong>torque</strong>. Sensor <strong>bandwidth</strong>, range, andresolution are designed to match the criteria of the roboticfly experiments while remaining insensitive to off-axis loads.We present a final <strong>sensor</strong> design with a range of ±130µNm, aresolution of 4.5nNm, and <strong>bandwidth</strong> of 1kHz.I. INTRODUCTIONWithin the last decade, multiple biologically-inspiredrobots have been developed at the insect scale, much smallerthan traditional macro-scale robots yet larger than trulymicroscopic technologies such as MEMS (for examples see[1], [2]). The unique scale and operating conditions of theserobots mean commercially available experimental tools maynot always be sufficient and thus custom designs are required.For example, the robotic fly presented in [1] required thedevelopment of a two-axis force <strong>sensor</strong> to empirically determinelift and drag forces generated by the flapping wings[3].More recent work on the robotic fly includes the useof asymmetric wing flapping motions to generate net body<strong>torque</strong>s [4], where the magnitude of predicted <strong>torque</strong>s is onthe order of 1-10µNm. These values were obtained using aquasi-steady blade-element aerodynamic model [5] to predictaerodynamic forces and resulting body <strong>torque</strong>s. To theauthors’ knowledge, even the most sensitive commerciallyavailable <strong>torque</strong> transducers fall short of the range, resolutionand <strong>bandwidth</strong> demanded for microrobotic experiments. Forinstance, the Nano17 by ATI Industrial Automation (Apex,NC) offers a <strong>torque</strong> measurement capacity of 120mNm anda resolution near 16µNm, which is an order of magnitudetoo large for our application.There have been several published works on the developmentand manufacture of custom <strong>torque</strong> <strong>sensor</strong>s for a varietyThis work was supported in part by the Army Research Laboratory (awardnumber W911NF-08-2-0004), the Wyss Institute for Biologically InspiredEngineering, and the Department of Defense (DoD) through the NationalDefense Science & Engineering Graduate Fellowship (NDSEG) Program(Ben Finio).The authors are with the School of Engineering and Applied Sciences andthe Wyss Institute for Biologically Inspired Engineering, <strong>Harvard</strong> University,Cambridge, MA 02138. bfinio@fas.harvard.eduof applications. One micro-<strong>torque</strong> <strong>sensor</strong> developed for thewatch industry [6] uses differential force measurement toachieve a resolution of 50nNm over a working range of±200µNm. The device consists of a spring blade positionedperpendicular to the <strong>torque</strong> axis (i.e. not mechanically connected)with a piezoresistive force <strong>sensor</strong> chip at both ends ofthe spring blade. A perpendicular bar mounted on the <strong>torque</strong>axis acts on the spring blade via two adjustment screws.These screws allow the spring blade to be pre-stressed sothat an applied <strong>torque</strong> will increase pressure on one force<strong>sensor</strong> and decrease pressure on the other. While this micro<strong>torque</strong><strong>sensor</strong> has adequate range, its resolution falls short ofour 10nNm target (discussed below).The most relevant previous work was presented in [7] andimproved upon in [8], where a contactless <strong>torque</strong> <strong>sensor</strong> wasdeveloped for rotating micromotors. The <strong>torque</strong> <strong>sensor</strong> in [8]uses a cross-shaped spring element where one end is fixedand the <strong>torque</strong> is calculated by measuring the torsional deformationat the free end with a laser triangulation <strong>sensor</strong>. Thepublished sensing range was ±200µNm with accuracy downto 4µNm. There are design features of this device, namelythe cross-shape <strong>sensor</strong> beam, that are found in our proposeddesign, however, there are several key differences. The testsin [8] were purely static and thus dynamic behavior of the<strong>sensor</strong> itself was not a concern. The <strong>sensor</strong> rotation axis andmotor shaft were directly aligned, therefore off-axis loadingwas not an issue. In our case, <strong>high</strong>-frequency actuation ofmicrorobots can lead to both excitation of resonant modes ofthe <strong>sensor</strong> and <strong>high</strong> off-axis loads. Consequently, this raisesissues related to the <strong>sensor</strong>’s <strong>bandwidth</strong>, resolution, and offaxisstiffness among others which are rigorously addressedin Section II.At the MEMS level there are some proposed designs thatfall within our desired sensing range [9], [10], [11]. Still, thisapproach has it owns challenges including 1) a fragile buildingmaterial (i.e. silicon) which makes <strong>sensor</strong> calibration andusage difficult, 2) extremely small mounting features, and 3)poor resistance to out of plane loads, especially for the typeof cantilevered <strong>torque</strong> experiments we desire to run.Other micro-<strong>torque</strong> <strong>sensor</strong>s have been developed for characterizingmicromotors [12], [13], [14], however, these deviceswere designed for continuously rotating motor shaftsand are not easily adapted to measure body <strong>torque</strong>s generatedby flapping-wing microrobots.978-1-61284-455-8/11/$26.00 ©2011 IEEE 31
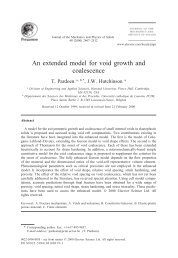
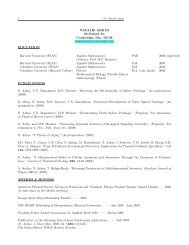
tLV+struts, and J fly is the moment of inertia of the robotic flyand associated mounting hardware that will ultimately beattached to the end of the <strong>sensor</strong>. Note that by the parallelaxis theorem, and accounting for both plates, J tp is definedas( )1J tp = 24 mr2 + mR 2 (4)rFig. 2. Dimensions that define the <strong>sensor</strong> geometry. Electricalconnections to the capacitive probe head and target plate are alsoshown.head with the target plate. This small operating range alsomakes them susceptible to drift due to thermal expansion ofcomponents such as the <strong>sensor</strong> itself or surrounding supportstructures. The addition of a target plate also adds mass to the<strong>sensor</strong>, which will lower the mechanical resonant frequencyof the beam and thus decrease the <strong>sensor</strong> <strong>bandwidth</strong>. Selectionof capacitive <strong>sensor</strong>s with appropriate specifications isdiscussed in Section III.D. <strong>An</strong>alytical ModelThe <strong>sensor</strong> geometry can be fully parameterized by thedimensions shown in Fig. 2: width w, thickness t, length L,target plate radius r and radius to the center of mass of thetarget plate R. We define R as a function of the width, targetplate radius, and an additional offset d (i.e. the edge of thetarget plate does not necessarily need to abut the edge of the<strong>sensor</strong> beam, it can be cantilevered out on a support strut;this dimension is not shown in Fig. 2),wR = w 2 + r + d (1)Given this geometry, [15] reports the torsional stiffness ofsuch a beam as( w) 4Gt4k θ =t − 0.373 (2)3Lwhere G is the shear modulus of the material. The totalmoment of inertia of the <strong>sensor</strong> about the θ axis is the sumof several components:J tot = J eq + J ec + J tp + J fly (3)where J eq is the equivalent moment of inertia of the beam(since it is fixed at one end and twists along its length, thiswill be less than the moment of inertia of the beam as arigid body), J ec is the moment of inertia of the square endcap at the end of the beam (not pictured in Fig. 2), whichserves as a flat surface to mount the device under test, J tpis the moment of inertia of the target plates and supportRθThe undamped resonant frequency of a spring-mass systemis ω n = √ k/m, so we havef n = 1√kθ(5)2π J totaland we can use this as an approximation for <strong>sensor</strong> <strong>bandwidth</strong>(realistically the usable <strong>bandwidth</strong> will be lower thanthe resonant frequency). Next, for the static rotation θ of the<strong>sensor</strong> due to a <strong>torque</strong> τ applied by the fly, we haveθ = τ k θ(6)and this rotation results in displacement δ θ of the center ofthe target plate,δ θ = R sin θ (7)We also have the potential displacement of the target platedue to force F applied by the fly in the y direction,δ y = F yL 3(8)3EIwhere I is the cross-sectional moment of area of the <strong>sensor</strong>beam. In order for the beam to effectively decouple <strong>torque</strong>and force measurements, we desire a <strong>high</strong> off-axis rejectionratio γ,γ = δ θ(9)δ yfor typical force and <strong>torque</strong> values F and τ expected fromthe fly.Note that while δ θ is the displacement of the center of thetarget plate, the target plate is actually undergoing translationand rotation. This could be a cause of concern for tworeasons: (1) Capacitive <strong>sensor</strong>s are typically designed andcalibrated to measure displacements of parallel surfaces witha linear response, so the <strong>torque</strong>-to-voltage calibration couldbe nonlinear, and (2) the outer edge of the target plate willtranslate more than the center and could possibly collidewith the probe head if the beam rotates too much. The latterconcern can be alleviated simply through proper selection ofgeometric parameters; and while a linear calibration curvewould be convenient, it is not necessarily required, thus thisissue is not cause for excessive concern.The concept of <strong>sensor</strong> quality is defined in [3] as theproduct of sensitivity and <strong>bandwidth</strong>, so in this case we haveQ = f n × δ θ (10)since a <strong>high</strong>er f n means a <strong>high</strong>er <strong>bandwidth</strong> and <strong>high</strong>erδ θ means <strong>high</strong>er sensitivity. The quality factor is subject totwo sets of constraints: (1) a minimum acceptable resonantfrequency, determined by the expected frequency of theflapping tests, and (2) an acceptable range of target plate33
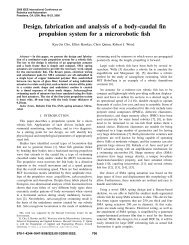
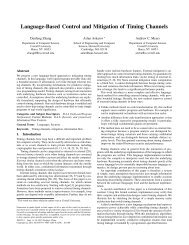
cross-shaped<strong>sensor</strong> beam105Sensor Calibration Curvestargetplatecapacitive<strong>sensor</strong>Torque (µNm)0−5flexuremount<strong>sensor</strong>mountstainlesssteelblock−10−15−1000 −800 −600 −400 −200 0 200 400 600 800Voltage (mV)Fig. 9. Sensor calibration curves. Each color corresponds to a singlecalibration process (the entire process takes several minutes), withmultiple calibrations taken over a period of hours or several days.The “x” markers correspond to individual readings, and each lineis a linear least-squares fit. Multiple <strong>sensor</strong> calibrations show thatwhile the zero reading is subject to drift over time, likely due tothermal effects, the sensitivity remains relatively constant.2System Thermal Response1.8Fig. 8. A CAD model (top) of the completed assembly including<strong>sensor</strong> beam, capacitive <strong>sensor</strong>s and supporting fixtures, and photograph(bottom) of the completed experimental setup with a roboticfly attached to the faceplate of the <strong>sensor</strong> via a lightweight carbonfiber truss structure (required to avoid collision of the wings andthe capacitive <strong>sensor</strong>).model and sufficient for flapping tests in the neighborhood of100Hz. A 60mg robotic fly (a more recent prototype of therobot presented in [1]) was mounted to the end of the <strong>sensor</strong>in the configuration shown in Fig. 11. This orientation allowedmeasurement of pitch <strong>torque</strong>s generated by the wingsduring flapping. The lift and drag forces both contributeto the net pitch <strong>torque</strong>. For symmetric upstroke/downstrokeflapping, the contribution to pitch from the drag force overone stroke cycle should average out to zero. That is, flappingin one direction, the drag force is opposite the direction ofwing motion and the contribution to pitch <strong>torque</strong> will bepositive. When the wing reverses direction, the drag forcealso reverses direction and thus the contribution to pitch isnegative. In general, the lift force always acts upward anddoes not reverse direction on the upstroke or downstroke(although lift values may briefly go negative near strokeVoltage (% of ±10V range)1.61.41.210.80.60.40.200 10 20 30 40 50 60Time (min)Fig. 10. The system is subject to drift due to thermal expansion,and over long time scales this can be significant due to ambienttemperature changes or air currents in the room (blue). A fiberopticlight source aimed directly at the <strong>sensor</strong> was used to determinethe system’s step response to a thermal input (red). The system’sthermal time constant τ is approximately 6.5 minutes, so it requiresabout half an hour to reach equilibrium. Significant changes in thethermal environment, such as bright lighting, can cause voltage drifton the order of several percent of the full operating range. Thisshould be taken into account when collecting data.36
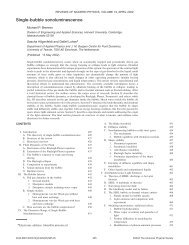
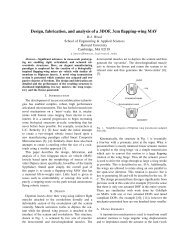
F liftF dragτFig. 11. The fly is mounted to the <strong>torque</strong> <strong>sensor</strong> in an orientationthat allows measurement of pitch <strong>torque</strong>s. Lift and drag forcesact on the fly’s wings as they flap back and forth, and both willcontribute to the <strong>torque</strong> τ.FFT of Raw Torque Dataaverage centerof lifttop view10 −1extremes of wingstrokepitch axisFig. 12. Nominally, assuming a symmetric vehicle and symmetricupstroke and downstroke flapping, the center of lift (i.e., location ofthe average lift force over one wingstroke) will act in-line with thevehicle’s center of mass, and there will be no pitch <strong>torque</strong> (left).However, biasing the stroke forward or backward while keeping theamplitude constant will move the point of action of the average liftforce away from the pitch axis, generating a <strong>torque</strong> (right).reversal due to inertial reactions, see [5]). Thus, changingthe location of the average lift force vector over one strokecan change the average pitch <strong>torque</strong> acting on the vehicle(Fig. 12), and this fact will be useful for vehicle control andstabilization. For many small insects, the dynamics of wingflapping are typically an order of magnitude faster than bodydynamics, therefore forces and <strong>torque</strong>s averaged over severalwingbeats can be sufficient for control purposes [16].The robotic fly’s wings are driven by a voltage-controlledpiezoelectric actuator. To verify the proposed method forcontrolling average pitch <strong>torque</strong>s, the wings were flappedat 100Hz with a drive signal amplitude of 200V, whichcorresponds to a stroke amplitude of approximately 100 ◦ ,or a gain of 0.5 ◦ /V. The DC value of the control signal wasvaried over a range of ±25V, or about ±12.5 ◦ of stroke anglebias (note that these values are approximate - in future tests,stereoscopic imaging can be used to reconstruct exact wingposition in 3D space, as in [5]). Instantaneous <strong>torque</strong> dependson contributions from both aerodynamic lift, drag and inertialforces (Fig. 11), however a running average (taken overten wingbeats) shows a clear correlation between the offsetvoltage and the average <strong>torque</strong> value (Fig. 14). The <strong>sensor</strong>’sMagnitude10 −210 −310 −410 −510 −610 0 10 1 10 2 10 310 0 Frequency (Hz)Fig. 13. (top) Instantaneous <strong>torque</strong> values have contributionsfrom drag, lift and inertial forces and are also affected by <strong>sensor</strong>resonance. A tenth-order Butterworth filter with a cutoff frequencyof 800Hz is used with the filtfilt command in Matlab to eliminatethe <strong>high</strong> frequency components of the signal without adding aphase delay, which allows decomposition of <strong>torque</strong> readings on asub-period basis. Data from four wingbeat periods is shown (oneperiod = 10msec) for the baseline flapping case with zero offsetvoltage. (bottom) <strong>An</strong> FFT of the signal shows that there are strongcomponents at both the flapping frequency (100Hz) and the <strong>sensor</strong>resonant frequency around 1kHz.<strong>high</strong> <strong>bandwidth</strong> allows characterization of contributions to<strong>torque</strong> with sub-period temporal resolution. If the resonantfrequency of the <strong>sensor</strong> is sufficiently <strong>high</strong> relative to theflapping frequency, a low-pass filter can be used to eliminatesignal components that arise due to <strong>sensor</strong> resonance (Fig.13). When synchronized with wing kinematics, <strong>torque</strong> measurementswould allow validation of aerodynamic modelsand decomposition of different contributions to net <strong>torque</strong>.This analysis is not presented here since 3D wing kinematicswere not recorded, and for purposes of vehicle control, theimportant result is the time-averaged <strong>torque</strong> value.Flapping tests at 110Hz resulted in saturation of the ±10Vanalog output of the capacitive <strong>sensor</strong>, corresponding to arange of ±130µNm. The final performance of the <strong>sensor</strong> issummarized in Table II.37
0.5Torque averaged over 0.1 seconds (10 wingbeats)TABLE IIACTUAL SENSOR PERFORMANCETorque (µNm)Average Torque (µNm)0−0.5−1−1.5−2−2.5−3−3.5−40 1 2 3 4 5 6 743.532.52Time (sec)Average Torque vs. Offset Voltage−25V−20V−15V−10V−5V0V+5V+10V+15V+20V+25V1.5−25 −20 −15 −10 −5 0 5 10 15 20 25Offset Voltage (V)Fig. 14. (top) A running average taken over 0.1sec (10 wingbeats)shows that controlling the stroke angle offset via an offset voltagecan directly control the DC value of the <strong>torque</strong> measurement. Thetransients at the beginning and end of the data are due to slowramp-up and ramp-down of flapping to avoid damage to the deviceunder test. (bottom) Correlating this average <strong>torque</strong> value to theoffset voltage command shows a roughly linear relationship, whichwill be useful for developing control laws.V. DISCUSSIONWe have presented the analysis, design, fabrication andtesting of a custom single-axis <strong>torque</strong> <strong>sensor</strong> suitable formeasuring <strong>torque</strong>s in a range not fulfilled by commerciallyavailable <strong>torque</strong> <strong>sensor</strong>s. The final fabricated <strong>sensor</strong> has arange of ±130µNm, resolution of 4.5nNm and <strong>bandwidth</strong>of 1kHz. While the <strong>sensor</strong> was designed to meet criteriafor a specific application - tests of a flapping-wing roboticfly - the geometry is scalable to meet different <strong>bandwidth</strong>or sensitivity criteria. It could easily be adapted to otherapplications such as measurements involving live insects orambulatory microrobots. This concept can also be extendedto more complex <strong>sensor</strong> geometries that can be used tomeasure multiple <strong>torque</strong>s or force/<strong>torque</strong> combinations bydesigning a beam that is sensitive to additional forces or<strong>torque</strong>s, although it becomes increasingly difficult to completelydecouple motions as more degrees of freedom areintroduced.ParameterValueOff-axis rejection ratio 335Range±130µNmResolution4.5nNmBandwidth1kHzSensitivity 75.8mV/µNmREFERENCES[1] R. J. Wood, “The first takeoff of a biologically inspired at-scale roboticinsect,” in IEEE Trans. on Robotics, vol. 24, 2008, pp. 341–347.[2] A. Baisch, P. S. Sreetharan, and R. J. Wood, “Biologically inspiredlocomotion of an insect scale hexapod robot,” in Intelligent Robotsand Systems (IROS), 2010 In Proc. IEEE/RSJ Int. Conf. on. IEEE,2010.[3] R. J. Wood, K. J. Cho, and K. Hoffman, “A novel multi-axis force <strong>sensor</strong>for microrobotics applications,” Smart Materials and Structures,vol. 18, p. 125002, 2009.[4] B. M. Finio and R. J. Wood, “Distributed power and control actuationin the thoracic mechanics of a robotic insect,” Bioinspiration &Biomimetics, vol. 5, p. 045006, 2010.[5] J. P. Whitney and R. J. Wood, “Aeromechanics of passive rotation inflapping flight,” Journal of Fluid Mechanics, vol. 1, no. 1, pp. 1–24,2010.[6] V. Gass, B. H. Van der Schoot, S. Jeanneret, and N. F. de Rooij,“Micro-<strong>torque</strong> <strong>sensor</strong> based on differential force measurement,” inProc. IEEE Int. Conf. on Micro Electro Mechanical Systems, 1994,pp. 241 –244.[7] F. Franek and A. Maciszewski, “Torsionselement und ver- wendungeines solchen bei einer einrichtung zur messung von reibungskraften,”Osterreichisches Patent AT 393 167 B, 1991.[8] G. Abraham, R. Duffait, P. Wurmsdobler, A. Matzner, and W. Brenner,“Principles of <strong>torque</strong> measurement for rotating microactuators,” inSensors, 2002. Proceedings of IEEE, vol. 2, 2002, pp. 1757 – 1761.[9] A. Vujanic, N. Adamovic, M. Jakovljevic, W. Brenner, G. Popovic,and H. Detter, “Silicon microstructure for precise measurements ofmechanical moments,” Microelectronics Journal, vol. 31, no. 11-12,p. 975 980, 2000.[10] F. Beyeler, S. Muntwyler, Z. Nagy, M. Moser, and B. J. Nelson,“A multi-axis mems force-<strong>torque</strong> <strong>sensor</strong> for measuring the load ona microrobot actuated by magnetic fields,” in Intelligent Robots andSystems. IROS IEEE/RSJ Int. Conf. on, 2007, pp. 3803 –3808.[11] F. Beyeler, S. Muntwyler, and B. J. Nelson, “A six-axis mems force<strong>torque</strong><strong>sensor</strong> with micro-newton and nano-newtonmeter resolution,”Microelectromechanical Systems, Journal of, vol. 18, no. 2, pp. 433–441, April 2009.[12] H. Ota, T. Ohara, Y. Karata, S. Nakasima, and M. Takeda, “Novelmicro <strong>torque</strong> measurement method for microdevices,” Journal ofMicromechanics and Microengineering, vol. 11, no. 5, p. 595, 2001.[13] C. Zwyssig, S. D. Round, and J. W. Kolar, “<strong>An</strong>alytical and experimentalinvestigation of a low <strong>torque</strong>, <strong>ultra</strong>-<strong>high</strong> speed drive system,”in Industry Applications Conf., 2006. 41st IAS <strong>An</strong>nual Meeting. Conf.Record of the 2006 IEEE, vol. 3, oct. 2006, pp. 1507 –1513.[14] D. Mathieson, B. J. Robertson, U. Beerschwinger, S. J. Yang, R. L.Reuben, A. J. Addlesee, J. Spencer, and R. A. Lawes, “Micro <strong>torque</strong>measurements for a prototype turbine,” Journal of Micromechanicsand Microengineering, vol. 4, no. 3, p. 129, 1994. [Online]. Available:http://stacks.iop.org/0960-1317/4/i=3/a=006[15] B. P. Trease, Y. M. Moon, and S. Kota, “Design of large-displacementcompliant joints,” Journal of Mechanical Design, vol. 127, p. 788,2005.[16] X. Deng, L. Schenato, and S. Sastry, “Flapping flight for biomimeticrobotic insects: Part II-flight control design,” IEEE Trans. on Robotics,vol. 22, no. 4, pp. 789–803, 2006.38