mesothelioma in australia incidence 1982 to 2008 mortality
mesothelioma in australia incidence 1982 to 2008 mortality
mesothelioma in australia incidence 1982 to 2008 mortality

You also want an ePaper? Increase the reach of your titles
YUMPU automatically turns print PDFs into web optimized ePapers that Google loves.
MESOTHELIOMA IN AUSTRALIAINCIDENCE <strong>1982</strong> TO <strong>2008</strong>MORTALITY 1997 TO 2007August 2012
Safe Work AustraliaMesothelioma <strong>in</strong> AustraliaIncidence <strong>1982</strong> <strong>to</strong> <strong>2008</strong>Deaths 1997 <strong>to</strong> 2007August 2012
AcknowledgementData on the number of new cases of <strong>mesothelioma</strong> <strong>in</strong> this report are collected by theNational Cancer Statistics Clear<strong>in</strong>g House, ma<strong>in</strong>ta<strong>in</strong>ed by the Australian Institute ofHealth and Welfare (AIHW). Data on fatal cases of <strong>mesothelioma</strong> are collected <strong>in</strong> theNational Mortality Database, made available <strong>to</strong> us by the AIHW. The authors, andnot these agencies, are responsible for the use of the data <strong>in</strong> this report. The authorswould like <strong>to</strong> thank the State Cancer Registries and the AIHW for allow<strong>in</strong>g access <strong>to</strong>the data presented <strong>in</strong> this report.DisclaimerThe <strong>in</strong>formation provided <strong>in</strong> this document can only assist you <strong>in</strong> the most generalway. This document does not replace any statu<strong>to</strong>ry requirements under any relevantState and Terri<strong>to</strong>ry legislation. Safe Work Australia is not liable for any loss result<strong>in</strong>gfrom any action taken or reliance made by you on the <strong>in</strong>formation or materialconta<strong>in</strong>ed on this document. Before rely<strong>in</strong>g on the material, users should carefullymake their own assessment as <strong>to</strong> its accuracy, currency, completeness and relevancefor their purposes, and should obta<strong>in</strong> any appropriate professional advice relevant <strong>to</strong>their particular circumstances.To the extent that the material on this document <strong>in</strong>cludes views or recommendationsof third parties, such views or recommendations do not necessarily reflect the views ofSafe Work Australia or <strong>in</strong>dicate its commitment <strong>to</strong> a particular course of action.Creative CommonsISBN 978-0-642-78527-5 [Onl<strong>in</strong>e pdf ]ISBN 978-0-642-78528-2 [Onl<strong>in</strong>e doc ]With the exception of the Safe Work Australia logo, this report is licensed by SafeWork Australia under a Creative Commons 3.0 Australia Licence. To view a copy ofthis licence, visithttp://creativecommons.org/licenses/by/3.0/au/deed.enIn essence, you are free <strong>to</strong> copy, communicate and adapt the work, as long as youattribute the work <strong>to</strong> Safe Work Australia and abide by the other licens<strong>in</strong>g terms. Thereport should be attributed as the Mesothelioma <strong>in</strong> Australia: Incidence <strong>1982</strong> <strong>to</strong> <strong>2008</strong>,Mortality 1997 <strong>to</strong> 2007.Enquiries regard<strong>in</strong>g the licence and any use of the report are welcome at:Copyright OfficerCommunications, IT and Knowledge ManagementSafe Work AustraliaGPO Box 641 Canberra ACT 2601Email: copyrightrequests@safework<strong>australia</strong>.gov.au
ContentsReport summary............................................................................................................ vIntroduction.................................................................................................................... 1Asbes<strong>to</strong>s production, use and control <strong>in</strong> Australia.................................................... 1Mesothelioma projections......................................................................................... 2The new Australian Mesothelioma Registry............................................................. 2Incidence of <strong>mesothelioma</strong>............................................................................................ 3New cases diagnosed <strong>in</strong> <strong>2008</strong>.................................................................................. 3Trends over time, <strong>1982</strong> <strong>to</strong> <strong>2008</strong>................................................................................ 4National data....................................................................................................... 5State and Terri<strong>to</strong>ry data....................................................................................... 7Deaths due <strong>to</strong> <strong>mesothelioma</strong>......................................................................................... 9Deaths <strong>in</strong> 2007......................................................................................................... 9Trends over time, 1997 <strong>to</strong> 2007.............................................................................. 10National data..................................................................................................... 10State and Terri<strong>to</strong>ry data..................................................................................... 11References.................................................................................................................. 13Useful l<strong>in</strong>ks.................................................................................................................. 13Mesothelioma <strong>in</strong> Australia 2012 ... iii
IntroductionMesothelioma is a usually fatal cancer which typically occurs 20 <strong>to</strong> 40 years afterexposure <strong>to</strong> asbes<strong>to</strong>s — although exposure does not necessarily result <strong>in</strong> the disease.All new cases of <strong>mesothelioma</strong> are notified <strong>to</strong> state and terri<strong>to</strong>ry Cancer Registries,as <strong>mesothelioma</strong> is a notifiable disease. These data are collected nationally by theAustralian Institute of Health and Welfare (AIHW) <strong>in</strong> the National Cancer StatisticsClear<strong>in</strong>g House (NCSCH). Information on deaths from <strong>mesothelioma</strong> is also collectedby the AIHW as part of the National Mortality Database. The AIHW publishes cancerdata <strong>in</strong> spreadsheets on its website. This report uses the <strong>mesothelioma</strong> data, andadditional data supplied by the state and terri<strong>to</strong>ry cancer registries <strong>to</strong> the AIHW, <strong>to</strong>report on the <strong>in</strong>cidence of new cases and deaths from <strong>mesothelioma</strong> by both ageand sex. In addition, trends over time are shown for the period <strong>1982</strong> <strong>to</strong> <strong>2008</strong> for thenumber of new cases, and from 1997 <strong>to</strong> 2007 for the number of deaths. The <strong>mortality</strong>section of this report is identical <strong>to</strong> that published <strong>in</strong> the previous edition because datafor <strong>2008</strong> are not yet available.Mesothelioma of the pleura (a cancer affect<strong>in</strong>g the protective l<strong>in</strong><strong>in</strong>g of the lung andchest cavity) was the most common form of <strong>mesothelioma</strong> diagnosed <strong>in</strong> Australia:<strong>in</strong>volv<strong>in</strong>g approximately 94% of cases s<strong>in</strong>ce <strong>1982</strong>. Mesothelioma of the peri<strong>to</strong>neum(a cancer affect<strong>in</strong>g the abdom<strong>in</strong>al l<strong>in</strong><strong>in</strong>g) is a much less common diagnosis,account<strong>in</strong>g for approximately 5% of cases s<strong>in</strong>ce <strong>1982</strong>. The figures presented <strong>in</strong> thispublication <strong>in</strong>clude all forms of <strong>mesothelioma</strong>.Asbes<strong>to</strong>s production, use and control <strong>in</strong> AustraliaIn Australia, more chrysotile (white asbes<strong>to</strong>s) than amphibole (blue and brown)asbes<strong>to</strong>s was m<strong>in</strong>ed until 1939. New South Wales, the first state <strong>to</strong> m<strong>in</strong>e asbes<strong>to</strong>s,produced the largest <strong>to</strong>nnages of chrysotile (until 1983) as well as smaller quantitiesof amphibole (until 1949). With the commencement of m<strong>in</strong><strong>in</strong>g <strong>in</strong> Wittenoom <strong>in</strong> WesternAustralia <strong>in</strong> 1937, crocidolite (blue asbes<strong>to</strong>s) dom<strong>in</strong>ated production until f<strong>in</strong>al closureof the m<strong>in</strong>e <strong>in</strong> 1966. The ma<strong>in</strong> sources of raw asbes<strong>to</strong>s imports were from Canada(chrysotile) and South Africa (crocidolite and amosite (brown asbes<strong>to</strong>s)). Consumptionpeaked <strong>in</strong> about 1975 at approximately 70 000 <strong>to</strong>nnes per year.In addition <strong>to</strong> imports of asbes<strong>to</strong>s fibre, Australia also imported many manufacturedasbes<strong>to</strong>s products, <strong>in</strong>clud<strong>in</strong>g asbes<strong>to</strong>s conta<strong>in</strong><strong>in</strong>g cement articles, yarn, cord andfabric, jo<strong>in</strong>t and millboard, friction materials and gaskets. The ma<strong>in</strong> sources of supplywere the United K<strong>in</strong>gdom (UK), United States of America (USA), Federal Republic ofGermany and Japan. With the clos<strong>in</strong>g of the crocidolite m<strong>in</strong>e at Wittenoom, Australianasbes<strong>to</strong>s production and exports decl<strong>in</strong>ed. Imports of chrysotile also started <strong>to</strong>decl<strong>in</strong>e.In Australia, over 60% of all production and 90% of all consumption of asbes<strong>to</strong>s fibrewas used <strong>in</strong> the asbes<strong>to</strong>s cement manufactur<strong>in</strong>g <strong>in</strong>dustry. From about 1940 <strong>to</strong> the late1960s all three types of asbes<strong>to</strong>s were used <strong>in</strong> this <strong>in</strong>dustry. The use of crocidolitebegan be<strong>in</strong>g phased out from 1967. Amosite was used until the mid 1980s. Much ofthe <strong>in</strong>dustry output rema<strong>in</strong>s <strong>in</strong> service <strong>to</strong>day <strong>in</strong> the form of “fibro” houses and waterand sewerage pip<strong>in</strong>g. By 1954, Australia was number four <strong>in</strong> the Western world <strong>in</strong>gross consumption of asbes<strong>to</strong>s cement products, after the USA, UK and France: andclearly first on a per capita basis. After World War II <strong>to</strong> 1954, 70 000 asbes<strong>to</strong>s cementhouses were built <strong>in</strong> the state of New South Wales alone (52% of all houses built).In Australia, until the 1960s, 25% of all new hous<strong>in</strong>g was clad <strong>in</strong> asbes<strong>to</strong>s cement.Exposures <strong>to</strong> asbes<strong>to</strong>s <strong>in</strong> the past were very high <strong>in</strong> some <strong>in</strong>dustries and occupations:as much as 25 million particles per cubic foot (150 fibres/ml) <strong>in</strong> asbes<strong>to</strong>s pulverisorsand dis<strong>in</strong>tegra<strong>to</strong>rs <strong>in</strong> the asbes<strong>to</strong>s cement <strong>in</strong>dustry, and up <strong>to</strong> 600 fibres/ml amongbaggers at Wittenoom. The use of asbes<strong>to</strong>s products has been regulated s<strong>in</strong>ce the late1970s. A series of regulations adopted <strong>in</strong> the late 1970s and early 1980s by the variousMesothelioma <strong>in</strong> Australia 2012 ... 1
states imposed exposure limits of 0.1 fibres/ml for crocidolite and amosite, and 0.1-1.0fibres/ml for chrysotile. In July 2003, a revised national exposure standard for chrysotileasbes<strong>to</strong>s of 0.1 fibres/ml was declared by the National Occupational Health andSafety Commission (NOHSC). The prohibition of all forms of asbes<strong>to</strong>s was adoptedsimultaneously under regulations <strong>in</strong> each Australian jurisdiction and Australian Cus<strong>to</strong>mson 31 December 2003.A new national Model Code of Practice, How <strong>to</strong> Manage and Control Asbes<strong>to</strong>s <strong>in</strong>the Workplace, December 2011, is available as an electronic publication on theSafe Work Australia web site. This Code of Practice provides practical guidance forpersons conduct<strong>in</strong>g a bus<strong>in</strong>ess or undertak<strong>in</strong>g on how <strong>to</strong> manage risks associated withasbes<strong>to</strong>s and asbes<strong>to</strong>s conta<strong>in</strong><strong>in</strong>g material at the workplace and thereby m<strong>in</strong>imise the<strong>in</strong>cidence of asbes<strong>to</strong>s-related diseases such as <strong>mesothelioma</strong>, asbes<strong>to</strong>sis and lungcancer.Mesothelioma ProjectionsDue <strong>to</strong> the long latency between exposure <strong>to</strong> asbes<strong>to</strong>s and diagnosis of<strong>mesothelioma</strong>, typically between 20 and 40 years, it is expected that the <strong>in</strong>cidence of<strong>mesothelioma</strong> will not peak until after 2013. Clements et al (2007a) predict that thenumber of new cases <strong>in</strong> Australia will peak <strong>in</strong> 2017. In another study, Clements et al(2007b) used two different models <strong>to</strong> project the <strong>in</strong>cidence of <strong>mesothelioma</strong> <strong>in</strong> men<strong>in</strong> New South Wales. Us<strong>in</strong>g an age/birth cohort model, they predict that the numberof new cases would peak <strong>in</strong> 2021 and us<strong>in</strong>g a model based on potential exposure <strong>to</strong>asbes<strong>to</strong>s <strong>in</strong> terms of age and calendar year, they predict the peak would occur <strong>in</strong> 2014.The new Australian Mesothelioma RegistryIn February 2010, Safe Work Australia <strong>in</strong>itiated and funded the establishment ofa new Mesothelioma Registry (www.<strong>mesothelioma</strong>-<strong>australia</strong>.com). The registryis adm<strong>in</strong>istered by the Cancer Institute of New South Wales <strong>in</strong> association withthe Monash Centre for Occupational & Environmental Health. Besides receiv<strong>in</strong>gnotifications of new diagnosis of <strong>mesothelioma</strong> from all Australian cancer registries,consent<strong>in</strong>g patients are asked about their residential, occupational and environmentalhis<strong>to</strong>ry. The Registry management committee <strong>in</strong>cludes some of the lead<strong>in</strong>g experts <strong>in</strong>asbes<strong>to</strong>s-related disease <strong>in</strong> Australia.The aims of the Australian Mesothelioma Registry are <strong>to</strong>:• better understand the exact relationship between asbes<strong>to</strong>s exposure and<strong>mesothelioma</strong>• better understand the nature and levels of asbes<strong>to</strong>s exposure that can result <strong>in</strong><strong>mesothelioma</strong>• identify the groups of workers exposed <strong>to</strong> potentially dangerous levels of asbes<strong>to</strong>sand <strong>to</strong> prevent that exposure• assist the development of policies <strong>to</strong> best deal with the asbes<strong>to</strong>s still present <strong>in</strong> ourenvironment (ma<strong>in</strong>ly our built environment)• provide <strong>in</strong>formation <strong>to</strong> assist researchers <strong>in</strong> undertak<strong>in</strong>g <strong>in</strong>vestigations with the aimof prevent<strong>in</strong>g <strong>mesothelioma</strong> <strong>in</strong> the future, and• identify other potential exposures that may cause <strong>mesothelioma</strong>.2 ... Safe Work Australia
Incidence of <strong>mesothelioma</strong>New cases diagnosed <strong>in</strong> <strong>2008</strong>All cases of cancer <strong>in</strong> Australia are notifiable by legislation <strong>to</strong> state and terri<strong>to</strong>ry cancerregistries. These registries report <strong>to</strong> the NCSCH which is operated by the AIHW underthe supervision of the Australasian Association of Cancer Registries (AACR). Nationaldata on <strong>mesothelioma</strong> are available from <strong>1982</strong>. National data presented <strong>in</strong> this reportwere provided by the AIHW. State and terri<strong>to</strong>ry data were provided by the relevantregistry through the AIHW.Incidence <strong>in</strong> a calendar year is def<strong>in</strong>ed as the number of new cases of <strong>mesothelioma</strong>diagnosed <strong>in</strong> an Australian state or terri<strong>to</strong>ry <strong>in</strong> that year. In <strong>2008</strong>, there were 661 peoplediagnosed with <strong>mesothelioma</strong> <strong>in</strong> Australia. Of these new cases about four out of everyfive cases (82%) were men.Figure 1 New cases of <strong>mesothelioma</strong>: by age and sex, <strong>2008</strong>Number of new cases1101009080706050403020100MalesFemalesAge group (years)Figure 1 shows the distribution by age and sex of new cases of <strong>mesothelioma</strong>diagnosed <strong>in</strong> <strong>2008</strong>. There were 543 men diagnosed with <strong>mesothelioma</strong> (see Table 1).These men were predom<strong>in</strong>ately of older age: 427 (79%) were aged 65 years or more.There was one man <strong>in</strong> his early thirties diagnosed but none younger.In <strong>2008</strong>, there were 118 women diagnosed with <strong>mesothelioma</strong>. Similarly, these womenwere predom<strong>in</strong>ately of older age: 87 (74%) were aged 65 years or more. There wasone women aged <strong>in</strong> her early thirties diagnosed but none younger.Mesothelioma <strong>in</strong> Australia 2012 ... 3
Figure 2 New cases of <strong>mesothelioma</strong>: age-specific <strong>in</strong>cidence rate by sex, <strong>2008</strong>New cases per 100 000 population5045403530252015105FemalesMales0Age group (years)Figure 2 shows the age-specific <strong>in</strong>cidence rates (new cases per 100 000 populationof that age) for the year <strong>2008</strong>. For men, the <strong>in</strong>cidence rate <strong>in</strong>creased consistentlyand considerably with age: reach<strong>in</strong>g a maximum of 49 new cases per 100 000 malesamong men aged 85 years and over. For women, a similar pattern was observed. Themaximum rate for women occurred among those aged 80–84 years: 8 new cases per100 000 females.Trends over time, <strong>1982</strong> <strong>to</strong> <strong>2008</strong>Table 1 New cases of <strong>mesothelioma</strong>: year of diagnosis by sex, <strong>1982</strong> <strong>to</strong> <strong>2008</strong>Year Males Females Total<strong>1982</strong> 134 22 1561983 131 15 1461984 149 17 1661985 178 24 2021986 195 30 2251987 174 29 2031988 246 31 2771989 229 40 2691990 257 34 2911991 260 47 3071992 287 39 3261993 318 51 3691994 373 47 4201995 335 59 3941996 362 53 4151997 393 75 4681998 412 61 4731999 400 76 4762000 403 77 4802001 468 107 5752002 455 109 5642003 540 112 6522004 510 93 6032005 499 114 6132006 487 104 5912007 561 107 668<strong>2008</strong> 543 118 6614 ... Safe Work Australia
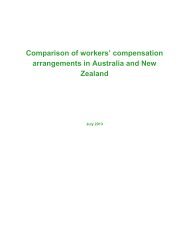
Figure 5 New cases of <strong>mesothelioma</strong>: age-specific <strong>in</strong>cidence rates for females,<strong>1982</strong> <strong>to</strong> <strong>2008</strong>New cases per 100 000 population1086420Females aged 80 years and overFemales aged 65–79Females aged 50–64Females aged 35–49Year of diagnosisS<strong>in</strong>ce 2002, the <strong>in</strong>cidence rate among women aged 80 years and over decl<strong>in</strong>edoverall from 9 <strong>to</strong> 4.5 new cases per 100 000 population <strong>in</strong> 2007. In <strong>2008</strong> the rate was7 new cases per 100 000 population (Figure 5). However, because of the relativelysmall number of women diagnosed, the rates are quite volatile.Age-standardisation is a method of adjust<strong>in</strong>g the crude <strong>in</strong>cidence rate <strong>to</strong> elim<strong>in</strong>atethe effect of differences <strong>in</strong> population age structures when compar<strong>in</strong>g crude rates fordifferent periods of time. By apply<strong>in</strong>g the observed age-specific death rates <strong>in</strong> eachyear <strong>to</strong> a standard population, the expected number of deaths can be calculated and amore comparable age-standardised rate can be calculated for each year.Figure 6 shows the age-standardised <strong>in</strong>cidence of new cases of <strong>mesothelioma</strong>(per 100 000 population) over the period <strong>1982</strong> <strong>to</strong> <strong>2008</strong>. The overall <strong>in</strong>cidence rate<strong>in</strong>creased from a m<strong>in</strong>imum of 1.1 new cases per 100 000 population <strong>in</strong> 1983 <strong>to</strong> amaximum of 3.2 <strong>in</strong> 2003. S<strong>in</strong>ce that date, the rate decl<strong>in</strong>ed <strong>to</strong> 2.7 <strong>in</strong> 2006, <strong>in</strong>creasedaga<strong>in</strong> <strong>in</strong> 2007 <strong>to</strong> 3.0, and then fell aga<strong>in</strong> slightly <strong>to</strong> 2.9 <strong>in</strong> <strong>2008</strong>.The age-standardised <strong>in</strong>cidence rate of new cases of <strong>mesothelioma</strong> for men wasconsiderably higher than that for women <strong>in</strong> all years. The male rate ranged between am<strong>in</strong>imum of 2.1 new cases per 100 000 males <strong>in</strong> 1983 <strong>to</strong> a maximum of 5.9 <strong>in</strong> 2003:Figure 6 New cases of <strong>mesothelioma</strong>: age-standardised <strong>in</strong>cidence rate by sex,<strong>1982</strong> <strong>to</strong> <strong>2008</strong>6MalesNew cases per 100 000 population54321PersonsFemales0Year of diagnosis6 ... Safe Work Australia
<strong>in</strong> <strong>2008</strong> there were 5 new cases per 100 000 males. The age-standardised <strong>in</strong>cidencerate for women over the period ranged between 0.2 new cases per 100 000 females <strong>in</strong>1983 and at or near 1 new cases per 100 000 females <strong>in</strong> recent years.Because asbes<strong>to</strong>s exposure <strong>in</strong> the workplace and the general environment has nowbeen elim<strong>in</strong>ated or m<strong>in</strong>imised, the <strong>in</strong>cidence of new cases of <strong>mesothelioma</strong> <strong>in</strong> thepopulation is expected <strong>to</strong> decl<strong>in</strong>e. However, because of the long latency betweenexposure <strong>to</strong> asbes<strong>to</strong>s and diagnosis of <strong>mesothelioma</strong>, typically between 20 and40 years, it is expected that the <strong>in</strong>cidence of <strong>mesothelioma</strong> will not peak until 2014 <strong>to</strong>2021, depend<strong>in</strong>g on the projection methodology. Further details can be found <strong>in</strong> theIntroduction, under Mesothelioma projections — p.6.State and Terri<strong>to</strong>ry dataFigure 7 shows the five-year roll<strong>in</strong>g average number of new cases of <strong>mesothelioma</strong>occurr<strong>in</strong>g <strong>in</strong> each state and terri<strong>to</strong>ry over the time period <strong>1982</strong>–1986 <strong>to</strong> 2004–<strong>2008</strong>:the period for which data are available for all states and terri<strong>to</strong>ries. Five-year roll<strong>in</strong>gaverages are used <strong>to</strong> smooth random annual variations and preserve confidentiality<strong>in</strong> the smaller states and terri<strong>to</strong>ries. Further detailed data by sex for each state andterri<strong>to</strong>ry can be found <strong>in</strong> Table 2.The five-year roll<strong>in</strong>g average number of new cases of <strong>mesothelioma</strong> <strong>in</strong> each stateand terri<strong>to</strong>ry generally reflects population distribution. The more populous states,H:\Data and Analysis\Projects\Mesothelioma\5th New South Wales, Vic<strong>to</strong>ria Annual and Meso Queensland, Report 2012\Data reported & the Analysis\Data largest number & explana<strong>to</strong>ry of new notes for 5th annual recases: respectively averag<strong>in</strong>g 211, 135 S&T and <strong>in</strong>cidence 119 cases over the five-year period2004–08. These three states have also experienced relatively consistent and similarrates of <strong>in</strong>crease <strong>in</strong> the number of cases of <strong>mesothelioma</strong> diagnosed over the period<strong>1982</strong>–86 <strong>to</strong> 2004–08. The number of new cases diagnosed <strong>in</strong> Western Australia<strong>in</strong>creased at a similar rate up until the mid-90s, and then the rate of <strong>in</strong>crease reduced.In South Australia and Tasmania the rate of <strong>in</strong>crease <strong>in</strong> the number of new cases s<strong>in</strong>cethe early 90s was not as great as <strong>in</strong> other jurisdictions.Figure 7 New cases of <strong>mesothelioma</strong>: five-year roll<strong>in</strong>g average number ofcases by state or terri<strong>to</strong>ry (a) , <strong>1982</strong>–1986 <strong>to</strong> 2004–<strong>2008</strong>250Average number of new cases200150100500NSWVicQldWASATasYear of diagnosis(a) Because the numbers of <strong>mesothelioma</strong> deaths <strong>in</strong> the ACT and the NT are relatively low, they cannot beplotted clearly at this scale. These numbers can be found <strong>in</strong> Table 2, p.12.Mesothelioma <strong>in</strong> Australia 2012 ... 7
Table 2 New cases of <strong>mesothelioma</strong>: five-year roll<strong>in</strong>g average number by state or terri<strong>to</strong>ry by sex, 1985–1989 <strong>to</strong> 2004–<strong>2008</strong>1985–89 1986–90 1987–91 1988–92 1989–93 1990–94 1991–95 1992–96 1993–97 1994–98 1995–99 1996–00 1997–01 1998–02 1999–03 2000–04 2001–05 2002–06 2003–07 2004–08M 77 80 85 92 97 110 116 123 127 132 131 134 139 141 150 156 163 167 175 175NSW F 11 12 12 13 14 14 16 17 19 21 23 24 28 31 34 34 37 38 36 35T 87 92 97 105 110 124 131 140 147 153 154 158 167 172 184 190 200 205 211 211M 39 42 44 51 56 61 64 73 77 83 82 85 89 90 98 105 108 105 113 110Vic F 5 6 7 8 9 11 13 14 17 17 18 19 18 20 22 23 24 24 24 25T 44 48 52 59 65 72 78 86 94 100 100 103 108 110 120 129 132 129 137 135M 32 34 37 38 39 47 49 50 58 64 66 71 79 83 85 88 90 94 98 99Qld F 3 4 6 7 8 8 8 8 8 8 10 10 14 17 17 18 20 20 18 20T 35 38 43 45 46 54 58 58 66 72 75 81 92 99 103 106 110 113 116 119M 28 31 34 37 41 44 49 52 55 55 57 56 57 59 60 62 68 69 70 75WA F 5 5 5 5 6 6 6 7 7 6 7 7 9 9 11 12 13 12 14 15T 33 36 38 42 47 50 55 59 62 61 63 63 66 68 71 74 81 82 84 90M 26 29 29 34 32 30 29 28 28 31 34 37 41 43 45 47 47 46 44 44SA F 5 5 5 5 5 4 4 4 5 5 6 7 8 8 9 9 10 9 10 10T 31 34 35 39 37 34 33 32 33 36 40 44 49 51 54 56 57 55 54 54M 2 3 3 4 5 5 5 5 5 5 4 5 5 7 9 11 12 11 11 9Tas F 0 0 0 0 0 0 1 1 1 1 1 1 1 1 2 2 2 2 2 1T 2 3 3 4 5 5 6 6 6 6 5 6 7 8 11 13 14 13 13 10M 1 1 1 1 1 2 2 2 2 2 3 4 4 4 5 5 5 4 6 5ACT F 1 1 1 0 0 0 0 0 1 1 1 1 1 0 0 1 1 1 1 1T 2 1 1 1 1 2 2 2 3 3 4 5 5 4 6 6 5 5 7 6M 0 0 0 0 1 1 1 2 2 3 2 2 1 1 1 2 2 2 2 2NT F 0 0 0 0 0 0 0 0 0 0 0 0 0 0 0 0 0 0 0 0T 0 0 0 0 1 1 1 2 2 3 3 2 2 1 1 2 2 2 2 2Aust.<strong>to</strong>talM 204 220 233 256 270 299 315 335 356 375 380 394 415 428 453 475 494 498 519 520F 31 33 36 38 42 44 49 50 57 59 65 68 79 86 96 100 107 106 106 107T 235 253 269 294 312 343 363 385 413 434 445 462 494 514 549 575 601 605 625 627Notes: M= male, F= female and T= <strong>to</strong>tal. The data above are averages rounded <strong>to</strong> the nearest person, consequently the sum of the relevant male and females figures does not necessarily equal the<strong>to</strong>tal figure. The five-year roll<strong>in</strong>g average for 1984–88 has been dropped from this table <strong>to</strong> allow for data for the latest report<strong>in</strong>g period, 2004–08, <strong>to</strong> be <strong>in</strong>cluded. Please refer <strong>to</strong> earlier reports <strong>in</strong> thisseries for <strong>1982</strong>–86, 1983–87, and 1984–88 data.8 ... Safe Work Australia
Deaths due <strong>to</strong> <strong>mesothelioma</strong> 1Deaths <strong>in</strong> 2007The cause of every Australian death is certified by a medical practitioner and recordedon a death certificate. These death certificates are required by state and terri<strong>to</strong>ryRegistrars of Births, Deaths and Marriages under jurisdiction specific legislation. Onbehalf of the Registrars these data are assembled, coded <strong>to</strong> the underly<strong>in</strong>g causeof death, and released by the Australian Bureau of Statistics (ABS). Cases wherethe underly<strong>in</strong>g cause of death was <strong>mesothelioma</strong> are discussed <strong>in</strong> this section. Dataon deaths due <strong>to</strong> <strong>mesothelioma</strong> are available from 1997 onwards, the year <strong>in</strong> whicha specific code for <strong>mesothelioma</strong> was added <strong>to</strong> the International Classification ofDiseases - 10th revision (ICD10).The <strong>in</strong>formation on deaths from <strong>mesothelioma</strong> <strong>in</strong> this section is based on the yearof death except for the most recent year 2007, where year of registration is used.The year of death and registration usually co<strong>in</strong>cide, although deaths at the end of acalendar year may be held over until the follow<strong>in</strong>g year, as will deaths whose causerequires further exam<strong>in</strong>ation by a coroner. In recent years less than 5% of deaths(all causes) were held over from one year <strong>to</strong> the next for process<strong>in</strong>g. This method ofreport<strong>in</strong>g the data allows the most recent year <strong>to</strong> be used.In 2007 there were 551 deaths registered with an underly<strong>in</strong>g cause of <strong>mesothelioma</strong>.Of these deaths, 464 (84%) were of men and 87 (16%) were of women.Figure 8 shows the age and sex distribution of those 551 decedents. Deaths amongyoung adults are rare: <strong>in</strong> 2007 the youngest deaths were <strong>in</strong> the 25–29 year age group.The graph shows that deaths due <strong>to</strong> <strong>mesothelioma</strong> were dist<strong>in</strong>ctly skewed <strong>to</strong>wards theolder age groups: this is particularly clear for the male decedents with 75% aged over65 years at the time of death. The comparable figure for female decedents was 70%.Figure 8 Deaths due <strong>to</strong> <strong>mesothelioma</strong>: by age and sex, 2007 (a)Number of deaths1009080706050403020100MalesFemalesAge group (years)(a) Data for 2007 is based on year of registration, not year of death.1. Note that data on deaths reported <strong>in</strong> this publication are based on data from state and terri<strong>to</strong>ry Registrarsof Births, Deaths and Marriages which are assembled, coded and released by the ABS. This data may differ<strong>to</strong> those reported by state cancer registries, which use pathology reports and other notifications, as well asdeath certificates, <strong>to</strong> ascerta<strong>in</strong> deaths from <strong>mesothelioma</strong>.Mesothelioma <strong>in</strong> Australia 2012 ... 9
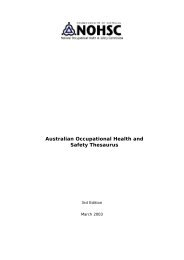
Figure 9 Deaths due <strong>to</strong> <strong>mesothelioma</strong>: age-specific <strong>mortality</strong> rates by sex, 2007 (a)50Deaths per 100 000 population403020100MalesFemalesAge group (years)(a) Data for 2007 is based on year of registration, not year of death.Figure 9 shows for 2007 the age-specific <strong>mortality</strong> rate (deaths per 100 000population) of deaths caused by <strong>mesothelioma</strong>. Because of the relatively shortsurvival period from onset of the disease, the age related pattern of <strong>mortality</strong> is verysimilar <strong>to</strong> that for diagnosis. The <strong>mortality</strong> rate for men <strong>in</strong>creases considerably andsteadily with age, reach<strong>in</strong>g a maximum of 46 deaths per 100 000 population amongmen aged 80–84 years before decl<strong>in</strong><strong>in</strong>g <strong>to</strong> 31 <strong>in</strong> the open-ended age group of 85years and over. For women, the rates were lower, but also reached a maximum of 6deaths per 100 000 population among women <strong>in</strong> both the 80–84 and 85 years and overage groups.Trends over time, 1997 <strong>to</strong> 2007National dataThe overall number of deaths result<strong>in</strong>g from <strong>mesothelioma</strong> <strong>in</strong>creased over theperiod between 1997 and 2007. The number of deaths reached a maximum of 551registered deaths <strong>in</strong> 2007; this followed a brief decl<strong>in</strong>e after an earlier peak of 545 <strong>in</strong>2004. Most of these decedents were male, with an average of 84% of <strong>to</strong>tal deathsover the eleven years.Figure 10 Deaths due <strong>to</strong> <strong>mesothelioma</strong>: year of death by sex, 1997 <strong>to</strong> 2007 (a)600Persons500Number of deaths400300200100MalesFemales01997 1998 1999 2000 2001 2002 2003 2004 2005 2006 2007Males 353 360 333 375 434 406 426 458 444 389 464Females 63 43 57 61 85 84 84 87 93 87 87Persons 416 403 390 436 519 490 510 545 537 476 551Year of death(a) Data for 2007 is based on year of registration, not year of death.10 ... Safe Work Australia
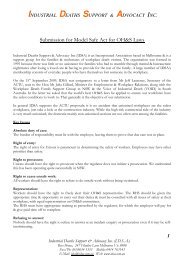
Figure 11 Deaths due <strong>to</strong> <strong>mesothelioma</strong>: age-standardised <strong>mortality</strong> rate by sex,1997 <strong>to</strong> 2007 (a)5MalesDeaths per 100 000 population43210PersonsFemales1997 1998 1999 2000 2001 2002 2003 2004 2005 2006 2007Year of death(a) Data for 2007 is based on year of registration, not year of death.Figure 11 shows that the overall age-standardised rate of death due <strong>to</strong> <strong>mesothelioma</strong>has rema<strong>in</strong>ed relatively stable over the eleven years for which data are available.Over the period the standardised rate has ranged between a m<strong>in</strong>imum of 2.1 deathsper 100 000 population <strong>in</strong> 1999 and a maximum of 2.7 <strong>in</strong> 2001. The standardised rate<strong>in</strong> 2007 was 2.4 deaths per 100 000 population.State and terri<strong>to</strong>ry dataH:\Data and Analysis\Projects\Mesothelioma\5th Figure 12 shows the average Annual number Meso Report of deaths 2012\Data due & <strong>to</strong> Analysis\Data <strong>mesothelioma</strong> & explana<strong>to</strong>ry occurr<strong>in</strong>g <strong>in</strong> notes for 5th annual reporeach state and terri<strong>to</strong>ry over the time S&T period <strong>mortality</strong> for which data are available. The patternof <strong>mortality</strong> across the states and terri<strong>to</strong>ries is similar <strong>to</strong> that of the <strong>in</strong>cidence of newcases s<strong>in</strong>ce the deaths reported result from develop<strong>in</strong>g <strong>mesothelioma</strong>: the rank<strong>in</strong>gFigure 12 Deaths due <strong>to</strong> <strong>mesothelioma</strong>: five-year roll<strong>in</strong>g average number bystate or terri<strong>to</strong>ry (a) , 1997-2001 <strong>to</strong> 2003-2007200NSWFive year average number of deaths150Vic100QldWA50SATas01997–2001 1998–2002 1999–2003 2000–2004 2001–2005 2002–2006 2003–2007NSW 149 148 154 159 168 165 175Vic 94 97 100 111 115 112 107Qld 74 81 90 94 97 99 104WA 63 64 64 67 69 70 73SA 43 44 47 50 52 45 47Tas 6 8 9 13 13 13 11ACT 3 4 4 5 5 5 5NT 2 1 0 1 1 1 1Year of death(a) Because the number of <strong>mesothelioma</strong> deaths <strong>in</strong> the ACT and NT are relatively low, they cannot beplotted clearly on this scale.Mesothelioma <strong>in</strong> Australia 2012 ... 11
primarily reflect<strong>in</strong>g the size of the population of the state or terri<strong>to</strong>ry. Any differencesbetween the number of people diagnosed with <strong>mesothelioma</strong> and the numberthat die from the disease must be attributable <strong>to</strong> variations <strong>in</strong> survival periods; thenumber of deaths that occur among those with the disease from causes other than<strong>mesothelioma</strong>; and <strong>in</strong> some cases, change of residence across state and terri<strong>to</strong>ryborders between diagnosis and death.12 ... Safe Work Australia
ReferencesClements M, Berry G & Shi J. Actuarial projections for <strong>mesothelioma</strong>: anepidemiological perspective. Presented <strong>to</strong> the Actuaries of Australia Xlth AccidentCompensation Sem<strong>in</strong>ar 2007a.Clements M, Berry G, Shi J, Ware S, Yates D, Johnson A. Projected <strong>mesothelioma</strong><strong>in</strong>cidence <strong>in</strong> men <strong>in</strong> New South Wales. Occupational and Environmental Medic<strong>in</strong>e2007b;64:747-752.Leigh J & Driscoll T. Malignant Mesothelioma <strong>in</strong> Australia, 1945-2002. InternationalJournal of Occupational and Environmental Health 2003;9:206-217.Useful l<strong>in</strong>ksMany of the State Cancer Registries publish state specific reports which <strong>in</strong>clude<strong>in</strong>formation on <strong>mesothelioma</strong>. In addition the AIHW releases detailed spreadsheets ofnational <strong>mesothelioma</strong> data. This <strong>in</strong>formation can be found via the l<strong>in</strong>ks below:• AIHW• Cancer Institute NSW• Vic Cancer Registry• WA Cancer Registry• SA Cancer Registry• Qld Cancer Registry• Tas Cancer Registry• NT Cancer Registrywww.aihw.gov.auwww.cancer<strong>in</strong>stitute.org.auwww.cancervic.org.auwww.health.wa.gov.au/wacrhttp://www.cancerqld.org.au/page/research_statistics/queensland_cancer_registry/www.menzies.utas.edu.auhttp://www.health.nt.gov.au/Health_Ga<strong>in</strong>s/Publications/<strong>in</strong>dex.aspx#NTCancerRegistry• ACT Cancer publicationswww.health.sa.gov.au/pehs/branches/branch-cancerregistry.htmhttp://health.act.gov.au/health-services/populationhealth/epidemiology-branch/epidemiology-publicationshealth-series/cancer-<strong>in</strong>-the-act-<strong>in</strong>cidence-and<strong>mortality</strong>-2011Australian Mesothelioma Registry:www.<strong>mesothelioma</strong>-<strong>australia</strong>.comSafe Work Australia has a web page for Mesothelioma related reports:http://www.safework<strong>australia</strong>.gov.au/AboutSafeWorkAustralia/WhatWeDo/Statistics/Pages/Mesothelioma.aspxMesothelioma <strong>in</strong> Australia 2012 ... 13
Enquiries:For further <strong>in</strong>formation about the contents of this publication contact:Data & Analysis SectionSafe Work Australia(02) 6121 9152Info@SafeWorkAustralia.gov.au