Australian Mesothelioma Register Report 2002 - Safe Work Australia
Australian Mesothelioma Register Report 2002 - Safe Work Australia
Australian Mesothelioma Register Report 2002 - Safe Work Australia

Create successful ePaper yourself
Turn your PDF publications into a flip-book with our unique Google optimized e-Paper software.
Table 9Table 10Table 11Table 12Figure 6Figure 7Figure 8Figure 9Table 13Table 14Table 15Table 16Table 17Table 18Male cases of mesothelioma in<strong>Australia</strong>, 1999, by age and State 14Female cases of mesothelioma in<strong>Australia</strong>, 1999, by age and State 14Age-specific incidence rates formesothelioma per million males in<strong>Australia</strong>, 1999, by age and State 15Age-specific incidence rates formesothelioma per million females in<strong>Australia</strong>, 1999, by age and State 15Crude incidence of mesothelioma in<strong>Australia</strong>, 1999, by age and sex 16Cases of mesothelioma in <strong>Australia</strong>,1997 - 1999, by site of primary lesion 17Trends in <strong><strong>Australia</strong>n</strong> incidence ofmesothelioma per million persons,by State, 1982 - 1999 18Trends in <strong><strong>Australia</strong>n</strong> incidence ofmesothelioma per million persons,by sex, 1982 - 1999 19Number of mesothelioma casesassociated with a past asbestos exposureand industry in <strong>Australia</strong>, 1997-1999 20Number of work-related, mesotheliomacases and industry in <strong>Australia</strong>, 1997-1999 20Number of mesothelioma cases classified byoccupation and industry in <strong>Australia</strong>,1997-1999 21Number of mesothelioma cases associatedwith a past asbestos exposure and occupationin <strong>Australia</strong>, 1997-1999 22Number of work-related, mesothelioma casesand occupation in <strong>Australia</strong>, 1997-1999 22Number of work-related, mesothelioma casesassociated with a past exposure to asbestosin <strong>Australia</strong>, 1997-1999 23Appendix AAsbestos exposures as documented in the<strong><strong>Australia</strong>n</strong> <strong>Mesothelioma</strong> <strong>Register</strong>,from 1 January 1986 to 31 December 2001 24iv
EXECUTIVE SUMMARYThis publication is the fourteenth report of the <strong><strong>Australia</strong>n</strong> <strong>Mesothelioma</strong> <strong>Register</strong> (the <strong>Register</strong>),produced by the Epidemiology Unit of the National Occupational Health and <strong>Safe</strong>ty Commission (NOHSC).<strong>Mesothelioma</strong> is a fatal form of cancer usually with a very long period between exposure and diagnosis.Long-term data from the <strong>Register</strong> indicates that:(a) the incidence rates of malignant mesothelioma have been increasing in <strong>Australia</strong> since 1965. It isbelieved that these high rates of mesothelioma are related to the extensive use and productionof asbestos in <strong>Australia</strong> in previous decades;(b) mesothelioma incidence rates are higher in males than females, possibly because of a higherexposure in male-dominated industries that produced or used asbestos (e.g. construction andmanufacturing);(c) the 50-64, 65-79 and 80 plus age groups have the highest age-specific incidences ofmesothelioma;(d) year-to-year fluctuations in age-specific mesothelioma incidence rates are lower in personsyounger than 64 years than in older persons; and(e) most <strong><strong>Australia</strong>n</strong> mesothelioma cases are cancerous lesions of the pleura. <strong>Mesothelioma</strong> casesaffecting the peritoneum and other sites are fewer.Based on the malignant mesothelioma cases recorded in 1997-99:(a) there is no indication of when the incidence rates of mesothelioma will start to decline in<strong>Australia</strong>;(b) incidence rates of malignant mesothelioma continue to be the highest in males, especially in SAand WA. The NT, the ACT and TAS have incidence rates below the national average while NSW,QLD and VIC have incidence rates approximating to the national average of 60 cases per millionmales; and(c) incidence rates of mesothelioma in SA are now higher than what they were previously, especiallyin males aged 75 years and above. SA now has the highest incidence rate for malignantmesothelioma cases for (92-118 per million males) in <strong>Australia</strong>, which is higher than the nationalaverage (60 cases per million males). It is not clear however, whether this indicates a genuinedivergence from other jurisdictions or changes in the consistency of reporting in differentjurisdictions.Since 1986 the <strong>Register</strong> has received 5,546 notifications of mesothelioma. About 88% of these caseswere linked to a previous exposure to asbestos. Cases of mesothelioma reported to the <strong>Register</strong> in 1997-1999 were used to study occupational exposure to asbestos, given industry and occupation, with theview to improve efficiency in monitoring mesothelioma. The <strong><strong>Australia</strong>n</strong> and New Zealand StandardIndustrial Classification (ANZSIC) (ABS 1993) and the <strong><strong>Australia</strong>n</strong> Standard Classification of Occupations(ASCO) (ABS 1997) coding systems were used to code for industry and occupation, respectively. About50 cases from VIC were excluded from the study because of a lack of information on industry,occupation and other information necessary to determine work-relatedness and asbestos exposure. Thestudy found that:(a) About 50% of the cases were uncodeable for industry and occupation;(b) Close to 45-49% of the cases were uncodeable for occupational asbestos exposure and workrelatedness;(c) A third of the persons that were exposed to asbestos worked in the Construction industry and aquarter worked in the Manufacturing industry;(d) Of the mesothelioma cases with a past asbestos exposure, close to 90% were work-related,about 2% were not work-related and the rest (9%) could not be classified;(e) Of the persons with work-related mesothelioma, one in three had worked in the Constructionindustry and one in five had worked in the Manufacturing industry. <strong>Work</strong>ers in the Cultural andRecreational Services industry had the fewest cases of occupational mesothelioma; and(f) Most occupational asbestos exposures occurred among Tradespersons/Related workers,Labourers/Related workers or Intermediate Production/Transport workers. In general, Serviceworkers (e.g. Advanced Clerical/Service workers and Elementary Clerical workers) had thefewest cases of occupational asbestos exposures.1
THE AUSTRALIAN MESOTHELIOMA PROGRAM AND REGISTERThe <strong><strong>Australia</strong>n</strong> <strong>Mesothelioma</strong> Surveillance Program (Ferguson et al, 1987) began on 1 January1980. Formal voluntary notification of cases was actively sought from a network of respiratoryphysicians, pathologists, general and thoracic surgeons, medical superintendents, medicalrecords administrators, State and Territory departments of occupational health, cancerregistries, compensation authorities or any other source. A full occupational and environmentalhistory was obtained for each case, either from the patient or next-of-kin. The history takingwas non directive but included specific questions on asbestos exposure at the end.Occupational and environmental exposure was based on the opinions of two experiencedhygienists, who were not independent or blinded as to disease status. The diagnosingpathologist was requested to provide slides and/or tissue specimens. These were circulatedamong a pathology expert panel for confirmation of diagnosis. Post-mortem examination wasactively sought in every case in order to confirm diagnosis and to obtain lung tissue free oftumour for lung fibre content analysis.From 1 January 1986, a less detailed notification system has operated, with a shortquestionnaire history, which is followed up by mail. In the case of all WA and most of the NSWnotifications (comprising 60% of the total <strong><strong>Australia</strong>n</strong> notifications), detailed occupational andenvironmental exposure histories from interview are available from the WA <strong>Mesothelioma</strong> <strong>Register</strong>and the NSW Dust Diseases Board. Only histologically confirmed cases are accepted but thereis no pathology panel diagnosis confirmation. This is now known as the <strong><strong>Australia</strong>n</strong> <strong>Mesothelioma</strong><strong>Register</strong> but is a continuation of the Program. Cross checks with State cancer registries areregularly carried out. Annual incidence reports are published (NIOHS (AGPS) 1989 - 2001).Recent reviews are available (Leigh, 1994, Leigh et al 1998, 2001).This report includes data on cases notified to the register and diagnosed in 1997, 1998 and1999. Reconciliation with all State cancer registries has been carried out, but some initialunder-reporting for 1999, 2000 and 2001 might be expected because of the relocation of the<strong>Register</strong> from Sydney to Canberra 2001 and recent changes in privacy legislation.Full analysis of incidence in 2000, 2001 and <strong>2002</strong> awaits reconciliation checks with State cancerregistries. However, notifications for 2000, 2001 and <strong>2002</strong> (to 31 March <strong>2002</strong>) wererespectively 490, 685 and 82.NOHSC acknowledges the continued cooperation of the notification network.3
STATISTICSIncidence in a calendar year is defined as the number of new cases of mesothelioma firstoccurring * in an <strong><strong>Australia</strong>n</strong> State or Territory in that year. Age specific incidence rates arecomputed from population tables published by the <strong><strong>Australia</strong>n</strong> Bureau of Statistics for theestimated resident mid year populations for 1997, 1998 and 1999 (estimates based on Census30 June, 1996). Standardised incidence rates (SI) were calculated using the "World StandardPopulation" 20 years of age or greater 1 .The cumulative incidence rate (CR) is obtained by summing the annual incidence rates (assumedconstant in each 5 year group). It can be shown, for rare diseases like mesothelioma, that thecumulative incidence rate approximates the cumulative risk, or probability, of developing thedisease in a lifetime 2 . This can be expressed as a percentage. Thus the figure 0.36 in table 3 forNSW (males) under CR indicates a 0.36% or 0.0036 lifetime (20-75) risk of developingmesothelioma. Therefore, the chance of developing mesothelioma between the ages 20-75 isapproximately 1 in 275.* "First occurrence" is the earliest known date of diagnosis (presumptive orconfirmed). Cases where a presumptive diagnosis had been rejected beforethe date of this report (27 March <strong>2002</strong>) have been excluded.1. Waterhouse, J., Muir, C., Shanmugaratnam, K., & Powell, J., eds, CancerIncidence in Five Continents Volume IV, Lyon (IARC Scientific PublicationsNo 42, 1982) pp 671- 674.2. Breslow, N. & Day, N., Statistical Methods in Cancer Research Volume I,Lyon (IARC Scientific Publications No 32, 1980) pp 51-52.4
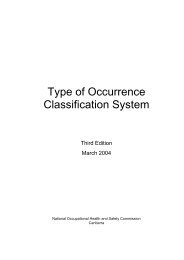
Figure 1Incident cases of malignant mesothelioma in <strong>Australia</strong>, 1945 - 1999750Number of cases7006506005505004504003503002502001501005001945 1950 1955 1960 1965 1970 1975 1980 1985 1990 1995 2000Year of diagnosis5
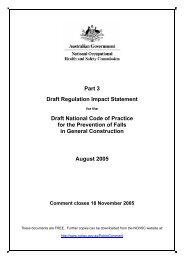
Figure 2Age-specific incidence rates of malignant mesothelioma in<strong><strong>Australia</strong>n</strong> men, 1986 - 1999350Incidence per million males300Age 80+250200Age 65-79150100Age 50-6450Age 35-490Age 20-341986 1987 1988 1989 1990 1991 1992 1993 1994 1995 1996 1997 1998 1999Year of diagnosis6
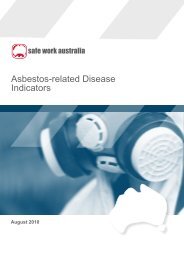
Figure 340Age-specific incidence rates of malignant mesothelioma in<strong><strong>Australia</strong>n</strong> women, 1986 - 1999Incidence per million females35Age 65-7930Age 80+252015Age 50-64105Age 35-490Age 20-341986 1987 1988 1989 1990 1991 1992 1993 1994 1995 1996 1997 1998 1999Year of diagnosis7
Table 1MALE CASES OF MESOTHELIOMA IN AUSTRALIA,1997, BY AGE AND STATENSW VIC QLD SA WA TAS NT ACT AUST20-24 0 0 0 0 0 0 0 0 025-29 0 0 0 0 0 0 0 0 030-34 0 0 0 0 0 0 0 0 035-39 1 0 0 0 1 0 0 0 240-44 1 1 0 0 1 0 0 0 345-49 4 0 1 0 1 0 0 0 650-54 7 4 11 1 1 1 0 0 2555-59 8 5 9 3 5 0 0 0 3060-64 13 15 13 2 10 0 0 0 5365-69 16 16 12 6 11 0 0 0 6170-74 37 22 12 10 9 1 0 0 9175-79 23 12 10 7 15 0 0 0 6780-84 11 12 4 5 4 0 0 0 3685+ 5 4 1 1 2 3 0 0 16All ages 126 91 73 35 60 5 0 0 390Table 2FEMALE CASES OF MESOTHELIOMA IN AUSTRALIA,1997, BY AGE AND STATENSW VIC QLD SA WA TAS NT ACT AUST20-24 0 0 0 0 0 0 0 0 025-29 0 0 0 1 0 0 0 0 130-34 0 1 0 0 0 0 0 0 135-39 0 0 0 0 0 0 0 0 040-44 0 0 0 0 0 0 0 0 045-49 1 3 3 0 0 0 0 0 750-54 0 2 2 3 0 0 0 0 755-59 3 4 1 0 1 0 0 0 960-64 4 0 0 2 2 0 0 0 865-69 1 2 0 1 0 0 0 1 570-74 7 6 1 1 1 0 0 1 1775-79 6 1 2 1 1 0 0 0 1180-84 1 1 0 0 1 0 0 0 385+ 0 2 1 1 0 0 0 1 5All ages 23 22 10 10 6 0 0 3 748
Table 3AGE-SPECIFIC INCIDENCE RATES FOR MESOTHELIOMAPER MILLION MALES IN AUSTRALIA, 1997, BY AGE AND STATENSW VIC QLD SA WA TAS NT ACT AUST20-24 0.0 0.0 0.0 0.0 0.0 0.0 0.0 0.0 0.025-29 0.0 0.0 0.0 0.0 0.0 0.0 0.0 0.0 0.030-34 0.0 0.0 0.0 0.0 0.0 0.0 0.0 0.0 0.035-39 4.0 0.0 0.0 0.0 13.7 0.0 0.0 0.0 2.740-44 4.3 5.9 0.0 0.0 14.3 0.0 0.0 0.0 4.445-49 18.4 0.0 8.2 0.0 15.2 0.0 0.0 0.0 9.250-54 37.0 29.4 105.6 22.3 18.5 70.4 0.0 0.0 44.955-59 54.1 46.3 113.1 86.3 121.5 0.0 0.0 0.0 69.360-64 103.5 164.0 203.5 65.5 306.5 0.0 0.0 0.0 147.165-69 134.9 186.1 205.4 201.7 372.8 0.0 0.0 0.0 181.370-74 372.4 307.3 246.6 379.9 378.9 131.8 0.0 0.0 323.775-79 339.3 251.3 297.8 390.9 979.5 0.0 0.0 0.0 352.980-84 288.9 431.4 211.6 479.3 444.0 0.0 0.0 0.0 331.885+ 230.7 236.4 88.8 166.6 348.2 1743.2 0.0 0.0 250.0All ages 56.7 55.9 61.1 66.2 94.6 30.7 0.0 0.0 59.6SI 45.4 46.4 56.7 46.6 88.6 24.8 0.0 0.0 50.4CR 0.36 0.37 0.44 0.38 0.62 0.10 0.00 0.00 0.39Lifetimerisk 1 in: 275 271 227 265 161 989 - - 256Table 4AGE-SPECIFIC INCIDENCE RATES FOR MESOTHELIOMAPER MILLION FEMALES IN AUSTRALIA, 1997, BY AGE AND STATENSW VIC QLD SA WA TAS NT ACT AUST20-24 0.0 0.0 0.0 0.0 0.0 0.0 0.0 0.0 0.025-29 0.0 0.0 0.0 18.6 0.0 0.0 0.0 0.0 1.430-34 0.0 5.5 0.0 0.0 0.0 0.0 0.0 0.0 1.435-39 0.0 0.0 0.0 0.0 0.0 0.0 0.0 0.0 0.040-44 0.0 0.0 0.0 0.0 0.0 0.0 0.0 0.0 0.045-49 4.7 18.8 25.6 0.0 0.0 0.0 0.0 0.0 10.950-54 0.0 15.0 20.3 67.2 0.0 0.0 0.0 0.0 13.155-59 20.8 37.6 13.4 0.0 25.6 0.0 0.0 0.0 21.460-64 31.5 0.0 0.0 63.7 61.6 0.0 0.0 0.0 22.065-69 8.0 22.0 0.0 31.8 0.0 0.0 0.0 253.0 14.270-74 59.6 69.9 18.4 32.2 37.8 0.0 0.0 276.5 51.875-79 65.5 15.2 46.4 40.7 48.9 0.0 0.0 0.0 43.080-84 15.7 21.5 0.0 0.0 67.5 0.0 0.0 0.0 16.885+ 0.0 50.3 41.4 68.8 0.0 0.0 0.0 800.0 33.5All ages 10.0 12.8 8.2 18.0 9.4 0.0 0.0 27.2 10.9SI 7.6 10.5 6.9 16.2 8.5 0.0 0.0 28.5 9.0CR 0.06 0.08 0.04 0.11 0.06 0.00 0.00 0.26 0.07Lifetimerisk 1 in: 1605 1185 2579 936 1600 - - 378 14689
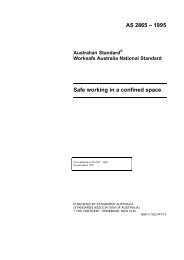
Figure 4Crude incidence of mesothelioma1000Incidence per millionin <strong>Australia</strong>, 1997,by age and sex100101020-24 25-29 30-34 35-39 40-44 45-49 50-54 55-59 60-64 65-69 70-74 75-79 80-84 85+Age in yearsMalesFemales10
Table 5MALE CASES OF MESOTHELIOMA IN AUSTRALIA,1998, BY AGE AND STATENSW VIC QLD SA WA TAS NT ACT AUST20-24 0 0 0 0 0 0 0 0 025-29 0 0 0 0 0 0 0 0 030-34 0 0 0 0 0 0 0 0 035-39 1 0 1 0 1 0 0 0 340-44 2 1 0 1 0 0 0 0 445-49 2 5 1 0 0 0 0 0 850-54 8 16 2 3 2 0 0 0 3155-59 15 6 10 5 7 0 0 0 4360-64 9 7 15 14 12 1 0 0 5865-69 29 15 9 2 13 2 0 1 7170-74 19 21 7 6 10 2 0 0 6575-79 19 14 13 7 6 0 0 0 5980-84 14 10 6 3 4 0 0 0 3785+ 6 4 1 8 2 0 0 0 21All ages 124 99 65 49 57 5 0 1 400Table 6FEMALE CASES OF MESOTHELIOMA IN AUSTRALIA,1998, BY AGE AND STATENSW VIC QLD SA WA TAS NT ACT AUST20-24 0 0 0 0 0 0 0 0 025-29 0 0 0 0 0 0 0 0 030-34 0 0 0 0 0 0 0 0 035-39 0 0 0 0 0 0 0 0 040-44 1 0 0 0 0 0 0 0 145-49 1 3 0 2 1 0 0 0 750-54 1 0 0 2 0 1 0 0 455-59 2 1 0 0 0 0 0 0 360-64 4 1 2 0 1 1 0 0 965-69 2 4 0 1 2 0 0 0 970-74 1 2 1 1 1 0 0 0 675-79 5 1 1 1 1 0 0 0 980-84 2 1 1 0 2 0 0 0 685+ 1 1 0 0 0 0 0 0 2All ages 20 14 5 7 8 2 0 0 5611
Table 7AGE-SPECIFIC INCIDENCE RATES FOR MESOTHELIOMAPER MILLION MALES IN AUSTRALIA, 1998, BY AGE AND STATENSW VIC QLD SA WA TAS NT ACT AUST20-24 0.0 0.0 0.0 0.0 0.0 0.0 0.0 0.0 0.025-29 0.0 0.0 0.0 0.0 0.0 0.0 0.0 0.0 0.030-34 0.0 0.0 0.0 0.0 0.0 0.0 0.0 0.0 0.035-39 3.9 0.0 7.4 0.0 13.4 0.0 0.0 0.0 4.040-44 8.5 5.8 0.0 18.1 0.0 0.0 0.0 0.0 5.745-49 9.1 31.5 8.1 0.0 0.0 0.0 0.0 0.0 12.250-54 39.9 111.4 18.0 63.8 34.5 0.0 0.0 0.0 52.455-59 98.8 54.2 121.0 139.1 164.1 0.0 0.0 0.0 96.460-64 71.6 76.5 234.8 458.5 367.8 104.3 0.0 0.0 161.065-69 246.9 175.9 154.0 68.4 439.7 222.8 0.0 263.8 212.470-74 188.7 287.3 141.0 225.0 412.2 259.6 0.0 0.0 227.375-79 266.0 277.0 368.6 371.3 363.7 0.0 0.0 0.0 294.280-84 360.6 358.2 307.5 284.7 447.4 0.0 0.0 0.0 336.185+ 260.6 221.0 82.3 1237.4 333.1 0.0 0.0 0.0 307.5All ages 55.2 60.0 53.5 92.1 88.1 30.7 0.0 9.4 60.4SI 45.1 49.5 48.6 76.8 88.0 26.7 0.0 13.2 52.2CR 0.33 0.37 0.34 0.49 0.72 0.29 0.00 0.13 0.39Lifetimerisk 1 in: 300 269 292 206 140 341 - 758 259Table 8AGE-SPECIFIC INCIDENCE RATES FOR MESOTHELIOMAPER MILLION FEMALES IN AUSTRALIA, 1998, BY AGE AND STATENSW VIC QLD SA WA TAS NT ACT AUST20-24 0.0 0.0 0.0 0.0 0.0 0.0 0.0 0.0 0.025-29 0.0 0.0 0.0 0.0 0.0 0.0 0.0 0.0 0.030-34 0.0 0.0 0.0 0.0 0.0 0.0 0.0 0.0 0.035-39 0.0 0.0 0.0 0.0 0.0 0.0 0.0 0.0 0.040-44 4.2 0.0 0.0 0.0 0.0 0.0 0.0 0.0 1.445-49 4.6 18.6 0.0 37.7 15.5 0.0 0.0 0.0 10.850-54 5.2 0.0 0.0 42.3 0.0 68.6 0.0 0.0 7.055-59 13.5 9.2 0.0 0.0 0.0 0.0 0.0 0.0 7.060-64 31.0 10.5 31.3 0.0 29.9 100.2 0.0 0.0 24.365-69 16.2 44.4 0.0 32.4 66.4 0.0 0.0 0.0 25.870-74 8.5 23.2 18.1 32.5 37.2 0.0 0.0 0.0 18.275-79 52.4 14.4 22.2 38.9 46.3 0.0 0.0 0.0 33.680-84 31.1 21.6 33.1 0.0 136.4 0.0 0.0 0.0 33.385+ 18.3 24.1 0.0 0.0 0.0 0.0 0.0 0.0 12.8All ages 8.6 8.1 4.0 12.5 12.3 11.6 0.0 0.0 8.2SI 6.7 6.8 3.3 10.6 10.0 12.4 0.0 0.0 6.7CR 0.04 0.05 0.02 0.07 0.07 0.08 0.00 0.00 0.05Lifetimerisk 1 in: 2402 1889 4045 1380 1343 1185 - - 211712
Figure 51000Incidence per millionCrude incidence of mesotheliomain <strong>Australia</strong>, 1998,by age and sex100101020-24 25-29 30-34 35-39 40-44 45-49 50-54 55-59 60-64 65-69 70-74 75-79 80-84 85+Age in yearsMalesFemales13
Table 9MALE CASES OF MESOTHELIOMA IN AUSTRALIA,1999, BY AGE AND STATENSW VIC QLD SA WA TAS NT ACT AUST20-24 0 1 0 0 0 0 0 0 125-29 0 0 0 0 0 0 0 0 030-34 0 0 0 0 1 0 0 0 135-39 1 1 0 0 0 0 0 0 240-44 0 1 1 1 2 0 0 0 545-49 2 1 2 0 0 0 0 0 550-54 4 8 3 2 7 0 0 3 2755-59 5 6 9 6 2 1 0 0 2960-64 9 11 10 11 6 0 0 0 4765-69 20 11 10 11 10 0 0 2 6470-74 19 13 5 10 9 1 0 2 5975-79 22 9 8 12 8 0 0 1 6080-84 12 6 4 6 9 1 0 0 3885+ 6 2 7 4 2 0 0 0 21All ages 100 70 59 63 56 3 0 8 359Table 10FEMALE CASES OF MESOTHELIOMA IN AUSTRALIA,1999, BY AGE AND STATENSW VIC QLD SA WA TAS NT ACT AUST20-24 0 0 0 0 0 0 0 0 025-29 0 0 0 0 0 0 0 0 030-34 1 0 0 0 0 0 0 0 135-39 0 1 0 0 0 0 0 0 140-44 0 0 0 0 0 0 0 0 045-49 2 1 0 0 0 0 0 0 350-54 0 2 2 2 0 0 0 0 655-59 3 3 0 3 1 0 0 0 1060-64 1 3 1 2 0 0 0 0 765-69 1 0 0 1 0 0 0 0 270-74 5 5 1 1 3 0 0 0 1575-79 5 5 3 0 3 0 0 0 1680-84 1 1 3 2 0 0 0 0 785+ 1 1 1 0 0 0 0 0 3All ages 20 22 11 11 7 0 0 0 7114
Table 11AGE-SPECIFIC INCIDENCE RATES FOR MESOTHELIOMAPER MILLION MALES IN AUSTRALIA, 1999, BY AGE AND STATENSW VIC QLD SA WA TAS NT ACT AUST20-24 0.0 5.7 0.0 0.0 0.0 0.0 0.0 0.0 1.425-29 0.0 0.0 0.0 0.0 0.0 0.0 0.0 0.0 0.030-34 0.0 0.0 0.0 0.0 14.1 0.0 0.0 0.0 1.435-39 3.9 5.4 0.0 0.0 0.0 0.0 0.0 0.0 2.740-44 0.0 5.7 7.7 18.0 27.8 0.0 0.0 0.0 7.145-49 9.0 6.2 16.1 0.0 0.0 0.0 0.0 0.0 7.550-54 19.4 53.9 25.9 41.0 115.5 0.0 0.0 282.1 44.155-59 31.5 52.3 103.0 161.4 44.6 82.7 0.0 0.0 62.260-64 68.9 116.0 144.8 352.0 169.7 0.0 0.0 0.0 124.165-69 172.0 129.3 170.8 381.4 337.4 0.0 0.0 514.9 192.470-74 186.5 175.7 98.5 372.8 363.7 128.5 0.0 644.3 203.475-79 292.3 166.9 215.1 601.4 452.4 0.0 0.0 442.5 282.480-84 304.3 214.7 201.6 568.2 1010.3 323.4 0.0 0.0 342.185+ 244.4 103.2 543.6 577.6 312.4 0.0 0.0 0.0 288.1All ages 43.9 41.7 47.6 117.6 84.7 18.4 0.0 73.9 53.3SI 33.9 36.0 42.7 90.5 75.7 12.5 0.0 78.1 44.5CR 0.25 0.28 0.28 0.66 0.54 0.11 0.00 0.72 0.32Lifetimerisk 1 in: 407 363 353 151 186 947 - 139 309Table 12AGE-SPECIFIC INCIDENCE RATES FOR MESOTHELIOMAPER MILLION FEMALES IN AUSTRALIA, 1999, BY AGE AND STATENSW VIC QLD SA WA TAS NT ACT AUST20-24 0.0 0.0 0.0 0.0 0.0 0.0 0.0 0.0 0.025-29 0.0 0.0 0.0 0.0 0.0 0.0 0.0 0.0 0.030-34 4.2 0.0 0.0 0.0 0.0 0.0 0.0 0.0 1.435-39 0.0 5.3 0.0 0.0 0.0 0.0 0.0 0.0 1.340-44 0.0 0.0 0.0 0.0 0.0 0.0 0.0 0.0 0.045-49 9.1 6.1 0.0 0.0 0.0 0.0 0.0 0.0 4.550-54 0.0 13.5 18.1 40.8 0.0 0.0 0.0 0.0 10.155-59 19.5 26.5 0.0 80.7 23.8 0.0 0.0 0.0 22.260-64 7.6 31.0 15.0 61.6 0.0 0.0 0.0 0.0 18.565-69 8.2 0.0 0.0 32.7 0.0 0.0 0.0 0.0 5.870-74 42.7 58.3 17.9 32.7 110.4 0.0 0.0 0.0 45.575-79 49.8 68.1 63.9 0.0 131.4 0.0 0.0 0.0 56.880-84 15.6 21.9 98.6 117.3 0.0 0.0 0.0 0.0 39.285+ 17.3 23.0 36.7 0.0 0.0 0.0 0.0 0.0 18.2All ages 8.5 12.5 8.7 19.6 10.6 0.0 0.0 0.0 10.2SI 6.1 9.6 5.3 16.6 7.5 0.0 0.0 0.0 7.5CR 0.05 0.07 0.03 0.12 0.07 0.00 0.00 0.00 0.05Lifetimerisk 1 in: 2191 1421 3919 805 1490 - - - 182915
Figure 61000Incidence per millionCrude incidence of mesotheliomain <strong>Australia</strong>, 1999,by age and sex100101020-24 25-29 30-34 35-39 40-44 45-49 50-54 55-59 60-64 65-69 70-74 75-79 80-84 85+Age in yearsMalesFemales16
Figure 7Cases of mesothelioma in <strong>Australia</strong>,1997 - 1999, by site of primary lesion500No. of cases4003001997199819992001000Pleura Peritoneum Other UnknownSite of lesion17
Figure 8Trends in <strong><strong>Australia</strong>n</strong> incidence of mesotheliomaper million persons by State, 1982 - 199960Incidence per million50SA40WA30QLD20VICNSW1001982 1984 1986 1988 1990 1992 1994 1996 1998 2000Year of diagnosisStandardised to World Population 20 years of age or greater18
Figure 9Trends in <strong><strong>Australia</strong>n</strong> incidence of mesotheliomaper million persons by sex, 1982 - 199960Incidence per million50Males4030Persons2010Females01982 1984 1986 1988 1990 1992 1994 1996 1998 2000Year of diagnosisStandardised to World Population 20 years of age or greater19
Table 13IndustryNUMBER OF MESOTHELIOMA CASES ASSOCIATED WITH A PASTASBESTOS EXPOSURE AND INDUSTRY IN AUSTRALIA, 1997-1999Asbestos exposureYes Possibly No Unknown TotalUncodeable 73 43 11 547 673Construction 161 12 7 15 195Manufacturing 141 13 5 5 164Government Administration/Defence 52 4 4 6 66Communication/Finance/Insurance 26 11 7 9 53Transport/Storage 38 5 1 1 45Mining 22 2 2 1 27Retail Trade 17 3 3 2 25Electricity/Gas/Water 18 0 0 0 18Agriculture/Forestry/Fishing 11 3 2 0 16Cultural/Recreational Services 8 1 0 0 9Total 567 97 42 586 1292Table 14NUMBER OF WORK-RELATED, MESOTHELIOMA CASESAND INDUSTRY IN AUSTRALIA, 1997-1999Industry<strong>Work</strong>-relatedYes No Unknown TotalUncodeable 20 24 630 673Construction 194 0 1 195Manufacturing 164 0 0 164Government Administration/Defence 64 1 1 66Communication/Finance/Insurance 53 0 0 53Transport/Storage 45 0 0 45Mining 27 0 0 27Retail Trade 25 0 0 25Electricity/Gas/Water 18 0 0 18Agriculture/Forestry/Fishing 16 0 0 16Cultural/Recreational Services 8 0 1 9Total 634 25 633 129220
Table 15NUMBER OF MESOTHELIOMA CASES CLASSIFIED BY OCCUPATION AND INDUSTRY IN AUSTRALIA, 1997-1999IndustryUncodeableManagers/Administrators ProfessionalsAssociateProfessionalsTradespersons/RelatedworkersOccupationAdvancedClerical/ServiceworkersIntermediateClerical/Sales/ServiceworkersIntermediateProduction/TransportworkersElementaryClerical/Sales/ServiceworkersLabourers/RelatedworkersUncodeable 655 1 5 1 4 0 0 2 0 6 673Construction 1 21 4 2 142 0 1 8 3 13 195Manufacturing 3 4 10 0 86 1 3 18 0 39 164GovernmentAdministration/Defence 4 3 14 17 18 0 5 3 0 2 66Communication/Finance/Insurance 0 5 10 6 5 4 12 1 6 4 53Transport/Storage 0 0 2 0 5 1 0 12 1 24 45Mining 0 0 1 0 0 0 1 19 0 6 27Retail Trade 0 0 0 6 12 0 2 2 2 1 25Electricity/Gas/Water 1 0 2 0 12 0 0 2 0 1 18Agriculture/Forestry/Fishing 1 8 0 0 0 0 0 1 0 6 16Cultural/RecreationalServices 0 0 1 1 2 0 1 1 2 1 9Total 665 42 49 33 286 6 25 69 14 103 1292Total21
Table 16NUMBER OF MESOTHELIOMA CASES ASSOCIATED WITH A PASTASBESTOS EXPOSURE AND OCCUPATION IN AUSTRALIA, 1997-1999OccupationAsbestos exposureYes Possibly No Unknown TotalUncodeable 71 40 11 543 665Tradespersons/Related workers 241 21 8 16 286Labourers/Related workers 88 10 3 2 103Intermediate Production/Transport workers 61 4 2 2 69Professionals 35 5 4 5 49Managers/Administrators 25 6 3 8 42Associate Professionals 25 3 1 4 33Intermediate Clerical/Sales/Service workers 12 5 5 3 25Elementary Clerical/Sales/Service workers 7 3 2 2 14Advanced Clerical/Service workers 2 0 3 1 6Total 567 97 42 586 1292Table 17NUMBER OF WORK-RELATED, MESOTHELIOMA CASES ANDOCCUPATION IN AUSTRALIA, 1997-1999Occupation<strong>Work</strong>-relatedYes No Unknown TotalUncodeable 8 25 632 665Tradespersons/Related workers 286 0 0 286Labourers/Related workers 103 0 0 103Intermediate Production/Transportworkers 69 0 0 69Professionals 49 0 0 49Managers/Administrators 42 0 0 42Associate Professionals 33 0 0 33Intermediate Clerical/Sales/Serviceworkers 25 0 0 25Elementary Clerical/Sales/Serviceworkers 13 0 1 14Advanced Clerical/Service workers 6 0 0 6Total 634 25 633 129222
Table 18NUMBER OF WORK-RELATED, MESOTHELIOMA CASES ASSOCIATEDWITH A PAST EXPOSURE TO ASBESTOS IN AUSTRALIA, 1997-1999Asbestos<strong>Work</strong>-relatedexposure Unknown Yes No TotalUnknown 536 43 7 586Yes 52 503 12 567Possibly 37 57 3 97No 8 31 3 42Total 633 634 25 129223
APPENDIX AASBESTOS EXPOSURES AS DOCUMENTED IN THE AUSTRALIANMESOTHELIOMA REGISTERFROM 1 JANUARY 1986 TO 31 DECEMBER 2001Circumstances of exposure Single exposure With otherexposureTotalexposuresAcoustic engineer 1 0 1Air-conditioning 13 14 27Aircraft 11 5 16Armed forces / wartime 29 19 48Armed forces / peacetime 7 3 10Asbestos bagging (not Wittenoom) 8 4 12Asbestos bags – handled which hadcontained asbestos8 0 8Asbestos clothing worn 9 4 13Asbestos covers for cooking 3 0 3Asbestos dwelling/fence –built/renovated71 14 85Asbestos dwelling – lived in 29 9 38Asbestos products factory – lived near 11 2 13Asbestos products factory – worked near 11 0 11Asbestos mine – worked / lived near -(not Wittenoom)Asbestos product handled in theworkplace13 7 2045 9 54Asbestos product manufacturer - worked 107 39 146Asbestos product part of workplace orsurrounds50 13 63Asbestos tailings – played on as a child 10 4 14Asbestos / or products worker – livedwith/washed clothes47 6 53Bakery (ovens) 3 0 3Boilermaker / cleaner / attendant /installer / welder86 62 148Brake linings – made/ repaired 59 19 78Brewery 1 0 1Bricklayer 15 5 20Brickworks 8 3 11Builder / builder’s labourer 197 43 240Carpenter / joiner 234 49 283Cement factory worker 20 2 2224
APPENDIX A continuedCircumstances of exposure Single exposure With otherexposureTotalexposuresChemical engineer 1 0 1Civil engineer 7 0 7Coal miner 1 0 1Concreting 7 3 10Construction worker 15 2 17Demolition 5 2 7Design engineer 2 1 3Diesel engineer 0 1 1Dockyard worker 41 23 64Electrical engineer 7 8 15Electrical fitter 15 4 19Electrical mechanic 3 0 3Electrician 59 17 76Electroplater 0 1 1Engineer 30 1 31Fireproofing 5 0 5Fire doors 5 0 5Fire fighter 6 3 9Fitter / turner 56 23 79Flour miller 1 0 1Foundry 6 2 8Furnace 6 0 6Glassworks / glaziers 6 0 6Industrial chemist 5 0 5Industrial engineer 2 0 2Instrument technician 1 0 1Insulation 19 4 23Jeweller 7 2 9Knitting mill worker 1 0 1Laboratory technician 8 3 11Labourer 33 17 50Lagger 31 16 47Lagging in workplace 24 5 29Laundry / drycleaners 14 5 19Linesman 9 4 13Locksmith 1 0 125
APPENDIX A continuedCircumstances of exposure Single exposure With otherexposureTotalexposuresMachine fitter 3 1 4Machine inspector 2 0 2Machine operator 1 5 6Machinist 4 0 4Maintenance carpenter 3 1 4Maintenance electrician 2 1 3Maintenance engineer 4 1 5Maintenance fitter 13 5 18Maintenance mechanic 3 2 5Maintenance worker 12 3 15Marine engineer 11 8 19Mechanical engineer 7 0 7Mechanical fitter 8 5 13Metal fabrication 3 0 3Metal trades 3 1 4Metallurgy 1 0 1Moulder 4 1 5Navy 162 66 228Oil refinery 7 3 10Painter / decorator 40 8 48Panel beater 9 2 11Paper mill 3 2 5Patternmaker 6 3 9Pipes – handled / cut / stored / drilled 25 6 31Plasterer 18 7 25Plumbing 60 28 88Power station worker 88 52 140Pressure pack manufacturer 1 0 1Printing 10 3 13Radiographer 2 0 2Railways 102 50 152Renovations / maintenance / lagging inworkplace21 5 26Roofing 17 4 21Rubber manufacturing 0 1 126
APPENDIX A continuedCircumstances of exposure Single exposure With otherexposureTotalexposuresSheet metal 14 12 26Ships – building / repairing / on 76 59 135Shop fitter 2 0 2Site visits / inspections 8 7 15Smelting 1 0 1Steelworks 13 8 21Storeman 18 0 18Stoves 2 0 2Sugar mill 6 4 10Tannery 2 0 2Telephone technician 6 3 9Tiler 13 1 14Toolmaker 4 2 6Trades assistant 17 3 20Transporting asbestos 14 6 20Transporting asbestos product 17 3 20Truck driver - general 1 0 1Tyre factory 10 4 14Waterside worker 96 13 109Weighing trucks 1 0 1Welder 23 9 32Whitewash – Greece / Cyprus 4 1 5Wine making (filters) 1 0 1Wittenoom 194 60 254Wood machinist 4 0 4Wood chipper 1 0 127
SUMMARY OF ASBESTOS EXPOSURESAsbestos exposuresingle 2,800multiple 400possible 281No apparent asbestos exposure 475No response to questionnaire 1,590Total cases from 1/1/86 – 31/12/2001 5,546Respondents with asbestos exposure 3,481Total respondents 5,546Percentage respondents with asbestos exposure 88%28
APPENDIX BNATIONAL OCCUPATIONAL HEALTH AND SAFETY COMMISSIONAUSTRALIAN MESOTHELIOMA REGISTER NOTIFICATION__________________________________________________________________________Please direct all correspondence to:The Registrar<strong><strong>Australia</strong>n</strong> <strong>Mesothelioma</strong> <strong>Register</strong>, National Occupational Health and <strong>Safe</strong>tyCommission, GPO Box 1577 Canberra ACT 2600 Telephone: (02) 6279 1005Patient details - please supply ALL available informationSURNAME: ................................. FIRST NAMES: ..................................................................ADDRESS:..................................................................................................................................STATE: ………POSTCODE: ………GENDER: M / F DATE OF BIRTH: / /IF DECEASED, DATE OF DEATH: / / PLACE OF DEATH: ..........………DATE OF INITIAL DIAGNOSIS: Month ................ Year: ..................HISTOLOGICAL: YES / NOHOSPITAL DIAGNOSED: ........................ PRIMARY SITE: .................................................CLINICIAN'S NAME: ..................NAME OF LOCAL GP: ………………………………………….ADDRESS: ................................ ADDRESS: ……………………………………………………….Please describe briefly main occupation(s) of patient's worklife.OCCUPATIONYEARINDUSTRY1. ..................................................... 1. .................................................. 19 - 192. ..................................................... 2. .................................................. 19 - 193. ..................................................... 3. .................................................. 19 - 19KNOWN ASBESTOS EXPOSURE: YES / NOIf "YES" please indicate circumstances and duration:.....................................................................................................Details of person completing this form.NAME: ………………………………………… SIGNATURE: ………………………………………ADDRESS: …………………………………… DATE: ..............................................................Please circle the ap propriate category: CLINICIAN PATHOLOGIST CANCERREGISTRY MEDICAL RECORDS ADMINDUST DISEASES BOARD OTHER:----------------------------------------------------------------------------------------------------------------------------Office Use OnlyDate Received:REGISTRATION NO:29
LIST OF PUBLICATIONS FROM THE MESOTHELIOMA PROGRAM AND REGISTERArmstrong B.K., Musk A.W., Baker J.E., Hunt J.M., Newall C.C., Henzell H.R., Blunsdon B.S.,Clarke-Hundley M.D. (1984). Epidemiology of malignant mesothelioma in Western <strong>Australia</strong>.Med. J. Aust. 141:86-88.Baker G., Driscoll T., Daniel S., Thompson R., Lee J., Constance T., Ferguson D., Leigh J.(1991). Clinical features of mesothelioma associated with tumor cell histology. Proceedings ofthe Thoracic Society of <strong>Australia</strong> and New Zealand, p 33.Berry G. (1991). Prediction of mesothelioma, lung cancer, and asbestosis in formerWittenoom asbestos workers. Br. J. Ind. Med. 48:793-802.Berry G., Ferguson D.A., Fung C., Grimwood A., Major G. (1987). <strong>Mesothelioma</strong> as a resultof occupational exposure to asbestos in <strong>Australia</strong>. XXII International Congress on OccupationalHealth, Sydney, <strong>Australia</strong>, 1987, p 57.de Klerk N.H., Armstrong B.K., Musk A.W., Hobbs M.S.T. (1989). Predictions of future casesof asbestos-related disease among former miners and millers of crocidolite in Western<strong>Australia</strong>. Med. J. Aust. 151:616-620.Driscoll T., Baker G., Daniel S., Thompson R., Lee J., Ferguson D.A., Leigh J. (1993). Clinicalfeatures of malignant mesothelioma in <strong>Australia</strong>. Aust. NZ J. Med. 23:19-25.Driscoll T., Leigh J., Thompson R. (1993). Asbestos and non-asbestos factors in the aetiologyof malignant mesothelioma: a case-referent study. Proceedings of the 8th InternationalConference on Occupational Lung Diseases (Prague), 1:319-323.Ferguson D.A. (1989). Malignant mesothelioma - the rising epidemic (Letter). Med. J.Aust.150:233-235.Ferguson D.A. (1990). Low-level asbestos - the priorities are wrong (Letter). Med. J. Aust.152:617-618.Ferguson D.A., Berry G., Grimwood A. (1987). The incidence of mesothelioma in <strong>Australia</strong>.XXII International Congress on Occupational Health, Sydney, <strong>Australia</strong>, 1987, p 56.Ferguson D.A., Berry G., Jelihovsky T., Andreas S.B., Rogers A.J., Fung S.C., Grimwood A.,Thompson R. (1987). The <strong><strong>Australia</strong>n</strong> <strong>Mesothelioma</strong> Surveillance Program 1979-1985. Med. J.Aust. 147:166-172.Henderson D.W., de Klerk N.H., Hammar S.P., Hillerdal G., Huuskonen M.,Leigh J., Pott F., Roggli V.L., Shilkin K.B., Tossavainen A. (1997).Asbestos and Lung Cancer:is it attributable to asbestosis or to asbestos fibreburden? In: (B. Corrin ed) Pathology of Lung Tumors.London:Churchill Livingstonpp 83-118.30
Henderson D.W., Leigh, J. (2000). Asbestos and Lung Cancer: A selective update to theHelsinki Criteria for individual attribution. In: People and <strong>Work</strong> Research <strong>Report</strong>s. FIOH.Helsinki36:3-18.Henderson D.W., Roggli V.L, Shilkin K.B, Hammar S.P and Leigh J. (1995)Is Asbestosis an Obligate Precursor for Asbestos-Induced Lung Cancer? Fiber Burden and theChanging Balance of Evidence:A Preliminary Discussion Document In: Peters G.A., Peters B.J.(eds). Sourcebook on Asbestos Diseases Vol 11 Charlottesville:Michie pp 97-170.Henderson D.W., Shilkin K.B., Langlois S. Le P., Whitaker D. (eds). (1992). Malignantmesothelioma. Hemisphere, New York.Kjellstrom T., Smartt P. (2000). Increased mesothelioma incidence in New Zealand in theasbestos-cancer epidemic has started. NZ. Med. J. 113:485-490.Leigh J. (1991). The <strong><strong>Australia</strong>n</strong> <strong>Mesothelioma</strong> Program and <strong>Register</strong>. Proc. <strong>Work</strong>safe <strong>Australia</strong>Asbestos Symposium, pp 9-17.Leigh J. (1992). Review of "Malignant mesothelioma". Henderson et al (eds). Hemisphere,New York. Cancer Forum 16:176-177.Leigh J. (1994). The <strong><strong>Australia</strong>n</strong> <strong>Mesothelioma</strong> Program 1979-1994. In: Peters G.A. and Peters,B.J. (eds), The Current Status of the Asbestos Public Health Problem (Vol. 9, Sourcebook onAsbestos Diseases). N.H. Butterworth, pp 1-74.Leigh J. (1995). Malignant <strong>Mesothelioma</strong> in <strong>Australia</strong> 1982-1995. Epidemiology 6: S73.Leigh J. (1995). Malignant <strong>Mesothelioma</strong> in <strong>Australia</strong> 1982-1995. European Respiratory Journal8 (Supp.19): 437.Leigh J. (1995). <strong>Mesothelioma</strong>: is asbestos the only cause? (letter). Med. J. Aust. 163: 105-106.Leigh J. (1996). Predicting future numbers of cases of asbestos related disease in<strong>Australia</strong>. Proc. <strong>Work</strong>safe National Scientific Symposium Asbestos RelatedDiseases. Setting the National Research Agenda Sydney, June 1996.Leigh J. (1997). Malignant <strong>Mesothelioma</strong> in <strong>Australia</strong> 1945-1995. Environmental Managementand Health 8:177-178.Leigh J. (1997). Malignant <strong>Mesothelioma</strong> in <strong>Australia</strong> 1945-1995. RACP Fellowship Affairs 16(4): 29-32.Leigh J. (1999). Malignant mesothelioma in <strong>Australia</strong> 1945-1999. Proc 21 st Annual Conferenceof International Association of Cancer Registries (Lisbon) Absts. p 48.31
Leigh J. (1999). Malignant mesothelioma in <strong>Australia</strong> 1945-1999. Proc 5 th Meeting Int<strong>Mesothelioma</strong> Interest Group (Grantham, UK) Absts. p 41.Leigh J. (1999). The end game for asbestos? RACP Fellowship Affairs 18 (3): 35-37.Leigh J. (2000). Malignant <strong>Mesothelioma</strong> in <strong>Australia</strong> 1945-2000. Europ. Resp. J. 16 (Supp.31): 350.Leigh J. (2000). Malignant <strong>Mesothelioma</strong> in <strong>Australia</strong> 1945-2000. Respirology 5 (Supp.) :A59.Leigh J. (2001). Asbestos-related diseases: International estimates of future liability. Proc.Int. Cong. <strong>Work</strong> Injuries Prev., Rehab., Compensation (<strong>Work</strong>congress5) Adelaide Absts. p 102.Leigh J. (2001). Global future liability for asbestos-related disease. Proc. RACP AnnualScientific Meeting. Sydney Absts. p 63.Leigh J. (2001). Malignant mesothelioma in <strong>Australia</strong> (1945-2000). Int. J. Occ. Env. Health7(3) Supp :S34.Leigh J., Berry G., de Klerk, N.H., Henderson, D.W. (1996). Asbestos-Related LungCancer. Apportionment of Causation and Damages to Asbestos and TobaccoSmoke. In: Peters G.A., Peters B.J. (eds). Sourcebook on Asbestos Diseases Vol 13Charlottesville:Michie pp 141-166.Leigh J., Corvalan C., Copland P.I. (1993). Malignant mesothelioma incidence in <strong>Australia</strong>1982-1992. Proceedings of the 5th International Congress on Applied Mineralogy (Perth), pp28-30.Leigh J., Corvalan C.F., Copland P.I. (1993). The incidence of malignant mesothelioma in<strong>Australia</strong> 1982-92. Proceedings of the 8th International Conference on Occupational LungDiseases (Prague), 1: 314-318.Leigh J., Corvalan C.F., Grimwood A., Berry G., Ferguson D.A., Thompson R (1991). Theincidence of malignant mesothelioma in <strong>Australia</strong> 1982-1988. Am. J. Ind. Med. 20:643-655.Leigh J., Davidson P. (1995). Malignant <strong>Mesothelioma</strong> in <strong>Australia</strong> 1982-1995. Proceedings ofthe 5 th International Symposium of the ISSA Research Section (Bonn),pp 429-437.Leigh J., Davidson P., Hendrie L., Berry D. (<strong>2002</strong>). Malignant <strong>Mesothelioma</strong> in <strong>Australia</strong>(1945-2000). Am. J. Ind. Med. 41:188-201.Leigh J., Davidson P., Hendrie L., Berry D. (2001). Malignant <strong>Mesothelioma</strong> in <strong>Australia</strong>(1945-2000). J. Occ. Health and <strong>Safe</strong>ty (ANZ) 17:453-470.Leigh J., Davidson P., Hull B.P. (1996). Malignant mesothelioma in <strong>Australia</strong> 1945-1995.Epidemiology 7: S80.32
Leigh J., Davidson P, Hull B.P. (1996). Malignant mesothelioma in <strong>Australia</strong> 1945-1995. Proc. 30th Ann. Meeting Int. Ass. Cancer Registries (Edinburgh).Leigh J., Davidson P., Hull B.P. (1997). Malignant mesothelioma in <strong>Australia</strong> 1945-1995. Proc. Inhaled Particles VIII Ann. Occ. Hyg. 41(Supp. 1): 161-167.Leigh J., Davidson P., Hull B.P. (1998). Malignant mesothelioma in <strong>Australia</strong> 1945-1997. Excerpta Medica ICS 1153 Adv. Prev. Occ. Resp. Dis. 299-302.Leigh J., Driscoll T., Baker G., Corvalan C. (1991). The <strong><strong>Australia</strong>n</strong> <strong>Mesothelioma</strong> Program -Recent research results. J. Occup. Health <strong>Safe</strong>ty-Aust. NZ, 7:365-371.Leigh J., Hull B., Ruck L., Mandryk J., Rogers A.J. (1993). Lung asbestos fibre content bytype and length and mesothelioma site and cell type. Proceedings of the 8th InternationalConference on Occupational Lung Diseases (Prague), 1:351-356.Leigh J., Robinson B.W.S. (2001). The History of <strong>Mesothelioma</strong> in <strong>Australia</strong> 1945-2000. In:<strong>Mesothelioma</strong> (Robinson B.W.S., Chahinian P. eds) London: Taylor and Francis pp 55-87.Leigh J., Rogers A.J., Berry G., Ferguson D.A., Mulder H.B., Ackad M. (1990). Relationshipbetween lung asbestos fibre type and concentration and relative risk of mesothelioma. XXIIIInternational Congress on Occupational Health, Montreal, Canada, p 160.Leigh J., Rogers A.J., Ferguson D.A., Mulder H.B., Ackad M., Thompson R. (1991). Lungasbestos fiber content and mesothelioma cell type, site, and survival. Cancer 68:135-141.McNulty, J. C. (1962). Malignant pleural mesothelioma in an asbestos worker. Med. J. Aust.2:953-954.Musk A.W., de Klerk N.H., Eccles J.L. et al (1992). Wittenoom, Western <strong>Australia</strong>: A modernindustrial disaster. Am. J. Ind. Med. 21:735-747.Musk A.W., Dolin P.J., Armstrong B.K., Ford J.M., de Klerk N.H., Hobbs M.S. (1989). Theincidence of malignant mesothelioma in <strong>Australia</strong> 1947-1980. Med. J. Aust. 150:242-246.National Institute of Occupational Health and <strong>Safe</strong>ty - Epidemiology and SurveillanceUnit. <strong>Mesothelioma</strong> <strong>Report</strong>s 1989, 1990, 1991, 1992, 1993, 1994, 1995, 1996, 1997, 1998,1999, 2000, 2001 (Annual series). Canberra, AGPS.Rogers A.J. (1984). Determination of mineral fibre in human tissue by light microscopy andtransmission electron microscopy. Ann. Occup. Hyg. 28:1-12.Rogers A.J. (1992). Predictions of mesothelioma in former Wittenoom asbestos workers(Letter). Br. J. Ind. Med. 49:451-452.33
Rogers A.J., Leigh J., Berry G., Ferguson D.A., Mulder H.B., Ackad M. (1991). Relationshipbetween lung asbestos fiber type and concentration and relative risk of mesothelioma - Acase-control study. Cancer 67:1912-1920.Rogers A.J., Leigh J., Berry G., Ferguson D.A., Mulder H.B., Ackad M., Morgan G.G. (1994).Dose-response relationship between airborne and lung asbestos fibre type, length andconcentration and the relative risk of mesothelioma. Inhaled particles VII. Ann. Occup. Hyg.,38 (Supp. 1): 631-638.Rogers A.J., Yeung P., Johnson A., Leigh J., Davidson P. (1997). Trends inoccupational groups and industries associated with <strong><strong>Australia</strong>n</strong> mesothelioma cases1979-1995. Proc. Inhaled Particles VIII Ann. Occ. Hyg. 41(Supp. 1)123-128.Rossiter C.E. (1987). Asbestos blues (Letter). Med. J. Aust. 147:162.Takahashi K., Huuskonen M. S., Tossavainen A., Higashi T., Okubo T.and Rantanen, J. (1999). Ecological Relationship between <strong>Mesothelioma</strong> Incidence/Mortalityand Asbestos Consumption in Ten Western Countries and Japan, J. Occup. Health 41: 8-11.Tossavainen A., Takahashi K. (2000). Epidemiological trends for asbestos-related cancers, In:People and <strong>Work</strong> Research <strong>Report</strong>s. FIOH.Helsinki 36: 26-30.World Trade Organisation. (2000). European Communities - Measures affecting asbestosand asbestos-containing products. <strong>Report</strong> of the panel. WT/DS135/R 15 September 2000.Yeung P., Rogers A. (2001). An Occupation-Industry Matrix Analysis of <strong>Mesothelioma</strong> Cases in<strong>Australia</strong> 1980-1985. App. Occ. Env. Hyg. 16:40-44.34