Improved Sib-Pair Linkage Test for Disease Susceptibility Loci
Improved Sib-Pair Linkage Test for Disease Susceptibility Loci
Improved Sib-Pair Linkage Test for Disease Susceptibility Loci

Create successful ePaper yourself
Turn your PDF publications into a flip-book with our unique Google optimized e-Paper software.
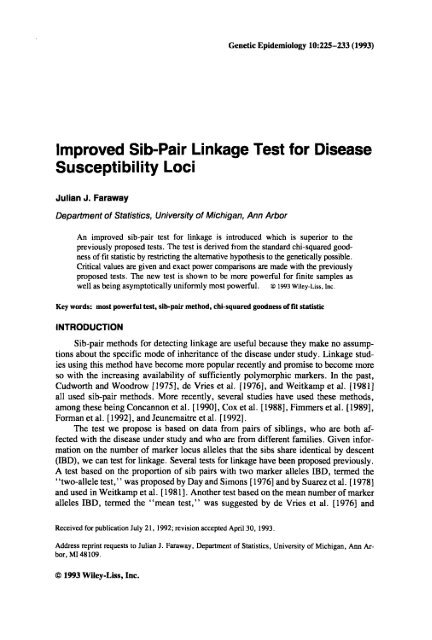
Powerful <strong>Sib</strong>-<strong>Pair</strong> <strong>Linkage</strong> <strong>Test</strong> 227tion of v0, pl, D2), which is asymptotically most powerful test, among linear combinations,against a specified point (Po, pl, p2) alternative. However, since the object ofsib-pair tests is to avoid specifying a point alternative, the alternative hypothesis mustrange over all physically possible values of (PO, pl, p2) and so, as the authors admit,this test is not practically applicable. They also proposed max(tl, t2) as a test statistic.NEW TEST STATISTICIf we restrict the alternative hypothesis to possible values of (Po, pl, p2) and computethe test statistic accordingly, then we can expect a more powerful test. The procedureis explained in Lehmann [ 1986:pp 480fl. This test is an asymptotically uni<strong>for</strong>mlymost powerful invariant test. So as n gets large this test is, in some sense, the bestpossible. We shall see that it dominates the other tests <strong>for</strong> small n also.Since the alternative hypothesis of our test allows all feasible (Po, pl, p2) (except thepoint of the null hypothesis, po = p2 = %, p1 = %), it is practical (in that parametersthat are not usually known, do not need to be specified) as well as asymptotically atleast as powerful, at any point in (Po, pl, p2), as the a<strong>for</strong>ementioned test.Now, following Suarez et al. [ 19781, we assume the trait locus has two alleles T andt with frequencies p and q = 1 - p. respectively. Let the penetrance probabilities <strong>for</strong>the three genotypes, ZT, Tt, tt, befl,f2,f3, respectively. We assume thatf, 2f2 >f3.The prevalence of the trait in the population (K) is then K = p2fl + 2p4f2 + u2f3 andthe additive (VA) and dominance (V,) variances areLet the recombination fraction be 8 and cp = 8 + (1 - 8)2, then the values of (Po,pl, p2) are then determined by K, VA, V, and 8 as described in table 3 of Suarez etal. [1978]:(Po, p,, p2) can only take values in a region F defined by 0 Sf,, f2, f3, p G 1 ,f, >f2 2f3, 0 S 8 G %. The region is determined by three linear constraints. The first,pl + p2 s1, follows trivially from the fact that PO + pl + p2 = 1. The second, p , < Yz, can bederived easily from the <strong>for</strong>mula <strong>for</strong>p, given above. The third restriction: 3p1/2 + p2 21, is more difficult to obtain. The triangle F is equivalent to that found independentlyby Holmans [ 19931. In addition, it may be shown that this triangle cannot be made anysmaller, which indicates that the power of the test cannot be improved further withoutthe imposition of tighter constraints on the parameters. See the Appendix <strong>for</strong> details.
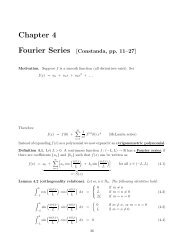
228 FarawayAp211/211400 p1Fig. 1. The value of the new test statistic depends on the observed value of 6, and e2, shown in thisdiagram.Suarez et a]. [1976] determined the feasible region <strong>for</strong> (VA, V,) <strong>for</strong> fixed valuesof K, but this is not sufficient to determine the feasible region of (pot pl, p2) <strong>for</strong> generalK.The computation of the test statistic requires that we must find the point in F thatminimizes the weighted distance to v0, pl, p2) and the compute the chi-squared statisticbased on that point, i.e., find the (vo, vl, v2) that minimizesubject to (vo, vl, v2) E F and then the test statistic isT = 4n(vo- 1/4)2 + 2n(vl- 1/2)2 -t 4n(V2- %)*.This is a straight<strong>for</strong>ward quadratic programing problem. For a reference on solvingsuch problems see Fletcher [1987]. Unless (Po, p,, p2) E F, S will be minimized
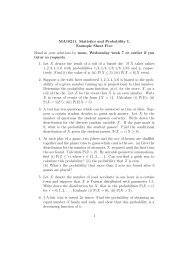
Powerful <strong>Sib</strong>-<strong>Pair</strong> <strong>Linkage</strong> <strong>Test</strong> 229TABLE I. Critical Values <strong>for</strong> TTail probability 0.05 0.01 0.005 0.001 0.0005 0.0001Critical value 3.42 6.48 1.71 11.00 12.60 16.22on the boundary of F, so the test statistic may be explicitly calculated. There are fourpossibilities, depending on the region in which Go, PI, p2) falls. Serendipitously, thetest statistic is a hybrid of three previously used tests.t9 -xfl =f2=0.05,f3=0.005...............................9-xfl=0.09,f2=f3=0.0092-I20 40 60 80 1002 -I20 40 60 60 100No. of <strong>Sib</strong> pairsNo. of <strong>Sib</strong> pairsQdx2.I 220 40 60 80 100 20 40 60 80 100No. of <strong>Sib</strong> palnNo. of Slb pairsFig. 2. Exact power <strong>for</strong> the new test (T), the two-allele test, (i,), the mean test, (t2). and the chi-squaredgoodness of fit test (Y) <strong>for</strong> a nominal 5% level of significance, complete linkage, 0 = 0, population frequency,K = 0.01,
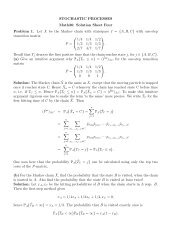
230 Faraway8fl =f2=0.05,f3=0.005x..........chi-square-. 0x -Ip20 40 60 80 100No. of <strong>Sib</strong> pairs20 40 60 80 100No. of <strong>Sib</strong> pairsxxfl=0.02,f2=f3=0.0028iig 2c0x20 40 60 80 1008ii& 2-dx20 40 60 80 100No. of <strong>Sib</strong> pairsNo. of <strong>Sib</strong> pairsFig. 3. Exact power <strong>for</strong> the new test (T), the two-allele test, (t,), the mean test, (tz), and the chi-squaredgoodness of fit test (Y) <strong>for</strong> a nominal 5% level of significance, complete linkage, 0 = 0.25, populationfrequency, K = 0.01.The regions and values of the test statistic may be seen in Figure 1. T is continuousas v0, PI, P2) varies. The asymptotic distribution of T can be calculated exactlyusing the asymptotic multivariate normality of v0, PI, P2) but its <strong>for</strong>m is not tractable.The exact distribution of T under the null hypothesis may be determined exactly <strong>for</strong> allvalues of n that are likely to occur in practice, because the computation is relativelyinexpensive. A program is available from the author which can determine exact criticalvalues <strong>for</strong> any desired size of test. Alternatively, Table I gives critical values basedon n = 150.POWERWe make the power comparisons as in Blackwelder and Elston [1985], setting 0= 0, K = 0.01, and the significance level to 5%. Due to the discreteness of all thetest statistics, a randomized decision rule was used to set the size at exactly 5% to
PI =~'f:Powerful <strong>Sib</strong>-<strong>Pair</strong> <strong>Linkage</strong> <strong>Test</strong> 233E2 +f:+ 6~2fi + 4e2 + 2 ~f: +f:Note that3p112 + p2 =4e2 + 6~2fi +f: + 3~f:e2f: + 6~2fi + 4e2 + 2~f: +f:which tends 1 1 as E + 0. Now sinceandIt is possible to choose anfl such that (PI, p2) comes arbitrarily close to the line 3p1/2 +p2 = 1 <strong>for</strong> a given pI between 0 and 112.To show that the other two bounds are tight, similar arguments apply. Forpl S 1/2,the boundary is described by setting 8 = 0, p = e,fi = f2 = 1 and lettingf3 varybetween 0 and 1 <strong>for</strong> E small. For p1 + p2 6 1, the boundary described by setting8 = 0, p = e,f1 = 1 ,f3 = E* and lettingf2 vary between 0 and 1.