NGC 2264 IRS Evidence for Triggered Star Formation - University of ...
NGC 2264 IRS Evidence for Triggered Star Formation - University of ...
NGC 2264 IRS Evidence for Triggered Star Formation - University of ...

Create successful ePaper yourself
Turn your PDF publications into a flip-book with our unique Google optimized e-Paper software.
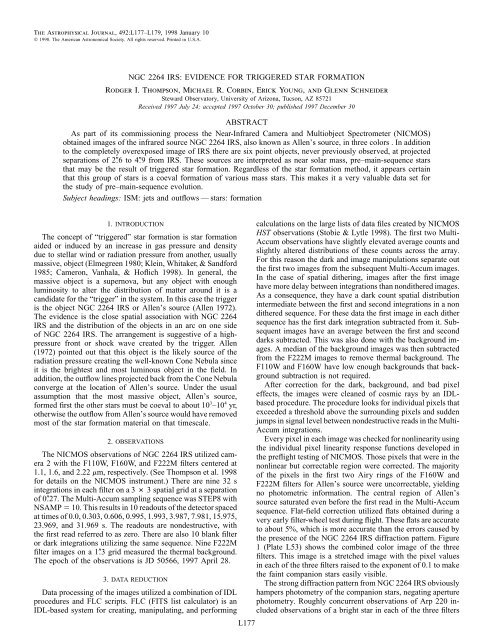
The Astrophysical Journal, 492:L177–L179, 1998 January 10 1998. The American Astronomical Society. All rights reserved. Printed in U.S.A.<strong>NGC</strong> <strong>2264</strong> <strong>IRS</strong>: EVIDENCE FOR TRIGGERED STAR FORMATIONRodger I. Thompson, Michael R. Corbin, Erick Young, and Glenn SchneiderSteward Observatory, <strong>University</strong> <strong>of</strong> Arizona, Tucson, AZ 85721Received 1997 July 24; accepted 1997 October 30; published 1997 December 30ABSTRACTAs part <strong>of</strong> its commissioning process the Near-Infrared Camera and Multiobject Spectrometer (NICMOS)obtained images <strong>of</strong> the infrared source <strong>NGC</strong> <strong>2264</strong> <strong>IRS</strong>, also known as Allen’s source, in three colors . In additionto the completely overexposed image <strong>of</strong> <strong>IRS</strong> there are six point objects, never previously observed, at projectedseparations <strong>of</strong> 2.6 to 4.9 from <strong>IRS</strong>. These sources are interpreted as near solar mass, pre–main-sequence starsthat may be the result <strong>of</strong> triggered star <strong>for</strong>mation. Regardless <strong>of</strong> the star <strong>for</strong>mation method, it appears certainthat this group <strong>of</strong> stars is a coeval <strong>for</strong>mation <strong>of</strong> various mass stars. This makes it a very valuable data set <strong>for</strong>the study <strong>of</strong> pre–main-sequence evolution.Subject headings: ISM: jets and outflows — stars: <strong>for</strong>mation1. INTRODUCTIONThe concept <strong>of</strong> “triggered” star <strong>for</strong>mation is star <strong>for</strong>mationaided or induced by an increase in gas pressure and densitydue to stellar wind or radiation pressure from another, usuallymassive, object (Elmegreen 1980; Klein, Whitaker, & Sand<strong>for</strong>d1985; Cameron, Vanhala, & H<strong>of</strong>lich 1998). In general, themassive object is a supernova, but any object with enoughluminosity to alter the distribution <strong>of</strong> matter around it is acandidate <strong>for</strong> the “trigger” in the system. In this case the triggeris the object <strong>NGC</strong> <strong>2264</strong> <strong>IRS</strong> or Allen’s source (Allen 1972).The evidence is the close spatial association with <strong>NGC</strong> <strong>2264</strong><strong>IRS</strong> and the distribution <strong>of</strong> the objects in an arc on one side<strong>of</strong> <strong>NGC</strong> <strong>2264</strong> <strong>IRS</strong>. The arrangement is suggestive <strong>of</strong> a highpressurefront or shock wave created by the trigger. Allen(1972) pointed out that this object is the likely source <strong>of</strong> theradiation pressure creating the well-known Cone Nebula sinceit is the brightest and most luminous object in the field. Inaddition, the outflow lines projected back from the Cone Nebulaconverge at the location <strong>of</strong> Allen’s source. Under the usualassumption that the most massive object, Allen’s source,<strong>for</strong>med first the other stars must be coeval to about 10 3 –10 4 yr,otherwise the outflow from Allen’s source would have removedmost <strong>of</strong> the star <strong>for</strong>mation material on that timescale.2. OBSERVATIONSThe NICMOS observations <strong>of</strong> <strong>NGC</strong> <strong>2264</strong> <strong>IRS</strong> utilized camera2 with the F110W, F160W, and F222M filters centered at1.1, 1.6, and 2.22 mm, respectively. (See Thompson et al. 1998<strong>for</strong> details on the NICMOS instrument.) There are nine 32 sintegrations in each filter on a 3 # 3 spatial grid at a separation<strong>of</strong> 0.27. The Multi-Accum sampling sequence was STEP8 withNSAMP 10. This results in 10 readouts <strong>of</strong> the detector spacedat times <strong>of</strong> 0.0, 0.303, 0.606, 0.995, 1.993, 3.987, 7.981, 15.975,23.969, and 31.969 s. The readouts are nondestructive, withthe first read referred to as zero. There are also 10 blank filteror dark integrations utilizing the same sequence. Nine F222Mfilter images on a 1.3 grid measured the thermal background.The epoch <strong>of</strong> the observations is JD 50566, 1997 April 28.3. DATA REDUCTIONData processing <strong>of</strong> the images utilized a combination <strong>of</strong> IDLprocedures and FLC scripts. FLC (FITS list calculator) is anIDL-based system <strong>for</strong> creating, manipulating, and per<strong>for</strong>mingL177calculations on the large lists <strong>of</strong> data files created by NICMOSHST observations (Stobie & Lytle 1998). The first two Multi-Accum observations have slightly elevated average counts andslightly altered distributions <strong>of</strong> these counts across the array.For this reason the dark and image manipulations separate outthe first two images from the subsequent Multi-Accum images.In the case <strong>of</strong> spatial dithering, images after the first imagehave more delay between integrations than nondithered images.As a consequence, they have a dark count spatial distributionintermediate between the first and second integrations in a nondithered sequence. For these data the first image in each dithersequence has the first dark integration subtracted from it. Subsequentimages have an average between the first and seconddarks subtracted. This was also done with the background images.A median <strong>of</strong> the background images was then subtractedfrom the F222M images to remove thermal background. TheF110W and F160W have low enough backgrounds that backgroundsubtraction is not required.After correction <strong>for</strong> the dark, background, and bad pixeleffects, the images were cleaned <strong>of</strong> cosmic rays by an IDLbasedprocedure. The procedure looks <strong>for</strong> individual pixels thatexceeded a threshold above the surrounding pixels and suddenjumps in signal level between nondestructive reads in the Multi-Accum integrations.Every pixel in each image was checked <strong>for</strong> nonlinearity usingthe individual pixel linearity response functions developed inthe preflight testing <strong>of</strong> NICMOS. Those pixels that were in thenonlinear but correctable region were corrected. The majority<strong>of</strong> the pixels in the first two Airy rings <strong>of</strong> the F160W andF222M filters <strong>for</strong> Allen’s source were uncorrectable, yieldingno photometric in<strong>for</strong>mation. The central region <strong>of</strong> Allen’ssource saturated even be<strong>for</strong>e the first read in the Multi-Accumsequence. Flat-field correction utilized flats obtained during avery early filter-wheel test during flight. These flats are accurateto about 5%, which is more accurate than the errors caused bythe presence <strong>of</strong> the <strong>NGC</strong> <strong>2264</strong> <strong>IRS</strong> diffraction pattern. Figure1 (Plate L53) shows the combined color image <strong>of</strong> the threefilters. This image is a stretched image with the pixel valuesin each <strong>of</strong> the three filters raised to the exponent <strong>of</strong> 0.1 to makethe faint companion stars easily visible.The strong diffraction pattern from <strong>NGC</strong> <strong>2264</strong> <strong>IRS</strong> obviouslyhampers photometry <strong>of</strong> the companion stars, negating aperturephotometry. Roughly concurrent observations <strong>of</strong> Arp 220 includedobservations <strong>of</strong> a bright star in each <strong>of</strong> the three filters
L178 THOMPSON ET AL. Vol. 492TABLE 1Properties <strong>of</strong> the Companion <strong>Star</strong>sObject Arcsec AU 1.1 Mag a H Mag K Mag1 ...... 4.9 3740 21.7 b 17.5 14.92 ...... 5.2 3940 21.7 16.2 13.03 ...... 3.6 2740 20.0 15.9 14.24 ...... 3.8 2910 20.7 16.0 13.35 ...... 4.5 3400 22.9 b 16.8 12.56 ...... 2.6 1990 22.9 b 16.3 12.6a“1.1 Mag” refers to the magnitude in the F110W filter inthe Arizona system with an A0 V star having zero color.bThese values are upper limits.<strong>for</strong> determination <strong>of</strong> the point spread function (PSF). Calibratedphotometry was done on this star; then scaled intensity images<strong>of</strong> these PSF observations were subtracted from the six sourcesin the current observation. The scaling <strong>for</strong> each source wasadjusted until only the <strong>IRS</strong> diffraction pattern and backgroundwere visible. Experimentation showed that scaling changes <strong>of</strong>10% are easily visible, generating an obvious source or holein the background. The photometry <strong>of</strong> the sources not in thediffraction spikes is accurate to 10% in the H and K bands. Insome cases there are only upper limits to the F110W flux. Thetwo sources (2 and 6) coincident with the spider diffractionspikes have about 15% accuracy. Table 1 gives photometricand spatial in<strong>for</strong>mation on the six sources.4. NATURE OF THE SOURCESA normal procedure in star <strong>for</strong>mation regions is to plot thesources in a color-color plot and place them in a computedevolutionary sequence. However, most computed evolutionarysequences utilize a gray atmosphere assumption that even theauthors warn against using (D’Antona & Mazzitelli 1994). Ingeneral, observations <strong>of</strong> pre–main-sequence objects find verynonstellar colors due to the presence <strong>of</strong> disks, associated dust,and outflows (Adams, Lada, & Shu 1987). Allen’s source itselfis a prime example with a very nonstellar spectral energy distribution(Chini, Krugel, & Kreysa 1986). For this reason wewill not try to place the companion stars on a theoretical temperatureluminosity track.4.1. Allen’s SourceAs has been noted previously (Thompson & Tokunaga 1978),the exact nature <strong>of</strong> <strong>NGC</strong> <strong>2264</strong> <strong>IRS</strong> is ambiguous. Its luminosity3<strong>of</strong> 2.3 # 10 L , is consistent with a ZAMS B2 star, however,its K magnitude <strong>of</strong> 4.88 (Allen 1972) is far too bright <strong>for</strong> a B2star, even in the absence <strong>of</strong> extinction. For reasons that will bediscussed later we will revise the extinction from the A V -value<strong>of</strong> 35 used in Thompson & Tokunaga (1978) to a value <strong>of</strong> 20.2With this extinction, the N V-value is consistent with a B0.2estar if only the Lyman continuum ionization is considered orwith B8 if the Balmer continuum is also utilized. The luminosityand ionization are consistent with an intermediate valuetypical <strong>of</strong> line excess sources that produce partial ionizationfrom the n 2 state (Thompson 1984). The excess K bright-ness is very probably due to the presence <strong>of</strong> a luminous viscousdisk or free-free emission from the very high-density ionizationregion implied by the line excess. The line excess requires avery strong outflow from the source even at the current time.4.2. The Companion SourcesThe H K colors <strong>of</strong> the companion sources are consistentwith very young, highly reddened sources <strong>of</strong> type a or b <strong>of</strong>Adams et al. (1987). If we assume that all <strong>of</strong> the sources havesimilar extinction, we can impose a criterion that the H Kcolor must be positive. The highest extinction that preservesthis criterion is AV 20. This extinction value is not highenough to satisfy the condition that Allen’s source must havean I magnitude fainter than 20. However, given the uncertaintiesin the slope <strong>of</strong> the extinction function in the I band, we adopt20 as a reasonable number <strong>for</strong> the region. Table 2 gives thedereddened and absolute magnitudes <strong>of</strong> the sources <strong>for</strong> thatextinction. The very red colors <strong>of</strong> all <strong>of</strong> the sources exceptsource 3 confirm that the companion stars do not have normalstellar colors but are consistent with the range <strong>of</strong> H K colorsfrom 0.4 to 3.1 found in the flat spectrum sources <strong>of</strong> Adamset al. (1987).Table 2 gives two estimates <strong>of</strong> the luminosity <strong>of</strong> the companionsources. The first estimate assumes that the spectralenergy distribution <strong>of</strong> the companion sources is similar to Allen’ssource and scales the Allen’s source luminosity by theratio <strong>of</strong> the observed K fluxes. The second method assumesthat all <strong>of</strong> the sources have the spectrum <strong>of</strong> a K7 dwarf andthat the dereddened K flux is the photospheric flux.An estimate <strong>of</strong> the masses <strong>of</strong> the companion objects is possibleusing the luminosity estimates, an evolutionary time, andthe tables in D’Antona & Mazzitelli (1994). In Table 2 the lastcolumn shows the estimated mass from the luminosity based5on Allen’s source and an evolutionary time <strong>of</strong> 1.5 # 10 yr.The evolutionary time is equal to the time needed <strong>for</strong> Allen’ssource to traverse the radiative equilibrium track and reach thezero-age main sequence (ZAMS) (Iben 1965). The massesrange between 0.12 and 0.42 M , , with a total mass in thecompanion stars <strong>of</strong> 1.74 M , .5. TRIGGERED OR UNASSISTED FORMATION?A viable alternative to triggered or assisted star <strong>for</strong>mationis previous or coeval <strong>for</strong>mation unaffected by <strong>NGC</strong> <strong>2264</strong> <strong>IRS</strong>.Also, we must consider the possibility that the observed objectsare just chance groupings <strong>of</strong> stars not physically associatedTABLE 2Intrinsic Magnitudes and Colors <strong>of</strong> the Companion <strong>Star</strong>s with A V 20Object 1.1 Mag H K Abs 1.1 a Abs H Abs K H K L ,bL ,cM ,1 . . . . . . 14.9 14.1 13.0 5.5 4.7 3.6 1.1 0.2 0.3 0.122 . . . . . . 14.9 12.8 11.1 5.5 3.4 1.7 1.7 1.3 1.6 0.333 . . . . . . 13.2 12.5 12.3 3.8 3.1 2.9 0.2 0.4 0.6 0.194 . . . . . . 13.9 12.6 11.4 4.5 3.2 2.0 1.2 1.0 1.3 0.285 . . . . . . 16.1 13.4 10.6 6.7 4.0 1.2 2.8 2.1 2.5 0.426 . . . . . . 16.1 12.9 10.7 6.7 3.5 1.3 2.2 1.9 2.5 0.40aThe absolute luminosity uses a distance <strong>of</strong> 760 pc (Hodapp 1994).bThe luminosity calculated by the ratio <strong>of</strong> K fluxes times the luminosity <strong>of</strong> Allen’s source.cThe luminosity calculated by assuming a K7 dwarf color.