Annual Report
Annual Report
Annual Report

Create successful ePaper yourself
Turn your PDF publications into a flip-book with our unique Google optimized e-Paper software.
HUBER+SUHNER <strong>Annual</strong> <strong>Report</strong> 2010 · Part 2<br />
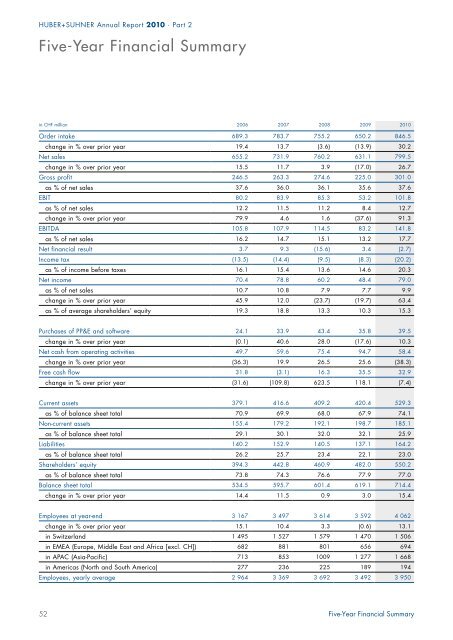
Five-Year Financial Summary<br />
in CHF million 2006 2007 2008 2009 2010<br />
Order intake 689.3 783.7 755.2 650.2 846.5<br />
52<br />
change in % over prior year 19.4 13.7 (3.6) (13.9) 30.2<br />
Net sales 655.2 731.9 760.2 631.1 799.5<br />
change in % over prior year 15.5 11.7 3.9 (17.0) 26.7<br />
Gross profit 246.5 263.3 274.6 225.0 301.0<br />
as % of net sales 37.6 36.0 36.1 35.6 37.6<br />
EBIT 80.2 83.9 85.3 53.2 101.8<br />
as % of net sales 12.2 11.5 11.2 8.4 12.7<br />
change in % over prior year 79.9 4.6 1.6 (37.6) 91.3<br />
EBITDA 105.8 107.9 114.5 83.2 141.8<br />
as % of net sales 16.2 14.7 15.1 13.2 17.7<br />
Net financial result 3.7 9.3 (15.6) 3.4 (2.7)<br />
Income tax (13.5) (14.4) (9.5) (8.3) (20.2)<br />
as % of income before taxes 16.1 15.4 13.6 14.6 20.3<br />
Net income 70.4 78.8 60.2 48.4 79.0<br />
as % of net sales 10.7 10.8 7.9 7.7 9.9<br />
change in % over prior year 45.9 12.0 (23.7) (19.7) 63.4<br />
as % of average shareholders’ equity 19.3 18.8 13.3 10.3 15.3<br />
Purchases of PP&E and software 24.1 33.9 43.4 35.8 39.5<br />
change in % over prior year (0.1) 40.6 28.0 (17.6) 10.3<br />
Net cash from operating activities 49.7 59.6 75.4 94.7 58.4<br />
change in % over prior year (36.3) 19.9 26.5 25.6 (38.3)<br />
Free cash flow 31.8 (3.1) 16.3 35.5 32.9<br />
change in % over prior year (31.6) (109.8) 623.5 118.1 (7.4)<br />
Current assets 379.1 416.6 409.2 420.4 529.3<br />
as % of balance sheet total 70.9 69.9 68.0 67.9 74.1<br />
Non-current assets 155.4 179.2 192.1 198.7 185.1<br />
as % of balance sheet total 29.1 30.1 32.0 32.1 25.9<br />
Liabilities 140.2 152.9 140.5 137.1 164.2<br />
as % of balance sheet total 26.2 25.7 23.4 22.1 23.0<br />
Shareholders’ equity 394.3 442.8 460.9 482.0 550.2<br />
as % of balance sheet total 73.8 74.3 76.6 77.9 77.0<br />
Balance sheet total 534.5 595.7 601.4 619.1 714.4<br />
change in % over prior year 14.4 11.5 0.9 3.0 15.4<br />
Employees at year-end 3 167 3 497 3 614 3 592 4 062<br />
change in % over prior year 15.1 10.4 3.3 (0.6) 13.1<br />
in Switzerland 1 495 1 527 1 579 1 470 1 506<br />
in EMEA (Europe, Middle East and Africa [excl. CH]) 682 881 801 656 694<br />
in APAC (Asia-Pacific) 713 853 1009 1 277 1 668<br />
in Americas (North and South America) 277 236 225 189 194<br />
Employees, yearly average 2 964 3 369 3 692 3 492 3 950<br />
Five-Year Financial Summary