URBAN LIFE ACCOUNTS - Itera
URBAN LIFE ACCOUNTS - Itera
URBAN LIFE ACCOUNTS - Itera

You also want an ePaper? Increase the reach of your titles
YUMPU automatically turns print PDFs into web optimized ePapers that Google loves.
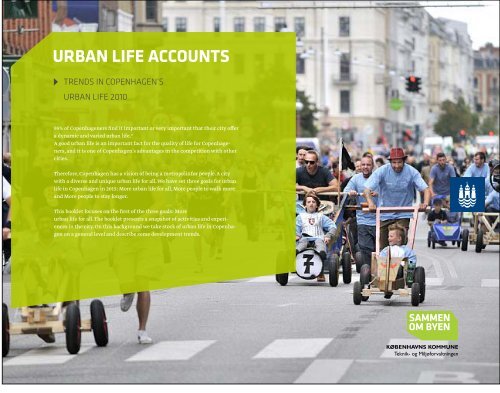
<strong>URBAN</strong> <strong>LIFE</strong> <strong>ACCOUNTS</strong>TRENDS IN COPENHAGEN’S<strong>URBAN</strong> <strong>LIFE</strong> 201095% of Copenhageners find it important or very important that their city offera dynamic and varied urban life.*A good urban life is an important fact for the quality of life for Copenhageners,and it is one of Copenhagen’s advantages in the competition with othercities.Therefore, Copenhagen has a vision of being a metropolis for people. A citywith a diverse and unique urban life for all. We have set three goals for urbanlife in Copenhagen in 2015: More urban life for all, More people to walk moreand More people to stay longer.This booklet focuses on the first of the three goals: Moreurban life for all. The booklet presents a snapshot of activities and experiencesin the city. On this background we take stock of urban life in Copenhagenon a general level and describe some development trends.
Contents1 MORE <strong>URBAN</strong> <strong>LIFE</strong> FOR ALL2 MORE PEOPLE TO WALK3 MORE PEOPLE TO STAY LONGER1.1 <strong>URBAN</strong> <strong>LIFE</strong> IN COPENHAGEN 5Urban life in Copenhagen is exciting and variedCopenhagen’s 2015 objective2010 status2.1 COPENHAGENERS ON FOOT 16A good city is a city where many people walkCopenhageners walk more than the average DaneCopenhagen’s 2015 objectiveEvery fourth trip is made on footEasier to get around on foot3.1HOW COPENHAGENERS USE THE <strong>URBAN</strong> SPACE 32A good city is a city where many people enjoy spending time outdoorsCopenhagen’s 2015 objectiveThe most popular placesCopenhageners’ satisfaction with recreational spaces in the cityHow to make us spend more time outdoorsMETHODThe urban life accounts are based on figures fromseveral studies, including counts and surveys ofpedestrians and the recreational use of streets, citysquares and parks, two polls carried out by Catinét, apoll carried out by Megafon, a study of transport habitscarried out by the Technical University of Denmark andmany other figures and statistics from the City ofCopenhagen, Technical and EnvironmentalAdministration. Most of the figures are from 2010, althoughsome date back to 2008 and 2009.1.2 <strong>URBAN</strong> <strong>LIFE</strong> MEANS OUTDOOR CAFÉS AND RESTAURANTS 8A cafe latte, please!Nyhavn: twice as much outdoor seating as No. 2Outdoor seating all year roundPedal-powered juice bar1.3 <strong>URBAN</strong> <strong>LIFE</strong> MEANS PEACE AND QUIET 11Ahhh...Urban life is about feeling safe2.2 WHERE, WHEN AND WHY WE WALK 19Where we walkCopenhagen’s inner city has become one big pedestrian zoneWhen we walkWhy we walkLocal variations in reasons for not walkingSatisfaction with pavements and snow clearing2.3 3 MAIN SHOPPING STREETS 25Number of pedestrians per hour in the main shopping streetsWe walk more in the main shopping streets in autumnWe walk more in the main shopping streets on Fridays3.2 SPENDING TIME IN CITY SQUARES AND SHOPPING STREETS 37Copenhageners spend time outdoors all year roundGender and age differencesPeople density in city squaresWhat we do when we spend time outdoors3.3 SPENDING TIME IN PARKS, ON BEACHES AND IN NATURE AREAS 40ParksPeople density in the parksWhat we do when we visit parks, beaches and nature areasGender and age differencesIn cases where the statistical uncertainty is particularlypronounced, this is mentioned in a note.Some of the raw data material is available on www.kk.dk.Here you will also find additional information about urbanlife in Copenhagen to supplement the stories that have beenhighlighted in this booklet.1.4 <strong>URBAN</strong> <strong>LIFE</strong> MEANS EVENTS 12Events for allHalf of all events take place in the inner cityThe most popular events are concerts, exhibitions and marketsWomen prefer markets and dancingMiddle-aged Copenhageners go to the theatre, older Copenhageners go to neighbourhoodparties2.4 SAFETY FOR ALL PEDESTRIANS 283.4 PHYSICAL ACTIVITY, PLAY AND PLAYGROUNDS 43Pedestrian safetyExercising in the cityPerceived safetyLocal variation in the degree of satisfactionGender differences in perceived safetySeasonal differences in use of the city’s outdoor sports facilitiesParents prefer to walk their children to schoolPlaygrounds – Copenhagen’s overlooked recreational spacesWomen’s streets and men’s streetsPlayground useDegree of satisfaction with playgrounds Number of children per playground2Available playground space per child3
1 MORE <strong>URBAN</strong> <strong>LIFE</strong> FOR ALL 1.1 <strong>URBAN</strong> <strong>LIFE</strong> IN COPENHAGEN<strong>URBAN</strong> <strong>LIFE</strong> IN COPENHAGEN IS EXCITING AND VARIEDAll Copenhagen districts are characterized by a close network of public transportationand close access to green areas, water and urban spaces that offer a chance to relax,exercise or take part in cultural experiences. But there are variations in residents’perceptions of the quality of the facilities and their distance from the home.In 2010, we asked the Copenhageners how satisfied they were with urban life. Thepoll found that Copenhageners generally find the city exciting, dynamic and varied,and that some districts in particular are perceived as inspiring.TOP 10 DISTRICTS WHERE A LARGE SHARE OF THERESIDENTS FEEL THAT THEY LIVE IN A NEIGHBOURHOODWITH A GOOD MIX OF HOMES, CULTURE, WORKPLACES,SHOPS AND AN ATTRACTIVE <strong>URBAN</strong> <strong>LIFE</strong> OVERALLCopenhagen is dynamic and varied 88%There are lots of exciting things going on in the city 85%Urban life in Copenhagen is boring, there is not enough going on 5%1. Inner city2. Vesterbro / Kongens Enghave3. Østerbro4. Nørrebro5. Vanløse6. Valby7. Amager east8. Amager west9. Brønshøj-Husum10. BispebjergThe list has some statistical uncertainty. Source: Megafon.Source: Catinét.45
COPENHAGEN’S 2015 GOALBY 2015, 80% OF COPENHAGENERS SHOULD BE SATISFIED WITHTHEIR OPPORTUNITIES FOR TAKING PART IN <strong>URBAN</strong> <strong>LIFE</strong>.2010-status2015 GAOLThe City of Copenhagen has a goalof reaching a level of 80% satisfactionwith urban life by 2015. Thisobjective was reached already by2010, in part thanks to initiatives thatmake it easier to organize events andactivities in the urban space and increaseaccessibility in the city.2010-statusIN 2010, 89% OF COPENHAGENERS WERE SATISFIED OR VERYSATISFIED WITH THEIR OPPORTUNITIES FOR TAKING PART IN<strong>URBAN</strong> <strong>LIFE</strong>. THE 2015 GOAL IS THAT 80% SHOULD BE SATISFIED.100%90%Goal for 2015 80%70%60%50%40%30%20%10%0%2010 2011The goal was set before the first measurement in 2010.Source: Voxmeter2010 statusEven though a very high share of Copenhageners – 89% – choose ”satisfied” or ”verysatisfied” in reply to the general question about their opportunities for taking part inurban life, the picture changes when residents are asked to assess individual aspectsof urban life. Here, satisfaction varies considerably, from a high level of satisfactionwith distance to stores to a somewhat lower level of satisfaction with the design oflocal recreational urban spaces.Satisfaction with the availability of activities for children in Copenhagen 51%Satisfaction with the availability of activities for young people in Copenhagen 56%Satisfaction with the availability of activities for elderly people in Copenhagen 45%Satisfaction with the ability to use local outdoor areas for exercise purposes 68%Satisfaction with the availability of outdoor seating in local cafés and restaurants 79%Satisfaction with the opportunities for playing in the local urban space 63%Satisfaction with the availability of peace and quiet in the local area 59%Satisfaction with the distance to green areas 77%Satisfaction with the distance to local recreational urban spaces 59%Satisfaction with distance to playgrounds 78%Satisfaction with distance to facilities for sports, play and physical activity 60%Satisfaction with distance to public transportation 86%Satisfaction with distance to stores 86%Satisfaction with the facilities in blue and green areas 64%Satisfaction with the facilities in local recreational urban spaces 40%Satisfaction with accessibility in Copenhagen 41%*Feel safe outdoors in the city after dark 57%Feel safe outdoors in the city during the daytime 71%(*The objective for satisfaction with accessibility is 50%)Replies of “do not know” or “not applicable” are not factored in.Source: Catinét and Megafon.NEIGHBOURHOODS WITH THE HIGHEST ANDLOWEST LEVELS OF SATISFACTIONHighest satisfaction:Lowest satisfaction:How satisfied are you with the distanceto blue and green areas? Brønshøj-Husum NørrebroHow satisfied are you with the facilities inblue and green areas? Østerbro NørrebroHow satisfied are you with the distance to Inner citylocal recreational urban spaces? and Christianshavn BispebjergHow satisfied are you with the facilities in Inner citylocal recreational urban spaces? og Christianshavn BispebjergHow satisfied are you with the availability Vanløse andof peace and quiet in your local area? Brønshøj-Husum NørrebroHow satisfied are you with the walkingInner citydistance to public transportation? and Christianshavn Amager westThe list has a certain statistical uncertainty. Source: Catinét.6 7
1.2 <strong>URBAN</strong> <strong>LIFE</strong> MEANSOUTDOOR CAFÉSAND RESTAURANTSA CAFE LATTE, PLEASE!Copenhageners have come to enjoy having their coffee al fresco. As soon as thesun peeks out, the city squares are packed with café goers. Warm blankets and gasheaters extend the outdoor season from early spring until well into autumn, in someplaces even all year round.In 2010, the City of Copenhagen issued 450 permits for outdoor seating, which is anestimated 11,500 seats. The number of seats is an estimate because restaurants donot declare how many chairs or benches they put up. The calculation is based on thesize of the areas in question. This area is divided by 0.75 based on the estimatedsize of an outdoor seat of approximately 0.75 square metres.Most of the outdoor seating is found in the inner city, including Christianshavn,which has an estimated 7,053 seats, 61% of the total number in Copenhagen.NYHAVN: TWICE AS MUCH OUTDOOR SEATING AS NO. 2It is hardly a surprise to Copenhageners or visitors to the city that Nyhavn is the areawith the largest amount of outdoor seating. With a total of 26 permits and an estimated1,324 seats, Nyhavn has more than twice as much as Gråbrødre Torv, whichcomes second.Sankt Hans Torv in Nørrebro and Havneparken in Islands Brygge are the only twoareas in the Top 10 list that are not in the inner city.All restaurants in Copenhagen are required to have a permit for outdoor seating,but it is only in the inner city that the permit costs money. Hence, many restaurantowners outside the inner city may not be aware that they need a permit. Thereforewe only have accurate numbers for outdoor seating in the inner city.OUTDOOR SEATING ALL YEAR ROUNDOnly 1% of Copenhageners state that they never sit outdoors in a café or a restaurant.Outdoor service is used by virtually all Copenhageners, and even in winter, asmany as 14% have their coffee or pizza outside at least a couple of times a month.Generally, 92% of the Copenhageners are satisfied with the availability of outdoorseating in cafés and restaurants in the city, although not everybody is equally satisfiedwith the availability in their own local area. Here, 78% are satisfied with availability,while 10% are downright unsatisfied, and 12% say neither/nor.COPENHAGENERS’ USE OF OUTDOOR SEATINGIN CAFÉS AND RESTAURANTSnumber of permits number of seats (estimated)Inner city + Christianshavn 266 7,053Vesterbro, incl. Kgs. Enghave 68 1,596Amager west 33 560Nørrebro 29 764Østerbro incl. Fælledparken 22 764Amager east 13 473Valby 10 280Vanløse 4 52Brønshøj/Husum 3 31Bispebjerg 2 4Number of seats is estimated. Source: Copenhagen Traffic Department, City of CopenhagenTOP 10 <strong>URBAN</strong> SPACES INTERMS OF OUTDOOR SEATING1. Nyhavn 1,3242. Gråbrødre Torv 6573. Gammeltorv/Nytorv 4684. Kultorvet 3685. Town Hall Square 3596. Sankt Hans Torv 2457. Amagertorv 2248. Kongens Nytorv 1729. Axeltorv 15110. Havneparken, Islands Brygge 128Source: Copenhagen Traffic Department, City of Copenhagena few times a month or more rarer neverSpring 62% 35% 3%Summer 81% 18% 1%Autumn 42% 46% 11%Winter 14% 41% 44%In some cases, the figures do not add up to exactly 100% because they are based on a combination of categories, which may havebeen rounded up or down. Source: Catinét.8 9
1.3 Urban life meanspeace and quietPEDAL-POWERED COFFEE SHOPA new type of service on wheels has hit the Copenhagen streetsin recent years. Pedal-powered coffee shops and motorized juicebars offer Copenhageners access to drinks and snacks in thestreets, parks and city squares. Previously, stationary vendingstands, such as the hotdog stands, were the main type of streetkitchen in Copenhagen, and the hotdog stands are still populartoday. But mobile street vending is growing rapidly, and in just afew years it has given the Copenhageners a much wider choice ofquick access to refreshments.For Copenhagen residents and visitors the mobile street vendorsadd variation to urban life with a new type of recreational spacethat comes and goes. The mobile carts can adapt to the flow ofpeople in the city, go to places with a peak in demand and seekout events in the urban space.2010 was the first year that the City of Copenhagen issuedpermits to mobile street vendors. A total of 128 permits wereissued, 61 of them for the inner city. The inner city is the only areawhere the permit costs money. In the inner city, 49 permits wereissued for both summer and autumn/winter, while 12 were issuedfor autumn/winter only.NUMBER OF PERMITS ISSUED TOMOBILE STREET VENDORS IN 2010inner city 61The rest of Copenhagen 67Source: Traffic Department, City of Copenhagen<strong>URBAN</strong> <strong>LIFE</strong> IS ABOUT FEELING SAFECopenhagen’s safety index for 2009 has twomain figures for people’s sense of safety: onefor the daytime and one for the night-time:91.6% feel safe during the daytime62.5% feel safe at night-time.There are considerable gender differencesbehind these two figures. In a poll from 2010,11% more women than men agree or stronglyagree that they do not like being outside afterdark (Copenhageners in general: 20%). 18%more women than men agree or strongly agreethat they worry about becoming a victim ofcrime when they travel in their local area afterdark (Copenhageners in general: 22%).Kilde: Catinét + Københavns Kommunes TryghedsindeksAhhh...An attractive urban life includes the ability to find oases of peace and quiet.Peaceful, beautiful places that make Copenhageners bring a book or a laptopoutdoors or take a walk to clear their mind. When asked why they visit squares andshopping streets, 27% replied that they seek peace and quiet.Generally, Copenhageners find the city fairly noisy. 54% say that they find the citynoisy, and a slightly smaller group, 39%, says that they find their local area noisy.The latter figure matches the fact that 58% say that they are satisfied with theirability to find peace and quiet in their local area. 14% are somewhat unsatisfied,while 9% are very unsatisfied with their ability to find peace and quiet in their localarea.There are considerable age differences in perceptions of noise in the local area.The ones who feel most bothered are the 30-49-year-olds; in this group 46% saythat they perceive their local area as noisy. This age group has the largest share ofparents with infants, which is probably a factorI am satisfied with the availability of peace and quiet in my local area 58%To some degree or a high degree I feel that the cemeteries in my neighbourhoodare places where I can relax and find peace and quiet 94%I find the city noisy 54%I find my local area noisy 39%To some degree or a high degree I am bothered by the city’s business and culturalactivities (for example businesses, cafés, cultural events) 20%Source: Megafon. Catinét1011
1.4<strong>URBAN</strong> <strong>LIFE</strong>MEANS EVENTSEVENTS FOR ALLOver the past 100 years, urban life has gone from a situation where the public spacewas mainly characterized by necessary activities, especially related to work andtrade, to today’s situation where most of the activities are voluntary. The differenceis that the voluntary activities mostly take place when the urban spaces are pleasantplaces to be, and when there are attractive events to seek out.92% of Copenhageners say that they participate in or watch events in the urbanspace at least twice a year. Of this group, 18% say that they take part in events atleast once a month. Events in the city include sports events, culture festivals, concerts,exhibitions, stage performances, circus shows, flea markets and many othertypes.Every month of the year offers a wide range of outdoor events in Copenhagen, andevery year sees the addition of new festivals and sports and cultural events, whichgives Copenhageners of all ages additional opportunities for watching and participating.Development of city life from 1880 to 2005AcTIVEPASSIVE1880 1900 1910 1920 1930 1940 1950 1960 1970 1980 1990 2000WILL HAPPEN REGARDLESSOF QUALITYWILL HAPPEN ONLY WHEN GOODQUALITY CITY SPACE EXISTSOPTIONAL ACTIVITIESNECESSARY ACTIVITIESHALF OF ALL EVENTS TAKE PLACE IN THE INNER CITYThe vast majority of events take place in the inner city, including Christianshavn.In 2010 the City of Copenhagen issued permits to a total of 1,009 eventsin the inner city, which is about half of all event permits in Copenhagen. Thetotal number of permits for events in Copenhagen in 2010 was 1,916 or anaverage of about five a day.41 permits were issued to events that include more than one district. On thelist below, these 41 events are counted once for all the districts that theyincluded.NUMBER OF EVENTSIN COPENHAGEN BYDISTRICT:inner city + Christianshavn 1046Østerbro, incl. Fælledparken 204Nørrebro 193Vesterbro, incl. Kgs. Enghave 160Amager west 80Valby 80Brønshøj/Husum 68Vanløse 51Amager east 51Bispebjerg 13Source: Traffic Department, City of Copenhagen300275250225200175150125100755025SEEN ACROSS THE YEAR, THERE ARE MORE ONE-DAY EVENTS IN THEEARLY SUMMER MONTHS AND IN THE AUTUMN MONTHS.JanuaryFebruaryMarchSource: Traffic Department, City of CopenhagenAprilMayJuneJulyAugustSeptemberOctoberNovemberDecember12 13
2MORE PEOPLE TO WALKCONCERTS, EXHIBITIONS AND MARKETS ARE THE MOSTPOPULAR EVENTSConcerts are the type of event that Copenhageners frequent most. As many as 64%have been to a concert within the past year; 43% even in their local area. This meansthat music events are both popular and geographically widely distributed in the city.Three types of events have a majority of local visitors: midsummer’s celebrations,neighbourhood parties and street parties.NUMBER OF COPENHAGENERS WHO HAVE GONE TO EVENTSIN THE CITY IN THE PAST YEAR% throughout the city % in the districtsconcerts 64 43exhibitions (photography, art) 58 37markets 56 48theatre 43 21culture days 42 36festivals 28 20midsummer’s celebrations 24 25jogging 18 14neighbourhood parties 18 19ice-skating rinks 17 12Christmas parties 13 7carnival 11 8street parties 11 12dancing 9 5circus 7 5none of the above 6 15WOMEN PREFER MARKETS AND DANCINGMore women than men go to events in the city. Events such as ice-skating rinks,festivals and circus shows have approximately equal shares of male and femalepatrons, but Copenhagen women frequent dance events more than twice as oftenas men, and 17% more women than men visit markets.MIDDLE-AGED PEOPLE GO TO THE THEATRE, OLDER PEOPLE GO TONEIGHBOURHOOD PARTIESEvent preferences vary with age. 50-65-year-old Copenhageners go to the theatreand exhibitions more than any other age group. The 66+ group is the most likely togo to neighbourhood parties, and 30-49-year-olds go ice-skating and jogging morethan other age groups. Young people are not the largest group in any event category.They are very likely to go to concerts (41%), but no more likely than any other agegroup.TOP 5 EVENTS1.2.3.4.5.Source: Catinét15-29-olds 30-49-olds 50-65-olds 66+concerts markets markets marketsmarkets concerts exhibitions concertsmidsummer’s celeb. culture days concerts exhibitionsfestivals exhibitions culture days culture daysculture days midsummer’s celeb. theatre / midsummer’s celeb.neighbourhood partiesSource: Catinét14 15
2.1COPENHAGENERSON FOOTCOPENHAGEN’S 2015 GOALBY 2015 FOOT TRAFFIC HAS INCREASED BY 20%COMPARED WITH TODAY.A GOOD CITY IS A CITY WHERE MANY PEOPLE WALKPedestrians contribute to a vibrant city. The more people walk, the more life thereis in between the buildings, and that makes a city appealing. Green, beautiful andlively – but not noisy – streets and urban spaces encourage us to get around on foot.A city with many pedestrians is also a safe city. Schoolchildren walking on foot arean indication that the city feels safe.Walking is simple, healthy and free. When we move through the city on foot, weare in touch with the physical environment through our body, and that providesfamiliarity, attachment and a sense of shared ownership. We can use our senses toexplore our surroundings, meet other people and make eye contact. We can noticeand explore new aspects of the city, and we can stop and pause when we encounterinteresting people, places or events.Copenhagen is involved in the international study WALK 21, which compares thewalking habits in four cities. The other three cities are London, Barcelona andCanberra. The first results from the study are expected in 2011. You can read moreabout it at www.walk21.com.2015 GOALThe goal for 2015 is to makeCopenhageners walk 20% morethan they did in 2010. Thepedestrian strategy outlinesways of reaching that goal, whichincludes developing a pedestrianculture, creating pedestrian routesand meeting places, improving theshopping streets and upgrading thetraffic hubs.2010 statusIN 2010 THE AVERAGE COPENHAGENER WALKED FOR9.86 MINUTES A DAY, NOT INCLUDING TRIPS THAT ALSOINCLUDE OTHER FORMS OF TRANSPORTATION.THE OBJECTIVE FOR 2015 IS FOR COPENHAGENERS TOWALK FOR AN AVERAGE OF 12 MINUTES A DAY.Goal for 2015Source: DTU - Technological University of Denmark16 1712 min10 min8 min6 min4 min2 min0 min2010 2011
2010-status2.2WHERE, WHEN ANDWHY WE WALKCOPENHAGENERS WALK MORE THAN THE AVERAGE DANECopenhageners walk for 9.86 minutes a day, covering a distance of 0.93 km. That istwo and a half minute and 240 metres more than the average Dane, who only walksfor 7.37 minutes a day, the equivalent of 0.63 km. The figures represent trips that aremade exclusively on foot.EVERY FOURTH TRIP IS MADE ON FOOTOn average, Copenhageners make 25% of all trips on foot, whether they are going towork or school, running an errand or attending a leisure activity. The preferred modeof transportation for Copenhageners is the bicycle, which is used for 30% of all trips,while 27% of the trips are made by car.WHERE WE WALKIn June 2010 the City of Copenhagen did foot traffic counts for a whole day in 80streets in the city. The count showed that inner city pedestrian streets have thelargest volume of foot traffic. Of the Top 10 foot traffic streets, only two are notlocated in the inner city.min/dayCopenhageners walk for 9,86 min/day 0,93 km/dayThe average Dane walks for 7,37 min/day 0,63 km/daySource: study of transportation habits carried out by the Technological University of DenmarkCopenhageners make 15% of their trips to work and school on foot.km/dayIf we include walking to get to a bicycle, a car or a bus, 40% walk between 30and 60 minutes every day.50403020100Less than 30 minutes 30-60 minutes More than 60 minutesSource: CatinétSource: CatinétCopenhageners make 30% of their trips to sports/entertainment/events on foot.Weekends/holidaysweekdaysCopenhageners make 57% of their trips to parks, nature areas, harbour baths or the beach on foot.Copenhagen: distribution of trips.other: 3%walking: 18%car: 56%public transportation: 6%bicycle: 17%Denmark overall: distribution of trips.other: 2 %public transportation: 15 %walking: 25 %bicycle: 30 %car: 27 %Source: study of transportation habits carried out by the Technological University of Denmark13. Jernbane Allé 771TOP 10 FOOT TRAFFIC STREETS IN COPENHAGEN BASED ONTHE 2010 TRAFFIC COUNT1. Vimmelskaftet (middle section of Strøget) 3,1282. Frederiksberggade (western section of Strøget) 3,0833. Frederiksborggade (east of Nørre Voldgade) 2,9744. Østergade (eastern section of Strøget) 1,9645. Vesterbrogade (by Tivoli) 1,5166. Frederiksborggade (west of Nørre Voldgade) 1,4907. Nørrebrogade (by Nørrebro Station) 1,3678. Fiolstræde 9139. Nyhavn 89810. Kay Fiskers Plads (by Field’s) 87312. Østerbrogade (by Trianglen) 818And further down the list...26. Flintholm Station 51428. Nordre Frihavnsgade 50130. Amagerbrogade (by Hollænderdybet) 47333. Istedgade (by Gasværksvej) 45537. Blågårdsgade 36944. Valby Langgade 16545. Emil Holms Kanal 12049. Sluseholmen 9718 19The figures are averaged numbers of pedestrians per hour on a June day in 2010 between 10 a.m. and 6 p.m. Source: Copenhagen Traffic Department, City of Copenhagen
THE INNER CITT HAS BECOME ONE BIG PEDESTRIAN ZONEHistorically, the inner city of Copenhagen has developed from an area where all typesof traffic could go everywhere to being increasingly off-limits to cars and motorcyclesand in some cases also bicycles. Since the first pedestrian street, Strøget, wasestablished in 1962, a growing number of streets and squares have been transformedto improve conditions for pedestrians in particular by providing a safe environment withlittle noise. Parking spaces in city squares have been replaced with benches and outdoorseating for cafés and restaurants. And asphalt has been replaced with granite and otherstone surfaces, signalling that pedestrians have the right of way.Over the years, the inner city has become increasingly pedestrian-friendly throughdecades of efforts to improve streets and squares. Now the focus has shifted to theVesterbro, Nørrebro and Østerbro and the outer districts. Integrated Urban Renewalprojects and awareness of the importance of shopping streets for urban life are keyaspects in the efforts to improve conditions for pedestrians.The Royal Danish Academy of Fine Arts, School of Architecture has documented thehistorical development of Copenhagen’s inner city, including the growing area reservedfor pedestrians over time and the number of pedestrians who use specific streets andsquares in the city.THE GRADUAL DEVELOPMENT IN THE SIZE OF PEDESTRIANAREAS IN COPENHAGEN’S INNER CITY FROM 1962 TO 2005First pedestrian street 1962, 15,800 m2.In 1973 the expansion of the pedestrian street system had82.820reached a point where it connected all the main destinations inthe city centre, 49,200 m2.66.15049.20099.77095.750WHEN WE WALKIf we look at the traffic pattern for the main shopping streets it is clear thatpedestrians are distributed more evenly over the course of the day than bicyclistsand motorists. An example from Amagerbrogade, where we counted pedestriansthroughout 2010 clearly reveals the differences.The differences in the time pattern for pedestrians and other groups reveal thatthere is no rush hour for foot traffic. While the number of cars and bicycles clearlypeaks around 9 a.m. and 5 p.m., the intensity of foot traffic increases graduallythroughout the morning and the afternoon. This pattern matches the findings in apoll which found that many Copenhageners walk simply to get some fresh air or dosome window-shopping, not just to get to and from work. In comparison with bicyclerides and car trips, walks are mainly recreational and unrushed.24-HOUR CYCLE FOR PEDESTRIANS, BICYCLISTS AND DRIVERS20%18%16%14%Pedestrians Bicyclists Drivers12%In 2005, the network of streets andsquares that were off-limits to cars22.86015.80010%8%6%reached 99,770 m2.4%1962 1968 1973 198819921996 20052%0%123456789101113141516171819202112222324The bar chart illustrates the development of pedestrian areas in m2 in Copenhagen’s inner city from 1962 until 2005.Illustration: Gehl ArchitectsSource: Traffic Department, City of Copenhagen20 21
WHY WE WALKMost trips involve some amount of walking. If the persondoes not walk all the way, he or she typically walks to andfrom the car, the bicycle or the bus stop.COPENHAGENERS’ TOP 5 REASONS FORWALKING RATHER THAN USING OTHERFORMS OF TRANSPORTATIONCOPENHAGENERS’ TOP 5 ENVIRONMENTAL REASONSFOR NOT WALKINGOnly 15% of Copenhageners walk all the way to and fromwork, but feet are the preferred mode of transportationfor going to the park, walking the dog, exercising, going tothe market or grocery shopping. If we go to a restaurantor a café, we are just as likely to take the bicycle. And wewalk with our children. Copenhageners are almost fourtimes more likely to walk to the playground than to takethe bicycle, while trips to school are mostly made onbicycle, with walking as a close second.1. Because I enjoy being outdoors (70%)2. Because I like to look around and enjoy the environment(nature, buildings, particular areas, etc.) (69%)3. Because exercise is good for me (68%)4. Because I find it relaxing (for example a break from stressat work, stress at home, psychological problems, etc.) (56%)5. Because it is more convenient (44%)1. Too much traffic (17%)2. The area is filthy/not inviting for walks (14%)3. Too much air pollution (12%)4. The pavements are too uneven (12%)5. The area is poorly lit (11%)Thus, there is a clear pattern where walking is closelyassociated with leisure activities, exercise, recreation andeveryday errands. The main reason why Copenhagenersprefer walking is that we like being outdoors. We walk toget some fresh air.When we ask Copenhageners why they sometimeschoose to bike or drive instead of walking, some ofthe most common answers are that it is hard to carrygroceries, or that walking takes too long. When askedwhat might encourage them to walk more, most peoplesay that a clean, green urban environment is the mainmotivator; this underscores the impression that walks aremainly a recreational activity.COPENHAGENERS’ TOP 5 PERSONAL REA-SONS FOR NOT WALKING1. I prefer biking (33%)2. I find it difficult to carry groceries etc. (29%)3. It takes too long (18%)4. I am usually in too much of hurry (16%)5. I am lazy (6%)The lists have a certain statistical uncertainty.Source: CatinétTOP 5 FACTORS THATWOULD MAKECOPENHAGENERS WALK MORE1. More green routes and foot paths (61%)2. Greener environment (60%)3. If the city were cleaner (49%)4. Improved air quality (48%)5. If the city were generally better suited forpedestrians (45%)The lists have a certain statistical uncertainty.Source: Catinét2223
2.3 MAIN SHOPPINGSTREETSLOCAL VARIATIONS IN REASONS FOR NOT WALKINGFigures from the various neighbourhoods in Copenhagen suggest that there isconsiderable variation between the neighbourhoods in reasons for not walking.Narrow pavements are a problem in Nørrebro in particular, while the residents oneastern Amager are more likely than other Copenhageners to avoid walking becauseof poor lighting.SATISFACTION WITH PAVEMENTS AND SNOW CLEARINGThere are local variations in the residents’ satisfaction with the state of thepavements in various neighbourhoods. Eastern Amager has the highest shareof residents who are satisfied with the maintenance of the pavements. In a poll,78% of the residents on eastern Amager said that they were somewhat or verysatisfied. At 61%, Vanløse has the lowest share of residents who are satisfied withpavement maintenance.MAIN SHOPPING STREETSThe most intense foot traffic is found in Copenhagen’s inner city pedestrian streets.But all districts have busy streets, and the main shopping streets in particularattract many pedestrians. There are eleven main shopping streets in Copenhagen,located in Vesterbro, Nørrebro and Østerbro and the outer districts. Bispebjerg is theonly district in Copenhagen that does not have a major shopping street.“THE PAVEMENTSARE TOO UNEVEN!”- Brønshøj-Husum“TOO MUCHNOISE!”- VanløseNørrebro has the largest share of people who are satisfied with snow clearing andsalting of local pedestrian streets and squares. Here, 76% say that they aresomewhat or very satisfied. The lowest rating is found in Bispebjerg, where only 64%are satisfied with snow clearing and salting of pedestrian streets and squares.The shopping streets have a concentration of shops, cafés, restaurants and otherattractions. Most of them have a high volume of all sorts of traffic. The shoppingstreets are some of the most important everyday urban spaces, which many Copenhagenersvisit often.”Der er formeget trafik!”- Indre byNEIGHBOURHOODS WITH THE HIGHEST AND LOWESTSATISFACTION RATINGSCopenhagen has an ambition of upgrading the main shopping streets, includingimproving conditions for pedestrians. Wider pavements with quality paving are oneelement. Copenhagen’s Municipal Plan has identified eleven streets as main shoppingstreets. These streets are found both in the inner and outer districts.“THE AREA ISPOORLY LIT!”“TOO MUCH AIRPOLLUTION!”- ØsterbroHighest satisfaction: Lowest satisfaction:How satisfied are you with pavementmaintenance? Amager Øst VanløseHow satisfied are you with snow clearingand salting of pedestrian streets and squares? Nørrebro Bispebjerg- eastern AmagerSource: MegafonSource: Catinét“THE PAVEMENTSARE TOO NARROW!”- Nørrebro24 25
STRØGGADERWE WALK MORE IN THE MAIN SHOPPING STREETS IN AUTUMNWE WALK MORE IN THE MAIN SHOPPING STREETS ON FRIDAYSNUMBER OF PEDESTRIANS IN THEMAIN SHOPPING STREETS PER HOURTorvegade (Christianshavn) 907Nørrebrogade 794Jernbane Allé 771Østerbrogade 602FrederikssundsvejNørrebrogadeØsterbrogadeNdr Frihavnsg.One might think that Copenhageners would pour out into the shopping streets to go shoppingwhen the sun comes out in spring and summer. But in fact, May and June are the two monthsof the year that have the lowest number of pedestrians, according to a whole-year count inAmagerbrogade. Instead, the number of pedestrians in the shopping streets peaks in October,November and December.Copenhageners tend to walk more in the main shopping streets on Mondays,Thursdays and Fridays. Throughout 2010, traffic counts were carried out in severallocations in Amagerbrogade, and the graph below represents an average over theyear. Whether the pattern from the shopping street matches pedestrian habitsin other types of streets, such as local streets, we do not know. The distributionacross the week may be related to shopping and errands and, for example, thelonger business hours in banks and stores on Thursdays and Fridays.Jernbane AlléNordre Frihavnsgade 501Istedgade 493Amagerbrogade 428Frederikssundsvej 331Borgbjergsvej 303Holmbladsgade 289Valby Langgade 165Based on a foot traffic count in all Copenhagen’s main shopping streets in June 2010. The figurerefers to number of pedestrians per hour. In some of the streets, counts were carried out inValby L angg.MozartsvejBorgbjergsvejIstedgadeTorveg.HolmbladsgadeAmagerbrogadeVARIATION OVER THE YEAR IN FOOT TRAFFIC IN AMAGERBROGADE IN 2010250.000200.000175.000150.000125.000100.00075.00050.000VARIATION OVER THE WEEK IN FOOT TRAFFIC INAMAGERBROGADE IN 201018%16%14%12%10%8%6%several locations; in these cases the figures represent an average. For example, there are 1,36725.0004%pedestrians an hour in Nørrebrogade by Nørrebro Station but only 442 in the same street by02%Assistens Cemetery. In Nørrebrogade, traffic counts were carried out in four locations, and theaverage is 794 pedestrians an hour.Source: Traffic Department, City of CopenhagenJanuaryFebruaryMarchAprilSource: Traffic Department, City of CopenhagenMayJuneJulyAugustSeptemberOctoberNovemberDecember0%MondayTuesdayWednesdayThursdayFridaySaturdaySundayMain shopping streets. The municipal plan 2009Source: Traffic Department, City of Copenhagen2627
2.4SAFETY FOR ALLPEDESTRIANSPEDESTRIAN SAFETYPARENTS PREFER TO WALK THEIR CHILDREN TO SCHOOLPedestrians in Copenhagen generally feel safe in their local areas and in the city asa whole. But there are major variations in perceived safety in the daytime versusnight-time and in men’s and women’s respective sense of safety.One safety aspect is traffic-related, another with people’s general sense of safetywhen walking in the city.PERCEIVED SAFETYIn a poll, 78% of Copenhageners responded that they were satisfied with conditionsfor pedestrians in their local area, while 9% said that they were unsatisfied, and 14%said neither/nor.Most schoolchildren in Copenhagen are walked to and from school by their parents.Copenhagen parents feel that walking with their child is the safest way to get toand from school, and as long as the school is less than 500 metres away from home,accompanied walking is the most common form of travel.When the children live one to two km away from their school, the bicycle is the mostcommon form of transportation for parents and children living in Copenhagen. If theschool is more than two km away, the children are usually driven to school. The caris perceived as the second-safest form of transportation after walking the child toschool.COPENHAGEN PARENTS’ PERCEPTIONS OF THE SAFETY OFVARIOUS WAYS OF GETTING TO SCHOOLGENDER DIFFERENCESIN PERCEIVED SAFETY:I DON’T LIKE WALKINGOUTSIDE AFTER DARK:I WORRY ABOUT BECOMINGA VICTIM OF CRIME AFTERDARK:31113115Women Men Women Men45% said that there is too much traffic in their local area, 23% do not feel safe crossingthe street in their local area, and 9% are worried about becoming a victim ofcrime during the daytime.Generally, however, Copenhageners feel fairly safe in the city. 74% generally feel safeoutdoors after dark, while 80% feel safe crossing the street in the dark.Feel safe crossing the street in the daytime 76.5%Feel safe crossing the street at night-time 80%Feel safe in the city after dark 74%Feel safe in the city during the daytime 89.8%Lighting makes it feel safer to travel outdoors 90%Walking (parents and children walking together) 4,55Car 4,27Bicycle (child’s seat on the bicycle, carrier cycle, trailer) ) 4,12Bus 3,92Bicycle (riding together on separate bicycles) 3,91Train/metro 3,82Walking (children walking on their own) 3,44Bicycle (children riding on their own) 2,70The respondents rated safety on a scale from 0 to 5, with 5 as absolute safety. Source: Optimizers.Source: CatinétSource: Catinét, Megafon28 29
STREETS WITH MOREMALE THAN FEMALEPEDESTRIANS:ISTEDGADE: 16% MORE MALETHAN FEMALE PEDESTRIANS(DAYTIME)NYHAVN: 21% MORE MALETHAN FEMALE PEDESTRIANS(NIGHT-TIME)3 MORE PEOPLE TO STAY LONGERWomenmenSource: CatinétWOMEN’S STREETS AND MEN’S STREETSMore women than men walk in Copenhagen. In the manualpedestrian count in all Copenhagen neighbourhoods in 2010,49% pedestrians were women, 42% were men, and the restwere children. But men and women do not walk in the sameareas. In some streets, one gender is so over-representedthat they can almost be classified as women’s streets andmen’s streets.The largest share of men was found in Istedgade during thedaytime from 7 a.m. to 7 p.m. The count found 16% moremale than female pedestrians. During that same time, atraffic count found 15% more male than female pedestriansin Kalvebod Brygge, and 8% more male than femalepedestrians in Nørrebrogade by Assistens Cemetery.74On the other hand, there were 22% more female pedestriansthan male in Frederiksborggade, east of Nørre Voldgade, and22% more in Jernbane Allé by Vanløse Station. Vesterbrogadeby Westend also had a considerable over-representation ofwomen with 19% more women than men, while there were17% more women at Trianglen in Østerbro and 17% more inFrederikssundsvej by Husum Torv.In the night-time there are generally more male than femalepedestrians in Copenhagen. The largest gender differencesin the time span from 8 p.m. to midnight is found in Nyhavn,where there are 21% more male than female pedestrians, inStrøget, which has 17% more men, and in Vesterbrogade byScala, which has 17% more male than female pedestrians.STREETS WITH MORE FEMALE THAN MALE PEDESTRIANS:FREDERIKSBORGGADE: 22% VESTERBROGADE: 19% MOREMORE FEMALE THAN MALE FEMALE THAN MALEPEDESTRIANS (DAYTIME) PEDESTRIANS (DAYTIME)womenmenSource: Catinét3031
3.1HOW COPENHAGENERSUSE THE <strong>URBAN</strong> SPACECOPENHAGEN’S 2015 GOALBY 2015 COPENHAGENERS SHOULD SPEND20% MORE TIME IN THE <strong>URBAN</strong> SPACE THANTHEY DO TODAY.A GOOD CITY IS A CITY WHERE MANY PEOPLE ENJOY SPENDING TIMEOUTDOORSTo many Copenhageners the city’s parks, squares and shopping streets are a natural extensionof the home. Many eat outdoors and meet family and friends in the park or in a cafe,and the children play in the playground.The urban space is also used for exercise. In particular, runners use the streets, parks andpaths around the lakes. And in recent years, street sport has become popular: skaters andparkour enthusiasts do not stick to dedicated courts but seek out the city squares and findnew uses for the hard surfaces of the city.Some urban spaces offer fixed installations for recreational use. For example,benches invite anyone to sit down and take a break. Other elements in the urban space arevariable, as when festivals temporarily transform an urban space to a zone with a uniqueidentity. Others in turn are temporary elements that may turn the urban space into a stage,for example while a street artist performs, or into a coffee shop when a mobile coffee shoppulls up.When many people enjoy spending time outside it is an indication that the city feels safe,and that many people are attracted to the possibilities and experiences offered by theoutdoor space.2015 GOALCopenhagen has a goal ofencouraging more people tospend more time in the urbanspace. The specific goal for 2015is that people should spend 20%more time in the outdoor spacethan they did in 2010.Various strategies have beendeveloped for achieving this goal,including urban gardens, renovationof the city’s playgrounds andIntegrated Urban Renewal projectsthat create new recreationalpossibilities in run-down urban areas.2010 statusIN 2010 AN AVERAGE COPENHAGENER SPENT 1 HOURAND 28 MINUTES A WEEK IN THE CITY’S SQUARES ANDSHOPPING STREETS.BY 2015, THIS SHOULD HAVE INCREASED TO 1 HOUR AND45 MINUTTES A WEEK.2 hoursGoal for 2015 1 hour + 45 min1 hour + 30 min1 hour + 15 min1 hour45 min30 min15min0 minThe figure for 2010 is based on data from pollsconcerning both frequency and duration.Source: Catinét2010 201132 33
2010-status2010 StatusA poll in 2010 examined how often and how long Copenhageners spend time citysquares and shopping streets, and how often they visited parks, nature areas,harbour baths and beaches. The answers showed a seasonal variation.Spending time is defined as a “staying for a while”. If the 2015 goal is to be achieved,Copenhageners need to spend time outdoors more often or longer than they do now,both in summer and winter.HOW OFTEN COPENHAGENERS VISIT CITY SQUARES ANDSHOPPING STREETS42% visit at least twice a week in spring59% visit at least twice a week in summer31% visit at least twice a week in autumn31% visit at least twice a week in autumnSource: CatinétHOW LONG WE SPEND ON AVERAGE IN CITY SQUARES ANDSHOPPING STREETSspringsummerautumnwinterless than 30 minutes 30-60 minutes more than 60 minutesSource: Catinét28%13%39%HOW OFTEN COPENHAGENERS VISIT PARKS, NATURE AREAS,HARBOUR BATHS AND BEACHES46% visit at least twice a week in spring64% visit at least twice a week in summer41% visit at least twice a week in autumn25% visit at least twice a week in winterSource: Catinét26%72%43%44%60%30%16%22% 6%THE MOST POPULAR PLACESIn June 2010 a traffic count of city squares, parks and shopping streets inCopenhagen surveyed 72 different outdoor recreational locations in the city. Thecounts were carried out on weekdays in June between 10 a.m. and 6 p.m. undervarying weather conditions. Changes in weather affect the number of people whospend time outdoors; the count does not correct for this factor. The number ofpeople does not give any direct indication of the quality of the location. Lessfrequented sites might offer other valuable experiences.TOP 10 <strong>URBAN</strong> SPACES IN TERMS OF NUMBER OF VISITS1. Nyhavn 6362. Havneparken 4073. Amager Torv – Strøget 2084. Nørre Voldgade – Nørreport Station 1515. Kultorvet 1466. Strædet – Kompagnistræde 1447. Vimmelskaftet – middle section of Strøget 1288. Valbyparken – nature playground 1259. Istedgade 11610. Østerbrogade (not including Nu Hansens Plads) 116And further down on the list...12. Gunnar Nu Hansens Plads 8924. Enghave Plads 4429. Sankt Hans Torv 4232. Sundbyvester Plads 2836. Bopa Plads 2547. Sundbyøster Plads 1553. Husum Torv 1154. Vanløse Torv 1155. Utterslev Torv 10The figures are based on an hourlyaverage of the number of peoplespending time outdoors. Source: Traffic72. Silkeborg Plads 0Department, City of Copenhagen34 35
3.2SPENDING TIME IN CITYSQUARES AND SHOPPINGSTREETSHOW TO MAKE US SPEND MORE TIME OUTDOORSWhat will it take to encourage Copenhageners to spend more time outdoors? Inpolls, 54% said that they would spend more time outside if there were more trees,bushes and flowers. 46% think that they would spend more time outside if the citywere cleaner. But behind these averages lie some important differences in whatwould make different categories of residents spend more time in the urban spacethan they do today.Of the Copenhageners who only use the city to go shopping, 45% think that morebenches would make them spend more time in the urban space. This point of view isshared by 33% of Copenhageners in general.NUMBER OF PEOPLE WHO THINK THAT BENCHES WOULDMOTIVATE THEM TO SPEND MORE TIME IN THE <strong>URBAN</strong> SPACECopenhageners who only use the city to go shopping 45%All Copenhageners 33%Source: CatinétTOP 5 FACTORS THAT WOULD MAKE COPENHAGENERSSPEND MORE TIME IN THE <strong>URBAN</strong> SPACE1. The city should be greener (more trees, bushes and flowers)2. The city should be cleaner3. Less traffic4. More information about possible activities, beautiful sites in the city, cultural experiences etc.5. More benchesSource: CatinétThis Top 5 list does not mean that if the city were covered in trees and benches, allresidents would spend more time outdoors. Some groups prefer a different aestheticand have other expectations of the city. Thus, to be truly diverse, Copenhagen shouldnot only offer the types of urban spaces that appeal to the majority but also makeroom for the secret, the eccentric and the temporary to flourish.COPENHAGENERS SPEND TIME OUTDOORS ALL YEAR ROUNDIn the summer, Copenhagen squares and parks are filled with people eating icecream, chatting or people-watching. And Copenhageners also spend time outdoorsin the wintertime. 35% of Copenhageners say that they visit squares and shoppingstreets at least twice a month in the winter time. And 63% say that they visit parksand nature areas at least twice a month.I spend time outdoors (stay for a while) in citysquares and shopping streets at least twice amonth:spring 80%summer 90%autumn 66%winter 35%I spend time outdoors (stay for a while) in parks, natureareas, harbour baths and beaches at least twice amonth:spring 87%summer 93%autumn 80%winter 63%Source: CatinétOf the people who prefer to stay in their local area, 28% say that improved lightingand paving will motivate them to stay longer, compared with 21% of theCopenhageners in general.NUMBER OF PEOPLE WHO THINK THAT IMPROVED LIGHTINGAND PAVING WOULD MOTIVATE THEM TO STAY LONGERCopenhageners who prefer to stay in their local area 28%All Copenhageners 21%Source: CatinétCOPENHAGENERS’ GENERAL SATISFACTION WITH OUTDOORRECREATIONAL FACILITIES IN THE CITY89% are satisfied with the availability of peace and quiet and places to relax in local green areas.98% of Copenhageners feel that they have good opportunities for meeting in the green areas of the city.87.5% are satisfied with the opportunities for playing outdoors in their local area, for example in city squares and nature areas.96% find the more cultural gardens and historical facilities to be presentable and clean.However, 26% do not think that their local area offers good outdoor recreational facilities in the daytime, and 29% in the night-time.Source: Megafon, CatinétTOP 10 REASONS FOR COPENHAGENERS TO SPEND TIME INCITY SQUARES AND SHOPPING STREETS1. café visit 77%2. going for a walk 76%3. window-shopping 63%4. going for a bicycle ride 57%5. sitting on a bench 56%6. getting some fresh air 55%7. people-watching 53%8. enjoying nature/the view 52%9. meeting friends family 52%10. taking part in events, for example concerts 48% Source: Catinét36 37
GENDER AND AGE DIFFERENCESAGE DIFFERENCES IN WHAT COPENHAGENERSDO IN CITY SQUARES AND SHOPPING STREETSPEOPLE DENSITY IN CITY SQUARESThere are considerable gender and age differences in what Copenhageners do whenthey visit city squares and shopping streets.The main gender difference is that women do far more window-shopping than men,while men do far more people-watching.18-29100%95%90%85%A traffic count in 2010 found that Nyhavn was the urban space in Copenhagen thathad the largest number of people. However, measured per square metre, Nyhavn isnot the most crowded urban space. Measured in density, Amagertorv in Strøget isthe most intense urban space in Copenhagen on a summer’s day.Young Copenhageners are more likely than other age groups to say that they visitcafés, exercise, eat food that they brought along, take part in events or simply go toget some fresh air.30-4950-6580%75%70%65%SQUARE METRES PER PERSON IN CITY SQUARESIN SHOPPING STREETS AND CITY SQUARES, WOMEN GO WINDOW-SHOPPING, WHILE MEN ENJOY PEOPLE-WATCHINGSource: CatinétWINDOW-SHOPPING7252 48PEOPLE-WATCHINGwomen men women men5966+60%55%50%45%40%35%30%25%20%15%10%5%0%caférunning, ball playing, exercisingpeople-watchingspending time with family/friendsgetting some fresh airtaking part in events, for example concertseating takeaway or a packed meal/picnicplaying/my children playSource: CatinétAmagertorvKongens NytorvNyhavnEnghave PladsKultorvetGl Torv/NytorvAxeltorvGråbrødre TorvSankt Hans TorvRådhuspladsenper person per hour0,8 m21,3 m21,5 m21,6 m21,9 m22,4 m23,4 m24,3 m24,3 m25,2 m2Some of the urban spaces are difficult to measure precisely. Therefore, the figures should be read as estimates, not as preciseindications. Furthermore, the duration of visits may vary considerably depending on whether there are many outdoor food vendors,and whether they are restaurants or ice cream vendors. These differences are not factored in. Source: Traffic Department, City ofCopenhagen38 39
3.3SPENDING TIME IN PARKS, ONBEACHES AND IN NATURE AREASPARKSParks are the Copenhageners’ shared gardens and some of the most importantoutdoor recreational areas in the city. Especially in spring and summer, many like tobring a book, a newspaper or some music along, enjoy the green surroundings andmaybe take a nap. Others organise social events, share a meal, play ball and croquet,celebrate birthdays or even host wedding receptions in the park.80% of Copenhageners are satisfied or very satisfied with the designof and facilities in the green and blue areas in their local neighbourhood 80%PEOPLE DENSITY IN THE PARKSTo discover how much people use the parks we carried out traffic counts in 2010 infive Copenhagen parks. The parks differ in size and location and offer different typesof nature experiences.Of the five, Fælledparken clearly had the largest number of visitors with an hourlyaverage of more than 2,000 visitors, compared with only 200 visitors an hour inEnghaveparken in Vesterbro. But since the parks are very different in size, thesenumbers do not reflect how much room is available to the individual visitor.Therefore we also calculated the number of visitors compared to the size of the park.Source: CatinétTOP 10 REASONS WHY COPENHAGENERS VISITPARKS, BEACHES AND NATURE AREAS1. going for a walk 72%2. enjoying nature/views 67%3. fresh air 66%4. going for a bicycle ride 53%5. meeting friends/family 47%6. enjoying the peace and quiet 45%7. sitting on a bench 45%8. people-watching 43%9. café visit 35%10. taking part in events, for example concerts 33%Source: CatinétNumber of visitors an hour:Fælledparken 2110Amager Fælled 556Østre Anlæg 357Enghaveparken 194Kastrup Fort 38Number of square metres availableper hour per person:Enghaveparken184 m2Fælledparken279 m2Østre Anlæg379 m2Kastrup Fort2920 m2Amager Fælled4737 m2The numbers include both pedestrians and bicyclists who enter the parks. The count was based on the number of people enteringthrough the park entrances. Therefore they do not give a precise indication of time spent in the parks but should be seen as estimates.Sources: Parks and Nature Department, City of Copenhagen; Department of Traffic, City of Copenhagen.40 41
3.4PHYSICAL ACTIVITY,PLAY ANDPLAYGROUNDSWHAT WE DO WHEN WE ARE OUTSIDECopenhageners do many different things when they visit parks, beaches and natureareas. The most common answer to the question about the purpose of the visit was‘taking a walk’. However, there are considerable gender and age differences inCopenhageners’ purpose with visiting parks and nature areas.18% more women than men say that they go to meet with friends or family, and14% more women than men say that they eat food that they brought along. 36%more of young people between 15 and 29 years of age eat a packed meal ortakeaway in nature areas compared with people over 66 years of age. In the 66+group, on the other hand, people are 19% more likely to engage in people-watchingin nature areas, compared with the 15-29-year-olds.Similarly, there are considerable age and gender differences in what Copenhagenersdo in city squares and shopping streets.WOMEN ARE MUCH MORE LIKELY THAN MEN TO USE THE GREENAREAS FOR SOCIAL PURPOSES.MEETING WITH FAMILY/FRIENDSTAKING PART IN EVENTS55% 37%39% 29%women men women men18-2930-4950-6566+75%70%65%60%55%50%45%40%35%30%25%20%15%10%5%0%running, ball playing, exercisingAGE DIFFERENCES IN WHATCOPENHAGENERS DO IN PARKS, ONBEACHES AND IN NATURE AREASpeople-watchingspending time with family/friendswindow-shopping/flea marketgoing for a bicycle rideeating a packed meal/takeawaySEASONAL DIFFERENCES IN THEUSE OF THE CITY’S OUTDOORSPORTS FACILITIESspring 23%summer 29%autumn 22%EXERCISING IN THE CITYCopenhageners have long used the city’s streets and parks for jogging, and a growingnumber of people use the urban space for exercising. Recent years have seen anincreased emphasis on the positive effects of engaging in outdoor physical activityfor the health of the individual as well as urban life. Play and exercise areincorporated in the design of the urban spaces, outdoor fitness centres pop up nextto basket ball courts, and urban spaces are redesigned to accommodate the growingpopularity of street sports.LOCAL VARIATION IN THE DEGREE OF SATISFACTIONGenerally, the residents of Copenhagen are quite satisfied with the opportunitiesfor ball playing, exercise and physical activity in their local area. As many as 84% ofthe Copenhageners say that they are somewhat or very satisfied. If we break the pollnumbers down to see the degree of satisfaction in the individual districts, there aredifferences. The highest degree of satisfaction is found in Vanløse, Brønshøj-Husumand Østerbro; the lowest degree of satisfaction is found in the inner city.DEGREE OF SATISFACTION IN LOCAL DISTRICTS WITH THE OPPOR-TUNITIES FOR BALL PLAYING, EXERCISE AND PHYSICAL ACTIVITYVanløse 89%Brønshøj-Husum 89%Østerbro 89%Valby 88%Bispebjerg 84%Vesterbro/Kgs. Enghave 82%Amager Øst 81%winter 14%Nørrebro 78%Source: CatinétKilde: CatinétPercentage of people using the city’s outdoor sports facilitiesAmager Vest 77%at least twice a moths. Source: CatinétIndre by 76%42 43Source: Megafon
PLAYGROUNDS– COPENHAGEN’S OVERLOOKED RECREATIONAL AREASWhile many Copenhageners never or rarely visit one of the city’s many playgrounds,the playgrounds are a natural and essential part of everyday life for many families.And the playgrounds have many visitors. The Top 10 list (page 5) of Copenhagensites with the most visitors includes a single playground, in 8th place: the natureplayground in Valbyparken.DEGREE OF SATISFACTION WITH PLAYGROUNDSIn a poll, Copenhageners with children or grandchildren were asked how satisfiedthey were with the distance from their home to the playground and with the state ofthe playgrounds.90.6% are satisfied with the distance from their home to a playground83% are satisfied with the opportunities for play in the city’s public playgrounds71.6% agree that the design of the playground is inventive58.4% agree that the playground equipment is new56.6 agree that the design is unusual and exciting87.8 agree that they feel safe in the playground82% agree that the playground equipment is generally kept cleanNUMBER OF CHILDREN PER PLAYGROUNDThere are 125 public playgrounds in Copenhagen, evenly distributed across thedistricts. The largest number is found in Nørrebro and Valby, with 14 playgroundseach. The smallest number is found in Bispebjerg and Vesterbro/Kongens Enghave,with 8 playgrounds each. The number of playgrounds does not in itself indicate howmany children share a playground on average. The number of children varies a greatdeal between districts.AVAILABLE PLAYGROUND SPACE PER CHILDAs mentioned above, the 2010 count found that the playground in Valbyparken wasthe most popular playground in Copenhagen. But as this is a very large playground,the count does not indicate whether the sandboxes are crowded, or the childrenhave to wait in line to use the slides. A count of the number of square metres perchild reveals that there is plenty of room for each child in the popular playground inValbyparken.Playgrounds should give children a safe place for rough-and-tumble play. A playgroundis good when it is safe, and when the equipment is fun, sturdy and of highquality. However, the playgrounds are also recreational areas for adults, who playwith their children and chat with other adults. Today, playgrounds are importantsocial meeting places for both children and adults.Copenhagen is currently upgrading all the city’s playgrounds. From 2008 through2011, all the city’s playgrounds will be renovated. Some renovation processes havebeen completed, while others are ongoing or under preparation.Sourcer: Catinét, MegafonLOCAL VARIATION IN THE DEGREE OF SATISFACTION WITH THEOPPORTUNITIES FOR PLAY IN PUBLIC PLAYGROUNDSTo illustrate these differences, we have calculated how many children there are perplayground, on average, in the inner city and in Vesterbro, Nørrebro and Østerbro.NUMBER OF CHILDREN BETWEEN ZERO AND TEN YEARS OF AGEPER PLAYGROUND IN THE DIFFERENT DISTRICTSIndre by 487Nørrebro 616Østerbro 765Vesterbro/Kongens Enghave 839NUMBER OF SQUARE METRE PER VISITOR TO THE PLAYGROUNDEnghaveparken legepladsElefantens bastionSkydebanehavenValbyparken legeplads81 m291 m2122 m2139 m2The figures should be read as estimates, not as precise data, as the measurements of thesize of the playgrounds is based on maps and is not 100% accurate.Source:Center for park and nature, City of Copenhagenper person per hourPLAYGROUND USEVanløse 93%Østerbro 89%Vesterbro/Kgs. Enghave 85%Nørrebro 84%Amager Øst 82%Valby 82%Brønshøj-Husum 82%Amager Vest 80%Indre by 79%Bispebjerg 71%In 2010 a poll asked Copenhageners how often and for how long they visit the city’splaygrounds. The figures only include replies from people with children or grandchildren.Of this group, 31% visit the playgrounds at least once a week.Of the people who visit the playgrounds, 27% spend one to three hours on each visittogether with the children. 60% stay less than an hour.The figures should be read with the reservation that a given playground may be frequented by children from other districts. This isespecially true of playgrounds located close to the boundary between districts.Source: Center for park and nature, City of CopenhagenSource: Megafon44 45
<strong>URBAN</strong> <strong>LIFE</strong> <strong>ACCOUNTS</strong>- Trends in Copenhagen’s urban life 2010<strong>URBAN</strong> <strong>LIFE</strong> <strong>ACCOUNTS</strong> 2010 are the first of their kind in Copenhagen.The purpose of the accounts is to measure the quality of and satisfactionwith urban life in Copenhagen. The City of Copenhagen is currentlypursuing strategies and efforts to improve urban life.The urban life accounts were prepared byTechnical and Environmental Administration, City of CopenhagenText and editing: Niels BjørnTranslation: Dorthe H. SilverDesign: City of Copenhagen, TMF Grafisk DesignPhoto: Troels Heien, Gitte Lotinga, Klaus Hjerrild,Gehl Architects, DK NEWS and City of CopenhagenCopenhagen 2011www.kk.dk46