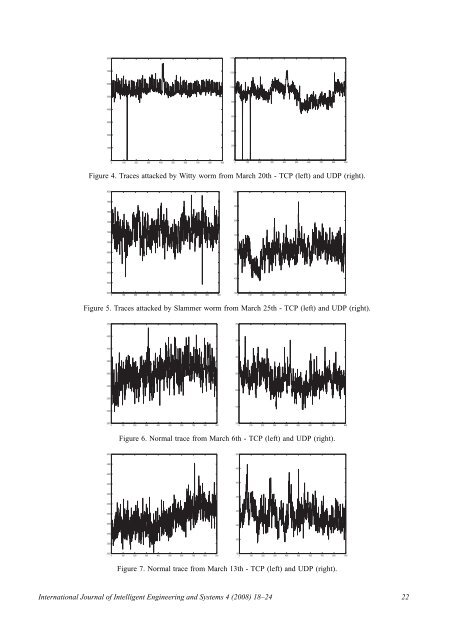
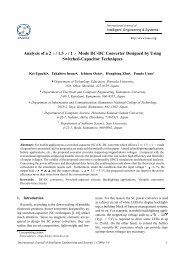
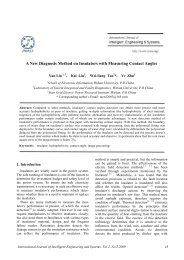
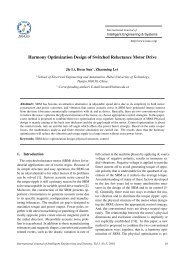
0.30.20.10-0.1-0.2-0.3-0.4-0.5450 500 550 6000.40.30.20.10-0.1-0.2-0.3-0.4460 480 500 520 540 560Figure 3. Example dictionary atomsO k,l = 1 ∑o ( )A|LP k,l |c(i) ,W c(k,l)i∈LP k,l(9)LP k,l is a list <strong>of</strong> atoms grouped by centered atom. O k,lis mean <strong>of</strong> local distances from centered atom W c(k,l)to the atoms A c(i) which are strongly correlated withA c(i) .Centroid W c(k,l) represents atoms A c(i) which belongsto the set i ∈ LP k,l . List <strong>of</strong> atoms LP k,l shouldbe selected according to the Equation 10:max o ( )A c(i) ,W c(k,l) ≤i∈LP k,lmin o ( )A c(t) ,W c(k,l) (10)t∈D\LP k,lIn the proposed IDS solution 1D real Gabor basefunction (Equation 11) was used to build dictionary[10]-[12].α u,s,ξ,φ (t) = c u,s,ξ,φ α( t − u )cos(2πξ(t − u) + φ) (11)swhere:α(t) = 1 √ se −πt2 (12)c u,s,ξ,φ - is a normalizing constant used to achieveatom unit energy,In order to create overcomplete set <strong>of</strong> 1D base functionsdictionary D was built by varying subsequentatom parameters: Frequency ξ and phase φ, Positionu, Scale s [13].Base functions dictionary D was created with using10 different scales (dyadic scales) and 50 differentfrequencies.In Figure 3 example atoms from dictionary D arepresented.5. Experiments and ResultsIn our experiments we decided to detect worm attacks.We tested our algorithms on normal and attackedtraces to evaluate if our method is capable <strong>of</strong>detecting known worms.Similarly to the work by Dainotti et al. [14] wetested the efficiency <strong>of</strong> our algorithms on Slammer andWitty worms. Slammer worm spread in 2003, whileWitty spread in March 2004.In our experiments we use TCP and UDP packets<strong>of</strong> Slammer and Witty made available by the WIDE-MAWI and CAIDA projects [15][16].In this paper we will show our algorithm tested onattacked and normal traces.The attacked traces represent traffic (TCP andUDP packets) from March 20th (Witty) (Figure 4)and March 25th (Slammer) (Figure 5).The normal traces represent traffic from March 6thand March 13th (Figures 6-7).The calculated values <strong>of</strong> Matching Pursuit MeanProjection for our test traces (normal and attacked)are presented in Tables 1-2.In tables 1 Matching Pursuit Mean Projection valuesfor TCP packets are presented. In tables 2 MatchingPursuit Mean Projection values for UDP packetsare given, respectively.Table 1. Mean Projection values calculated for test TCPtracesTCP TraceMP25.03.2004 (Slammer) 62020.03.2004 (Witty) 6676.03.2004 45313.03.2004 373Decision block <strong>of</strong> our system is based on the MatchingPursuit Mean Projection values. As presented inFigure 1 we calculate difference Diff between examinedand normal traces stored in a reference database.If the value Diff is larger than a certain threshold tour application signalizes the attack/anomaly.In the experiments shown here, in the case <strong>of</strong> Wormattacks, our application was set to t = 30%, whichmeans that if Matching Pursuit Mean Projection differsmore than 30% from the reference normal tracesthe attack should be detected.As presented in Tables 1-2 mean projection valuesdiffer significantly and our IDS application successfullydetects Witty and Slammer worms. In our experimentswe can report 100% worm detection for TCPand UDP packets with no false alarms. However, so farwe tested our method on a limited number <strong>of</strong> traces.We decided to use known and benchmark traces andworms first. Now we extensively test our method witha larger number <strong>of</strong> real-networks anonimized tracesas well as with the generated traffic traces.International Journal <strong>of</strong> Intelligent Engineering and Systems 4 (<strong>2008</strong>) 18–24 21
0 100 200 300 400 500 600 700 800 90080001400700012006000100050008004000600300040020001000200000 100 200 300 400 500 600 700 800 900Figure 4. Traces attacked by Witty worm from March 20th - TCP (left) and UDP (right).8000100078009007600740080072007007000680060066005006400400620060000 100 200 300 400 500 600 700 800 9003000 100 200 300 400 500 600 700 800 900Figure 5. Traces attacked by Slammer worm from March 25th - TCP (left) and UDP (right).4400400420035040003003800360025034002003200150300028000 100 200 300 400 500 600 700 800 9001000 100 200 300 400 500 600 700 800 900Figure 6. Normal trace from March 6th - TCP (left) and UDP (right).500050048004504600440040042003504000380030036002503400200320030000 100 200 300 400 500 600 700 800 9001500 100 200 300 400 500 600 700 800 900Figure 7. Normal trace from March 13th - TCP (left) and UDP (right).International Journal <strong>of</strong> Intelligent Engineering and Systems 4 (<strong>2008</strong>) 18–24 22