Supplementary Information - Deutsche Bank Interim Report 3Q2011
Supplementary Information - Deutsche Bank Interim Report 3Q2011
Supplementary Information - Deutsche Bank Interim Report 3Q2011

You also want an ePaper? Increase the reach of your titles
YUMPU automatically turns print PDFs into web optimized ePapers that Google loves.
05 // SUPPLEMENTARY INFORMATION GROUP FIVE-YEAR RECORD<br />
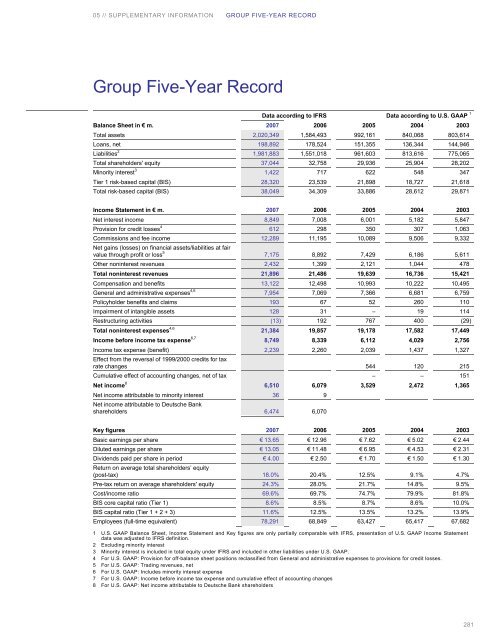
Group Five-Year Record<br />
Data according to IFRS Data according to U.S. GAAP 1<br />
Balance Sheet in € m. 2007 2006 2005 2004 2003<br />
Total assets 2,020,349 1,584,493 992,161 840,068 803,614<br />
Loans, net 198,892 178,524 151,355 136,344 144,946<br />
Liabilities 2 1,981,883 1,551,018 961,603 813,616 775,065<br />
Total shareholders' equity 37,044 32,758 29,936 25,904 28,202<br />
Minority interest3 1,422 717 622 548 347<br />
Tier 1 risk-based capital (BIS) 28,320 23,539 21,898 18,727 21,618<br />
Total risk-based capital (BIS) 38,049 34,309 33,886 28,612 29,871<br />
Income Statement in € m. 2007 2006 2005 2004 2003<br />
Net interest income 8,849 7,008 6,001 5,182 5,847<br />
Provision for credit losses4 612 298 350 307 1,063<br />
Commissions and fee income<br />
Net gains (losses) on financial assets/liabilities at fair<br />
12,289 11,195 10,089 9,506 9,332<br />
value through profit or loss 5 7,175 8,892 7,429 6,186 5,611<br />
Other noninterest revenues 2,432 1,399 2,121 1,044 478<br />
Total noninterest revenues 21,896 21,486 19,639 16,736 15,421<br />
Compensation and benefits 13,122 12,498 10,993 10,222 10,495<br />
General and administrative expenses4,6 7,954 7,069 7,366 6,681 6,759<br />
Policyholder benefits and claims 193 67 52 260 110<br />
Impairment of intangible assets 128 31 – 19 114<br />
Restructuring activities (13) 192 767 400 (29)<br />
Total noninterest expenses 4,6 21,384 19,857 19,178 17,582 17,449<br />
Income before income tax expense 6,7 8,749 8,339 6,112 4,029 2,756<br />
Income tax expense (benefit)<br />
Effect from the reversal of 1999/2000 credits for tax<br />
2,239 2,260 2,039 1,437 1,327<br />
rate changes 544 120 215<br />
Cumulative effect of accounting changes, net of tax – – 151<br />
Net income8 6,510 6,079 3,529 2,472 1,365<br />
Net income attributable to minority interest<br />
Net income attributable to <strong>Deutsche</strong> <strong>Bank</strong><br />
36 9<br />
shareholders 6,474 6,070<br />
Key figures 2007 2006 2005 2004 2003<br />
Basic earnings per share € 13.65 € 12.96 € 7.62 € 5.02 € 2.44<br />
Diluted earnings per share € 13.05 € 11.48 € 6.95 € 4.53 € 2.31<br />
Dividends paid per share in period<br />
Return on average total shareholders’ equity<br />
€ 4.00 € 2.50 € 1.70 € 1.50 € 1.30<br />
(post-tax) 18.0% 20.4% 12.5% 9.1% 4.7%<br />
Pre-tax return on average shareholders' equity 24.3% 28.0% 21.7% 14.8% 9.5%<br />
Cost/income ratio 69.6% 69.7% 74.7% 79.9% 81.8%<br />
BIS core capital ratio (Tier 1) 8.6% 8.5% 8.7% 8.6% 10.0%<br />
BIS capital ratio (Tier 1 + 2 + 3) 11.6% 12.5% 13.5% 13.2% 13.9%<br />
Employees (full-time equivalent) 78,291 68,849 63,427 65,417 67,682<br />
1 U.S. GAAP Balance Sheet, Income Statement and Key figures are only partially comparable with IFRS, presentation of U.S. GAAP Income Statement<br />
data was adjusted to IFRS definition.<br />
2 Excluding minority interest<br />
3 Minority interest is included in total equity under IFRS and included in other liabilities under U.S. GAAP.<br />
4 For U.S. GAAP: Provision for off-balance sheet positions reclassified from General and administrative expenses to provisions for credit losses.<br />
5 For U.S. GAAP: Trading revenues, net<br />
6 For U.S. GAAP: Includes minority interest expense<br />
7 For U.S. GAAP: Income before income tax expense and cumulative effect of accounting changes<br />
8 For U.S. GAAP: Net income attributable to <strong>Deutsche</strong> <strong>Bank</strong> shareholders<br />
281