entire - Deutsche Bank Annual Report 2012
entire - Deutsche Bank Annual Report 2012
entire - Deutsche Bank Annual Report 2012

Create successful ePaper yourself
Turn your PDF publications into a flip-book with our unique Google optimized e-Paper software.
<strong>Deutsche</strong> <strong>Bank</strong><br />
<strong>Annual</strong> Review 2010<br />
Delivering in the face of uncertainty
Delivering in the face of uncertainty<br />
In 2010 the mechanisms driving the globally interconnected economy<br />
and fi nancial markets became apparent. Market disruptions capable<br />
of posing a severe threat to the stability of the world economic<br />
order revealed great diff erences in the power to react.<br />
For <strong>Deutsche</strong> <strong>Bank</strong>, independence and strict regulatory requirements<br />
are not mutually exclusive. Particularly in times of far-reaching<br />
change, stable conditions provide security and create scope for<br />
action. But high social costs impair the ideal macroeconomic<br />
environ ment. Last year, we successfully demonstrated that extensive<br />
change certainly opens up major opportunities.<br />
We do not see ourselves as a superior winner of the crisis. Nevertheless,<br />
thanks to our market strength, our swift and responsible<br />
actions as well as our highly motivated and diverse workforce, we<br />
are now in a considerably stronger position than before. And we<br />
are proud of this.<br />
We discussed our annual topic “Delivering in the<br />
face of uncertainty” with our shareholder Patrick<br />
Lemmens, Portfolio Manager, Robeco Institutional<br />
Asset Management B. V., Rotterdam (pages 20 / 21);<br />
our client Emma Quinn, Head of Dealing – Australia<br />
and New Zealand, AllianceBernstein, Sydney (pages<br />
34 / 35); our colleague Maurice Robinson, registrar<br />
services GmbH, Frankfurt (pages 58 / 59); and<br />
Chennupati Vidya, Vasavya Mahila Mandali (VMM),<br />
Vijayawada (pages 64 / 65).
<strong>Deutsche</strong> <strong>Bank</strong><br />
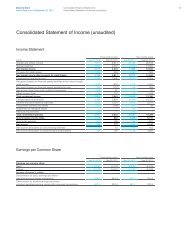
The Group at a glance 2010 2009<br />
Basic earnings per share 1 € 3.07 € 7.21<br />
Diluted earnings per share 1 € 2.92 € 6.94<br />
Average shares outstanding, in m., basic 1 753 689<br />
Average shares outstanding, in m., diluted 1 791 717<br />
Return on average shareholders’ equity (post tax) 5.5 % 14.6 %<br />
Pre-tax return on average shareholders’ equity 9.5 % 15.3 %<br />
Pre-tax return on average active equity 9.6 % 15.1 %<br />
Book value per basic share outstanding 2 € 52.38 € 52.65<br />
Cost / income ratio 3 81.6 % 72.0 %<br />
Compensation ratio 4 44.4 % 40.5 %<br />
Noncompensation ratio 5 37.3 % 31.5 %<br />
in € m. 2010 2009<br />
Total net revenues 28,567 27,952<br />
Provision for credit losses 1,274 2,630<br />
Total noninterest expenses 23,318 20,120<br />
Income (loss) before income taxes 3,975 5,202<br />
Net income (loss) 2,330 4,958<br />
in € bn. Dec 31, 2010 Dec 31, 2009<br />
Total assets 1,906 1,501<br />
Shareholders’ equity 48.8 36.6<br />
Core Tier 1 capital ratio 6 8.7 % 8.7 %<br />
Tier 1 capital ratio 7 12.3 % 12.6 %<br />
Number Dec 31, 2010 Dec 31, 2009<br />
Branches 3,083 1,964<br />
thereof in Germany 2,087 961<br />
Employees ( full-time equivalent ) 102,062 77,053<br />
thereof in Germany 49,265 27,321<br />
Long-term rating Dec 31, 2010 Dec 31, 2009<br />
Moody’s Investors Service Aa3 Aa1<br />
Standard & Poor’s A+ A+<br />
Fitch Ratings AA– AA–<br />
1 The number of average basic and diluted shares outstanding has been adjusted for all periods before October 6, 2010 to refl ect the eff ect of the bonus<br />
element of the subscription rights issue in connection with the capital increase.<br />
2 Book value per basic share outstanding is defi ned as shareholders’ equity divided by the number of basic shares outstanding (both at period end).<br />
3 Total noninterest expenses as a percentage of total net interest income before provision for credit losses plus noninterest income.<br />
4 Compensation and benefi ts as a percentage of total net interest income before provision for credit losses plus noninterest income.<br />
5 Noncompensation noninterest expenses which is defi ned as total noninterest expenses less compensation and benefi ts, as a percentage of total net interest<br />
income before provision for credit losses plus noninterest income.<br />
6 The capital ratios relate the respective capital to risk-weighted assets for credit, market and operational risk. Excludes transitional items pursuant to section<br />
64h (3) German <strong>Bank</strong>ing Act.<br />
7 The Tier 1 capital ratio relates Tier 1 capital to risk-weighted assets for credit, market and opertational risk. The Tier 1 capital ratio excludes transitional items<br />
pursuant to Section 64h (3) German <strong>Bank</strong>ing Act.
The <strong>Deutsche</strong> <strong>Bank</strong> Share<br />
Useful information on the <strong>Deutsche</strong> <strong>Bank</strong> share<br />
2010<br />
Change in total return 1 (11.72) %<br />
Share in equities trading (Xetra) 1 6.80 %<br />
Average daily trading volume 2 8.0 million shares<br />
Share price high 3 € 55.11<br />
Share price low 3 € 35.93<br />
Dividend per share ( proposed for 2010 ) € 0.75<br />
As of December 31, 2010<br />
Issued shares 929,499,640<br />
Outstanding shares 919,062,360<br />
Share capital € 2,379,519,078.40<br />
Market capitalization € 36.34 billion<br />
Share price 4 € 39.10<br />
Weighting in the DAX 5.99 %<br />
Weighting in the STOXX 50 1.38 %<br />
Securities identifi cation codes<br />
<strong>Deutsche</strong> Börse New York Stock Exchange<br />
Type of issue Registered share Type of issue Global Registered Share<br />
Symbol DBK Currency U.S. $<br />
WKN 514000 Symbol DB<br />
ISIN DE0005140008 CINS D 18190898<br />
Reuters DBKGn. DE Bloomberg DBK GR<br />
1 Share price based on Xetra<br />
2 Orderbook statistics ( Xetra )<br />
3 For comparison purposes, the share prices have been adjusted for all periods before October 6, 2010 to refl ect the impact of the subscription rights issue in<br />
connection with the capital increase.<br />
4 Xetra – closing price<br />
Facts /<br />
Figures
Contents<br />
Letter from the Chairman of the Management Board – 02<br />
Group Executive Committee – 08<br />
<strong>Report</strong> of the Supervisory Board – 10<br />
Supervisory Board – 18<br />
01 –<br />
<strong>Deutsche</strong> <strong>Bank</strong> Group<br />
Corporate profi le and overview – 23<br />
Investments in the future<br />
Corporate Governance – 27<br />
The foundation for long-term success<br />
In the interests of our partners – 29<br />
Strength for our shareholders, clients, staff and society<br />
02 –<br />
Stakeholders<br />
Shareholders – 37<br />
Strong support for our record-level capital increase<br />
Clients – Corporate & Investment <strong>Bank</strong> – 41<br />
Building on our competitive edge<br />
Clients – Private Clients and Asset Management – 46<br />
Sustained positive momentum<br />
Clients – Corporate Investments – 51<br />
Shareholding in <strong>Deutsche</strong> Postbank AG transferred<br />
to Private & Business Clients Corporate Division<br />
Clients – Central Infrastructure – 52<br />
The executive arm of the Management Board<br />
Staff – 53<br />
Growth through acquisitions<br />
Society – 56<br />
Building social capital<br />
03 –<br />
Consolidated Financial Statements / Excerpts<br />
Statement of Income – 61<br />
Balance Sheet – 62<br />
Group Five-Year Record – 63<br />
04 –<br />
Further Information<br />
Glossary – 67<br />
Imprint / Publications – 71<br />
Financial Calendar – 72
<strong>Deutsche</strong> <strong>Bank</strong><br />
<strong>Annual</strong> Review 2010<br />
Letter from the Chairman of the Management Board<br />
Dr. Josef Ackermann<br />
Chairman of the Management Board and<br />
the Group Executive Committee<br />
For <strong>Deutsche</strong> <strong>Bank</strong>, 2010 was a crucial year. It was a year of<br />
investments and changes, and one in which we clearly<br />
strengthened our competitive position. In many ways, the<br />
bank is now stronger than before the fi nancial crisis and<br />
exceptionally well positioned for renewed growth.<br />
Last year, the global economy showed increasing signs of<br />
recovery. The worst is behind us – but we are not out of the<br />
woods yet. Growth momentum came primarily from the<br />
emerging markets in Asia and Latin America. By contrast,<br />
recovery in most of the industrial countries has been slower.<br />
The U. S. economy is still weighed down by the need for real<br />
estate market corrections and high levels of indebtedness.<br />
The eurozone is marked by signifi cant imbalances: while some<br />
of Europe’s ’ peripheral’ states face economic and structural<br />
problems, our home market, Germany, saw strong economic<br />
growth of 3.6 %.<br />
Against this background, the bank’s total net revenues in 2010<br />
came to € 28.6 billion. These are among the highest revenues<br />
we have ever recorded. At € 4 billion, our reported income before<br />
02
<strong>Deutsche</strong> <strong>Bank</strong><br />
<strong>Annual</strong> Review 2010<br />
Letter from the Chairman of the Management Board<br />
income taxes was impacted by special items. Excluding the<br />
one-time charges from our three acquisitions – Postbank, parts<br />
of ABN AMRO, and Sal. Oppenheim / BHF-BANK – our income<br />
before income taxes would have been € 6.5 billion, compared<br />
with € 5.2 billion in 2009. Adjusted for further specifi c investments<br />
and one-time items such as write-downs, our pre-tax<br />
profi t for 2010 would have been more than € 7 billion.<br />
For our Group Divisions Corporate & Investment <strong>Bank</strong> ( CIB ) and<br />
Private Clients and Asset Management ( PCAM ), combined<br />
income before income taxes – adjusted for acquisition eff ects –<br />
was around € 7.2 billion. That puts us well within sight of<br />
our € 10 billion target for our operating business units for 2011.<br />
CIB recorded income before income taxes of € 6.0 billion. This<br />
is the division’s second best performance in the history of<br />
the bank.<br />
Corporate <strong>Bank</strong>ing & Securities ( CB & S ) which forms part of our<br />
investment banking, generated pre-tax profi ts of € 5.1 billion<br />
last year. The dedicated client focus and clear progress in the<br />
division’s integration process contributed to this outstanding<br />
performance. This performance is all the more impressive considering<br />
that it was achieved with signifi cantly reduced risks,<br />
at a time when the sovereign debt crisis was weighing on the<br />
fi nancial markets and limiting the corporate sector’s appetite for<br />
capital-raising and M & A activities.<br />
As expected, revenues in our Rates and Money Market trading<br />
normalized. In Debt trading, we are ranked fi rst among the best<br />
bond houses in Europe, and we are number two worldwide.<br />
Furthermore, among the world’s top three bond houses, we are<br />
the only bank that was able to capture market share. Our Foreign<br />
Exchange trading continued to perform very strongly at the same<br />
high level as in 2009. We were the number one globally in this<br />
business for the sixth consecutive year. We generated higher<br />
revenues in our Credit trading and Commodities businesses;<br />
and in Equities trading we maintained the momentum gained<br />
from the recalibration of our equity derivatives operations.<br />
03
<strong>Deutsche</strong> <strong>Bank</strong><br />
<strong>Annual</strong> Review 2010<br />
Letter from the Chairman of the Management Board<br />
In our Origination and Advisory business, we can also report<br />
a number of major successes. For the fi rst time, we achieved<br />
our long-term strategic objective of being among the world’s<br />
top fi ve banks in this business, too. In the past year, no<br />
other bank has gained greater market share in this area than<br />
<strong>Deutsche</strong> <strong>Bank</strong>.<br />
In our M & A business, we nearly doubled our market share and<br />
now hold fi fth place – based on fees – in the global rankings.<br />
In our Global Transaction <strong>Bank</strong>ing Corporate Division, continued<br />
low interest rates had a negative impact on results. Income<br />
before income taxes came to € 905 million and was also impacted<br />
by specifi c items. In Cash Management, we consolidated<br />
our leading position in euro clearing and stabilized our position<br />
among the top U. S. dollar clearing houses.<br />
In 2010, PCAM maintained its positive momentum from 2009<br />
and generated income before income taxes of € 1 billion.<br />
Income before income taxes in Asset and Wealth Management<br />
was € 100 million, after net charges of € 368 million relating<br />
to Sal. Oppenheim / BHF-BANK. The business division benefi ted<br />
primarily from increased performance fees and volume-based<br />
commissions as well as a favourable market environment.<br />
Especially in times of uncertainty, customers appreciate the<br />
secure, reliable and competent service <strong>Deutsche</strong> <strong>Bank</strong> provides.<br />
If the market environment continues to recover, our Asset<br />
and Wealth Management division will be able to increase its<br />
results signifi cantly.<br />
Our Private & Business Clients ( PBC ) Corporate Division nearly<br />
doubled its income before income taxes on the year to<br />
€ 890 million. The effi ciency measures we launched in 2009 had<br />
a positive eff ect in this area. The good results were, primarily<br />
underpinned by the improved credit environment, higher<br />
margins and growth in brokerage commission revenues as well<br />
as, for the fi rst time, the contribution from Postbank.<br />
04
<strong>Deutsche</strong> <strong>Bank</strong><br />
<strong>Annual</strong> Review 2010<br />
Letter from the Chairman of the Management Board<br />
Another key element of our success is our risk and capital<br />
management. Even after the consolidation of Sal. Oppenheim,<br />
ABN AMRO and Postbank, we recorded a Tier 1 ratio of 12.3 %<br />
and a core Tier 1 ratio of 8.7 % at the end of 2010. By means<br />
of the biggest capital increase in the bank’s history, we secured<br />
the funding needed for the Postbank takeover and strengthened<br />
our capital base ahead of the stricter requirements under<br />
the Basel III regulatory framework. As things stand today, we<br />
expect to meet the Basel III solvency ratios, due to be phased<br />
in by 2019, as early as 2013. To this end, we will maintain our<br />
disciplined capital management, pay an appropriate dividend<br />
and implement our growth initiatives.<br />
Our dividend proposal also serves to meet this objective. With<br />
the approval of the Supervisory Board, the Management Board<br />
will propose a dividend of € 0.75 per share for the 2010 fi nancial<br />
year. While this is the same amount as last year on a per-share<br />
basis, it relates to a 50 % greater capital base.<br />
The fact that we were able to carry out the biggest capital<br />
increase in the bank’s history, and that it went so smoothly, is<br />
clear evidence of investors’ confi dence in <strong>Deutsche</strong> <strong>Bank</strong>’s<br />
future performance. On behalf of the <strong>entire</strong> bank, I would like to<br />
take this opportunity to express once again my thanks to you<br />
all for your trust and support. We will do everything possible to<br />
live up to the expectations that our shareholders have for their<br />
investment.<br />
Today, our bank is more respected than ever across the globe.<br />
The top positions we hold in terms of reputation and brand<br />
strength open up new opportunities for the future. We are<br />
fi rmly committed to our corporate social responsibility. In 2010,<br />
we dedicated nearly € 100 million to supporting projects around<br />
the world relating to education, sustainability, community<br />
development and art. We regard these investments in society<br />
as investments in our own future.<br />
05
<strong>Deutsche</strong> <strong>Bank</strong><br />
<strong>Annual</strong> Review 2010<br />
Letter from the Chairman of the Management Board<br />
The year 2010 once again demonstrated the strengths of our<br />
business model with its diversifi ed business structure. We have<br />
received numerous awards in recognition of our top performance<br />
in many product categories. The prestigious magazine International<br />
Financing Review ( IFR ) recently named us “<strong>Bank</strong> of the<br />
Year” – which, after 2003 and 2005, marks the third time that<br />
<strong>Deutsche</strong> <strong>Bank</strong> has been awarded the industry’s most coveted<br />
prize. We are extremely proud of this achievement.<br />
2011 will be the year in which we aim to fully leverage the strong,<br />
forward-looking market position built up in 2010 as we carried<br />
out Phase 4 of our Management Agenda. We are aware, of<br />
course, that uncertainties still remain for the economy and the<br />
fi nancial markets, which is the environment in which we and<br />
our clients do business. Our priorities are clear:<br />
First, our investment bank has demonstrated that it can con sistently<br />
deliver outstanding results – and that it can do so with<br />
a more conservative risk profi le.<br />
Second, our successful acquisitions in Germany and Europe<br />
have strengthened our retail banking and asset management<br />
businesses. We are set to profi t from a more balanced revenue<br />
mix, lower revenue volatility as well as improved liquidity<br />
and more broadly based refi nancing opportunities. With the<br />
acqui sition of the renowned private bank Sal. Oppenheim,<br />
we extended our leading position in the market for wealth<br />
management in Germany.<br />
Another step in our strategy to consistently strengthen our<br />
“stable” businesses was the acquisition of Postbank. It will help<br />
us turn retail banking into a strong second pillar alongside<br />
investment banking. <strong>Deutsche</strong> <strong>Bank</strong> and Postbank are an ideal<br />
match as they attract diff erent client groups. Although Postbank<br />
is now part of <strong>Deutsche</strong> <strong>Bank</strong> Group, it will remain the strong,<br />
independent brand it has always been for its clients.<br />
06
<strong>Deutsche</strong> <strong>Bank</strong><br />
<strong>Annual</strong> Review 2010<br />
Letter from the Chairman of the Management Board<br />
Third, in Asia, we are well on track with our plan to double<br />
revenues and profi ts this year based on 2008 levels. Fourth and<br />
fi nally, we expect the integration of our investment bank and<br />
the consolidation of Postbank to generate considerable synergies<br />
and we envisage signifi cant effi ciency gains from the<br />
reinvigoration of our performance culture.<br />
<strong>Deutsche</strong> <strong>Bank</strong> is very well positioned for the future. Naturally,<br />
my colleagues and I are well aware that we will face many<br />
challenges and uncertainties this year, too. However, barring<br />
unforeseen obstacles, we will be able to reach our target by<br />
drawing on last year’s hard work and the momentum gained<br />
from our accomplishments. We look forward to continuing to<br />
serve the interests of our shareholders, our clients, our<br />
employees and the communities in which we operate in 2011<br />
and beyond.<br />
Yours sincerely,<br />
Dr. Josef Ackermann<br />
Chairman of the Management Board and<br />
the Group Executive Committee<br />
Frankfurt am Main, March 2011<br />
07
<strong>Deutsche</strong> <strong>Bank</strong><br />
<strong>Annual</strong> Review 2010<br />
Group Executive Committee<br />
Group Executive Committee<br />
1 Stefan Krause, *1962<br />
Management Board member since 2008.<br />
Chief Financial Offi cer, responsible for Finance,<br />
Tax, Corporate Insurance, Investor Relations<br />
and Group Strategy & Planning.<br />
2 Rainer Neske, *1964<br />
Management Board member since 2009.<br />
Head of Private & Business Clients.<br />
3 Dr. Josef Ackermann, *1948<br />
Management Board member since 1996.<br />
Chairman of the Management Board and the<br />
Group Executive Committee, responsible<br />
for Asset and Wealth Management, Corporate<br />
Investments, Communications & Corporate<br />
Social Responsibility, Economics / DB Research<br />
and Audit.<br />
4 Hermann-Josef Lamberti, *1956<br />
Management Board member since 1999.<br />
Chief Operating Offi cer, responsible for<br />
Human Resources, Information Technology,<br />
Operations and Process Management,<br />
Building and Facilities Management as well<br />
as Purchasing.<br />
5 Kevin Parker, *1959<br />
Head of Asset Management.<br />
6 Seth Waugh, *1958<br />
Chief Executive Offi cer <strong>Deutsche</strong> <strong>Bank</strong><br />
Americas.<br />
7 Dr. Hugo Bänziger, *1956<br />
Management Board member since 2006.<br />
Chief Risk Offi cer, responsible for Risk<br />
Management, Legal, Compliance,<br />
Corporate Security, Treasury and Corporate<br />
Governance.<br />
1 – 2 – 3 – 4 – 7 – 9 – 12<br />
Members of the Management Board<br />
of <strong>Deutsche</strong>n <strong>Bank</strong> AG.<br />
8 Werner Steinmüller, *1954<br />
Head of Global Transaction <strong>Bank</strong>ing.<br />
9 Anshuman Jain, *1963<br />
Management Board member since 2009.<br />
Head of the Corporate & Investment <strong>Bank</strong>.<br />
10 Robert Rankin, *1963<br />
Chief Executive Offi cer<br />
<strong>Deutsche</strong> <strong>Bank</strong> Asia Pacifi c (ex-Japan).<br />
11 Pierre de Weck, *1950<br />
Head of Private Wealth Management.<br />
12 Jürgen Fitschen, *1948<br />
Management Board member since 2009.<br />
Head of Regional Management worldwide.<br />
Chairman of the Management Committee<br />
Germany.<br />
08
<strong>Deutsche</strong> <strong>Bank</strong><br />
<strong>Annual</strong> Review 2010<br />
Group Executive Committee<br />
1 2<br />
3<br />
4 5<br />
7 8 9<br />
10 11 12<br />
09<br />
6
<strong>Deutsche</strong> <strong>Bank</strong><br />
<strong>Annual</strong> Review 2010<br />
<strong>Report</strong> of the Supervisory Board<br />
<strong>Report</strong> of the Supervisory Board<br />
Dr. Clemens Börsig<br />
Chairman of the Supervisory Board<br />
In 2010, the economic environment continued to stabilize further, beyond our original<br />
expectations. In particular our home market, Germany, benefi ted from this. Growth<br />
continued in the key emerging markets of Latin America and Asia. In the eurozone,<br />
fi scal tightening and economic rebalancing dampened growth in some countries.<br />
Uncertainties remain concerning the stability of the fi nancial system, which, in light<br />
of the excessive levels of sovereign debt, led to high volatility in the capital markets.<br />
Furthermore, new regulatory requirements have become more concrete in the wake<br />
of the crisis. The “Basel III” rules recently approved by the G20 are just the beginning.<br />
For <strong>Deutsche</strong> <strong>Bank</strong>, 2010 was a year of investments, a year in which we drove change<br />
and clearly enhanced our competitive position. In many ways, the bank is now stronger<br />
than before the fi nancial crisis and exceptionally well positioned for renewed growth.<br />
Our market presence was signifi cantly expanded through the takeover of parts of ABN<br />
AMRO <strong>Bank</strong> in the Netherlands as well as Sal. Oppenheim and Postbank in Germany.<br />
The bank has thus improved its earnings power, especially in the retail and commercial<br />
banking businesses, and is creating a second powerful revenue engine alongside its<br />
globally successful investment banking operations.<br />
The bank also strengthened its equity capital base. Thanks to the well-chosen timeframe,<br />
the capital increase was carried out very successfully in September with gross<br />
issue proceeds of € 10.2 billion, making it possible to launch into the decisive phase<br />
of the Postbank takeover. The bank’s capital strength will continue to be a top priority<br />
for the Management Board and Supervisory Board in the future, too. We also took<br />
this into account in this year’s dividend proposal, just like last year. The bank will<br />
continue to face major challenges, including the Postbank integration and new regulatory<br />
requirements. We would like to thank the Management Board and the bank’s<br />
employees for their great personal dedication.<br />
10
<strong>Deutsche</strong> <strong>Bank</strong><br />
<strong>Annual</strong> Review 2010<br />
<strong>Report</strong> of the Supervisory Board<br />
In 2010, we again addressed numerous statutory and regulatory changes. Last year,<br />
we extensively discussed the bank’s economic and fi nancial development, its<br />
operating environment, risk management system, planning and internal control<br />
system as well as changes in the system of compensation for the Management<br />
Board. We held in-depth discussions with the Management Board on the bank’s<br />
strategy and continued im plementation of the measures in phase four of the bank’s<br />
management agenda. The Management Board reported to us regularly, without<br />
delay and comprehensively on business policies and other fundamental issues relating<br />
to management and corporate planning, the bank’s fi nancial development and<br />
earnings situation, the bank’s risk, liquidity and capital management as well as transactions<br />
and events that were of signifi cant importance to the bank. We advised the<br />
Management Board and monitored its management of business. We were involved in<br />
decisions of fundamental importance. Regular discussions were also held between<br />
the Chairman of the Super visory Board and the Chairman of the Management Board<br />
dealing with important topics and upcoming decisions. Between meetings, the<br />
Management Board kept us informed in writing of important events. Resolutions<br />
were passed by circulation procedure when necessary between the meetings.<br />
Meetings of the Supervisory Board<br />
The Supervisory Board held nine meetings in the 2010 fi nancial year.<br />
At the fi rst meeting of the year on February 3, 2010, we discussed the development<br />
of business in 2009, the key fi gures of the <strong>Annual</strong> Financial Statements for 2009 and a<br />
comparison of the plan-actual fi gures for 2009. The dividend proposal for the year 2009<br />
as well as the corporate planning for the years 2010 to <strong>2012</strong> were noted with approval.<br />
Furthermore, we discussed the audit report by PricewaterhouseCoopers on the proper<br />
functioning of the business organization of the Corporate Security area, as well as<br />
the Corporate Governance <strong>Report</strong> and Corporate Governance Statement. We gave<br />
our consent to Dr. Börsig and Dr. Eick being named in the <strong>Annual</strong> <strong>Report</strong> as fi nancial<br />
experts in accordance with German and U.S. law and verifi ed the indepen dence of the<br />
Audit Committee members. Finally, we approved amendments to of the Articles of<br />
Association and, following extensive discussion, the restructuring of the Management<br />
Board’s compensation based on a recommendation from the Chairman’s Committee.<br />
At two other meetings on February 10 and February 18, 2010, we discussed the basis<br />
for calculating the variable compensation for the Management Board for the 2009<br />
fi nancial year, including the regulations of the Act on the Appropriateness of Management<br />
Board Compensation (VorstAG ), and subsequently determined the Management<br />
Board’s compensation – with the involvement of an independent external legal<br />
advisor and compensation consultant – while taking into account the recommendations<br />
of the Chairman’s Committee.<br />
At the fi nancial statements meeting on March 12, 2010, based on the Audit Committee’s<br />
recommendation and after a discussion with the auditor, we approved the Consolidated<br />
Financial Statements and <strong>Annual</strong> Financial Statements for 2009. Furthermore,<br />
the Compliance and Anti-Money Laundering <strong>Report</strong> was presented and a discussion<br />
was held on the possible increase in our participation in Hua Xia <strong>Bank</strong> in China.<br />
Mr. Lamberti informed us of the bank’s compensation structures and practices<br />
(Remuneration <strong>Report</strong>) in accordance with the new requirements of the Federal<br />
Financial Supervisory Authority (BaFin). We also obtained extensive information on<br />
the key risk positions and the Group’s risk management. Changes in the composition<br />
of the Regional Advisory Boards and Advisory Councils in Germany were presented<br />
to us, and the resolution proposals for the Agenda of the General Meeting 2010<br />
were approved.<br />
11
<strong>Deutsche</strong> <strong>Bank</strong><br />
<strong>Annual</strong> Review 2010<br />
<strong>Report</strong> of the Supervisory Board<br />
At the meeting on the day before the General Meeting, we discussed the procedures<br />
for the General Meeting and the announced counterproposals as well as the status of<br />
litigation in connection with the General Meetings 2004 – 2009. As necessary, resolutions<br />
were approved. Furthermore, Dr. Ackermann summarized the bank’s exposures<br />
in Greece and reported on the future course of action.<br />
At an extraordinary meeting on June 15, 2010, we noted Mr. Cohrs’s request to retire<br />
from the Management Board with eff ect from September 30, 2010, and agreed<br />
in general, on the basis of specifi c criteria, to the termination of his service agreement.<br />
Furthermore, we approved in general the resulting changes to the Business<br />
Allocation Plan for the Management Board based on the proposal submitted by the<br />
Chairman’s Committee. Dr. Ackermann informed us of the stress tests planned for<br />
fi nancial institutions.<br />
At the meeting on July 27, 2010, we were informed of the bank’s development in the<br />
fi rst six months of the year. Based on the supplements to the German Corporate<br />
Governance Code approved by the Government Commission in May 2010, amendments<br />
to the terms of reference for the Supervisory Board, Chairman’s Committee<br />
and Nomination Committee were resolved, with the aim of implementing all of the<br />
new recommendations of the Code. Furthermore, we approved an adjustment to the<br />
plan conditions for the restricted incentive and equity awards issued to the Management<br />
Board members in 2010. Mr. Lamberti reported to us on the bank’s IT infrastructure,<br />
the governance of GTO and ongoing challenges facing the banking sector.<br />
Mr. Krause presented the strategic and fi nancial objectives of the complexity reduction<br />
program as well as a progress report on the integration of Sal. Oppenheim and<br />
the commercial banking activities taken over from ABN AMRO <strong>Bank</strong> in the Netherlands.<br />
In addition, we approved the Management Board resolution to raise our participation<br />
in Hua Xia <strong>Bank</strong> in China to 19.99 % within the framework of its capital increase<br />
as well as the proposal submitted by the Chairman’s Committee regarding the termination<br />
of Mr. Cohrs’s service agreement.<br />
At an extraordinary meeting on September 12, 2010, based on the recommendation<br />
of the Chairman’s Committee, we consented to the Management Board resolutions<br />
taken on the same day to submit a public takeover off er to the shareholders of<br />
<strong>Deutsche</strong> Postbank AG and to increase the share capital of the bank.<br />
At the last meeting of the year on October 27, 2010, we were informed of the development<br />
of business in the third quarter and of the status of the takeover off er submitted<br />
to shareholders of <strong>Deutsche</strong> Postbank AG. Together with the Management Board,<br />
we discussed in detail the bank’s further strategic development along with the corresponding<br />
targets and planned measures. Mr. Lamberti presented to us the <strong>Deutsche</strong><br />
<strong>Bank</strong> Human Resources <strong>Report</strong>. Furthermore, changes to the Terms of Reference<br />
for the Management Board, including the Business Allocation Plan, and to the Terms<br />
of Reference for the Audit Committee, based on the Minimum Requirements for<br />
the Compliance Function were discussed and approved. Finally, we determined the<br />
objectives for the composition of the Supervisory Board.<br />
12
<strong>Deutsche</strong> <strong>Bank</strong><br />
<strong>Annual</strong> Review 2010<br />
<strong>Report</strong> of the Supervisory Board<br />
The Committees of the Supervisory Board<br />
The Chairman’s Committee met ten times during the reporting period. In addition,<br />
two telephone conferences took place. Between the meetings, the Chairman of the<br />
Chairman’s Committee spoke with the Committee members regularly about issues<br />
of major importance. The Committee examined, in particular, the new statutory and<br />
regulatory requirements for Management Board compensation and their implementation,<br />
the preparations for determining the variable compensation for the 2009<br />
fi nancial year, issues of succession planning and the termination of the Management<br />
Board appointment of Mr. Cohrs. Discussions also focussed on the amendments<br />
required to the terms of reference for the Management Board and the Supervisory<br />
Board and its committees as well as changes to the Management Board’s Business<br />
Allocation Plan. In addition, the Chairman’s Committee prepared resolutions for the<br />
Supervisory Board and gave its approval to Management Board members for their<br />
ancillary activities or to accept directorships at other companies. Furthermore, based<br />
on the authorization of the Supervisory Board, it approved the fi nal structure of the<br />
bank’s capital increase. Finally, it handled the implementation of the new recommendations<br />
and suggestions of the German Corporate Governance Code.<br />
At its six meetings, the Risk Committee discussed the bank’s exposures subject to<br />
mandatory approval under German law and the Articles of Association. Where<br />
necessary, the Risk Committee gave its approval. Apart from credit, liquidity, country,<br />
market and operational risks, the Committee also addressed legal and reputational<br />
risks. The Committee’s discussions extensively covered the bank’s risk position along<br />
with the developments of the sovereign debt crisis in Europe and their impacts on the<br />
bank. In addition to the development of risks relating to leveraged fi nance, commercial<br />
real estate fi nance and monoline insurers, the Committee discussed in detail the<br />
eff ects of the new regulatory rules on the bank and its risk position. Furthermore, the<br />
Committee focussed on the risk absorption capacity, i.e. the ratio between available<br />
and required capital (reporting in accordance with ICAAP ) including a comparison<br />
of the economic risks to the risk coverage potential and its consistent incorporation<br />
in risk management, and on the development of the bank’s refi nancing and liquidity<br />
position. Also, global industry portfolios were presented according to a specifi ed plan<br />
and discussed at length.<br />
The Audit Committee met six times in 2010. Representatives of the bank’s auditor<br />
participated regularly in these meetings. Subjects covered were the audit of the<br />
<strong>Annual</strong> Financial Statements and Consolidated Financial Statements for 2009, the<br />
quarterly fi nancial statements, Forms 20-F and 6-K for the U.S. Securities and<br />
Exchange Commission ( SEC ), as well as the interim reports. The Committee dealt with<br />
the proposal for the election of the auditor for the 2010 fi nancial year, issued the audit<br />
mandate, specifi ed audit areas of focus, resolved on the auditor’s remuneration<br />
and verifi ed the auditor’s independence in accordance with the requirements of the<br />
German Corporate Governance Code and the rules of the U.S. Public Company<br />
Accounting Oversight Board ( PCAOB ). The Audit Committee is convinced that, as in<br />
the previous years, there are no confl icts of interest on the part of the bank’s auditor.<br />
13
<strong>Deutsche</strong> <strong>Bank</strong><br />
<strong>Annual</strong> Review 2010<br />
<strong>Report</strong> of the Supervisory Board<br />
It checked in detail to what extent our internal control systems are in accordance<br />
with the requirements of the Sarbanes-Oxley Act. The Committee assured itself of<br />
the eff ectiveness of the system of internal controls, risk management and internal<br />
audit and monitored the fi nancial reporting and accounting process. When necessary,<br />
resolutions were passed or recommendations were issued for the Supervisory<br />
Board’s approval. The Audit Committee had reports submitted to it regularly on the<br />
engagement of accounting fi rms, including the auditor, with non-audit-related tasks,<br />
on the work of internal audit, on issues relating to compliance, on legal and reputational<br />
risks as well as on special investigations and signifi cant fi ndings of regulatory<br />
authorities. Internal Audit’s plan for the year was noted with approval. The Audit<br />
Committee did not receive any complaints in connection with accounting, internal<br />
accounting controls and auditing matters. At the last meeting of the year, the Committee<br />
obtained information from the Management Board and the auditor on key<br />
topics in planning for the <strong>Annual</strong> Financial Statements for 2010. These included,<br />
above all, the initial consolidation of <strong>Deutsche</strong> Postbank AG, Sal. Oppenheim and<br />
the business units acquired from ABN AMRO <strong>Bank</strong> in the Netherlands, the measures<br />
to prepare for the audit of the <strong>Annual</strong> Financial Statements and the areas of<br />
audit focus pursuant to Section 30 of the German <strong>Bank</strong>ing Act ( KWG ). Furthermore,<br />
it received reports on the replacement of IAS 39 and the introduction of IFRS 9 for<br />
fi nancial instruments, as well as on steps taken and further plans for in the complexity<br />
reduction program.<br />
The Nomination Committee held two informal meetings relating to succession issues<br />
on the Supervisory Board.<br />
Meetings of the Mediation Committee, established pursuant to the provisions of<br />
Germany’s Co-Determination Act (MitbestG), were not necessary in 2010.<br />
The committee chairmen reported regularly to the Supervisory Board on the work<br />
of the committees.<br />
In 2010, all Supervisory Board members participated in the meeting of Supervisory Board<br />
and their respective committees with only few exceptions (average atten dance: 95 % ).<br />
Corporate Governance<br />
Implementation of the new recommendations of the German Corporate Governance<br />
Code was discussed at the Supervisory Board and Chairman’s Committee meetings<br />
in July 2010. The Supervisory Board resolved to implement all of the new recommendations<br />
of the Code and accordingly amended the terms of reference for the Supervisory<br />
Board, Chairman’s Committee, Nomination Committee and Management Board<br />
as necessary.<br />
In addition, the Chairman’s Committee and Supervisory Board addressed the implementation<br />
of the new regulations on Management Board compensation at several<br />
meetings. For the review of the structure of the Management Board’s compensation<br />
system and of the appropriateness of the variable compensation for the 2010 fi nancial<br />
year, the Supervisory Board resolved to engage an independent legal advisor and a<br />
compensation consultant.<br />
Furthermore, at the meeting in October 2010, based on a proposal by the Chairman’s<br />
Committee and in accordance with No. 5.4.1 of the German Corporate Governance<br />
Code, we determined the objectives for the composition of the Supervisory Board.<br />
See pages 375 ff . of the Corporate Governance <strong>Report</strong> in the Financial <strong>Report</strong> 2010.<br />
14
<strong>Deutsche</strong> <strong>Bank</strong><br />
<strong>Annual</strong> Review 2010<br />
<strong>Report</strong> of the Supervisory Board<br />
As resolved in October 2009, effi ciency reviews on the basis of company-specifi c<br />
questionnaires were carried out in spring 2010, not only for the Supervisory Board<br />
as a whole, but also for the Chairman’s, Audit and Risk Committees, and the results<br />
were presented and discussed in detail at the subsequent meetings. We are of the<br />
opinion that the work of the Supervisory Board is carried out effi ciently and that<br />
a high stan dard was achieved in this context. Suggestions and measures that had<br />
been recommended in the previous review of the Supervisory Board’s effi ciency were<br />
eff ectively implemented and led to a further increase in the effi ciency of the work<br />
of the Supervisory Board and its committees. In addition, initial suggestions from the<br />
effi ciency reviews were already implemented in 2010.<br />
We determined that the Supervisory Board has what we consider to be an adequate<br />
number of independent members. We also determined that all members of the Audit<br />
Committee are independent as defi ned by the implementation rules of the Securities<br />
and Exchange Commission ( SEC ) issued pursuant to Section 407 of the Sarbanes-<br />
Oxley Act of 2002. Dr. Börsig and Dr. Eick were named as Audit Committee fi nancial<br />
experts in accordance with the regulations of the SEC as well as Sections 107 ( 4 ) and<br />
100 ( 5 ) of the German Stock Corporation Act (AktG).<br />
The Declaration of Conformity pursuant to Section 161 of the German Stock Corporation<br />
Act (AktG), last issued by the Supervisory Board and Management Board in<br />
October 2009 and updated in January 2010, was reissued at the meeting of the Supervisory<br />
Board on October 27, 2010. <strong>Deutsche</strong> <strong>Bank</strong> AG complies, without exception,<br />
with all of the recommendations in the version of the Code dated May 26, 2010.<br />
A com prehensive presentation of the bank’s corporate governance, including the<br />
text of the Declaration of Conformity issued on October 27, 2010, can be found in the<br />
Financial <strong>Report</strong> 2010 on pages 375 ff . and on our Internet website at http: // www.<br />
deutsche-bank.com / ir / en / content / corporate_governance.htm. The terms of reference<br />
for the Supervisory Board and its committees as well as for the Management<br />
Board are also published there, each in their currently applicable versions.<br />
Training and Further Education Measures<br />
Members of the Supervisory Board completed the training and further education<br />
mea sures required for their tasks on their own. <strong>Deutsche</strong> <strong>Bank</strong> provided the appropriate<br />
support to them in this context. New members joining the Supervisory Board in<br />
2010 were given orientation individually tailored to their levels of knowledge, a package<br />
of information material and opportunities for internal and external training, which<br />
were widely used. All of the members of the Supervisory Board were informed of<br />
the legal basis of the Supervisory Board’s work as part of a workshop carried out by<br />
an external attorney. Furthermore, another external attorney spoke to them on the<br />
Supervisory Board’s responsibilities and task. During the reporting year, two internal<br />
workshops were held for members of the Risk Committee on issues relating to credit,<br />
market and operational risks as well as the economic capital model ( ICAAP ). Together<br />
with staff members of the Finance department and the auditor, the Audit Committee<br />
members discussed the new regulations on accounting and fi nancial reporting. In<br />
addition, members of the Supervisory Board were informed of new developments in<br />
corporate governance.<br />
15
<strong>Deutsche</strong> <strong>Bank</strong><br />
<strong>Annual</strong> Review 2010<br />
<strong>Report</strong> of the Supervisory Board<br />
Confl icts of Interest and Their Handling<br />
The Risk Committee dealt with the loan approvals required pursuant to Section 15<br />
of the German <strong>Bank</strong>ing Act ( KWG ). Supervisory Board members who were also board<br />
members of the respective borrowing company when the resolutions were taken,<br />
or who might have faced a possible confl ict of interests for other reasons, did not participate<br />
in the discussion and voting.<br />
In September 2010, Professor Kagermann did not participate in the discussion of and<br />
voting on the submission of a public takeover off er to the shareholders of <strong>Deutsche</strong><br />
Postbank AG owing to his membership on the Supervisory Board of <strong>Deutsche</strong> Post AG<br />
and thus a possible confl ict of interests in this context.<br />
Occasionally, there were latent confl icts of interest on the part of individual Supervisory<br />
Board members. During the reporting period, Ms. Förster and Ms. Ruck were<br />
also members of the Supervisory Board of <strong>Deutsche</strong> <strong>Bank</strong> Privat- und Geschäftskunden<br />
AG as representatives of the employees. They did not participate in the discussions<br />
of and voting on topics relating to their work, such as resolutions pursuant<br />
to Section 32 of the German Co-determination Act (MitbestG). Additional special<br />
measures to address these latent and only occasional confl icts of interest were<br />
not required.<br />
Litigation<br />
As in the preceding years, the Supervisory Board was regularly informed of important<br />
lawsuits and discussed further courses of action. These included the actions for<br />
rescission and to obtain information fi led in connection with the General Meetings<br />
in 2004, 2005, 2006, 2007, 2008, 2009 and 2010, as well as the lawsuits brought against<br />
<strong>Deutsche</strong> <strong>Bank</strong> and Dr. Breuer by Dr. Kirch and KGL Pool GmbH. The General Meeting’s<br />
election of shareholder representatives on May 29, 2008, was contested by several<br />
shareholders. The case is currently before Germany’s Supreme Court, which will rule<br />
on the admissibility of an appeal against the decision taken by the Higher Regional<br />
Court Frankfurt am Main to dismiss the complaint.<br />
Furthermore, reports concerning important lawsuits were presented to the Supervisory<br />
Board on a regular basis and, in detail, to the Audit and Risk Committees.<br />
<strong>Annual</strong> Financial Statements<br />
KPMG Aktiengesellschaft Wirtschaftsprüfungsgesellschaft, the auditor of the <strong>Annual</strong><br />
Financial Statements elected at last year’s General Meeting, has audited the accounting,<br />
the <strong>Annual</strong> Financial Statements and the Management <strong>Report</strong> for 2010 as well as the<br />
Consolidated Financial Statements with the related Notes and Management <strong>Report</strong><br />
for 2010. The audits led in each case to an unqualifi ed opinion. The Audit Committee<br />
examined the documents for the <strong>Annual</strong> Financial Statements and Consolidated<br />
Financial Statements, along with the auditor’s report, and discussed these extensively<br />
with the auditor. The Chairman of the Audit Committee reported to us on this at today’s<br />
meeting of the Supervisory Board. We agreed with the results of the audits after inspecting<br />
the auditor’s reports and documents for the the <strong>Annual</strong> Financial Statements<br />
and Consolidated Financial Statements, and after an extensive discussion, we agreed<br />
to the recommendation of the Audit Committee and determined that, also based on<br />
the results of our inspections, there were no objections to be raised.<br />
16
<strong>Deutsche</strong> <strong>Bank</strong><br />
<strong>Annual</strong> Review 2010<br />
<strong>Report</strong> of the Supervisory Board<br />
Today, we approved the <strong>Annual</strong> Financial Statements and Consolidated Financial<br />
Statements prepared by the Management Board; the <strong>Annual</strong> Financial Statements<br />
are thus established. We agree to the Management Board’s proposal for the appropriation<br />
of profi ts.<br />
Personnel Issues<br />
With eff ect from the end of September 30, 2010, Mr. Cohrs retired from the Management<br />
Board. His functional responsibilities were assumed by Mr. Jain in addition<br />
to his existing tasks.<br />
There were changes in the composition of the Supervisory Board. Mr. Wunderlich<br />
was a member of the Supervisory Board until June 30, 2010. He was replaced for the<br />
remainder of his term of offi ce by Mr. Kazmierczak. Ms. Förster was a member of<br />
the Supervisory Board until July 31, 2010. She was replaced for the remainder of her<br />
term of offi ce by Mr. Viertel.<br />
We thank the members who left last year for their dedicated work on the Supervisory<br />
Board and for their constructive assistance to the company and the Management<br />
Board in recent years.<br />
The Supervisory Board<br />
Dr. Clemens Börsig<br />
Chairman<br />
Frankfurt am Main, March 11, 2011<br />
17
<strong>Deutsche</strong> <strong>Bank</strong><br />
<strong>Annual</strong> Review 2010<br />
Supervisory Board<br />
Supervisory Board<br />
Dr. Clemens Börsig<br />
Chairman,<br />
Frankfurt am Main<br />
Karin Ruck*<br />
Deputy Chairperson,<br />
<strong>Deutsche</strong> <strong>Bank</strong> AG,<br />
Bad Soden am Taunus<br />
Wolfgang Böhr*<br />
<strong>Deutsche</strong> <strong>Bank</strong> AG,<br />
Dusseldorf<br />
Dr. Karl-Gerhard Eick<br />
Management consultant,<br />
KGE Asset Management Consulting Ltd.,<br />
London<br />
Heidrun Förster*<br />
until July 31, 2010,<br />
<strong>Deutsche</strong> <strong>Bank</strong> Privat- und<br />
Geschäftskunden AG,<br />
Berlin<br />
Alfred Herling*<br />
<strong>Deutsche</strong> <strong>Bank</strong> AG,<br />
Wuppertal<br />
Gerd Herzberg*<br />
Deputy Chairman of ver.di<br />
Vereinte Dienstleistungsgewerkschaft,<br />
Hamburg<br />
Sir Peter Job<br />
London<br />
Prof. Dr. Henning Kagermann<br />
President of acatech – German<br />
Academy of Science and Engineering,<br />
Königs Wusterhausen<br />
Peter Kazmierczak*<br />
from July 1, 2010,<br />
<strong>Deutsche</strong> <strong>Bank</strong> AG,<br />
Herne<br />
Martina Klee*<br />
<strong>Deutsche</strong> <strong>Bank</strong> AG,<br />
Frankfurt am Main<br />
* Elected by our employees<br />
in Germany.<br />
Suzanne Labarge<br />
Toronto<br />
Maurice Lévy<br />
Chairman and Chief Executive<br />
Offi cer of Publicis Groupe S.A.,<br />
Paris<br />
Henriette Mark*<br />
<strong>Deutsche</strong> <strong>Bank</strong> AG,<br />
Munich<br />
Gabriele Platscher*<br />
<strong>Deutsche</strong> <strong>Bank</strong> Privat- und<br />
Geschäftskunden AG,<br />
Braunschweig<br />
Dr. Theo Siegert<br />
Managing Partner of<br />
de Haen Carstanjen & Söhne,<br />
Dusseldorf<br />
Dr. Johannes Teyssen<br />
Chairman of the<br />
Management Board of E.ON AG<br />
from May 1, 2010,<br />
Oberding<br />
Marlehn Thieme*<br />
<strong>Deutsche</strong> <strong>Bank</strong> AG,<br />
Bad Soden am Taunus<br />
Tilman Todenhöfer<br />
Managing Partner of Robert Bosch<br />
Industrietreuhand KG,<br />
Madrid<br />
Stefan Viertel*<br />
from August 1, 2010,<br />
<strong>Deutsche</strong> <strong>Bank</strong> AG,<br />
Bad Soden am Taunus<br />
Werner Wenning<br />
Chairman of the Management<br />
Board of Bayer AG<br />
until September 30, 2010,<br />
Leverkusen<br />
Leo Wunderlich*<br />
until June 30, 2010,<br />
<strong>Deutsche</strong> <strong>Bank</strong> AG,<br />
Mannheim<br />
18
<strong>Deutsche</strong> <strong>Bank</strong><br />
<strong>Annual</strong> Review 2010<br />
Supervisory Board<br />
Committees<br />
Chairman’s Committee<br />
Dr. Clemens Börsig<br />
Chairman<br />
Heidrun Förster*<br />
until July 31, 2010<br />
Alfred Herling*<br />
from August 1, 2010<br />
Karin Ruck*<br />
Tilman Todenhöfer<br />
Mediation Committee<br />
Dr. Clemens Börsig<br />
Chairman<br />
Wolfgang Böhr*<br />
Karin Ruck*<br />
Tilman Todenhöfer<br />
Audit Committee<br />
Dr. Karl-Gerhard Eick<br />
Chairman<br />
Dr. Clemens Börsig<br />
Sir Peter Job<br />
Henriette Mark*<br />
Karin Ruck*<br />
Marlehn Thieme*<br />
* Elected by our employees<br />
in Germany.<br />
Risk Committee<br />
Dr. Clemens Börsig<br />
Chairman<br />
Sir Peter Job<br />
Prof. Dr. Henning Kagermann<br />
Suzanne Labarge<br />
Substitute Member<br />
Dr. Theo Siegert<br />
Substitute Member<br />
Nomination Committee<br />
Dr. Clemens Börsig<br />
Chairman<br />
Tilman Todenhöfer<br />
Werner Wenning<br />
19
<strong>Deutsche</strong> <strong>Bank</strong><br />
<strong>Annual</strong> Review 2010<br />
Patrick Lemmens<br />
Rotterdam<br />
In my view, <strong>Deutsche</strong> <strong>Bank</strong> has achieved<br />
good results for all its stakeholders:<br />
equity investors, employees, customers<br />
and society at large. But we continue<br />
to be critical in a constructive way and<br />
want <strong>Deutsche</strong> <strong>Bank</strong> to be cost effi cient<br />
with a stable and solid return.<br />
Patrick Lemmens,<br />
Portfolio Manager,<br />
Robeco Institutional Asset Management B.V.,<br />
Rotterdam<br />
20
<strong>Deutsche</strong> <strong>Bank</strong><br />
<strong>Annual</strong> Review 2010<br />
21
01 -<br />
<strong>Deutsche</strong> <strong>Bank</strong> Group<br />
Corporate profi le and overview – 23<br />
Investments in the future<br />
Corporate Governance – 27<br />
The foundation for long-term success<br />
In the interests of our partners – 29<br />
Strength for our shareholders, clients,<br />
staff and society
<strong>Deutsche</strong> <strong>Bank</strong><br />
<strong>Annual</strong> Review 2010<br />
01 – <strong>Deutsche</strong> <strong>Bank</strong> Group<br />
Corporate profi le and overview<br />
Corporate profi le and overview<br />
Investments in the future<br />
<strong>Deutsche</strong> <strong>Bank</strong> is a leading global investment bank with a substantial private clients<br />
franchise. Its businesses are mutually reinforcing. Our diversifi ed business model<br />
enabled us to weather the fi nancial crisis signifi cantly better than many of our peers<br />
using our own resources. From this strong position, we made several strategic acquisitions<br />
in 2010. These investments in the future were also refl ected in the title “<strong>Bank</strong><br />
of the Year” awarded to us by the prestigious magazine International Financial Review.<br />
Management structure<br />
The prime responsibilities of <strong>Deutsche</strong> <strong>Bank</strong> AG’s Management Board include the<br />
Group’s strategic management, resource allocation, fi nancial accounting and reporting,<br />
risk management, and corporate control. It is supported in the performance<br />
of its leadership and oversight duties by central infrastructure units and other service<br />
departments, as well as functional bodies chaired by Management Board members.<br />
Management Board member Anshu Jain assumed Michael Cohrs’s responsibility<br />
for Global <strong>Bank</strong>ing on July 1, 2010, and has since been the sole Head of the Corporate<br />
& In vestment <strong>Bank</strong> Group Division. Michael Cohrs retired from the Management<br />
Board on September 30, 2010.<br />
The Group Executive Committee ( GEC ) is made up of the members of the Management<br />
Board, the Heads of the core businesses who are not members of the Manage ment<br />
Board, as well as the Head of the Americas Region. Eff ective from January 1, 2011, the<br />
Head of Asia Pacifi c (excluding Japan) was appointed to the GEC. His appointment<br />
as a new member underlines the strategic importance of this region as one of our key<br />
growth drivers. At regular meetings, the GEC analyzes the development of the business<br />
divisions, discusses matters of Group strategy and draws up recommendations that<br />
are presented to the Management Board. Josef Ackermann chairs both the Management<br />
Board and the GEC.<br />
Management structure<br />
Corporate &<br />
Investment <strong>Bank</strong><br />
Functional Committees<br />
Group Executive Committee<br />
Management Board<br />
Business Heads / Regional Heads<br />
Corporate<br />
Investments<br />
Regional Committees<br />
Private Clients and<br />
Asset Management<br />
23
<strong>Deutsche</strong> <strong>Bank</strong><br />
<strong>Annual</strong> Review 2010<br />
01 – <strong>Deutsche</strong> <strong>Bank</strong> Group<br />
Corporate profi le and overview<br />
Group Divisions<br />
<strong>Deutsche</strong> <strong>Bank</strong> is made up of the following Group Divisions: Corporate & Investment<br />
<strong>Bank</strong> ( CIB ), Private Clients and Asset Management ( PCAM ) and Corporate Investments ( CI ).<br />
Corporate & Investment <strong>Bank</strong><br />
CIB is responsible for <strong>Deutsche</strong> <strong>Bank</strong>’s capital markets business, comprising the origination,<br />
sales and trading of capital markets products including debt, equity, and other<br />
securities, together with our corporate advisory, corporate lending and transaction<br />
banking businesses. Our clients are institutions – both public sector entities, from<br />
medium-sized businesses to large multinational corporations. CIB is subdivided into<br />
two Corporate Divisions: Corporate <strong>Bank</strong>ing & Securities ( CB & S ) and Global Transaction<br />
<strong>Bank</strong>ing ( GTB ). Corporate <strong>Bank</strong>ing & Securities comprises our Markets and Corporate<br />
Finance businesses, and covers <strong>Deutsche</strong> <strong>Bank</strong> Group’s origination, sales and trading<br />
of securities, corporate advisory and M & A businesses worldwide, together with other<br />
corporate fi nance activities. Global Transaction <strong>Bank</strong>ing covers <strong>Deutsche</strong> <strong>Bank</strong>’s cash<br />
management for corporate and fi nancial institutions, trade fi nance business as well<br />
as trust & securities services.<br />
Private Clients and Asset Management<br />
PCAM is made up of two Corporate Divisions: Asset and Wealth Management ( AWM )<br />
and Private & Business Clients ( PBC ). Asset and Wealth Management comprises the<br />
Asset Management ( AM ) and Private Wealth Management ( PWM ) Business Divisions.<br />
AM provides retail clients across the globe with mutual fund products through our<br />
DWS franchise. It also off ers institutional clients, including pension funds and insurance<br />
companies, a broad range of services from traditional to alternative investment<br />
products. PWM serves high net worth individuals and families worldwide. It provides<br />
these very discerning clients with a fully-integrated wealth management service,<br />
including inheritance planning and philanthropic advisory services.<br />
Private & Business Clients ( PBC ) provides a full range of traditional banking products,<br />
including current accounts, deposits and loans, and investment management and<br />
pension products mainly to private and self-employed individuals, and small to<br />
medium-sized businesses. Outside Germany, PBC has for years operated in Italy,<br />
Spain, Belgium and Portugal, and for some years now in Poland. We are also making<br />
focused investments in the fast-growing Chinese and Indian markets.<br />
24
<strong>Deutsche</strong> <strong>Bank</strong><br />
<strong>Annual</strong> Review 2010<br />
01 – <strong>Deutsche</strong> <strong>Bank</strong> Group<br />
Corporate profi le and overview<br />
Corporate Investments<br />
The Corporate Investments ( CI ) Group Division manages <strong>Deutsche</strong> <strong>Bank</strong>’s global principal<br />
investment activities. These include certain credit exposures, certain private<br />
equity and venture capital investments, certain corporate real estate investments, our<br />
industrial holdings and certain other non-strategic investments.<br />
Our strategy – Management Agenda Phase 4<br />
In the year under review we consistently implemented Phase 4 of the Management<br />
Agenda, which was launched in December 2009. This sets out the following objectives:<br />
Increasing the profi tability and the quality of earnings in the Corporate & Investment<br />
<strong>Bank</strong> with renewed risk and balance sheet discipline. We aim to create earnings<br />
and cost synergies through closer integration of Markets, Corporate Finance and<br />
Global Transaction <strong>Bank</strong>ing. Moreover, we are integrating the commercial banking<br />
activities acquired from ABN AMRO in the Netherlands, thereby extending our franchise<br />
with small and medium-sized enterprises.<br />
In PCAM, concentrating on core businesses and home market leadership. In AWM<br />
our focus is on realizing higher profi ts and further growth through the measures<br />
implemented to increase effi ciency and cut costs, as well as on further leveraging<br />
our strengths in Germany. We are making good progress towards the fully integration<br />
of Sal. Oppenheim in PWM, which enables us to build on our market leadership<br />
in advising wealthy clients in Germany. In PBC, our key priority is now the<br />
integration of <strong>Deutsche</strong> Postbank, following majority ownership and consolidation<br />
achieved in 2010. Through the realignment of the PCAM Corporate Division we aim<br />
to consolidate our leading position in German retail banking and achieve a more<br />
balanced earnings structure.<br />
Focussing on Asia as a key driver of growth and momentum around the world.<br />
Building on our current position, we aim to further leverage the enormous potential<br />
of this region to achieve above average growth in our businesses there. Our<br />
objective is to be one of the best three to fi ve providers, depending on the business<br />
area. We are making the necessary investments and providing the resources this<br />
requires.<br />
25
<strong>Deutsche</strong> <strong>Bank</strong><br />
<strong>Annual</strong> Review 2010<br />
01 – <strong>Deutsche</strong> <strong>Bank</strong> Group<br />
Corporate profi le and overview<br />
Reinvigorating our performance culture. In order to increase effi ciency across our<br />
business areas, we are maintaining our focus on cost discipline, optimizing infrastructure<br />
processes and reducing complexity wherever possible. We have identifi<br />
ed potential effi ciency gains from this complexity reduction amounting to € 1 billion,<br />
which should have their full impact in <strong>2012</strong>.<br />
We are very confi dent that with this strategy we are well positioned to continue our<br />
success story even in fast changing markets and an increasingly regulated environment.<br />
Global presence<br />
New York<br />
London<br />
Frankfurt<br />
am Main<br />
Regional major hub<br />
Capital of country in which we are represented<br />
Singapore<br />
Dubai<br />
Tokyo<br />
26
<strong>Deutsche</strong> <strong>Bank</strong><br />
<strong>Annual</strong> Review 2010<br />
01 – <strong>Deutsche</strong> <strong>Bank</strong> Group<br />
Corporate Governance<br />
Corporate Governance<br />
The foundation for long-term success<br />
Eff ective corporate governance in accordance with high international standards is a<br />
matter of course for us. The essential framework for this is provided, fi rst and foremost,<br />
by the German Stock Corporation Act and the German Corporate Governance<br />
Code. As our share is also listed on the New York Stock Exchange, we are also subject<br />
to the relevant U.S. capital market laws as well as the rules of the Securities and<br />
Exchange Commission ( SEC ) and New York Stock Exchange.<br />
Our system of corporate governance provides the basis for the responsible management<br />
and control of <strong>Deutsche</strong> <strong>Bank</strong>, with a focus on sustainable value creation. It has<br />
four key elements: good relations with shareholders, eff ective cooperation between<br />
the Management Board and Supervisory Board, a performance-based compensation<br />
system with a sustainable and long-term focus, as well as transparent and timely<br />
reporting.<br />
Shareholders<br />
As required by law, our shareholders participate in decisions of material importance<br />
to the bank, including amendments to the Articles of Association, the appropriation<br />
of profi t, the authorization to issue new shares and important structural changes.<br />
<strong>Deutsche</strong> <strong>Bank</strong> has only one class of shares, with each share carrying one voting right.<br />
To make it easier for our shareholders to exercise their voting rights, we off er absentee<br />
voting and support the use of electronic media for the <strong>Annual</strong> General Meeting.<br />
For example, shareholders can issue authorizations and voting instructions to <strong>Deutsche</strong><br />
<strong>Bank</strong>’s proxies through the internet.<br />
Management Board<br />
The Management Board is responsible for managing the company and exercises control<br />
over <strong>Deutsche</strong> <strong>Bank</strong> Group companies. It ensures compliance with all provisions<br />
of law and company internal policies. In appointing people to management functions<br />
in the company, the Management Board takes diversity into account. The members<br />
of the Management Board together with the heads of the bank’s core businesses<br />
who are not members of the Management Board as well as the head of <strong>Deutsche</strong><br />
<strong>Bank</strong> Americas and the head of <strong>Deutsche</strong> <strong>Bank</strong> Asia Pacifi c (ex Japan) form the Group<br />
Executive Committee ( GEC ). This committee analyzes the development of the business<br />
divisions, discusses matters of Group strategy and prepares recommendations<br />
for decisions taken by the Management Board.<br />
Supervisory Board<br />
The Supervisory Board oversees and advises the Management Board in its management<br />
of the business. Major decisions aff ecting the bank require Supervisory Board<br />
approval. It specifi es the information and reporting duties of the Management Board,<br />
appoints the members of the Management Board, and draws up long-term plans<br />
for their succession together with the Management Board. The Supervisory Board<br />
reviews the effi ciency of its work annually. In addition to the Mediation Committee<br />
required by law, the Supervisory Board has established a Chairman’s Committee,<br />
Audit Committee, Risk Committee and Nomination Committee.<br />
To carry out its tasks, the Supervisory Board takes care to ensure a balanced composition<br />
and that its members possess the required knowledge, ability and expertise.<br />
Furthermore, the Supervisory Board respects diversity in the company, in particular<br />
when appointing members to the Management Board and making proposals for the<br />
election of the Supervisory Board. In light of the bank’s international activities, the<br />
Supervisory Board has an appropriate number of members with long-term international<br />
experience. The Supervisory Board also has a suffi cient number of independent<br />
members.<br />
27
<strong>Deutsche</strong> <strong>Bank</strong><br />
<strong>Annual</strong> Review 2010<br />
01 – <strong>Deutsche</strong> <strong>Bank</strong> Group<br />
Corporate Governance<br />
Compensation<br />
The compensation of the Management Board members is primarily aligned to the<br />
sustainable, long-term success of the bank. The factors for determining variable compensation<br />
are individual performance as well as, on the one hand, the bank’s planned<br />
and actually achieved two-year average return on equity, and on the other hand, the<br />
relative performance of the bank’s share over a three-year period compared to a<br />
selected group of our peers. A substantial part of the variable compensation is awarded<br />
on a deferred basis, subject to a possible clawback and largely equity-based. To a<br />
reasonable extent, the deferred variable compensation is subject to the sustained<br />
performance of <strong>Deutsche</strong> <strong>Bank</strong>, positive or negative.<br />
Members of the Supervisory Board receive compensation comprised of a fi xed and<br />
a variable component. The variable compensation is linked to the achievement of<br />
ambitious targets, the dividend and the three-year average earnings per share. The<br />
chair and deputy chair of the Supervisory Board as well as the chair and members of<br />
the Supervisory Board committees receive additional compensation.<br />
The individual compensation of the members of the Management Board and the<br />
Supervisory Board as well as the structure of our remuneration system are published<br />
in the Compensation <strong>Report</strong>. Please refer to the Financial <strong>Report</strong> 2010, page 128 ff .<br />
Financial reporting<br />
Shareholders and the public are regularly kept up to date through the <strong>Annual</strong> <strong>Report</strong>,<br />
including the Consolidated Financial Statements, as well as the Interim <strong>Report</strong>s.<br />
The reporting of <strong>Deutsche</strong> <strong>Bank</strong> Group is in accordance with International Financial<br />
<strong>Report</strong>ing Standards ( IFRS ). This provides for a high degree of transparency in fi nancial<br />
reporting and facilitates comparability with our international peers.<br />
Declaration of Conformity<br />
On October 27, 2010, the Management Board and Supervisory Board amended the<br />
annual Declaration of Conformity pursuant to § 161 of the German Stock Corporation<br />
Act. <strong>Deutsche</strong> <strong>Bank</strong> AG acts in conformity with the recommendations of the German<br />
Corporate Governance Code in the version dated May 26, 2010, without any exceptions.<br />
Our detailed Corporate Governance <strong>Report</strong>, along with the Declaration of Conformity<br />
for 2010 and other documents on our corporate governance, such as the terms of<br />
reference for the Management Board, the Supervisory Board and its committees, are<br />
available on the Internet at www.deutsche-bank.com / corporate-governance.<br />
We continuously check our system of corporate governance in light of new events,<br />
statutory requirements and developments in domestic and international standards,<br />
and make the appropriate adjustments.<br />
28
<strong>Deutsche</strong> <strong>Bank</strong><br />
<strong>Annual</strong> Review 2010<br />
01 – 1<br />
Our Partners<br />
Shareholders<br />
Clients<br />
Staff<br />
Society<br />
01 – <strong>Deutsche</strong> <strong>Bank</strong> Group<br />
In the interests of our partners<br />
In the interests of our partners<br />
Strength for our shareholders, clients,<br />
staff and society<br />
In 2010 <strong>Deutsche</strong> <strong>Bank</strong> carried out major strategic investments and demonstrated its<br />
ability to generate strong earnings and growth. These achievements are the result<br />
of an excellent position in the markets, an astute business policy and a stable corporate<br />
structure borne by the talents of its diverse staff . This benefi ts our shareholders,<br />
clients, staff and society. Chart 01 – 1<br />
Shareholders<br />
It is in our shareholders’ best interests to continue to reduce risk-weighted assets and<br />
to strengthen our capital base. Our targeted acquisitions contribute to stabilizing and<br />
balancing our earning power. As <strong>Deutsche</strong> <strong>Bank</strong> came through the fi nancial crisis in<br />
better shape than many of its competitors, it can benefi t from the economic upturn<br />
directly. And that benefi ts our shareholders too. This also applies to our commitment<br />
to creating an effi cient regulatory framework, which will make the fi nancial system<br />
more resilient, while avoiding competitive distortions and unnecessary social costs.<br />
Clients<br />
For our clients, we are a reliable partner with a full range of fi nancial solutions suited<br />
to their individual needs. The streamlining and accelerated integration of our Corporate<br />
& Investment <strong>Bank</strong> Group Division translate into a higher quality of service and<br />
an enhanced product range. With our internationally competitive business model,<br />
we can assist our clients in building their success. And as a result of the expansion of<br />
the retail business, we are now in a position to off er a suitable range of products and<br />
services for all of our client groups in Germany.<br />
Staff<br />
<strong>Deutsche</strong> <strong>Bank</strong>’s success is primarily thanks to its staff members, who bring their<br />
passion to perform and expertise to furthering the company’s interests. We see the<br />
diversity of our employees as an asset both in our internal interactions as well as<br />
in our external relationships with our clients. We invest heavily in the professional<br />
and personal skills of our staff . Our performance-based remuneration structures are<br />
aligned to our long-term success and take account of recent lessons learned from<br />
the fi nancial crisis.<br />
Society<br />
We take the loss of confi dence that numerous banks have experienced since the<br />
start of the fi nancial crisis seriously. As one of the initiators and fi rst signatories,<br />
<strong>Deutsche</strong> <strong>Bank</strong> committed itself to the “Code for Responsible Business Conduct” in<br />
2010. By doing so, we intend to integrate social responsibility more decisively in our<br />
business policies and the underlying processes and to take these into account in all<br />
aspects of our decision-making. We recognize our responsibility to society. This is<br />
something upon which the community can rely. We are aware that we cannot continue<br />
to do business successfully in the long run without the acceptance of the society of<br />
which <strong>Deutsche</strong> <strong>Bank</strong> is a part.<br />
29
<strong>Deutsche</strong> <strong>Bank</strong><br />
<strong>Annual</strong> Review 2010<br />
Shareholders<br />
Record-level capital increase.<br />
01 – <strong>Deutsche</strong> <strong>Bank</strong> Group<br />
In the interests of our partners<br />
Structural Data<br />
2010 2009 2008<br />
Number of shareholders 640,623 586,295 581,938<br />
Shareholders by type in % of share capital1 Institutional ( including banks ) 75 74 71<br />
Private 25 26 29<br />
Regional breakdown in % of share capital1 Germany 47 46 55<br />
European Union ( excluding Germany ) 31 31 25<br />
Switzerland 6 6 7<br />
U.S.A. 13 16 11<br />
Other 3 1 2<br />
Key Figures<br />
2010 2009 2008<br />
Change in total return of <strong>Deutsche</strong> <strong>Bank</strong> share 2 ( 11.7 ) % 79.4 % ( 66.8 ) %<br />
Average daily trading volume ( in million shares ) 3 8.0 8.4 10.0<br />
Dividend per share for the fi nancial year ( in € ) 0.754 0.75 0.50<br />
Special Projects<br />
Capital increase from authorized capital<br />
Record-level share issue with gross proceeds of € 10.2 billion primarily for the acquisition of <strong>Deutsche</strong> Postbank AG.<br />
Issue of 308.6 million new shares at a subscription ratio of 2 : 1 and a subscription price of € 33 per share.<br />
Investor and analyst surveys Perception analyses among institutional investors to gauge the attractiveness of <strong>Deutsche</strong> <strong>Bank</strong>’s share as an<br />
investment. Online survey among investors and analysts on the quality of Investor Relations activities.<br />
1 Figures rounded<br />
2 Share price based on Xetra<br />
3 Orderbook statistics (Xetra)<br />
4 Proposal for the <strong>Annual</strong> General Meeting on May 26, 2011<br />
30
<strong>Deutsche</strong> <strong>Bank</strong><br />
<strong>Annual</strong> Review 2010<br />
Clients<br />
01 – <strong>Deutsche</strong> <strong>Bank</strong> Group<br />
In the interests of our partners<br />
Strong client relationships more important than ever.<br />
Structural Data<br />
2010 2009 2008<br />
Number of clients ( rounded )<br />
Corporate & Investment <strong>Bank</strong>1 54,400 41,600 42,600<br />
Private Clients and Asset Management Private & Business Clients 28,787,000 14,600,000 14,600,000<br />
thereof: <strong>Deutsche</strong> Postbank AG<br />
Asset & Wealth Management<br />
14,150,000 – –<br />
Retail Asset Management 2 ( Germany / Luxembourg ) 2,225,000 2,119,000 1,937,000<br />
thereof: in cooperation 464,000 389,000 230,000<br />
Institutional Asset Management 2,300 2,300 2,300<br />
Private Wealth Management 3 79,400 78,000 1 92,000<br />
Key Figures<br />
2010 2009 2008<br />
Corporate & Investment <strong>Bank</strong> Euromoney Primary Debt Poll, ranking 3 3 1<br />
Euromoney FX Poll, ranking 1 1 1<br />
Euromoney Awards for Excellence,<br />
number of awards won 16 15 21<br />
Risk Awards 5 2 3<br />
IFR Awards 8 7 1<br />
Private Clients and Asset Management DWS Investments<br />
Number of Performance Awards in Europe 76 53 109<br />
<strong>Deutsche</strong> Insurance Asset Management<br />
Award as Best Global Insurance Asset Manager 4 1 1 1<br />
Special Projects<br />
Corporate & Investment <strong>Bank</strong><br />
Increased integration of the Corporate & Investment <strong>Bank</strong> through streamlining, more closely connected divisions<br />
and higher growth.<br />
Completion of the acquisition of parts of ABN AMRO’s commercial banking activities in the Netherlands.<br />
Private Clients and Asset Management Acquisition of Sal. Oppenheim Group completed.<br />
Lead sponsorship for Christies’ auction house’s “Green Auction” in New York in April 2010, which raised U. S. $ 1.5<br />
million for four green not-for-profi t organizations.<br />
Majority shareholding in and consolidation of <strong>Deutsche</strong> Postbank AG.<br />
Berliner <strong>Bank</strong> transferred to the IT platform of Private & Business Clients.<br />
1 Change in counting method<br />
2 Including clients whose business relationship is managed by a cooperation partner<br />
3 Number of relationships excluding Private Client Services (U.S. A.), 2010 including Sal. Oppenheim<br />
4 Reactions Magazine<br />
31
<strong>Deutsche</strong> <strong>Bank</strong><br />
<strong>Annual</strong> Review 2010<br />
Staff<br />
Attractive employer.<br />
01 – <strong>Deutsche</strong> <strong>Bank</strong> Group<br />
In the interests of our partners<br />
Structural Data<br />
2010 2009 2008<br />
Staff ( full-time equivalents ) 1 102,062 77,053 80,456<br />
Divisions Private Clients and Asset Management 51.5 % 39.7 % 40.5 %<br />
Corporate & Investment <strong>Bank</strong> 2 15.7 % 18.5 % 18.5 %<br />
Infrastructure / Regional Management 32.8 % 41.8 % 41.0 %<br />
Regions Germany<br />
Europe ( excluding Germany ),<br />
48.3 % 35.5 % 34.7 %<br />
Middle East and Africa 23.3 % 28.6 % 28.7 %<br />
Americas 11.0 % 14.5 % 15.3 %<br />
Asia / Pacifi c 17.4 % 21.4 % 21.3 %<br />
Qualifi cations 3, 4 University degree 63.9 % 63.5 % 64.0 %<br />
High school certifi cate 15.5 % 19.1 % 17.3 %<br />
Other school degrees 20.6 % 17.4 % 18.7 %<br />
Age 3, 4 up to 24 years 7.6 % 8.4 % 9.9 %<br />
25 – 34 years 34.1 % 35.0 % 35.5 %<br />
35 – 44 years 32.7 % 32.2 % 31.7 %<br />
45 – 54 years 19.9 % 19.0 % 17.9 %<br />
over 54 years 5.8 % 5.4 % 5.0 %<br />
Key Figures 4<br />
2010 2009 2008<br />
Employee Commitment Index 74 77 74<br />
Employees leaving the bank for a new job 6.6 % 4.8 % 7.3 %<br />
Training ( expenses in € million ) 95 86 114<br />
Apprenticeship programs ( expenses in € million ) 41 41 41<br />
Special Projects<br />
dbAGILE<br />
Group Executive Committee-sponsored initiative fostering the individual development of 60 senior managers<br />
over the medium term.<br />
Check-up 40+ 8,700 employees have already taken part in this comprehensive health-check program available free of charge<br />
to all staff in Germany aged 40 and above. Similar programs exist in other countries.<br />
1 Staff ( full-time equivalent ) = total headcount adjusted proportionately for part-time staff , excluding apprentices and interns<br />
2 Including Corporate Investments<br />
3 Number of staff (headcount)<br />
4 Excluding <strong>Deutsche</strong> Postbank<br />
32
<strong>Deutsche</strong> <strong>Bank</strong><br />
<strong>Annual</strong> Review 2010<br />
Society<br />
Building social capital.<br />
01 – <strong>Deutsche</strong> <strong>Bank</strong> Group<br />
In the interests of our partners<br />
Structural Data<br />
2010 2009 2008<br />
Number of countries in which <strong>Deutsche</strong> <strong>Bank</strong> operates ( including off shore sites ) 74 72 72<br />
Key Figures<br />
in € million 2010 2009 2008<br />
Spending by <strong>Deutsche</strong> <strong>Bank</strong> on social responsibility activities 91.7 74.8 75.9<br />
thereof: <strong>Deutsche</strong> <strong>Bank</strong> Americas Foundation 6.8 9.5 8.8<br />
Corporate Citizenship UK 5.1 4.7 4.3<br />
<strong>Deutsche</strong> <strong>Bank</strong> Asia Foundation 3.0 3.7 3.7<br />
Spending by endowed <strong>Deutsche</strong> <strong>Bank</strong> foundations 6.4 6.3 6.4<br />
<strong>Deutsche</strong> <strong>Bank</strong> Foundation 4.5 4.9 5.0<br />
Other foundations 1.9 1.4 1.4<br />
Total 98.1 81.1 82.3<br />
Special Projects<br />
Ensuring viability<br />
Enabling talent<br />
World’s fi rst-ever platin LEED ( Leadership in Energy and Environmental Design ) Platinum certifi cation for the refurbishment<br />
of a high-rise building – <strong>Deutsche</strong> <strong>Bank</strong>’s Head Offi ce in Frankfurt am Main.<br />
Start of FairTalent, a program that supports young people from socially disadvantaged families and enables them<br />
to explore their full potential.<br />
Outstanding relief eff orts in response to natural disasters in Haiti, Chile and Pakistan.<br />
Wangechi Mutu recognized as fi rst “Artist of the Year”.<br />
Creating opportunity<br />
Fostering creativity<br />
Committing ourselves 17,000 <strong>Deutsche</strong> <strong>Bank</strong> employees participated in over 3,000 corporate volunteering projects worldwide.<br />
33
<strong>Deutsche</strong> <strong>Bank</strong><br />
<strong>Annual</strong> Review 2010<br />
Emma Quinn<br />
Sydney<br />
34
<strong>Deutsche</strong> <strong>Bank</strong><br />
<strong>Annual</strong> Review 2010<br />
AllianceBernstein and <strong>Deutsche</strong> <strong>Bank</strong><br />
have much in common, not least the<br />
pride each of us takes in the strength<br />
of our respective global businesses and<br />
local franchises. These qualities have<br />
served both fi rms well in uncertain<br />
times, and helped transform our working<br />
relationship into a true partnership.<br />
Emma Quinn,<br />
Head of Dealing – Australia and New Zealand,<br />
AllianceBernstein,<br />
Sydney<br />
35
02 -<br />
Stakeholders<br />
Shareholders – 37<br />
Strong support for our record-level capital increase<br />
Clients – Corporate & Investment <strong>Bank</strong> – 41<br />
Building on our competitive edge<br />
Clients – Private Clients and Asset Management – 46<br />
Sustained positive momentum<br />
Clients – Corporate Investments – 51<br />
Shareholding in <strong>Deutsche</strong> Postbank AG transferred<br />
to Private & Business Clients Corporate Division<br />
Clients – Central Infrastructure – 52<br />
The executive arm of the Management Board<br />
Staff – 53<br />
Growth through acquisitions<br />
Society – 56<br />
Building social capital<br />
Statements relating to <strong>Deutsche</strong> <strong>Bank</strong>‘s competitive position, market share or ranking are<br />
based essentially on external sources, including industry publications (e.g. Euromoney, etc.)<br />
and specialist information providers (e.g. Thomson Reuters, Dealogic, etc.).
<strong>Deutsche</strong> <strong>Bank</strong><br />
<strong>Annual</strong> Review 2010<br />
02 –1<br />
Shareholders’ equity<br />
In € bn. at period end<br />
50<br />
25<br />
0<br />
41.5<br />
39.1 38.5<br />
36.6<br />
48.8<br />
4Q 1Q 2Q 3Q 4Q<br />
09 10 10 10 10<br />
02 – Stakeholders<br />
Shareholders<br />
Shareholders<br />
Strong support for our record-level capital increase<br />
On September 12, 2010, <strong>Deutsche</strong> <strong>Bank</strong> announced the largest capital increase in its<br />
history, intended to fi nance the takeover of <strong>Deutsche</strong> Postbank AG. For this purpose, a<br />
resolution was passed to off er, in Germany and the United States of America, a total<br />
of 308.6 million new registered no par value shares (common shares) from authorized<br />
capital against cash contributions. Through the subscription rights granted to them,<br />
our shareholders were able to acquire one new share for every two shares they owned<br />
(subscription ratio of 2:1 ). The legally required prospectus containing all of the details<br />
was published on September 21, 2010. Shareholders were subsequently able to exercise<br />
their subscription rights from September 22 to October 5.<br />
Record-level share issue<br />
Our shareholders reacted very positively to this off er: 306.51 million new <strong>Deutsche</strong> <strong>Bank</strong><br />
shares were issued to holders of subscription rights at a fi xed subscription price of € 33.<br />
The remaining 2.13 million shares that shareholders did not exercise their subscription<br />
rights on were sold on the stock exchanges. All in all, we successfully placed all of the<br />
new <strong>Deutsche</strong> <strong>Bank</strong> shares issued and generated gross issue proceeds of € 10.2 billion,<br />
which were even higher than initially expected.<br />
The share capital of <strong>Deutsche</strong> <strong>Bank</strong> AG increased by € 790.1 million to € 2,379.5 million<br />
and the number of common shares rose to 929,499,640 as of the end of the year 2010<br />
( 2009: 620,859,015 ). The strong support for our capital increase of more than € 10 billion<br />
in a particularly diffi cult environment for banks highlights the great trust our shareholders<br />
have in <strong>Deutsche</strong> <strong>Bank</strong>’s future development. Chart 02 – 1<br />
Increased market capitalization<br />
The capital increase contributed to our market capitalization, which rose to € 36.3 billion<br />
by the end of the year ( 2009: € 30.7 billion). The weighting of the <strong>Deutsche</strong> <strong>Bank</strong> share<br />
in the DAX went up to 6.0 % ( 2009: 5.8 % ). The volume of trading in our share on Xetra<br />
came to € 160 billion during 2010, which means we ranked second among DAX shares.<br />
On the New York Stock Exchange, the average volume of trading in our share declined<br />
in 2010 by 12 %.<br />
Volatile markets<br />
Last year’s recovery on the international markets continued in 2010, however, at a<br />
signifi cantly slower pace and with big diff erences between various countries. In the<br />
fi rst few months of the fi nancial year, the global economy stabilized further and the<br />
situation on the fi nancial markets relaxed in light of a continuing abundant supply<br />
of liquidity. However, the expanding debt problems in the eurozone weighed on the<br />
mood and volume of activity of the capital market participants in the spring and again<br />
in the autumn. While economic growth was strong and above average in Germany, the<br />
dynamics in many other industrial countries lagged behind. The greatest momentum<br />
came from the emerging markets in Asia and Latin America. Volatility on the fi nancial<br />
markets rose as a result of reoccurring discussions about the risks to the euro.<br />
37
<strong>Deutsche</strong> <strong>Bank</strong><br />
<strong>Annual</strong> Review 2010<br />
02 –2<br />
Strong increase in number<br />
of shareholders<br />
In thousands at year end<br />
600<br />
300<br />
0<br />
361<br />
348<br />
641<br />
582<br />
586<br />
06 07 08 09 10<br />
02 – Stakeholders<br />
Shareholders<br />
Diffi cult year for banks<br />
In this environment, the <strong>Deutsche</strong> <strong>Bank</strong> share, too, was exposed to greater volatility.<br />
Our share commenced trading at the beginning of the year at € 45.50, rose to € 55.11 in<br />
April and closed the year at € 39.10. The share price thus declined over the course of<br />
the year by 13 %; all share prices have been adjusted to refl ect the subscription rights<br />
issue. In light of the uncertainty surrounding the planned regulatory reforms of the<br />
banking sector as well as country and sector-specifi c fi scal charges, the share prices<br />
of most of our peers also went down. Accordingly, the STOXX Europe <strong>Bank</strong>s lost 12 %<br />
during the year 2010.<br />
Germany’s major share index, DAX, closed the year 2010 at 6,914 points. With a plus of<br />
16 %, Germany’s stock exchange was among the strongest in the industrial countries.<br />
Wall Street gained 12.8 %, based on the S & P 500, and the FTSE 100 in London rose by<br />
9 %. In contrast, the Euro STOXX 50 went down by 5.8 %.<br />
Dividend unchanged<br />
<strong>Deutsche</strong> <strong>Bank</strong> generated solid earnings from its business operations in 2010. We will<br />
therefore propose a dividend of € 0.75 to the <strong>Annual</strong> General Meeting 2011, with a<br />
nearly 50 % bigger capital base. This refl ects both the stricter regulatory requirements<br />
for banks’ equity capital funding as well as our future growth initiatives.<br />
Long-term return<br />
The share price decline in 2010 reduced the long-term total shareholder return. An<br />
investor who bought <strong>Deutsche</strong> <strong>Bank</strong> shares for the equivalent of € 10,000 at the start<br />
of 1980, reinvested dividends and subscribed to capital increases without injecting<br />
additional funds would have held a portfolio worth € 79,314 at the end of 2010. This<br />
corresponds to an average annual return of 7 %, while the DAX, for example, recorded<br />
an increase of 9 % per annum over the same period.<br />
Long-term value<br />
2,000<br />
1,500<br />
1,000<br />
500<br />
0<br />
80 81 82 83 84 85 86 87 88 89 90 91 92 93 94 95 96 97 98 99 00 01 02 03 04 05 06 07 08 09 10<br />
Total Return Index, beginning of 1980 = 100, quarterly fi gures<br />
<strong>Deutsche</strong> <strong>Bank</strong><br />
DAX<br />
Source: Datastream<br />
38
<strong>Deutsche</strong> <strong>Bank</strong><br />
<strong>Annual</strong> Review 2010<br />
02 – 3<br />
Shareholder structure<br />
slightly changed<br />
In % of share capital at year end<br />
100<br />
50<br />
86<br />
14<br />
86<br />
14<br />
71<br />
29<br />
74 75<br />
26<br />
0<br />
06 07 08 09 10<br />
Institutional shareholders ( incl. banks )<br />
Private shareholders<br />
25<br />
02 – Stakeholders<br />
Shareholders<br />
European investors increase their holdings<br />
The number of our shareholders increased over the course of 2010 by about 54,000<br />
to reach a new record high of 640,623 ( 2009: 586,295 ). Chart 02 – 2 This rise took place<br />
exclusively after the announcement of our capital increase on September 12, 2010,<br />
and was almost <strong>entire</strong>ly attributable to private shareholders in Germany. This is<br />
counter to the general development in Germany, where the number of people who<br />
owned shares declined again in 2010. In total, the ratio of private investors with<br />
holdings in our share capital went down slightly to 25 % ( 2009: 26 % ). Refl ecting this<br />
development, the holdings of institutional investors (including banks) rose to 75 %<br />
( 2009: 74 % ). Chart 02 – 3 Above all investors in Europe, including Germany, expanded<br />
their holdings in <strong>Deutsche</strong> <strong>Bank</strong> shares. In contrast, the percentage of U.S. investors<br />
went down to 13 % ( 2009: 16 % ). Our regional shareholder structure changed very<br />
little overall despite the capital increase: 47 % of all <strong>Deutsche</strong> <strong>Bank</strong> shares were held<br />
in Germany ( 2009: 46 % ), while 53 % were held abroad (2009: 54 %). Chart 02 – 4<br />
<strong>Deutsche</strong> <strong>Bank</strong> shares continue to be almost <strong>entire</strong>ly in free fl oat. Large shareholders<br />
with holdings subject to the reporting threshold of 3 % as of December 31, 2010, were<br />
Credit Suisse Group, Zurich, with 3.86 %, and BlackRock Inc., New York, with 5.14 %.<br />
Lively discussions at our <strong>Annual</strong> General Meeting<br />
Our <strong>Annual</strong> General Meeting on May 27, 2010, in Frankfurt am Main, took place for<br />
the fi rst time on a climate-neutral basis and was attended by 5,000 shareholders,<br />
one quarter less than 2009’s record number of visitors ( 6,700 ). The report of the<br />
Chairman of the Management Board on the preceding fi nancial year and current<br />
outlook was followed by a lively discussion between the shareholders and the<br />
company’s manage ment. For the fi rst time, the remuneration system for the<br />
Management Board members was submitted to a vote by the shareholders. The<br />
<strong>Annual</strong> General Meeting approved all of the resolutions on the agenda by clear<br />
majorities. Similar to the average of the DAX 30 companies, the level of voting capital<br />
present declined on the previous year, from 41.9 % to 35.1 %.<br />
New share buybacks<br />
The <strong>Annual</strong> General Meeting authorized <strong>Deutsche</strong> <strong>Bank</strong> to purchase own shares<br />
at a volume equivalent to up to 10 % of the share capital by November 30, 2014. By<br />
the end of the year, we had repurchased 18.8 million shares and around half of this<br />
volume was used for share-based compensation for our employees. We did not<br />
cancel any shares during the reporting year and held 10.0 million shares in Treasury<br />
on December 31, 2010. From the start of the share buyback program in mid-2002 up<br />
to the end of December 2010, we repurchased a total of 264 million <strong>Deutsche</strong> <strong>Bank</strong><br />
shares worth € 16.7 billion, resold 16 million shares on the market worth € 0.5 billion<br />
and cancelled 118 million shares with a value of approximately € 7.2 billion.<br />
39
<strong>Deutsche</strong> <strong>Bank</strong><br />
<strong>Annual</strong> Review 2010<br />
02 – 4<br />
Regional distribution<br />
of share capital<br />
In % at year end 2010<br />
3 %<br />
Other<br />
6 %<br />
Switzerland<br />
13 %<br />
U.S.A.<br />
31 %<br />
Europe (excl.<br />
Germany)<br />
47 %<br />
Germany<br />
02 – Stakeholders<br />
Shareholders<br />
High level of investor interest<br />
Investors’ and fi nancial analysts’ interest in our share was especially great in 2010.<br />
Their principal focus was on the bank’s strategic approach, acquisitions and capital<br />
funding in light of the greater regulatory requirements to come. Our Investor<br />
Relations team regularly reported on these matters to our investors and answered<br />
their questions. At analyst meetings and in telephone conference calls, we provided<br />
information on the development of the bank’s results and, in particular, the voluntary<br />
off er for the takeover of <strong>Deutsche</strong> Postbank. At international securities conferences<br />
and our own Investor Relations events, 398 ( 2009: 386 ) individual and group discus -<br />
sions were held with equity and debt investors, also with the participation of mem bers<br />
of the Management Board. During the fi rst two weeks following the announcement<br />
of our capital increase alone, we conducted roadshows with several Management<br />
Board members and visited larger equity investors in Germany, the United Kingdom,<br />
Switzerland, France, Italy, Spain, the Netherlands, Belgium, Scandinavia and the U.S.A.<br />
Our presentations in this context focussed primarily on the strategic reasons for sub -<br />
mitting our takeover off er for <strong>Deutsche</strong> Postbank.<br />
Comprehensive Internet service<br />
Private investors contact us above all through our toll-free shareholder hotline and<br />
our Internet portal. On the Investor Relations website, we provide all of the current<br />
company announcements and fi nancial reports as well as the possibility, for example,<br />
of viewing interactive analyses of the <strong>Deutsche</strong> <strong>Bank</strong> share. We broadcast all of<br />
our Investor Relations events without exception or restrictions live via the Internet.<br />
Furthermore, shareholders can register online to participate in our <strong>Annual</strong> General<br />
Meeting, but they can also issue their voting instructions online in advance of the<br />
shareholders’ meeting. The number of invitations to the <strong>Annual</strong> General Meeting that<br />
we send per e-mail rose to 41,700, which helps us to reduce costs and protect the<br />
environment.<br />
Ratings reviewed<br />
The international rating agencies reviewed the credit ratings of banks around the<br />
world in 2010. <strong>Deutsche</strong> <strong>Bank</strong> retained its long-term ratings from Standard & Poor’s<br />
( A+ ) and Fitch ( AA– ), whereas Moody’s carried out a downgrading in March to Aa3. In<br />
contrast, Standard & Poor’s raised its long-term rating for <strong>Deutsche</strong> Postbank by one<br />
notch (to A), after <strong>Deutsche</strong> <strong>Bank</strong>’s takeover of a majority stake was confi rmed at the<br />
end of November.<br />
40
<strong>Deutsche</strong> <strong>Bank</strong><br />
<strong>Annual</strong> Review 2010<br />
02 –5<br />
Corporate Finance:<br />
strong improvement in U.S. Equity<br />
Capital Markets business<br />
Market share in %<br />
8<br />
4<br />
4.2<br />
5.1<br />
3.2<br />
4.7<br />
6.7<br />
0<br />
06 07 08 09 10<br />
* 10 9 10 6 5<br />
* Ranking in peer comparison<br />
Source: Dealogic<br />
02 – Stakeholders<br />
Clients – Corporate & Investment <strong>Bank</strong><br />
Clients – Corporate & Investment <strong>Bank</strong><br />
Building on our competitive edge<br />
For our Corporate & Investment <strong>Bank</strong> ( CIB ) Group Division, 2010 was a challenging year.<br />
Even so, we generated record annual revenues and our second-best income before<br />
income taxes. Despite periods of lower market-wide activity, signifi cant market turbulence<br />
in the wake of the sovereign debt concerns of a few countries and sustained<br />
low interest rates, we succeeded in strengthening our competitive position across<br />
all of our CIB businesses. This was facilitated during the reporting year by the further<br />
integration of our business operations in CIB, building on the successful recalibration<br />
in 2009. Our outstanding reputation in the market was refl ected by the awards<br />
<strong>Deutsche</strong> <strong>Bank</strong> won in 2010: “<strong>Bank</strong> of the Year” from Inter national Financing Review,<br />
“Best Global Investment <strong>Bank</strong>” from Euromoney magazine and “Derivatives House of<br />
the Year” from Risk magazine.<br />
CIB comprises our Corporate <strong>Bank</strong>ing & Securities and Global Transaction <strong>Bank</strong>ing<br />
Corporate Divisions. Corporate <strong>Bank</strong>ing & Securities consists of the Markets and<br />
Corporate Finance Business Divisions.<br />
Excerpt from segment reporting ( Corporate & Investment <strong>Bank</strong>1 )<br />
The Corporate & Investment <strong>Bank</strong> Group Division reported income before income taxes of € 6.0 billion in 2010. The<br />
Corporate <strong>Bank</strong>ing & Securities Corporate Division recorded income before income taxes of € 5.1 billion, compared<br />
with € 3.5 billion in 2009. Overall, net revenues in 2010 were higher than in the year before. This primarily refl ects<br />
lower mark-downs and trading losses as well as increased client activity across fl ow and structured products in Credit<br />
Trading, and in Equity Derivatives. In addition, we recorded signifi cantly lower provision for credit losses related to<br />
assets which had been reclassifi ed in accordance with IAS 39. The Global Transaction <strong>Bank</strong>ing Corporate Division<br />
generated income before income taxes of € 0.9 billion (2009: € 0.8 billion). Even excluding the positive impact from<br />
the fi rst-time consolidation of the commercial banking activities acquired from ABN AMRO in the Netherlands, GTB<br />
generated record revenues, predominantly attributable to growth in fee income in Trust & Securities Services, Trade<br />
Finance, and Cash Management, which off set the impact of the continuing low interest rate environment.<br />
in € m. 2010 2009<br />
Net revenues 20,929 18,807<br />
Total provision for credit losses 488 1,816<br />
Noninterest expenses 14,422 12,679<br />
Income before income taxes 5,999 4,314<br />
Return on equity ( pre-tax ) in % 32 23<br />
Risk weighted assets 211,115 203,962<br />
Assets 1,519,983 1,343,824<br />
1 Excerpt from segment reporting. For notes and other detailed information, see Financial <strong>Report</strong> 2010 ( Management <strong>Report</strong> ).<br />
41
<strong>Deutsche</strong> <strong>Bank</strong><br />
<strong>Annual</strong> Review 2010<br />
02 –6<br />
Markets:<br />
leader in U.S. fi xed income<br />
Market share in %<br />
14<br />
7<br />
8.3<br />
10.7<br />
9.9<br />
9.5<br />
12.8<br />
0<br />
06 07 08 09 10<br />
* 5 3 3 4 1<br />
* Ranking in peer comparison<br />
Source: Greenwich Associates<br />
02 – Stakeholders<br />
Clients – Corporate & Investment <strong>Bank</strong><br />
Corporate <strong>Bank</strong>ing & Securities<br />
The Markets Business Division combines the sales, trading and structuring of a<br />
wide range of fi nancial market products, including bonds, equities and equity-linked<br />
products, exchange-traded and over-the-counter derivatives, foreign exchange,<br />
money market instruments, securitized instruments and commodities. Coverage of<br />
institutional clients is provided by the Institutional Client Group. Research provides<br />
analysis of markets, products and trading strategies.<br />
Market conditions at the start of 2010 were little changed from the latter part of 2009.<br />
Volatility was low and credit spreads tightened. Liquidity in the markets improved<br />
and the relationships between asset classes stabilized. However, the markets for<br />
securitization continued to yield very few transactions. As the year progressed,<br />
concerns about the sovereign debt of a few countries led to an increase in volatility<br />
and credit spreads. Investors became more cautious and issuance activity slowed<br />
down, especially during the summer, when volumes noticeably declined.<br />
Even in this environment, Markets was successful in gaining market share among<br />
clients, while maintaining disciplined use of resources such as assets and risk.<br />
All of our fl ow businesses performed exceptionally well in 2010. We captured signifi -<br />
cant market share in fi xed income in the U.S.A. and thus, for the fi rst time, advanced<br />
to No. 1 in this business, according to Greenwich Associates. Chart 02 – 6 Our equities<br />
and commodities businesses benefi ted from sustained high demand. Thanks to our<br />
innovative structuring platform across asset classes, we can provide our clients with<br />
customized products that precisely fi t their needs. We discontinued our dedicated<br />
proprietary equity trading business.<br />
We had a record year in fi xed income in 2010. In our foreign exchange sales and<br />
trading business, we consolidated our position as the global leader for the sixth<br />
con secutive year, according to Euromoney’s benchmark industry poll. Our money<br />
markets and interest rates businesses, which won several awards from Risk<br />
maga zine, played a signifi cant role in generating revenues. We worked in close<br />
cooperation with our clients on innovative solutions, for example, to hedge a<br />
German automobile company’s risk from increasing life expectancy (longevity risk)<br />
for its pension liabilities. Chart 02 – 7<br />
42
<strong>Deutsche</strong> <strong>Bank</strong><br />
<strong>Annual</strong> Review 2010<br />
02 – 7<br />
Markets: maintaining our<br />
position as world leader in<br />
foreign exchange<br />
Ranking in peer comparison<br />
1<br />
3<br />
1<br />
1<br />
1<br />
06 07 08 09 10<br />
Source: Euromoney FX Poll<br />
1<br />
1<br />
02 – Stakeholders<br />
Clients – Corporate & Investment <strong>Bank</strong><br />
Our business in fl ow and structured credit products recovered markedly in 2010, while<br />
we further reduced legacy asset positions. Emerging markets debt performed well<br />
as capital fl ows continued to move into emerging economies and we benefi ted<br />
from our global presence. In commodities we delivered a very strong performance,<br />
despite the diffi cult market conditions in 2010.<br />
Our equities business continued its recovery that started in 2009. For the third year in<br />
a row, we were named the world’s best prime broker by Global Custodian magazine<br />
based on a survey of hedge funds. We continued to invest in our cash equities business,<br />
particularly in electronic trading in the U.S.A. and Asia. Our equity derivatives<br />
trading business continues to focus on the high volume products that our institutional<br />
clients demand.<br />
The economic outlook for our Markets Business Division remains uncertain. We are,<br />
however, convinced that we are well prepared for a variety of market conditions and<br />
the regulatory changes to come thanks to our broadly diversifi ed business model.<br />
Awards 2010<br />
Awards 2010<br />
International Financing Review<br />
“Derivatives House of the Year”<br />
for the fi fth time in six years<br />
Euromoney<br />
“Best Global Investment <strong>Bank</strong>”<br />
“FX Poll-No. 1 FX <strong>Bank</strong>”<br />
for the sixth consecutive year<br />
Risk<br />
“Derivatives House of the Year”<br />
for the third time since 2003<br />
“<strong>Bank</strong> Risk Manager of the Year”<br />
Global Custodian<br />
“No. 1 Global Prime Broker”<br />
for the third consecutive year<br />
Greenwich Associates<br />
“No. 1 in U.S. fi xed income”<br />
43
<strong>Deutsche</strong> <strong>Bank</strong><br />
<strong>Annual</strong> Review 2010<br />
02 – 8<br />
Corporate Finance:<br />
now among the world’s top 5<br />
Ranking in peer comparison<br />
5<br />
10<br />
7<br />
06 07 08 09 10<br />
Source: Dealogic, based on fees<br />
8<br />
8<br />
7<br />
5<br />
02 – Stakeholders<br />
Clients – Corporate & Investment <strong>Bank</strong><br />
Our Corporate Finance Business Division is responsible for mergers and acquisitions<br />
( M & A ), including advisory; debt and equity issuance; and capital markets coverage<br />
of large and medium-sized corporations. Regional and industry-focused teams ensure<br />
the delivery of our <strong>entire</strong> range of fi nancial products and services to our clients.<br />
In 2010, the business division signifi cantly improved its competitive position. Under<br />
diffi cult market conditions, Corporate Finance achieved its goal of becoming a top<br />
fi ve global provider, according to Dealogic, based on estimated fees. In the past year,<br />
no other bulge bracket bank has gained more market share in this area than <strong>Deutsche</strong><br />
<strong>Bank</strong>. This success was partly due to the strategic and counter-cyclical investments<br />
that we made over the past few years to extend our expertise into key regions and<br />
sectors, including the U.S.A., fi nancial institutions and industrial companies. Chart 02 – 8<br />
Our M & A business made considerable progress in 2010, rising to fi fth place in the<br />
global rankings from No. 9 in the previous year. We ranked No. 1 in Europe and doubled<br />
our market share in the U.S.A. Cross-border M & A transactions, where we hold a<br />
leading position, contributed signifi cantly to this increase. Crucially, we advised on<br />
these not only across the world’s developed markets, but also into emerging markets<br />
in the energy, pharmaceuticals and consumer goods sectors.<br />
Our origination business performed strongly thanks to higher volumes, although the<br />
market remained turbulent throughout the year due to concerns about the sovereign<br />
debt of a few countries.<br />
In our Equity Capital Markets business, we succeeded in capturing market share, even<br />
with high market volatility. We were the only bulge bracket bank to do so in 2010, and<br />
the only one to participate in the three biggest equity issues of the year. Our Equity<br />
Capital Markets business moved up in the global and U.S. rankings to fi fth place, and<br />
in Europe, Middle East and Africa ( EMEA ) we regained the No. 1 position. Chart 02 – 5<br />
Our debt origination business grew strongly in 2010 in the underwriting of both investment<br />
grade and high yield bonds. We are ranked No. 4 globally in both investment<br />
grade and high yield and in EMEA we are ranked No. 1 and 2 respectively. In leveraged<br />
fi nance, we approved selected loans where the risks and rewards made economic<br />
sense. Awards 2010<br />
Awards 2010<br />
International Financing Review<br />
“EMEA High Yield Bond House”<br />
Finance Asia<br />
“Best High Yield Bond House”<br />
Financial News<br />
“DCM House of the Year”<br />
44
<strong>Deutsche</strong> <strong>Bank</strong><br />
<strong>Annual</strong> Review 2010<br />
02 –9<br />
Global Transaction <strong>Bank</strong>ing:<br />
leader in euro clearing<br />
Market share in %<br />
20<br />
10<br />
18.7<br />
17.4<br />
16.6<br />
21.1 21.1<br />
0<br />
06 07 08 09 10<br />
* 1 1 1 1 1<br />
* Ranking in peer comparison<br />
Source: Bundesbank –<br />
„Target2 Germany“<br />
02 – Stakeholders<br />
Clients – Corporate & Investment <strong>Bank</strong><br />
Global Transaction <strong>Bank</strong>ing<br />
The Global Transaction <strong>Bank</strong>ing ( GTB ) Corporate Division delivers a comprehensive<br />
range of commercial banking products and services for corporate clients and<br />
fi nancial institutions, including domestic and cross-border payments, professional<br />
risk management and international trade fi nancing. GTB also provides trust, agency,<br />
depositary, custody and related services. GTB consists of Cash Management for<br />
Corporates and Financial Institutions, Trade Finance and Trust & Securities Services.<br />
GTB generated record revenues in 2010. It succeeded in growing market share in key<br />
business segments, while continuing to invest in new products and technologies and<br />
expand its network of business locations. Through the further integration with CIB,<br />
we began to maximize additional opportunities with our clients. We completed the<br />
acquisition of parts of ABN AMRO’s commercial banking activities in the Netherlands<br />
on April 1, thereby gaining 33,000 new clients and started the integration process.<br />
In our Cash Management business, we maintained our leading position in euro<br />
clearing, and continued to be one of the top US dollar clearing banks. We increased<br />
the number of our clients and mandates by expanding our business operations into<br />
new industries and segments. We were successful in building on our leading position<br />
with fi nancial institutions. Chart 02 – 9<br />
Our Trade Finance business delivered a strong performance in 2010, helped by growth<br />
in world trade volumes. Our clients continued to demand products and services<br />
to reduce risk. We were able to signifi cantly expand our fl ow business in fi nancing<br />
international imports and exports as well as structured trade fi nance, where we<br />
work together with export credit agencies and private risk insurers.<br />
In 2010, Trust & Securities Services successfully integrated Dresdner <strong>Bank</strong>’s thirdparty<br />
securities lending business, acquired in 2009. We expanded our custody busi -<br />
ness to include the Kingdom of Saudi Arabia and our third-party alternative fund<br />
administration business doubled the assets it administered. Furthermore, we<br />
retained our top three position in the traditional debt and structured fi nance services<br />
businesses, including achieving the No. 1 position as trustee for U.S. Asset Backed<br />
Securities. Awards 2010<br />
Awards 2010<br />
The <strong>Bank</strong>er<br />
“Cash Management House of the Year”<br />
Euromoney<br />
“Best Cash Management House in Europe”<br />
Trade Finance<br />
“Best Trade <strong>Bank</strong> in Europe”<br />
“Best Short-Term Trade Finance <strong>Bank</strong>”<br />
45
<strong>Deutsche</strong> <strong>Bank</strong><br />
<strong>Annual</strong> Review 2010<br />
02 – 10<br />
Asset Management:<br />
regional split of invested assets<br />
Total of 549.9 € bn. end of 2010<br />
223<br />
Americas<br />
25<br />
Asia/Pacifi c<br />
25<br />
United Kingdom<br />
Figures rounded<br />
244<br />
Germany<br />
34<br />
Europe (excl.<br />
Germany,<br />
United Kingdom)<br />
02 – Stakeholders<br />
Clients – Private Clients and Asset Management<br />
Clients – Private Clients and Asset Management<br />
Sustained positive momentum<br />
The Private Clients and Asset Management Group Division ( PCAM ) comprises<br />
<strong>Deutsche</strong> <strong>Bank</strong>’s investment management business for both private and institutional<br />
clients, together with our traditional banking activities for private individuals and<br />
small and medium-sized businesses.<br />
For PCAM, 2010 was a year in which we carried out two acquisitions of strategic<br />
importance, setting the course for our future development. With the acquisition of<br />
Sal. Oppenheim Group and the majority stake in <strong>Deutsche</strong> Postbank AG, we expanded<br />
once again our leading position in our home market, Germany. Despite the charges<br />
that came with these steps, the PCAM Group Division raised its earnings in an increasingly<br />
favourable environment. Total assets under management rose by € 299 billion to<br />
€ 1,179 billion. Of this aggregate fi gure, € 115 billion are attributable to Sal. Oppenheim,<br />
including BHF <strong>Bank</strong>, and € 105 billion to Postbank.<br />
PCAM consists of two corporate divisions: Asset and Wealth Management and<br />
Private & Business Clients.<br />
Asset and Wealth Management<br />
The Asset and Wealth Management Corporate Division comprises two business<br />
divisions: Asset Management and Private Wealth Management. Asset Management<br />
provides retail and institutional investors with a range of traditional and alternative<br />
investment products or tailored investment solutions. Private Wealth Management<br />
serves the banking needs of wealthy individuals and families around the world.<br />
In 2010, the Asset Management ( AM ) Business Division succeeded in increasing its<br />
contribution to profi ts. This refl ected the successful completion of our restructuring,<br />
which resulted in improved conditions for our Asset Management business and a<br />
further recovery of the markets. AM’s business strategy remains aligned with seven<br />
‘megatrends’-macro industry trends we identifi ed several years ago that we believe<br />
are transforming the investment management business.<br />
Excerpt from segment reporting (Private Clients and Asset Management 1 )<br />
The Private Clients and Asset Management Group Division recorded income before income taxes of € 1.0 billion in 2010,<br />
compared with € 0.7 billion in 2009. In the Asset and Wealth Management Corporate Division, income before income<br />
taxes was € 0.1 billion (2009: € 0.2 billion), including a loss related to Sal. Oppenheim / BHF. In the Private & Business Clients<br />
Corporate Division, income before income taxes increased to € 0.9 billion (2009: € 0.5 billion). This development refl ects<br />
higher revenues, mainly resulting from the fi rst-time consolidation of Postbank and from deposits and payment services.<br />
Noninterest expenses in Private & Business Clients increased compared to 2009, predominantly driven by the consolida<br />
tion of Postbank. Excluding this eff ect, noninterest expenses decreased, largely as a result of lower severance payments.<br />
in € m. 2010 2009<br />
Net revenues 10,043 8,261<br />
Total provision for credit losses 789 806<br />
Noninterest expenses 8,258 6,803<br />
Income before income taxes 989 658<br />
Return on equity ( pre-tax ) in % 9 8<br />
Risk weighted assets 127,827 49,073<br />
Assets 412,477 174,739<br />
1 Excerpt from segment reporting. For notes and other detailed information, see Financial <strong>Report</strong> 2010 ( Management <strong>Report</strong> ).<br />
46
<strong>Deutsche</strong> <strong>Bank</strong><br />
<strong>Annual</strong> Review 2010<br />
02 – 11<br />
Asset Management:<br />
product mix by invested assets<br />
Total of 549.9 € bn. end of 2010<br />
46<br />
Alternative<br />
investments<br />
including real<br />
estate<br />
151<br />
Nonaffi<br />
liated<br />
insurance<br />
assets<br />
175<br />
Institutional business<br />
Figures rounded<br />
178<br />
Retail funds<br />
02 – Stakeholders<br />
Clients – Private Clients and Asset Management<br />
Asset Management comprises four major businesses: retail, in which DWS Investments<br />
serves the needs of individual investors and retirement accounts; institutional, in<br />
which DB Advisors manages assets for clients such as pension funds, corporations,<br />
sovereign wealth funds and governments; insurance, in which <strong>Deutsche</strong> Insurance<br />
Asset Management concentrates on the investment and advisory needs of insurance<br />
companies; and alternatives, led by RREEF, one of the world’s largest real estate<br />
investment managers. Furthermore, we are active in other alternative areas through<br />
DB Climate Change Advisors, DB Private Equity and RREEF Infrastructure. At the end<br />
of 2010, AM had assets under management of € 550 billion in total (2009: € 496 billion).<br />
Chart 02 – 11<br />
Retail Investors<br />
DWS Investments ( DWS ) is the leading provider in Germany of investment funds and<br />
fund-based pension products for private clients. Based on market share, DWS remained<br />
the number-one mutual fund company in its home market, and among the top<br />
ten mutual fund providers in Europe. Globally, AM managed assets of € 178 billion<br />
at the end of 2010 for retail investors, which was an increase of € 13 billion on the<br />
previous year. DWS was again the recipient of numerous awards throughout the year<br />
for investment performance and client service. And as it grows its global footprint,<br />
in the U.S.A., DWS has attracted positive infl ows based on net sales of its funds in<br />
short-term fi xed income, municipal bonds and commodities. And in Japan we were<br />
very successful, for example, with three new investment funds, each with a volume<br />
of more than € 1 billion.<br />
Institutional asset management<br />
By the end of 2010, DB Advisors managed assets of € 175 billion (2009: € 173 billion) and<br />
fi rmly established itself as one of the world’s fi ve-largest providers of fi xed-income<br />
investment solutions. We continued to innovate our investment solutions, introducing<br />
a fi xed-income climate change fund and a Floating Rate NAV product. Furthermore,<br />
in 2010 we acquired Henderson Global Investors’ sterling money market fund.<br />
Asset management for insurance companies<br />
<strong>Deutsche</strong> Insurance Asset Management (<strong>Deutsche</strong> Insurance) again grew strongly<br />
in 2010. With a market share of 17 % and assets under management of € 151 billion at<br />
the end of 2010, representing a € 36 billion rise over 2009, <strong>Deutsche</strong> Insurance is the<br />
second-largest asset manager in this segment. For the third year in a row, Reactions<br />
magazine awarded us the title “Best Global Insurance Asset Manager”, and for the<br />
second consecutive year we were the magazine’s “Best Insurance Asset Manager” in<br />
London. During 2010, we also integrated the insurance business of Oppenheim VAM<br />
Kapitalanlagegesellschaft mbH, with assets of around € 10 billion, and increased our<br />
focus on insurance companies in Europe.<br />
47
<strong>Deutsche</strong> <strong>Bank</strong><br />
<strong>Annual</strong> Review 2010<br />
02 – 12<br />
Private Wealth Management:<br />
higher invested assets<br />
At year end in € bn.<br />
300<br />
150<br />
189194<br />
190<br />
164<br />
275*<br />
0<br />
06 07 08 09 10<br />
* thereof Sal. Oppenheim € 67 bn.<br />
02 – Stakeholders<br />
Clients – Private Clients and Asset Management<br />
Real estate and other alternative investments<br />
RREEF, a highly respected real estate investment specialist in its fi eld, managed assets<br />
of € 37 billion at the end of 2010. With a recovery underway in real estate, the majority<br />
of RREEF funds performed positively, and our two open-end real estate funds in Germany<br />
“grundbesitz europa” and “gundbesitz global,” achieved top rankings.<br />
In addition to RREEF, AM’s other alternative investment areas were active in 2010.<br />
DB Climate Change Advisors continued to solidify its position in climate changerelated<br />
investing, especially as institutional investors began to display an increased<br />
interest in climate change research and investment strategies with a commitment<br />
to sustainability.<br />
DB Private Equity, which focuses on primary and secondary fund investments for<br />
institutions and high-net-worth individuals, successfully integrated three existing busi -<br />
ness units: Private Equity Group from <strong>Deutsche</strong> <strong>Bank</strong>’s Private Wealth Manage ment<br />
division; the secondary market team from RREEF; and the former Sal. Oppenheim<br />
Private Equity Partners. Operating globally with assets under management of<br />
€ 2.4 billion at the end of 2010, DB Private Equity is now number fi ve in Europe and<br />
number one in Germany in the fund-of-funds business.<br />
Our RREEF Infrastructure business continued to grow. With assets of approximately<br />
€ 6.1 billion under management, we ranked number four among the world’s largest<br />
infrastructure investment managers. Over the course of 2010, we completed our fi rst<br />
renewable investment by acquiring stakes in three wind farms in Spain.<br />
Our Private Wealth Management ( PWM ) Business Division is a world-leading wealth<br />
manager with tailored fi nancial services for wealthy clients, trusts and foundations as<br />
well as select institutional investors. We completed the acquisition of Sal. Oppenheim<br />
in March 2010, further strengthening our position in Europe and our now undisputed<br />
market leadership in Germany. Nearly 4,600 employees at 109 locations in 30 countries<br />
provide coverage to our demanding clientele. At the end of 2010, PWM including Sal.<br />
Oppenheim, but excluding BHF-<strong>Bank</strong>, managed total invested assets of € 275 billion<br />
(PWM 2009: € 190 billion). PWM’s business results in 2010 neared their pre-crisis levels,<br />
after a decline in 2008 and 2009 as a result of the fi nancial crisis. Chart 02 – 12<br />
Good fi nancial markets and the return to more equity driven client investment as well<br />
as increased lending contributed to PWM’s recovery. We continued to strengthen<br />
our ultra high net worth and high net worth off erings, particularly through closer<br />
cooperation with other business divisions within the Group. This supported our additional<br />
focus and success with the ultra high net worth client segment.<br />
The Private Wealth Management business performed very strongly in our German<br />
home market in 2010. We succeeded in attracting € 5 billion in net new money, while<br />
increasing revenues. We were ranked fi rst in 20 categories in Euromoney’s Private<br />
<strong>Bank</strong>ing and Wealth Management Survey; this refl ects our exceptional competitive<br />
edge in this market.<br />
48
<strong>Deutsche</strong> <strong>Bank</strong><br />
<strong>Annual</strong> Review 2010<br />
02 – 13<br />
Private & Business Clients:<br />
strong growth in client<br />
deposits as a result<br />
of Postbank acquisition<br />
Savings, time and sight deposits<br />
in € bn. at year end<br />
250<br />
125<br />
72<br />
118<br />
116<br />
96<br />
234*<br />
0<br />
06 07 08 09 10<br />
* thereof <strong>Deutsche</strong> Postbank AG 118 € bn.<br />
02 – Stakeholders<br />
Clients – Private Clients and Asset Management<br />
PWM also achieved signifi cant progress in the realignment and integration of Sal.<br />
Oppenheim during 2010. We focused the business on asset and wealth management,<br />
reorganized the management team, reduced risk-weighted assets and expenses,<br />
and reinforced control functions.<br />
With steady asset infl ows, PWM in the United Kingdom successfully expanded its<br />
revenues in 2010 by more than 20 %. We also benefi tted from the turnaround of our<br />
U.S. business, where our revenues grew by 16 % in 2010.<br />
During the course of the year, PWM reorganized its regional management structure in<br />
order to best capture local business opportunities in mature and developing markets.<br />
Furthermore, we expanded our businesses in key growth markets in Latin America,<br />
the Middle East, Russia and Asia.<br />
In line with the Group’s strategic priorities, PWM continued to expand its business<br />
in the Asia Pacifi c region. As a result we increased revenues by 25 % over 2009. For<br />
the fourth consecutive year, we won Asiamoney’s award for the “Best Private <strong>Bank</strong><br />
in India”.<br />
PWM remains committed to creating sustainable value by providing fi rst class wealth<br />
management services to meet the needs of our clients around the world.<br />
Private & Business Clients<br />
<strong>Deutsche</strong> <strong>Bank</strong>’s Private & Business Clients Corporate Division ( PBC ) provides branch<br />
banking and fi nancial services to private customers, self-employed clients as well<br />
as small and medium-sized businesses internationally. We hold the leading position<br />
in our home market, Germany. PBC’s product range includes payment and current<br />
account services, investment management and retirement pension planning, mutual<br />
funds and securities, as well as loans to individual private clients and businesses.<br />
PBC operates 2,860 branches in Germany, Italy, Spain, Belgium, Portugal, Poland,<br />
India and China, thereof 1,108 Postbank branches. In addition, PBC works with<br />
indepen dent fi nancial advisors. We also leverage our sales potential through<br />
cooperation agreements with renowned partners, such as the largest automobile<br />
association in Germany, ADAC, and the fi nancial services division of Spain’s postal<br />
service, Correos. In some countries, for example, Germany and Poland, our market<br />
presence comprises multiple brands.<br />
In 2010, PBC signifi cantly increased it operating results compared to 2009. Key contrib<br />
utions to this increase came from higher securities brokerage revenues and a<br />
record performance in deposits and payments. We also benefi ted from the effi ciency<br />
enhance ment measures we introduced back in 2009 as well as our signifi cantly<br />
lower risk costs.<br />
In our home market, Germany, we took an historic step in 2010 to further strengthen<br />
our position in the private clients business: We acquired a majority stake in <strong>Deutsche</strong><br />
Postbank AG, which we consolidated on our balance sheet in December. Postbank<br />
is thus now part of our retail banking franchise. The two banks’ customer groups<br />
complement each other ideally. Postbank’s integration into <strong>Deutsche</strong> <strong>Bank</strong> Group will<br />
be facilitated by the cooperation we launched back in 2009 in distribution and sales,<br />
purchasing and information technology – a cooperation that has already exceeded<br />
our expectations.<br />
49
<strong>Deutsche</strong> <strong>Bank</strong><br />
<strong>Annual</strong> Review 2010<br />
02 – 14<br />
Private & Business Clients:<br />
considerable increase in the<br />
number of branches in Germany<br />
Total of 2,052 at year end 2010<br />
61<br />
Berliner<br />
<strong>Bank</strong><br />
94<br />
norisbank<br />
789<br />
<strong>Deutsche</strong><br />
<strong>Bank</strong><br />
1,108<br />
Postbank<br />
02 – Stakeholders<br />
Clients – Private Clients and Asset Management<br />
In Germany, PBC now provides banking coverage to a total of 24 million clients,<br />
with more than 2,000 branches at their disposal and over 35,000 staff at their service.<br />
Through the Postbank acquisition, we are deploying a massive reinforcement to<br />
our multi-brand strategy. With two independent and ideally established nationwide<br />
brands on the market, we can now provide all the diff erent customer groups in<br />
Germany with the products and services that best suit their banking needs. In Europe,<br />
too, we are among the leading banks in terms of revenues and customer deposits.<br />
Chart 02 – 14<br />
In 2010 Berliner <strong>Bank</strong>, our regional brand in Berlin, migrated to our IT platform,<br />
resulting in a clear modernization benefi t. 2010 also saw positive developments in<br />
norisbank, which received several awards for its account services.<br />
In <strong>Deutsche</strong> <strong>Bank</strong>’s branch banking business, we delivered a strong earnings<br />
increase in 2010. And we launched a program for the ongoing development of our<br />
advisory serv ice. With a special focus on client satisfaction, we aim to improve<br />
the quality of our services, as the key factor in our competitive market. We also<br />
changed our operational management control with the result that we now measure<br />
our success to an equal extent in terms of both the added value to our clients and<br />
our profi tability or the added value for shareholders. The mobile sales force of<br />
approximately 1,400 independent fi nancial advisors was realigned with the aim of<br />
achieving higher quality.<br />
Strong growth was also seen in the other European PBC countries. Revenues increased<br />
in all product categories, and risk costs declined signifi cantly in our lending business.<br />
PBC Poland successfully returned to profi tability thanks to a restructuring of its<br />
business model.<br />
In 2010, we continued the expansion of our presence in Asia. For example, we are<br />
increasing our stake – subject to regulatory approval – in Hua Xia <strong>Bank</strong> in China, from<br />
17.1 % to 19.99 %. In India, we remained right on track during 2010 and now provide<br />
banking coverage at 15 branches to over 415,000 clients.<br />
50
<strong>Deutsche</strong> <strong>Bank</strong><br />
<strong>Annual</strong> Review 2010<br />
02 – 15<br />
Corporate Investments:<br />
development of carrying value<br />
of investments<br />
In € bn. at year end<br />
30<br />
15<br />
0<br />
10.4 9.9<br />
17.3<br />
24.6<br />
14.9<br />
06 07 08 09 10<br />
02 – Stakeholders<br />
Clients– Corporate Investments<br />
Clients – Corporate Investments<br />
Shareholding in <strong>Deutsche</strong> Postbank AG transferred<br />
to Private & Business Clients Corporate Division<br />
The Corporate Investments Group Division ( CI ) manages <strong>Deutsche</strong> <strong>Bank</strong>’s global<br />
principal investment activities. These include certain credit exposures, certain private<br />
equity and venture capital investments, certain corporate real estate investments,<br />
our industrial holdings and certain other non-strategic investments. Chart 02 – 15<br />
As at the end of 2010, CI managed € 3.0 billion of assets relating to equity investments,<br />
including our stake in the port operating company Maher Terminals and The Cosmopolitan<br />
of Las Vegas. Maher and Cosmopolitan are not part of our core business, are<br />
therefore held for investment purposes on a temporary basis.<br />
Following our acquisition of a majority stake in <strong>Deutsche</strong> Postbank AG we transferred<br />
this investment to our Private & Business Clients Corporate Division in December 2010.<br />
At year end, the other investments amounted to € 11.9 billion. In the course of 2010, the<br />
liquidity facility for <strong>Deutsche</strong> Pfandbriefbank AG (formerly Hypo Real Estate <strong>Bank</strong> AG)<br />
amounting to € 9.2 billion, in which we participated in December 2009, was fully repaid.<br />
The last repayment was made in December 2010, at which point we participated<br />
in a new liquidity facility for FMS Wertmanagement Anstalt des öff entlichen Rechts,<br />
the winding-up agency of the Hypo Real Estate Group, by subscribing to fully ECBeligible<br />
notes in the amount of € 6.4 billion.<br />
Excerpt from segment reporting (Corporate Investments 1 )<br />
The Corporate Investments Group Division reported a loss before income taxes of € 2.6 billion in 2010 (2009: profi t<br />
of € 0.5 billion). This result was mainly attributable to a Postbank-related charge of € 2.3 billion, which was recorded<br />
in the third quarter.<br />
in € m. 2010 2009<br />
Net revenues (2,020) 1,044<br />
Total provision for credit losses (4) 8<br />
Noninterest expenses 637 581<br />
Income before income taxes (2,649) 456<br />
Risk weighted assets 4,580 16,935<br />
Assets 17,766 28,456<br />
1 Excerpt from segment reporting. For notes and other detailed information, see Financial <strong>Report</strong> 2010 ( Management <strong>Report</strong> ).<br />
51
<strong>Deutsche</strong> <strong>Bank</strong><br />
<strong>Annual</strong> Review 2010<br />
02 – 16<br />
Stable Tier 1 capital ratio<br />
at high level<br />
In % at year end<br />
14<br />
7<br />
0<br />
8.6<br />
8.5<br />
1 based on IFRS<br />
2 based on IFRS, Basel I<br />
3 based on IFRS, Basel II<br />
10.1<br />
12.6 12.3<br />
06¹ 07² 08³ 09³ 10³<br />
02 – Stakeholders<br />
Clients – Central Infrastructure<br />
Clients – Central Infrastructure<br />
The executive arm of the Management Board<br />
Our central infrastructure departments support the Management Board in performing<br />
its executive duties through their strategy, risk management and control functions.<br />
Most of the corresponding processes are globally integrated into the business divisions<br />
where our banking operations are located, but have their own independent reporting<br />
lines. This mode of operating has long been a key element of our leadership and<br />
organizational culture and once again proved to be successful during 2010.<br />
The central infrastructure area comprises Finance, Audit, Tax, Legal, Risk & Capital,<br />
Investor Relations, Communications & Corporate Social Responsibility, Human<br />
Resources, Group Strategy & Planning, Corporate Insurance and DB Research.<br />
Current requirements<br />
The impact of the global fi nancial and economic crisis, tighter regulatory requirements<br />
as well as the preparations for and conclusion of our strategic acquisitions<br />
demanded an extraordinary workload from our employees in 2010. All of the departments<br />
involved worked together closely to meet the wide-ranging challenges.<br />
The Treasury team within Legal, Risk & Capital ensured that <strong>Deutsche</strong> <strong>Bank</strong> retained<br />
ample liquidity reserves and broad access to debt capital and retail funding markets<br />
at all times in 2010. We increased our equity capital through a € 10.2 billion rights issue,<br />
the biggest ever in German banking history, primarily for the acquisition of <strong>Deutsche</strong><br />
Postbank.<br />
Broad-based support<br />
One of the key areas that our Finance team concentrated on was the ongoing development<br />
of our value-based management concept, which focuses on total shareholder<br />
return. We use this method to make the factors driving shareholder value transparent<br />
to our senior management.<br />
In 2010, Group Strategy & Planning supported the Management Board in the implemen -<br />
tation of Phase 4 of our Management Agenda and was closely involved in carrying<br />
out our strategic acquisitions. By conducting studies of economics-related topics,<br />
including energy, innovation and sustainability, and by identifying new fi elds of<br />
business, DB Research provided key information to the Management Board, the<br />
business divisions and our clients.<br />
One of the primary aims of our Human Resources organization was to continue to<br />
position <strong>Deutsche</strong> <strong>Bank</strong> as an “employer of choice”. Our goal is to recruit and retain<br />
the most talented people. In the year under review, we devoted special attention to<br />
talent management, adjusting our compensation structure and increasing the ratio<br />
of women in senior management positions.<br />
52
<strong>Deutsche</strong> <strong>Bank</strong><br />
<strong>Annual</strong> Review 2010<br />
02 – 17<br />
Staff numbers<br />
In thousands at year end*<br />
100<br />
50<br />
78.3<br />
80.5<br />
77.1<br />
68.8<br />
102.1*<br />
0<br />
06 07 08 09 10<br />
* Full-time equivalent<br />
* thereof Postbank 20.4 thousands<br />
02 – Stakeholders<br />
Staff<br />
Staff<br />
Growth through acquisitions<br />
The number of (full-time) staff employed by <strong>Deutsche</strong> <strong>Bank</strong> Group rose in 2010 by<br />
25,009 to 102,062. This increase was mainly due to two acquisitions in Germany.<br />
After adjustment for the net eff ect of these consolidations and a number of resales,<br />
the headcount grew only slightly by 222 employees. Chart 02 – 17<br />
In our Corporate & Investment <strong>Bank</strong> Group Division, staff numbers rose by 1,752<br />
in 2010 ( +12 % ). This can mostly be linked to the purchase of parts of ABN AMRO’s<br />
commercial banking activities in the Netherlands. In Private Clients and Asset<br />
Management, the number of staff grew by 72 % from 30,611 to 52,584. This increase<br />
is primarily attributable to the fi rst-time consolidation of Postbank with 20,361<br />
employees. <strong>Deutsche</strong> <strong>Bank</strong> gained another 3,675 staff members through the<br />
acquisition of Sal. Oppenheim Group.<br />
We have expanded our established service centres, especially in India, the Philippines,<br />
the UK and the USA. Staff numbers in these service centres increased by approximately<br />
1,200 in 2010. The headcount in the other infrastructure areas remained – on<br />
balance – unchanged from 2009.<br />
Changed personnel structure<br />
<strong>Deutsche</strong> <strong>Bank</strong>’s regional personnel structure has seen a marked shift as a result<br />
of the acquisitions: The percentage of staff working in Germany rose from 35.5 %<br />
( 2009 ) to 48.3 %.<br />
Securing the next generation of staff continues to be one of our priorities. In 2010,<br />
we hired 634 apprentices, increasing the total number to 1,437 at the end of 2010<br />
(fi gures exclude Postbank). During this period, 721 university graduates joined the<br />
bank (excluding Postbank). For a number of years now, we have been off ering interns<br />
with high potential a compact development program enabling them to gain practical<br />
insight to selected business areas through lectures and workshops. In 2010, over 600<br />
students from around the world took part in this summer internship program.<br />
An employer of choice<br />
Attracting, engaging and retaining the best talent is of prime importance to the bank.<br />
In 2010 we targeted potential applicants directly through our “Agile minds” marketing<br />
campaign. We regularly conduct surveys and comparative studies to measure our<br />
attractiveness to talented individuals.<br />
To help our employees to lead active professional lives for as long as possible, we<br />
off er health checks and fl exible working hours, also in our own interests. These<br />
initiatives have been very well received: some 8,700 staff members across Germany<br />
have already taken part in our health-check program for all employees aged 40<br />
and above. In addition, since 2010 a general smoking ban has been in force in all<br />
<strong>Deutsche</strong> <strong>Bank</strong> premises in Germany. In 2010, <strong>Deutsche</strong> <strong>Bank</strong> was awarded the<br />
“Career and Family” certifi cate for the second time by the charitable association<br />
Hertie Foundation (Germany) for its family-friendly HR policies.<br />
53
<strong>Deutsche</strong> <strong>Bank</strong><br />
<strong>Annual</strong> Review 2010<br />
02 – 18<br />
Employee Commitment Index*<br />
Index ceiling = 100<br />
80<br />
77<br />
74<br />
74<br />
71<br />
68<br />
60<br />
06 07 08 09 101 * <strong>Annual</strong>, anonymous survey within<br />
<strong>Deutsche</strong> <strong>Bank</strong> by an independent<br />
institute<br />
1 Excluding <strong>Deutsche</strong> Postbank<br />
02 – Stakeholders<br />
Staff<br />
Since 2010, <strong>Deutsche</strong> <strong>Bank</strong> employees in Australia, China, Japan, Singapore and<br />
Sri Lanka have been able to opt for diff erent forms of fl exible working, and there<br />
are plans to extend these arrangements across the Asia-Pacifi c region in future.<br />
This increases our competitive edge in the fast-growing and demanding market<br />
for competent staff .<br />
A new maternity coaching initiative was launched in Asia to guide women through<br />
the transitions from career to parental leave and back again.<br />
The commitment index, a measure of staff loyalty to the company based on an<br />
anonymous Group-wide survey performed by an independent institution for more<br />
than ten years, remained strong in 2010 at 74 points. That is the second highest<br />
result since the survey began, indicating that employees continue to closely identify<br />
with the bank and are particularly willing to put in a strong performance. The slight<br />
reduction in comparison to the record of 77 points in 2009 primarily refl ects an easing<br />
of tension or return to normality after the fi nancial crisis. Chart 02 –18<br />
Compensation structure adjusted to new regulations<br />
In 2010 <strong>Deutsche</strong> <strong>Bank</strong> regularly participated in the ongoing discussions on compen<br />
sa tion practices and regulatory requirements, especially in Europe. Initiatives<br />
by regulators and various governmental measures around the globe have imposed<br />
new or enhanced mandatory requirements for compensation structures within the<br />
fi nancial industry.<br />
In accordance with the voluntary self-commitment to comply with the Financial Stability<br />
Board ( FSB ) Principles on sound compensation, and in reponse to the circular published<br />
by the German regulator BaFin in late December 2009, <strong>Deutsche</strong> <strong>Bank</strong> was one of a<br />
small number of global fi nancial institutions to publish a separate Compensation <strong>Report</strong><br />
in March 2010. This report on our amended compensation concept, which contained<br />
some previously unpublished information, was com mended as exemplary by the Com -<br />
mittee of European <strong>Bank</strong>ing Supervisors ( CEBS ) in June.<br />
On October 13, 2010, the Compensation Regulation for Institutions came into eff ect<br />
in Germany. This transposes the new European Capital Requirements Directive 3.<br />
In December, the CEBS published guidelines on these requirements. In March 2011,<br />
<strong>Deutsche</strong> <strong>Bank</strong> issued its second Compensation <strong>Report</strong> along with its <strong>Annual</strong> <strong>Report</strong><br />
for 2010 www.deutsche-bank.de / ir / en. This states that our current compensation system<br />
fully meets the requirements applicable since the beginning of 2011. Our report helps<br />
further increase transparency as regards compensation practices at <strong>Deutsche</strong> <strong>Bank</strong>.<br />
So as compensation becomes more strictly regulated at European banks while many<br />
other countries have made considerably less progress in this respect, the issue of a<br />
global level playing fi eld in compensation is becoming increasingly urgent.<br />
Global Share Purchase Plan for employees<br />
On April 1, 2010, we launched a new Global Share Purchase Plan allowing all authorized<br />
employees to purchase <strong>Deutsche</strong> <strong>Bank</strong> shares in monthly instalments of at least<br />
€ 25 and a maximum of € 125 over a period of one year. The bank then matches the<br />
acquired shares in a ratio of one to one up to a maximum of ten free shares, provided<br />
the staff member remains employed by <strong>Deutsche</strong> <strong>Bank</strong> Group for another year.<br />
At the end of the year, the plan was in place in a total of 27 countries.<br />
54
<strong>Deutsche</strong> <strong>Bank</strong><br />
<strong>Annual</strong> Review 2010<br />
02 – 19<br />
Return from parental leave<br />
In % in <strong>Deutsche</strong> <strong>Bank</strong> Group Germany<br />
80<br />
40<br />
0<br />
81<br />
79<br />
77<br />
79<br />
74<br />
06 07 08 09 10 1<br />
1 Excluding <strong>Deutsche</strong> Postbank<br />
02 – Stakeholders<br />
Staff<br />
Identifying and developing potential<br />
To identify and nurture talent, we run talent reviews in all businesses and divisions<br />
throughout the bank. One particular focus in 2010 was on training our managers<br />
to enable them to better identify, support and encourage talented individuals.<br />
<strong>Deutsche</strong> <strong>Bank</strong> continually expanded its training curriculum in 2010. This includes<br />
topics such as leadership and management, business and fi nance as well as team<br />
and interpersonal skills. For our most promising employees, we provide individual<br />
coaching and training.<br />
Culture of diversity<br />
Diversity is an integral part of our corporate culture. At the same time, it is an important<br />
success factor in a global bank. We can only live up to our promise to perform<br />
if our employees are able to realize their full potential, regardless of their nationality,<br />
religious beliefs, race, sexual orientation, gender, age or ethnic background. Socially<br />
and culturally mixed teams are an advantage when it comes to providing our diverse<br />
client groups with innovative services tailored to their needs. We fi rmly believe<br />
that bringing diff erent perspectives and backgrounds together in an inclusive, open<br />
environment improves the quality of work.<br />
In the reporting year, we off ered diversity training sessions to managers to raise their<br />
awareness of unconscious biases they may have. The regional diversity councils<br />
formed in 2009 and led by the CEOs at international locations proved eff ective and<br />
were expanded.<br />
<strong>Deutsche</strong> <strong>Bank</strong> won various awards in recognition of its family benefi ts and fl exible<br />
working policies which help employees balance career and family. In the United<br />
States, it was voted one of the 100 Best Companies for Working Mothers and was<br />
winner of the Dave Thomas Foundation for Adoption Award. In the UK, the bank<br />
was named Top Employer for Working Families in the fi nancial services sector with<br />
a special commendation for support of women before and during maternity leave<br />
as well as when they return to work. It was also voted one of the Top 25 Most LBGT<br />
Friendly Corporations by the International Gay & Lesbian Chamber of Commerce.<br />
In the Corporate Equality Index set up by The Human Rights Campaign the bank was<br />
given a perfect score of 100 %.<br />
During 2010 one gender diversity target was to promote the professional develop -<br />
ment of women and their representation in senior positions across <strong>Deutsche</strong> <strong>Bank</strong>.<br />
This was also the aim of the ATLAS (Accomplished Top Leaders Advancement<br />
Strategy) program founded in 2009 and sponsored by Management Board Chairman<br />
Josef Ackermann. ATLAS turned in fi rst encouraging results in 2010, with 30 % of<br />
the initial group of participants moving into new or expanded roles.<br />
As part of the Women Global Leaders program in 2010, we held a one-week seminar<br />
for the fi rst time at the INSEAD Business School near Paris for 34 selected female<br />
Directors, which met with great success. Furthermore, we now have an active Senior<br />
Women’s Advisory Board operating in Germany, equivalent to the boards already<br />
established in the UK and the USA, with the aim of making women in management<br />
a higher priority at the bank.<br />
55
<strong>Deutsche</strong> <strong>Bank</strong><br />
<strong>Annual</strong> Review 2010<br />
02 – 20<br />
Global social responsibility:<br />
investments by area of activity<br />
2010 total of € 98.1 m.<br />
4 %<br />
Corporate<br />
Volunteering<br />
22 %<br />
Art & Music<br />
36 %<br />
Education<br />
38 %<br />
Social<br />
Investments<br />
02 – Stakeholders<br />
Society<br />
Society<br />
Building social capital<br />
<strong>Deutsche</strong> <strong>Bank</strong> was one of the main initiators and fi rst signatories of the “Code<br />
of Responsible Conduct for Business”, launched in November 2010 by 21 German<br />
companies. With this code, we intend to integrate social responsibility even<br />
more closely in our business processes and duly consider it in all our decisions.<br />
For us, corporate social responsibility means more than just donating money: we<br />
want to build social capital – also for our own good. In the year under review, the bank<br />
and its staff took part in a wide range of social projects both in Germany and abroad.<br />
We invested nearly € 100 million – more than ever before – in educational, social, art<br />
and music projects, in addition to employee volunteering activities. Chart 02 – 20<br />
Sustainability: Ensuring viability<br />
<strong>Deutsche</strong> <strong>Bank</strong> has been committed to the general principle of sustainable develop -<br />
ment and consistently implements it along the accepted environmental, social<br />
and governance dimensions of sustainability. On the way to full carbon-neutrality<br />
of our operations from 2013 onwards we achieved our annual carbon reduction<br />
objective for 2010. We moved back into our headquarters in Frankfurt which after a<br />
3-year retrofi t programme are now one of the most environment-friendly skyscrapers<br />
worldwide. The bank’s internal guidelines for risk management have been expanded<br />
by a “Green Filter” tool in order to include the carbon impact of transactions in our<br />
decision processes. Our commitment to sustainability is documented in particular by<br />
our long-time membership in the UN Global Compact and the signing of the Principles<br />
for Responsible Investment ( PRI ) of the United Nations.<br />
The Global Metro Summit in 2010, organized by <strong>Deutsche</strong> <strong>Bank</strong>’s Alfred Herrhausen<br />
Society, focused on stable and sustainable economic concepts for metropolitan<br />
regions. The conference expands the Urban Age network, fi rst established in 2005,<br />
providing a forum for international experts to discuss the challenges facing the<br />
world’s mega cities.<br />
Education: Enabling talent<br />
Even today, it is not talent but social origin which, in many cases, determines a<br />
person’s educational advancement. <strong>Deutsche</strong> <strong>Bank</strong> is strongly committed world -<br />
wide to equality of opportunity and the fair promotion of talent. In 2010 we launched<br />
“FairTalent”, an initiative that provides targeted individual assistance to underprivileged,<br />
but highly talented children. <strong>Deutsche</strong> <strong>Bank</strong> employees also serve as<br />
mentors to the young people taking part.<br />
In order to intensify the exchange between the academic and business world,<br />
<strong>Deutsche</strong> <strong>Bank</strong> has established a chair of fi nance at Bocconi University in Milan and<br />
at the Luxembourg School of Finance. Moreover, we facilitated a new professorship<br />
at the House of Finance at Goethe University in Frankfurt and signifi cantly increased<br />
our fi nancial support for the European School of Management and Technology in Berlin.<br />
56
<strong>Deutsche</strong> <strong>Bank</strong><br />
<strong>Annual</strong> Review 2010<br />
02 – 21<br />
SAM sustainability rating:<br />
increasing our lead over<br />
global average<br />
Diff erence in basis points<br />
35<br />
25<br />
19<br />
21 21<br />
26<br />
30<br />
15<br />
06 07 08 09 101 1 <strong>Deutsche</strong> <strong>Bank</strong> 2010: 80 of 100 points<br />
Global average 2010: 50 of 100 points<br />
Source: SAM Research Inc.<br />
02 – Stakeholders<br />
Society<br />
Social Investments: Creating opportunity<br />
In 2010 <strong>Deutsche</strong> <strong>Bank</strong> successfully completed the Eye Fund, an innovative investment<br />
vehicle amounting to U.S. $ 14.5 million, which provides start-up fi nancing for the<br />
expansion of eye care clinics in the world’s poorer regions. We support the renewal<br />
of infrastructure in economically deprived communities in the United States through<br />
loans and investments. For this work, the Federal Reserve <strong>Bank</strong> awarded us an<br />
“outstanding” rating for the 19th consecutive time.<br />
The year was overshadowed by a number of natural catastrophes, among them<br />
earthquakes in Haiti and Chile and fl oods in Pakistan. <strong>Deutsche</strong> <strong>Bank</strong>, its foundations,<br />
clients and staff together contributed more than € 5 million for the people aff ected<br />
by these disasters. Wherever possible, our employees support relief action locally –<br />
fulfi lling our claim of giving more than money.<br />
Art and Music: Fostering creativity<br />
The <strong>Deutsche</strong> <strong>Bank</strong> Collection in the newly renovated Head Offi ce in Frankfurt am<br />
Main has been rejuvenated and given a clearer international focus. Around 1,500 art -<br />
works by 100 artists from more than 40 countries invite the viewer to embark on a<br />
journey through the contemporary global art scene. Our ongoing commitment to art<br />
in the workplace at more than 900 <strong>Deutsche</strong> <strong>Bank</strong> locations worldwide was honoured<br />
by the 2010 Art & Work award.<br />
The work of the Kenyan-born and New York-based artist Wangechi Mutu, selected<br />
in 2010 to be our fi rst “Artist of the Year”, was the subject of an exhibition at the<br />
<strong>Deutsche</strong> Guggenheim in Berlin. With this new award, we promote aspiring young<br />
artists from around the world.<br />
Via an exclusive partnership, <strong>Deutsche</strong> <strong>Bank</strong> has enjoyed close links with the Berliner<br />
Philharmoniker for many years. In 2010, the orchestra toured Australia for the fi rst<br />
time and realized a Zukunft@BPhil project there. Zukunft@BPhil aims to open up new<br />
and creative experiences for children and young people and introduce them to<br />
classical music through workshops and dance projects. More than 18,000 children<br />
and young people have participated in the programme worldwide since 2002.<br />
Corporate Volunteering: Committing ourselves<br />
In the year under review, more than 17,000 of our employees supported over 3,000 community<br />
projects around the world. <strong>Deutsche</strong> <strong>Bank</strong> supports this personal com mitment<br />
with either paid leave or donations to the charitable partners.<br />
The Partners in Leadership programme, in which <strong>Deutsche</strong> <strong>Bank</strong> senior managers<br />
advise school administrators on management issues, was the winner of the “European<br />
Employee Volunteering Award - Germany”. In the United Kingdom, the bank<br />
raised 1 million pounds for the AfriKids programme as part of the “Charity of the Year<br />
2010” initiative. Further information on our corporate social responsibility activities can be found in our<br />
“Corporate Social Responsibility <strong>Report</strong> 2010” and at www.db.com / csr.<br />
57
<strong>Deutsche</strong> <strong>Bank</strong><br />
<strong>Annual</strong> Review 2010<br />
Maurice Robinson<br />
Frankfurt<br />
<strong>Deutsche</strong> <strong>Bank</strong> has a strong network<br />
culture. This brings employees<br />
together in such a global and complex<br />
organi zation. It is important<br />
for a cross-divisional exchange of<br />
ideas, enabling us to produce fast<br />
and effi cient solutions for clients.<br />
Maurice Robinson,<br />
registrar services GmbH,<br />
Frankfurt am Main<br />
Global Transaction <strong>Bank</strong>ing<br />
58
<strong>Deutsche</strong> <strong>Bank</strong><br />
<strong>Annual</strong> Review 2010<br />
59
03 -<br />
Consolidated Financial Statements / Excerpts<br />
Statement of Income – 61<br />
Balance Sheet – 62<br />
Group Five-Year Record – 63<br />
For notes and other detailed information (including footnotes), see Financial <strong>Report</strong> 2010 (Consolidated Financial Statements).
<strong>Deutsche</strong> <strong>Bank</strong><br />
<strong>Annual</strong> Review 2010<br />
Statement of Income<br />
03 – Consolidated Financial Statements / Excerpts<br />
Statement of Income<br />
Statement of Income<br />
in € m. 2010 2009 2008<br />
Interest and similar income 28,779 26,953 54,549<br />
Interest expense 13,196 14,494 42,096<br />
Net interest income 15,583 12,459 12,453<br />
Provision for credit losses 1,274 2,630 1,076<br />
Net interest income after provision for credit losses 14,309 9,829 11,377<br />
Commissions and fee income 10,669 8,911 9,741<br />
Net gains ( losses ) on fi nancial assets / liabilities at fair value through profi t or loss 3,354 7,109 ( 9,992)<br />
Net gains ( losses ) on fi nancial assets available for sale 201 ( 403 ) 666<br />
Net income ( loss ) from equity method investments ( 2,004) 59 46<br />
Other income ( loss ) 764 ( 183) 699<br />
Total noninterest income 12,984 15,493 1,160<br />
Compensation and benefi ts 12,671 11,310 9,606<br />
General and administrative expenses 10,133 8,402 8,339<br />
Policyholder benefi ts and claims 485 542 ( 252)<br />
Impairment of intangible assets 29 ( 134) 585<br />
Restructuring activities – – –<br />
Total noninterest expenses 23,318 20,120 18,278<br />
Income ( loss ) before income taxes 3,975 5,202 ( 5,741)<br />
Income tax expense ( benefi t ) 1,645 244 ( 1,845)<br />
Net income ( loss ) 2,330 4,958 ( 3,896)<br />
Net income ( loss) attributable to noncontrolling interests 20 ( 15) ( 61)<br />
Net income ( loss ) attributable to <strong>Deutsche</strong> <strong>Bank</strong> shareholders 2,310 4,973 ( 3,835)<br />
Earnings per Common Share1 in € 2010 2009 2008<br />
Basic 3.07 7.21 ( 6.87)<br />
Diluted2 Number of shares in million<br />
2.92 6.94 ( 6.87)<br />
1<br />
Denominator for basic earnings per share – weighted-average shares outstanding 753.3 689.4 558.5<br />
Denominator for diluted earnings per share – adjusted weighted-average shares after assumed conversions 790.8 716.7 558.6<br />
1 The number of average basic and diluted shares outstanding has been adjusted for all periods before October 6, 2010 to refl ect the eff ect of the bonus element of the subscription<br />
rights issue in connection with the capital increase.<br />
2 Includes numerator eff ect of assumed conversions. For further detail please see Note 11 “Earnings per Common Share”.<br />
61
<strong>Deutsche</strong> <strong>Bank</strong><br />
<strong>Annual</strong> Review 2010<br />
Balance Sheet<br />
03 – Consolidated Financial Statements / Excerpts<br />
Balance Sheet<br />
Assets<br />
in € m. Dec 31, 2010 Dec 31, 2009<br />
Cash and due from banks 17,157 9,346<br />
Interest-earning deposits with banks 92,377 47,233<br />
Central bank funds sold and securities purchased under resale agreements 20,365 6,820<br />
Securities borrowed 28,916 43,509<br />
Financial assets at fair value through profi t or loss<br />
Trading assets 271,291 234,910<br />
Positive market values from derivative fi nancial instruments 657,780 596,410<br />
Financial assets designated at fair value through profi t or loss 171,926 134,000<br />
Total fi nancial assets at fair value through profi t or loss<br />
of which € 91 billion and € 79 billion were pledged to creditors and can be sold<br />
or repledged at December 31, 2010, and 2009, respectively 1,100,997 965,320<br />
Financial assets available for sale<br />
of which € 3.9 billion and € 0.5 billion were pledged to creditors and can be sold<br />
or repledged at December 31, 2010, and 2009, respectively 54,266 18,819<br />
Equity method investments 2,608 7,788<br />
Loans 407,729 258,105<br />
Property and equipment 5,802 2,777<br />
Goodwill and other intangible assets 15,594 10,169<br />
Other assets 149,229 121,538<br />
Assets for current tax 2,249 2,090<br />
Deferred tax assets 8,341 7,150<br />
Total assets 1,905,630 1,500,664<br />
Liabilities and equity<br />
in € m. Dec 31, 2010 Dec 31, 2009<br />
Deposits 533,984 344,220<br />
Central bank funds purchased and securities sold under repurchase agreements 27,922 45,495<br />
Securities loaned 3,276 5,564<br />
Financial liabilities at fair value through profi t or loss<br />
Trading liabilities 68,859 64,501<br />
Negative market values from derivative fi nancial instruments 647,171 576,973<br />
Financial liabilities designated at fair value through profi t or loss 130,154 73,522<br />
Investment contract liabilities 7,898 7,278<br />
Total fi nancial liabilities at fair value through profi t or loss 854,082 722,274<br />
Other short-term borrowings 64,990 42,897<br />
Other liabilities 181,827 154,281<br />
Provisions 2,204 1,307<br />
Liabilities for current tax 2,736 2,141<br />
Deferred tax liabilities 2,307 2,157<br />
Long-term debt 169,660 131,782<br />
Trust preferred securities 12,250 10,577<br />
Obligation to purchase common shares – –<br />
Total liabilities 1,855,238 1,462,695<br />
Shareholders’ equity<br />
Common shares, no par value, nominal value of € 2.56 2,380 1,589<br />
Additional paid-in capital 23,515 14,830<br />
Retained earnings 25,999 24,056<br />
Common shares in treasury, at cost ( 450) ( 48)<br />
Equity classifi ed as obligation to purchase common shares – –<br />
Accumulated other comprehensive income, net of tax ( 2,601) ( 3,780)<br />
Total shareholders’ equity 48,843 36,647<br />
Noncontrolling interests 1,549 1,322<br />
Total equity 50,392 37,969<br />
Total liabilities and equity 1,905,630 1,500,664<br />
62
<strong>Deutsche</strong> <strong>Bank</strong><br />
<strong>Annual</strong> Review 2010<br />
Group Five-Year Record<br />
03 – Consolidated Financial Statements / Excerpts<br />
Group Five-Year Record<br />
Balance Sheet<br />
in € m. Dec 31, 2010 Dec 31, 2009 Dec 31, 2008 Dec 31, 2007 Dec 31, 2006<br />
Total assets 1,905,630 1,500,664 2,202,423 1,925,003 1,520,580<br />
Loans 407,729 258,105 269,281 198,892 178,524<br />
Total liabilities 1,855,238 1,462,695 2,170,509 1,885,688 1,486,694<br />
Total shareholders’ equity 48,843 36,647 30,703 37,893 33,169<br />
Noncontrolling interests 1,549 1,322 1,211 1,422 717<br />
Tier 1 capital 42,565 34,406 31,094 28,320 23,539<br />
Total regulatory capital 48,688 37,929 37,396 38,049 34,309<br />
Income Statement<br />
in € m. 2010 2009 2008 2007 2006<br />
Net interest income 15,583 12,459 12,453 8,849 7,008<br />
Provision for credit losses 1,274 2,630 1,076 612 298<br />
Commissions and fee income 10,669 8,911 9,741 12,282 11,192<br />
Net gains ( losses ) on fi nancial assets / liabilities at fair value through profi t or loss 3,354 7,109 ( 9,992 ) 7,175 8,892<br />
Other noninterest income ( loss ) (1,039) ( 527) 1,411 2,523 1,476<br />
Total noninterest income 12,984 15,493 1,160 21,980 21,560<br />
Compensation and benefi ts 12,671 11,310 9,606 13,122 12,498<br />
General and administrative expenses 10,133 8,402 8,339 8,038 7,143<br />
Policyholder benefi ts and claims 485 542 ( 252) 193 67<br />
Impairment of intangible assets 29 ( 134) 585 128 31<br />
Restructuring activities – – – ( 13) 192<br />
Total noninterest expenses 23,318 20,120 18,278 21,468 19,931<br />
Income ( loss ) before income taxes 3,975 5,202 ( 5,741) 8,749 8,339<br />
Income tax expense ( benefi t ) 1,645 244 ( 1,845) 2,239 2,260<br />
Net income ( loss ) 2,330 4,958 ( 3,896) 6,510 6,079<br />
Net income ( loss ) attributable to noncontrolling interests 20 ( 15) ( 61) 36 9<br />
Net income ( loss ) attributable to <strong>Deutsche</strong> <strong>Bank</strong> shareholders 2,310 4,973 ( 3,835) 6,474 6,070<br />
Key fi gures 2010 2009 2008 2007 2006<br />
Basic earnings per share¹ € 3.07 € 7.21 ( € 6.87) € 12.29 € 11.66<br />
Diluted earnings per share¹ € 2.92 € 6.94 ( € 6.87) € 11.80 € 10.44<br />
Dividends paid per share in period € 0.75 € 0.50 € 4.50 € 4.00 € 2.50<br />
Return on average shareholders’ equity ( post-tax ) 5.5 % 14.6 % ( 11.1 ) % 17.9 % 20.3 %<br />
Pre-tax return on average shareholders’ equity 9.5 % 15.3 % ( 16.5 ) % 24.1 % 27.9 %<br />
Cost / income ratio 81.6 % 72.0 % 134.3 % 69.6 % 69.8 %<br />
Core Tier 1 capital ratio² 8.7 % 8.7 % 7.0 % 6.9 % 6.9 %<br />
Tier 1 capital ratio² 12.3 % 12.6 % 10.1 % 8.6 % 8.5 %<br />
Total capital ratio² 14.1 % 13.9 % 12.2 % 11.6 % 12.5 %<br />
Employees ( full-time equivalent ) 102,062 77,053 80,456 78,291 68,849<br />
¹ The number of average basic and diluted shares outstanding has been adjusted for all periods before October 6, 2010 to refl ect the eff ect of the bonus element of the subscription<br />
rights issue in connection with the capital increase.<br />
² Ratios presented for 2009 and 2008 are pursuant to the revised capital framework presented by the Basel Committee in 2004 (“Basel II”) as adopted into German law by the<br />
German <strong>Bank</strong>ing Act and the Solvency Regulation (“Solvabilitätsverordnung”). Ratios presented for 2007 and 2006 are based on the Basel I framework and thus calculated on<br />
a noncomparative basis. The capital ratios relate the respective capital to risk-weighted assets for credit, market and operational risk. Excludes transitional items pursuant to<br />
Section 64h (3) German <strong>Bank</strong>ing Act.<br />
63
<strong>Deutsche</strong> <strong>Bank</strong><br />
<strong>Annual</strong> Review 2010<br />
Chennupati Vidya<br />
Vijayawada<br />
64
<strong>Deutsche</strong> <strong>Bank</strong><br />
<strong>Annual</strong> Review 2010<br />
I have never given up channelling my<br />
eff orts into creating an environment<br />
that provides equal opportunities<br />
for women and girls. <strong>Deutsche</strong> <strong>Bank</strong><br />
has supported our institution VMM<br />
in protecting vulnerable children for<br />
six years now, and is responsible<br />
for visible positive change in the lives<br />
of many children.<br />
Chennupati Vidya,<br />
Vasavya Mahila Mandali ( VMM ),<br />
Vijayawada<br />
65
04 -<br />
Further Information<br />
Glossary – 67<br />
Imprint / Publications – 71<br />
Financial Calendar – 72
<strong>Deutsche</strong> <strong>Bank</strong><br />
<strong>Annual</strong> Review 2010<br />
Glossary<br />
A<br />
Alpha<br />
Investment return in excess of the<br />
benchmark return<br />
Alternative assets / investments<br />
Direct investments in private equity,<br />
venture capital, mezzanine capital, real<br />
estate capital investments and investments<br />
in leveraged buyout funds, venture capital<br />
funds and hedge funds.<br />
American Depositary Receipts ( ADRs )<br />
Negotiable certifi cates issued by U. S.<br />
banks and representing non-American<br />
equities deposited with them. ADRs<br />
simplify, reduce the cost of and accelerate<br />
trading in the American securities markets.<br />
Asset-backed securities ( ABS )<br />
Particular type of securitized payment<br />
receivables in the form of tradable<br />
securities. These securities are created<br />
by the repackaging of certain fi nancial<br />
assets Securitization.<br />
Asset Finance & Leasing<br />
Center of competence for off ering<br />
structured and innovative asset fi nancing<br />
solutions for durable and high value<br />
assets.<br />
Average active equity<br />
We calculate active equity to make it<br />
easier to compare us to our competitors<br />
and we refer to active equity for several<br />
ratios. However, active equity is not a<br />
measure provided for in International<br />
Financing <strong>Report</strong>ing Standards and you<br />
should not compare our ratios based on<br />
average active equity to other companies’<br />
ratios without considering the diff erences<br />
in the calculation. The items for which we<br />
adjust the average shareholders’ equity<br />
are average unrealized net gains on assets<br />
available for sale, average fair value<br />
adjustments on cash fl ow hedges ( both<br />
components net of applicable taxes ), as<br />
well as average dividends, for which a<br />
proposal is accrued on a quarterly basis<br />
and for which payments occur once a<br />
year following the approval by the <strong>Annual</strong><br />
General Meeting.<br />
04 – Further Information<br />
Glossary<br />
B<br />
Basel II<br />
Revised capital framework of the Basel<br />
Committee which has replaced the former<br />
Basel I regulations especially on the<br />
calculation of the regulatory risk position.<br />
BIS<br />
<strong>Bank</strong> for International Settlements<br />
domiciled in Basel.<br />
Broker / Brokerage<br />
Brokers accept orders to buy and sell<br />
securities from banks and private investors<br />
and execute them on behalf of the<br />
customer. For this activity, the broker<br />
usually receives a commission.<br />
Buy-out<br />
Purchase ( in full or in part ) of a company<br />
or specifi c corporate activities.<br />
C<br />
Capital according to Basel II<br />
Capital recognized for regulatory<br />
purposes according to the Basel Capital<br />
Adequancy Accord of 2004 for banks.<br />
Capital according to Basel II consists of:<br />
– Tier 1 capital: primarily share capital,<br />
reserves and certain Trust preferred<br />
securities,<br />
– Tier 2 capital: primarily participatory<br />
capital, cumulative preference shares,<br />
long-term subordinated debt and<br />
unrealized gains on listed securities,<br />
– Tier 3 capital: mainly short-term subordinated<br />
debt and excess Tier 2 capital.<br />
Tier 2 capital is limited to 100 % of Tier 1<br />
capital while the amount of long-term<br />
subordinated debt that can be recognized<br />
as Tier 2 capital is limited to 50 % of Tier 1<br />
capital.<br />
67<br />
Cash management<br />
Refers to the management of liquid assets<br />
in dollars, euro and other currencies for<br />
companies and fi nancial institutions to<br />
optimize fi nancial transactions.<br />
Clearing<br />
The process of transmitting, reconciling<br />
and, in some cases, confi rming payment<br />
orders.<br />
Collateralized debt obligations ( CDOs )<br />
Investment vehicles based on a portfolio<br />
of assets that can include bonds, loans or<br />
derivatives.<br />
Commercial mortgage-backed securities<br />
( CMBS )<br />
Mortgage-backed securties ( MBS ), which<br />
are backed by commercial mort gage<br />
loans.<br />
Compliance<br />
Entirety of measures adopted to ensure<br />
that relevant laws, rules and internal<br />
regulations are adhered to and to prevent<br />
legal or regulatory sanctions as well<br />
as fi nancial or reputational damage.<br />
Corporate fi nance<br />
General term for capital market-related,<br />
innovative fi nancing services to satisfy<br />
special consulting requirements in<br />
business with corporate customers.<br />
Correlation<br />
Reciprocal relationship between at least<br />
two variables ( e.g. assets ). It can be<br />
positive, in which case the variables move<br />
in the same direction, or negative when<br />
they move in opposite directions.<br />
However, correlation says nothing about<br />
causality ( i.e. cause / eff ect ). Correlation is<br />
an important tool used in asset allocation<br />
to diversify and / or hedge risks.
<strong>Deutsche</strong> <strong>Bank</strong><br />
<strong>Annual</strong> Review 2010<br />
Cost / income ratio<br />
In general: a ratio expressing a company’s<br />
cost eff ectiveness which sets operating<br />
expenses in relation to operating income.<br />
Credit default swap<br />
An agreement between two parties whereby<br />
one party pays the other a fi xed<br />
coupon over a specifi ed term. The other<br />
party makes no payment unless a<br />
specifi ed credit event such as a default<br />
occurs, at which time a payment is made<br />
and the swap terminates.<br />
Credit trading<br />
Trading in loan or credit-related products.<br />
Custody<br />
Custody and administration of securities<br />
as well as additional securities services.<br />
D<br />
Debt products<br />
Tradable instruments representing a<br />
liability or claim with respect to assets<br />
of one or more private or public sector<br />
entities. The phrase also denotes a<br />
broader range of instruments including<br />
foreign exchange and commodity<br />
contracts.<br />
Derivatives<br />
Products whose value derives largely from<br />
the price, price fl uctuations and price<br />
expectations of an underlying instrument<br />
( e.g. share, bond, foreign exchange<br />
or index ). Derivatives include Swaps,<br />
Options and Futures.<br />
DJSI<br />
Dow Jones Sustainability Indexes are an<br />
index family tracking the member<br />
companies’ ecological and social achievements.<br />
<strong>Deutsche</strong> <strong>Bank</strong> has been listed<br />
in the DJSI World and the DJSI STOXX ever<br />
since they were fi rst launched.<br />
www.sustainability-index.com<br />
04 – Further Information<br />
Glossary<br />
E<br />
Earnings per share<br />
Key fi gure determined according to<br />
International Financing <strong>Report</strong>ing<br />
Standards and expressing a company’s<br />
net income attributable to its shareholders<br />
in relation to the average number<br />
of common shares outstanding. Apart<br />
from basic earnings per share, diluted<br />
earnings per share must also be reported<br />
if the assumed conversion and exercise<br />
of outstanding share options, unvested<br />
deferred share awards and convertible<br />
debt and certain forward contracts could<br />
increase the number of shares.<br />
Equity capital markets ( ECM )<br />
Primarily, activities connected with a<br />
company’s IPO or the placement of<br />
new shares. It also covers the privatization<br />
of state-owned companies.<br />
Euro commercial paper program<br />
Instrument allowing the fl exible issuance<br />
of unsecured, short-term debt by an<br />
issuer. A program may comprise several<br />
bond issues over a period of time.<br />
F<br />
Fair value<br />
Amount at which assets or liabilities<br />
would be exchanged between knowledgeable,<br />
willing and independent counterparties.<br />
Fair value is often identical to<br />
market price.<br />
68<br />
Family offi ce<br />
Financial services which are designed for<br />
families with very large and complex<br />
portfolios of assets and which protect<br />
customers’ interests on the basis of<br />
absolute independence through optimal<br />
management and comprehensive coordination<br />
of individual wealth components.<br />
Financial supply chain management<br />
Optimization of fi nancial payments along<br />
the supply chain.<br />
Futures<br />
Forward contracts standardized with<br />
respect to quantity, quality and delivery<br />
date, in which an instrument traded on<br />
the money, capital, precious metal or<br />
foreign exchange markets is to be<br />
delivered or taken receipt of at an agreed<br />
price at a certain future time. Cash<br />
settlement is often stipulated for such<br />
contracts ( e.g. futures based on equity<br />
indices ) to meet the obligation ( instead<br />
of delivery or receipt of securities ).<br />
G<br />
Goodwill<br />
The amount which the buyer of a<br />
company pays, taking account of future<br />
earnings, over and above the fair value<br />
of the company’s individually identifi able<br />
assets and liabilities.<br />
H<br />
Hedge fund<br />
A fund whose investors are generally<br />
institutions and wealthy individuals.<br />
Hedge funds can employ strategies which<br />
mutual funds are not permitted to use.<br />
Examples include short selling, leveraging<br />
and derivatives. Hedge fund returns are<br />
often uncorrelated with traditional investment<br />
returns.
<strong>Deutsche</strong> <strong>Bank</strong><br />
<strong>Annual</strong> Review 2010<br />
I<br />
International Financial <strong>Report</strong>ing<br />
Standards ( IFRS )<br />
Financial <strong>Report</strong>ing Rules of the International<br />
Accounting Standards Board to<br />
ensure globally transparent and comparable<br />
accounting and disclosure. Main<br />
objective is to present information that is<br />
useful in making economic decis ions,<br />
mainly for investors.<br />
Investment banking<br />
Generic term for capital market-oriented<br />
business. This primarily includes the<br />
issuing and trading of securities and their<br />
derivatives, interest and currency<br />
manage ment, corporate fi nance, M & A<br />
advisory, structured fi nance and<br />
private equity.<br />
Investor relations<br />
Investor relations describes the systematic<br />
and continuous two-way communication<br />
between companies and both current and<br />
potential providers of capital. Information<br />
is supplied on major corporate events,<br />
fi nancial results, business strategy and<br />
the capital market’s expectations of<br />
management. One objective of investor<br />
relations activities is to ensure that a<br />
company’s equity is appropriately valued<br />
by the market.<br />
L<br />
Leveraged buy-out<br />
Debt-fi nanced purchase of all or parts of<br />
a company or specifi c activities of a<br />
company. Interest and principal payments<br />
are fi nanced from the acquired company’s<br />
future revenues.<br />
04 – Further Information<br />
Glossary<br />
M<br />
Management buyout<br />
Purchase of a company’s <strong>entire</strong> outstanding<br />
shares by its management,<br />
thereby ending the company’s listing.<br />
Mezzanine<br />
Flexible, mixed form of fi nancing<br />
comprising equity and debt capital.<br />
Mortgage-backed securities ( MBS )<br />
Securities backed by mortgage loans.<br />
Sub-categories are residential mort gagebacked<br />
securities ( RMBS ) and commercial<br />
mortgage-backed securities ( CMBS ).<br />
O<br />
Option<br />
Right to purchase ( call option ) or sell ( put<br />
option ) a specifi c asset ( e.g. security or<br />
foreign exchange ) from or to a counterparty<br />
( option seller ) at a predetermined<br />
price on or before a specifi c future date.<br />
OTC derivatives<br />
Nonstandardized fi nancial instruments<br />
( derivatives ) not traded on a stock<br />
exchange, but directly between market<br />
participants ( over the counter ).<br />
P<br />
Portfolio<br />
Part or all of one or all categories of assets<br />
( e.g. securities, loans, equity invest ments<br />
or real estate ). Portfolios are formed<br />
primarily to diversify risk.<br />
Portfolio management<br />
Management and administration of a<br />
portfolio of securities for a client. This<br />
can involve the continous review of the<br />
portfolio and, if agreed with the client,<br />
purchases and sales.<br />
Pre-tax return on average active equity<br />
Income before income tax expense<br />
attributable to <strong>Deutsche</strong> <strong>Bank</strong> shareholders<br />
( annualized ), which is defi ned<br />
as income before income taxes less<br />
minority interest, as a percentage of<br />
average active equity.<br />
Prime services / brokerage<br />
Suite of products including clearing<br />
and settlement, custody, reporting and<br />
fi nancing of positions for institutional<br />
investors.<br />
69<br />
Private equity<br />
Equity investment in non-listed companies.<br />
Examples are venture capital and buyout<br />
funds.<br />
Q<br />
Quantitative investments<br />
Portfolios of equities, bonds as well as<br />
hedge funds. Portfolios are managed in<br />
a systematic and regulated framework<br />
applying fundamental investment<br />
principles. The choice of investment is<br />
determined by the processing of large<br />
data volumes while applying quantitative<br />
methods and techniques.<br />
R<br />
Rating<br />
External: standardized evaluation of issuers’<br />
credit standing and debt instruments,<br />
carried out by specialized agencies.<br />
Internal: detailed risk assessment of every<br />
exposure associated with an obligor.
<strong>Deutsche</strong> <strong>Bank</strong><br />
<strong>Annual</strong> Review 2010<br />
Registered shares<br />
Shares registered in a person’s name.<br />
As required under joint stock company<br />
law, that person is registered in the share<br />
register with certain personal information<br />
and the number of shares owned. Only<br />
those persons entered in the share<br />
register are deemed to be shareholders<br />
of the company and are entitled, for<br />
instance, to exercise rights at the General<br />
Meeting.<br />
Repo ( repurchase agreement )<br />
An agreement to repurchase securities<br />
sold ( genuine repurchase agreement<br />
where the asset remains the seller’s<br />
property ). From the buyer’s viewpoint,<br />
the transaction is a reverse repo.<br />
Residential mortgage-backed securities<br />
( RMBS )<br />
Mortgage-backed securities ( MBS ), which<br />
are backed by residential mortgage loans.<br />
S<br />
Sale and lease back<br />
Transaction in which one party sells assets<br />
such as real estate to another party and<br />
at the same time enters into an agreement<br />
to lease the assets for a pre-determined<br />
period of time.<br />
Sarbanes-Oxley Act ( SOX )<br />
U.S. capital market law passed in 2002 to<br />
strengthen corporate governance and<br />
restore investor confi dence in response to<br />
major corporate and accounting scandals.<br />
Legislation established standards ranging<br />
from additional Corporate Board responsibilities<br />
to criminal penalties for all<br />
companies that have listed their shares<br />
on a U.S. stock exchange.<br />
04 – Further Information<br />
Glossary<br />
Securitization<br />
Rights evidenced by securities ( e.g. shares<br />
or bonds ). Often replacing loans or<br />
fi nancing of various kinds of claims by<br />
issuing securities ( such as bonds or commercial<br />
paper ).<br />
Shareholder value<br />
Management concept that focuses<br />
strategic and operational decision-making<br />
on the steady growth of a company’s<br />
value. The guiding principle is that only<br />
returns above the cost of capital add<br />
value for shareholders.<br />
Sharia-compliant<br />
In accordance with Islamic law.<br />
SPAC<br />
( special purpose acquisition company )<br />
Publicly traded buy-out company that<br />
raises money in order to pursue the<br />
acquisition of an existing company.<br />
Subprime<br />
Used as a term to categorize U.S. mortgages<br />
representing loans with a higher<br />
expectation of risk.<br />
Sustainability<br />
Denotes the interplay of economy,<br />
ecology and social responsibility with the<br />
objective of sustainably advancing the<br />
basis for human life while preparing it for<br />
the future.<br />
Swaps<br />
Exchange of one payment fl ow for<br />
another. Interest rate swap: exchange<br />
of interest payment fl ows in the same<br />
currency with diff erent terms and<br />
conditions ( e.g. fi xed or fl oating ).<br />
Currency swap: exchange of interest<br />
payment fl ows and principal amounts<br />
in diff erent currencies.<br />
70<br />
T<br />
Trust-preferred securities<br />
Hybrid capital instruments characterized<br />
by profi t-related interest payments. Under<br />
banking supervisory regulations they are<br />
part of Tier 1 capital if interest payments<br />
are not accumulated in case of losses<br />
( noncumulative trust-preferred securities )<br />
and if the instruments do not have a<br />
stated maturity date or if they are not<br />
redeemable at the option of the holder.<br />
Otherwise they are included in Tier 2<br />
capital ( for example cumulative trust<br />
preferred securities ).<br />
Trust & Securities Services<br />
Broad range of administrative services for<br />
securities. They include, for example,<br />
securities custody, trust administration,<br />
issuing and paying agent services,<br />
depositary bank function for American<br />
Depositary Receipts ( ADRs ).<br />
U<br />
U.S. GAAP ( United States Generally<br />
Accepted Accounting Principles )<br />
U.S. accounting principles drawn up by<br />
the Financial Accounting Standards Board<br />
( FASB ) and the American Institute of<br />
Certifi ed Public Accountants ( AICPA ).<br />
In addition, the interpretations and<br />
explanations furnished by the Securities<br />
and Exchange Commission ( SEC ) are<br />
particularly relevant for companies listed<br />
on the stock exchange. As in the case of<br />
International Financing <strong>Report</strong>ing<br />
Standards, the main objective is to provide<br />
information useful for making decisions,<br />
especially for investors.
<strong>Deutsche</strong> <strong>Bank</strong><br />
<strong>Annual</strong> Review 2010<br />
Imprint / Publications<br />
<strong>Deutsche</strong> <strong>Bank</strong> Aktiengesellschaft<br />
Taunusanlage 12<br />
60262 Frankfurt am Main<br />
Germany<br />
Telephone: +49 69 91 00 0<br />
deutsche.bank@db.com<br />
Investor Relations<br />
Telephone: +49 69 91 03 80 80<br />
db.ir @ db.com<br />
Photos<br />
Martin Joppen, Frankfurt<br />
page 02<br />
Andreas Pohlmann, Munich<br />
page 09<br />
Matthias Ziegler, Munich<br />
pages 09, 10, 20 / 21, 34 / 35, 58 / 59,<br />
64 / 65 and cover<br />
04 – Further Information<br />
Imprint / Publications<br />
We will be pleased to send you the<br />
following publications relating to our<br />
fi nancial reporting<br />
Please note that <strong>Deutsche</strong> <strong>Bank</strong> Group’s<br />
annual report consists of two separate<br />
sections: <strong>Annual</strong> Review 2010 and Financial<br />
<strong>Report</strong> 2010.<br />
<strong>Annual</strong> Review 2010<br />
( German / English )<br />
Financial <strong>Report</strong> 2010<br />
( German / English )<br />
<strong>Annual</strong> <strong>Report</strong> 2010 on Form 20-F<br />
( English )<br />
<strong>Annual</strong> Financial Statements<br />
and Management <strong>Report</strong> of<br />
<strong>Deutsche</strong> <strong>Bank</strong> AG 2010<br />
( German / English )<br />
List of Advisory Council Members<br />
( German )<br />
Corporate Social Responsibility –<br />
<strong>Report</strong> 2010<br />
( from May 2011 in German<br />
and English )<br />
How to order<br />
E-mail – Internet<br />
service-center @ bertelsmann.de<br />
www.deutsche-bank.com / 10<br />
Fax<br />
+49 18 05 07 08 08<br />
Telephone<br />
+49 18 05 80 22 00<br />
Post<br />
arvato logistics services<br />
Bestellservice <strong>Deutsche</strong> <strong>Bank</strong><br />
Gottlieb-Daimler-Strasse 1<br />
33428 Harsewinkel<br />
Germany<br />
Online<br />
All publications relating to our<br />
fi nancial reporting are available at:<br />
www.deutsche-bank.com / 10<br />
71<br />
Cautionary statement regarding forward-looking<br />
statements:<br />
This report contains forward-looking statements.<br />
Forward-looking statements are statements that<br />
are not historical facts; they include statements<br />
about our beliefs and expectations and the assumptions<br />
underlying them. These statements are based<br />
on plans, estimates and projections as they are<br />
current ly available to the management of <strong>Deutsche</strong><br />
<strong>Bank</strong>. Forward-looking statements therefore speak<br />
only as of the date they are made, and we undertake<br />
no obligation to update publicly any of them<br />
in light of new information or future events.<br />
By their very nature, forward-looking statements<br />
involve risks and uncertainties. A number of<br />
im portant factors could therefore cause actual<br />
results to diff er materially from those contained<br />
in any forward-looking statement. Such factors<br />
include the conditions in the fi nancial markets<br />
in Germany, in Europe, in the United States and<br />
elsewhere from which we derive a substantial<br />
portion of our trading revenues, potential defaults<br />
of borrowers or trading counterparties, the implementation<br />
of our management agenda, the reliability<br />
of our risk management policies, procedures<br />
and methods, and other risks referenced in our<br />
fi lings with the U.S. Securities and Exchange Commission.<br />
Such factors are described in detail in<br />
our SEC Form 20-F of 15 March 2011 in the section<br />
“Risk Factors”. Copies of this document are<br />
available upon request or can be downloaded from<br />
www.deutsche-bank.com / ir.<br />
Climate neutral:<br />
This report is climate neutral. The amount of greenhouse<br />
gas emissions caused by production and<br />
distribution ( 73 t CO 2 equivalents ) has been off set<br />
by additional investments in a high quality climate<br />
pro tection project.
Financial Calendar<br />
Financial Calendar<br />
2011<br />
April 28, 2011<br />
Interim <strong>Report</strong> as of March 31, 2011<br />
May 26, 2011<br />
<strong>Annual</strong> General Meeting in the Festhalle<br />
Frankfurt am Main (Exhibition Center)<br />
May 27, 2011<br />
Dividend payment<br />
July 26, 2011<br />
Interim <strong>Report</strong> as of June 30, 2011<br />
October 25, 2011<br />
Interim <strong>Report</strong> as of September 30, 2011<br />
<strong>2012</strong><br />
February 2, <strong>2012</strong><br />
Preliminary results for the 2011 fi nancial year<br />
March 20, <strong>2012</strong><br />
<strong>Annual</strong> <strong>Report</strong> 2011 and Form 20-F<br />
April 26, <strong>2012</strong><br />
Interim <strong>Report</strong> as of March 31, <strong>2012</strong><br />
May 31, <strong>2012</strong><br />
<strong>Annual</strong> General Meeting in the Festhalle<br />
Frankfurt am Main (Exhibition Center)<br />
June 1, <strong>2012</strong><br />
Dividend payment<br />
July 31, <strong>2012</strong><br />
Interim <strong>Report</strong> as of June 30, <strong>2012</strong><br />
October 30, <strong>2012</strong><br />
Interim <strong>Report</strong> as of September 30, <strong>2012</strong>
Global<br />
presence<br />
Close to our clients<br />
Branch business with private & business clients<br />
Branch and / or subsidiary<br />
Representative offi ces ( only )<br />
Major regional hubs<br />
New York<br />
Frankfurt am Main<br />
London
Main<br />
on<br />
Dubai<br />
Singapore<br />
Tokyo
The uncertainty of our times reminds us that we need to be more<br />
vigilant and more sensitive to changes while consistently making<br />
good use of our opportunities. To benefi t everyone: our shareholders,<br />
our clients, our employees and society. We need to be fi nancially<br />
successful to be a valuable long-term partner for our four key groups<br />
of stakeholders. And that is what we intend to be, not only in times<br />
like these, but also in the future.<br />
<strong>Deutsche</strong> <strong>Bank</strong> took several major steps forward in 2010. We are now<br />
in a signifi cantly stronger position than before the crisis and on<br />
track to achieve the targets we have set ourselves for earnings and<br />
growth. We have invested in these objectives and are working on<br />
them with a passion.<br />
Delivering in the face of uncertainty
Our identity<br />
Our mission<br />
We compete to be the leading global provider of fi nancial<br />
solutions, creating lasting value for our clients, our shareholders,<br />
our people and the communities in which we operate.<br />
Our promise<br />
Excellence — in idea origination and execution, in advice,<br />
product and service, delivering one bank with all its resources<br />
and capabilities.<br />
Relevant client solutions — understanding diverse client needs,<br />
adding value, building trust and commitments that endure.<br />
Responsibility — acting today, thinking about tomorrow, demonstrating<br />
transparency and leadership.<br />
Our brand<br />
<strong>Deutsche</strong> is clear: we are here to perform – in business and beyond.<br />
We do this with a unique mix of passion and precision.<br />
This measured approach gives us the confi dence to enable agile<br />
minds to look beyond the obvious, gaining advantage for every one<br />
we work with.
<strong>Deutsche</strong> <strong>Bank</strong><br />
Financial <strong>Report</strong> 2010
<strong>Deutsche</strong> <strong>Bank</strong><br />
Financial <strong>Report</strong> 2010<br />
<strong>Deutsche</strong> <strong>Bank</strong><br />
The Group at a glance<br />
2010 2009<br />
Share price at period-end 1 € 39.10 € 44.98<br />
Share price high 1 € 55.11 € 53.05<br />
Share price low 1 € 35.93 € 14.00<br />
Basic earnings per share 2 € 3.07 € 7.21<br />
Diluted earnings per share 2 € 2.92 € 6.94<br />
Average shares outstanding, in m., basic 2 753 689<br />
Average shares outstanding, in m., diluted 2 791 717<br />
Return on average shareholders’ equity (post tax) 5.5 % 14.6 %<br />
Pre-tax return on average shareholders’ equity 9.5 % 15.3 %<br />
Pre-tax return on average active equity 9.6 % 15.1 %<br />
Book value per basic share outstanding 3 € 52.38 € 52.65<br />
Cost/income ratio 4 81.6 % 72.0 %<br />
Compensation ratio 5 44.4 % 40.5 %<br />
Noncompensation ratio 6 37.3 % 31.5 %<br />
in € m. in € m.<br />
Total net revenues 28,567 27,952<br />
Provision for credit losses 1,274 2,630<br />
Total noninterest expenses 23,318 20,120<br />
Income (loss) before income taxes 3,975 5,202<br />
Net income (loss) 2,330 4,958<br />
Dec 31, 2010 Dec 31, 2009<br />
in € bn. in € bn.<br />
Total assets 1,906 1,501<br />
Shareholders’ equity 48.8 36.6<br />
Core Tier 1 capital ratio 7 8.7 % 8.7 %<br />
Tier 1 capital ratio 8 12.3 % 12.6 %<br />
Number Number<br />
Branches 3,083 1,964<br />
thereof in Germany 2,087 961<br />
Employees (full-time equivalent) 102,062 77,053<br />
thereof in Germany<br />
Long-term rating<br />
49,265 27,321<br />
Moody’s Investors Service Aa3 Aa1<br />
Standard & Poor’s A+ A+<br />
Fitch Ratings AA– AA–<br />
1 For comparison purposes, the share prices have been adjusted for all periods before October 6, 2010 to reflect the impact of the subscription rights issue in<br />
connection with the capital increase.<br />
2 The number of average basic and diluted shares outstanding has been adjusted for all periods before October 6, 2010 to reflect the effect of the bonus element of the<br />
subscription rights issue in connection with the capital increase.<br />
3 Book value per basic share outstanding is defined as shareholders’ equity divided by the number of basic shares outstanding (both at period end).<br />
4 Total noninterest expenses as a percentage of total net interest income before provision for credit losses plus noninterest income.<br />
5 Compensation and benefits as a percentage of total net interest income before provision for credit losses plus noninterest income.<br />
6 Noncompensation noninterest expenses which is defined as total noninterest expenses less compensation and benefits, as a percentage of total net interest income<br />
before provision for credit losses plus noninterest income.<br />
7 The capital ratios relate the respective capital to risk weighted assets for credit, market and operational risk. Excludes transitional items pursuant to Section 64h (3)<br />
German <strong>Bank</strong>ing Act.<br />
8<br />
The Tier 1 capital ratio relates Tier 1 capital to risk-weighted assets for credit, market and operational risk. The Tier 1 capital ratio excludes transitional items pursuant<br />
to Section 64h (3) German <strong>Bank</strong>ing Act.<br />
Due to rounding, numbers presented throughout this document may not add up precisely to the totals provided and percentages may not precisely reflect the<br />
absolute figures.
<strong>Deutsche</strong> <strong>Bank</strong> Content 1<br />
Financial <strong>Report</strong> 2010<br />
01 –<br />
Management <strong>Report</strong> and <strong>Report</strong> of the<br />
Supervisory Board<br />
Operating and Financial Review – 4<br />
<strong>Report</strong> of the Supervisory Board – 43<br />
Risk <strong>Report</strong> – 50<br />
Internal Control over Financial <strong>Report</strong>ing – 118<br />
Information pursuant to Section 315 (4) of the German<br />
Commercial Code and Explanatory <strong>Report</strong> – 123<br />
Compensation <strong>Report</strong> – 128<br />
Corporate and Social Responsibility – 138<br />
Outlook – 141<br />
02 –<br />
Consolidated Financial Statements<br />
Consolidated Statement of Income – 151<br />
Consolidated Statement of Comprehensive Income – 152<br />
Consolidated Balance Sheet – 153<br />
Consolidated Statement of Changes in Equity – 154<br />
Consolidated Statement of Cash Flows – 156<br />
Notes to the Consolidated Financial Statements including<br />
Table of Content – 157<br />
03 –<br />
Confirmations<br />
Independent Auditors’ <strong>Report</strong> – 372<br />
Responsibility Statement by the Management Board – 374
<strong>Deutsche</strong> <strong>Bank</strong> Content 2<br />
Financial <strong>Report</strong> 2010<br />
04 –<br />
Corporate Governance Statement /<br />
Corporate Governance <strong>Report</strong><br />
Management Board and Supervisory Board – 376<br />
<strong>Report</strong>ing and Transparency – 386<br />
Related Party Transactions – 387<br />
Auditing and Controlling – 387<br />
Compliance with the German Corporate Governance Code – 389<br />
05 –<br />
Supplementary Information<br />
Management Board – 392<br />
Supervisory Board – 393<br />
Advisory Boards – 395<br />
Group Five-Year Record – 400<br />
Declaration of Backing – 401<br />
Glossary – 402<br />
Impressum – Publications – 408
Management <strong>Report</strong> and <strong>Report</strong> of the Supervisory Board<br />
Operating and Financial Review<br />
<strong>Deutsche</strong> <strong>Bank</strong> Group – 4<br />
Executive Summary – 5<br />
Results of Operations – 9<br />
Financial Position – 28<br />
Liquidity and Capital Resources – 40<br />
Value-based Management – 42<br />
Events after the <strong>Report</strong>ing Date – 42<br />
<strong>Report</strong> of the Supervisory Board – 43<br />
Risk <strong>Report</strong><br />
Risk Management Executive Summary – 50<br />
Risk and Capital Management – 52<br />
Risk and Capital Strategy – 55<br />
Categories of Risk – 55<br />
Risk Management Tools – 58<br />
Credit Risk – 60<br />
Market Risk – 88<br />
Operational Risk – 101<br />
Liquidity Risk at <strong>Deutsche</strong> <strong>Bank</strong> Group (excluding Postbank) – 105<br />
Capital Management – 113<br />
Balance Sheet Management – 115<br />
Overall Risk Position – 116<br />
Internal Control over Financial <strong>Report</strong>ing – 118<br />
Information pursuant to Section 315 (4) of the German Commercial Code and Explanatory <strong>Report</strong> – 123<br />
Compensation <strong>Report</strong><br />
Principles of the Compensation System for Management Board Members – 128<br />
Compensation System for Supervisory Board Members – 136<br />
Corporate and Social Responsibility<br />
Employees and Social Responsibility – 138<br />
Corporate Social Responsibility – 139<br />
Outlook – 141
<strong>Deutsche</strong> <strong>Bank</strong> 01 – Management <strong>Report</strong> 4<br />
Financial <strong>Report</strong> 2010 Operating and Financial Review<br />
Operating and Financial Review<br />
The following discussion and analysis should be read in conjunction with the consolidated financial statements<br />
and the related notes to them. Our consolidated financial statements for the years ended December 31, 2010<br />
and 2009 have been audited by KPMG AG Wirtschaftsprüfungsgesellschaft that issued an unqualified opinion.<br />
<strong>Deutsche</strong> <strong>Bank</strong> Group<br />
Our Organization<br />
Headquartered in Frankfurt am Main, Germany, we are the largest bank in Germany, and one of the largest<br />
financial institutions in Europe and the world, as measured by total assets of € 1,906 billion as of December 31,<br />
2010. As of that date, we employed 102,062 people on a full-time equivalent basis and operated in 74 countries<br />
out of 3,083 branches worldwide, of which 68 % were in Germany. We offer a wide variety of investment, financial<br />
and related products and services to private individuals, corporate entities and institutional clients around<br />
the world.<br />
Group Divisions<br />
We are organized into the Group Divisions Corporate & Investment <strong>Bank</strong> (CIB), Private Clients and Asset<br />
Management (PCAM) and Corporate Investments (CI).<br />
Corporate & Investment <strong>Bank</strong><br />
In CIB, we carry out our capital markets business including our origination, sales and trading activities in debt,<br />
equity and other securities, as well as our advisory, credit and transaction banking businesses. CIB’s institutional<br />
clients are public sector clients like sovereign countries and multinational organizations, and private sector clients<br />
like medium-sized companies and multinational corporations.<br />
CIB is further sub-divided into the Corporate Divisions Corporate <strong>Bank</strong>ing & Securities (CB&S) and Global<br />
Transaction <strong>Bank</strong>ing (GTB).<br />
CB&S includes the Business Divisions Markets and Corporate Finance, which globally carry out our securities<br />
origination, sales and trading businesses, as well as our mergers and acquisitions advisory and corporate<br />
finance businesses.<br />
GTB includes our product offerings in trade finance, cash management and trust & securities services for financial<br />
institutions and other companies.<br />
Private Clients and Asset Management<br />
PCAM is further sub-divided into the Corporate Divisions Asset and Wealth Management (AWM) and Private &<br />
Business Clients (PBC).<br />
AWM consists of the Asset Management Business Division (AM) and the Private Wealth Management Business<br />
Division (PWM). The global retail mutual fund business of our subsidiary DWS forms part of AM. Furthermore,<br />
AM offers a variety of products to institutional clients like pension funds and insurance companies, including<br />
traditional investments, hedge funds as well as specific real estate investments. PWM offers its products<br />
globally to high net worth clients and ultra high net worth individuals, their families and selected institutions.<br />
PWM offers its demanding clients an integrated approach to wealth management, including succession planning<br />
and philanthropic advisory services.
<strong>Deutsche</strong> <strong>Bank</strong> 01 – Management <strong>Report</strong> 5<br />
Financial <strong>Report</strong> 2010 Operating and Financial Review<br />
PBC offers retail clients as well as small and medium sized business customers a variety of products including<br />
accounts, loan and deposit services as well as investment advice. In our German homemarket, we strengthened<br />
our leading market position through the acquisition of Postbank. Besides Germany, PBC has operated for a long<br />
time in Italy, Spain, Belgium and Portugal, and for several years in Poland. Furthermore, we make focused<br />
investments in emerging markets in Asia, for instance in China and India.<br />
Corporate Investments<br />
The CI Group Division manages our global principal investment activities.<br />
Executive Summary<br />
The Global Economy<br />
Following the marked contraction in 2009, with a decline of almost 1 % in global GDP, the world economy grew<br />
again by an estimated 4.75 % in 2010. Three factors played a major role in this development: stimuli from<br />
expansive monetary and fiscal policies, investments that had been postponed in 2009 and were subsequently<br />
made in 2010, and the building up of inventory. However, momentum has slowed since around autumn 2010<br />
as the effect of these factors tailed off.<br />
While the U.S. economy is estimated to have grown by almost 3 % on average during 2010, the eurozone<br />
continued to lag behind in the global economic recovery with real growth of just 1.75 %. In some countries of<br />
the eurozone, the dampening effects of massive consolidation programs, and structural adjustments, especially<br />
in the real estate sector, made themselves felt. In addition, despite financial aid for Greece and Ireland and<br />
plans to establish a permanent crisis mechanism, by the end of the year concerns had increased in the financial<br />
markets about the long-term solvency of some countries of the eurozone. In line with this, there was a dramatic<br />
widening in yield spreads between government bonds from these countries and German government bonds.<br />
By contrast, the German economy – supported by strong stimuli stemming from external trade and also from a<br />
recovering domestic economy – expanded by 3.6 %, the highest growth rate since reunification. The German<br />
labor market continued to develop extremely favorably compared with that of other countries.<br />
The emerging market economies grew by an estimated 7.5 % last year, compared with 2.5 % in 2009. Growth<br />
in the Asian emerging markets was probably even close to 9.5 %. In China, where the pace of growth had slowed<br />
only slightly in 2009 to 8.7 %, the economy grew by 10.3 % in 2010.<br />
The <strong>Bank</strong>ing Industry<br />
Three key issues dominated the global banking sector in the past year – business recovery after the slump<br />
during the financial crisis, preparations for the most extensive legal and regulatory reforms in decades, as well<br />
as the growing risks associated with high sovereign debt in many industrial countries.
<strong>Deutsche</strong> <strong>Bank</strong> 01 – Management <strong>Report</strong> 6<br />
Financial <strong>Report</strong> 2010 Operating and Financial Review<br />
In operating terms, banks made good progress overall, albeit from a low base. In traditional lending business,<br />
loan loss provisions reduced significantly, though the absolute burden was still high. At the same time, 2010<br />
saw a stabilization in loan volumes, which had contracted the year before, thanks to a slight rise in demand.<br />
This was at least in part attributable to central banks’ continuing expansionary monetary policies.<br />
Capital markets business produced mixed results compared with the very good performance of 2009. The<br />
volume of corporate and sovereign bond issues fell slightly over the high prior year figure, though high-yield<br />
paper issuance volumes rose. Equity issuance stayed robust, with growth especially strong in initial public<br />
offerings. The M&A business gained traction, but remained weak. Overall, investment banking saw a return of<br />
market participants who had cut back their activities during the financial crisis. This led to more intense competition<br />
and narrower margins.<br />
In asset management, banks benefited from rising valuations in most asset classes and from higher inflows. In<br />
transaction business they profited from the economic recovery and a dynamic rebound in world trade, nearly to<br />
pre-crisis levels.<br />
Despite this growth, the banking industry continued to be only moderately profitable overall, recording single<br />
digit returns on equity for the most part. Almost all major European and U.S. banks reported net profits, while<br />
the share of unprofitable, smaller banks decreased significantly.<br />
Alongside operating performance, 2010 was shaped primarily by far-reaching regulatory measures planned by<br />
legislators and supervisory authorities. The Basel III reform of capital requirements will probably prove to be the<br />
most significant change in the long term. The final details have been largely agreed so that the new standards are<br />
now set to be implemented in nearly all of the world’s major financial markets. It is still uncertain, though, whether<br />
implementation of the rules will actually be harmonized throughout each country and what concrete effects the<br />
new framework will have on banks’ business.<br />
Together with the forthcoming regulatory changes, the banking environment in 2010 was also greatly impacted<br />
by the European sovereign debt crisis and fears of a weak recovery or even a relapse of some major economies<br />
into recession. While the robust recovery of the global economy over the last few months has brightened the<br />
prospects for banks’ business, the public debt problems encountered especially by several euro-area countries,<br />
and their lack of competitiveness, continued to weigh on market sentiment. These concerns spilled over into<br />
the banking sector at times – causing the funding markets for financial institutions in severely affected countries<br />
to dry up, and attracting criticism of the extensive cross-border activities of particular European banks as<br />
well as generally giving rise to significant financial market volatility.<br />
<strong>Deutsche</strong> <strong>Bank</strong><br />
In this environment, we generated a net income of € 2.3 billion in 2010, compared to € 5.0 billion in 2009, a solid<br />
result considering the impact of several significant factors. These factors include, firstly, certain valuation- and<br />
integration-related charges from the acquisitions of the commercial banking activities from ABN AMRO in the<br />
Netherlands, of Sal. Oppenheim/BHF-BANK and of Postbank, the latter including a charge of € 2.3 billion in the<br />
third quarter 2010. Secondly, during the year we invested in the integration of our CIB businesses, in our IT<br />
platform and in other business growth initiatives. Thirdly, deferred compensation expenses were significantly<br />
higher in 2010 reflecting changes in compensation structures implemented in 2009. Additionally, the aforementioned<br />
acquisitions increased our revenue and expenses run rates, as well as our balance sheet, risk<br />
weighted assets and invested assets. Moreover, a shift in foreign exchange rates, in particular between the<br />
U.S. dollar and the euro, contributed to an increase in our reported euro revenues and expenses, with an overall<br />
positive impact on net income.
<strong>Deutsche</strong> <strong>Bank</strong> 01 – Management <strong>Report</strong> 7<br />
Financial <strong>Report</strong> 2010 Operating and Financial Review<br />
Net revenues of € 28.6 billion in 2010 were among the highest ever generated by us and increased by € 615 million<br />
from € 28.0 billion in 2009. CIB’s net revenues increased from € 18.8 billion in 2009 to € 20.9 billion in 2010.<br />
Overall Sales & Trading net revenues for 2010 were € 12.8 billion, compared with € 12.2 billion in 2009. This<br />
primarily reflects lower mark-downs from legacy positions, lower trading losses in Equity Derivatives as well as<br />
increased client activity across flow products and structured solutions in Credit Trading. This was partly offset<br />
by the normalization of bid-offer spreads and subdued client activity in Money Markets and Rates. Origination<br />
and Advisory revenues increased to € 2.5 billion in 2010 (2009: € 2.2 billion). PCAM’s net revenues were<br />
€ 10.0 billion in 2010, an increase of € 1.8 billion compared to 2009. This development was mainly attributable<br />
to the first time consolidation of Postbank as well as the acquisition of Sal. Oppenheim/BHF-BANK. In addition,<br />
higher deposits revenues in PBC were driven by improved margins. In AWM, the non-recurrence of impairment<br />
charges recognized in 2009 related to RREEF investments, as well as higher fee income in a more favorable<br />
market environment, also contributed to the increase. In CI, net revenues in the full year 2010 were negative<br />
€ 2.0 billion, versus positive € 1.0 billion in 2009. Revenues in both years were materially impacted by our<br />
investment in Postbank, including the aforementioned charge in the third quarter 2010 and several positive<br />
effects in 2009.<br />
In 2010, provision for credit losses was € 1.3 billion, versus € 2.6 billion in 2009, primarily driven by significantly<br />
decreased provisions for assets reclassified in accordance with IAS 39.<br />
Our noninterest expenses were € 23.3 billion in 2010, versus € 20.1 billion in 2009. Half of the increase was<br />
attributable to the aforementioned acquisitions in 2010. In addition, compensation expenses in 2010 reflected<br />
higher amortization expenses for deferred compensation following the aforementioned change in compensation<br />
structures, including the impact of accelerated amortization for employees eligible for career retirement. The<br />
remainder of the increase was due to the aforementioned investments in the integration of our CIB businesses,<br />
in our IT platform and in other business growth initiatives.<br />
We recorded income before income taxes of € 4.0 billion in 2010, including the aforementioned € 2.3 billion<br />
charge taken in the third quarter 2010 related to the Postbank acquisition, compared with € 5.2 billion for 2009.<br />
Our pre-tax return on average active equity was 9.6 % in 2010, versus 15.1 % in 2009. Our pre-tax return on<br />
average shareholders’ equity was 9.5 % in 2010 and 15.3 % in 2009. Diluted earnings per share were € 2.92 in<br />
2010 and € 6.94 in 2009.
<strong>Deutsche</strong> <strong>Bank</strong> 01 – Management <strong>Report</strong> 8<br />
Financial <strong>Report</strong> 2010 Operating and Financial Review<br />
The aforementioned shifts in currencies led to an increase in our assets, liabilities and invested assets compared<br />
to December 31, 2009. After the successfully completed capital increase, our Tier 1 capital ratio was 12.3 %<br />
and our Core Tier 1 capital ratio was 8.7 % as of December 31, 2010. Risk-weighted assets at year-end 2010<br />
were € 346 billion, versus € 273 billion at year-end 2009, largely as a result of € 60 billion attributable to the<br />
first time consolidation of Postbank.<br />
The following table presents our condensed consolidated statement of income for 2010 and 2009.<br />
in € m.<br />
(unless stated otherwise) 2010 2009<br />
2010 increase (decrease)<br />
from 2009<br />
in € m. in %<br />
Net interest income 15,583 12,459 3,124 25<br />
Provision for credit losses 1,274 2,630 (1,356) (52)<br />
Net interest income after provision for credit losses 14,309 9,829 4,480 46<br />
Commissions and fee income 10,669 8,911 1,758 20<br />
Net gains (losses) on financial assets/liabilities<br />
at fair value through profit or loss 3,354 7,109 (3,755) (53)<br />
Net gains (losses) on financial assets available for sale 201 (403) 604 N/M<br />
Net income (loss) from equity method investments (2,004) 59 (2,063) N/M<br />
Other income (loss) 764 (183) 947 N/M<br />
Total noninterest income 12,984 15,493 (2,509) (16)<br />
Total net revenues 27,293 25,322 1,971 8<br />
Compensation and benefits 12,671 11,310 1,361 12<br />
General and administrative expenses 10,133 8,402 1,731 21<br />
Policyholder benefits and claims 485 542 (57) (11)<br />
Impairment of intangible assets 29 (134) 163 N/M<br />
Restructuring activities – – – N/M<br />
Total noninterest expenses 23,318 20,120 3,198 16<br />
Income (loss) before income taxes 3,975 5,202 (1,227) (24)<br />
Income tax expense (benefit) 1,645 244 1,401 N/M<br />
Net income (loss) 2,330 4,958 (2,628) (53)<br />
Net income (loss) attributable to noncontrolling interests 20 (15) 35 N/M<br />
Net income (loss) attributable to <strong>Deutsche</strong> <strong>Bank</strong> shareholders 2,310 4,973 (2,663) (54)<br />
N/M – Not meaningful
<strong>Deutsche</strong> <strong>Bank</strong> 01 – Management <strong>Report</strong> 9<br />
Financial <strong>Report</strong> 2010 Operating and Financial Review<br />
Results of Operations<br />
Consolidated Results of Operations<br />
You should read the following discussion and analysis in conjunction with the consolidated financial statements.<br />
Net Interest Income<br />
The following table sets forth data related to our Net interest income.<br />
in € m.<br />
(unless stated otherwise) 2010 2009<br />
2010 increase (decrease)<br />
from 2009<br />
in € m. in %<br />
Total interest and similar income 28,779 26,953 1,826 7<br />
Total interest expenses 13,196 14,494 (1,298) (9)<br />
Net interest income 15,583 12,459 3,124 25<br />
Average interest-earning assets 1 993,780 879,601 114,179 13<br />
Average interest-bearing liabilities 1 933,537 853,383 80,154 9<br />
Gross interest yield 2 2.90 % 3.06 % (0.16) ppt (5)<br />
Gross interest rate paid 3 1.41 % 1.70 % (0.29) ppt (17)<br />
Net interest spread 4 1.48 % 1.37 % 0.11 ppt 8<br />
Net interest margin 5 1.57 % 1.42 % 0.15 ppt 11<br />
ppt – Percentage points<br />
1 Average balances for each year are calculated in general based upon month-end balances.<br />
2 Gross interest yield is the average interest rate earned on our average interest-earning assets.<br />
3 Gross interest rate paid is the average interest rate paid on our average interest-bearing liabilities.<br />
4 Net interest spread is the difference between the average interest rate earned on average interest-earning assets and the average interest rate paid on average<br />
interest-bearing liabilities.<br />
5 Net interest margin is net interest income expressed as a percentage of average interest-earning assets.<br />
Net interest income in 2010 was € 15.6 billion, an increase of € 3.1 billion, or 25 %, versus 2009. The improvement<br />
was primarily driven by a decrease in interest expenses, mainly due to a shift in liabilities from higher<br />
yields, originated in prior years, to current market rates and due to higher market rates at the beginning of 2009.<br />
In addition, interest income improved due to an increase in average interest-earning assets by € 114 billion,<br />
mainly in Corporate <strong>Bank</strong>ing & Securities, which exceeded the increase in average interest-bearing liabilities.<br />
These developments resulted in a widening of our net interest spread by 11 basis points and of our net interest<br />
margin by 15 basis points.<br />
The development of our net interest income is also impacted by the accounting treatment of some of our<br />
hedging-related derivative transactions. We enter into nontrading derivative transactions primarily as economic<br />
hedges of the interest rate risks of our nontrading interest-earning assets and interest-bearing liabilities. Some<br />
of these derivatives qualify as hedges for accounting purposes while others do not. When derivative transactions<br />
qualify as hedges of interest rate risks for accounting purposes, the interest arising from the derivatives is<br />
reported in interest income and expense, where it offsets interest flows from the hedged items. When derivatives<br />
do not qualify for hedge accounting treatment, the interest flows that arise from those derivatives will appear<br />
in trading income.
<strong>Deutsche</strong> <strong>Bank</strong> 01 – Management <strong>Report</strong> 10<br />
Financial <strong>Report</strong> 2010 Operating and Financial Review<br />
Net Gains (Losses) on Financial Assets/Liabilities at Fair Value through Profit or Loss<br />
The following table sets forth data related to our Net gains (losses) on financial assets/liabilities at fair value<br />
through profit or loss.<br />
in € m.<br />
(unless stated otherwise) 2010 2009<br />
2010 increase (decrease)<br />
from 2009<br />
in € m. in %<br />
CIB – Sales & Trading (equity) 451 1,125 (674) (60)<br />
CIB – Sales & Trading (debt and other products) 2,912 4,130 (1,218) (29)<br />
Other (9) 1,854 (1,863) N/M<br />
Total net gains (losses) on financial assets/<br />
liabilities at fair value through profit or loss 3,354 7,109 (3,755) (53)<br />
N/M – Not meaningful<br />
Net gains on financial assets/liabilities at fair value through profit or loss decreased by € 3.8 billion, particularly<br />
offset by increases in net interest income. In Sales & Trading (debt and other products), Net gains on financial<br />
assets/liabilities at fair value through profit or loss were € 2.9 billion in 2010, compared to € 4.1 billion in 2009.<br />
This decrease was mainly driven by Money Markets, Rates and Emerging Markets due to less favorable market<br />
conditions compared to 2009. Partly offsetting were lower mark-downs from legacy positions in Credit Trading. In<br />
Sales & Trading (equity), net gains (losses) on financial assets/liabilities at fair value through profit or loss were<br />
gains of € 451 million in 2010, compared to € 1.1 billion in 2009. This decline was mainly driven by Cash Trading,<br />
as client activity decreased, partly offset by lower trading losses in Equity derivatives. In other products, net<br />
gains on financial assets/liabilities at fair value through profit or loss in 2010 were negative € 9 million, compared<br />
to positive € 1.9 billion in 2009. The decrease reflects higher gains related to our stake in Postbank recognized<br />
in CI in 2009, gains from derivative contracts used to hedge effects on shareholders’ equity, resulting<br />
from obligations under share-based compensation plans, recorded in C&A in 2009, and mark-to-market losses<br />
on new loans and loan commitments held at fair value from Loan Products in CIB.<br />
Net Interest Income and Net Gains (Losses) on Financial Assets/Liabilities at Fair Value through<br />
Profit or Loss<br />
Our trading and risk management businesses include significant activities in interest rate instruments and related<br />
derivatives. Under IFRS, interest and similar income earned from trading instruments and financial instruments<br />
designated at fair value through profit or loss (e.g., coupon and dividend income), and the costs of funding net<br />
trading positions are part of net interest income. Our trading activities can periodically shift income between net<br />
interest income and net gains (losses) on financial assets/liabilities at fair value through profit or loss depending<br />
on a variety of factors, including risk management strategies.<br />
In order to provide a more business-focused discussion, the following table presents net interest income and<br />
net gains (losses) on financial assets/liabilities at fair value through profit or loss by group division and by product<br />
within the Corporate & Investment <strong>Bank</strong>.
<strong>Deutsche</strong> <strong>Bank</strong> 01 – Management <strong>Report</strong> 11<br />
Financial <strong>Report</strong> 2010 Operating and Financial Review<br />
in € m.<br />
(unless stated otherwise) 2010 2009<br />
2010 increase (decrease)<br />
from 2009<br />
in € m. in %<br />
Net interest income 15,583 12,459 3,124 25<br />
Total net gains (losses) on financial assets/<br />
liabilities at fair value through profit or loss 3,354 7,109 (3,755) (53)<br />
Total net interest income and net gains (losses)<br />
on financial assets/liabilities at fair value through profit or loss 18,937 19,568 (631) (3)<br />
Breakdown by Group Division/CIB product: 1<br />
Sales & Trading (equity) 2,266 2,047 218 11<br />
Sales & Trading (debt and other products) 9,204 9,725 (521) (5)<br />
Total Sales & Trading 11,469 11,772 (302) (3)<br />
Loan products 2 778 777 1 0<br />
Transaction services 1,497 1,180 317 27<br />
Remaining products 3 336 240 97 40<br />
Total Corporate & Investment <strong>Bank</strong> 14,081 13,969 112 1<br />
Private Clients and Asset Management 4,708 4,157 550 13<br />
Corporate Investments (184) 793 (977) N/M<br />
Consolidation & Adjustments 331 649 (317) (49)<br />
Total net interest income and net gains (losses)<br />
on financial assets/liabilities at fair value through profit or loss 18,937 19,568 (631) (3)<br />
N/M – Not meaningful<br />
1 This breakdown reflects net interest income and net gains (losses) on financial assets/liabilities at fair value through profit or loss only. For a discussion of the group<br />
divisions’ total revenues by product please refer to “Results of Operations by Segment”.<br />
2 Includes the net interest spread on loans as well as the fair value changes of credit default swaps and loans designated at fair value through profit or loss.<br />
3 Includes net interest income and net gains (losses) on financial assets/liabilities at fair value through profit or loss of origination, advisory and other products.<br />
Corporate & Investment <strong>Bank</strong> (CIB). Combined net interest income and net gains (losses) on financial assets/<br />
liabilities at fair value through profit or loss from Sales & Trading were € 11.5 billion in 2010, compared to<br />
€ 11.8 billion in 2009. The main driver for the decrease were lower revenues in Money Markets and Rates mainly<br />
due to lower bid-offer spreads and subdued client activity as a result of sovereign risk concerns. In addition, net<br />
interest income and net gains (losses) on financial assets/liabilities at fair value through profit or loss were down<br />
in Emerging Markets, due to less favorable market conditions compared to 2009. Partly offsetting these decreases<br />
were lower mark-downs from legacy positions and lower trading losses in Equity Derivatives in 2010 compared<br />
to 2009. Loan products were virtually unchanged, while in Transaction services, combined net interest income<br />
and net gains (losses) on financial assets/liabilities at fair value through profit or loss increased by € 317 million.<br />
This increase was attributable to growth across all businesses in Global Transaction <strong>Bank</strong>ing (including the<br />
aforementioned acquisition). Remaining products increased by € 97 million, mainly in Origination & Advisory.<br />
Private Clients and Asset Management (PCAM). Combined net interest income and net gains (losses) on<br />
financial assets/liabilities at fair value through profit or loss were € 4.7 billion in 2010, an increase of € 550 million,<br />
or 13 %, compared to 2009. The increase was mainly driven by the first-time consolidation of Postbank. In<br />
addition, the increase included higher net interest income from Credit products as well as from Deposits and<br />
Payment services.
<strong>Deutsche</strong> <strong>Bank</strong> 01 – Management <strong>Report</strong> 12<br />
Financial <strong>Report</strong> 2010 Operating and Financial Review<br />
Corporate Investments (CI). Combined net interest income and net gains (losses) on financial assets/ liabilities<br />
at fair value through profit or loss were negative € 184 million in 2010, compared to positive € 793 million in<br />
2009. The development primarily reflects the non-recurrence of gains recorded in 2009 related to our minority<br />
stake in Postbank.<br />
Consolidation & Adjustments (C&A). Combined net interest income and net gains (losses) on financial assets/<br />
liabilities at fair value through profit or loss were € 331 million in 2010, compared to € 649 million in 2009. The<br />
main reason for the decrease were gains recorded in 2009 from derivative contracts used to hedge effects on<br />
shareholders’ equity, resulting from obligations under share-based compensation plans, and higher net interest<br />
income on non-divisionalized assets and liabilities, including taxes.<br />
Provision for Credit Losses<br />
Provision for credit losses was € 1.3 billion in 2010, versus € 2.6 billion in 2009. The provision in CIB was<br />
€ 488 million, versus € 1.8 billion in the prior year, primarily reflecting a significant decrease in the provision for<br />
assets reclassified in accordance with IAS 39. The provision in PCAM was € 789 million, including € 56 million<br />
from Postbank. Excluding Postbank, the provision was € 733 million, versus € 806 million in the prior year. The<br />
development was influenced by measures taken on portfolio and country level. Provision for credit losses in 2009<br />
was positively impacted by changes in certain parameter and model assumptions, which reduced the provision<br />
by € 87 million in CIB and by € 146 million in PCAM.<br />
For further information on the provision for loan losses see the “Risk <strong>Report</strong> – Credit Risk – Movements in the<br />
Allowance for Loan Losses.”<br />
Remaining Noninterest Income<br />
The following table sets forth information on our Remaining noninterest income.<br />
in € m.<br />
(unless stated otherwise) 2010 2009<br />
2010 increase (decrease)<br />
from 2009<br />
in € m. in %<br />
Commissions and fee income 1 10,669 8,911 1,758 20<br />
Net gains (losses) on financial assets available for sale 201 (403) 604 N/M<br />
Net income (loss) from equity method investments (2,004) 59 (2,063) N/M<br />
Other income (loss) 764 (183) 947 N/M<br />
Total remaining noninterest income 9,630 8,384 1,246 15<br />
N/M – Not meaningful<br />
1 includes:<br />
2010 2009 in € m. in %<br />
Commissions and fees from fiduciary activities:<br />
Commissions for administration 491 392 99 25<br />
Commissions for assets under management 2,833 2,319 514 22<br />
Commissions for other securities business 205 214 (9) (4)<br />
Total<br />
Commissions, broker’s fees, mark-ups on securities underwriting<br />
and other securities activities:<br />
3,529 2,925 604 21<br />
Underwriting and advisory fees 2,148 1,767 381 22<br />
Brokerage fees 1,725 1,682 43 3<br />
Total 3,873 3,449 424 12<br />
Fees for other customer services 3,267 2,537 730 29<br />
Total commissions and fee income 10,669 8,911 1,758 20
<strong>Deutsche</strong> <strong>Bank</strong> 01 – Management <strong>Report</strong> 13<br />
Financial <strong>Report</strong> 2010 Operating and Financial Review<br />
Commissions and fee income. Total commissions and fee income was € 10.7 billion in 2010, an increase of<br />
€ 1.8 billion, or 20 %, compared to 2009. Commissions and fees from fiduciary activities increased € 604 million<br />
compared to the prior year, driven by higher asset based fees and performance fees in AM. Underwriting and<br />
advisory fees improved by € 381 million, or 22 %, mainly from a number of large initial public offerings (IPOs).<br />
Brokerage fees increased by € 43 million, or 3 %, primarily driven by the first time consolidation of Sal. Oppenheim/<br />
BHF-BANK as well as a stronger performance in PBC compared to the prior year. This positive development is<br />
partly offset by a decrease in CB&S. Fees for other customer services were up by € 730 million, or 29 %, from<br />
increased business activity.<br />
Net gains (losses) on financial assets available for sale. Net gains on financial assets available for sale were<br />
€ 201 million in 2010, versus net losses of € 403 million in 2009. The gains in 2010 mainly resulted from the sale<br />
of Axel Springer AG shares in CB&S, which had been pledged as loan collateral, and from the disposal of an<br />
available for sale security position in PBC. The losses in 2009 were primarily attributable to impairment charges<br />
related to investments in CB&S and to AM’s real estate business.<br />
Net income (loss) from equity method investments. Net loss from equity method investments was € 2.0 billion<br />
in 2010 versus a net gain of € 59 million in 2009. The net loss in 2010 included a charge of € 2.3 billion, partly<br />
offset by a positive equity pick-up, both related to our investment in Postbank. In 2009, the net income from<br />
equity method investments included gains from our investment in Postbank, partly offset by impairment charges<br />
on certain equity method investments in our commercial real estate business in CB&S.<br />
Other income (loss). Total Other income (loss) was a gain of € 764 million in 2010 versus a loss of € 183 million<br />
in 2009. The development was mainly driven by significantly reduced impairments on The Cosmopolitan of Las<br />
Vegas, higher results from derivatives qualifying for hedge accounting and a gain representing negative goodwill<br />
related to the commercial banking activities acquired from ABN AMRO in the Netherlands.
<strong>Deutsche</strong> <strong>Bank</strong> 01 – Management <strong>Report</strong> 14<br />
Financial <strong>Report</strong> 2010 Operating and Financial Review<br />
Noninterest Expenses<br />
The following table sets forth information on our noninterest expenses.<br />
2010 increase (decrease)<br />
from 2009<br />
in € m.<br />
(unless stated otherwise) 2010 2009 in € m. in %<br />
Compensation and benefits 12,671 11,310 1,361 12<br />
General and administrative expenses 1 10,133 8,402 1,731 21<br />
Policyholder benefits and claims 485 542 (57) (11)<br />
Impairment of intangible assets 29 (134) 163 N/M<br />
Restructuring activities – – – N/M<br />
Total noninterest expenses 23,318 20,120 3,198 16<br />
N/M – Not meaningful<br />
1 includes:<br />
2010 2009 in € m. in %<br />
IT costs 2,274 1,759 515 29<br />
Occupancy, furniture and equipment expenses 1,665 1,457 208 14<br />
Professional service fees 1,616 1,088 528 49<br />
Communication and data services 785 672 113 17<br />
Travel and representation expenses 558 408 150 37<br />
Payment, clearing and custodian services 418 406 12 3<br />
Marketing expenses 341 278 63 23<br />
Other expenses 2,476 2,334 142 6<br />
Total general and administrative expenses 10,133 8,402 1,731 21<br />
Compensation and benefits. In the full year 2010, compensation and benefits were up by € 1.4 billion, or 12 %,<br />
compared to 2009. The increase included € 660 million related to the acquisitions in 2010. In addition, the<br />
increase reflected higher amortization expenses for deferred compensation consequent to changes in compensation<br />
structures, mainly with respect to an increase in the proportion of deferred compensation, including<br />
the impact of accelerated amortization for employees eligible for career retirement.<br />
General and administrative expenses. General and administrative expenses increased by € 1.7 billion versus<br />
2009, reflecting € 1.0 billion from the acquisitions in 2010 including higher professional service fees. The<br />
remainder of the increase was due to the impact of foreign exchange movements as well as to higher investment<br />
spend in our IT platform and in business growth in 2010. The increase also included higher operating<br />
costs related to our consolidated investments, particularly The Cosmopolitan of Las Vegas property, which<br />
commenced operations in December 2010. General and administrative expenses in 2009 included € 316 million<br />
from a legal settlement with Huntsman Corp. and € 200 million related to our offer to repurchase certain products<br />
from private investors.<br />
Policyholder benefits and claims. Policyholder benefits and claims in 2010 were € 485 million, a decrease of<br />
€ 57 million compared to the prior year, resulting primarily from our Abbey Life business. These insurance-related<br />
charges are offset by related net gains on financial assets/liabilities at fair value through profit or loss.
<strong>Deutsche</strong> <strong>Bank</strong> 01 – Management <strong>Report</strong> 15<br />
Financial <strong>Report</strong> 2010 Operating and Financial Review<br />
Impairment of intangible assets. In 2010, an impairment charge of € 29 million on intangible assets relating to<br />
the client portfolio of an acquired domestic custody services business was recorded in GTB. In 2009, a reversal<br />
of an impairment charge on intangible assets of € 291 million was recorded in AM, related to DWS Investments<br />
in the U.S. (formerly DWS Scudder). This positive effect was partly offset by goodwill impairment charges of<br />
€ 151 million, which were related to a consolidated RREEF infrastructure investment.<br />
Income Tax Expense<br />
The income tax expense of € 1.6 billion recorded for 2010 was impacted by the Postbank related charge of<br />
€ 2.3 billion, which did not have a corresponding tax benefit. This was partly offset by improved U.S. income<br />
tax positions and a favorable geographic mix of income. By contrast, income tax expense in 2009 of € 244 million<br />
benefited from the recognition of previously unrecognized deferred tax assets in the U.S and favorable outcomes<br />
of tax audit settlements. The effective tax rates were 41.4 % in 2010 and 4.7 % in 2009.
<strong>Deutsche</strong> <strong>Bank</strong> 01 – Management <strong>Report</strong> 16<br />
Financial <strong>Report</strong> 2010 Operating and Financial Review<br />
Segment Results of Operations<br />
The following is a discussion of the results of our business segments. See Note 05 “Business Segments and<br />
Related Information” to the consolidated financial statements for information regarding<br />
— our organizational structure;<br />
— effects of significant acquisitions and divestitures on segmental results;<br />
— changes in the format of our segment disclosure;<br />
— the framework of our management reporting systems;<br />
— consolidating and other adjustments to the total results of operations of our business segments, and<br />
— definitions of non-GAAP financial measures that are used with respect to each segment.<br />
The criterion for segmentation into divisions is our organizational structure as it existed at December 31, 2010.<br />
Segment results were prepared in accordance with our management reporting systems.<br />
2010<br />
in € m.<br />
(unless stated otherwise)<br />
Corporate &<br />
Investment<br />
<strong>Bank</strong><br />
Private<br />
Clients and<br />
Asset<br />
Management<br />
Corporate<br />
Investments<br />
Total<br />
Management<br />
<strong>Report</strong>ing<br />
Consolidation<br />
&<br />
Adjustments<br />
Total<br />
Consolidated<br />
Net revenues 20,929 1 10,043 (2,020) 2<br />
28,953 (386) 28,567<br />
Provision for credit losses 488 789 (4) 1,273 0 1,274<br />
Total noninterest expenses<br />
therein:<br />
14,422 8,258 637 23,318 1 23,318<br />
Policyholder benefits and claims 486 0 – 486 – 485<br />
Impairment of intangible assets 29 – – 29 – 29<br />
Restructuring activities – – – – – –<br />
Noncontrolling interests 20 6 (2) 24 (24) –<br />
Income (loss) before income taxes 5,999 989 (2,649) 4,339 (363) 3,975<br />
Cost/income ratio 69 % 82 % N/M 81 % N/M 82 %<br />
Assets 3 1,519,983 412,477 17,766 1,894,282 11,348 1,905,630<br />
Average active equity 4 18,644 10,635 4,168 33,446 7,907 41,353<br />
Pre-tax return on average active equity 5 N/M – Not meaningful<br />
32 % 9 % (64) % 13 % N/M 10 %<br />
1 Includes a gain from the recognition of negative goodwill related to the acquisition of the commercial banking activities of ABN AMRO in the Netherlands of<br />
€ 208 million as reported in the second quarter 2010 which is excluded from the Group’s target definition.<br />
2 Includes a charge related to the investment in <strong>Deutsche</strong> Postbank AG of € 2,338 million, which is excluded from the Group’s target definition.<br />
3 The sum of corporate divisions does not necessarily equal the total of the corresponding group division because of consolidation items between corporate divisions,<br />
which are to be eliminated on group division level. The same approach holds true for the sum of group divisions compared to ‘Total Consolidated’.<br />
4 For management reporting purposes goodwill and other intangible assets with indefinite lives are explicitly assigned to the respective divisions. Average active equity<br />
is first allocated to divisions according to goodwill and intangible assets; remaining average active equity is allocated to divisions in proportion to the economic capital<br />
calculated for them.<br />
5 For the calculation of pre-tax return on average active equity please refer to Note 05 “Business Segments and Related Information”. For ‘Total consolidated’, pre-tax<br />
return on average shareholders’ equity is 10 %.
<strong>Deutsche</strong> <strong>Bank</strong> 01 – Management <strong>Report</strong> 17<br />
Financial <strong>Report</strong> 2010 Operating and Financial Review<br />
2009<br />
in € m.<br />
(unless stated otherwise)<br />
Corporate &<br />
Investment<br />
<strong>Bank</strong><br />
Private<br />
Clients and<br />
Asset<br />
Management<br />
Corporate<br />
Investments<br />
Total<br />
Management<br />
<strong>Report</strong>ing<br />
Consoli-<br />
dation &<br />
Adjustments<br />
Total<br />
Consolidated<br />
Net revenues 18,807 8,261 1,044 28,112 (159) 27,952<br />
Provision for credit losses 1,816 806 8 2,630 (0) 2,630<br />
Total noninterest expenses<br />
therein:<br />
12,679 6,803 581 20,063 57 20,120<br />
Policyholder benefits and claims 541 – – 541 2 542<br />
Impairment of intangible assets 5 (291) 151 (134) – (134)<br />
Restructuring activities – – – – – –<br />
Noncontrolling interests (2) (7) (1) (10) 10 –<br />
Income (loss) before income taxes 4,314 658 456 5,428 (226) 5,202 1<br />
Cost/income ratio 67 % 82 % 56 % 71 % N/M 72 %<br />
Assets 2 1,343,824 174,739 28,456 1,491,108 9,556 1,500,664<br />
Average active equity 3 19,041 8,408 4,323 31,772 2,840 34,613<br />
Pre-tax return on average active equity 4 N/M – Not meaningful<br />
23 % 8 % 11 % 17 % N/M 15 %<br />
1 Includes a gain from the sale of industrial holdings (Daimler AG) of € 236 million, a reversal of impairment of intangible assets (Asset Management) of € 291 million<br />
(the related impairment had been recorded in 2008), an impairment charge of € 278 million on industrial holdings and an impairment of intangible assets (Corporate<br />
Investments) of € 151 million which are excluded from the Group’s target definition.<br />
2 The sum of corporate divisions does not necessarily equal the total of the corresponding group division because of consolidation items between corporate divisions,<br />
which are to be eliminated on group division level. The same approach holds true for the sum of group divisions compared to ‘Total Consolidated’.<br />
3 For management reporting purposes goodwill and other intangible assets with indefinite lives are explicitly assigned to the respective divisions. Average active equity<br />
is first allocated to divisions according to goodwill and intangible assets; remaining average active equity is allocated to divisions in proportion to the economic capital<br />
calculated for them.<br />
4 For the calculation of pre-tax return on average active equity please refer to Note 05 “Business Segments and Related Information”. For ‘Total consolidated’, pre-tax<br />
return on average shareholders’ equity is 15 %.
<strong>Deutsche</strong> <strong>Bank</strong> 01 – Management <strong>Report</strong> 18<br />
Financial <strong>Report</strong> 2010 Operating and Financial Review<br />
Group Divisions<br />
Corporate & Investment <strong>Bank</strong> Group Division<br />
The following table sets forth the results of our Corporate & Investment <strong>Bank</strong> Group Division (CIB) for the years<br />
ended December 31, 2010 and 2009, in accordance with our management reporting systems.<br />
in € m.<br />
(unless stated otherwise) 2010 2009<br />
Net revenues:<br />
Sales & Trading (equity) 3,108 2,650<br />
Sales & Trading (debt and other products) 9,740 9,557<br />
Origination (equity) 706 663<br />
Origination (debt) 1,199 1,127<br />
Advisory 573 402<br />
Loan products 1,736 1,949<br />
Transaction services 3,223 2,609<br />
Other products 644 (151)<br />
Total net revenues 20,929 18,807<br />
therein:<br />
Net interest income and net gains (losses) on financial assets/liabilities<br />
at fair value through profit or loss 14,081 13,969<br />
Provision for credit losses 488 1,816<br />
Total noninterest expenses 14,422 12,679<br />
therein:<br />
Policyholder benefits and claims 486 541<br />
Impairment of intangible assets 29 5<br />
Restructuring activities – –<br />
Noncontrolling interests 20 (2)<br />
Income (loss) before income taxes 5,999 4,314<br />
Cost/income ratio 69 % 67 %<br />
Assets 1,519,983 1,343,824<br />
Average active equity 1 18,644 19,041<br />
Pre-tax return on average active equity 32 % 23 %<br />
1 See Note 05 “Business Segments and Related Information” to the consolidated financial statements for a description of how average active equity is allocated to the<br />
divisions.<br />
The following paragraphs discuss the contribution of the individual corporate divisions to the overall results of<br />
the Corporate & Investment <strong>Bank</strong> Group Division.
<strong>Deutsche</strong> <strong>Bank</strong> 01 – Management <strong>Report</strong> 19<br />
Financial <strong>Report</strong> 2010 Operating and Financial Review<br />
Corporate <strong>Bank</strong>ing & Securities Corporate Division<br />
The following table sets forth the results of our Corporate <strong>Bank</strong>ing & Securities Corporate Division (CB&S) for<br />
the years ended December 31, 2010 and 2009, in accordance with our management reporting systems.<br />
in € m.<br />
(unless stated otherwise) 2010 2009<br />
Net revenues:<br />
Sales & Trading (equity) 3,108 2,650<br />
Sales & Trading (debt and other products) 9,740 9,557<br />
Origination (equity) 706 663<br />
Origination (debt) 1,199 1,127<br />
Advisory 573 402<br />
Loan products 1,736 1,949<br />
Other products 428 (151)<br />
Total net revenues 17,490 16,197<br />
Provision for credit losses 348 1,789<br />
Total noninterest expenses 12,028 10,891<br />
therein:<br />
Policyholder benefits and claims 486 541<br />
Impairment of intangible assets – 5<br />
Restructuring activities – –<br />
Noncontrolling interests 20 (2)<br />
Income (loss) before income taxes 5,094 3,520<br />
Cost/income ratio 69 % 67 %<br />
Assets 1,468,863 1,308,222<br />
Average active equity 1 17,096 17,881<br />
Pre-tax return on average active equity 30 % 20 %<br />
1 See Note 05 “Business Segments and Related Information” to the consolidated financial statements for a description of how average active equity is allocated to the<br />
divisions.<br />
Sales & Trading (debt and other products) net revenues were € 9.7 billion, an increase of 2 % compared to<br />
€ 9.6 billion in 2009. Net revenues in the prior year included net mark-downs of € 1.0 billion, mainly related to<br />
provisions against monoline insurers and charges related to Ocala Funding LLC of approximately € 350 million<br />
compared to Ocala-related charges of approximately € 360 million and immaterial net mark-downs in the current<br />
year. Revenues in Money Markets and Rates were materially lower due to lower bid-offer spreads and subdued<br />
client activity as a result of sovereign risk concerns. Revenues in Credit Trading were significantly higher driven<br />
by lower mark-downs from legacy positions and increased client activity across flow and structured solutions.<br />
Revenues in the Foreign Exchange business were stable reflecting strong market share (source: Euromoney)<br />
and higher volumes, offsetting decreases in bid-offer spreads in a more normalized environment. Commodities<br />
revenues were higher than the prior year, despite a more challenging environment. Emerging Markets revenues<br />
were lower reflecting less favorable market conditions compared to 2009.<br />
Sales & Trading (equity) net revenues were € 3.1 billion, an increase of € 458 million, or 17 %, compared to<br />
€ 2.7 billion in 2009. Equity Trading revenues were slightly down compared to the prior year, as decreased<br />
activity during the summer was partly offset by a pick-up towards the end of the year. Revenues from Equity<br />
Derivatives were significantly higher, reflecting the recalibration of the business and the non-recurrence of the<br />
trading losses that occurred in the first quarter 2009. In Prime Finance, revenues were slightly higher due to<br />
increased client balances, improved competitive positioning (source: Global Custodian) and the launch of new<br />
products and services. Revenues from dedicated Equity Proprietary Trading were not material and the business<br />
was exited during the third quarter of 2010.
<strong>Deutsche</strong> <strong>Bank</strong> 01 – Management <strong>Report</strong> 20<br />
Financial <strong>Report</strong> 2010 Operating and Financial Review<br />
Origination and Advisory revenues were € 2.5 billion in 2010, an increase of € 286 million, or 13 %, compared<br />
to 2009. During 2010, we achieved and maintained our target of a top five ranking and were ranked number<br />
five globally in 2010 compared to number seven in 2009. Globally, we had top five ranks across all origination<br />
and advisory products. In Advisory, revenues were € 573 million, up 43 % from 2009. The M&A business was<br />
ranked number one in EMEA, number six in the Americas and number five globally, a substantial improvement<br />
over the prior year. Debt Origination revenues of € 1.2 billion increased by 6 % from the prior year. We were<br />
ranked fourth in Investment Grade and in High Yield, and number five in Leveraged Loans. In Equity Origination,<br />
revenues of € 706 million increased by 6 % from prior year, despite lower deal activity compared to the prior<br />
year period. However, we were ranked number one in EMEA and number five in the U.S. Globally, we were<br />
ranked number five, up from number nine in 2009. (Source for all rankings and market shares: Dealogic)<br />
Loan products revenues were € 1.7 billion, a decrease of € 213 million, or 11 %, from 2009. The decrease is<br />
primarily due to mark-to-market losses on new loans and loan commitments held at fair value.<br />
Net revenues from other products were € 428 million, an increase of € 579 million from 2009, which included<br />
an impairment charge of € 500 million related to The Cosmopolitan of Las Vegas property and losses on private<br />
equity investments in the first quarter 2009.<br />
In provision for credit losses, CB&S recorded a net charge of € 348 million, compared to a net charge of<br />
€ 1.8 billion in 2009. The decrease compared to the prior year was mainly attributable to lower provision for<br />
credit losses related to assets which had been reclassified in accordance with IAS 39.<br />
Noninterest expenses were € 12.0 billion, an increase of € 1.1 billion, or 10 %, compared to 2009, which<br />
benefitted from changes in compensation structures, mainly with respect to an increase in the proportion of<br />
deferred compensation. Compensation expenses in 2010 reflected higher amortization expenses for deferred<br />
compensation as a consequence of the aforementioned change in compensation structures including the impact<br />
of accelerated amortization for employees eligible for career retirement. This increase was also driven by<br />
business growth, costs for strategic initiatives and complexity reduction efforts as well as the impact of foreign<br />
exchange rate movements. Partially offsetting this increase was the non-recurrence of prior year charges<br />
including € 316 million from a legal settlement with Huntsman Corp. as well as € 200 million related to an offer<br />
to repurchase certain products from private investors.
<strong>Deutsche</strong> <strong>Bank</strong> 01 – Management <strong>Report</strong> 21<br />
Financial <strong>Report</strong> 2010 Operating and Financial Review<br />
Amendments to IAS 39 and IFRS 7, “Reclassification of Financial Assets”<br />
Under the amendments to IAS 39 and IFRS 7 issued in October 2008, certain financial assets were reclassified<br />
in the second half of 2008 and the first quarter of 2009 from the financial assets at fair value through profit or<br />
loss and the available for sale classifications into the loans classification. The reclassifications were made in<br />
instances where management believed that the expected repayment of the assets exceeded their estimated<br />
fair values, which reflected the significantly reduced liquidity in the financial markets, and that returns on these<br />
assets would be optimized by holding them for the foreseeable future. Where this clear change of intent existed<br />
and was supported by an ability to hold and fund the underlying positions, we concluded that the reclassifications<br />
aligned the accounting more closely with the business intent.<br />
The tables below show the incremental impact of the reclassification for CB&S. The tables show that the<br />
reclassifications resulted in a € 753 million incremental loss to the income statement and a € 325 million<br />
incremental loss to other comprehensive income for 2010. For the full year 2009, the reclassifications resulted<br />
in a € 273 million incremental loss to the income statement and a € 1.2 billion incremental loss to other comprehensive<br />
income. The consequential effect on credit market risk disclosures is provided in “Update on Key<br />
Credit Market Exposures”.<br />
Carrying value Fair value<br />
Dec 31, 2010 Year ended Dec 31, 2010<br />
Impact on<br />
income before<br />
income taxes<br />
Impact on other<br />
comprehensive<br />
income<br />
2010 impact of the reclassification<br />
Sales & Trading – Debt<br />
in € bn. in € bn. in € m. in € m.<br />
Trading assets reclassified to loans 16.6 14.7 (582) –<br />
Financial assets available for sale reclassified to loans<br />
Origination and Advisory<br />
8.7 7.8 2 (325)<br />
Trading assets reclassified to loans 1 Loan products<br />
1.4 1.2 (173) –<br />
Financial assets available for sale reclassified to loans – – – –<br />
Total 26.7 23.7 (753) 2<br />
(325)<br />
1 The significant decrease in carrying value and fair value of reclassified assets in Origination and Advisory since December 2009 is mainly due to the restructuring of<br />
loans to Actavis Group hF in 2010 with a carrying amount of € 4.2 billion. There was no gain or loss recognized as a result of the restructuring. The restructuring is<br />
detailed further in Note 17 “Equity Method Investments”.<br />
2 In addition to the impact in CB&S, income before income taxes decreased by € 3 million in PBC.
<strong>Deutsche</strong> <strong>Bank</strong> 01 – Management <strong>Report</strong> 22<br />
Financial <strong>Report</strong> 2010 Operating and Financial Review<br />
Carrying value Fair value<br />
Dec 31, 2009 Year ended Dec 31, 2009<br />
Impact on<br />
income before<br />
income taxes<br />
Impact on other<br />
comprehensive<br />
income<br />
2009 impact of the reclassification<br />
Sales & Trading – Debt<br />
in € bn. in € bn. in € m. in € m.<br />
Trading assets reclassified to loans 18.2 15.9 407 –<br />
Financial assets available for sale reclassified to loans<br />
Origination and Advisory<br />
9.3 8.2 (16) (1,102)<br />
Trading assets reclassified to loans<br />
Loan products<br />
6.1 5.7 (664) –<br />
Financial assets available for sale reclassified to loans – – – (114) 1<br />
Total 33.6 29.8 (273) 2<br />
(1,216)<br />
1 The negative amount shown as the annual movement in other comprehensive income is due to an instrument being impaired in the year. The decrease in fair value<br />
since reclassification that would have been recorded in equity would then be removed from equity and recognized through the income statement.<br />
2 In addition to the impact in CB&S, income before income taxes increased by € 18 million in PBC.<br />
During 2010 we sold reclassified assets with a carrying value of € 2.0 billion. The sales resulted in a net loss on<br />
sale of € 3 million. Sales were made due to circumstances that were not foreseen at the time of reclassification.<br />
The assets reclassified included funded leveraged finance loans with a fair value on the date of reclassification<br />
of € 7.5 billion which were entered into as part of an “originate to distribute” strategy. Assets with a fair value on<br />
the date of reclassification of € 9.4 billion were contained within consolidated asset backed commercial paper<br />
conduits as of the reclassification date. Commercial real estate loans were reclassified with a fair value on the<br />
date of reclassification of € 9.1 billion. These loans were intended for securitization at their origination or purchase<br />
date. The remaining reclassified assets, which comprised other assets principally acquired or originated for the<br />
purpose of securitization, had a fair value of € 11.9 billion on the reclassification date.
<strong>Deutsche</strong> <strong>Bank</strong> 01 – Management <strong>Report</strong> 23<br />
Financial <strong>Report</strong> 2010 Operating and Financial Review<br />
Global Transaction <strong>Bank</strong>ing Corporate Division<br />
The following table sets forth the results of our Global Transaction <strong>Bank</strong>ing Corporate Division (GTB) for the<br />
years ended December 31, 2010 and 2009, in accordance with our management reporting systems.<br />
in € m.<br />
(unless stated otherwise) 2010 2009<br />
Net revenues:<br />
Transaction services 3,223 2,609<br />
Other products 216 –<br />
Total net revenues 3,439 2,609<br />
Provision for credit losses 140 27<br />
Total noninterest expenses 2,394 1,788<br />
therein:<br />
Restructuring activities – –<br />
Impairment on intangible assets 29<br />
Noncontrolling interests – –<br />
Income (loss) before income taxes 905 795<br />
Cost/income ratio 70 % 69 %<br />
Assets 71,877 47,414<br />
Average active equity 1 1,548 1,160<br />
Pre-tax return on average active equity 58 % 68 %<br />
1 See Note 05 “Business Segments and Related Information” to the consolidated financial statements for a description of how average active equity is allocated to<br />
the divisions.<br />
GTB’s net revenues were a record € 3.4 billion, an increase of 32 %, or € 830 million, compared to 2009. Even<br />
excluding the impact of the commercial banking activities acquired from ABN AMRO in the Netherlands, which<br />
included a gain of € 216 million related to negative goodwill resulting from the first-time consolidation of the<br />
acquired activities in 2010, GTB generated record revenues. This strong performance was predominantly<br />
attributable to growth in fee income in Trust & Securities Services, Trade Finance, and Cash Management offsetting<br />
the impact of the continuing low interest rate environment, mainly affecting the latter business. Trust &<br />
Securities Services benefitted from positive business momentum, especially in Asia in the fourth quarter.<br />
Provision for credit losses was € 140 million. The increase of € 113 million versus 2009 was primarily related to<br />
the commercial banking activities acquired from ABN AMRO.<br />
Noninterest expenses were € 2.4 billion, an increase of 34 %, or € 606 million, compared to 2009. The increase<br />
was mainly driven by operating and integration costs related to the commercial banking activities acquired from<br />
ABN AMRO, and significant severance expenses of € 130 million in the fourth quarter related to specific measures<br />
associated with the realignment of infrastructure areas and sales units.
<strong>Deutsche</strong> <strong>Bank</strong> 01 – Management <strong>Report</strong> 24<br />
Financial <strong>Report</strong> 2010 Operating and Financial Review<br />
Private Clients and Asset Management Group Division<br />
The following table sets forth the results of our Private Clients and Asset Management Group Division (PCAM)<br />
for the years ended December 31, 2010 and 2009, in accordance with our management reporting systems.<br />
in € m.<br />
(unless stated otherwise) 2010 2009<br />
Net revenues:<br />
Discretionary portfolio/fund management 2,560 2,083<br />
Advisory/brokerage 1,745 1,531<br />
Credit products 2,708 2,605<br />
Deposits and payment services 2,029 1,875<br />
Other products 1,001 167<br />
Total net revenues 10,043 8,261<br />
therein:<br />
Net interest income and net gains (losses) on financial assets/liabilities at fair value through profit or<br />
loss 4,708 4,157<br />
Provision for credit losses 789 806<br />
Total noninterest expenses 8,258 6,803<br />
therein:<br />
Policyholder benefits and claims – –<br />
Impairment of intangible assets – (291)<br />
Restructuring activities – –<br />
Noncontrolling interests 6 (7)<br />
Income (loss) before income taxes 989 658<br />
Cost/income ratio 82 % 82 %<br />
Assets 412,477 174,739<br />
Average active equity 1 10,635 8,408<br />
Pre-tax return on average active equity 9 % 8 %<br />
Invested assets 2 (in € bn.) 1,179 880<br />
1 See Note 05 “Business Segments and Related Information” to the consolidated financial statements for a description of how average active equity is allocated to the<br />
divisions.<br />
2 We define invested assets as (a) assets we hold on behalf of customers for investment purposes and/or (b) client assets that are managed by us. We manage<br />
invested assets on a discretionary or advisory basis, or these assets are deposited with us.<br />
The following paragraphs discuss the contribution of the individual corporate divisions to the overall results of<br />
the Private Clients and Asset Management Group Division.
<strong>Deutsche</strong> <strong>Bank</strong> 01 – Management <strong>Report</strong> 25<br />
Financial <strong>Report</strong> 2010 Operating and Financial Review<br />
Asset and Wealth Management Corporate Division<br />
The following table sets forth the results of our Asset and Wealth Management Corporate Division (AWM) for<br />
the years ended December 31, 2010 and 2009, in accordance with our management reporting systems.<br />
in € m.<br />
(unless stated otherwise) 2010 2009<br />
Net revenues:<br />
Discretionary portfolio/fund management (AM) 1,733 1,562<br />
Discretionary portfolio/fund management (PWM) 515 264<br />
Total discretionary portfolio/fund management 2,247 1,826<br />
Advisory/brokerage 857 689<br />
Credit products 383 255<br />
Deposits and payment services 138 169<br />
Other products 282 (255)<br />
Total net revenues 3,907 2,685<br />
Provision for credit losses 43 17<br />
Total noninterest expenses 3,765 2,475<br />
therein:<br />
Policyholder benefits and claims – –<br />
Impairment of intangible assets – (291)<br />
Restructuring activities – –<br />
Noncontrolling interests (1) (7)<br />
Income (loss) before income taxes 100 200<br />
Cost/income ratio 96 % 92 %<br />
Assets 65,508 43,761<br />
Average active equity 1 6,737 4,791<br />
Pre-tax return on average active equity 1 % 4 %<br />
Invested assets 2 (in € bn.) 873 686<br />
1 See Note 05 “Business Segments and Related Information” to the consolidated financial statements for a description of how average active equity is allocated to the<br />
divisions.<br />
2 We define invested assets as (a) assets we hold on behalf of customers for investment purposes and/or (b) client assets that are managed by us. We manage<br />
invested assets on a discretionary or advisory basis, or these assets are deposited with us.<br />
For the year 2010, AWM reported net revenues of € 3.9 billion, up € 1.2 billion, or 46 %, compared to 2009. The<br />
increase included € 646 million attributable to the acquisition of Sal. Oppenheim/BHF-BANK in Private Wealth<br />
Management (PWM), which are reflected in revenues from discretionary portfolio management/fund management<br />
(up € 250 million or 95 %), credit products (up € 128 million, or 50 %) and other products (up € 537 million from<br />
negative € 255 million in 2009). Revenues in AWM also grew due to higher asset based fees and performance<br />
fees in Asset Management’s (AM) discretionary portfolio management/fund management (up € 171 million, or<br />
11 %). In addition, Advisory/brokerage revenues (up € 168 million, or 24 %) benefitted from higher client activity<br />
and an improved market environment. Deposits and payment services revenues decreased by € 31 million, or<br />
18 %, mainly reflecting lower margins.<br />
Provision for credit losses was € 43 million in 2010, an increase of € 27 million compared to 2009, mainly attributable<br />
Sal. Oppenheim/BHF-BANK.<br />
Noninterest expenses in 2010 were € 3.8 billion, an increase of € 1.3 billion, or 52 %, compared to 2009. This<br />
development included the reversal of an impairment charge on intangible assets of € 291 million in AM in 2009,<br />
which related to DWS Investments in the U.S. (formerly DWS Scudder). In addition, noninterest expenses in<br />
2010 included € 986 million related to Sal. Oppenheim/BHF-BANK.
<strong>Deutsche</strong> <strong>Bank</strong> 01 – Management <strong>Report</strong> 26<br />
Financial <strong>Report</strong> 2010 Operating and Financial Review<br />
Invested assets in AWM were € 873 billion at December 31, 2010, an increase of € 188 billion compared to<br />
December 31, 2009. The increase included € 112 billion from the acquisition of Sal. Oppenheim/BHF-BANK<br />
(€ 68 billion related to Sal. Oppenheim and € 45 billion related to BHF-BANK). The remaining increase was<br />
mainly driven by market appreciation and the weakening of the Euro. AWM recorded in 2010 net outflows of<br />
€ 2.5 billion, mainly driven by cash outflows in the Americas, which were largely offset by inflows in Europe and<br />
in insurance in the Americas.<br />
Private & Business Clients Corporate Division<br />
The following table sets forth the results of our Private & Business Clients Corporate Division (PBC) for the<br />
years ended December 31, 2010 and 2009, in accordance with our management reporting systems.<br />
in € m.<br />
(unless stated otherwise) 2010 2009<br />
Net revenues:<br />
Discretionary portfolio/fund management 313 257<br />
Advisory/brokerage 887 841<br />
Credit products 2,325 2,350<br />
Deposits and payment services 1,891 1,706<br />
Other products 720 422<br />
Total net revenues 6,136 5,576<br />
Provision for credit losses 746 790<br />
Total noninterest expenses 4,493 4,328<br />
therein:<br />
Restructuring activities – –<br />
Noncontrolling interests 8 0<br />
Income (loss) before income taxes 890 458<br />
Cost/income ratio 73 % 78 %<br />
Assets 346,998 131,014<br />
Average active equity 1 3,897 3,617<br />
Pre-tax return on average active equity 23 % 13 %<br />
Invested assets 2 (in € bn.) 306 194<br />
Loan volume (in € bn.) 255 96<br />
Deposit volume (in € bn.) 229 109<br />
1 See Note 05 “Business Segments and Related Information” to the consolidated financial statements for a description of how average active equity is allocated to the<br />
divisions.<br />
2 We define invested assets as (a) assets we hold on behalf of customers for investment purposes and/or (b) client assets that are managed by us. We manage<br />
invested assets on a discretionary or advisory basis, or these assets are deposited with us.<br />
Net revenues were € 6.1 billion, up € 560 million, or 10 %, versus 2009. Revenues in 2010 included the first-time<br />
consolidation of Postbank, which began on December 3, 2010. This resulted in additional net revenues of<br />
€ 414 million, recorded in the interim in revenues from other products. Thus, Postbank was the main contributor<br />
for the increase of € 298 million, or 71 %, in revenues from other products, partly offset by lower revenues from<br />
PBC’s Asset and liability management function. Revenues from discretionary portfolio management/fund management<br />
revenues increased by € 56 million, or 22 %, and Advisory/brokerage revenues by € 46 million, or 5 %.<br />
Both products benefited from increased activity of retail investors in more favorable market conditions, as well<br />
as higher revenues related to insurance products sales. Credit products revenues were down by € 25 million or<br />
1 % driven by lower margins. Deposits and payment services revenues increased by € 185 million, or 11 %, mainly<br />
driven by improved deposit margins.<br />
Provision for credit losses was € 746 million, of which € 56 million related to Postbank. Excluding Postbank,<br />
provision for credit losses decreased by € 100 million, or 13 %, compared to 2009, mainly attributable to measures<br />
taken on portfolio and country level.
<strong>Deutsche</strong> <strong>Bank</strong> 01 – Management <strong>Report</strong> 27<br />
Financial <strong>Report</strong> 2010 Operating and Financial Review<br />
Noninterest expenses of € 4.5 billion were € 165 million, or 4 %, higher than in 2009. This increase was predominantly<br />
driven by € 320 million related to the first-time consolidation of Postbank. Excluding Postbank, noninterest<br />
expenses decreased by € 155 million, or 4 %, mainly attributable to lower severance payments.<br />
Invested assets were € 306 billion as of December 31, 2010, an increase of € 112 billion compared to December<br />
31, 2009, mainly driven by the Postbank consolidation. Excluding this effect, invested assets increased by<br />
€ 7 billion, including € 5 billion due to market appreciation and € 2 billion net inflows, mainly in deposits.<br />
The number of clients in PBC was 28.8 million at year end 2010, including 14.2 million related to Postbank.<br />
Corporate Investments Group Division<br />
The following table sets forth the results of our Corporate Investments Group Division (CI) for the years ended<br />
December 31, 2010 and 2009, in accordance with our management reporting systems.<br />
in € m.<br />
(unless stated otherwise) 2010 2009<br />
Net revenues (2,020) 1,044<br />
therein:<br />
Net interest income and net gains (losses) on financial assets/liabilities<br />
at fair value through profit or loss (184) 793<br />
Provision for credit losses (4) 8<br />
Total noninterest expenses 637 581<br />
therein:<br />
Impairment of intangible assets – 151<br />
Restructuring activities – –<br />
Noncontrolling interests (2) (1)<br />
Income (loss) before income taxes (2,649) 456<br />
Cost/income ratio N/M 56 %<br />
Assets 17,766 28,456<br />
Average active equity 1 4,168 4,323<br />
Pre-tax return on average active equity (64) % 11 %<br />
N/M – Not meaningful<br />
1 See Note 05 “Business Segments and Related Information” to the consolidated financial statements for a description of how average active equity is allocated to the<br />
divisions.<br />
Net revenues were negative € 2.0 billion, versus positive € 1.0 billion compared to 2009. Net revenues in 2010<br />
were mainly impacted by a charge of € 2.3 billion on our investment in Postbank, which was recorded in the<br />
third quarter. In addition, net revenues included an impairment charge of € 124 million on The Cosmopolitan of<br />
Las Vegas. Net revenues in 2009 included € 1.0 billion related to the Postbank transaction, mark-to-market gains<br />
of € 83 million from our option to increase our share in Hua Xia <strong>Bank</strong> Co. Ltd. and an impairment charge of<br />
€ 75 million on The Cosmopolitan of Las Vegas.<br />
Total noninterest expenses were € 637 million, an increase of € 56 million compared to the previous year. This<br />
increase was mainly due to higher expenses related to space and building optimization and higher operating<br />
costs of our consolidated investment in The Cosmopolitan of Las Vegas, which commenced operations in<br />
December 2010. Noninterest expenses in 2009 included a goodwill impairment charge of € 151 million on our<br />
investment in Maher Terminals.
<strong>Deutsche</strong> <strong>Bank</strong> 01 – Management <strong>Report</strong> 28<br />
Financial <strong>Report</strong> 2010 Operating and Financial Review<br />
Consolidation & Adjustments<br />
For a discussion of Consolidation & Adjustments to our business segment results see Note 05 “Business Segments<br />
and Related Information” to the consolidated financial statements.<br />
Financial Position<br />
The table below shows information on the financial position.<br />
in € m. Dec 31, 2010 Dec 31, 2009<br />
Cash and due from banks 17,157 9,346<br />
Interest-earning deposits with banks 92,377 47,233<br />
Central bank funds sold, securities purchased under resale agreements and securities borrowed 49,281 50,329<br />
Trading assets 271,291 234,910<br />
Positive market values from derivative financial instruments 657,780 596,410<br />
Financial assets designated at fair value through profit or loss 1 171,926 134,000<br />
Loans 407,729 258,105<br />
Brokerage and securities related receivables 103,423 93,452<br />
Remaining assets 134,666 76,879<br />
Total assets 1,905,630 1,500,664<br />
Deposits 533,984 344,220<br />
Central bank funds purchased, securities sold under repurchase agreements and securities loaned 31,198 51,059<br />
Trading liabilities 68,859 64,501<br />
Negative market values from derivative financial instruments 647,171 576,973<br />
Financial liabilities designated at fair value through profit or loss 2 130,154 73,522<br />
Other short-term borrowings 64,990 42,897<br />
Long-term debt 169,660 131,782<br />
Brokerage and securities related payables 116,146 110,797<br />
Remaining liabilities 93,076 66,944<br />
Total liabilities 1,855,238 1,462,695<br />
Total equity 50,392 37,969<br />
1 Includes securities purchased under resale agreements designated at fair value through profit or loss of € 108,912 million and € 89,977 million and securities<br />
borrowed designated at fair value through profit or loss of € 27,887 million and € 19,987 million as of December 31, 2010 and December 31, 2009, respectively.<br />
2 Includes securities sold under repurchase agreements designated at fair value through profit or loss of € 107,999 million and € 52,795 million as of December 31,<br />
2010 and December 31, 2009, respectively.<br />
Assets and Liabilities<br />
As of December 31, 2010, total assets were € 1,906 billion. More than half of the increase of € 405 billion, or<br />
27 %, compared to December 31, 2009, was related to our acquisitions. The shift in foreign exchange rates<br />
and in particular between the U.S. dollar and the euro contributed another 20 % to the overall increase of our<br />
balance sheet during 2010.<br />
Our loan book, which went up € 150 billion from prior year-end, was the primary driver for the increase in total<br />
assets. € 141 billion or 94 % of the increase was related to our acquisitions, in particular to Postbank.<br />
Positive market values from derivatives increased by € 61 billion, with € 23 billion relating to currency translation<br />
effects and € 21 billion stemming from acquisitions.
<strong>Deutsche</strong> <strong>Bank</strong> 01 – Management <strong>Report</strong> 29<br />
Financial <strong>Report</strong> 2010 Operating and Financial Review<br />
Also, interest-earning deposits with banks almost doubled from year-end 2009 to year-end 2010, primarily to<br />
support our liquidity reserve.<br />
Total liabilities were up by € 393 billion to € 1,855 billion.<br />
The main driver of the growth in total liabilities were deposits, which increased by € 190 billion, significantly<br />
impacted by our acquisitions adding € 146 billion or 77 % to this position.<br />
Negative market values from derivatives were up by € 70 billion, also primarily driven by currency translation<br />
effects and new acquisitions.<br />
Equity<br />
As of December 31, 2010, total equity was € 50.4 billion, an increase of € 12.4 billion, or 33 %, compared to<br />
€ 38.0 billion as of December 31, 2009. The main factors contributing to this development were a capital<br />
increase of € 10.1 billion (after expenses of approximately € 0.1 billion), net income attributable to <strong>Deutsche</strong><br />
<strong>Bank</strong> shareholders of € 2.3 billion and net gains recognized in accumulated other comprehensive income of<br />
€ 1.2 billion, partly offset by cash dividends paid of € 465 million and an increase in of € 403 million in our treasury<br />
shares which are deducted from equity. The aforementioned net gains recognized in accumulated other<br />
comprehensive income were mainly driven by positive effects from exchange rate changes of € 1.2 billion<br />
(especially in the U.S. dollar).<br />
Regulatory Capital<br />
Total regulatory capital (Tier 1 and 2 capital) reported under Basel II was € 48.7 billion at the end of 2010 compared<br />
to € 37.9 billion at the end of 2009, reflecting primarily the completion of the € 10.2 billion capital increase<br />
in the fourth quarter and our acquisitions in 2010. Tier 1 capital increased to € 42.6 billion at the end of 2010<br />
versus € 34.4 billion at the end of 2009. As of 31 December 2010, Core Tier 1 capital increased to € 30.0 billion<br />
from € 23.8 billion in 2009.<br />
Update on Key Credit Market Exposures<br />
The following is an update on the development of certain credit positions (including protection purchased from<br />
monoline insurers) of those CB&S businesses on which we have previously provided additional risk disclosures.<br />
These positions were those that significantly impacted the performance of CB&S during the recent financial<br />
crisis. In addition to these CB&S positions, we have also provided information about positions acquired from<br />
Postbank where relevant.
<strong>Deutsche</strong> <strong>Bank</strong> 01 – Management <strong>Report</strong> 30<br />
Financial <strong>Report</strong> 2010 Operating and Financial Review<br />
Mortgage Related Exposure: We have mortgage related exposures through a number of our businesses,<br />
including our CDO trading and origination and U.S. and European mortgage businesses. The following table<br />
presents the mortgage related exposure from the businesses described net of hedges and other protection<br />
purchased. Hedges consist of a number of different market instruments, including protection provided by monoline<br />
insurers, single name credit default swap contracts with market counterparties and index-based contracts.<br />
Mortgage related exposure in our CDO trading<br />
and origination, U.S. and European residential<br />
mortgage businesses Dec 31, 2010 Dec 31, 2009<br />
in € m.<br />
Gross<br />
exposure<br />
Hedges<br />
and other<br />
protection<br />
purchased Net exposure<br />
Gross<br />
exposure<br />
Hedges<br />
and other<br />
protection<br />
purchased Net exposure<br />
Subprime 1 and Alt-A 2 CDO exposure in trading<br />
and origination businesses:<br />
CDO subprime exposure – Trading 420 75 345 688 371 317<br />
CDO subprime exposure – Available for sale 34 – 34 34 – 34<br />
CDO Alt-A exposure – Trading 56 49 7 77 55 22<br />
Residential mortgage trading businesses:<br />
Other U.S. residential mortgage business<br />
exposure 3,4 3,428 3,153 275 4,315 3,201 1,114<br />
European residential mortgage business<br />
exposure 169 – 169 179 – 179<br />
1 In determining subprime, we apply industry standard criteria including FICO (credit quality) scores and loan-to-value ratios. In limited circumstances, we also classify<br />
exposures as subprime if 50 % or more of the underlying collateral is home equity loans which are subprime.<br />
2 Alt-A loans are loans made to borrowers with generally good credit, but with non-conforming underwriting ratios or other characteristics that fail to meet the standards<br />
for prime loans. These include lower FICO scores, higher loan-to-value ratios and higher percentages of loans with limited or no documentation.<br />
3 Thereof € (267) million Alt-A, € 10 million Subprime, € 52 million Other and € 480 million Trading-related net positions as of December 31, 2010 and € 202 million Alt-A,<br />
€ 71 million Subprime, € 244 million Other and € 597 million Trading-related net positions as of December 31, 2009.<br />
4 The reserves included in the ‘Other U.S residential mortgage business’ disclosure have been revised to factor in an updated calculation of credit risk and is intended<br />
to better reflect fair value of the instruments underlying the exposure. We have revised the exposure as of December 31, 2009, which results in a reduction in the net<br />
exposure of € 187 million to € 1.1 billion. As of December 31, 2010, the exposure was also calculated on this basis and results in a reduction in the net exposure of<br />
€ 320 million to € 275 million.<br />
In the above table, net exposure represents our potential loss in the event of a 100 % default of securities and<br />
associated hedges, assuming zero recovery. It is not an indication of net delta adjusted trading risk (the net delta<br />
adjusted trading risk measure is used to ensure comparability between different exposures; for each position<br />
the delta represents the change of the position in the related security which would have the same sensitivity to<br />
a given change in the market).<br />
The table above relates to key credit market positions exposed to fair value movements. It excludes assets<br />
reclassified from trading or available for sale to loans and receivables in accordance with the amendments to<br />
IAS 39 with a carrying value as of December 31, 2010 of € 1.8 billion (which includes European residential<br />
mortgage exposure of € 1.0 billion, Other U.S. residential mortgage exposure of € 339 million, CDO subprime<br />
exposure – Trading of € 402 million) and as of December 31, 2009 of € 1.9 billion (which includes European<br />
residential mortgage exposure of € 1.1 billion, Other U.S. residential mortgage exposure of € 370 million, CDO<br />
subprime exposure – Trading of € 432 million).
<strong>Deutsche</strong> <strong>Bank</strong> 01 – Management <strong>Report</strong> 31<br />
Financial <strong>Report</strong> 2010 Operating and Financial Review<br />
In addition to these CB&S positions, Postbank has exposure to European commercial mortgage-backed<br />
securities of € 192 million as well as residential mortgage-backed securities of € 428 million (which includes<br />
€ 398 million in Europe, € 27 million in U.S). In addition, Postbank has exposure to non-corporate CDOs of<br />
€ 69 million where the underlying assets include both commercial mortgage-backed securities and residential<br />
mortgage-backed securities. These positions are mainly classified as loans and receivables and available for<br />
sale.<br />
The table also excludes both agency mortgage-backed securities and agency eligible loans, which we do not<br />
consider to be credit sensitive products, and interest-only and inverse interest-only positions which are negatively<br />
correlated to deteriorating markets due to the effect on the position of the reduced rate of mortgage prepayments.<br />
The slower prepayment rate extends the average life of these interest-only products which in turn leads to a<br />
higher value due to the longer expected interest stream.<br />
The various gross components of the overall net exposure shown above represent different vintages, locations,<br />
credit ratings and other market-sensitive factors. Therefore, while the overall numbers above provide a view of<br />
the absolute levels of our exposure to an extreme market movement, actual future profits and losses will depend<br />
on actual market movements, basis movements between different components of our positions, and our ability<br />
to adjust hedges in these circumstances.<br />
Ocala Funding LLC: We own 71.4 % of the commercial paper issued by Ocala Funding LLC (Ocala), a commercial<br />
paper vehicle sponsored by Taylor Bean & Whitaker Mortgage Corp. (TBW), which ceased mortgage lending<br />
operations and filed for bankruptcy protection in August 2009. We classify the commercial paper as a trading<br />
asset and measure it at fair value through profit or loss. As of December 31, 2010, the total notional value of the<br />
commercial paper issued by Ocala which was held by the Group was € 904 million. As a result of TBW filing for<br />
bankruptcy and based on information available at the time, we recognized a fair value loss of approximately<br />
€ 350 million for 2009 related to the Ocala commercial paper. On July 1, 2010, additional information about the<br />
collateral held by Ocala was included in an Asset Reconciliation <strong>Report</strong> filed with the bankruptcy court with<br />
respect to the TBW estate. Based on this new information and certain management assumptions related to the<br />
eligibility of claims raised against the bankruptcy administrators, we recognized an additional fair value loss in<br />
the second quarter 2010 of approximately € 270 million. In the third quarter 2010, we recorded a further fair<br />
value charge of approximately € 90 million resulting in a fair value loss adjustment for 2010 of approximately<br />
€ 360 million.<br />
Exposure to Monoline Insurers: The deterioration of the U.S. subprime mortgage and related markets has<br />
generated large exposures to financial guarantors, such as monoline insurers, that have insured or guaranteed<br />
the value of pools of collateral referenced by CDOs and other market-traded securities. Actual claims against<br />
monoline insurers will only become due if actual defaults occur in the underlying assets (or collateral). There is<br />
ongoing uncertainty as to whether some monoline insurers will be able to meet all their liabilities to banks and<br />
other buyers of protection. Under certain conditions (e.g., liquidation) we can accelerate claims regardless of<br />
actual losses on the underlying assets.
<strong>Deutsche</strong> <strong>Bank</strong> 01 – Management <strong>Report</strong> 32<br />
Financial <strong>Report</strong> 2010 Operating and Financial Review<br />
The following tables summarize the fair value of our counterparty exposures to monoline insurers with respect<br />
to U.S. residential mortgage-related activity and other activities, respectively, in each case on the basis of the<br />
fair value of the assets compared with the notional value guaranteed or underwritten by monoline insurers. The<br />
other exposures described in the second table arise from a range of client and trading activity, including collateralized<br />
loan obligations, commercial mortgage-backed securities, trust preferred securities, student loans and<br />
public sector or municipal debt. The tables show the associated credit valuation adjustments (“CVA”) that we<br />
have recorded against the exposures. CVAs are assessed using a model-based approach with numerous input<br />
factors for each counterparty, including the likelihood of an event (either a restructuring or insolvency), an<br />
assessment of any potential settlement in the event of a restructuring and recovery rates in the event of either<br />
restructuring or insolvency. The ratings in the tables below are the lower of Standard & Poor’s, Moody’s or our<br />
own internal credit ratings as of December 31, 2010 and December 31, 2009.<br />
Monoline exposure related to U.S.<br />
residential mortgages Dec 31, 2010 Dec 31, 2009<br />
in € m.<br />
Notional<br />
amount<br />
Fair value<br />
prior to<br />
CVA CVA<br />
Fair value<br />
after CVA<br />
Notional<br />
amount<br />
Fair value<br />
prior to<br />
CVA CVA<br />
Fair value<br />
after CVA<br />
AA Monolines:<br />
Other subprime 139 60 (6) 54 142 70 (6) 64<br />
Alt-A 4,069 1,539 (308) 1,231 4,337 1,873 (172) 1,701<br />
Total AA Monolines 4,208 1,599 (314) 1,285 4,479 1,943 (178) 1,765
<strong>Deutsche</strong> <strong>Bank</strong> 01 – Management <strong>Report</strong> 33<br />
Financial <strong>Report</strong> 2010 Operating and Financial Review<br />
Other Monoline exposure Dec 31, 2010 Dec 31, 2009<br />
in € m.<br />
Notional<br />
amount<br />
Fair value<br />
prior to<br />
CVA CVA<br />
Fair value<br />
after CVA<br />
Notional<br />
amount<br />
Fair value<br />
prior to<br />
CVA CVA<br />
Fair value<br />
after CVA<br />
AA Monolines:<br />
TPS-CLO 2,988 837 (84) 753 2,717 925 (85) 840<br />
CMBS 1,084 12 (1) 11 1,004 68 (6) 62<br />
Corporate single<br />
name/Corporate CDO 602 (1) – (1) 2,033 (3) – (3)<br />
Student loans 295 19 (2) 17 232 39 (4) 35<br />
Other 925 226 (23) 203 902 249 (23) 226<br />
Total AA Monolines 5,894 1,093 (110) 983 6,888 1,277 (117) 1,160<br />
Non Investment Grade<br />
Monolines:<br />
TPS-CLO 917 215 (49) 166 876 274 (100) 174<br />
CMBS 6,024 547 (273) 274 5,932 813 (355) 458<br />
Corporate single<br />
name/Corporate CDO 2,180 12 (6) 6 4,366 26 (12) 14<br />
Student loans 1,308 597 (340) 257 1,221 560 (319) 241<br />
Other 1,807 226 (94) 132 1,645 278 (102) 176<br />
Total Non Investment Grade<br />
Monolines 12,236 1,597 (762) 835 14,040 1,950 (887) 1,063<br />
Total 18,130 2,690 (872) 1,818 20,928 3,227 (1,004) 2,223<br />
The tables exclude counterparty exposure to monoline insurers that relates to wrapped bonds. A wrapped bond<br />
is one that is insured or guaranteed by a third party. As of December 31, 2010 and December 31, 2009, the<br />
exposure on wrapped bonds related to U.S. residential mortgages was € 67 million and € 100 million, respectively,<br />
and the exposure on wrapped bonds other than those related to U.S. residential mortgages was € 58 million<br />
and € 54 million, respectively. In each case, the exposure represents an estimate of the potential mark-downs<br />
of wrapped assets in the event of monoline defaults.<br />
A proportion of the mark-to-market monoline exposure has been mitigated with CDS protection arranged with<br />
other market counterparties and other economic hedge activity.<br />
As of December 31, 2010 and December 31, 2009 the total credit valuation adjustment held against monoline<br />
insurers was € 1,186 million and € 1,182 million respectively.
<strong>Deutsche</strong> <strong>Bank</strong> 01 – Management <strong>Report</strong> 34<br />
Financial <strong>Report</strong> 2010 Operating and Financial Review<br />
Commercial Real Estate Business: Our Commercial Real Estate business takes positions in commercial<br />
mortgage whole loans which are originated and either held with the intent to sell, syndicate, securitize or otherwise<br />
distribute to third party investors, or held on an amortized cost basis. The following is a summary of our<br />
exposure to commercial mortgage whole loans as of December 31, 2010 and December 31, 2009. This excludes<br />
our portfolio of secondary market commercial mortgage-backed securities which are actively traded and priced.<br />
Commercial Real Estate whole loans<br />
in € m. Dec 31, 2010 Dec 31, 2009<br />
Loans held on a fair value basis, net of risk reduction 1 2,265 1,806<br />
Loans reclassified in accordance with the amendments to IAS 39 2 4,941 6,453<br />
Loans related to asset sales 3 2,186 2,083<br />
Other loans classified as loans and receivables 4 15,814 –<br />
1 Risk reduction trades represent a series of derivative or other transactions entered into in order to mitigate risk on specific whole loans. Fair value of risk reduction<br />
amounted to € 689 million as of December 31, 2010 and € 1.0 billion as of December 31, 2009.<br />
2 Carrying value.<br />
3 Carrying value of vendor financing on loans sold since January 1, 2008.<br />
4 Carrying value of loans acquired from Postbank.<br />
Leveraged Finance Business: The following is a summary of our exposures to leveraged loan and other financing<br />
commitments arising from the activities of our Leveraged Finance business as of December 31, 2010 and<br />
December 31, 2009. These activities include private equity transactions and other buyout arrangements. The<br />
table excludes loans transacted prior to January 1, 2007, which were undertaken prior to the disruption in the<br />
leveraged finance markets, and loans that have been classified as held to maturity since inception.<br />
Leveraged Finance<br />
in € m. Dec 31, 2010 Dec 31, 2009<br />
Loans held on a fair value basis 2,263 505<br />
thereof: loans entered into since January 1, 2008 2,230 385<br />
Loans reclassified in accordance with the amendments to IAS 39 1 1,367 6,152<br />
Loans related to asset sales 2 5,863 5,804<br />
1 Carrying value. The significant decrease in carrying value since December 2009 is mainly due to the restructuring of loans with Actavis Group hF, as described in<br />
Note 17 “Equity Method Investments”.<br />
2 Carrying value of vendor financing on loans sold since January 1, 2008.<br />
Special Purpose Entities<br />
We engage in various business activities with certain entities, referred to as special purpose entities (SPEs),<br />
which are designed to achieve a specific business purpose. The principal uses of SPEs are to provide clients<br />
with access to specific portfolios of assets and risk and to provide market liquidity for clients through securitizing<br />
financial assets. SPEs may be established as corporations, trusts or partnerships.<br />
We may or may not consolidate SPEs that we have set up or sponsored or with which we have a contractual<br />
relationship. We will consolidate an SPE when we have the power to govern its financial and operating policies,<br />
generally accompanying a shareholding, either directly or indirectly, of more than half the voting rights. If the<br />
activities of the SPEs are narrowly defined or it is not evident who controls the financial and operating policies<br />
of the SPE we will consider other factors to determine whether we have the majority of the risks and rewards.<br />
We reassess our treatment of SPEs for consolidation when there is a change in the SPE’s arrangements or the<br />
substance of the relationship between us and an SPE changes. For further detail on our accounting policies<br />
regarding consolidation and reassessment of consolidation of SPEs please refer to Note 01 “Significant<br />
Accounting Policies” in our consolidated financial statements.
<strong>Deutsche</strong> <strong>Bank</strong> 01 – Management <strong>Report</strong> 35<br />
Financial <strong>Report</strong> 2010 Operating and Financial Review<br />
In limited situations we consolidate some SPEs for both financial reporting and German regulatory purposes.<br />
However, in all other cases we hold regulatory capital, as appropriate, against all SPE-related transactions and<br />
related exposures, such as derivative transactions and lending-related commitments and guarantees. To date,<br />
our exposures to non-consolidated SPEs have not had a material impact on our debt covenants, capital ratios,<br />
credit ratings or dividends.<br />
The following sections provide detail about the assets (after consolidation eliminations) in our consolidated SPEs<br />
and our maximum unfunded exposure remaining to certain non-consolidated SPEs. These sections should be<br />
read in conjunction with the Update on Key Credit Market Exposures which is included in the section “Financial<br />
Position”.<br />
Total Assets in Consolidated SPEs<br />
Dec 31, 2010 Asset type<br />
in € m.<br />
Financial<br />
assets at<br />
fair value<br />
through<br />
profit or loss 1<br />
Financial<br />
assets<br />
available<br />
for sale Loans<br />
Cash and<br />
cash<br />
equivalents Other assets Total assets<br />
Category:<br />
Group sponsored ABCP conduits – 431 15,304 – 59 15,794<br />
Group sponsored securitizations 3,168 369 1,250 20 23 4,830<br />
Third party sponsored securitizations 189 – 507 2 18 716<br />
Repackaging and investment products 6,606 1,053 206 2,211 664 10,740<br />
Mutual funds 4,135 9 – 465 654 5,263<br />
Structured transactions 2,533 269 5,315 386 381 8,884<br />
Operating entities 1,676 3,522 3,309 514 3,582 12,603<br />
Other 199 300 556 117 304 1,476<br />
Total 18,506 5,953 26,447 3,715 5,685 60,306<br />
1 Fair value of derivative positions is € 158 million.<br />
Dec 31, 2009 Asset type<br />
in € m.<br />
Financial<br />
assets at<br />
fair value<br />
through<br />
profit or loss 1<br />
Financial<br />
assets<br />
available<br />
for sale Loans<br />
Cash and<br />
cash<br />
equivalents Other assets Total assets<br />
Category:<br />
Group sponsored ABCP conduits 30 279 15,222 – 33 15,564<br />
Group sponsored securitizations 3,409 – 1,175 4 57 4,645<br />
Third party sponsored securitizations 200 – 516 3 73 792<br />
Repackaging and investment products 5,789 1,973 36 661 557 9,016<br />
Mutual funds 5,163 – – 1,313 35 6,511<br />
Structured transactions 2,531 108 5,207 26 423 8,295<br />
Operating entities 1,603 3,319 1,898 501 2,416 9,737<br />
Other 610 240 786 59 453 2,148<br />
Total 19,335 5,919 24,840 2,567 4,047 56,708<br />
1 Fair value of derivative positions is € 250 million.
<strong>Deutsche</strong> <strong>Bank</strong> 01 – Management <strong>Report</strong> 36<br />
Financial <strong>Report</strong> 2010 Operating and Financial Review<br />
Group Sponsored ABCP Conduits<br />
We set up, sponsor and administer our own asset-backed commercial paper (ABCP) programs. These programs<br />
provide our customers with access to liquidity in the commercial paper market and create investment products<br />
for our clients. As an administrative agent for the commercial paper programs, we facilitate the purchase of<br />
non-<strong>Deutsche</strong> <strong>Bank</strong> Group loans, securities and other receivables by the commercial paper conduit (conduit),<br />
which then issues to the market high-grade, short-term commercial paper, collateralized by the underlying assets,<br />
to fund the purchase. The conduits require sufficient collateral, credit enhancements and liquidity support to<br />
maintain an investment grade rating for the commercial paper. We are the liquidity provider to these conduits<br />
and therefore exposed to changes in the carrying value of their assets. We consolidate the majority of our<br />
sponsored conduit programs because we have the controlling interest.<br />
Our liquidity exposure to these conduits is to the <strong>entire</strong> commercial paper issued of € 16.3 billion and € 16.2 billion<br />
as of December 31, 2010 and December 31, 2009, of which we held € 2.2 billion and € 8.2 billion, respectively.<br />
The decrease in the commercial paper held is due to improved liquidity in the market during the year.<br />
The collateral in the conduits includes a range of asset-backed loans and securities, including aircraft leasing,<br />
student loans, trust preferred securities and residential- and commercial-mortgage-backed securities. There<br />
has been no significant movement in the collateral held in these conduits during the period.<br />
Group Sponsored Securitizations<br />
We sponsor SPEs for which we originate or purchase assets. These assets are predominantly commercial and<br />
residential whole loans or mortgage-backed securities. The SPEs fund these purchases by issuing multiple<br />
tranches of securities, the repayment of which is linked to the performance of the assets in the SPE. When we<br />
retain a subordinated interest in the assets that have been securitized, an assessment of the relevant factors is<br />
performed and, if SPEs are controlled by us, they are consolidated. The fair value of our retained exposure in<br />
these securitizations as of December 31, 2010 and December 31, 2009 was € 3.2 billion and € 3.0 billion,<br />
respectively.<br />
Third Party Sponsored Securitizations<br />
In connection with our securities trading and underwriting activities, we acquire securities issued by third party<br />
securitization vehicles that purchase diversified pools of commercial and residential whole loans or mortgagebacked<br />
securities. The vehicles fund these purchases by issuing multiple tranches of securities, the repayment<br />
of which is linked to the performance of the assets in the vehicles. When we hold a subordinated interest in the<br />
SPE, an assessment of the relevant factors is performed and if SPEs are controlled by us, they are consolidated.<br />
As of December 31, 2010 and December 31, 2009 the fair value of our retained exposure in these securitizations<br />
was € 0.7 billion and € 0.7 billion, respectively.
<strong>Deutsche</strong> <strong>Bank</strong> 01 – Management <strong>Report</strong> 37<br />
Financial <strong>Report</strong> 2010 Operating and Financial Review<br />
Repackaging and Investment Products<br />
Repackaging is a similar concept to securitization. The primary difference is that the components of the<br />
repackaging SPE are generally securities and derivatives, rather than non-security financial assets, which are<br />
then “repackaged” into a different product to meet specific individual investor needs. We consolidate these<br />
SPEs when we have the majority of risks and rewards. Investment products offer clients the ability to become<br />
exposed to specific portfolios of assets and risks through purchasing our structured notes. We hedge this<br />
exposure by purchasing interests in SPEs that match the return specified in the notes. We consolidate the SPEs<br />
when we hold the controlling interest or have the majority of risks and rewards. In 2010, consolidated assets<br />
increased by € 1.7 billion as a result of new business during the period.<br />
Mutual Funds<br />
We offer clients mutual fund and mutual fund-related products which pay returns linked to the performance of<br />
the assets held in the funds. We provide a guarantee feature to certain funds in which we guarantee certain<br />
levels of the net asset value to be returned to investors at certain dates. The risk for us as guarantor is that we<br />
have to compensate the investors if the market values of such products at their respective guarantee dates are<br />
lower than the guaranteed levels. For our investment management service in relation to such products, we earn<br />
management fees and, on occasion, performance-based fees. We are not contractually obliged to support these<br />
funds and have not done so during 2010. In 2009, we made a decision to support the funds’ target yields by<br />
injecting cash of € 16 million.<br />
During 2010 the amount of assets held in consolidated funds decreased by € 1.2 billion. This movement was<br />
predominantly due to cash outflows during the period.<br />
Structured Transactions<br />
We enter into certain structures which offer clients funding opportunities at favorable rates. The funding is<br />
predominantly provided on a collateralized basis. These structures are individually tailored to the needs of our<br />
clients. We consolidate these SPEs when we hold the controlling interest or we have the majority of the risks<br />
and rewards through a residual interest holding and/or a related liquidity facility. The composition of the SPEs<br />
that we consolidate is influenced by the execution of new transactions and the maturing, restructuring and<br />
exercise of early termination options with respect to existing transactions.<br />
Operating Entities<br />
We establish SPEs to conduct some of our operating business when we benefit from the use of an SPE. These<br />
include direct holdings in certain proprietary investments and the issuance of credit default swaps where our<br />
exposure has been limited to our investment in the SPE. We consolidate these entities when we hold the controlling<br />
interest or are exposed to the majority of risks and rewards of the SPE. In 2009, our exposure to Maher<br />
Terminals LLC and Maher Terminals of Canada Corp. was reclassified from Repackaging and Investment<br />
Products to Operating Entities. During 2010 the amount of assets held in Operating entities increased by<br />
€ 2.9 billion. This movement was predominantly due to the consolidation of Postbank SPEs of € 1.4 billion and<br />
€ 1.1 billion following the completion of the Cosmopolitan of Las Vegas.
<strong>Deutsche</strong> <strong>Bank</strong> 01 – Management <strong>Report</strong> 38<br />
Financial <strong>Report</strong> 2010 Operating and Financial Review<br />
Exposure to Non-consolidated SPEs<br />
in € bn. Dec 31, 2010 Dec 31, 2009<br />
Maximum unfunded exposure by category:<br />
Group sponsored ABCP conduits 2.5 2.7<br />
Third party ABCP conduits 1 2.4 2.5 1<br />
Third party sponsored securitizations<br />
U.S. 1.5 3.9<br />
non-U.S. 1.2 2.5<br />
Guaranteed mutual funds 2 10.7 12.4<br />
Real estate leasing funds 0.8 0.8<br />
1 This includes a margin facility as a result of the restructuring of the Canadian asset-backed commercial paper program in January 2009 (€ 1.8 billion and € 1.6 billion<br />
as of December 31, 2010 and 2009, respectively). There have been no drawdowns against this facility.<br />
2 Notional amount of the guarantees.<br />
Group Sponsored ABCP Conduits<br />
We sponsor and administer five ABCP conduits, established in Australia, which are not consolidated because<br />
we do not hold the majority of risks and rewards. These conduits provide our clients with access to liquidity in<br />
the commercial paper market in Australia. As of December 31, 2010 and December 31, 2009 they had assets<br />
totaling € 1.9 billion and € 2.3 billion respectively, consisting of securities backed by non-U.S. residential mortgages<br />
issued by warehouse SPEs set up by the clients to facilitate the purchase of the assets by the conduits.<br />
The minimum credit rating for these securities is AA–. The credit enhancement necessary to achieve the required<br />
credit ratings is ordinarily provided by mortgage insurance extended by third-party insurers to the SPEs.<br />
The weighted average life of the assets held in the conduits is five years. The average life of the commercial<br />
paper issued by these off-balance sheet conduits is one to three months.<br />
Our exposure to these entities is limited to the committed liquidity facilities totaling € 2.5 billion as of December<br />
31, 2010 and € 2.7 billion as of December 31, 2009. None of these liquidity facilities have been drawn. Advances<br />
against the liquidity facilities are collateralized by the underlying assets held in the conduits, and thus a drawn<br />
facility will be exposed to volatility in the value of the underlying assets. Should the assets decline sufficiently in<br />
value, there may not be sufficient funds to repay the advance. As at December 31, 2010 we did not hold material<br />
amounts of commercial paper or notes issued by these conduits.<br />
Third Party ABCP Conduits<br />
In addition to sponsoring our commercial paper programs, we also assist third parties with the formation and<br />
ongoing risk management of their commercial paper programs. We do not consolidate any third party ABCP<br />
conduits as we do not control them.
<strong>Deutsche</strong> <strong>Bank</strong> 01 – Management <strong>Report</strong> 39<br />
Financial <strong>Report</strong> 2010 Operating and Financial Review<br />
Our assistance to third party conduits is primarily financing-related in the form of unfunded committed liquidity<br />
facilities and unfunded committed repurchase agreements in the event of disruption in the commercial paper<br />
market. The liquidity facilities and committed repurchase agreements are recorded off-balance sheet unless a<br />
contingent payment is deemed probable and estimable, in which case a liability is recorded. At December 31,<br />
2010 and 2009, the notional amount of undrawn facilities provided by us was € 2.4 billion and € 2.5 billion,<br />
respectively. These facilities are collateralized by the assets in the SPEs and therefore the movement in the fair<br />
value of these assets will affect the recoverability of the amount drawn.<br />
Third Party Sponsored Securitizations<br />
The third party securitization vehicles to which we, and in some instances other parties, provide financing are<br />
third party-managed investment vehicles that purchase diversified pools of assets, including fixed income<br />
securities, corporate loans, asset-backed securities (predominantly commercial mortgage-backed securities,<br />
residential mortgage-backed securities and credit card receivables) and film rights receivables. The vehicles<br />
fund these purchases by issuing multiple tranches of debt and equity securities, the repayment of which is linked<br />
to the performance of the assets in the vehicles.<br />
The notional amount of liquidity facilities with an undrawn component provided by us as of December 31, 2010<br />
and December 31, 2009 was € 7.0 billion and € 11.1 billion, respectively, of which € 4.3 billion and € 4.7 billion<br />
had been drawn and € 2.7 billion and € 6.4 billion were still available to be drawn as detailed in the table. The<br />
reduction in the total notional during the period was largely due to maturing facilities. All facilities are available<br />
to be drawn if the assets meet certain eligibility criteria and performance triggers are not reached. These facilities<br />
are collateralized by the assets in the SPEs and therefore the movement in the fair value of these assets<br />
affects the recoverability of the amount drawn.<br />
Mutual Funds<br />
We provide guarantees to funds whereby we guarantee certain levels of the net asset value to be returned to<br />
investors at certain dates. These guarantees do not result in us consolidating the funds; they are recorded onbalance<br />
sheet as derivatives at fair value with changes in fair value recorded in the consolidated statement of<br />
income. The fair value of the guarantees was € 5.3 million as of December 31, 2010 and € 2.5 million as of<br />
December 31, 2009. As of December 31, 2010, these non-consolidated funds had € 12.0 billion assets under<br />
management and provided guarantees of € 10.7 billion. As of December 31, 2009, assets of € 13.7 billion and<br />
guarantees of € 12.4 billion were reported. The decrease in assets under management was primarily due to cash<br />
out flows from funds during the period.<br />
Real Estate Leasing Funds<br />
We provide guarantees to SPEs that hold real estate assets (commercial and residential land and buildings and<br />
infrastructure assets located in Germany) that are financed by third parties and leased to our clients. These<br />
guarantees are only drawn upon in the event that the asset is destroyed and the insurance company does not<br />
pay for the loss. If the guarantee is drawn we hold a claim against the insurance company. We also write put<br />
options to closed-end real estate funds set up by us, which purchase commercial or infrastructure assets located<br />
in Germany and which are then leased to third parties. The put option allows the shareholders to sell the asset<br />
to us at a fixed price at the end of the lease. As at December 31, 2010 and December 31, 2009 the notional<br />
amount of the guarantees was € 514 million and € 525 million respectively, and the notional of the put options<br />
was € 246 million and € 246 million respectively. The guarantees and the put options have an immaterial fair<br />
value. We do not consolidate these SPEs as we do not hold the majority of their risks and rewards.
<strong>Deutsche</strong> <strong>Bank</strong> 01 – Management <strong>Report</strong> 40<br />
Financial <strong>Report</strong> 2010 Operating and Financial Review<br />
Liquidity and Capital Resources<br />
For a detailed discussion of our liquidity risk management, see our Risk <strong>Report</strong> and Note 36 “Regulatory Capital”<br />
to our consolidated financial statements.<br />
Long-term Credit Ratings<br />
We believe that maintaining a strong credit quality is a key part of the value we offer to our clients, bondholders<br />
and shareholders. Below are our long-term credit ratings, which with the exception of Moody’s have remained<br />
unchanged throughout 2010.<br />
On March 4, 2010, Moody’s Investors Service downgraded the long-term credit rating of <strong>Deutsche</strong> <strong>Bank</strong> AG<br />
from Aa1 to Aa3. Moody’s attributed the downgrade to the bank’s continued preponderance of capital market<br />
activities and the resulting challenges for risk management, the delay in the acquisition of <strong>Deutsche</strong> Postbank<br />
AG and the consequent deferral of possible benefits of this acquisition, as well as <strong>Deutsche</strong> <strong>Bank</strong>’s other businesses<br />
which have shown a greater degree of earnings volatility than expected.<br />
Dec 31, 2010 Dec 31, 2009 Dec 31, 2008<br />
Moody’s Investors Service, New York 1 Aa3 Aa1 Aa1<br />
Standard & Poor’s, New York 2 A+ A+ A+<br />
Fitch Ratings, New York 3 AA– AA– AA–<br />
1 Moody’s defines the Aa rating as denoting bonds that are judged to be high quality by all standards. Moody’s rates Aa bonds lower than the best bonds (which it rates<br />
Aaa) because margins of protection may not be as large as in Aaa securities or fluctuation of protective elements may be of greater amplitude or there may be other<br />
elements present which make the long-term risk appear somewhat greater than Aaa securities. The numerical modifier 1 indicates that Moody’s ranks the obligation<br />
in the upper end of the Aa category. The numerical modifier 3 indicates that Moody’s ranks the obligation in the lower end of the Aa category.<br />
2 Standard and Poor’s defines its A rating as somewhat more susceptible to the adverse effects of changes in circumstances and economic conditions than obligations<br />
in higher-rated categories. However, the obligor’s capacity to meet its financial commitment on the obligation is still strong.<br />
3 Fitch Ratings defines its AA rating as very high credit quality. Fitch Ratings uses the AA rating to denote a very low expectation of credit risk. According to Fitch Ratings,<br />
AA-ratings indicate very strong capacity for timely payment of financial commitments. This capacity is not significantly vulnerable to foreseeable events. Category AA<br />
is Fitch Ratings second-highest rating category; the minus indicates a ranking in the lower end of the AA category.<br />
Each rating reflects the view of the rating agency only at the time it gave us the rating, and you should evaluate<br />
each rating separately and look to the rating agencies for any explanations of the significance of their ratings.<br />
The rating agencies can change their ratings at any time if they believe that circumstances so warrant. You<br />
should not view these long-term credit ratings as recommendations to buy, hold or sell our securities.
<strong>Deutsche</strong> <strong>Bank</strong> 01 – Management <strong>Report</strong> 41<br />
Financial <strong>Report</strong> 2010 Operating and Financial Review<br />
Tabular Disclosure of Contractual Obligations<br />
The table below shows the cash payment requirements from contractual obligations outstanding as of December<br />
31, 2010.<br />
Contractual obligations<br />
in € m. Total<br />
Less than<br />
1 year 1–3 years 3–5 years<br />
Payment due by period<br />
More than<br />
5 years<br />
Long-term debt obligations 169,660 28,870 44,296 35,703 60,791<br />
Trust preferred securities 12,250 1,334 2,736 1,745 6,435<br />
Long-term financial liabilities designated at fair<br />
value through profit or loss 1 16,383 3,675 4,711 3,040 4,957<br />
Finance lease obligations 155 17 29 36 73<br />
Operating lease obligations 5,221 831 1,341 975 2,074<br />
Purchase obligations 2,643 578 1,407 585 73<br />
Long-term deposits 58,729 – 22,461 12,969 23,299<br />
Other long-term liabilities 13,298 662 732 1,044 10,860<br />
Total 278,339 35,967 77,713 56,097 108,562<br />
1 Mainly long-term debt and long-term deposits designated at fair value through profit or loss.<br />
Figures above do not include the benefit of noncancelable sublease rentals of € 248 million on operating leases.<br />
Purchase obligations for goods and services include future payments for, among other things, processing,<br />
information technology and custodian services. Some figures above for purchase obligations represent minimum<br />
contractual payments and actual future payments may be higher. Long-term deposits exclude contracts with a<br />
remaining maturity of less than one year. Under certain conditions future payments for some long-term financial<br />
liabilities designated at fair value through profit or loss may occur earlier. See the following notes to the consolidated<br />
financial statements for further information: Note 12 “Financial Assets/Liabilities at Fair Value through<br />
Profit or Loss”, Note 23 “Leases”, Note 27 “Deposits” and Note 30 “Long-Term Debt and Trust Preferred Securities”.
<strong>Deutsche</strong> <strong>Bank</strong> 01 – Management <strong>Report</strong> 42<br />
Financial <strong>Report</strong> 2010 Operating and Financial Review<br />
Value-based Management<br />
Since 2009 we have further developed our value-based management framework, which focusses on Total Shareholder<br />
Return (TSR). Based on a TSR-model, which identifies the determinants of our value development<br />
empirically, key metrics for internal steering were derived and connected with business-specific value drivers.<br />
The key metrics include indicators for profitability and growth and evaluate the development of the Group and its<br />
divisions while considering certain constraints (for example with regard to captial consumption and leverage).<br />
Key indicators<br />
1 Return on Equity<br />
2<br />
IBIT<br />
Besides key metrics, business-specific value drivers were identified for every business division individually.<br />
These value drivers are the main internal and external factors which influence the performance and include<br />
financial as well as non-financial indicators, such as the number of customers, business volumes, margins,<br />
market share, external indicies or economic paramters. The selection of value drivers is based on empiric<br />
analyses and was agreed with the management of each buiness division.<br />
The improved concept was included in this years’ planning process and will be the future benchmark for<br />
monthly financial reporting as well as the basis for the quarterly discussion of individual business divisions’<br />
performance expecatations.<br />
Events after the <strong>Report</strong>ing Date<br />
5 Revenue growth<br />
6<br />
IBIT growth<br />
9 Core Tier 1 ratio<br />
Leverage ratio<br />
3 Cost/income ratio<br />
7 Asset growth<br />
11 Liquidity<br />
4 Economic profit<br />
8 Economic profit growth 12 Econ. capital usage<br />
After the balance sheet date no significant events occurred, which had a significant impact on our results of<br />
operations, financial position and net assets.<br />
10<br />
13 Share of classic banking<br />
14<br />
Revenues from growth<br />
regions
<strong>Deutsche</strong> <strong>Bank</strong> <strong>Report</strong> of the Supervisory Board 43<br />
Financial <strong>Report</strong> 2010<br />
<strong>Report</strong> of the Supervisory Board<br />
In 2010, the economic environment continued to stabilize further, beyond our original expectations. In particular<br />
our home market, Germany, benefited from this. Growth continued in the key emerging markets of Latin America<br />
and Asia. In the eurozone, fiscal tightening and economic rebalancing dampened growth in some countries.<br />
Uncertainties remain concerning the stability of the financial system, which, in light of the excessive levels of<br />
sovereign debt, led to high volatility in the capital markets. Furthermore, new regulatory requirements have<br />
become more concrete in the wake of the crisis. The “Basel III” rules recently approved by the G20 are just the<br />
beginning.<br />
For <strong>Deutsche</strong> <strong>Bank</strong>, 2010 was a year of investments, a year in which we drove change and clearly enhanced our<br />
competitive position. In many ways, the bank is now stronger than before the financial crisis and exceptionally<br />
well positioned for renewed growth. Our market presence was significantly expanded through the takeover of<br />
parts of ABN AMRO <strong>Bank</strong> in the Netherlands as well as Sal. Oppenheim and Postbank in Germany. The bank<br />
has thus improved its earnings power, especially in the retail and commercial banking businesses, and is creating<br />
a second powerful revenue engine alongside its globally successful investment banking operations.<br />
The bank also strengthened its equity capital base. Thanks to the well-chosen timeframe, the capital increase<br />
was carried out very successfully in September with gross issue proceeds of € 10.2 billion, making it possible<br />
to launch into the decisive phase of the Postbank takeover. The bank’s capital strength will continue to be a top<br />
priority for the Management Board and Supervisory Board in the future, too. We also took this into account in<br />
this year’s dividend proposal, just like last year. The bank will continue to face major challenges, including the<br />
Postbank integration, and new regulatory requirements. We would like to thank the Management Board and<br />
the bank’s employees for their great personal dedication.<br />
In 2010, we again addressed numerous statutory and regulatory changes. Last year, we extensively discussed<br />
the bank’s economic and financial development, its operating environment, risk management system, planning<br />
and internal control system as well as changes in the system of compensation for the Management Board. We<br />
held in-depth discussions with the Management Board on the bank’s strategy and continued implementation of<br />
the measures in phase four of the bank’s management agenda. The Management Board reported to us regularly,<br />
without delay and comprehensively on business policies and other fundamental issues relating to management<br />
and corporate planning, the bank’s financial development and earnings situation, the bank’s risk, liquidity and<br />
capital management as well as transactions and events that were of significant importance to the bank. We<br />
advised the Management Board and monitored its management of business. We were involved in decisions of<br />
fundamental importance. Regular discussions were also held between the Chairman of the Supervisory Board<br />
and the Chairman of the Management Board dealing with important topics and upcoming decisions. Between<br />
meetings, the Management Board kept us informed in writing of important events. Resolutions were passed by<br />
circulation procedure when necessary between the meetings.
<strong>Deutsche</strong> <strong>Bank</strong> <strong>Report</strong> of the Supervisory Board 44<br />
Financial <strong>Report</strong> 2010<br />
Meetings of the Supervisory Board<br />
The Supervisory Board held nine meetings in the 2010 financial year.<br />
At the first meeting of the year on February 3, 2010, we discussed the development of business in 2009, the<br />
key figures of the <strong>Annual</strong> Financial Statements for 2009 and a comparison of the plan-actual figures for 2009.<br />
The dividend proposal for the year 2009 as well as the corporate planning for the years 2010 to <strong>2012</strong> were<br />
noted with approval. Furthermore, we discussed the audit report by PricewaterhouseCoopers on the proper<br />
functioning of the business organization of the Corporate Security area, as well as the Corporate Governance<br />
<strong>Report</strong> and Corporate Governance Statement. We gave our consent to Dr. Börsig and Dr. Eick being named in<br />
the <strong>Annual</strong> <strong>Report</strong> as financial experts in accordance with German and U.S. law and verified the independence<br />
of the Audit Committee members. Finally, we approved amendments to the Articles of Association and, following<br />
extensive discussion, the restructuring of the Management Board’s compensation based on a recommendation<br />
from the Chairman’s Committee.<br />
At two other meetings on February 10 and February 18, 2010, we discussed the basis for calculating the variable<br />
compensation for the Management Board for the 2009 financial year, including the regulations of the Act on the<br />
Appropriateness of Management Board Compensation (VorstAG), and subsequently determined the Management<br />
Board’s compensation – with the involvement of an independent external legal advisor and compensation<br />
consultant – while taking into account the recommendations of the Chairman’s Committee.<br />
At the financial statements meeting on March 12, 2010, based on the Audit Committee’s recommendation and<br />
after a discussion with the auditor, we approved the Consolidated Financial Statements and <strong>Annual</strong> Financial<br />
Statements for 2009. Furthermore, the Compliance and Anti-Money Laundering <strong>Report</strong> was presented and a<br />
discussion was held on the possible increase in our participation in Hua Xia <strong>Bank</strong> in China. Mr. Lamberti informed<br />
us of the bank’s compensation structures and practices (Remuneration <strong>Report</strong>) in accordance with the new<br />
requirements of the Federal Financial Supervisory Authority (BaFin). We also obtained extensive information<br />
on the key risk positions and the Group’s risk management. Changes in the composition of the Regional Advisory<br />
Boards and Advisory Councils in Germany were presented to us, and the resolution proposals for the Agenda<br />
of the General Meeting 2010 were approved.<br />
At the meeting on the day before the General Meeting, we discussed the procedures for the General Meeting<br />
and the announced counterproposals as well as the status of litigation in connection with the General Meetings<br />
2004 – 2009. As necessary, resolutions were approved. Furthermore, Dr. Ackermann summarized the bank’s<br />
exposures in Greece and reported on the future course of action.<br />
At an extraordinary meeting on June 15, 2010, we noted Mr. Cohrs’s request to retire from the Management<br />
Board with effect from September 30, 2010, and agreed in general, on the basis of specific criteria, to the termination<br />
of his service agreement. Furthermore, we approved in general the resulting changes to the Business<br />
Allocation Plan for the Management Board based on the proposal submitted by the Chairman’s Committee.<br />
Dr. Ackermann informed us of the stress tests planned for financial institutions.<br />
At the meeting on July 27, 2010, we were informed of the bank’s development in the first six months of the year.<br />
Based on the supplements to the German Corporate Governance Code approved by the Government Commission<br />
in May 2010, amendments to the terms of reference for the Supervisory Board, Chairman’s Committee and<br />
Nomination Committee were resolved, with the aim of implementing all of the new recommendations of the<br />
Code. Furthermore, we approved an adjustment to the plan conditions for the restricted incentive and equity<br />
awards issued to the Management Board members in 2010. Mr. Lamberti reported to us on the bank’s IT infra-
<strong>Deutsche</strong> <strong>Bank</strong> <strong>Report</strong> of the Supervisory Board 45<br />
Financial <strong>Report</strong> 2010<br />
structure, the governance of GTO and ongoing challenges facing the banking sector. Mr. Krause presented the<br />
strategic and financial objectives of the complexity reduction program as well as a progress report on the integration<br />
of Sal. Oppenheim and the commercial banking activities taken over from ABN AMRO <strong>Bank</strong> in the<br />
Netherlands. In addition, we approved the Management Board resolution to raise our participation in Hua Xia<br />
<strong>Bank</strong> in China to 19.99 % within the framework of its capital increase as well as the proposal submitted by<br />
the Chairman’s Committee regarding the termination of Mr. Cohrs’s service agreement.<br />
At an extraordinary meeting on September 12, 2010, based on the recommendation of the Chairman’s Committee,<br />
we consented to the Management Board resolutions taken on the same day to submit a public takeover<br />
offer to the shareholders of <strong>Deutsche</strong> Postbank AG and to increase the share capital of the bank.<br />
At the last meeting of the year on October 27, 2010, we were informed of the development of business in the<br />
third quarter and of the status of the takeover offer submitted to shareholders of <strong>Deutsche</strong> Postbank AG. Together<br />
with the Management Board, we discussed in detail the bank’s further strategic development along with the<br />
corresponding targets and planned measures. Mr. Lamberti presented to us the <strong>Deutsche</strong> <strong>Bank</strong> Human<br />
Resources <strong>Report</strong>. Furthermore, changes to the Terms of Reference for the Management Board, including the<br />
Business Allocation Plan, and to the Terms of Reference for the Audit Committee, based on the Minimum<br />
Requirements for the Compliance Function were discussed and approved. Finally, we determined the objectives<br />
for the composition of the Supervisory Board.<br />
The Committees of the Supervisory Board<br />
The Chairman’s Committee met ten times during the reporting period. In addition, two telephone conferences<br />
took place. Between the meetings, the Chairman of the Chairman’s Committee spoke with the Committee<br />
members regularly about issues of major importance. The Committee examined, in particular, the new statutory<br />
and regulatory requirements for Management Board compensation and their implementation, the preparations<br />
for determining the variable compensation for the 2009 financial year, issues of succession planning and the<br />
termination of the Management Board appointment of Mr. Cohrs. Discussions also focussed on the amendments<br />
required to the terms of reference for the Management Board and the Supervisory Board and its committees as<br />
well as changes to the Management Board’s Business Allocation Plan. In addition, the Chairman’s Committee<br />
prepared resolutions for the Supervisory Board and gave its approval to Management Board members for their<br />
ancillary activities or to accept directorships at other companies. Furthermore, based on the authorization of<br />
the Supervisory Board, it approved the final structure of the bank’s capital increase. Finally, it handled the<br />
implementation of the new recommendations and suggestions of the German Corporate Governance Code.<br />
At its six meetings, the Risk Committee discussed the bank’s exposures subject to mandatory approval under<br />
German law and the Articles of Association. Where necessary, the Risk Committee gave its approval. Apart<br />
from credit, liquidity, country, market and operational risks, the Committee also addressed legal and reputational<br />
risks. The Committee’s discussions extensively covered the bank’s risk position along with the developments<br />
of the sovereign debt crisis in Europe and their impacts on the bank. In addition to the development of<br />
risks relating to leveraged finance, commercial real estate finance and monoline insurers, the Committee discussed<br />
in detail the effects of the new regulatory rules on the bank and its risk position. Furthermore, the<br />
Committee focussed on the risk absorption capacity, i.e. the ratio between available and required capital<br />
(reporting in accordance with ICAAP) including a comparison of the economic risks to the risk coverage potential<br />
and its consistent incorporation in risk management, and on the development of the bank’s refinancing
<strong>Deutsche</strong> <strong>Bank</strong> <strong>Report</strong> of the Supervisory Board 46<br />
Financial <strong>Report</strong> 2010<br />
and liquidity position. Also, global industry portfolios were presented according to a specified plan and discussed<br />
at length.<br />
The Audit Committee met six times in 2010. Representatives of the bank’s auditor participated regularly in<br />
these meetings. Subjects covered were the audit of the <strong>Annual</strong> Financial Statements and Consolidated Financial<br />
Statements for 2009, the quarterly financial statements, Forms 20-F and 6-K for the U.S. Securities<br />
and Exchange Commission (SEC), as well as the interim reports. The Committee dealt with the proposal for<br />
the election of the auditor for the 2010 financial year, issued the audit mandate, specified audit areas of focus,<br />
resolved on the auditor’s remuneration and verified the auditor’s independence in accordance with the requirements<br />
of the German Corporate Governance Code and the rules of the U.S. Public Company Accounting<br />
Oversight Board (PCAOB). The Audit Committee is convinced that, as in the previous years, there are no conflicts<br />
of interest on the part of the bank’s auditor. It checked in detail to what extent our internal control systems<br />
are in accordance with the requirements of the Sarbanes-Oxley Act. The Committee assured itself of the effectiveness<br />
of the system of internal controls, risk management and internal audit and monitored the financial reporting<br />
and accounting process. When necessary, resolutions were passed or recommendations were issued for the<br />
Supervisory Board’s approval. The Audit Committee had reports submitted to it regularly on the engagement of<br />
accounting firms, including the auditor, with non-audit-related tasks, on the work of internal audit, on issues<br />
relating to compliance, on legal and reputational risks as well as on special investigations and significant findings<br />
of regulatory authorities. Internal Audit’s plan for the year was noted with approval. The Audit Committee did<br />
not receive any complaints in connection with accounting, internal accounting controls and auditing matters. At<br />
the last meeting of the year, the Committee obtained information from the Management Board and the auditor<br />
on key topics in planning for the <strong>Annual</strong> Financial Statements for 2010. These included, above all, the initial<br />
consolidation of <strong>Deutsche</strong> Postbank AG, Sal. Oppenheim and the business units acquired from ABN AMRO<br />
<strong>Bank</strong> in the Netherlands, the measures to prepare for the audit of the <strong>Annual</strong> Financial Statements and the areas<br />
of audit focus pursuant to Section 30 of the German <strong>Bank</strong>ing Act (KWG). Furthermore, it received reports on<br />
the replacement of IAS 39 and the introduction of IFRS 9 for financial instruments, as well as on steps taken<br />
and further plans for the complexity reduction program.<br />
The Nomination Committee held two informal meetings relating to succession issues on the Supervisory Board.<br />
Meetings of the Mediation Committee, established pursuant to the provisions of Germany’s Co-Determination<br />
Act (MitbestG), were not necessary in 2010.<br />
The committee chairmen reported regularly to the Supervisory Board on the work of the committees.<br />
In 2010, all Supervisory Board members participated in the meetings of the Supervisory Board and their<br />
respective committees with only few exceptions (average attendance: 95 %).<br />
Corporate Governance<br />
Implementation of the new recommendations of the German Corporate Governance Code was discussed at<br />
the Supervisory Board and Chairman’s Committee meetings in July 2010. The Supervisory Board resolved to<br />
implement all of the new recommendations of the Code and accordingly amended the terms of reference for<br />
the Supervisory Board, Chairman’s Committee, Nomination Committee and Management Board as necessary.
<strong>Deutsche</strong> <strong>Bank</strong> <strong>Report</strong> of the Supervisory Board 47<br />
Financial <strong>Report</strong> 2010<br />
In addition, the Chairman’s Committee and Supervisory Board addressed the implementation of the new regulations<br />
on Management Board compensation at several meetings. For the review of the structure of the Management<br />
Board’s compensation system and of the appropriateness of the variable compensation for the 2010<br />
financial year, the Supervisory Board resolved to engage an independent legal advisor and a compensation<br />
consultant.<br />
Furthermore, at the meeting in October 2010, based on a proposal by the Chairman’s Committee and in<br />
accordance with No. 5.4.1 of the German Corporate Governance Code, we determined the objectives for the<br />
composition of the Supervisory Board (see pages 375 ff. of the Corporate Governance <strong>Report</strong> in the Financial<br />
<strong>Report</strong> 2010).<br />
As resolved in October 2009, efficiency reviews on the basis of company-specific questionnaires were carried<br />
out in spring 2010, not only for the Supervisory Board as a whole, but also for the Chairman’s, Audit and Risk<br />
Committees, and the results were presented and discussed in detail at the subsequent meetings. We are of the<br />
opinion that the work of the Supervisory Board is carried out efficiently and that a high standard was achieved in<br />
this context. Suggestions and measures that had been recommended in the previous review of the Supervisory<br />
Board’s efficiency were effectively implemented and led to a further increase in the efficiency of the work<br />
of the Supervisory Board and its committees. In addition, initial suggestions from the efficiency reviews were<br />
already implemented in 2010.<br />
We determined that the Supervisory Board has what we consider to be an adequate number of independent<br />
members. We also determined that all members of the Audit Committee are independent as defined by the<br />
implementation rules of the Securities and Exchange Commission (SEC) issued pursuant to Section 407 of the<br />
Sarbanes-Oxley Act of 2002. Dr. Börsig and Dr. Eick were named as Audit Committee financial experts in<br />
accordance with the regulations of the SEC as well as Sections 107 (4) and 100 (5) of the German Stock Corporation<br />
Act (AktG).<br />
The Declaration of Conformity pursuant to Section 161 of the German Stock Corporation Act (AktG), last issued<br />
by the Supervisory Board and Management Board in October 2009 and updated in January 2010, was reissued<br />
at the meeting of the Supervisory Board on October 27, 2010. <strong>Deutsche</strong> <strong>Bank</strong> AG complies, without exception,<br />
with all of the recommendations in the version of the Code dated May 26, 2010.<br />
A comprehensive presentation of the bank’s corporate governance, including the text of the Declaration of<br />
Conformity issued on October 27, 2010, can be found in the Financial <strong>Report</strong> 2010 on pages 375 ff. and on our<br />
Internet website at http://www.deutsche-bank.com/ir/en/content/corporate_governance.htm. The terms of reference<br />
for the Supervisory Board and its committees as well as for the Management Board are also published<br />
there, each in their currently applicable versions.<br />
Training and Further Education Measures<br />
Members of the Supervisory Board completed the training and further education measures required for their<br />
tasks on their own. <strong>Deutsche</strong> <strong>Bank</strong> provided the appropriate support to them in this context. New members<br />
joining the Supervisory Board in 2010 were given orientation individually tailored to their levels of knowledge,<br />
a package of information material and opportunities, for internal and external training, which were widely used.<br />
All of the members of the Supervisory Board were informed of the legal basis of the Supervisory Board’s work<br />
as part of a workshop carried out by an external attorney. Furthermore, another external attorney spoke to
<strong>Deutsche</strong> <strong>Bank</strong> <strong>Report</strong> of the Supervisory Board 48<br />
Financial <strong>Report</strong> 2010<br />
them on the Supervisory Board’s responsibilities and task. During the reporting year, two internal workshops<br />
were held for members of the Risk Committee on issues relating to credit, market and operational risks as well<br />
as the economic capital model (ICAAP). Together with staff members of the Finance department and the auditor,<br />
the Audit Committee members discussed the new regulations on accounting and financial reporting. In<br />
addition, members of the Supervisory Board were informed of new developments in corporate governance.<br />
Conflicts of Interest and Their Handling<br />
The Risk Committee dealt with the loan approvals required pursuant to Section 15 of the German <strong>Bank</strong>ing Act<br />
(KWG). Supervisory Board members who were also board members of the respective borrowing company<br />
when the resolutions were taken, or who might have faced a possible conflict of interests for other reasons, did<br />
not participate in the discussion and voting.<br />
In September 2010, Professor Kagermann did not participate in the discussion of and voting on the submission<br />
of a public takeover offer to the shareholders of <strong>Deutsche</strong> Postbank AG owing to his membership on the<br />
Supervisory Board of <strong>Deutsche</strong> Post AG and thus a possible conflict of interests in this context.<br />
Occasionally, there were latent conflicts of interest on the part of individual Supervisory Board members. During<br />
the reporting period, Ms. Förster and Ms. Ruck were also members of the Supervisory Board of <strong>Deutsche</strong><br />
<strong>Bank</strong> Privat- und Geschäftskunden AG as representatives of the employees. They did not participate in the<br />
discussions of and voting on topics relating to their work, such as resolutions pursuant to Section 32 of the<br />
German Co-determination Act (MitbestG). Additional special measures to address these latent and only occasional<br />
conflicts of interest were not required.<br />
Litigation<br />
As in the preceding years, the Supervisory Board was regularly informed of important lawsuits and discussed<br />
further courses of action. These included the actions for rescission and to obtain information filed in connection<br />
with the General Meetings in 2004, 2005, 2006, 2007, 2008, 2009 and 2010, as well as the lawsuits brought<br />
against <strong>Deutsche</strong> <strong>Bank</strong> and Dr. Breuer by Dr. Kirch and KGL Pool GmbH. The General Meeting’s election of<br />
shareholder representatives on May 29, 2008, was contested by several shareholders. The case is currently before<br />
Germany’s Supreme Court, which will rule on the admissibility of an appeal against the decision taken by<br />
the Higher Regional Court Frankfurt am Main to dismiss the complaint.<br />
Furthermore, reports concerning important lawsuits were presented to the Supervisory Board on a regular<br />
basis and, in detail, to the Audit and Risk Committees.
<strong>Deutsche</strong> <strong>Bank</strong> <strong>Report</strong> of the Supervisory Board 49<br />
Financial <strong>Report</strong> 2010<br />
<strong>Annual</strong> Financial Statements<br />
KPMG Aktiengesellschaft Wirtschaftsprüfungsgesellschaft, the auditor of the <strong>Annual</strong> Financial Statements<br />
elected at last year’s General Meeting, has audited the accounting, the <strong>Annual</strong> Financial Statements and the<br />
Management <strong>Report</strong> for 2010 as well as the Consolidated Financial Statements with the related Notes and<br />
Management <strong>Report</strong> for 2010. The audits led in each case to an unqualified opinion. The Audit Committee<br />
examined the documents for the <strong>Annual</strong> Financial Statements and Consolidated Financial Statements, along<br />
with the auditor’s report, and discussed these extensively with the auditor. The Chairman of the Audit Committee<br />
reported to us on this at today’s meeting of the Supervisory Board. We agreed with the results of the audits after<br />
inspecting the auditor’s reports and the documents for the <strong>Annual</strong> Financial Statements and Consolidated Financial<br />
Statements, and after an extensive discussion, we agreed to the recommendation of the Audit Committee<br />
and determined that, also based on the results of our inspections, there were no objections to be raised.<br />
Today, we approved the <strong>Annual</strong> Financial Statements and Consolidated Financial Statements prepared by the<br />
Management Board; the <strong>Annual</strong> Financial Statements are thus established. We agree to the Management<br />
Board’s proposal for the appropriation of profits.<br />
Personnel Issues<br />
With effect from the end of September 30, 2010, Mr. Cohrs retired from the Management Board. His functional<br />
responsibilities were assumed by Mr. Jain in addition to his existing tasks.<br />
There were changes in the composition of the Supervisory Board. Mr. Wunderlich was a member of the Supervisory<br />
Board until June 30, 2010. He was replaced for the remainder of his term of office by Mr. Kazmierczak.<br />
Ms. Förster was a member of the Supervisory Board until July 31, 2010. She was replaced for the remainder of<br />
her term of office by Mr. Viertel.<br />
We thank the members who left last year for their dedicated work on the Supervisory Board and for their constructive<br />
assistance to the company and the Management Board in recent years.<br />
Frankfurt am Main, March 11, 2011<br />
The Supervisory Board<br />
Dr. Clemens Börsig<br />
Chairman
<strong>Deutsche</strong> <strong>Bank</strong> 01 – Management <strong>Report</strong> 50<br />
Financial <strong>Report</strong> 2010 Risk <strong>Report</strong><br />
Risk <strong>Report</strong><br />
Included in the following section on quantitative and qualitative disclosures about credit, market and other risks<br />
is information which forms part of the financial statements of <strong>Deutsche</strong> <strong>Bank</strong> and which is incorporated by<br />
reference into the financial statements of this report. Such information is marked by a bracket in the margins<br />
throughout this section.<br />
Effective December 3, 2010, <strong>Deutsche</strong> <strong>Bank</strong> consolidated <strong>Deutsche</strong> Postbank Group (“Postbank”). The following<br />
section on qualitative and quantitative risk disclosures provides a comprehensive view on the risk profile of<br />
<strong>Deutsche</strong> <strong>Bank</strong> Group, after consolidation of Postbank. In particular, the quantitative information generally reflects<br />
<strong>Deutsche</strong> <strong>Bank</strong> Group including Postbank for the reporting date December 31, 2010 or the respective reporting<br />
period from December 3, 2010. In the limited instances where a consolidated view has not been presented, a<br />
separate Postbank risk disclosure or applicable qualitative commentary is provided where appropriate.<br />
Postbank currently conducts its own risk management activities under its own statutory responsibilities.<br />
<strong>Deutsche</strong> <strong>Bank</strong> Group provides advisory services to Postbank with regard to specific risk management areas.<br />
It is intended to increase the convergence of risk management principles across <strong>Deutsche</strong> <strong>Bank</strong> Group and<br />
Postbank over time. This also responds to regulatory requirements that are applicable to <strong>Deutsche</strong> <strong>Bank</strong> AG<br />
as the parent company of the combined group.<br />
Risk Management Executive Summary<br />
The overall focus of Risk and Capital Management in 2010 was on maintaining our risk profile in line with our<br />
risk strategy, strengthening our capital base and supporting the Group’s strategic initiatives under phase 4 of<br />
our management agenda. This approach is reflected across the different risk metrics summarized below.<br />
Credit Risk<br />
— Diligent adherence to our core credit principles of proactive and prudent risk management, coupled with the<br />
economic recovery in our key markets in 2010 has resulted in lower credit losses and further improved quality<br />
of our non-Postbank credit portfolio. This has been achieved by stringent application of our existing<br />
risk management philosophy of strict underwriting standards, active concentration risk management and<br />
risk mitigation strategies including collateral, hedging, netting and credit support arrangements.<br />
— Our provision for credit losses in 2010 was € 1.3 billion which is significantly lower than € 2.6 billion in 2009.<br />
The € 1.3 billion in 2010 included € 278 million of new provisions relating to assets reclassified in accordance<br />
with IAS 39. Our provision for non IAS 39 assets in 2010 also declined during the year to € 996 million<br />
(including € 56 million of Postbank related provisions in 2010) compared to € 1.4 billion in 2009.<br />
— The portion of our corporate loan book carrying an investment-grade rating improved from 61 % at December<br />
31, 2009 to 69 % at December 31, 2010, reflecting positive rating migration and the first-time inclusion of<br />
Postbank positions.
<strong>Deutsche</strong> <strong>Bank</strong> 01 – Management <strong>Report</strong> 51<br />
Financial <strong>Report</strong> 2010 Risk <strong>Report</strong><br />
— Excluding acquisitions, the loan portfolio grew by 3 % or € 8 billion whilst adhering to strict risk/reward<br />
requirements.<br />
— With the consolidation of Postbank on December 3, 2010, our loan portfolio increased by € 129 billion,<br />
principally in German retail loans but also including € 15 billion commercial real estate loans.<br />
Market Risk<br />
— In 2010, we continued to increase the number and specialization of our Market Risk Management staff.<br />
— The economic capital usage for trading market risk totaled € 6.4 billion at year-end 2010 compared with<br />
€ 4.6 billion at year-end 2009. The increase reflected methodology changes and more conservative liquidity<br />
assumptions. This was partially offset by a reduction in our legacy (trading) credit exposure.<br />
— The decrease in average value-at-risk in 2010 was driven primarily by reduced risk taking and lower historical<br />
volatilities. In addition our trading business continued to recalibrate the business model towards taking less<br />
risk in illiquid or complex exposures.<br />
Operational Risk<br />
— Operational risk economic capital usage increased by € 189 million, or 5 %, to € 3.7 billion as of December<br />
31, 2010. The increase is fully explained by acquisitions.<br />
Liquidity Risk<br />
— Liquidity Reserves (excluding Postbank) exceeded € 145 billion as of December 31, 2010.<br />
— 2010 issuance activities amounted to € 22.9 billion as compared to a planned € 19 billion (excluding Postbank).<br />
— The Postbank acquisition added significant stable funding sources.<br />
Capital Management<br />
— We successfully completed the capital increase in October 2010 with net proceeds of € 10.1 billion.<br />
— The Core Tier 1 capital ratio, which excludes hybrid instruments, was 8.7 % at the end of 2010, at the same<br />
level as at the end of 2009.<br />
— Tier 1 capital ratio was 12.3 % at the end of 2010, compared to 12.6 % at the end of 2009, and substantially<br />
above our published target level of at least 10.0 %.<br />
— Risk-weighted assets were up by € 73 billion to € 346 billion at the end of 2010, mainly due to the consolidation<br />
of Postbank.<br />
Balance Sheet Management<br />
— As of December 31, 2010, our leverage ratio according to our target definition was 23 at the same level as<br />
at the end of 2009, and below our leverage ratio target of 25. The impact from our acquisitions on our total<br />
assets was fully compensated for by the impact of our rights issue on the applicable equity.
<strong>Deutsche</strong> <strong>Bank</strong> 01 – Management <strong>Report</strong> 52<br />
Financial <strong>Report</strong> 2010 Risk <strong>Report</strong><br />
Risk and Capital Management<br />
The wide variety of our businesses requires us to identify, measure, aggregate and manage our risks effectively,<br />
and to allocate our capital among our businesses appropriately. We manage risk and capital through a framework<br />
of principles, organizational structures as well as measurement and proactive monitoring processes that<br />
are closely aligned with the activities of our group divisions. The importance of strong risk and capital management<br />
and the continuous need to refine these practices became particularly evident during the financial market<br />
crisis. While we continuously strive to improve our risk and capital management, we may be unable to anticipate<br />
all market developments, in particular those of an extreme nature.<br />
Risk and Capital Management Principles<br />
The following key principles underpin our approach to risk and capital management:<br />
— Our Management Board provides overall risk and capital management supervision over our consolidated<br />
Group. Our Supervisory Board regularly monitors our risk and capital profile.<br />
— We manage credit, market, liquidity, operational, business and reputational risks as well as our capital in a<br />
coordinated manner at all relevant levels within our organization. This also holds true for complex products<br />
which we typically manage within our framework established for trading exposures.<br />
— The structure of our integrated Legal, Risk & Capital function is closely aligned with the structure of our<br />
group divisions.<br />
— The Legal, Risk & Capital function is independent of our group divisions.<br />
Comparable risk management principles are in place at Postbank reflected in its own organizational setup.
<strong>Deutsche</strong> <strong>Bank</strong> 01 – Management <strong>Report</strong> 53<br />
Financial <strong>Report</strong> 2010 Risk <strong>Report</strong><br />
Risk and Capital Management Organization<br />
The following chart provides a schematic overview of the risk management governance structure of the<br />
<strong>Deutsche</strong> <strong>Bank</strong> Group.<br />
Risk and Capital Management – Schematic Overview of Governance Structure at Group Level<br />
Supervisory Board<br />
Management Board<br />
Risk Executive Committee *)<br />
Management of Legal, Risk & Capital function<br />
Chair: Dr. Hugo Bänziger<br />
Voting Members: Senior Risk Managers<br />
Non-Voting Members: Senior Representatives from<br />
Group Audit, Loan Exposure Management Group<br />
and Research<br />
*) Supported by several Sub-Committees<br />
Risk Committee of the Supervisory Board<br />
Regular monitoring of risk and capital profile<br />
Chair: Dr. Clemens Börsig<br />
Management Board<br />
Overall risk and capital management supervision<br />
Chief Risk Officer: Dr. Hugo Bänziger<br />
Risk Management Functions<br />
Capital and Risk Committee *)<br />
Planning of Capital, Funding & Liquidity<br />
Chair: Dr. Hugo Bänziger<br />
Voting Members: Chief Financial Officer and<br />
Senior Risk Managers<br />
Non-Voting Members: Global Business Heads and<br />
Head of Group Strategy & Planning<br />
Our Chief Risk Officer, who is a member of our Management Board, is responsible for our Group-wide credit,<br />
market, operational, liquidity, business, legal and reputational risk management. Additionally our Chief Risk<br />
Officer is responsible for capital management activities and heads our integrated Legal, Risk & Capital function.<br />
Two functional committees, which are both chaired by our Chief Risk Officer, are central to the Legal, Risk &<br />
Capital function.<br />
— Our Risk Executive Committee is responsible for management and control of the aforementioned risks<br />
across our consolidated Group. To fulfill this mandate, the Risk Executive Committee is supported by subcommittees<br />
that are responsible for dedicated areas of risk management, including several policy committees<br />
and the Group Reputational Risk Committee.
<strong>Deutsche</strong> <strong>Bank</strong> 01 – Management <strong>Report</strong> 54<br />
Financial <strong>Report</strong> 2010 Risk <strong>Report</strong><br />
— The responsibilities of the Capital and Risk Committee include risk profile and capital planning, capital capacity<br />
monitoring and optimization of funding. It also supervises our non-traded market risk exposures.<br />
Multiple members of the Capital and Risk Committee are also members of the Group Investment Committee,<br />
ensuring a close link between both committees as proposals for strategic investments are analyzed by the<br />
Group Investment Committee. Depending on the size of the strategic investment it may require approval from<br />
the Group Investment Committee, the Management Board or even the Supervisory Board. The development of<br />
the strategic investments is monitored by the Group Investment Committee on a regular basis.<br />
Dedicated Legal, Risk & Capital units are established with the mandate to:<br />
— Ensure that the business conducted within each division is consistent with the risk appetite that the Capital<br />
and Risk Committee has set within a framework established by the Management Board;<br />
— Formulate and implement risk and capital management policies, procedures and methodologies that are<br />
appropriate to the businesses within each division;<br />
— Approve credit, market and liquidity risk limits;<br />
— Conduct periodic portfolio reviews to ensure that the portfolio of risks is within acceptable parameters; and<br />
— Develop and implement risk and capital management infrastructures and systems that are appropriate for<br />
each division.<br />
The heads of our Legal, Risk & Capital units, who are members of our Risk Executive Committee, are responsible<br />
for the performance of the risk management units and report directly to our Chief Risk Officer.<br />
Our Finance and Audit departments operate independently of both the group divisions and of the Legal, Risk &<br />
Capital function. The role of the Finance department is to help quantify and verify the risk that we assume and<br />
ensure the quality and integrity of our risk-related data. Our Audit department performs risk-oriented reviews of<br />
the design and operating effectiveness of our system of internal controls.<br />
Postbank’s Group-wide risk management organization independently measures and evaluates all key risks and<br />
their drivers. During 2010 the Chief Risk Officer had a direct reporting line to the Management Board of Postbank.<br />
Effective March 1, 2011, Postbank’s Chief Risk Officer role has been established at Management Board level.<br />
The key risk management committees of Postbank, in all of which Postbank’s Chief Risk Officer is a voting<br />
member, are:<br />
— The <strong>Bank</strong> Risk Committee (newly established in 2010), which advises Postbank’s Management Board with<br />
respect to the determination of overall risk appetite and risk allocation.<br />
— The Credit Risk Committee, which is responsible for limit allocation and the definition of an appropriate limit<br />
framework.<br />
— The Market Risk Committee, which decides on limit allocations as well as strategic positioning of Postbank’s<br />
banking book and the management of liquidity risk.<br />
— The Operational Risk Committee which defines the appropriate risk framework as well as the capital allocation<br />
for the individual business areas.
<strong>Deutsche</strong> <strong>Bank</strong> 01 – Management <strong>Report</strong> 55<br />
Financial <strong>Report</strong> 2010 Risk <strong>Report</strong><br />
Risk and Capital Strategy<br />
The risk and capital strategy is developed annually through an integrated process, led by the Legal, Risk &<br />
Capital function together with the group divisions and the Finance function, ensuring Group-wide alignment of<br />
risk and performance targets. The strategy is ultimately presented to, and approved by, the Management Board.<br />
Subsequently, this plan is also presented to, and discussed with, the Risk Committee of the Supervisory Board.<br />
Our risk appetite is set for various parameters and different levels of the Group. Performance against these<br />
targets is monitored regularly and a report on selected important and high-level targets is brought to the direct<br />
attention of the Chief Risk Officer, the Capital and Risk Committee and/or the Management Board. In case of a<br />
significant deviation from the targets, it is the responsibility of the divisional legal, risk & capital units to bring this<br />
to the attention of their superiors and ultimately the Chief Risk Officer if no immediate mitigation or future<br />
mitigation strategy can be achieved on a subordinated level.<br />
Amendments to the risk and capital strategy must be approved by the Chief Risk Officer or the full Management<br />
Board, depending on significance.<br />
At Postbank, similar fundamental principles are in place with Postbank’s Management Board being responsible<br />
for Postbank’s risk profile and risk strategy, and regularly reporting thereon to the Supervisory Board of Postbank.<br />
Starting in 2011, Postbank’s capital demand is reflected in the consolidated Group’s risk and capital strategy.<br />
Categories of Risk<br />
As part of our business activities, we face a variety of risks, the most significant of which are described further<br />
below in dedicated sections, starting with credit risk. These risks can be categorized in a variety of ways. From<br />
a regulatory perspective, we hold regulatory capital against three types of risk: credit risk, market risk and<br />
operational risk. As part of our internal capital adequacy assessment process we calculate the amount of economic<br />
capital that is necessary to cover the risks generated from our business activities. We also calculate and<br />
monitor liquidity risk, which we manage via a separate risk management framework.
<strong>Deutsche</strong> <strong>Bank</strong> 01 – Management <strong>Report</strong> 56<br />
Financial <strong>Report</strong> 2010 Risk <strong>Report</strong><br />
Credit Risk<br />
Credit risk arises from all transactions where actual, contingent or potential claims against any counterparty,<br />
borrower or obligor (which we refer to collectively as “counterparties”) exist, including those claims that we plan<br />
to distribute (see further below in the more detailed credit risk section). These transactions are typically part of<br />
our traditional non-traded lending activities (such as loans and contingent liabilities), or our direct trading activity<br />
with clients (such as OTC derivatives, FX forwards and Forward Rate Agreements) or are related to our positions<br />
in traded credit products (such as bonds). This latter risk, which we call “Traded Default Risk” is managed using<br />
both credit and market risk parameters. We distinguish between three kinds of credit risk:<br />
— Default risk is the risk that counterparties fail to meet contractual payment obligations.<br />
— Country risk is the risk that we may suffer a loss, in any given country, due to any of the following reasons: a<br />
possible deterioration of economic conditions, political and social upheaval, nationalization and expropriation<br />
of assets, government repudiation of indebtedness, exchange controls and disruptive currency depreciation<br />
or devaluation. Country risk includes transfer risk which arises when debtors are unable to meet their obligations<br />
owing to an inability to transfer assets to nonresidents due to direct sovereign intervention.<br />
— Settlement risk is the risk that the settlement or clearance of transactions will fail. It arises whenever the<br />
exchange of cash, securities and/or other assets is not simultaneous.<br />
Market Risk<br />
Market risk arises from the uncertainty concerning changes in market prices and rates (including interest rates,<br />
equity prices, foreign exchange rates and commodity prices), the correlations among them and their levels of<br />
volatility. In our risk management processes we further distinguish market risk into:<br />
— Trading market risk, which arises primarily through the market-making and trading activities in the various<br />
cash and derivative markets.<br />
— Nontrading market risk, which arises from assets and liabilities that are typically on our books for a longer<br />
period of time (i.e. non-consolidated strategic investments, alternative asset investments, sight and saving<br />
deposits, and equity compensation), but where the inherent value is still dependent on the movement of financial<br />
markets and parameters. We include risk from the modeling of the duration of sight and saving deposits<br />
and risk from our <strong>Deutsche</strong> <strong>Bank</strong> Bauspar business in nontrading market risk. In addition, we also<br />
include equivalent risks that Postbank categorizes as business and collective risks, respectively.<br />
Operational Risk<br />
Operational risk is the potential for incurring losses in relation to employees, contractual specifications and<br />
documentation, technology, infrastructure failure and disasters, external influences and customer relationships.<br />
This definition includes legal and regulatory risk, but excludes business and reputational risk.<br />
Liquidity Risk<br />
Liquidity risk is the risk arising from our potential inability to meet all payment obligations when they come due<br />
or only being able to meet these obligations at excessive costs.
<strong>Deutsche</strong> <strong>Bank</strong> 01 – Management <strong>Report</strong> 57<br />
Financial <strong>Report</strong> 2010 Risk <strong>Report</strong><br />
Business Risk<br />
Business risk describes the risk we assume due to potential changes in general business conditions, such as<br />
our market environment, client behavior and technological progress. This can affect our results if we fail to adjust<br />
quickly to these changing conditions.<br />
Beyond the above risks, there are a number of further risks, such as reputational risk, insurance-specific risk<br />
and concentration risk. They are substantially related to one or more of the above risk types.<br />
Reputational Risk<br />
Within our risk management processes, we define reputational risk as the risk that publicity concerning a<br />
transaction, counterparty or business practice involving a client will negatively impact the public’s trust in our<br />
organization.<br />
Several policies and guidelines form the framework of our reputational risk management. The primary responsibility<br />
for the identification, escalation and resolution of reputational risk issues resides with the business divisions.<br />
The risk management units assist and advise the business divisions in ascertaining that reputational risk<br />
issues are appropriately identified, escalated and addressed.<br />
The most senior dedicated body for reputational risk issues is our Group Reputational Risk Committee (GRRC).<br />
It is a permanent sub-committee of the Risk Executive Committee and is chaired by the Chief Risk Officer. The<br />
GRRC reviews and makes final determinations on all reputational risk issues, where escalation of such issues<br />
is deemed necessary by senior business and regional management, or required under other Group policies<br />
and procedures.<br />
Insurance Specific Risk<br />
Our exposure to insurance risk relates to Abbey Life Assurance Company Limited (ALAC) and the defined benefit<br />
pension obligations of <strong>Deutsche</strong> <strong>Bank</strong> Group. In our risk management framework, we consider insurance-related<br />
risks primarily as non-traded market risks. We monitor the underlying assumptions in the calculation of these<br />
risks regularly and seek risk mitigating measures such as reinsurances, if we deem this appropriate. We are<br />
primarily exposed to the following insurance-related risks.<br />
— Longevity risk. The risk of faster or slower than expected improvements in life expectancy on immediate and<br />
deferred annuity products. For risk management purposes, monthly stress testing and economic capital<br />
allocation are carried out for both ALAC and the defined benefit pension obligation as part of our market risk<br />
framework and process. For ALAC, reinsurance is the primary method of mitigation of longevity risk. Mortality<br />
experience investigations and sensitivities of the obligations to changes in longevity are provided by ALAC<br />
and the global scheme actuary TowersWatson on an annual basis.<br />
— Mortality and morbidity risks. The risks of a higher or lower than expected number of death or disability<br />
claims on assurance products and of an occurrence of one or more large claims.<br />
— Expenses risk. The risk that policies cost more or less to administer than expected.<br />
— Persistency risk. The risk of a higher or lower than expected percentage of lapsed policies.
<strong>Deutsche</strong> <strong>Bank</strong> 01 – Management <strong>Report</strong> 58<br />
Financial <strong>Report</strong> 2010 Risk <strong>Report</strong><br />
To the extent that actual experience is less favorable than the underlying assumptions, or it is necessary to<br />
increase provisions due to more onerous assumptions, the amount of capital required in the insurance entities<br />
may increase.<br />
Concentration Risk<br />
Risk Concentrations are not an isolated risk type but are broadly integrated in the management of credit, market,<br />
operational and liquidity risks. Risk concentrations refer to a bank’s loss potential through unbalanced distribution<br />
of dependencies on specific risk drivers. Risk concentrations are encountered within and across counterparties,<br />
regions/countries, industries and products, impacting the aforementioned risks. Risk concentrations are actively<br />
managed, for instance by entering into offsetting or risk-reducing transactions. Management of risk concentration<br />
across risk types involves expert panels, qualitative assessments, quantitative instruments (such as economic<br />
capital and stress testing) and comprehensive reporting.<br />
Risk Management Tools<br />
We use a comprehensive range of quantitative tools and metrics for monitoring and managing risks. As a matter<br />
of policy, we continually assess the appropriateness and the reliability of our quantitative tools and metrics in<br />
light of our changing risk environment. Some of these tools are common to a number of risk categories, while<br />
others are tailored to the particular features of specific risk categories. The following are the most important<br />
quantitative tools and metrics we currently use to measure, manage and report our risk:<br />
— Economic capital. Economic capital measures the amount of capital we need to absorb very severe unexpected<br />
losses arising from our exposures. “Very severe” in this context means that economic capital is set at<br />
a level to cover with a probability of 99.98 % the aggregated unexpected losses within one year. We calculate<br />
economic capital for the default risk, transfer risk and settlement risk elements of credit risk, for market risk<br />
including traded default risk, for operational risk and for general business risk. We continuously review and<br />
enhance our economic capital model as appropriate. Notably during the course of 2009 and 2010 we revised<br />
the correlation model underlying our credit risk portfolio model to align it more closely with observable default<br />
correlations. In addition, the model is now capable of deriving our loss potential for multiple time steps, which<br />
is expected to enable it to also determine the regulatory Incremental Risk Charge going forward. Within our<br />
economic capital framework we capture the effects of rating migration as well as profits and losses due to<br />
fair value accounting. We use economic capital to show an aggregated view of our risk position from individual<br />
business lines up to our consolidated Group level. We also use economic capital (as well as goodwill and<br />
unamortized other intangible assets) in order to allocate our book capital among our businesses. This enables<br />
us to assess each business unit’s risk-adjusted profitability, which is a key metric in managing our financial<br />
resources. In addition, we consider economic capital, in particular for credit risk, when we measure the riskadjusted<br />
profitability of our client relationships. For consolidation purposes Postbank economic capital has<br />
been calculated on a basis consistent with <strong>Deutsche</strong> <strong>Bank</strong> methodology, however, limitations in data availability<br />
may lead to portfolio effects that are not fully estimated and thereby resulting in over or under estimation.<br />
See “Overall Risk Position” below for a quantitative summary of our economic capital usage.
<strong>Deutsche</strong> <strong>Bank</strong> 01 – Management <strong>Report</strong> 59<br />
Financial <strong>Report</strong> 2010 Risk <strong>Report</strong><br />
Following a similar concept, Postbank also quantifies its capital demand arising from severe unexpected<br />
losses, referring to it as “risk capital”. In doing so, Postbank uses uniform parameters to measure individual<br />
risks that have been classified as material. These parameters are oriented on the value-at-risk approach,<br />
using the loss (less the expected gain or loss) that will not be exceeded for a 99.93 % level of probability<br />
within the given holding period which is usually one year but for market risk set at 90 days.<br />
— Expected loss. We use expected loss as a measure of our credit and operational risk. Expected loss is a<br />
measurement of the loss we can expect within a one-year period from these risks as of the respective reporting<br />
date, based on our historical loss experience. When calculating expected loss for credit risk, we take<br />
into account credit risk ratings, collateral, maturities and statistical averaging procedures to reflect the risk<br />
characteristics of our different types of exposures and facilities. All parameter assumptions are based on<br />
statistical averages of up to seven years based on our internal default and loss history as well as external<br />
benchmarks. We use expected loss as a tool of our risk management process and as part of our management<br />
reporting systems. We also consider the applicable results of the expected loss calculations as a component<br />
of our collectively assessed allowance for credit losses included in our financial statements. For<br />
operational risk we determine the expected loss from statistical averages of our internal loss history, recent<br />
risk trends as well as forward looking expert estimates.<br />
— Value-at-Risk. We use the value-at-risk approach to derive quantitative measures for our trading book market<br />
risks under normal market conditions. Our value-at-risk figures play a role in both internal and external<br />
(regulatory) reporting. For a given portfolio, value-at-risk measures the potential future loss (in terms of<br />
market value) that, under normal market conditions, will not be exceeded with a defined confidence level in<br />
a defined period. The value-at-risk for a total portfolio represents a measure of our diversified market risk<br />
(aggregated, using pre-determined correlations) in that portfolio.<br />
At Postbank, the value-at-risk approach is used for both the trading book and the banking book. Postbank<br />
has laid down the material foundation to apply the internal market risk model used to measure and manage<br />
market risk in order to determine the capital requirements for market risk in accordance with the German<br />
Regulation on Solvency (“SolvV”) subsequent to regulatory approval.
<strong>Deutsche</strong> <strong>Bank</strong> 01 – Management <strong>Report</strong> 60<br />
Financial <strong>Report</strong> 2010 Risk <strong>Report</strong><br />
— Stress testing. We supplement our analysis of credit, market, operational and liquidity risk with stress testing.<br />
For credit risk management purposes, we perform stress tests to assess the impact of changes in general<br />
economic conditions or specific parameters on our credit exposures or parts thereof as well as the impact<br />
on the creditworthiness of our portfolio. For market risk management purposes, we perform stress tests because<br />
value-at-risk calculations are based on relatively recent historical data, only purport to estimate risk<br />
up to a defined confidence level and assume good asset liquidity. Therefore, they only reflect possible losses<br />
under relatively normal market conditions. Stress tests help us determine the effects of potentially extreme<br />
market developments on the value of our market risk sensitive exposures, both on our highly liquid and less<br />
liquid trading positions as well as our investments. The correlations between market risk factors used in our<br />
current stress tests are estimated from volatile market conditions in the past using an algorithm, and the<br />
estimated correlations proved to be essentially consistent with those observed during recent periods of market<br />
stress. We use stress testing to determine the amount of economic capital we need to allocate to cover our<br />
market risk exposure under the scenarios of extreme market conditions we select for our simulations. For<br />
operational risk management purposes, we perform stress tests on our economic capital model to assess its<br />
sensitivity to changes in key model components, which include external losses. For liquidity risk management<br />
purposes, we perform stress tests and scenario analysis to evaluate the impact of sudden stress events on<br />
our liquidity position. In 2010, we completed the implementation of our group wide stress testing framework<br />
across the different risk types, which also comprise reverse stress tests, i.e. an analysis that develops a<br />
scenario which makes the business model unviable.<br />
At Postbank all material and actively managed risk categories (credit, market, liquidity and operational risks)<br />
are subject to defined stress tests.<br />
— Regulatory risk assessment. German banking regulators assess our capacity to assume risk in several<br />
ways, which are described in more detail in Note 36 “Regulatory Capital” of the consolidated financial<br />
statements.<br />
Credit Risk<br />
We measure and manage our credit risk following the below philosophy and principles:<br />
— The key principle of credit risk management is client due diligence, which is aligned with our country and<br />
industry portfolio strategies. Prudent client selection is achieved in collaboration with our business line counterparts<br />
as a first line of defense. In all our group divisions consistent standards are applied in the respective<br />
credit decision processes.<br />
— We actively aim to prevent undue concentration and long tail-risks (large unexpected losses) by ensuring a<br />
diversified and marketable credit portfolio, effectively protecting the bank’s capital in all market conditions.<br />
Client, industry, country and product-specific concentrations are actively assessed and managed against<br />
our risk appetite.
<strong>Deutsche</strong> <strong>Bank</strong> 01 – Management <strong>Report</strong> 61<br />
Financial <strong>Report</strong> 2010 Risk <strong>Report</strong><br />
— We aim to avoid large directional credit risk on a counterparty and portfolio level by applying stringent<br />
underwriting standards combined with a pro-active hedging and distribution model and collateralization of<br />
our hold portfolio where feasible.<br />
— We are selective in taking outright cash risk positions unless secured, guaranteed and/or adequately hedged.<br />
Exceptions to this general principle are lower risk, short-term transactions and facilities supporting specific<br />
trade finance requests as well as low risk businesses where the margin allows for adequate loss coverage.<br />
— We aim to secure our derivative portfolio through collateral agreements and may additionally hedge concentration<br />
risks to further mitigate credit risks from underlying market movements.<br />
— Every extension of credit or material change to a credit facility (such as its tenor, collateral structure or major<br />
covenants) to any counterparty requires credit approval at the appropriate authority level. We assign credit<br />
approval authorities to individuals according to their qualifications, experience and training, and we review<br />
these periodically.<br />
— We measure and consolidate all our credit exposures to each obligor on a global basis that applies across<br />
our consolidated Group, in line with regulatory requirements of the German <strong>Bank</strong>ing Act (Kreditwesengesetz).<br />
Postbank has comparable uniform standards in place.<br />
Credit Risk Ratings<br />
A basic and key element of the credit approval process is a detailed risk assessment of each credit-relevant<br />
counterparty. When rating a counterparty we apply in-house assessment methodologies, scorecards and our<br />
26-grade rating scale for evaluating the credit-worthiness of our counterparties. The majority of our rating methodologies<br />
are authorized for use within the Advanced Internal Rating Based Approach under Basel II rules.<br />
Our rating scale enables us to compare our internal ratings with common market practice and ensures comparability<br />
between different sub-portfolios of our institution. Several default ratings therein enable us to incorporate<br />
the potential recovery rate of unsecured defaulted counterparty exposures. We generally rate our counterparties<br />
individually, though certain portfolios of securitized receivables are rated on a pool basis.<br />
In our retail business, creditworthiness checks and counterparty ratings of the homogenous portfolio are derived<br />
by utilizing an automated decision engine. The decision engine incorporates quantitative aspects (e.g. financial<br />
figures), behavioral aspects, credit bureau information (such as SCHUFA in Germany) and general customer<br />
data. These input factors are used by the decision engine to determine the creditworthiness of the borrower<br />
and, after consideration of collateral evaluation, the expected loss as well as the further course of action required<br />
to process the ultimate credit decision. The established rating procedures we have implemented in our retail<br />
business are based on multivariate statistical methods and are used to support our individual credit decisions<br />
for this portfolio as well as managing the overall retail portfolio.<br />
The algorithms of the rating procedures for all counterparties are recalibrated frequently on the basis of the<br />
default history as well as other external and internal factors and expert judgments.<br />
Postbank makes use of internal rating systems authorized for use within the Foundation Internal Rating Based<br />
Approach under Basel II. Similar to us all internal ratings and scorings are based on a uniform master scale,<br />
which assigns each rating or scoring result to the default probability determined for that class.
<strong>Deutsche</strong> <strong>Bank</strong> 01 – Management <strong>Report</strong> 62<br />
Financial <strong>Report</strong> 2010 Risk <strong>Report</strong><br />
Credit Limits and Approval<br />
Credit limits set forth maximum credit exposures we are willing to assume over specified periods. In determining<br />
the credit limit for a counterparty we consider the counterparty’s credit quality by reference to its internal<br />
credit rating. Credit limits are established by the Credit Risk Management function via the execution of assigned<br />
credit authorities. Credit authority is generally assigned to individuals as personal credit authority according to<br />
the individual’s professional qualification and experience. All assigned credit authorities are reviewed on a<br />
periodic basis to ensure that they are adequate to the individual performance of the authority holder. The results<br />
of the review are presented to the Group Credit Policy Committee and reported to the Risk Executive Committee.<br />
Where an individual’s personal authority is insufficient to establish required credit limits, the transaction is referred<br />
to a higher credit authority holder or where necessary to an appropriate credit committee such as the CRM<br />
Underwriting Committee. Where personal and committee authorities are insufficient to establish appropriate<br />
limits the case is referred to the Management Board for approval.<br />
At Postbank comparable credit limit standards are in place.
<strong>Deutsche</strong> <strong>Bank</strong> 01 – Management <strong>Report</strong> 63<br />
Financial <strong>Report</strong> 2010 Risk <strong>Report</strong><br />
Credit Risk Mitigation<br />
In addition to determining counterparty credit quality and our risk appetite, we also use various credit risk mitigation<br />
techniques to optimize credit exposure and reduce potential credit losses. Credit risk mitigants, described<br />
more fully below, are applied in the following forms:<br />
— Collateral held as security to reduce losses by increasing the recovery of obligations.<br />
— Risk transfers, which shift the probability of default risk of an obligor to a third party including hedging executed<br />
by our Loan Exposure Management Group.<br />
— Netting and collateral arrangements which reduce the credit exposure from derivatives and repo- and repostyle<br />
transactions.<br />
Collateral Held as Security for Loans<br />
We regularly agree on collateral to be received from or to be provided to customers in contracts that are subject<br />
to credit risk. We also regularly agree on collateral to be received from borrowers in our lending contracts.<br />
Collateral is security in the form of an asset or third-party obligation that serves to mitigate the inherent risk of<br />
credit loss in an exposure, by either substituting the borrower default risk or improving recoveries in the event<br />
of a default. While collateral can be an alternative source of repayment, it does not replace the necessity of<br />
high quality underwriting standards.<br />
We segregate collateral received into the following two types:<br />
— Financial and other collateral, which enables us to recover all or part of the outstanding exposure by liquidating<br />
the collateral asset provided, in cases where the borrower is unable or unwilling to fulfill its primary<br />
obligations. Cash collateral, securities (equity, bonds), collateral assignments of other claims or inventory,<br />
equipment (e.g., plant, machinery, aircraft) and real estate typically fall into this category.<br />
— Guarantee collateral, which complements the borrower’s ability to fulfill its obligation under the legal contract<br />
and as such is provided by third parties. Letters of Credit, insurance contracts, export credit insurance,<br />
guarantees and risk participations typically fall into this category.<br />
Risk Transfers<br />
Risk transfers to third parties form a key part of our overall risk management process and are executed in<br />
various forms, including outright sales, single name and portfolio hedging, and securitizations. Risk transfers<br />
are conducted by the respective business units and by our Loan Exposure Management Group (“LEMG”), in<br />
accordance with specifically approved mandates.<br />
LEMG focuses on managing the residual credit risk of loans and lending-related commitments of the international<br />
investment-grade portfolio and the medium-sized German companies’ portfolio within our Corporate &<br />
Investment <strong>Bank</strong> Group Division.<br />
Acting as a central pricing reference, LEMG provides the respective Corporate & Investment <strong>Bank</strong> Group Division<br />
businesses with an observed or derived capital market rate for loan applications; however, the decision of whether<br />
or not the business can enter into the credit risk remains exclusively with Credit Risk Management.
<strong>Deutsche</strong> <strong>Bank</strong> 01 – Management <strong>Report</strong> 64<br />
Financial <strong>Report</strong> 2010 Risk <strong>Report</strong><br />
LEMG is concentrating on two primary initiatives within the credit risk framework to further enhance risk management<br />
discipline, improve returns and use capital more efficiently:<br />
— to reduce single-name and industry credit risk concentrations within the credit portfolio and<br />
— to manage credit exposures actively by utilizing techniques including loan sales, securitization via collateralized<br />
loan obligations, default insurance coverage and single-name and portfolio credit default swaps.<br />
Netting and Collateral Arrangements for Derivatives<br />
In order to reduce the credit risk resulting from OTC derivative transactions, where OTC clearing is not available,<br />
we regularly seek the execution of standard master agreements (such as master agreements for derivatives<br />
published by the International Swaps and Derivatives Association, Inc. (ISDA) or the German Master Agreement<br />
for Financial Derivative Transactions) with our clients. A master agreement allows the netting of rights and<br />
obligations arising under derivative transactions that have been entered into under such master agreement<br />
upon the counterparty’s default, resulting in a single net claim owed by or to the counterparty (“close-out netting”).<br />
For parts of the derivatives business (e.g., foreign exchange transactions) we also enter into master agreements<br />
under which we set off amounts payable on the same day in the same currency and in respect to transactions<br />
covered by such master agreements (“payment netting”), reducing our settlement risk. In our risk measurement<br />
and risk assessment processes we apply netting only to the extent we have satisfied ourselves of the legal validity<br />
and enforceability of the master agreement in all relevant jurisdictions.<br />
Also, we enter into credit support annexes (“CSA”) to master agreements in order to further reduce our derivatives-related<br />
credit risk. These annexes generally provide risk mitigation through periodic, usually daily, margining<br />
of the covered exposure. The CSAs also provide for the right to terminate the related derivative transactions<br />
upon the counterparty’s failure to honor a margin call. As with netting, when we believe the annex is enforceable,<br />
we reflect this in our exposure measurement.<br />
Certain CSAs to master agreements provide for rating dependent triggers, where additional collateral must be<br />
pledged if a party’s rating is downgraded. We also enter into master agreements that provide for an additional<br />
termination event upon a party’s rating downgrade. We analyze and monitor potential contingent payment<br />
obligations resulting from a rating downgrade in our stress testing approach for liquidity risk on an ongoing<br />
basis.<br />
In order to reduce the credit risk resulting from OTC derivative transactions, Postbank regularly seeks the execution<br />
of standard master agreements (such as the German Master Agreement for Financial Derivative<br />
Transactions). Postbank applies netting only to the extent it has satisfied itself of the legal validity and enforceability<br />
of the master agreement in all relevant jurisdictions. In order to further reduce its derivatives-related<br />
credit risk, Postbank has entered into CSAs to master agreements with most of the key counterparties in its<br />
financial markets portfolio. As with netting, when Postbank believes the annex is enforceable, it reflects this in<br />
its capital requirements.
<strong>Deutsche</strong> <strong>Bank</strong> 01 – Management <strong>Report</strong> 65<br />
Financial <strong>Report</strong> 2010 Risk <strong>Report</strong><br />
For purposes of calculating the regulatory requirements for its derivatives exposures Postbank uses the current<br />
exposure method, i.e. calculates its exposure at default as the sum of the positive fair value of its derivatives<br />
transactions and the regulatory add-ons.<br />
In singular cases, Postbank agreed to clauses in its CSAs to the master agreements which require it to increase<br />
its collateral upon the event of an external rating downgrade for Postbank. The rating downgrade by Moody’s<br />
(from Aa3 to A1) in the first half of 2010 had, however, no direct effect on the amount of collateral to be provided<br />
and therefore did not impact Postbank’s risk-bearing capacity.<br />
Monitoring Credit Risk<br />
Ongoing active monitoring and management of credit risk positions is an integral part of our credit risk management<br />
activities. Monitoring tasks are primarily performed by the divisional risk units in close cooperation<br />
with our portfolio management function.<br />
Credit counterparties are allocated to credit officers within specified divisional risk units which are aligned to<br />
types of counterparty (such as Financial Institution or Corporate). The individual credit officers within these<br />
divisional risk units have the relevant expertise and experience to manage the credit risks associated with<br />
these counterparties and their associated credit related transactions. It is the responsibility of each credit officer<br />
to undertake ongoing credit monitoring for their allocated portfolio of counterparties. We also have procedures<br />
in place intended to identify at an early stage credit exposures for which there may be an increased risk of loss.<br />
In instances where we have identified counterparties where problems might arise, the respective exposure is<br />
generally placed on a watchlist. We aim to identify counterparties that, on the basis of the application of our risk<br />
management tools, demonstrate the likelihood of problems well in advance in order to effectively manage the<br />
credit exposure and maximize the recovery. The objective of this early warning system is to address potential<br />
problems while adequate options for action are still available. This early risk detection is a tenet of our credit<br />
culture and is intended to ensure that greater attention is paid to such exposures.<br />
At Postbank largely similar processes are in place.<br />
A key focus of our credit risk management approach is to avoid any undue concentrations in our portfolio.<br />
Significant concentrations of credit risk could be derived from having material exposures to a number of counterparties<br />
with similar economic characteristics, or who are engaged in comparable activities, where these<br />
similarities may cause their ability to meet contractual obligations to be affected in the same manner by changes<br />
in economic or industry conditions. A concentration of credit risk may also exist at an individual counterparty<br />
level. Our portfolio management framework provides a direct measure of concentrations within our credit risk<br />
portfolio.<br />
Managing industry and, country risk are key components of our overall concentration risk management approach<br />
for non-Postbank portfolios. Settlement risk is also considered as part of our overall credit risk management<br />
activities.
<strong>Deutsche</strong> <strong>Bank</strong> 01 – Management <strong>Report</strong> 66<br />
Financial <strong>Report</strong> 2010 Risk <strong>Report</strong><br />
In 2010 Postbank enhanced the management of concentrations in the credit area by systematically identifying<br />
credit concentration on the level of a single counterparty as well as on a sectoral level (e.g. industry sector,<br />
regions, collateral types).<br />
Industry Risk Management<br />
To manage industry risk, we have grouped our Corporate and Financial Institutions counterparties into various<br />
industry sub-portfolios. For each of these sub-portfolios an “Industry Batch report” is prepared usually on an<br />
annual basis. This report highlights industry developments and risks to our credit portfolio, reviews concentration<br />
risks and incorporates an economic downside stress test. This analysis is used to define strategies for both<br />
our industry portfolio, and individual counterparties within the portfolio based on their risk/reward profile and<br />
potential.<br />
The Industry Batch reports are presented to the Group Credit Policy Committee, a sub-committee of the Risk<br />
Executive Committee and are submitted afterwards to the Management Board. In accordance with an agreed<br />
schedule, a select number of Industry Batch reports are also submitted to the Risk Committee of the Supervisory<br />
Board. In addition to these Industry Batch reports, the development of the industry sub-portfolios is constantly<br />
monitored during the year and is compared to the approved sub-portfolio strategies. Regular overviews<br />
are prepared for the Group Credit Policy Committee to discuss recent developments and to take action if<br />
necessary.<br />
Country Risk Management<br />
Avoiding undue concentrations also from a regional perspective is an integral part of our credit risk management<br />
framework. We manage country risk through a number of risk measures and limits, the most important<br />
being:<br />
— Total counterparty exposure. All credit extended and OTC derivatives exposure to counterparties domiciled<br />
in a given country that we view as being at risk due to economic or political events (“country risk event”). It<br />
includes nonguaranteed subsidiaries of foreign entities and offshore subsidiaries of local clients.<br />
— Transfer risk exposure. Credit risk arising where an otherwise solvent and willing debtor is unable to meet its<br />
obligations due to the imposition of governmental or regulatory controls restricting its ability either to obtain<br />
foreign exchange or to transfer assets to nonresidents (a “transfer risk event”). It includes all of our credit extended<br />
and OTC derivatives exposure from one of our offices in one country to a counterparty in a different<br />
country.<br />
— Highly-stressed event risk scenarios. We use stress testing to measure potential risks on our trading positions<br />
and view these as market risk.
<strong>Deutsche</strong> <strong>Bank</strong> 01 – Management <strong>Report</strong> 67<br />
Financial <strong>Report</strong> 2010 Risk <strong>Report</strong><br />
Our country risk ratings represent a key tool in our management of country risk. They are established by an<br />
independent country risk research function within our Credit Risk Management function and include:<br />
— Sovereign rating. A measure of the probability of the sovereign defaulting on its foreign or local currency<br />
obligations.<br />
— Transfer risk rating. A measure of the probability of a “transfer risk event.”<br />
— Event risk rating. A measure of the probability of major disruptions in the market risk factors relating to a<br />
country.<br />
All sovereign and transfer risk ratings are reviewed, at least annually, by the Group Credit Policy Committee, a<br />
sub-committee of our Risk Executive Committee. Our country risk research group also reviews, at least quarterly,<br />
our ratings for the major Emerging Markets countries. Ratings for countries that we view as particularly volatile,<br />
as well as all event risk ratings, are subject to continuous review.<br />
We also regularly compare our internal risk ratings with the ratings of the major international rating agencies.<br />
Country Risk limits are reviewed at least annually, in conjunction with the review of country risk ratings. Country<br />
Risk limits are set by either our Management Board or by our Cross Risk Review Committee, a sub-committee<br />
of our Risk Executive Committee pursuant to delegated authority.<br />
We charge our group divisions with the responsibility of managing their country risk within the approved limits.<br />
The regional units within Credit Risk Management monitor our country risk based on information provided by<br />
our finance function. Our Group Credit Policy Committee also reviews data on transfer risk.<br />
Important elements of the country risk management at Postbank are country risk ratings and country risk limits.<br />
Ratings are reviewed and adjusted if required by means of a rating tool on a monthly basis. Country risk limits<br />
and sovereign risk limits for all relevant countries are approved by the Management Board annually. Loans are<br />
charged to the limits with their gross nominal amounts and allocated to individual countries based on the country<br />
of domicile of the borrower.<br />
Settlement Risk Management<br />
Our trading activities may give rise to risk at the time of settlement of those trades. Settlement risk is the risk of<br />
loss due to the failure of a counterparty to honor its obligations to deliver cash, securities or other assets as<br />
contractually agreed.<br />
For many types of transactions, we mitigate settlement risk by closing the transaction through a clearing agent,<br />
which effectively acts as a stakeholder for both parties, only settling the trade once both parties have fulfilled<br />
their sides of the bargain.
<strong>Deutsche</strong> <strong>Bank</strong> 01 – Management <strong>Report</strong> 68<br />
Financial <strong>Report</strong> 2010 Risk <strong>Report</strong><br />
Where no such settlement system exists, the simultaneous commencement of the payment and the delivery<br />
parts of the transaction is common practice between trading partners (free settlement). In these cases, we may<br />
seek to mitigate our settlement risk through the execution of bilateral payment netting agreements. We are also<br />
participant in industry initiatives to reduce settlement risks. Acceptance of settlement risk on free settlement<br />
trades requires approval from our credit risk personnel, either in the form of pre-approved settlement risk limits,<br />
or through transaction-specific approvals. We do not aggregate settlement risk limits with other credit exposures<br />
for credit approval purposes, but we take the aggregate exposure into account when we consider whether a given<br />
settlement risk would be acceptable.<br />
Credit Risk Tools – Economic Capital for Credit Risk<br />
We calculate economic capital for the default risk, country risk and settlement risk as elements of credit risk. In<br />
line with our economic capital framework, economic capital for credit risk is set at a level to absorb with a<br />
probability of 99.98 % very severe aggregate unexpected losses within one year. For December 31, 2010,<br />
we included Postbank in our calculation of economic capital usage, which has been calculated on a basis consistent<br />
with <strong>Deutsche</strong> <strong>Bank</strong> methodology. Limitations in data availability, however, may result in portfolio effects<br />
that are not fully estimated and thereby resulting in over- or underestimation.<br />
Our economic capital for credit risk is derived from the loss distribution of a portfolio via Monte Carlo Simulation<br />
of correlated rating migrations. The loss distribution is modeled in two steps. First, individual credit exposures<br />
are specified based on parameters for the probability of default, exposure at default and loss given default. In a<br />
second step, the probability of joint defaults is modeled through the introduction of economic factors, which<br />
correspond to geographic regions and industries. The simulation of portfolio losses is then performed by an<br />
internally developed model, which takes rating migration and maturity effects into account. Effects due to<br />
wrong-way derivatives risk (i.e., the credit exposure of a derivative in the default case is higher than in non<br />
default scenarios) are modeled after the fact by applying our own alpha factor determined for our use of the<br />
Basel II Internal Models Method. We allocate expected losses and economic capital derived from loss distributions<br />
down to transaction level to enable management on transaction, customer and business level.<br />
Employing a similar approach, Postbank calculates a credit value-at-risk (“CVaR”) at 99.93 % confidence over<br />
a one year time horizon for all Postbank exposures subject to credit risk.<br />
Credit Exposures<br />
Counterparty credit exposure arises from our traditional non-trading lending activities which include elements<br />
such as loans and contingent liabilities. Counterparty credit exposure also arises via our direct trading activity<br />
with clients in certain instruments which include OTC derivatives, FX forwards and Forward Rate Agreements.<br />
A default risk also arises from our positions in traded credit products such as bonds.<br />
We define our credit exposure by taking into account all transactions where losses might occur due to the fact<br />
that counterparties may not fulfill their contractual payment obligations.
<strong>Deutsche</strong> <strong>Bank</strong> 01 – Management <strong>Report</strong> 69<br />
Financial <strong>Report</strong> 2010 Risk <strong>Report</strong><br />
Maximum Exposure to Credit Risk<br />
The following table presents our maximum exposure to credit risk without taking account of any collateral held<br />
or other credit enhancements that do not qualify for offset in our financial statements.<br />
in € m. 1 Dec 31, 2010 Dec 31, 2009<br />
Due from banks 17,157 9,346<br />
Interest-earning deposits with banks 92,377 47,233<br />
Central bank funds sold and securities purchased under resale agreements 20,365 6,820<br />
Securities borrowed 28,916 43,509<br />
Financial assets at fair value through profit or loss 2 1,026,494 900,800<br />
Financial assets available for sale 2 48,587 14,852<br />
Loans 3 411,025 261,448<br />
Other assets subject to credit risk 61,441 52,457<br />
Financial guarantees and other credit related contingent liabilities 4 68,055 52,183<br />
Irrevocable lending commitments and other credit related commitments 4 123,881 104,125<br />
Maximum exposure to credit risk 1,898,297 1,492,773<br />
1 All amounts at carrying value unless otherwise indicated.<br />
2 Excludes equities, other equity interests and commodities.<br />
3 Gross loans less (deferred expense)/unearned income before deductions of allowance for loan losses.<br />
4 Financial guarantees, other credit related contingent liabilities and irrevocable lending commitments (including commitments designated under the fair value option)<br />
are reflected at notional amounts.<br />
Included in the category of financial assets at fair value through profit or loss as of December 31, 2010, were<br />
€ 109 billion of securities purchased under resale agreements and € 28 billion of securities borrowed, both with<br />
limited net credit risk as a result of very high levels of collateral, as well as debt securities of € 171 billion that<br />
are over 83 % investment grade. The above mentioned financial assets available for sale category primarily<br />
reflected debt securities of which more than 83 % were investment grade.<br />
The increase in maximum exposure to credit risk for December 31, 2010 was predominantly driven by acquisitions,<br />
which accounted for € 235 billion exposure as of December 31, 2010, thereof € 211 billion relating to<br />
Postbank. A significant proportion of Postbank’s contribution was reflected in the loans category.<br />
Excluding acquisitions, the maximum exposure to credit risk increased by € 171 billion largely within the interest<br />
earning deposits with banks, and financial assets at fair value through profit and loss categories.<br />
In the tables below, we show details about several of our main credit exposure categories, namely loans,<br />
irrevocable lending commitments, contingent liabilities and over-the-counter (“OTC”) derivatives:<br />
— “Loans” are net loans as reported on our balance sheet at amortized cost but before deduction of our allowance<br />
for loan losses.<br />
— “Irrevocable lending commitments” consist of the undrawn portion of irrevocable lending-related commitments.<br />
— “Contingent liabilities” consist of financial and performance guarantees, standby letters of credit and indemnity<br />
agreements.<br />
— “OTC derivatives” are our credit exposures from over-the-counter derivative transactions that we have<br />
entered into, after netting and cash collateral received. On our balance sheet, these are included in trading<br />
assets or, for derivatives qualifying for hedge accounting, in other assets, in either case, before netting and<br />
cash collateral received.
<strong>Deutsche</strong> <strong>Bank</strong> 01 – Management <strong>Report</strong> 70<br />
Financial <strong>Report</strong> 2010 Risk <strong>Report</strong><br />
The following table breaks down several of our main credit exposure categories by geographical region. For<br />
this table, we have allocated exposures to regions based on the country of domicile of our counterparties,<br />
irrespective of any affiliations the counterparties may have with corporate groups domiciled elsewhere.<br />
Credit risk profile<br />
by region Loans 1<br />
in € m.<br />
Dec 31,<br />
2010<br />
Dec 31,<br />
2009<br />
Dec 31,<br />
2010<br />
Irrevocable lending<br />
commitments 2<br />
Dec 31,<br />
2009<br />
Contingent liabilities OTC derivatives 3 Total<br />
Germany 207,129 105,297 24,273 14,112 15,758 12,126 3,018 3,455 250,178 134,990<br />
Western Europe<br />
(excluding Germany) 110,930 81,954 30,239 27,006 18,019 13,128 22,213 21,081 181,401 143,169<br />
Eastern Europe 8,103 6,986 1,844 1,306 1,319 1,428 836 690 12,102 10,410<br />
North America 54,887 45,717 59,506 55,337 22,063 17,018 26,765 30,805 163,221 148,877<br />
Central and South<br />
America 4,121 3,325 575 214 1,427 777 1,792 831 7,915 5,147<br />
Asia/Pacific 23,562 16,921 6,651 5,793 8,532 7,086 7,247 7,060 45,992 36,860<br />
Africa 961 947 419 233 911 620 421 458 2,712 2,258<br />
Other 4 1,332 301 373 124 27 – 13 160 1,745 585<br />
Total 411,025 261,448 123,880 104,125 68,056 52,183 62,305 64,540 665,266 482,296<br />
Dec 31,<br />
2010<br />
Dec 31,<br />
2009<br />
Dec 31,<br />
2010<br />
Dec 31,<br />
2009<br />
1 Includes impaired loans amounting to € 6.3 billion as of December 31, 2010 and € 7.2 billion as of December 31, 2009.<br />
2 Includes irrevocable lending commitments related to consumer credit exposure of € 4.5 billion as of December 31, 2010 and € 2.9 billion as of December 31, 2009.<br />
3 Includes the effect of netting agreements and cash collateral received where applicable.<br />
4 Includes supranational organizations and other exposures that we have not allocated to a single region.<br />
Our largest concentrations of credit risk within loans from a regional perspective were in Western Europe and<br />
North America, with a significant share in households. The concentration in Western Europe was principally in<br />
our home market Germany, which includes most of our mortgage lending business. Within the OTC derivatives<br />
business our largest concentrations were also in Western Europe and North America, with a significant share<br />
in highly rated banks and insurance companies for which we consider the credit risk to be limited.<br />
The increase in loans at the end of 2010 was predominantly due to the first time inclusion of Postbank. Postbanks<br />
total contribution to our loan exposure at December 31, 2010, was € 129 billion, with the vast majority being<br />
concentrated in the German region (€ 103 billion).<br />
As of December 31, 2010, credit risk concentrations at Postbank can be recognized with respect to highly rated<br />
banks as well as in the structured credit portfolio.<br />
The following table provides an overview of our net sovereign credit risk exposure to certain European Countries.<br />
Net sovereign exposure<br />
in € m. Dec 31, 2010<br />
Portugal (12)<br />
Ireland 237<br />
Italy 8,011<br />
Greece 1,601<br />
Spain 2,283<br />
Total 12,120<br />
Dec 31,<br />
2010<br />
Dec 31,<br />
2009
<strong>Deutsche</strong> <strong>Bank</strong> 01 – Management <strong>Report</strong> 71<br />
Financial <strong>Report</strong> 2010 Risk <strong>Report</strong><br />
The above shown figures reflect a net “accounting view” of our sovereign exposure insofar as they are based<br />
on gross IFRS exposures with further adjustments, such as with respect to netting and underlying risk, to arrive<br />
at a net exposure view. Out of our total net sovereign credit risk exposure of € 12.1 billion to Portugal, Ireland,<br />
Italy, Greece and Spain, € 6.9 billion was due to the consolidation of Postbank. Both, we and Postbank closely<br />
monitor these exposures.<br />
The following table breaks down several of our main credit exposure categories according to the industry sectors<br />
of our counterparties.<br />
Credit risk profile<br />
by industry sector Loans 1<br />
in € m.<br />
Dec 31,<br />
2010<br />
Dec 31,<br />
2009<br />
Dec 31,<br />
2010<br />
Irrevocable lending<br />
commitments 2<br />
Dec 31,<br />
2009<br />
Contingent liabilities OTC derivatives 3 Total<br />
<strong>Bank</strong>s and insurance 38,798 22,002 22,241 25,289 17,801 11,315 32,315 27,948 111,155 86,554<br />
Fund management<br />
activities 27,964 26,462 6,435 11,135 2,392 540 9,318 12,922 46,109 51,059<br />
Manufacturing 20,748 17,314 31,560 24,814 18,793 16,809 3,270 2,169 74,371 61,106<br />
Wholesale and retail<br />
trade 13,637 10,938 7,369 6,027 5,022 3,443 517 604 26,545 21,012<br />
Households 167,352 85,675 9,573 4,278 2,537 1,820 842 801 180,304 92,574<br />
Commercial real estate<br />
activities 44,119 28,959 3,210 1,876 2,196 2,194 1,577 1,286 51,102 34,315<br />
Public sector 24,113 9,572 858 520 57 19 6,510 5,527 31,538 15,638<br />
Other 4 74,294 60,526 42,634 30,186 19,258 16,043 7,956 13,283 144,142 120,038<br />
Total 411,025 261,448 123,880 104,125 68,056 52,183 62,305 64,540 665,266 482,296<br />
Dec 31,<br />
2010<br />
Dec 31,<br />
2009<br />
Dec 31,<br />
2010<br />
Dec 31,<br />
2009<br />
1 Includes impaired loans amounting to € 6.3 billion as of December 31, 2010 and € 7.2 billion as of December 31, 2009.<br />
2 Includes irrevocable lending commitments related to consumer credit exposure of € 4.5 billion as of December 31, 2010 and € 2.9 billion as of December 31, 2009.<br />
3 Includes the effect of netting agreements and cash collateral received where applicable.<br />
4 Loan exposures for Other include lease financing.<br />
During 2010 our credit risk profile composition by industry sector remained largely unchanged with the exception<br />
of effects from consolidation of Postbank. These effects included € 75 billion in household loans, € 21 billion<br />
in loans to banks and insurance companies, € 15 billion in commercial real estate loans as well as € 8 billion<br />
in loans to the public sector.<br />
Our loans, irrevocable lending commitments, contingent liabilities and OTC derivatives-related credit exposure<br />
to our ten largest counterparties accounted for 5 % of our aggregated total credit exposure in these categories<br />
as of December 31, 2010 compared to 7 % as of December 31, 2009. Our top ten counterparty exposures were<br />
by majority with well-rated counterparties or relate to structured trades which show high levels of risk mitigation,<br />
with the exception of one leveraged finance exposure.<br />
Credit Exposure from Lending<br />
Certain types of loans have a higher risk of non-collection than others. In our amortized cost loan portfolio we<br />
therefore differentiate loans by certain categories on the basis of relevant criteria including their loss expectation<br />
through the cycle, stability of their risk return relationship as well as the market perception of an asset class.<br />
Dec 31,<br />
2010<br />
Dec 31,<br />
2009
<strong>Deutsche</strong> <strong>Bank</strong> 01 – Management <strong>Report</strong> 72<br />
Financial <strong>Report</strong> 2010 Risk <strong>Report</strong><br />
The following table provides an overview of the categories of our loan book and the segregation into a lower,<br />
medium and higher risk bucket.<br />
in € m. Dec 31, 2010 Dec 31, 2009<br />
Lower risk bucket<br />
PBC Mortgages 140,727 67,311<br />
Investment Grade/German Mid-Cap 69,436 32,615<br />
GTB 38,353 19,823<br />
PWM 24,468 17,977<br />
PBC small corporate 17,550 15,127<br />
Government collateralized/structured transactions 9,074 7,674<br />
Corporate Investments 7,966 12,774<br />
Sub-total lower risk bucket 307,574 173,301<br />
Moderate risk bucket<br />
PBC Consumer Finance 18,902 15,032<br />
Asset Finance (DB sponsored conduits) 18,465 19,415<br />
Collateralized hedged structured transactions 12,960 14,564<br />
Financing of pipeline assets 8,050 7,886<br />
Sub-total moderate risk bucket 58,377 56,897<br />
Higher risk bucket<br />
Commercial Real Estate 29,024 12,990<br />
CF Leveraged Finance 7,018 11,768<br />
Other 9,032 6,492<br />
Sub-total higher risk bucket 45,074 31,250<br />
Total loan book 411,025 261,448<br />
The majority of our low risk exposures are associated with our Private & Business Client retail banking activities.<br />
75 % of our loan book at December 31, 2010 was in the low risk category, considerably higher than the 66 % at<br />
December 31, 2009. The increase in low risk loans was driven by the first-time inclusion of Postbank’s exposures<br />
which contributed € 109 billion to the low risk loans category. The majority of Postbank’s low risk loans related<br />
to client mortgages.<br />
Our Private & Business Clients (excluding Postbank integration) portfolio growth during 2010 was focused on<br />
secured lending within the lower risk bucket, especially mortgages, while the consumer finance portfolio declined.<br />
The rise in consumer finance exposures was again attributable to the inclusion of Postbank which had consumer<br />
finance exposure of € 4 billion as at December 31, 2010. Excluding Postbank our overall consumer finance<br />
exposure decreased in line with our defined strategy and predominantly relates to customers in Germany and<br />
Italy.<br />
Our higher risk bucket was predominantly driven by our leveraged finance and commercial real estate exposures.<br />
Our credit risk management approach put strong emphasis specifically on the portfolios we deem to be of higher<br />
risk. Portfolio strategies and credit monitoring controls are in place for these portfolios. The increase in commercial<br />
real estate exposures was driven by the inclusion of Postbank’s commercial real estate exposures which<br />
totaled € 15 billion at December 31, 2010. A borrower group concentration contributed approximately 50 % of<br />
the exposure in the CF Leveraged Finance category.
<strong>Deutsche</strong> <strong>Bank</strong> 01 – Management <strong>Report</strong> 73<br />
Financial <strong>Report</strong> 2010 Risk <strong>Report</strong><br />
The following table summarizes the level of impaired loans and the established allowance for loan losses for<br />
our higher-risk loan bucket.<br />
in € m. Impaired loans<br />
Dec 31, 2010 Dec 31, 2009<br />
Allowance for<br />
loan losses Impaired loans<br />
Allowance for<br />
loan losses<br />
Commercial Real Estate 421 297 460 274<br />
CF Leveraged Finance 336 180 2,122 815<br />
Other 798 466 934 377<br />
Total 1,555 943 3,516 1,466<br />
The above reduction of impaired loans and allowances for loan losses in relation to our higher risk loan bucket<br />
was primarily driven by the restructuring of a single counterparty relationship in the leveraged finance portfolio<br />
of our Corporate Finance business.<br />
Credit Exposure Classification<br />
We also classify our credit exposure under two broad headings: consumer credit exposure and corporate credit<br />
exposure.<br />
— Our consumer credit exposure consists of our smaller-balance standardized homogeneous loans, primarily<br />
in Germany, Italy and Spain, which include personal loans, residential and nonresidential mortgage loans,<br />
overdrafts and loans to self-employed and small business customers of our private and retail business.<br />
— Our corporate credit exposure consists of all exposures not defined as consumer credit exposure.<br />
Corporate Credit Exposure<br />
The following table breaks down several of our main corporate credit exposure categories according to the<br />
creditworthiness categories of our counterparties.<br />
Corporate credit exposure credit<br />
risk profile<br />
by creditworthiness category Loans 1<br />
in € m.<br />
Dec 31,<br />
2010<br />
Dec 31,<br />
2009<br />
Irrevocable lending<br />
commitments 2<br />
Dec 31,<br />
2010<br />
Dec 31,<br />
2009<br />
Contingent liabilities OTC derivatives 3 Total<br />
AAA–AA 62,603 28,134 23,068 22,211 7,334 6,573 23,967 23,966 116,972 80,884<br />
A 48,467 29,634 31,945 22,758 21,318 13,231 16,724 13,793 118,454 79,416<br />
BBB 56,096 46,889 36,542 28,814 20,391 15,753 8,408 7,600 121,437 99,056<br />
BB 44,809 43,401 22,083 23,031 11,547 9,860 7,905 12,785 86,344 89,077<br />
B 12,594 9,090 7,775 5,935 5,454 4,290 2,960 1,952 28,783 21,267<br />
CCC and below 17,425 14,633 2,467 1,376 2,012 2,476 2,341 4,444 24,245 22,929<br />
Total 241,994 171,781 123,880 104,125 68,056 52,183 62,305 64,540 496,235 392,629<br />
Dec 31,<br />
2010<br />
Dec 31,<br />
2009<br />
Dec 31,<br />
2010<br />
Dec 31,<br />
2009<br />
1 Includes impaired loans mainly in category CCC and below amounting to € 3.6 billion as of December 31, 2010 and € 4.9 billion as of December 31, 2009.<br />
2 Includes irrevocable lending commitments related to consumer credit exposure of € 4.5 billion as of December 31, 2010 and € 2.9 billion as of December 31, 2009.<br />
3 Includes the effect of netting agreements and cash collateral received where applicable.<br />
This table reflects an increase in our corporate loan book and irrevocable lending commitments which was<br />
predominantly driven by the inclusion of Postbank exposures. The portion of our corporate loan book carrying<br />
an investment-grade rating increased from 61 % as of December 31, 2009 to 69 % as of December 31, 2010,<br />
reflecting the first time inclusion of Postbank exposures as well as improvements in counterparty ratings as<br />
counterparties recover from the credit crisis and as a result of our proactive risk management activities. The<br />
loan exposure shown in the table above does not take into account any collateral, other credit enhancement or<br />
credit risk mitigating transactions. After consideration of such credit mitigants, we believe that our loan book is<br />
well-diversified. The marginal decrease in our OTC derivatives exposure, particularly in our creditworthiness<br />
category “BB”, was predominantly driven by tighter risk reduction activities. The OTC derivatives exposure<br />
Dec 31,<br />
2010<br />
Dec 31,<br />
2009
<strong>Deutsche</strong> <strong>Bank</strong> 01 – Management <strong>Report</strong> 74<br />
Financial <strong>Report</strong> 2010 Risk <strong>Report</strong><br />
does not include credit risk mitigants (other than master agreement netting) or collateral (other than cash).<br />
Taking these mitigants into account, we believe that the remaining current credit exposure was significantly<br />
lower, adequately structured, enhanced or well-diversified and geared towards investment grade counterparties.<br />
Our Loan Exposure Management Group (LEMG) helps mitigate our corporate credit exposures. The notional<br />
amount of LEMG’s risk reduction activities increased by 4 % from € 52.9 billion as of December 31, 2009, to<br />
€ 54.9 billion as of December 31, 2010.<br />
As of year-end 2010, LEMG held credit derivatives with an underlying notional amount of € 34.6 billion. The<br />
position totaled € 32.7 billion as of December 31, 2009.<br />
The credit derivatives used for our portfolio management activities are accounted for at fair value.<br />
LEMG also mitigated the credit risk of € 20.3 billion of loans and lending-related commitments as of December 31,<br />
2010, by synthetic collateralized loan obligations supported predominantly by financial guarantees and, to a<br />
lesser extent, credit derivatives for which the first loss piece has been sold. This position totaled € 20.2 billion<br />
as of December 31, 2009.<br />
LEMG has elected to use the fair value option under IAS 39 to report loans and commitments at fair value,<br />
provided the criteria for this option are met. The notional amount of LEMG loans and commitments reported at<br />
fair value increased during the year to € 54.1 billion as of December 31, 2010, from € 48.9 billion as of December<br />
31, 2009. By reporting loans and commitments at fair value, LEMG has significantly reduced profit and loss<br />
volatility that resulted from the accounting mismatch that existed when all loans and commitments were reported<br />
at historical cost while derivative hedges were reported at fair value.
<strong>Deutsche</strong> <strong>Bank</strong> 01 – Management <strong>Report</strong> 75<br />
Financial <strong>Report</strong> 2010 Risk <strong>Report</strong><br />
Consumer Credit Exposure<br />
The table below presents our total consumer credit exposure, consumer loan delinquencies in terms of loans<br />
that are 90 days or more past due, and net credit costs, which are the net provisions charged during the period,<br />
after recoveries. Loans 90 days or more past due and net credit costs are both expressed as a percentage of<br />
total exposure. Regardless of the past due status of the individual loans, in terms of credit quality the mortgage<br />
lending and loans to small business customers within the consumer credit exposure are allocated to our lower<br />
risk bucket while the consumer finance business is allocated to the moderate risk bucket. This credit risk quality<br />
aspect is also reflected by our net credit costs expressed as a percentage of the total exposure supporting them,<br />
which is the main credit risk management instrument for these exposures.<br />
Total exposure<br />
in € m.<br />
Total exposure<br />
excluding Postbank<br />
in € m.<br />
90 days or more past due<br />
as a % of total exposure<br />
excluding Postbank<br />
Net credit costs<br />
as a % of total exposure<br />
excluding Postbank<br />
Dec 31, 2010 Dec 31, 2010 Dec 31, 2009 Dec 31, 2010 Dec 31, 2009 Dec 31, 2010 Dec 31, 2009<br />
Consumer credit exposure<br />
Germany:<br />
Consumer and small business<br />
130,317 60,706 59,804 1.77 % 1.73 % 0.56 % 0.55 %<br />
financing 19,055 12,733 13,556 3.16 % 2.72 % 1.92 % 1.69 %<br />
Mortgage lending<br />
Consumer credit exposure<br />
111,262 47,973 46,248 1.41 % 1.44 % 0.20 % 0.22 %<br />
outside Germany 38,713 33,027 29,864 3.84 % 3.37 % 0.86 % 1.27 %<br />
Total consumer credit exposure 1 169,030 93,733 89,668 2.50 % 2.28 % 0.66 % 0.79 %<br />
1 Includes impaired loans amounting to € 2.7 billion as of December 31, 2010 and € 2.3 billion as of December 31, 2009.<br />
The volume of our consumer credit exposure increased due to the consolidation of Postbank by € 75.3 billion<br />
or 89 %, mainly in German mortgage lending. As loans were consolidated at their fair values representing our<br />
expected future cash flows, no consolidated loans were considered 90 days or more past due as of December<br />
31, 2010. The net credit cost incurred on Postbank consumer credit loans since consolidation date were insignificant<br />
compared to the consolidated loan volume. The volume of our consumer credit exposure excluding<br />
Postbank rose by € 4 billion, or 4.5 %, from year end 2009 to December 31, 2010, driven by volume growth in<br />
Germany (up € 902 million), Poland (up € 1,034 million), Italy (up € 949 million) and Portugal (up € 547 million),<br />
mainly within mortgage lending. Measures taken on portfolio and country level lead to significant reduction of<br />
net credit costs in Spain and India, partially offset by increases in our consumer finance business in Poland.<br />
Revised parameter and model assumptions in 2009 led to a one-time release of loan loss allowance of € 60 million<br />
in the first quarter 2009 as well as a lower level of provisions for credit losses of € 28 million for the first quarter<br />
2010.
<strong>Deutsche</strong> <strong>Bank</strong> 01 – Management <strong>Report</strong> 76<br />
Financial <strong>Report</strong> 2010 Risk <strong>Report</strong><br />
Credit Exposure from Derivatives<br />
The following table shows the notional amounts and gross market values of OTC and exchange-traded derivative<br />
contracts we held for trading and nontrading purposes as of December 31, 2010. The table below includes<br />
Postbank OTC and exchange-traded derivative contracts which have a negligible impact on the overall totals.<br />
Dec 31, 2010 Notional amount maturity distribution Positive<br />
in € m. Within 1 year<br />
> 1 and<br />
≤ 5 years After 5 years Total<br />
Exchange-traded derivative transactions (e.g., futures and options) are regularly settled through a central<br />
counterparty (e.g., LCH. Clearnet Ltd. or Eurex Clearing AG), the rules and regulations of which provide for<br />
daily margining of all current and future credit risk positions emerging out of such transactions. To the extent<br />
possible, we also use central counterparty clearing services for OTC derivative transactions (“OTC clearing”);<br />
we thereby benefit from the credit risk mitigation achieved through the central counterparty’s settlement system.<br />
As the replacement values of derivatives portfolios fluctuate with movements in market rates and with changes<br />
in the transactions in the portfolios, we also estimate the potential future replacement costs of the portfolios<br />
over their lifetimes or, in case of collateralized portfolios, over appropriate unwind periods. We measure the<br />
potential future exposure against separate limits. We supplement the potential future exposure analysis with<br />
stress tests to estimate the immediate impact of extreme market events on our exposures (such as event risk<br />
in our Emerging Markets portfolio).<br />
market<br />
value<br />
Negative<br />
market<br />
value<br />
Net<br />
market<br />
value<br />
Interest-rate-related transactions:<br />
OTC products 16,942,302 15,853,777 11,080,457 43,876,536 419,196 401,179 18,017<br />
Exchange-traded products 1,120,579 276,258 2,272 1,399,109 128 110 18<br />
Sub-total 18,062,881 16,130,035 11,082,729 45,275,645 419,324 401,289 18,035<br />
Currency-related transactions:<br />
OTC products 3,805,544 1,325,473 607,743 5,738,760 110,440 118,452 (8,012)<br />
Exchange-traded products 13,113 970 – 14,083 104 221 (117)<br />
Sub-total 3,818,657 1,326,443 607,743 5,752,843 110,544 118,673 (8,129)<br />
Equity/index-related transactions:<br />
OTC products 362,294 333,108 95,785 791,187 31,084 38,297 (7,213)<br />
Exchange-traded products 256,942 100,475 4,332 361,749 2,933 1,995 938<br />
Sub-total 619,236 433,583 100,117 1,152,936 34,017 40,292 (6,275)<br />
Credit derivatives 308,387 2,545,673 537,759 3,391,819 81,095 73,036 8,059<br />
Other transactions:<br />
OTC products 143,323 150,068 8,831 302,222 18,587 17,879 708<br />
Exchange-traded products 72,437 41,874 839 115,150 2,742 2,621 121<br />
Sub-total 215,760 191,942 9,670 417,372 21,329 20,500 829<br />
Total OTC business 21,561,850 20,208,099 12,330,575 54,100,524 660,402 648,843 11,559<br />
Total exchange-traded business 1,463,071 419,577 7,443 1,890,091 5,907 4,947 960<br />
Total 23,024,921 20,627,676 12,338,018 55,990,615 666,309 653,790 12,519<br />
Positive market values including<br />
the effect of netting and cash<br />
collateral received 63,942
<strong>Deutsche</strong> <strong>Bank</strong> 01 – Management <strong>Report</strong> 77<br />
Financial <strong>Report</strong> 2010 Risk <strong>Report</strong><br />
The potential future exposure measure which we use is generally given by a time profile of simulated positive<br />
market values of each counterparty’s derivatives portfolio, for which netting and collateralization are considered.<br />
For limit monitoring we employ the 95th quantile of the resulting distribution of market values, internally referred<br />
to as potential future exposure (“PFE”). The average exposure profiles generated by the same calculation process<br />
are used to derive the so-called average expected exposure (“AEE”) measure, which we use to reflect potential<br />
future replacement costs within our credit risk economic capital, and the expected positive exposure (“EPE”)<br />
measure driving our regulatory capital requirements. While AEE and EPE are generally calculated with respect<br />
to a time horizon of one year, the PFE is measured over the <strong>entire</strong> lifetime of a transaction or netting set. We<br />
also employ the aforementioned calculation process to derive stressed exposure results for input into our credit<br />
portfolio stress testing.<br />
Credit Exposure from Nonderivative Trading Assets<br />
The following table shows details about the composition of our nonderivative trading assets for the dates<br />
specified.<br />
in € m. Dec 31, 2010 Dec 31, 2009<br />
Government paper & agencies 92,866 76,318<br />
Financial institutions & corporates 73,711 69,408<br />
Equities 66,868 58,798<br />
Traded loans 23,080 21,847<br />
Other 14,766 8,539<br />
Total nonderivative trading assets 271,291 234,910<br />
Traded credit products such as bonds in our developed markets’ trading book (excluding Postbank) are managed<br />
by a dedicated risk management unit combining our credit and market risk expertise. We use appropriate<br />
portfolio limits and ratings-driven thresholds on single-issuer basis, combined with our market risk management<br />
tools to risk manage such positions. Emerging markets traded credit products are risk managed using<br />
expertise which resides within our respective emerging markets credit risk unit and market risk management.<br />
Distribution Risk Management<br />
We frequently underwrite commitments with the intention to sell down or distribute part of the risk to third parties.<br />
These commitments include the undertaking to fund bank loans and to provide bridge loans for the issuance of<br />
public bonds. The risk is that we may not be successful in the distribution of the facilities. In this case, we would<br />
have to hold more of the underlying risk than intended for longer periods of time than originally intended.<br />
For risk management purposes we treat the full amount of all such commitments as credit exposure requiring<br />
credit approval. This approval also includes our intended final hold. Amounts which we intend to sell are classified<br />
as trading assets and are subject to fair value accounting. The price volatility is monitored in our market<br />
risk process. We protect the value of these assets against adverse market movements via adequate credit<br />
documentation for these transactions and market risk hedges (most commonly using related indices), which<br />
are also captured in our market risk process.
<strong>Deutsche</strong> <strong>Bank</strong> 01 – Management <strong>Report</strong> 78<br />
Financial <strong>Report</strong> 2010 Risk <strong>Report</strong><br />
Problem Loans<br />
Our problem loans consist mainly of impaired loans. Credit Risk Management regularly assesses whether<br />
there is objective evidence that a loan or group of loans is impaired. A loan or group of loans is impaired and<br />
impairment losses are incurred if<br />
— there is objective evidence of impairment as a result of a loss event that occurred after the initial recognition<br />
of the asset and up to the balance sheet date (a “loss event”),<br />
— the loss event had an impact on the estimated future cash flows of the financial asset or the group of financial<br />
assets, and<br />
— a reliable estimate of the loss amount can be made.<br />
Credit Risk Management’s loss assessments are subject to regular review in collaboration with Group Finance.<br />
The results of this review are reported to and approved by an oversight committee comprised of Group Finance<br />
and Legal, Risk & Capital senior management.<br />
The impairment loss is generally calculated on the basis of discounted expected cash flows using the original<br />
effective interest rate of the loan. For troubled debt restructurings (as defined below) the original effective interest<br />
rate before modification of terms is used.<br />
While we assess the impairment for our corporate credit exposures individually, we assess the impairment of<br />
our smaller-balance standardized homogeneous loans collectively.<br />
The loan loss provisioning methodology for the majority of our Private & Business Client portfolio is based on<br />
statistical models. Our loan portfolio is divided into homogenous and non-homogeneous parts. These parts are<br />
further differentiated into sub-portfolios based on the nature of the exposure and the type of the customer.<br />
Using historical data the level of loan loss provision for the homogeneous portfolio is automatically calculated<br />
using statistical models, based on allowance rates for each respective arrears class (days past due). The nonhomogeneous<br />
portfolio is characterized by large credit facilities or certain loan categories which are not comparable<br />
due to their size, complexity or quality. These credit facilities undergo a case by case review on a regular<br />
basis and once it has been determined that an impairment loss has been incurred, a loan loss allowance is<br />
determined according to an expected loss methodology.<br />
Postbank’s methodology for establishing loan loss allowances is similar to ours. Exceptions include the fact<br />
that Postbank executes direct charge-offs without first establishing a loan loss allowance and the fact that the<br />
loan loss allowances in its retail mortgage portfolio are assessed individually for loans being 180 days or more<br />
past due. In reflecting Postbank in our consolidated results, the effects of the aforementioned differences have<br />
been aligned to our policies for reporting purposes.
<strong>Deutsche</strong> <strong>Bank</strong> 01 – Management <strong>Report</strong> 79<br />
Financial <strong>Report</strong> 2010 Risk <strong>Report</strong><br />
Loan loss allowances established for loans prior to consolidation of Postbank, Sal. Oppenheim/BHF-BANK and<br />
parts of the commercial banking activities in the Netherlands acquired from ABN AMRO, have not been consolidated<br />
into our stock of loan loss allowances. Instead, these loan loss allowances have been considered in<br />
determining the fair value representing the cost basis of the newly consolidated loans. Subsequent improvements<br />
in the credit quality of these loans are reflected as an appreciation in their carrying value with a corresponding<br />
gain recognized in other income. Loan loss allowances established for loans after consolidation of Postbank,<br />
Sal. Oppenheim/BHF-BANK and parts of the commercial banking activities in the Netherlands acquired from<br />
ABN AMRO, however, are included in our provision for credit losses and loan loss allowances.<br />
The second component of our problem loans are nonimpaired problem loans, where no impairment loss is<br />
recorded but where either known information about possible credit problems of borrowers causes management<br />
to have serious doubts as to the ability of such borrowers to comply with the present loan repayment terms or<br />
that are 90 days or more past due but for which the accrual of interest has not been discontinued.<br />
In keeping with SEC industry guidance, we also continue to monitor and report the following categories in our<br />
problem loans:<br />
— Nonaccrual Loans: We place a loan on nonaccrual status if the loan has been in default as to payment of<br />
principal or interest for 90 days or more and the loan is neither well secured nor in the process of collection,<br />
or the accrual of interest should be ceased according to management’s judgment as to collectability of contractual<br />
cash flows. When a loan is placed on nonaccrual status, the accrual of interest in accordance with<br />
the contractual terms of the loan is discontinued. However, the accretion of the net present value of the written<br />
down amount of the loan due to the passage of time is recognized as interest income based on the original<br />
effective interest rate of the loan. Cash receipts of interest on nonaccrual loans are recorded as a reduction<br />
of principal.<br />
— Loans Ninety Days or More Past Due and Still Accruing: These are loans in which contractual interest or<br />
principal payments are 90 days or more past due but on which we continue to accrue interest as no impairment<br />
loss is recorded.<br />
— Troubled Debt Restructurings: These are loans that we have restructured due to deterioration in the borrower’s<br />
financial position on terms that we would not otherwise consider. If a borrower performs satisfactorily for<br />
one year under a restructured loan, we no longer consider that borrower’s loan to be a troubled debt<br />
restructuring, unless at the time of restructuring the new interest rate was lower than the market rate for similar<br />
credit risks.<br />
With the consolidation of Postbank, parts of the commercial banking activities in the Netherlands acquired from<br />
ABN AMRO and Sal. Oppenheim/BHF-BANK, we acquired certain loans for which a specific allowance had<br />
been established beforehand by Postbank, ABN AMRO or Sal. Oppenheim/BHF-BANK, respectively. These<br />
loans were taken onto our balance sheet at their fair values as determined by their expected cash flows which<br />
reflected the credit quality of these loans at the time of acquisition. As long as our cash flow expectations regarding<br />
these loans have not deteriorated since acquisition, they are not considered impaired or problem loans.
<strong>Deutsche</strong> <strong>Bank</strong> 01 – Management <strong>Report</strong> 80<br />
Financial <strong>Report</strong> 2010 Risk <strong>Report</strong><br />
The following two tables present a breakdown of our problem loans for the dates specified.<br />
Dec 31, 2010 Impaired loans Nonimpaired problem loans<br />
Problem<br />
loans<br />
in € m. German Non-German Total German Non-German Total Total<br />
Individually assessed 996 2,556 3,552 239 1,635 1,874 5,426<br />
Nonaccrual loans<br />
Loans 90 days or more past due<br />
902 2,374 3,276 153 897 1,051 4,327<br />
and still accruing – – – 36 8 44 44<br />
Troubled debt restructurings 94 182 276 50 729 779 1,055<br />
Collectively assessed 1,010 1,703 2,713 267 29 296 3,009<br />
Nonaccrual loans<br />
Loans 90 days or more past due<br />
1,009 1,583 2,591 – – – 2,591<br />
and still accruing – – – 252 5 258 258<br />
Troubled debt restructurings 1 120 121 15 24 38 160<br />
Total problem loans<br />
thereof: IAS 39 reclassified<br />
2,006 4,258 6,265 506 1,664 2,170 8,435<br />
problem loans 84 1,150 1,234 – 979 979 2,213<br />
Dec 31, 2009 Impaired loans Nonimpaired problem loans<br />
Problem<br />
loans<br />
in € m. German Non-German Total German Non-German Total Total<br />
Individually assessed 758 4,145 4,903 304 1,037 1,341 6,244<br />
Nonaccrual loans<br />
Loans 90 days or more past due<br />
707 4,027 4,734 200 1,003 1,203 5,937<br />
and still accruing – – – 50 5 55 55<br />
Troubled debt restructurings 51 118 169 54 29 83 252<br />
Collectively assessed 907 1,391 2,298 274 97 371 2,669<br />
Nonaccrual loans<br />
Loans 90 days or more past due<br />
905 1,281 2,186 – – – 2,186<br />
and still accruing – – – 260 6 266 266<br />
Troubled debt restructurings 2 110 112 14 91 105 217<br />
Total problem loans<br />
thereof: IAS 39 reclassified<br />
1,665 5,536 7,201 578 1,134 1,712 8,913<br />
problem loans 28 2,750 2,778 – 159 159 2,937<br />
Our total problem loans decreased by € 478 million or 5 % during 2010 due to € 1.4 billion of charge-offs, partly<br />
offset by a € 716 million gross increase of problem loans and a € 248 million increase as a result of exchange<br />
rate movements.<br />
The decrease in our total problem loans was driven by a restructuring of loans for a single counterparty stemming<br />
from a failed syndication which were among the loans reclassified in accordance with IAS 39. This led to a<br />
reduction of € 1.4 billion in impaired loans, thereof € 545 million due to charge-offs. After the restructuring we<br />
continued to provide both senior and subordinate debt financing, but held certain noncontrolling rights, consents<br />
and vetoes over the financial and operating decisions of the company. We accounted for the subordinated<br />
financing arrangement as an equity method investment, and it was not disclosed as a problem loan.
<strong>Deutsche</strong> <strong>Bank</strong> 01 – Management <strong>Report</strong> 81<br />
Financial <strong>Report</strong> 2010 Risk <strong>Report</strong><br />
Individually assessed impaired loans decreased by overall € 1.4 billion due to charge-offs of € 934 million and<br />
gross decreases of € 609 million, partly offset by € 191 million exchange rate movements. The main reason for<br />
the overall reduction of individually assessed impaired loans was the aforementioned restructuring. Our collectively<br />
assessed impaired loans increased by € 415 million. These increases were driven by our acquisition of<br />
Postbank as well as by increases in our portfolios in Italy and Poland. Gross increases in collectively assessed<br />
impaired loans of € 909 million and € 15 million exchange rate movements were partially offset by € 509 million<br />
charge-offs.<br />
These effects led to a total decrease in impaired loans by € 937 million or 13 %, while nonimpaired problem<br />
loans increased by € 459 million due to a number of loans designated as defaulted, but for which we did not<br />
expect to incur a loss, mainly due to collateralization.<br />
Our problem loans included € 2.2 billion of problem loans among the loans reclassified to loans and receivables<br />
in accordance with IAS 39. For these loans we recorded charge-offs of € 607 million and gross decreases in<br />
problem loans of € 219 million, partially offset by a € 101 million increase as a result of exchange rate movements.<br />
Our commitments to lend additional funds to debtors with problem loans amounted to € 184 million as of December<br />
31, 2010, a decrease of € 7 million or 4 % compared to December 31, 2009. Of these commitments,<br />
€ 40 million were to debtors whose loan terms have been modified in a troubled debt restructuring, a decrease<br />
of € 11 million compared to December 31, 2009.<br />
In addition, as of December 31, 2010, we had € 8 million of lease financing transactions that were nonperforming,<br />
an increase of € 1 million or 14 % compared to December 31, 2009. These amounts are not included in our<br />
total problem loans.<br />
The following table presents an overview of nonimpaired Troubled Debt Restructurings representing our renegotiated<br />
loans that would otherwise be past due or impaired.<br />
in € m. Dec 31, 2010 Dec 31, 2009<br />
Troubled debt restructurings not impaired 818 188<br />
The following table breaks down the nonimpaired past due loan exposure carried at amortized cost according<br />
to its past due status, including nonimpaired loans past due more than 90 days but where there is no concern<br />
over the creditworthiness of the counterparty.<br />
in € m. Dec 31, 2010 Dec 31, 2009<br />
Loans less than 30 days past due 4,092 6,192<br />
Loans 30 or more but less than 60 days past due 973 941<br />
Loans 60 or more but less than 90 days past due 384 558<br />
Loans 90 days or more past due 981 925<br />
Total loans past due but not impaired 6,430 8,616
<strong>Deutsche</strong> <strong>Bank</strong> 01 – Management <strong>Report</strong> 82<br />
Financial <strong>Report</strong> 2010 Risk <strong>Report</strong><br />
The following table presents the aggregated value of collateral – with the fair values of collateral capped at loan<br />
outstandings – held by us against our loans past due but not impaired.<br />
in € m. Dec 31, 2010 Dec 31, 2009<br />
Financial and other collateral 3,484 3,965<br />
Guarantees received 244 330<br />
Total capped fair value of collateral held for loans past due but not impaired 3,728 4,295<br />
Impaired Loans<br />
The following tables present a breakdown of our impaired loans, the components of our allowance for loan<br />
losses and the respective coverage ratios by region based on the country of domicile of our counterparties for<br />
the dates specified.<br />
Dec 31, 2010 Impaired Loans Loan loss allowance Impaired loan<br />
in € m.<br />
Individually<br />
assessed<br />
Collectively<br />
assessed Total<br />
Individually<br />
assessed<br />
Collectively<br />
assessed Total<br />
coverage<br />
ratio in %<br />
Germany 996 1,010 2,006 559 453 1,012 50<br />
Western Europe<br />
(excluding Germany) 1,153 1,441 2,594 640 997 1,637 63<br />
Eastern Europe 22 245 267 6 186 192 72<br />
North America 1,146 4 1,150 339 4 343 30<br />
Central and South America 43 – 43 27 – 27 63<br />
Asia/Pacific 169 13 182 68 13 81 45<br />
Africa 23 – 23 4 – 4 17<br />
Other – – – – – – –<br />
Total 3,552 2,713 6,265 1,643 1,653 3,296 53<br />
Dec 31, 2009 Impaired Loans Loan loss allowance Impaired loan<br />
in € m.<br />
Individually<br />
assessed<br />
Collectively<br />
assessed Total<br />
Individually<br />
assessed<br />
Collectively<br />
assessed Total<br />
coverage<br />
ratio in %<br />
Germany 758 907 1,665 498 454 952 57<br />
Western Europe<br />
(excluding Germany) 2,457 1,245 3,702 1,035 741 1,776 48<br />
Eastern Europe 30 121 151 17 94 111 74<br />
North America 1,392 3 1,395 397 3 400 29<br />
Central and South America 84 1 85 21 1 22 26<br />
Asia/Pacific 136 21 157 51 21 72 46<br />
Africa 27 – 27 7 – 7 26<br />
Other 19 – 19 3 – 3 16<br />
Total 4,903 2,298 7,201 2,029 1,314 3,343 46
<strong>Deutsche</strong> <strong>Bank</strong> 01 – Management <strong>Report</strong> 83<br />
Financial <strong>Report</strong> 2010 Risk <strong>Report</strong><br />
The following tables present a breakdown of our impaired loans, the components of our allowance for loan<br />
losses and the respective coverage ratios by industry sector of our counterparties for the dates specified.<br />
Dec 31, 2010 Impaired Loans Loan loss allowance Impaired loan<br />
in € m.<br />
Individually<br />
assessed<br />
Collectively<br />
assessed Total<br />
Individually<br />
assessed<br />
Collectively<br />
assessed Total<br />
coverage<br />
ratio in %<br />
<strong>Bank</strong>s and insurance 81 – 81 82 – 82 100<br />
Fund management activities 841 – 841 298 97 395 41<br />
Manufacturing 603 139 742 332 125 457 62<br />
Wholesale and retail trade 199 113 312 147 111 258 83<br />
Households 163 1,810 1,973 105 965 1,070 54<br />
Commercial real estate activities 740 229 969 259 83 342 35<br />
Public sector – – – – – – –<br />
Other 925 422 1,347 420 272 692 56<br />
Total 3,552 2,713 6,265 1,643 1,653 3,296 53<br />
Dec 31, 2009 Impaired Loans Loan loss allowance Impaired loan<br />
Individually Collectively<br />
Individually Collectively<br />
coverage<br />
in € m.<br />
assessed assessed Total assessed assessed Total ratio in %<br />
<strong>Bank</strong>s and insurance 101 – 101 82 0 82 81<br />
Fund management activities 848 – 848 281 – 281 33<br />
Manufacturing 582 116 698 307 116 423 61<br />
Wholesale and retail trade 255 91 346 117 71 188 54<br />
Households 103 1,556 1,659 49 750 799 48<br />
Commercial real estate activities 710 250 960 314 92 406 42<br />
Public sector 45 – 45 6 – 6 13<br />
Other 1 2,259 285 2,544 873 285 1,158 46<br />
Total 4,903 2,298 7,201 2,029 1,314 3,343 46<br />
1 For December 31, 2009 the category Other contained primarily the impaired junior debt portion of one Leveraged Finance exposure which was reclassified to loans<br />
and receivables in accordance with IAS 39.<br />
The following table presents the aggregated value of collateral we held against impaired loans, with fair values<br />
capped at transactional outstandings.<br />
in € m. Dec 31, 2010 Dec 31, 2009<br />
Financial and other collateral 1,502 1,757<br />
Guarantees received 77 57<br />
Total capped fair value of collateral held for impaired loans 1,579 1,814<br />
Considering the collateral held against impaired loans in addition to the allowance for loan losses, the impaired<br />
loan coverage was 78 % as of December 31, 2010 and 72 % as of December 31, 2009. The increase was<br />
principally driven by a reduction of loans reclassified in accordance with IAS 39. These loans required a lower<br />
amount of loan loss allowance due to fair value charges taken before their reclassification and hence lead to a<br />
lower average coverage ratio.
<strong>Deutsche</strong> <strong>Bank</strong> 01 – Management <strong>Report</strong> 84<br />
Financial <strong>Report</strong> 2010 Risk <strong>Report</strong><br />
Collateral Obtained<br />
The following table presents the aggregated value of collateral we obtained on the balance sheet during the<br />
reporting periods by taking possession of collateral held as security or by calling upon other credit enhancements.<br />
in € m. 2010 2009<br />
Commercial real estate 32 78<br />
Residential real estate 47 10<br />
Other 1 –<br />
Total collateral obtained during the reporting period 80 88<br />
Collateral obtained is made available for sale in an orderly fashion or through public auctions, with the proceeds<br />
used to repay or reduce outstanding indebtedness. Generally we do not occupy obtained properties for our<br />
business use.<br />
The commercial real estate collateral obtained in 2010 related to two of our U.S. exposures while the residential<br />
real estate collateral obtained related predominately to a number of cases in Spain and also a few cases in the<br />
U.S. where we have executed foreclosure by taking possession.<br />
The residential real estate collateral obtained, as shown in the table above, excludes collateral recorded as a<br />
result of consolidating securitization trusts under SIC-12 and IAS 27. The year-end amounts in relation to<br />
collateral obtained for these trusts were € 25 million and € 33 million, for December 31, 2010 and December 31,<br />
2009, respectively.<br />
Movements in the Allowance for Loan Losses<br />
We record increases to our allowance for loan losses as an increase of the provision for loan losses in our<br />
income statement. Charge-offs reduce our allowance while recoveries, if any, are credited to the allowance<br />
account. If we determine that we no longer require allowances which we have previously established, we<br />
decrease our allowance and record the amount as a reduction of the provision for loan losses in our income<br />
statement.<br />
The following table presents a breakdown of the movements in our allowance for loan losses for the periods<br />
specified.<br />
in € m.<br />
Individually<br />
assessed<br />
Collectively<br />
assessed Total<br />
2010 2009<br />
Individually<br />
assessed<br />
Collectively<br />
assessed Total<br />
Balance, beginning of year 2,029 1,314 3,343 977 961 1,938<br />
Provision for loan losses 562 751 1,313 1,789 808 2,597<br />
Net charge-offs (896) (404) (1,300) (637) (419) (1,056)<br />
Charge-offs (934) (509) (1,443) (670) (552) (1,222)<br />
Recoveries 38 104 143 33 133 166<br />
Changes in the group of consolidated companies – – – – – –<br />
Exchange rate changes/other (52) (8) (60) (101) (36) (137)<br />
Balance, end of year 1,643 1,653 3,296 2,029 1,314 3,343
<strong>Deutsche</strong> <strong>Bank</strong> 01 – Management <strong>Report</strong> 85<br />
Financial <strong>Report</strong> 2010 Risk <strong>Report</strong><br />
The following table sets forth a breakdown of the movements in our allowance for loan losses specifically for<br />
charge-offs and recoveries, including, with respect to our German loan portfolio, by industry classifications for<br />
the periods specified. The breakdown between German and non-German borrowers is based on the country of<br />
domicile of our borrowers.<br />
in € m.<br />
(unless stated otherwise) 2010 2009<br />
Balance, beginning of year 3,343 1,938<br />
Charge-offs:<br />
German:<br />
<strong>Bank</strong>s and insurance (5) (2)<br />
Fund management activities – –<br />
Manufacturing (43) (43)<br />
Wholesale and retail trade (32) (23)<br />
Households (excluding mortgages) (338) (340)<br />
Households – mortgages (26) (23)<br />
Commercial real estate activities (22) (6)<br />
Public sector – –<br />
Other (49) (72)<br />
German total (515) (509)<br />
Non-German total (928) (713)<br />
Total charge-offs (1,443) (1,222)<br />
Recoveries:<br />
German:<br />
<strong>Bank</strong>s and insurance 1 1<br />
Fund management activities – –<br />
Manufacturing 14 11<br />
Wholesale and retail trade 6 7<br />
Households (excluding mortgages) 63 83<br />
Households – mortgages 4 1<br />
Commercial real estate activities 4 7<br />
Public sector – –<br />
Other 20 25<br />
German total 112 135<br />
Non-German total 31 31<br />
Total recoveries 143 166<br />
Net charge-offs (1,300) (1,056)<br />
Provision for loan losses 1,313 2,597<br />
Other changes (e.g. exchange rate changes, changes in the group of consolidated companies) (60) (137)<br />
Balance, end of year 3,296 3,343<br />
Percentage of total net charge-offs to average loans for the year 0.45 % 0.39 %<br />
Our allowance for loan losses as of December 31, 2010 was € 3.3 billion, a 1 % decrease from prior year end.<br />
The decrease in our allowance was principally due to charge-offs, reductions resulting from currency translation<br />
and unwinding effects exceeding our provisions.<br />
Our net charge-offs amounted to € 1.3 billion in 2010. Of the charge-offs for 2010, € 896 million were related to<br />
our corporate credit exposure, of which € 607 million were related to assets which had been reclassified in<br />
accordance with IAS 39 in our United Kingdom and Asia-Pacific portfolios, and € 404 million to our consumer<br />
credit exposure, mainly driven by our German portfolios.
<strong>Deutsche</strong> <strong>Bank</strong> 01 – Management <strong>Report</strong> 86<br />
Financial <strong>Report</strong> 2010 Risk <strong>Report</strong><br />
Our provision for loan losses in 2010 was € 1.3 billion, principally driven by € 562 million for our corporate credit<br />
exposures, of which € 278 million of new provisions were established relating to assets which had been reclassified<br />
in accordance with IAS 39, relating predominantly to exposures in Corporate <strong>Bank</strong>ing & Securities. The<br />
remaining increase reflected impairment charges taken on a number of exposures in the Americas and in Europe<br />
in an overall favorable global economic credit environment. Loan loss provisions in our collectively assessed<br />
exposure amounted to € 751 million, reflecting a significant reduction of our net credit costs in Spain and India<br />
partially offset by increases in Poland, which is lower than the € 808 million recorded in the prior year, which<br />
was predominately driven by the challenging credit environment in Spain and Poland during 2009.<br />
Our individually assessed loan loss allowance was € 1.6 billion as of December 31, 2010. The € 386 million<br />
decrease in 2010 comprises net provisions of € 562 million (including the aforementioned impact from IAS 39<br />
reclassifications), net charge-offs of € 896 million and a € 52 million decrease from currency translation and<br />
unwinding effects.<br />
Our collectively assessed loan loss allowance totaled € 1.7 billion as of December 31, 2010, representing an<br />
increase of € 339 million against the level reported for the end of 2009 (€ 1.3 billion). Movements in this component<br />
comprised a € 751 million provision, being partially offset by € 404 million net charge-offs and a € 8 million<br />
net decrease from currency translation and unwinding effects.<br />
Our allowance for loan losses as of December 31, 2009 was € 3.3 billion, a 72 % increase from the € 1.9 billion<br />
reported for the end of 2008. The increase in our allowance was principally due to provisions exceeding substantially<br />
our charge-offs.<br />
Our gross charge-offs amounted to € 1.2 billion in 2009. Of the charge-offs for 2009, € 637 million were related<br />
to our corporate credit exposure, of which € 414 million were related to assets which had been re-classified in<br />
accordance with IAS 39 in our U.S. and U.K. portfolios, and € 419 million to our consumer credit exposure, mainly<br />
driven by our German portfolios.<br />
Our provision for loan losses in 2009 was € 2.6 billion, principally driven by € 1.8 billion for our corporate credit<br />
exposures, of which € 1.3 billion of new provisions were established relating to assets which had been reclassified<br />
in accordance with IAS 39, relating predominantly to exposures in Leveraged Finance. The remaining<br />
increase reflected impairment charges taken on a number of exposures in the Americas and in Europe in an<br />
overall deteriorating credit environment. Loan loss provisions for PCAM amounted to € 805 million, predominately<br />
reflecting a more challenging credit environment in Spain and Poland. Provisions in 2009 were positively<br />
impacted by changes in certain parameter and model assumptions, which reduced provisions by € 87 million in<br />
CIB and € 146 million in PCAM.<br />
Our individually assessed loan loss allowance was € 2.0 billion as of December 31, 2009. The € 1.1 billion<br />
increase in 2009 is comprised of net provisions of € 1.8 billion (including the aforementioned impact from IAS 39<br />
reclassifications), net charge-offs of € 637 million and a € 101 million decrease from currency translation and<br />
unwinding effects.
<strong>Deutsche</strong> <strong>Bank</strong> 01 – Management <strong>Report</strong> 87<br />
Financial <strong>Report</strong> 2010 Risk <strong>Report</strong><br />
Our collectively assessed loan loss allowance totaled € 1.3 billion as of December 31, 2009, representing an<br />
increase of € 353 million against the level reported for the end of 2008 (€ 961 million). Movements in this component<br />
include a € 808 million provision, including a positive impact by changes in certain parameter and model<br />
assumptions which reduced provision by € 87 million, being offset by € 419 million net charge-offs and a<br />
€ 36 million net decrease from currency translation and unwinding effects.<br />
Non-German Component of the Allowance for Loan Losses<br />
The following table presents an analysis of the changes in the non-German component of the allowance for loan<br />
losses. As of December 31, 2010, 69 % of our total allowance was attributable to non-German clients compared<br />
to 72 % as of December 31, 2009.<br />
in € m. 2010 2009<br />
Balance, beginning of year 2,391 995<br />
Provision for loan losses 820 2,182<br />
Net charge-offs (897) (682)<br />
Charge-offs (928) (713)<br />
Recoveries 31 31<br />
Other changes (e.g. exchange rate changes, changes in the group of consolidated companies) (30) (104)<br />
Balance, end of year 2,284 2,391<br />
Allowance for Off-balance Sheet Positions<br />
The following table shows the activity in our allowance for off-balance sheet positions, which comprises contingent<br />
liabilities and lending-related commitments.<br />
in € m.<br />
Individually<br />
assessed<br />
Collectively<br />
assessed Total<br />
2010 2009<br />
Individually<br />
assessed<br />
Collectively<br />
assessed Total<br />
Balance, beginning of year 83 124 207 98 112 210<br />
Provision for off-balance sheet positions (18) (21) (39) 21 12 33<br />
Usage – – – (45) – (45)<br />
Changes in the group of consolidated<br />
companies 42 – 42 – – –<br />
Exchange rate changes 1 7 8 10 – 10<br />
Balance, end of year 108 110 218 83 124 207<br />
In 2010 we recorded changes in the group of consolidated companies for off-balance sheet allowances following<br />
the consolidation of acquisitions amounting to € 34 million for Postbank and € 8 million for Sal. Oppenheim/<br />
BHF-BANK.<br />
Treatment of Default Situations under Derivatives<br />
Unlike standard loan assets, we generally have more options to manage the credit risk in our OTC derivatives<br />
when movement in the current replacement costs of the transactions and the behavior of our counterparty<br />
indicate that there is the risk that upcoming payment obligations under the transactions might not be honored.<br />
In these situations, we are frequently able under prevailing contracts to obtain additional collateral or terminate<br />
the transactions or the related master agreement at short notice.
<strong>Deutsche</strong> <strong>Bank</strong> 01 – Management <strong>Report</strong> 88<br />
Financial <strong>Report</strong> 2010 Risk <strong>Report</strong><br />
Derivatives – Credit Valuation Adjustment<br />
We establish a counterparty credit valuation adjustment for OTC derivative transactions to cover expected credit<br />
losses. The adjustment amount is determined at each reporting date by assessing the potential credit exposure<br />
to all counterparties, taking into account any collateral held, the effect of netting under a master agreement,<br />
expected loss given default and the credit risk for each counterparty based on historic default levels.<br />
The credit valuation adjustments are significant for certain monoline counterparties. These credit valuation<br />
adjustments are assessed using a model-based approach with numerous input factors for each counterparty,<br />
including market data, the likelihood of an event (either a restructuring or insolvency), an assessment of any<br />
potential settlement in the event of a restructuring, and recovery rates in the event of either restructuring or<br />
insolvency. We recorded € 1.2 billion in credit valuation adjustments against our aggregate monoline exposures<br />
for 2010 and € 1.2 billion for 2009.<br />
The master agreements executed with our clients usually provide for a broad set of standard or bespoke termination<br />
rights, which allow us to respond swiftly to a counterparty’s default or to other circumstances which<br />
indicate a high probability of failure. When our decision to terminate derivative transactions or the related master<br />
agreement results in a residual net obligation owed by the counterparty, we restructure the obligation into a<br />
non-derivative claim and manage it through our regular work-out process. As a consequence, for accounting<br />
purposes we typically do not show any nonperforming derivatives.<br />
Market Risk<br />
The vast majority of our businesses are subject to market risk, defined as the potential for change in the market<br />
value of our trading and investing positions. Risk can arise from adverse changes in interest rates, credit<br />
spreads, foreign exchange rates, equity prices, commodity prices and other relevant parameters, such as<br />
market volatility.<br />
Market risk arising from Postbank has been included in the 2010 information and where possible our own risk<br />
methodology framework has been applied. <strong>Deutsche</strong> <strong>Bank</strong>, however, does not manage any market risk aspect<br />
of Postbank.<br />
The primary objective of Market Risk Management is to ensure that our business units optimize the risk-reward<br />
relationship and do not expose the <strong>Bank</strong> to unacceptable losses outside of our risk appetite. To achieve this<br />
objective, Market Risk Management works closely together with risk takers (the business units) and other control<br />
and support groups. This is restricted to the <strong>Deutsche</strong> <strong>Bank</strong> Group excluding Postbank.
<strong>Deutsche</strong> <strong>Bank</strong> 01 – Management <strong>Report</strong> 89<br />
Financial <strong>Report</strong> 2010 Risk <strong>Report</strong><br />
We differentiate between two substantially different types of market risk:<br />
— Trading market risk arises primarily through the market-making activities of the Corporate & Investment<br />
<strong>Bank</strong> division. This involves taking positions in debt, equity, foreign exchange, other securities and commodities<br />
as well as in equivalent derivatives.<br />
— Nontrading market risk in various forms: Equity risk arises primarily from non-consolidated strategic investments<br />
in the Corporate Investment portfolio, alternative asset investments and equity compensation. Interest<br />
rate risk stems from our nontrading asset and liability positions. Other nontrading market risk elements<br />
are risks arising from asset management and fund related activities as well as model risks in PBC, GTB and<br />
PWM, which are derived by stressing assumptions of client behavior in combination with interest rate<br />
movements. Postbank categorizes risk from modeling deposits as business risk and risk from its building<br />
society BHW as collective risk whereas in <strong>Deutsche</strong> <strong>Bank</strong> Group excluding Postbank these risks are part of<br />
nontrading market risk.<br />
Trading Market Risk Management Framework at <strong>Deutsche</strong> <strong>Bank</strong> Group (excluding Postbank)<br />
Our primary instrument to manage trading market risk is the limit setting process which is not applicable to<br />
Postbank. Our Management Board, supported by Market Risk Management, which is part of our independent<br />
Legal, Risk & Capital function, sets Group-wide value-at-risk and economic capital limits for market risk in the<br />
trading book. Market Risk Management sub-allocates this overall limit to our group divisions and individual<br />
business areas within CIB (e.g., Global Rates, Equity, etc.) based on anticipated business plans and risk appetite.<br />
Within the individual business areas, the business heads may establish business limits by sub-allocating the<br />
Market Risk Management limit down to individual portfolios or geographical regions.<br />
Value-at-risk and economic capital limits are used for managing all types of market risk at an overall portfolio<br />
level. In addition, Market Risk Management operates sensitivity and concentration/liquidity limits as an additional<br />
and complementary tool for managing certain portfolios or risk types. A distinction is made between Market Risk<br />
Management limits and business limits for sensitivities and concentration/liquidity. In practice, the Market Risk<br />
Management limits are likely to be a relatively small number of key limits necessary to capture an exposure to<br />
a particular risk factor and will tend to be global in nature rather than for any particular geographical region or<br />
specific portfolios.<br />
To manage the exposures inside the limits, the risk takers apply several risk mitigating measures, most notably<br />
the use of<br />
— Portfolio management: Risk diversification arises in portfolios which consist of a variety of positions. Because<br />
some investments are likely to rise in value when others decline, diversification can help to lower the overall<br />
level of risk profile of a portfolio.<br />
— Hedging: Hedging involves taking positions in related financial assets, including derivative products, such as<br />
futures, swaps and options. Hedging activities may not always provide effective mitigation against losses<br />
due to differences in the terms, specific characteristics or other basis risks that may exist between the hedge<br />
instrument and the exposure being hedged.
<strong>Deutsche</strong> <strong>Bank</strong> 01 – Management <strong>Report</strong> 90<br />
Financial <strong>Report</strong> 2010 Risk <strong>Report</strong><br />
In 2010, we continued to invest heavily in our market risk management function and increased our staffing level<br />
by close to 30 %. We have added specific market risk management resources in key asset class areas, further<br />
built out our central teams and established a dedicated change management function.<br />
Trading Market Risk Management Framework at Postbank<br />
The Market Risk Management framework at Postbank is based on the following key principles: In general,<br />
Postbank’s Financial Markets division manages trading market risk centrally based on separately defined risk<br />
limits for <strong>Deutsche</strong> Postbank AG and its foreign subsidiary Luxembourg.<br />
The aggregate limits are set by the Management Board of Postbank and allocated by the Market Risk Committee<br />
to the individual operating units as sub-limits. The allocation mechanism for market risk limits at Postbank<br />
is similar to <strong>Deutsche</strong> <strong>Bank</strong>’s Economic Capital approach. The risk capital limits allocated to specific business<br />
activities represent the level of market risk that is reasonable and desirable for Postbank from an earnings<br />
perspective.<br />
On a day-to-day basis, market risk at Postbank is monitored through a system of limits based on the Value-at-<br />
Risk methodology. In addition, Postbank’s Market Risk Committee has defined sensitivity limits for the trading<br />
and banking book as well as for specific subportfolios.<br />
Quantitative Risk Management Tools<br />
Value-at-Risk at <strong>Deutsche</strong> <strong>Bank</strong> Group (excluding Postbank)<br />
Value-at-risk is a quantitative measure of the potential loss (in value) of trading positions due to market movements<br />
that will not be exceeded in a defined period of time and with a defined confidence level.<br />
Our value-at-risk for the trading businesses is based on our own internal value-at-risk model. In October 1998,<br />
the German <strong>Bank</strong>ing Supervisory Authority (now the BaFin) approved our internal value-at-risk model for calculating<br />
the regulatory market risk capital for our general and specific market risks, which are not applied to Postbank.<br />
Since then the model has been periodically refined and approval has been maintained.<br />
We calculate value-at-risk using a 99 % confidence level and a holding period of one day. This means we estimate<br />
there is a 1 in 100 chance that a mark-to-market loss from our trading positions will be at least as large as the<br />
reported value-at-risk. For regulatory reporting, the holding period is ten days.<br />
We use historical market data to estimate value-at-risk, with an equally-weighted 261 trading day history. The<br />
calculation employs a Monte Carlo Simulation technique, and we assume that changes in risk factors follow a<br />
certain distribution, e.g., normal or logarithmic normal distribution. To determine our aggregated value-at-risk,<br />
we use observed correlations between the risk factors during this 261 trading day period.
<strong>Deutsche</strong> <strong>Bank</strong> 01 – Management <strong>Report</strong> 91<br />
Financial <strong>Report</strong> 2010 Risk <strong>Report</strong><br />
Our value-at-risk model is designed to take into account the following risk factors: interest rates, credit spreads,<br />
equity prices, foreign exchange rates and commodity prices, as well as their implied volatilities and common<br />
basis risk. The model incorporates both linear and, especially for derivatives, nonlinear effects of the risk factors<br />
on the portfolio value.<br />
The value-at-risk measure enables us to apply a constant and uniform measure across all of our trading businesses<br />
and products. It allows a comparison of risk in different businesses, and also provides a means of aggregating<br />
and netting positions within a portfolio to reflect correlations and offsets between different asset<br />
classes. Furthermore, it facilitates comparisons of our market risk both over time and against our daily trading<br />
results.<br />
When using value-at-risk estimates a number of considerations should be taken into account. These include<br />
the following:<br />
— The use of historical market data may not be a good indicator of potential future events, particularly those<br />
that are extreme in nature. This ‘backward-looking’ limitation can cause value-at-risk to understate risk (as in<br />
2008), but can also cause it to be overstated.<br />
— Assumptions concerning the distribution of changes in risk factors, and the correlation between different risk<br />
factors, may not hold true, particularly during market events that are extreme in nature. There is no standard<br />
value-at-risk methodology to follow and different assumptions would produce different results.<br />
— The one day holding period does not fully capture the market risk arising during periods of illiquidity, when<br />
positions cannot be closed out or hedged within one day.<br />
— Value-at-risk does not indicate the potential loss beyond the 99th quantile.<br />
— Intra-day risk is not captured.<br />
— There may be risks in the trading book that are either not or not fully captured by the value-at-risk model.<br />
We continuously analyze potential weaknesses of our value-at-risk model using statistical techniques such as<br />
back-testing, but also rely on risk management experience and expert opinion. Back-testing provides an analysis<br />
of the predictive power of the value-at-risk calculations based on actual experience. We compare the hypothetical<br />
daily profits and losses under the buy-and-hold assumption (in accordance with German regulatory requirements)<br />
with the estimates from our value-at-risk model.<br />
A committee with participation from Market Risk Management, Market Risk Operations, Risk Analytics and<br />
Instruments, Finance and others meets on a quarterly basis to review back-testing results of our Group as a<br />
whole and on individual businesses. The committee analyzes performance fluctuations and assesses the predictive<br />
power of our value-at-risk model, which in turn allows us to improve and adjust the risk estimation<br />
process accordingly.
<strong>Deutsche</strong> <strong>Bank</strong> 01 – Management <strong>Report</strong> 92<br />
Financial <strong>Report</strong> 2010 Risk <strong>Report</strong><br />
We are committed to the ongoing development of our proprietary risk models, and we allocate substantial<br />
resources to reviewing and improving them. Special attention is given to improving those parts of the value-atrisk<br />
model that relate to the areas where losses have been experienced in the recent past. During 2010, improvements<br />
were made to the value-at-risk calculation, including the following:<br />
— Inclusion of Equity Dividend Risk<br />
— Refined methodology for securitization positions<br />
— Inclusion of the market risk of Sal. Oppenheim and BHF-BANK<br />
In addition, we have introduced a process of systematically capturing and evaluating immaterial risks currently<br />
not captured in our value-at-risk model.<br />
Value-at-Risk at Postbank<br />
The Postbank also uses the value-at-risk concept to quantify and monitor the market risk it assumes. Postbank<br />
also uses a Monte Carlo Simulation for calculation of trading book risks across all portfolios, transforming heterogeneous<br />
types of market risk into a single measure of risk. The risk factors taken into account in the value-atrisk<br />
include yield curves, equity prices, foreign exchange rates, and volatilities, along with risks arising from<br />
changes in credit spreads. Correlation effects between the risk factors are derived from historical data.<br />
The Postbank value-at-risk is currently not consolidated into the value-at-risk of the remaining Group.<br />
Economic Capital for Market Risk<br />
Economic capital for market risk measures the amount of capital we need to absorb very severe unexpected<br />
losses arising from our exposures over the period of one year. “Very severe” in this context means that economic<br />
capital is set at a level to cover with a probability of 99.98 % the aggregated unexpected losses within one year.<br />
The market risks from Postbank have been modeled into the Group’s Economic Capital results.<br />
We calculate economic capital using stress tests and scenario analyses. The stress tests are derived from<br />
historically observed severe market shocks. The resulting losses from these stress scenarios are then aggregated<br />
using correlations observed during periods of market crises, to reflect the increase in correlations which<br />
occurs during severe downturns.<br />
The stress tests are augmented by subjective assessments where only limited historical data is available, or<br />
where market developments lead us to believe that historical data may be a poor indicator of possible future<br />
market scenarios.<br />
The calculation of economic capital for market risk from the trading units is performed weekly. The model incorporates<br />
the following risk factors: interest rates, credit spreads, equity prices, foreign exchange rates and<br />
commodity prices. Volatility, credit correlation and common basis risks are also captured.
<strong>Deutsche</strong> <strong>Bank</strong> 01 – Management <strong>Report</strong> 93<br />
Financial <strong>Report</strong> 2010 Risk <strong>Report</strong><br />
During the course of 2010 we also implemented significant methodology enhancements to our economic capital<br />
model, including the following:<br />
— Extension of stress tests for securitization and correlation risk<br />
— Improved granularity for equity dividend and stock borrow risk<br />
— Enhanced coverage of basis risks<br />
Our stress testing results and economic capital estimations are necessarily limited by the number of stress<br />
tests executed and the fact that not all downside scenarios can be predicted and simulated. While our risk<br />
managers have used their best judgment to define worst case scenarios based upon the knowledge of past<br />
extreme market moves, it is possible for our market risk positions to lose more value than even our economic<br />
capital estimates. We also continuously assess and refine our stress tests in an effort to ensure they capture<br />
material risks as well as reflect possible extreme market moves.<br />
Postbank also performs scenario analyses and stress tests in addition to the value-at-risk calculations. The<br />
assumptions underlying the stress tests are validated on an ongoing basis.<br />
Value-at-Risk of Trading Units of Our Corporate & Investment <strong>Bank</strong> Group Division<br />
The following table shows the value-at-risk (with a 99 % confidence level and a one-day holding period) of the<br />
trading units of our Corporate & Investment <strong>Bank</strong> Group Division but excluding the value-at-risk of Postbank.<br />
Our trading market risk outside of these units excluding Postbank is immaterial. “Diversification effect” reflects<br />
the fact that the total value-at-risk on a given day will be lower than the sum of the values-at-risk relating to the<br />
individual risk classes. Simply adding the value-at-risk figures of the individual risk classes to arrive at an aggregate<br />
value-at-risk would imply the assumption that the losses in all risk categories occur simultaneously.<br />
in € m. Dec 31, 2010 Dec 31, 2009<br />
Value-at-risk of trading units<br />
Interest rate risk 77.4 111.0<br />
Equity price risk 21.3 37.0<br />
Foreign exchange risk 29.0 23.9<br />
Commodity price risk 13.3 14.8<br />
Diversification effect (70.1) (65.7)<br />
Total 70.9 121.0<br />
The following table shows the maximum, minimum and average value-at-risk (with a 99 % confidence level and<br />
a one-day holding period) of the trading units of our Corporate & Investment <strong>Bank</strong> Group Division for the periods<br />
specified excluding the value-at-risk of Postbank.<br />
Value-at-risk<br />
of trading<br />
units Total Diversification effect Interest rate risk Equity price risk<br />
Foreign<br />
exchange risk Commodity price risk<br />
in € m. 2010 2009 2010 2009 2010 2009 2010 2009 2010 2009 2010 2009<br />
Average 95.6 126.8 (48.6) (61.6) 86.8 117.6 21.9 26.9 22.9 28.7 12.7 15.1<br />
Maximum 126.4 180.1 (88.5) (112.3) 113.0 169.2 33.6 47.3 46.4 64.4 21.2 34.7<br />
Minimum 67.5 91.9 (26.4) (35.9) 65.8 83.2 13.6 14.5 10.8 11.9 6.2 8.5
<strong>Deutsche</strong> <strong>Bank</strong> 01 – Management <strong>Report</strong> 94<br />
Financial <strong>Report</strong> 2010 Risk <strong>Report</strong><br />
Our value-at-risk for the trading units remained within a band between € 67.5 million and € 126.4 million. The<br />
average value-at-risk in 2010 was € 95.6 million, which is 25 % below the 2009 average of € 126.8 million.<br />
The decrease in average Value-at-Risk observed in 2010 was driven primarily by reduced risk taking and lower<br />
historical volatilities. In addition, the trading business continued with the recalibration of its business model<br />
towards taking less risk in illiquid or complex exposures.<br />
The following table shows the value-at-risk of Postbank’s trading book (with a 99 % confidence level and a oneday<br />
holding period). “Diversification effect” reflects the fact that the total value-at-risk on a given day will be lower<br />
than the sum of the values-at-risk relating to the individual risk classes. Simply adding the value-at-risk figures<br />
of the individual risk classes to arrive at an aggregate value-at-risk would imply the assumption that the losses<br />
in all risk categories occur simultaneously.<br />
in € m. Dec 31, 2010<br />
Value-at-risk of Postbank<br />
Interest rate risk 1.8<br />
Equity price risk 0.2<br />
Foreign exchange risk 0.0<br />
Commodity price risk –<br />
Diversification effect (0.0)<br />
Total 2.0<br />
Regulatory Backtesting of Trading Market Risk<br />
Backtesting is a procedure used to verify the predictive power of the value-at-risk calculations involving the<br />
comparison of hypothetical daily profits and losses under the buy-and-hold assumption with the estimates from<br />
the value-at-risk model. An outlier is a hypothetical buy-and-hold trading loss that exceeds our value-at-risk<br />
estimate. On average, we would expect a 99 percent confidence level to give rise to two to three outliers in any<br />
one year. In our regulatory back-testing in 2010, we observed two outliers compared to one in 2009. Both outliers<br />
occurred in late May following increased market volatility. We continue to believe that, due to the significant<br />
improvement in methodology, calculation parameters and the model performance achieved since the market<br />
turmoil, our value-at-risk model will remain an appropriate measure for our trading market risk under normal<br />
market conditions.
<strong>Deutsche</strong> <strong>Bank</strong> 01 – Management <strong>Report</strong> 95<br />
Financial <strong>Report</strong> 2010 Risk <strong>Report</strong><br />
The following graph shows the daily buy-and-hold trading results in comparison to the value-at-risk as of the<br />
close of the previous business day. Both figures are shown in millions of Euro and exclude the Postbank valueat-risk<br />
calculated on a stand-alone basis.<br />
Buy-and-hold income of Trading Units and Value-at-Risk in 2010<br />
in € m.<br />
200<br />
150<br />
100<br />
50<br />
0<br />
(50)<br />
(100)<br />
(150)<br />
1/10 2/10 3/10 4/10 5/10 6/10 7/10 8/10 9/10 10/10 11/10 12/10<br />
Buy-and-hold income of Trading Units<br />
Value-at-Risk
<strong>Deutsche</strong> <strong>Bank</strong> 01 – Management <strong>Report</strong> 96<br />
Financial <strong>Report</strong> 2010 Risk <strong>Report</strong><br />
Daily Income of our Trading Units in 2010<br />
The following histogram shows the distribution of daily income of our trading units in 2010 (excluding Postbank).<br />
It displays the number of trading days on which we reached each level of trading income shown on the horizontal<br />
axis in millions of euro.<br />
Income of Trading Units in 2010<br />
Days<br />
20<br />
15<br />
10<br />
5<br />
0<br />
In €. Million<br />
(75) to (70)<br />
(70) to (65)<br />
(65) to (60)<br />
(60) to (55)<br />
(55) to (50)<br />
(50) to (45)<br />
(45) to (40)<br />
(40) to (35)<br />
(35) to (30)<br />
(30) to (25)<br />
(25) to (20)<br />
(20) to (15)<br />
(15) to (10)<br />
(10) to (5)<br />
(5) to 0<br />
0 to 5<br />
5 to 10<br />
10 to 15<br />
15 to 20<br />
20 to 25<br />
25 to 30<br />
30 to 35<br />
35 to 40<br />
40 to 45<br />
45 to 50<br />
50 to 55<br />
55 to 60<br />
60 to 65<br />
65 to 70<br />
70 to 75<br />
75 to 80<br />
80 to 85<br />
85 to 90<br />
90 to 95<br />
95 to 100<br />
100 to 105<br />
105 to 110<br />
110 to 115<br />
115 to 120<br />
120 to 125<br />
125 to 130<br />
130 to 135<br />
135 to 140<br />
140 to 145<br />
145 to 150<br />
150 to 155<br />
155 to 160<br />
160 to 165<br />
Over 165<br />
Our trading units achieved a positive actual income for 92 % of the trading days in 2010 (versus 91 % in 2009).<br />
Economic Capital Usage for our Trading Market Risk<br />
The economic capital usage for market risk arising from the trading units totaled € 6.4 billion at year-end 2010<br />
compared with € 4.6 billion at year-end 2009. Traded default risk increased by € 1.0 billion primarily from model<br />
refinements and more conservative liquidity assumptions. Traded market risk increased by € 0.8 billion, driven<br />
by model improvements with some partial offset from a reduction in legacy credit exposure. Postbank’s contribution<br />
to our economic capital usage for our trading market risk was minimal.
<strong>Deutsche</strong> <strong>Bank</strong> 01 – Management <strong>Report</strong> 97<br />
Financial <strong>Report</strong> 2010 Risk <strong>Report</strong><br />
Nontrading Market Risk Management<br />
Our Nontrading Market Risk Management units oversee a number of risk exposures resulting from various<br />
business activities and initiatives. Due to the complexity and variety of risk characteristics in the area of nontrading<br />
market risks, the responsibility of risk management is split into three teams:<br />
— The Nontrading Market Risk Management team within our Market Risk Management function covers market<br />
risks in PBC, GTB, PWM and Corporate Investments as well as structural foreign exchange risks, equity<br />
compensation risks and pension risks.<br />
— The Principal Investments team within our Credit Risk Management function is specialized in risk-related<br />
aspects of our nontrading alternative asset activities and performs monthly reviews of the risk profile of the<br />
nontrading alternative asset portfolios.<br />
— The Asset Management Risk unit within our Credit Risk Management function is specialized in risk-related<br />
aspects of our asset and fund management business. Noteworthy risks in this area arise, for example, from<br />
performance and/or principal guarantees and reputational risk related to managing client funds.<br />
The consolidation of Postbank in December 2010 has resulted in a significant change in our equity risk profile<br />
from nontrading activities. Previously an economic capital charge was calculated to our Strategic Investment<br />
Portfolio purely based on the size of our minority stake. Since consolidation, economic capital for all risk categories<br />
(credit risk, trading and nontrading market risk, operational risk and business risk) of the <strong>entire</strong> Postbank<br />
is included in our reporting.<br />
The majority of the interest rate and foreign exchange risks arising from <strong>Deutsche</strong> <strong>Bank</strong>’s nontrading asset and<br />
liability positions, excluding Postbank, has been transferred through internal hedges to trading books within the<br />
Corporate & Investment <strong>Bank</strong> and is thus reflected and managed through the value-at-risk numbers. Of the<br />
remaining risks that have not been transferred through those hedges foreign exchange risk is mitigated through<br />
match funding the investment in the same currency and only residual risk remains in the portfolios. For these<br />
residual positions there is immaterial interest rate risk remaining from the mismatch between the funding term<br />
and the expected maturity of the investment. In contrast to above approach, Postbank carries the majority of its<br />
open interest rate risk in the banking book. While this interest rate position is material on a Postbank standalone<br />
basis, the impact is immaterial when aggregated with <strong>Deutsche</strong> <strong>Bank</strong>’s risk positions.<br />
However, there is an important exception with respect to foreign exchange risk, which we refer to as structural<br />
foreign exchange risk exposure. This exposure arises from capital and retained earnings in non Euro currencies<br />
in certain subsidiaries, mainly U.S. and U.K. entities and represents the bulk of foreign exchange risk in our<br />
nontrading portfolio.<br />
In addition to the above risks, our Nontrading Market Risk Management function also has the mandate to monitor<br />
and manage risks arising from our equity compensation plans and pension liabilities. It also manages risks<br />
related to asset management activities, primarily resulting from guaranteed funds. Moreover, our PBC, GTB<br />
and PWM businesses are subject to modeling risk with regard to client deposits. This risk materializes if client<br />
behavior in response to interest rate movements deviates substantially from the historical norm.
<strong>Deutsche</strong> <strong>Bank</strong> 01 – Management <strong>Report</strong> 98<br />
Financial <strong>Report</strong> 2010 Risk <strong>Report</strong><br />
The Capital and Risk Committee supervises our nontrading market risk exposures. Investment proposals for<br />
strategic investments are analyzed by the Group Investment Committee. Depending on the size, any strategic<br />
investment requires approval from the Group Investment Committee, the Management Board or the Supervisory<br />
Board. The development of strategic investments is monitored by the Group Investment Committee on a regular<br />
basis. Multiple members of the Capital and Risk Committee are also members of the Group Investment Committee,<br />
ensuring a close link between both committees.<br />
Assessment of Market Risk in Our Nontrading Portfolios<br />
Due to the generally static nature of these positions we do not use value-at-risk to assess the market risk in our<br />
nontrading portfolios. Rather, we assess the risk through the use of stress testing procedures that are particular<br />
to each risk class and which consider, among other factors, large historically observed market moves and the<br />
liquidity of each asset class as well as changes in client behavior in relation to deposit products. This assessment<br />
forms the basis of our economic capital calculations which enable us to actively monitor and manage our nontrading<br />
market risk. As of year-end 2009 several enhancements to the economic capital coverage across the<br />
nontrading market risk portfolio were introduced. In 2010 the nontrading market risk economic capital coverage<br />
has been completed with the addition of an economic capital charge for <strong>Deutsche</strong> <strong>Bank</strong>’s pension risks.<br />
Economic Capital Usage for Our Nontrading Market Risk Portfolios per Business Area<br />
The table below shows the economic capital usages for our nontrading portfolios by business division and<br />
includes the economic capital usage of the Postbank calculated using our methodology.<br />
in € m. Dec 31, 2010 Dec 31, 2009<br />
Economic capital usage for our nontrading portfolios<br />
CIB 1,351 890<br />
PCAM 3,524 2,246<br />
Corporate Investments 1,051 5,043<br />
Consolidation & Adjustments 814 (277)<br />
Total 6,740 7,902<br />
The increase in CIB of € 461 million was driven by various new investments.<br />
The most significant changes in 2010 were driven by the full consolidation of Postbank which led to an overall<br />
reduction of the nontrading economic capital by € 3.3 billion. In this process, the economic capital charge for<br />
Postbank was transferred from Corporate Investments (€ 4.3 billion) to Private & Business Clients (€ 1 billion).<br />
In addition the newly integrated business of Sal. Oppenheim also led to an increase of € 313 million in PCAM.<br />
The major change in Consolidation & Adjustments was driven by an increase of structural foreign exchange risk<br />
of € 625 million.
<strong>Deutsche</strong> <strong>Bank</strong> 01 – Management <strong>Report</strong> 99<br />
Financial <strong>Report</strong> 2010 Risk <strong>Report</strong><br />
Carrying Value and Economic Capital Usage for Our Nontrading Market Risk Portfolios<br />
The table below shows the carrying values and economic capital usages separately for our nontrading portfolios.<br />
Carrying value Economic capital usage<br />
in € bn. Dec 31, 2010 Dec 31, 2009 Dec 31, 2010 Dec 31, 2009<br />
Nontrading portfolios<br />
Strategic Investments 1.8 7.6 0.6 4.9<br />
Major Industrial Holdings 1 0.2 0.2 – –<br />
Other Corporate Investments 4.4 0.9 1.8 0.2<br />
thereof: newly integrated businesses 2.6 – 1.3 –<br />
Alternative Assets 4.4 3.8 1.6 1.3<br />
Principal Investments 2.0 2.0 0.7 0.7<br />
Real Estate 2.3 1.7 0.9 0.6<br />
Hedge Funds 2 0.1 0.1 – –<br />
Other nontrading market risks 3 N/A N/A 2.7 1.5<br />
Total 10.8 12.5 6.7 7.9<br />
1 There is a small economic capital usage of € 4 million as of December 31, 2010 and of € 28 million as of December 31, 2009.<br />
2 There is a small economic capital usage of € 13 million as of December 31, 2010 and of € 17 million as of December 31, 2009.<br />
3 N/A indicates that the risk is mostly related to off-balance sheet and liability items.<br />
Our economic capital usage for these nontrading market risk portfolios totaled € 6.7 billion at year-end 2010,<br />
which is € 1.2 billion, or 15 %, below our economic capital usage at year-end 2009.<br />
— Strategic Investments. Our economic capital usage of € 0.6 billion as of December 31, 2010 was mainly<br />
driven by our participations in Hua Xia <strong>Bank</strong> Company Limited and Abbey Life Assurance Company.<br />
— Major Industrial Holdings. Our economic capital usage was € 4 million as of December 31, 2010. Most of the<br />
Major Industrial Holdings have been divested in prior years and accordingly the remaining positions no longer<br />
attract a material amount of economic capital.<br />
— Other Corporate Investments. Our economic capital usage was € 1.8 billion for our other corporate investments<br />
at year-end 2010. A total of € 1.3 billion of the overall increase of € 1.6 billion results from newly integrated<br />
businesses of Postbank and Sal. Oppenheim/BHF-BANK. The economic capital has been aligned<br />
with <strong>Deutsche</strong> <strong>Bank</strong>’s economic capital methodology. Newly included in this category is a restructured subordinated<br />
loan facility with significant equity characteristics, which contributed € 253 million to economic<br />
capital after diversification.<br />
— Alternative assets. Our alternative assets portfolio includes principal investments, real estate investments<br />
(including mezzanine debt) and small investments in hedge funds. Principal investments are composed of<br />
direct investments in private equity, mezzanine debt, short-term investments in financial sponsor leveraged<br />
buy-out funds, bridge capital to leveraged buy-out funds and private equity led transactions. The alternative<br />
assets portfolio has some concentration in infrastructure and real estate assets. While recent market conditions<br />
have limited the opportunities to sell down the portfolio, our intention remains to do so, provided suitable<br />
conditions allow it.
<strong>Deutsche</strong> <strong>Bank</strong> 01 – Management <strong>Report</strong> 100<br />
Financial <strong>Report</strong> 2010 Risk <strong>Report</strong><br />
— Other nontrading market risks:<br />
— Interest Rate Risk. This is mainly driven by maturity transformation of contractually short term deposits.<br />
The effective duration of contractually short term deposits is based upon observable client behavior,<br />
elasticity of deposit rates to market interest rates (DRE), volatility of deposit balances and <strong>Deutsche</strong><br />
<strong>Bank</strong>’s own credit spread. Economic capital is derived by stressing modeling assumptions – in particular<br />
the DRE – for the effective duration of overnight deposits. Our economic capital usage was € 435 million<br />
as of December 31, 2010 and was mainly driven by PBC including DB Bauspar. Behavioral and economic<br />
characteristics are taken into account when calculating the effective duration and optional exposures<br />
from our mortgages business.<br />
— Equity compensation. Risk arising from structural short position in our own share price arising from restricted<br />
equity units. Our economic capital usage was € (272) million as of December 31, 2010, on a<br />
diversified basis. The negative contribution to our diversified economic capital was derived from the fact<br />
that a reduction of our share price in a downside scenario as expressed by economic capital calculation<br />
methodology would reduce the negative impact on our capital position from the equity compensation<br />
liabilities.<br />
— Pension risk. Risk arising from our defined benefit obligations, including interest rate risk and inflation risk,<br />
credit spread risk, equity risk and longevity risk. Our economic capital usage, excluding Postbank, was<br />
€ 146 million as of December 31, 2010. The economic capital charge allocated at DB Group level for<br />
respective pension risks of Postbank amounted to € 33 million.<br />
— Structural Foreign Exchange Risk. Our foreign exchange exposure arising from unhedged capital and<br />
retained earnings in non-euro currencies in certain subsidiaries. Our economic capital usage was<br />
€ 927 million as of December 31, 2010 on a diversified basis.<br />
— Asset Management’s Guaranteed Funds. Our economic capital usage was € 1.4 billion as of December<br />
31, 2010.<br />
Our total economic capital figures for nontrading market risk currently do not take into account diversification<br />
benefits between the asset categories except for those of equity compensation and structural foreign exchange<br />
risk and pension risk.
<strong>Deutsche</strong> <strong>Bank</strong> 01 – Management <strong>Report</strong> 101<br />
Financial <strong>Report</strong> 2010 Risk <strong>Report</strong><br />
Operational Risk<br />
Organizational Structure<br />
The Head of Operational Risk & Business Continuity Management chairs the Operational Risk Management<br />
Committee, which is a permanent sub-committee of the Risk Executive Committee and is composed of the<br />
operational risk officers from our business divisions and our infrastructure functions. It is the main decisionmaking<br />
committee for all operational risk management matters.<br />
While the day-to-day operational risk management lies with our business divisions and infrastructure functions,<br />
the Operational Risk & Business Continuity Management function manages the cross divisional and cross<br />
regional operational risk as well as risk concentrations and ensures a consistent application of our operational<br />
risk management strategy across the bank. Based on this Business Partnership Model, which is also shown in<br />
the chart below, we ensure close monitoring and high awareness of operational risk.<br />
Business Partnership Model of Operational Risk Management<br />
Daily Execution<br />
– Part of business lines<br />
– Daily Risk Management<br />
– Implementation of<br />
ORM Framework<br />
Business Partners<br />
Divisional OR Teams<br />
Independent central<br />
ORM function (ORBCM)<br />
Strategy<br />
<strong>Report</strong>ing<br />
Target Setting<br />
ORM Framework<br />
AMA Capital Calculation<br />
Monitoring<br />
Testing and verification<br />
by: Audit, Compliance,<br />
Legal, Finance<br />
and others<br />
Control Groups<br />
Functional OR Teams
<strong>Deutsche</strong> <strong>Bank</strong> 01 – Management <strong>Report</strong> 102<br />
Financial <strong>Report</strong> 2010 Risk <strong>Report</strong><br />
Managing Our Operational Risk<br />
We manage operational risk based on a Group-wide consistent framework that enables us to determine our<br />
operational risk profile in comparison to our risk appetite and systematically identify operational risk themes<br />
and concentrations to define risk mitigating measures and priorities.<br />
We apply a number of techniques to efficiently manage the operational risk in our business, for example:<br />
— We perform systematic risk analyses, root cause analyses and lessons learned activities for events above<br />
€ 1 million to identify inherent areas of risk and to define appropriate risk mitigating actions which are monitored<br />
for resolution. The prerequisite for these detailed analyses and the timely information of our senior<br />
management on the development of the operational risk events and on single larger events is the continuous<br />
collection of all losses above € 10,000 arising from operational risk events in our “db-Incident <strong>Report</strong>ing<br />
System”.<br />
— We systematically utilize information on external events occurring in the banking industry to ensure that<br />
similar incidents will not happen to us.<br />
— Key Risk Indicators (“KRI”) are used to alert the organization to impending problems in a timely fashion.<br />
They allow the monitoring of the bank’s control culture as well as the operational risk profile and trigger risk<br />
mitigating actions. Within the KRI program we capture data at a granular level allowing for business environment<br />
monitoring and facilitating the forward looking management of operational risk based on early<br />
warning signals returned by the KRIs. We capture and monitor key operational risk indicators in our tool<br />
“db-Score”.<br />
— In our bottom-up Risk and Control Self Assessment (“RCSA”) process, which is conducted at least annually,<br />
areas with high risk potential are highlighted and risk mitigating measures to resolve issue are identified. In<br />
general, RCSAs are performed in our tool “db-SAT”. On a regular basis we conduct country risk workshops<br />
aiming to evaluate risks specific to countries and local legal entities we are operating in and take appropriate<br />
risk mitigating actions.<br />
— We conduct scenario analysis to amend internal and external loss information and derive actions from them.<br />
We also conduct stress testing on a regular basis to analyze the impact of extreme situations on our capital<br />
and the profit-and-loss account.<br />
— Regular operational risk profile reports at Group level for our business divisions, the countries we are operating<br />
in and our infrastructure functions are reviewed and discussed with the department’s senior management.<br />
The regular performance of the risk profile reviews enables us to early detect changes to the units risk<br />
profile as well as risk concentrations across the Group and to take corrective actions.<br />
— We assess the impact of changes to the Group’s risk profile as a result of new products, outsourcings and<br />
acquisitions.<br />
— Within our tracking tool “db-Track” we monitor risk mitigating measures identified via these techniques for<br />
resolution.<br />
— Due to the heterogeneous nature of operational risks in certain cases operational risks cannot be fully mitigated.<br />
In such cases operational risks are mitigated following the “as low as reasonably possible” principle<br />
by balancing the cost of mitigation with the benefits thereof and formally accepting the residual risk.<br />
— We perform top risk analyses in which the results of the aforementioned activities are considered. The top<br />
risk analyses mainly contribute into the annual operational risk management strategy and planning process.<br />
Besides the operational risk management strategic and tactical planning we define capital and expected<br />
loss targets which are monitored on a regular basis within the quarterly forecasting process.
<strong>Deutsche</strong> <strong>Bank</strong> 01 – Management <strong>Report</strong> 103<br />
Financial <strong>Report</strong> 2010 Risk <strong>Report</strong><br />
Measuring Our Operational Risks<br />
In 2010 we have integrated into our operational risk management processes Sal. Oppenheim (except for those<br />
parts which are in the process of being sold) and the commercial banking activities in the Netherlands acquired<br />
from ABN AMRO as well as Dresdner <strong>Bank</strong>’s global Agency Securities Lending business. Although Postbank<br />
manages its own operational risk, Postbank has also already been integrated into our economic capital calculation<br />
on a basis consistent with <strong>Deutsche</strong> <strong>Bank</strong> methodology. Limitations in data availability, however, may lead to<br />
portfolio effects that are not fully estimated and thereby resulting in over- or underestimation. The table below<br />
shows the economic capital usages for operational risk of our business segments for the periods specified.<br />
in € m. Dec 31, 2010 Dec 31, 2009<br />
Economic capital usage (for operational risk)<br />
CIB 2,735 2,822<br />
PCAM 939 654<br />
CI 8 17<br />
Total 3,682 3,493<br />
Economic capital usage for operational risk increased by € 189 million, or 5 %, to € 3.7 billion as of December<br />
31, 2010. The higher economic capital usage driven by acquisitions (Postbank, BHF-BANK, parts of the commercial<br />
banking activities in the Netherlands acquired from ABN AMRO and Sal. Oppenheim) was only partially<br />
offset by lower loss frequencies due to proactive operational risk management.<br />
We calculate and measure the economic and regulatory capital for operational risk using the internal AMA<br />
methodology. Economic capital is derived from the 99.98 % quantile and allocated to the businesses and used<br />
in performance measurement and resource allocation, providing an incentive to manage operational risk, optimizing<br />
economic capital utilization. The regulatory capital operational risk applies the 99.9 % quantile. Our<br />
internal AMA capital calculation is based upon the loss distribution approach. Gross losses adjusted for direct<br />
recoveries from historical internal and external loss data (Operational Riskdata eXchange Association (ORX)<br />
consortium data and a public database), plus scenario data are used to estimate the risk profile (that is, a loss<br />
frequency and a loss severity distribution). Thereafter, the frequency and severity distributions are combined in<br />
a Monte Carlo Simulation to generate losses over a one year time horizon. Finally, the risk mitigating benefits<br />
of insurance are applied to each loss generated in the Monte Carlo Simulation. Correlation and diversification<br />
benefits are applied to the net losses in a manner compatible with regulatory requirements to arrive at a net loss<br />
distribution at the Group level covering expected and unexpected losses. Capital is then allocated to each of<br />
the business divisions and both a qualitative adjustment (“QA”) and an expected losses deduction are made.
<strong>Deutsche</strong> <strong>Bank</strong> 01 – Management <strong>Report</strong> 104<br />
Financial <strong>Report</strong> 2010 Risk <strong>Report</strong><br />
The QA reflects the effectiveness and performance of the day-to-day operational risk management activities<br />
via KRIs and RCSAs focusing on the business environment and internal control factors. QA is applied as a<br />
percentage adjustment to the final capital number. This approach makes qualitative adjustment transparent to<br />
the management of the businesses and provides feedback on their risk profile as well as on the success of<br />
their management of operational risk. It thus provides incentives for the businesses to continuously improve<br />
Operational Risk Management in their areas.<br />
The expected loss for operational risk is based on historical loss experience and expert judgment considering<br />
business changes denoting the expected cost of operational losses for doing business. To the extent it is considered<br />
in the divisional business plans it is deducted from the AMA capital figure.<br />
The unexpected losses for the business divisions (after QA and expected loss) are aggregated to produce the<br />
Group AMA capital figure.<br />
Since 2008, we have maintained approval by the BaFin to use the AMA. We are waiting for regulatory approval<br />
to integrate Postbank into our regulatory capital calculation.<br />
Our Operational Risk Management Stress Testing Concept<br />
Within our Stress Testing concept we ensure that operational risks are sufficiently and adequately stressed.<br />
Our AMA methodology already incorporates stress testing elements such as external data containing extreme<br />
data points and an over 25 year loss history both used to model the severity distribution. Additionally, we perform<br />
complementary sensitivity analysis and contribute to firm wide stress tests including reverse stress testing.<br />
Role of Corporate Insurance/Deukona<br />
The definition of our insurance strategy and supporting insurance policy and guidelines is the responsibility of<br />
our specialized unit Corporate Insurance/Deukona (“CI/D”). CI/D is responsible for our global corporate insurance<br />
policy which is approved by our Management Board.<br />
CI/D is responsible for acquiring insurance coverage and for negotiating contract terms and premiums. CI/D<br />
also has a role in the allocation of insurance premiums to the businesses. CI/D specialists assist in devising the<br />
method for reflecting insurance in the capital calculations and in arriving at parameters to reflect the regulatory<br />
requirements. They validate the settings of insurance parameters used in the AMA model and provide respective<br />
updates. CI/D is actively involved in industry efforts to reflect the effect of insurance in the results of the capital<br />
calculations.<br />
We buy insurance in order to protect ourselves against unexpected and substantial unforeseeable losses. The<br />
identification, definition of magnitude and estimation procedures used are based on the recognized insurance<br />
terms of “common sense”, “state-of-the-art” and/or “benchmarking”. The maximum limit per insured risk takes<br />
into account the reliability of the insurer and a cost/benefit ratio, especially in cases in which the insurance market<br />
tries to reduce coverage by restricted/limited policy wordings and specific exclusions.
<strong>Deutsche</strong> <strong>Bank</strong> 01 – Management <strong>Report</strong> 105<br />
Financial <strong>Report</strong> 2010 Risk <strong>Report</strong><br />
We maintain a number of captive insurance companies, both primary and re-insurance companies. However,<br />
insurance contracts provided are only considered in the modeling/calculation of insurance-related reductions of<br />
operational risk capital requirements where the risk is re-insured in the external insurance market.<br />
The regulatory capital figure includes a deduction for insurance coverage amounting to € 467 million. Currently,<br />
no other risk transfer techniques beyond insurance are recognized in the AMA model.<br />
CI/D selects insurance partners in strict compliance with the regulatory requirements specified in the Solvency<br />
Regulations and the Operational Risks Experts Group recommendation on the recognition of insurance in<br />
advanced measurement approaches. The insurance portfolio, as well as CI/D activities are audited by Group<br />
Audit on a periodic basis.<br />
Operational Risk at Postbank<br />
Postbank’s approach to Operational Risk Management is largely comparable to <strong>Deutsche</strong> <strong>Bank</strong>’s approach.<br />
The Management Board of the Postbank is solely responsible for the management, control, and monitoring of<br />
operational risk. The Operational Risk Committee (ORK) commissioned by the Postbank Management Board<br />
defines the strategy and framework for controlling operational risk. Day-to-day management of operational risk<br />
is the responsibility of the individual units within the Postbank. Strategic parameters for managing operational<br />
risk, both qualitative as well as quantitative, are part of the overall strategy.<br />
At Postbank the economic capital requirements for operational risk both for the Postbank as a whole and for<br />
the four business divisions individually have been determined using a standalone internal capital model to<br />
calculate capital requirements for operational risk. Postbank received the approval by the BaFin for their AMA<br />
in December 2010.<br />
Within the consolidation of Postbank the results of the economic capital requirements for operational risk have<br />
been recalculated using <strong>Deutsche</strong> <strong>Bank</strong>’s economic capital methodology for operational risk based upon pooled<br />
data from <strong>Deutsche</strong> <strong>Bank</strong> Group and Postbank and are reported in aggregate in section “Overall Risk Position”<br />
of this report.<br />
Liquidity Risk at <strong>Deutsche</strong> <strong>Bank</strong> Group (excluding Postbank)<br />
Liquidity risk management safeguards our ability to meet all payment obligations when they come due. Our<br />
liquidity risk management framework has been an important factor in maintaining adequate liquidity and in<br />
managing our funding profile during 2010.<br />
Liquidity Risk Management Framework<br />
The Management Board defines our liquidity risk strategy, and in particular our tolerance for liquidity risk based<br />
on recommendations made by Treasury and the Capital and Risk Committee. At least once every year the<br />
Management Board will review and approve the limits which are applied to the Group to measure and control<br />
liquidity risk as well as the <strong>Bank</strong>’s long-term funding and issuance plan.
<strong>Deutsche</strong> <strong>Bank</strong> 01 – Management <strong>Report</strong> 106<br />
Financial <strong>Report</strong> 2010 Risk <strong>Report</strong><br />
Our Treasury function is responsible for the management of liquidity and funding risk of <strong>Deutsche</strong> <strong>Bank</strong> globally<br />
as defined in the liquidity risk strategy. Our liquidity risk management framework is designed to identify, measure<br />
and manage the liquidity risk position of the Group. Treasury reports the <strong>Bank</strong>’s overall liquidity and funding to<br />
the Management Board at least weekly via a Liquidity Scorecard. Our liquidity risk management approach<br />
starts at the intraday level (operational liquidity) managing the daily payments queue, forecasting cash flows<br />
and factoring in our access to Central <strong>Bank</strong>s. It then covers tactical liquidity risk management dealing with<br />
access to secured and unsecured funding sources. Finally, the strategic perspective comprises the maturity<br />
profile of all assets and liabilities (Funding Matrix) and our issuance strategy.<br />
Our cash-flow based reporting system provides daily liquidity risk information to global and regional management.<br />
Stress testing and scenario analysis plays a central role in our liquidity risk management framework. This also<br />
incorporates an assessment of asset liquidity, i.e. the characteristics of our asset inventory, under various stress<br />
scenarios as well as contingent funding requirements from off-balance-sheet commitments. The monthly stress<br />
testing results are used in setting our short-term wholesale funding limits (both unsecured and secured) and<br />
thereby ensuring we remain within the Board’s overall liquidity risk tolerance.<br />
Short-term Liquidity and Wholesale Funding<br />
Our Group-wide reporting system tracks all contractual cash flows from wholesale funding sources on a daily<br />
basis over a 12-month horizon. The system captures all cash flows from unsecured as well as from secured<br />
funding transactions. Wholesale funding limits, which are calibrated against our stress testing results and approved<br />
by the Management Board, express our maximum tolerance for liquidity risk. These limits apply to the<br />
respective cumulative global cash outflows and are monitored on a daily basis. Our liquidity reserves are the<br />
primary mitigant against stresses in short-term wholesale funding markets. At an individual entity level we may<br />
set liquidity outflow limits across a broader range of cash flows where this is considered to be meaningful or<br />
appropriate.<br />
Unsecured Funding<br />
Unsecured funding is a finite resource. Total unsecured funding represents the amount of external liabilities<br />
which we take from the market irrespective of instrument, currency or tenor. Unsecured funding is measured<br />
on a regional basis and aggregated to a global utilization report. As part of the overall Liquidity Risk Strategy,<br />
the management board approves limits to protect our access to unsecured funding at attractive levels.<br />
Funding Diversification<br />
Diversification of our funding profile in terms of investor types, regions, products and instruments is an important<br />
element of our liquidity risk management framework. Our core funding resources come from retail clients, longterm<br />
capital markets investors and transaction banking clients. Other customer deposits and borrowing from<br />
wholesale clients are additional sources of funding. We use wholesale deposits primarily to fund liquid assets.<br />
To ensure the additional diversification of its refinancing activities, we have a Pfandbrief license allowing us to<br />
issue mortgage Pfandbriefe.
<strong>Deutsche</strong> <strong>Bank</strong> 01 – Management <strong>Report</strong> 107<br />
Financial <strong>Report</strong> 2010 Risk <strong>Report</strong><br />
In 2010 we continued to focus on increasing our stable core funding components, while maintaining access to<br />
short-term wholesale funding markets, albeit on a relatively low level. The volume of discretionary wholesale<br />
funding is well diversified across products (e.g. CD, CP as well as term, call and overnight deposits) and tenors.<br />
The acquisition of Postbank significantly increased the volume of our most stable funding sources. Postbank’s<br />
status as a regulated bank and publicly traded company, however, may limit our access to its liquidity.<br />
The overall volume of discretionary wholesale funding and secured funding fluctuated between reporting dates<br />
based on our underlying business activities. Higher volumes, primarily in secured funding transactions, are<br />
largely driven by increased client related securities financing activities as well as intra quarter growth in liquid<br />
trading inventories. The growth in discretionary wholesale funding during the year 2010 is mainly a reflection of<br />
the growth in cash and liquid trading assets within our Corporate <strong>Bank</strong>ing & Securities Corporate Division.<br />
To avoid any unwanted reliance on these short-term funding sources, and to ensure a sound funding profile at<br />
the short end, which complies with the defined risk tolerance, we have implemented limit structures (across tenor)<br />
to these funding sources, which are derived from our stress testing analysis.
<strong>Deutsche</strong> <strong>Bank</strong> 01 – Management <strong>Report</strong> 108<br />
Financial <strong>Report</strong> 2010 Risk <strong>Report</strong><br />
The following chart shows the composition of our external funding sources (on a consolidated basis with the<br />
contribution from Postbank separately identified) that contribute to the liquidity risk position as of December 31,<br />
2010 and December 31, 2009, both in euro billion and as a percentage of our total external funding sources.<br />
Composition of external funding sources<br />
In € bn.<br />
300<br />
225<br />
150<br />
75<br />
0<br />
42<br />
180<br />
164<br />
169<br />
153<br />
11<br />
120<br />
100<br />
108<br />
21% 21% 26% 20% 12% 13% 10% 15% 10% 7% 19% 21% 3% 3%<br />
Capital Markets<br />
and Equity<br />
111<br />
Retail Transaction<br />
<strong>Bank</strong>ing<br />
Funding Matrix<br />
We map all funding-relevant assets and all liabilities into time buckets corresponding to their economic maturities<br />
to compile a maturity profile (funding matrix). Given that trading assets are typically more liquid than their<br />
contractual maturities suggest, we determine individual liquidity profiles reflecting their relative liquidity value.<br />
We take assets and liabilities from the retail bank that show a behavior of being renewed or prolonged regardless<br />
of capital market conditions (mortgage loans and retail deposits) and assign them to time buckets reflecting<br />
the expected prolongation. Wholesale banking products are included with their contractual maturities.<br />
The funding matrix identifies the excess or shortfall of assets over liabilities in each time bucket, facilitating<br />
management of open liquidity exposures. The funding matrix analysis together with the strategic liquidity planning<br />
process, which forecasts the funding supply and demand across business units, provides the key input parameter<br />
for our annual capital market issuance plan. Upon approval by the Capital and Risk Committee and the Management<br />
Board the capital market issuance plan establishes issuing targets for securities by tenor, volume and<br />
instrument. As per the year-end 2010, we were long funded in each of the annual time buckets of the funding<br />
matrix (2-10 years).<br />
118<br />
Other<br />
Customers*<br />
7<br />
97<br />
51<br />
Discretionary<br />
Wholesale<br />
6<br />
196<br />
165<br />
Secured Funding<br />
and Shorts<br />
29<br />
26<br />
Financing<br />
Vehicles**<br />
December 31, 2010: <strong>Deutsche</strong> <strong>Bank</strong> € 897 billion, Postbank € 178 billion: total €1,075 billion<br />
December 31, 2009: total € 777 billion<br />
* Other includes fiduciary, self-funding structures (e.g. X-markets), margin / Prime Brokerage cash balances (shown on a net basis).<br />
** Includes ABCP-Conduits.<br />
Note: Reconciliation to total balance sheet: Derivatives & settlement balances EUR 706 billion (EUR 620 billion), add-back for netting effect for<br />
Margin & Prime Brokerage cash balances (shown on a net basis) EUR 61 billion (EUR 51 billion), other non-funding liabilities EUR 63 billion (EUR 53 billion)<br />
for December 31, 2010 and December 31, 2009 respectively; figures may not add up due to rounding.
<strong>Deutsche</strong> <strong>Bank</strong> 01 – Management <strong>Report</strong> 109<br />
Financial <strong>Report</strong> 2010 Risk <strong>Report</strong><br />
In 2010, Treasury issued capital market instruments with a total value of approximately € 22.9 billion, € 3.9 billion<br />
more than the original issuance plan.<br />
For information regarding the maturity profile of our long-term debt, please refer to Note 30 “Long-Term Debt<br />
and Trust Preferred Securities” of our consolidated financial statements.<br />
Transfer Pricing<br />
We operate a transfer pricing framework that applies to all businesses and ensures that pricing is made of (i)<br />
assets in accordance with their underlying liquidity risk, (ii) liabilities in accordance with their funding maturity<br />
and (iii) contingent liquidity exposures in accordance with the cost of providing for commensurate liquidity<br />
reserves to fund unexpected cash requirements.<br />
Within this transfer pricing framework we allocate funding and liquidity risk costs and benefits to the firm’s business<br />
units and set financial incentives in line with the firm’s liquidity risk guidelines. Transfer prices are subject to<br />
liquidity (term) premiums depending on market conditions. Liquidity premiums are set by Treasury and picked<br />
up by a segregated liquidity account. The Treasury liquidity account is the aggregator of long-term liquidity<br />
costs. The management and cost allocation of the liquidity account is the key variable for transfer pricing funding<br />
costs within <strong>Deutsche</strong> <strong>Bank</strong>.<br />
Stress Testing and Scenario Analysis<br />
We use stress testing and scenario analysis to evaluate the impact of sudden stress events on our liquidity<br />
position. The scenarios we apply have been based on historic events, such as the 1987 stock market crash,<br />
the 1990 U.S. liquidity crunch and the September 2001 terrorist attacks, liquidity crisis case studies and hypothetical<br />
events.<br />
Also incorporated are the lessons learned from the latest financial markets crisis. They include the prolonged<br />
term money-market and secured funding freeze, collateral repudiation, reduced fungibility of currencies, stranded<br />
syndications as well as other systemic knock-on effects. The scenario types cover institution-specific events<br />
(e.g. rating downgrade), market related events (e.g. systemic market risk) as well as a combination of both,<br />
which links a systemic market shock with a multi-notch rating downgrade.<br />
Under each of these scenarios we assume that all maturing loans to customers will need to be rolled over and<br />
require funding whereas rollover of liabilities will be partially impaired resulting in a funding gap. In addition we<br />
analyze the potential funding requirements from off-balance sheet commitments (e.g. drawings of credit facilities<br />
and increased collateral requirements) which could materialize under stress. We then model the steps we would<br />
take to counterbalance the resulting net shortfall in funding. Countermeasures would include the Group’s unencumbered<br />
business asset inventory, the available long cash balance (over and above cash balances which<br />
form an integral part of our existing clearing and settlement activities), as well as our strategic liquidity reserve.
<strong>Deutsche</strong> <strong>Bank</strong> 01 – Management <strong>Report</strong> 110<br />
Financial <strong>Report</strong> 2010 Risk <strong>Report</strong><br />
The asset liquidity analysis thereby forms an integral piece of stress testing and tracks the volume and booking<br />
location within our consolidated business inventory of unencumbered, liquid assets which we can use to raise<br />
liquidity via secured funding transactions. Securities inventories include a wide variety of different securities. As<br />
a first step, we segregate illiquid and liquid securities in each inventory. Subsequently we assign liquidity values<br />
(haircuts) to different classes of liquid securities. The liquidity of these assets is an important element in protecting<br />
us against short-term liquidity squeezes.<br />
In addition the bank maintains sizeable cash balances, primarily with central banks, which are held in excess of<br />
the collateral which is required to support our clearing activities in euro, U.S. dollars and other currencies<br />
around the globe.<br />
As a separate countermeasure we hold a dedicated strategic liquidity reserve containing highly liquid and central<br />
bank eligible securities in major currencies around the world to support our liquidity profile in case of potential<br />
deteriorating market conditions. The volume of the strategic liquidity reserve is the function of expected stress<br />
result. Size and composition are subject to regular senior management review.<br />
The most immediately liquid and highest quality items within the above three categories are aggregated and<br />
separately identified as our Liquidity Reserves. These Reserves comprise available cash and highly liquid<br />
government securities and other central bank eligible assets. As of December 31, 2010 our Liquidity Reserves<br />
exceeded € 145 billion.<br />
Stress testing is fully integrated in our liquidity risk management framework. We track contractual cash flows per<br />
currency and product over an eight-week horizon (which we consider the most critical time span in a liquidity<br />
crisis) and apply the relevant stress case to all potential risk drivers from on balance sheet and off balance<br />
sheet products. Beyond the eight week time horizon we analyze on a quarterly basis the impact of a more<br />
prolonged stress period extending out to twelve months, together with mitigation actions which may include<br />
some change of business model. The liquidity stress testing provides the basis for the bank’s contingency<br />
funding plans which are approved by the Management Board.<br />
Our stress testing analysis assesses our ability to generate sufficient liquidity under extreme conditions and is<br />
a key input when defining our target liquidity risk position. The analysis is performed monthly. The following<br />
table shows stress testing results as of December 31, 2010. For each scenario, the table shows what our<br />
cumulative funding gap would be over an eight-week horizon after occurrence of the triggering event, how much<br />
counterbalancing liquidity we could generate via different sources as well as the resulting net liquidity position.<br />
Scenario<br />
in € bn. Funding Gap 1<br />
Gap Closure 2<br />
Net Liquidity<br />
Position<br />
Systemic market risk 50 164 114<br />
Emerging markets 14 169 155<br />
Event shock 15 138 123<br />
Operational risk (DB specific) 12 167 155<br />
1 notch downgrade (DB specific) 33 169 136<br />
Downgrade to A-2/P-2 (DB specific) 135 186 51<br />
Combined 3 142 173 31<br />
1 Funding gap caused by impaired rollover of liabilities and other projected outflows<br />
2 Based on liquidity generation through countermeasures<br />
3 Combined impact of systemic market risk and downgrade to A-2/P-2
<strong>Deutsche</strong> <strong>Bank</strong> 01 – Management <strong>Report</strong> 111<br />
Financial <strong>Report</strong> 2010 Risk <strong>Report</strong><br />
With the increasing importance of liquidity management in the financial industry, we maintain an active dialogue<br />
with central banks, supervisors, rating agencies and market participants on liquidity risk-related topics. We<br />
participate in a number of working groups regarding liquidity and support efforts to create industry-wide standards<br />
to evaluate and manage liquidity risk at financial institutions. In addition to our internal liquidity management<br />
systems, the liquidity exposure of German banks is regulated by the <strong>Bank</strong>ing Act and regulations issued by the<br />
BaFin. We are in compliance with all applicable liquidity regulations.<br />
Liquidity Risk at Postbank<br />
In general, Postbank’s Financial Markets division is responsible for the centralized operational management of<br />
liquidity risk. BHW Bausparkasse AG, the foreign subsidiaries in New York and Luxembourg, and the London<br />
branch manage their risks independently using uniform Postbank group-wide procedures and processes. In the<br />
event of a liquidity shock, the Liquidity Crisis Committee has clear responsibility and authority over all Postbank<br />
units responsible for portfolios as well as all portfolio units at the subsidiaries and foreign branches.<br />
Postbank’s overarching risk strategy encompasses its strategy for management of liquidity risk. The goal of<br />
liquidity management is to ensure that Postbank is solvent at all times, not only under normal conditions, but<br />
also in stress situations. Due to its strategic focus as a retail bank, Postbank enjoys a strong financing base in<br />
its customer business and is therefore relatively independent of the money and capital markets. To guard against<br />
unexpected cash outflows, an extensive portfolio consisting of unencumbered ECB-eligible securities is held<br />
that can be used to obtain liquidity rapidly. To ensure the additional diversification of its refinancing activities,<br />
Postbank has a Pfandbrief license allowing it to issue public sector Pfandbriefe and mortgage Pfandbriefe.<br />
At Postbank Market Risk Controlling assesses the liquidity status of the Postbank each business day on the<br />
basis of funding matrices and cash flow forecasts, with operational management of risk being performed on the<br />
basis of the liquidity status. Risk management is also based on a series of more far-reaching analyses of liquidity,<br />
in addition to regular Postbank’s Group-wide liquidity and issue planning and also includes regular stress testing.<br />
Based on the results of the stress tests, Postbank believes that its liquidity position remains solid. This is due<br />
not least to the further increase in customer deposits and Postbank’s extensive portfolio of ECB-eligible securities.
<strong>Deutsche</strong> <strong>Bank</strong> 01 – Management <strong>Report</strong> 112<br />
Financial <strong>Report</strong> 2010 Risk <strong>Report</strong><br />
Maturity Analysis of Financial Liabilities<br />
The following table presents a maturity analysis of the earliest contractual undiscounted cash flows for financial<br />
liabilities as of December 31, 2010, and 2009.<br />
Dec 31, 2010<br />
in € m. On demand<br />
Due within<br />
3 months<br />
Due between<br />
3 and 12 months<br />
Due between<br />
1 and 5 years<br />
Due after<br />
5 years<br />
Noninterest bearing deposits 89,068 – – – –<br />
Interest bearing deposits 120,154 233,469 32,564 35,430 23,299<br />
Trading liabilities 1 68,859 – – – –<br />
Negative market values from derivative financial<br />
instruments 1 647,171 – – – –<br />
Financial liabilities designated at fair value<br />
through profit or loss 32,332 101,163 8,474 8,056 3,736<br />
Investment contract liabilities 2 – 572 888 1,367 5,071<br />
Negative market values from derivative financial<br />
instruments, qualifying for hedge accounting 3 852 141 256 1,113 4,257<br />
Central bank funds purchased 4,456 1,848 – – –<br />
Securities sold under repurchase agreements 2,384 14,570 3,056 1,585 23<br />
Securities loaned 3,024 54 – – 198<br />
Other short-term borrowings 49,904 13,439 1,495 – –<br />
Long-term debt 1,695 11,647 16,879 80,713 58,153<br />
Trust preferred securities – – 2,434 4,481 5,335<br />
Other financial liabilities 119,693 6,160 268 516 22<br />
Off-balance sheet loan commitments 100,273 – – – –<br />
Financial guarantees 28,941 – – – –<br />
Total 4 1,268,806 383,063 66,314 133,261 100,094<br />
1 Trading liabilities and derivatives not qualifying for hedge accounting balances are recorded at fair value. We believe that this best represents the cash flow that would<br />
have to be paid if these positions had to be closed out. Trading liabilities and derivatives not qualifying for hedge accounting balances are shown within on demand<br />
which management believes most accurately reflects the short-term nature of trading activities. The contractual maturity of the instruments may however extend over<br />
significantly longer periods.<br />
2 These are investment contracts where the policy terms and conditions result in their redemption value equaling fair value. See Note 39 “Insurance and Investment<br />
Contracts” for more detail on these contracts.<br />
3 Derivatives designated for hedge accounting are recorded at fair value and are shown in the time bucket at which the hedged relationship is expected to terminate.<br />
4 The balances in the table do not agree to the numbers in the Group balance sheet as the cash flows included in the table are undiscounted. This analysis represents<br />
the worst case scenario for the Group if they were required to repay all liabilities earlier than expected. We believe that the likelihood of such an event occurring is<br />
remote. Interest cash flows have been excluded from the table.
<strong>Deutsche</strong> <strong>Bank</strong> 01 – Management <strong>Report</strong> 113<br />
Financial <strong>Report</strong> 2010 Risk <strong>Report</strong><br />
Dec 31, 2009<br />
in € m. On demand<br />
Due within<br />
3 months<br />
Due between<br />
3 and 12 months<br />
Due between<br />
1 and 5 years<br />
Due after<br />
5 years<br />
Noninterest bearing deposits 51,731 – – – –<br />
Interest bearing deposits 117,960 126,598 14,649 21,362 11,987<br />
Trading liabilities 1 64,501 – – – –<br />
Negative market values from derivative financial<br />
instruments 1 576,973 – – – –<br />
Financial liabilities designated at fair value<br />
through profit or loss 64,920 33,785 4,806 5,797 4,826<br />
Investment contract liabilities 2 – 514 806 1,247 4,710<br />
Negative market values from derivative financial<br />
instruments qualifying for hedge accounting 3 946 – 10 392 2,455<br />
Central bank funds purchased 3,824 1,884 – – –<br />
Securities sold under repurchase agreements 1,349 38,292 104 37 5<br />
Securities loaned 5,028 54 16 – 466<br />
Other short-term borrowings 24,830 17,370 632 – –<br />
Long-term debt 1,856 2,044 20,373 67,837 41,011<br />
Trust preferred securities – – 746 3,991 5,840<br />
Other financial liabilities 120,731 6,705 375 233 60<br />
Off-balance sheet loan commitments 63,662 – – – –<br />
Financial guarantees 21,719 – – – –<br />
Total 4 1,120,030 227,246 42,517 100,896 71,360<br />
1 Trading liabilities and derivatives not qualifying for hedge accounting balances are recorded at fair value. We believe that this best represents the cash flow that would<br />
have to be paid if these positions had to be closed out. Trading liabilities and derivatives not qualifying for hedge accounting balances are shown within on demand<br />
which management believes most accurately reflects the short-term nature of trading activities. The contractual maturity of the instruments may however extend over<br />
significantly longer periods.<br />
2 These are investment contracts where the policy terms and conditions result in their redemption value equaling fair value. See Note 39 “Insurance and Investment<br />
Contracts” for more detail on these contracts.<br />
3 Derivatives designated for hedge accounting are recorded at fair value and are shown in the time bucket at which the hedged relationship is expected to terminate.<br />
4 The balances in the table do not agree to the numbers in the Group balance sheet as the cash flows included in the table are undiscounted. This analysis represents<br />
the worst case scenario for the Group if they were required to repay all liabilities earlier than expected. We believe that the likelihood of such an event occurring is<br />
remote. Interest cash flows have been excluded from the table.<br />
Capital Management<br />
Our Treasury function manages our capital at Group level and locally in each region, except that Postbank<br />
manages its capital on a group level and locally on its own. The allocation of financial resources, in general,<br />
and capital, in particular, favors business portfolios with the highest positive impact on our profitability and<br />
shareholder value. As a result, Treasury periodically reallocates capital among business portfolios.<br />
Treasury implements our capital strategy, which itself is developed by the Capital and Risk Committee and<br />
approved by the Management Board, including the issuance and repurchase of shares. We are committed to<br />
maintain our sound capitalization. Overall capital demand and supply are constantly monitored and adjusted, if<br />
necessary, to meet the need for capital from various perspectives. These include book equity based on IFRS<br />
accounting standards, regulatory capital and economic capital. Since October 2008, our target for the Tier 1<br />
capital ratio continued to be at 10 % or above.
<strong>Deutsche</strong> <strong>Bank</strong> 01 – Management <strong>Report</strong> 114<br />
Financial <strong>Report</strong> 2010 Risk <strong>Report</strong><br />
The allocation of capital, determination of our funding plan and other resource issues are framed by the Capital<br />
and Risk Committee.<br />
Regional capital plans covering the capital needs of our branches and subsidiaries are prepared on a semiannual<br />
basis and presented to the Group Investment Committee. Most of our subsidiaries are subject to legal<br />
and regulatory capital requirements. Local Asset and Liability Committees attend to those needs under the<br />
stewardship of regional Treasury teams. Furthermore, they safeguard compliance with requirements such as<br />
restrictions on dividends allowable for remittance to <strong>Deutsche</strong> <strong>Bank</strong> AG or on the ability of our subsidiaries to<br />
make loans or advances to the parent bank. In developing, implementing and testing our capital and liquidity,<br />
we take such legal and regulatory requirements into account.<br />
On October 6, 2010, we completed a capital increase from authorized capital against cash contributions. In<br />
total, 308.6 million new registered no-par value shares (common shares) were issued, resulting in gross<br />
proceeds of € 10.2 billion. The net proceeds of € 10.1 billion raised in the issuance (after expenses of approximately<br />
€ 0.1 billion, net of tax) were primarily used to cover the capital consumption from the consolidation of<br />
Postbank, and, in addition, to support the existing capital base.<br />
Treasury executes the repurchase of shares. As of January 1, 2010, the number of shares held in Treasury<br />
from buybacks totaled 0.6 million. The 2009 <strong>Annual</strong> General Meeting granted our management board the<br />
authority to buy back up to 62.1 million shares before the end of October 2010. During the period from January 1,<br />
2010 until the 2010 <strong>Annual</strong> General Meeting, 11.1 million shares (or 2 % of shares issued) were purchased.<br />
Thereof 10.6 million were used for equity compensation purposes. As of the 2010 <strong>Annual</strong> General Meeting on<br />
May 27, 2010, the number of shares held in Treasury from buybacks totaled 1.0 million. The 2010 <strong>Annual</strong><br />
General Meeting granted our management board the authority to buy back up to 62.1 million shares before the<br />
end of November 2014. Thereof 31.0 million shares can be purchased by using derivatives. During the period<br />
from the 2010 <strong>Annual</strong> General Meeting until December 31, 2010, 18.8 million shares were purchased, of which<br />
0.5 million were purchased via sold put options which were executed by the counterparty at maturity date.<br />
9.8 million of the total 18.8 million shares repurchased were used for equity compensation purposes in 2010<br />
and 9.0 million shares were used to increase our Treasury position for later use for future equity compensation.<br />
As of December 31, 2010, the number of shares held in Treasury from buybacks totaled 10.0 million.<br />
Total outstanding hybrid Tier 1 capital (substantially all noncumulative trust preferred securities) as of December<br />
31, 2010, amounted to € 12.6 billion compared to € 10.6 billion as of December 31, 2009. This increase<br />
was mainly due to the consolidation of € 1.6 billion hybrid Tier 1 capital issued by Postbank and foreign exchange<br />
effects of the strengthened U.S. dollar on our U.S. dollar denominated hybrid Tier 1 capital. During the<br />
first half year 2010 we raised € 0.1 billion of hybrid Tier 1 capital by increasing an outstanding issue.<br />
In 2010, we issued € 1.2 billion of lower Tier 2 capital (qualified subordinated liabilities). Consolidation of Tier 2<br />
capital issued by Postbank added € 2.2 billion of lower Tier 2 capital and € 1.2 billion of profit participation<br />
rights. Profit participation rights amounted to € 1.2 billion after and nil before consolidation of Postbank. Qualified<br />
subordinated liabilities as of December 31, 2010 amounted to € 10.7 billion compared to € 7.1 billion as of<br />
December 31, 2009. Cumulative preferred securities amounted to € 0.3 billion as of December 31, 2010, unchanged<br />
to December 31, 2009.
<strong>Deutsche</strong> <strong>Bank</strong> 01 – Management <strong>Report</strong> 115<br />
Financial <strong>Report</strong> 2010 Risk <strong>Report</strong><br />
Capital Management at Postbank<br />
Postbank manages its capital by continuously monitoring capital supply and demand. Capital management aims<br />
at regulatory as well as at economic capital adequacy, in line with the concept of risk bearing capacity. In general,<br />
the capital allocation requires an appropriate return on regulatory capital demand. The capital allocation is<br />
approved by Postbank’s Management Board based on a multi year plan.<br />
The regulatory and economic capital demand is permanently monitored to adjust the available capital if required.<br />
Capital demand forecasts are regularly determined and carried forward based on the planned development of<br />
the business volume and results as well as expected risk parameter changes. Capital ratios are managed in<br />
compliance with the Postbank’s Management Board approved statutory guidelines, by steering the existing and<br />
new transaction volume, by issuance of Tier 1 and Tier 2 capital instruments or by executing risk mitigating<br />
capital market transactions.<br />
Balance Sheet Management<br />
We manage our balance sheet on a Group level excluding Postbank and, where applicable, locally in each<br />
region. In the allocation of financial resources we favor business portfolios with the highest positive impact on<br />
our profitability and shareholder value. Our balance sheet management function has the mandate to monitor<br />
and analyze balance sheet developments and to track certain market-observed balance sheet ratios. Based on<br />
this we trigger discussion and management action by the Capital and Risk Committee. While we monitor IFRS<br />
balance sheet developments, our balance sheet management is principally focused on adjusted values as<br />
used in our leverage ratio target definition, which is calculated using adjusted total assets and adjusted total<br />
equity figures.<br />
Similarly Postbank follows a value-oriented financial management approach that includes balance sheet<br />
management.<br />
As of December 31, 2010, on a consolidated basis our leverage ratio according to our target definition was 23,<br />
at the same level as of December 31, 2009, and below our leverage ratio target of 25. The impact from our<br />
acquisitions on our total assets was fully compensated for by the impact of our rights issue on the applicable<br />
equity. Our leverage ratio calculated as the ratio of total assets under IFRS to total equity under IFRS was 38<br />
as of December 31, 2010, a slight decrease compared to 40 at the end of 2009.
<strong>Deutsche</strong> <strong>Bank</strong> 01 – Management <strong>Report</strong> 116<br />
Financial <strong>Report</strong> 2010 Risk <strong>Report</strong><br />
Overall Risk Position<br />
To determine our overall (nonregulatory) risk position, we generally consider diversification benefits across risk<br />
types except for business risk, which we aggregate by simple addition.<br />
The table below shows our overall risk position as measured by the economic capital usage calculated for<br />
credit, market, operational and business risk for the dates specified.<br />
in € m. Dec 31, 2010 Dec 31, 2009<br />
Economic capital usage<br />
Credit risk 12,785 7,453<br />
Market Risk 13,160 12,515<br />
Trading market risk 6,420 4,613<br />
Nontrading market risk 6,740 7,902<br />
Operational risk 3,682 3,493<br />
Diversification benefit across credit, market and operational risk (3,534) (3,166)<br />
Sub-total credit, market and operational risk 26,093 20,295<br />
Business risk 1,085 501<br />
Total economic capital usage 27,178 20,796<br />
As of December 31, 2010, our economic capital usage totaled € 27.2 billion, which is € 6.4 billion, or 31 %,<br />
above the € 20.8 billion economic capital usage as of December 31, 2009. The increase in economic capital<br />
usage includes the effects of the acquisitions of Postbank, Sal. Oppenheim/BHF-BANK and parts of ABN AMRO’s<br />
commercial banking activities in the Netherlands, as well as exposure increases and the effects of various model<br />
refinements for the calculation of economic capital for credit risk and trading market risk.<br />
The December 31, 2010, economic capital usage included € 4.6 billion in relation to Postbank, which has been<br />
calculated on a basis consistent with <strong>Deutsche</strong> <strong>Bank</strong> methodology, however, limitations in data availability may<br />
lead to portfolio effects that are not fully estimated and thereby resulting in over or under estimation. For December<br />
31, 2009, € 4.2 billion economic capital usage was included for Postbank.<br />
Our economic capital usage for credit risk totaled € 12.8 billion as of December 31, 2010. The increase of<br />
€ 5.3 billion, or 72 %, was principally driven by acquisitions. The consolidation of Postbank as well as of Sal.<br />
Oppenheim and parts of ABN AMRO’s commercial banking activities in the Netherlands increased the economic<br />
capital usage by € 3.7 billion. The other changes reflected exposure increases, refinements of the credit risk<br />
model and the effect from regular recalibrations of the credit risk parameters.<br />
Our economic capital usage for market risk increased by € 645 million, or 5 %, to € 13.2 billion as of December<br />
31, 2010. The increase was driven by trading market risk, which increased by € 1.8 billion, or 39 %, primarily<br />
reflecting model improvements. Nontrading market risk economic capital usage decreased by € 1.2 billion, or<br />
15 %, reflecting the elimination of our former Postbank equity investment upon consolidation of Postbank’s<br />
assets on our balance sheet, which reduced the economic capital usage by € 3.3 billion net. This decrease was<br />
partly offset by changes in other nontrading market risk of € 1.8 billion and by the acquisition of Sal. Oppenheim,<br />
which contributed a further € 313 million.
<strong>Deutsche</strong> <strong>Bank</strong> 01 – Management <strong>Report</strong> 117<br />
Financial <strong>Report</strong> 2010 Risk <strong>Report</strong><br />
Operational risk economic capital usage increased by € 189 million, or 5 %, to € 3.7 billion as of December 31,<br />
2010. The increase is fully explained by acquisitions.<br />
Our economic capital usage for business risk, consisting of a strategic risk and a tax risk component, totaled<br />
€ 1.1 billion as of December 31, 2010. The strategic risk economic capital usage increase of € 450 million was<br />
primarily attributable to the Postbank acquisition resulting in an economic capital usage of € 400 million.<br />
The diversification effect of the economic capital usage across credit, market and operational risk increased by<br />
€ 368 million, or 12 %, as of December 31, 2010.<br />
The table below shows the economic capital usage of our business segments for the dates specified.<br />
in € m. Dec 31, 2010 Dec 31, 2009<br />
Corporate & Investment <strong>Bank</strong> 16,119 11,974<br />
Corporate <strong>Bank</strong>ing & Securities 14,828 11,242<br />
Global Transaction <strong>Bank</strong>ing 1,291 732<br />
Private Clients and Asset Management 9,394 4,434<br />
Asset and Wealth Management 2,717 1,878<br />
Private & Business Clients 6,677 2,556<br />
Corporate Investments 902 4,641<br />
Consolidation & Adjustments 762 (253)<br />
Total economic capital usage 27,178 20,796<br />
The future allocation of economic capital may change to reflect refinements in our risk measurement methodology.<br />
A primary measure we use to assess our risk bearing capacity is a ratio of our active book equity divided by<br />
the economic capital usage (shown in the above table) plus goodwill and intangibles (€ 42.8 billion and<br />
€ 31.0 billion as of December 31, 2010 and 2009, respectively). Active book equity, which was € 48.4 billion<br />
and € 36.4 billion as of December 31, 2010 and 2009, respectively, is calculated by adjusting total shareholders’<br />
equity for unrealized net gains (losses) on financial assets available for sale and on cash flow hedges as<br />
well as for accrued future dividends (for a reconciliation, please refer to Note 36 “Regulatory Capital” of the<br />
consolidated financial statements). A ratio of more than 100 % signifies that the active book equity adequately<br />
covers the aforementioned risk positions. This ratio was 113 % as of December 31, 2010, compared to 118 %<br />
as of December 31, 2009, as effects from the increase in economic capital and goodwill overcompensated the<br />
increase of active book equity, which was primarily attributable to the capital raise related to Postbank, retained<br />
earnings and foreign exchange effects.
<strong>Deutsche</strong> <strong>Bank</strong> 01 – Management <strong>Report</strong> 118<br />
Financial <strong>Report</strong> 2010 Internal Control over Financial <strong>Report</strong>ing<br />
Internal Control over Financial <strong>Report</strong>ing<br />
General<br />
Management of <strong>Deutsche</strong> <strong>Bank</strong> and its consolidated subsidiaries is responsible for establishing and maintaining<br />
adequate internal control over financial reporting (“ICOFR”). Our internal control over financial reporting is a<br />
process designed under the supervision of our Chairman of the Management Board and our Chief Financial<br />
Officer to provide reasonable assurance regarding the reliability of financial reporting and the preparation of the<br />
firm’s consolidated financial statements for external reporting purposes in accordance with International Financial<br />
<strong>Report</strong>ing Standards (IFRS). ICOFR includes our disclosure controls and procedures to prevent misstatements.<br />
Risks in financial reporting<br />
The main risks in financial reporting are that either financial statements are not fairly presented due to inadvertent<br />
or intentional errors (fraud) or the publication of financial statements is delayed. These risks may reduce investor<br />
confidence or cause reputational damage and may have legal consequences including banking regulatory<br />
intervention. A lack of fair presentation arises when one or more financial statement amounts or disclosures<br />
contain misstatements (or omissions) that are material. Misstatements could be deemed material if they could<br />
individually or collectively, influence economic decisions that users make on the basis of the financial statements.<br />
To address those risks of financial reporting, management of the Group has established ICOFR to provide<br />
reasonable but not absolute assurance against misstatements. The design of the ICOFR is based on the internal<br />
control framework established in Internal control – Integrated Framework issued by the Committee of<br />
Sponsoring Organizations of the Treadway Commission (“COSO”). COSO recommends the establishment of<br />
specific objectives to facilitate the design and evaluate adequacy of a control system. As a result in establishing<br />
ICOFR, management has adopted the following financial statement objectives:<br />
— Existence – assets and liabilities exist and transactions have occurred.<br />
— Completeness – all transactions are recorded, account balances are included in the financial statements.<br />
— Valuation – assets, liabilities and transactions are recorded in the financial reports at the appropriate<br />
amounts.<br />
— Rights and Obligations and ownership – rights and obligations are appropriately recorded as assets and<br />
liabilities.<br />
— Presentation and disclosures – classification, disclosure and presentation of financial reporting is appropriate.<br />
— Safeguarding of assets – unauthorized acquisitions, use or disposition of assets is prevented or detected in<br />
a timely manner.
<strong>Deutsche</strong> <strong>Bank</strong> 01 – Management <strong>Report</strong> 119<br />
Financial <strong>Report</strong> 2010 Internal Control over Financial <strong>Report</strong>ing<br />
However, any internal control system, including ICOFR, no matter how well conceived and operated, can provide<br />
only reasonable, not absolute, assurance that the objectives of that control system are met. As such, disclosure<br />
controls and procedures or systems for ICOFR may not prevent all error and all fraud. Further, the design of a<br />
control system must reflect the fact that there are resource constraints, and the benefits of controls must be<br />
considered relative to their costs.<br />
Organization of Internal Control System<br />
Functions involved in the system of internal control over financial reporting<br />
As the books and records form the basis of the financial statements, controls within the system of ICOFR are<br />
performed by all business functions and the respective infrastructure functions with an involvement in assuring<br />
the reliability of those books and records. As a result, the operation of ICOFR involves a large number of staff<br />
based mainly in the following functions: Finance, Group Technology and Operations, Legal, Risk & Capital<br />
and Tax.<br />
Finance is responsible for the periodic preparation of the financial statements and operates independently from<br />
the businesses. Within Finance, different departments have control responsibilities which contribute to the overall<br />
preparation process:<br />
— Finance specialists for businesses or entities – responsible for assuring the quality of financial data by performing<br />
validation and control. They are in close contact with business, infrastructure and legal entity management<br />
and employ their specific knowledge to address financial reporting issues arising on products and<br />
transactions, as well as validating reserving and other judgmental adjustments. They also provide oversight<br />
of the performance of controls over individual transactions and balances. Entity and business related specialists<br />
add the perspective of legal entities to the business view and sign-off on the financial reporting of<br />
their entities.<br />
— Finance-Group – responsible for Group-wide activities which include the preparation of group financial and<br />
management information, forecasting and planning, risk reporting. Finance-Group set the reporting timetables,<br />
perform the consolidation and aggregation processes, effect the elimination entries for inter and intra<br />
group activities, control the access and adjustment processes, compile the Group financial statements, consider<br />
and incorporate comments as to content and presentation made by senior management, SOx and<br />
Disclosure Steering Committee members and external advisors.<br />
— Accounting Policy and Advisory Group (“APAG”) – responsible for developing the Group’s interpretation of<br />
international accounting standards and their consistent application within the Group. APAG provides accounting<br />
advice and consulting services to Finance and the wider business, and ensures the timely resolution<br />
of corporate and transaction-specific accounting issues.<br />
— Global Valuation Oversight Group (“GVO”) and business aligned valuation specialists – responsible for<br />
developing policies and minimum standards for valuation, and provides related implementation guidance<br />
when undertaking valuation control work. This is in addition to challenging and validating valuation control<br />
results, and acting as the single point of contact for valuation topics with external third parties (such as regulators<br />
and auditors).
<strong>Deutsche</strong> <strong>Bank</strong> 01 – Management <strong>Report</strong> 120<br />
Financial <strong>Report</strong> 2010 Internal Control over Financial <strong>Report</strong>ing<br />
The operation of ICOFR is also importantly supported by Group Technology and Operations, Legal, Risk &<br />
Capital and Group Tax. Although these functions are not directly involved in the financial preparation process,<br />
they significantly contribute to the overall control of financial information:<br />
— Group Technology and Operations (“GTO”) – responsible for confirming transactions with counterparties,<br />
performing reconciliations both internally and externally of financial information between systems, depots<br />
and exchanges. GTO also undertake all transaction settlement activity on behalf of the Group and perform<br />
reconciliations of nostro account balances.<br />
— Legal, Risk & Capital (“LRC”) – through their responsibility for developing policies and standards for managing<br />
credit, market and operational risks. LRC identifies and assesses the adequacy of credit and operational<br />
provisions. The Legal department manages legal risks and identifies and assesses legal risk provisions.<br />
— Group Tax – responsible to produce complete and correct income tax related financial data together with<br />
Finance, covering the assessment and planning of current and deferred income taxes and the collection of<br />
tax related information. Group Tax monitors the income tax position and controls the provisioning for tax risks.<br />
Controls to minimize the risk of financial statement misstatement<br />
The system of ICOFR consists of a large number of internal controls and procedures to minimize the risk of<br />
misstatement of the financial statements. Such controls will include those which:<br />
— are ongoing or permanent in nature such as supervision within written policies and procedures or segregation<br />
of duties,<br />
— operate on a periodic basis such as those which are performed as part of the annual financial statement<br />
compilation process.<br />
— are preventative or detective in nature.<br />
— have a direct or indirect impact on the financial statements themselves. Controls which have an indirect<br />
effect on the financial statements include IT general controls such as system access and deployment controls<br />
whereas a control with a direct impact could be, for example, a reconciliation which directly supports a<br />
balance sheet line item.<br />
— feature automated and/or manual components. Automated controls are control functions embedded within<br />
system processes such as application enforced segregation of duty controls and interface checks over the<br />
completeness and accuracy of inputs. Manual internal controls are those operated by an individual or group<br />
of individuals such as authorization of transactions.
<strong>Deutsche</strong> <strong>Bank</strong> 01 – Management <strong>Report</strong> 121<br />
Financial <strong>Report</strong> 2010 Internal Control over Financial <strong>Report</strong>ing<br />
The resulting combination of individual controls encompasses all of the following aspects of ICOFR:<br />
— Accounting policy – design and implementation. To ensure the globally consistent recording and reporting of<br />
the Group’s business activities in accordance with authorized accounting policies.<br />
— Reference data. Controls over reference data in relation to the general ledger, on and off-balance sheet and<br />
product reference data.<br />
— Transaction approval, capture and confirmation. Controls to ensure the completeness and accuracy of recorded<br />
transactions and that they are appropriately authorized. Controls include transaction confirmations<br />
which are sent to and received from counterparties to ensure that trade details are corroborated.<br />
— Reconciliation controls, both externally and internally. Inter-system reconciliations are performed between<br />
relevant systems for all trades, transactions, positions or relevant parameters. External reconciliations include<br />
nostro account, depot and exchange reconciliations.<br />
— Valuation including Independent Price Verification process (“IPV”). Finance performs valuation controls (“VC”)<br />
at least monthly, in order to gain comfort as to the reasonableness of the front office valuation. The results of<br />
the VC processes are independently reviewed by the Global Valuation Oversight Group. The results of the<br />
VC process are assessed on a monthly basis by the Valuation Control Oversight Committee. Business aligned<br />
valuation specialists focus on valuation approaches and methodologies for various asset classes and perform<br />
IPV for complex derivatives and structured products.<br />
— Taxation. Controls to ensure tax calculations are performed properly and that tax balances are appropriately<br />
recorded in the financial statements.<br />
— Reserving and judgmental adjustment. Controls include processes to ensure reserving and judgmental<br />
adjustments are authorized and are reported in accordance with the approved accounting policies.<br />
— Balance Sheet Substantiation. The substantiation of balance sheet accounts involves determining the integrity<br />
of the general ledger account balances based on supporting evidence.<br />
— Consolidation and other period end reporting controls. At period end, all businesses and regions submit their<br />
financial data to the Group for consolidation. Controls over consolidation include the validation of accounting<br />
entries required to eliminate the effect of inter and intra company activities. Period end reporting controls include<br />
general ledger month end close processes and the review of late adjustments.<br />
— Financial Statement disclosure and presentation. The preparation and certification of disclosure checklists.<br />
Final review and sign-off of the Financial Statements by Senior Finance Management. The Financial Statements<br />
and the Management <strong>Report</strong> are – after approval of the Management Board – subject to review of<br />
the Supervisory Board and its Audit Committee.
<strong>Deutsche</strong> <strong>Bank</strong> 01 – Management <strong>Report</strong> 122<br />
Financial <strong>Report</strong> 2010 Internal Control over Financial <strong>Report</strong>ing<br />
Measuring effectiveness of internal control<br />
Each year, management of the Group undertakes a formal evaluation of the adequacy and effectiveness of<br />
ICOFR. This assessment as of December 31, 2010 excludes internal controls relating to <strong>Deutsche</strong> Postbank<br />
AG, which was initially consolidated on December 3, 2010. This evaluation incorporates an assessment of the<br />
effectiveness of the control environment as well as the detailed controls taking into account:<br />
— The financial misstatement risk of the relevant financial statement item, considering such factors as materiality<br />
and the susceptibility of the particular financial statement item to misstatement.<br />
— The susceptibility of the control to failure, considering such factors as the degree of automation, complexity,<br />
risk of management override, competence of personnel and the level of judgment required.<br />
These factors, in aggregate, determine the nature and extent of evidence that management requires in order to<br />
be able to assess whether or not the operation of the system of ICOFR is effective. The evidence itself is generated<br />
from procedures integrated with the daily responsibilities of staff or from procedures implemented specifically<br />
for purposes of the ICOFR evaluation. Information from other sources also form an important component<br />
of management’s evaluation since such evidence may either bring additional control issues to the attention of<br />
management or may corroborate findings. Such information sources include:<br />
— Group Audit reports<br />
— <strong>Report</strong>s on audits carried out by or on behalf of regulatory authorities<br />
— External Auditor reports<br />
— <strong>Report</strong>s commissioned to evaluate the effectiveness of outsourced processes to third parties<br />
The result of management testing subject to the exclusion noted and the information from other sources lead to<br />
the conclusion of management that ICOFR is appropriately designed and operating effectively for 2010.<br />
In addition, Group Audit provides assurance over the design and operating effectiveness of ICOFR by performing<br />
periodic and ad-hoc risk-based audits. <strong>Report</strong>s are produced summarizing the results from each audit performed<br />
which are distributed to the responsible managers for the activities concerned. These reports, together with the<br />
evidence generated by specific further procedures that Group Audit performs for the purpose provide evidence to<br />
support the annual evaluation by management of the overall operating effectiveness of the ICOFR.
<strong>Deutsche</strong> <strong>Bank</strong> 01 – Management <strong>Report</strong> 123<br />
Financial <strong>Report</strong> 2010 Information pursuant to Section 315 (4) of the German Commercial Code and Explanatory <strong>Report</strong><br />
Information pursuant to Section 315 (4) of the German<br />
Commercial Code and Explanatory <strong>Report</strong><br />
Structure of the Share Capital<br />
As of December 31, 2010, <strong>Deutsche</strong> <strong>Bank</strong>’s issued share capital amounted to € 2,379,519,078.40 consisting of<br />
929,499,640 ordinary shares without par value. The shares are fully paid up and in registered form. Each share<br />
confers one vote.<br />
Restrictions on Voting Rights or the Transfer of Shares<br />
Under Section 136 AktG the voting right of the affected shares is excluded by law. As far as the bank held own<br />
shares as of December 31, 2010 in its portfolio according to Section 71b AktG no rights could be exercised. We<br />
are not aware of any other restrictions on voting rights or the transfer of shares.<br />
Shareholdings which Exceed 10 % of the Voting Rights<br />
The German Securities Trading Act (Wertpapierhandelsgesetz) requires any investor whose share of voting<br />
rights reaches, exceeds or falls below certain thresholds as the result of purchases, disposals or otherwise,<br />
must notify us and the German Federal Financial Supervisory Authority (BaFin) thereof. The lowest threshold is<br />
3 %. We are not aware of any shareholder holding directly or indirectly 10 % or more of the voting rights.<br />
Shares with Special Control Rights<br />
Shares which confer special control rights have not been issued.<br />
System of Control of any Employee Share Scheme where the Control Rights are not Exercised<br />
Directly by the Employees<br />
The employees, who hold <strong>Deutsche</strong> <strong>Bank</strong> shares, exercise their control rights as other shareholders in accordance<br />
with applicable law and the Articles of Association (Satzung).<br />
Rules Governing the Appointment and Replacement of Members of the Management Board<br />
Pursuant to the German Stock Corporation Act (Section 84) and the Articles of Association of <strong>Deutsche</strong> <strong>Bank</strong><br />
(Section 6) the members of the Management Board are appointed by the Supervisory Board. The number of<br />
Management Board members is determined by the Supervisory Board. According to the articles of Association,<br />
the Management Board has at least three members. The Supervisory Board may appoint one member of the<br />
Management Board as Chairperson of the Management Board. Members of the Management Board may be<br />
appointed for a maximum term of up to five years. They may be re-appointed or have their term extended for one<br />
or more terms of up to a maximum of five years each. The German Co-Determination Act (Mitbestimmungsgesetz;<br />
Section 31) requires a majority of at least two thirds of the members of the Supervisory Board to appoint members<br />
of the Management Board. If such majority is not achieved, the Mediation Committee shall give, within one month,<br />
a recommendation for the appointment to the Management Board. The Supervisory Board will then appoint the<br />
members of the Management Board with the majority of its members. If such appointment fails, the Chairperson<br />
of the Supervisory Board shall have two votes in a new vote. If a required member of the Management Board has<br />
not been appointed, the Local Court (Amtsgericht) in Frankfurt am Main shall, in urgent cases, make the necessary<br />
appointments upon motion by any party concerned (Section 85 of the Stock Corporation Act).<br />
Pursuant to the German <strong>Bank</strong>ing Act (Kreditwesengesetz) evidence must be provided to the BaFin and the<br />
<strong>Deutsche</strong> Bundesbank that the member of the Management Board has adequate theoretical and practical<br />
experience of the businesses of the <strong>Bank</strong> as well as managerial experience before the member is appointed<br />
(Sections 24 (1) No. 1 and 33 (2) of the <strong>Bank</strong>ing Act).
<strong>Deutsche</strong> <strong>Bank</strong> 01 – Management <strong>Report</strong> 124<br />
Financial <strong>Report</strong> 2010 Information pursuant to Section 315 (4) of the German Commercial Code and Explanatory <strong>Report</strong><br />
The Supervisory Board may revoke the appointment of an individual as member of the Management Board or<br />
as Chairperson of the Management Board for good cause. Such cause includes in particular a gross breach of<br />
duties, the inability to manage the <strong>Bank</strong> properly or a vote of no-confidence by the shareholders’ meeting<br />
(Hauptversammlung, referred to as the General Meeting), unless such vote of no-confidence was made for<br />
obviously arbitrary reasons.<br />
The BaFin may appoint a special representative and transfer to such special representative the responsibility<br />
and powers of individual members of the Management Board if such members are not trustworthy or do not<br />
have the required competencies or if the credit institution does not have the required number of Management<br />
Board members. If members of the Management Board are not trustworthy or do not have the required expertise<br />
or if they have missed a material violation of the principles of sound management or if they have not addressed<br />
identified violations, the BaFin may transfer to the special representative the responsibility and powers of the<br />
Management Board in its <strong>entire</strong>ty. In any such case, the responsibility and powers of the Management Board<br />
members concerned are suspended (Section 45c (1) through (3) of the <strong>Bank</strong>ing Act).<br />
If the discharge of a bank’s obligations to its creditors is endangered or if there are valid concerns that effective<br />
supervision of the bank is not possible, the BaFin may take temporary measures to avert that risk. It may also<br />
prohibit members of the Management Board from carrying out their activities or impose limitations on such<br />
activities (Section 46 (1) of the <strong>Bank</strong>ing Act). In such case, the Local Court Frankfurt am Main shall, at the<br />
request of the BaFin appoint the necessary members of the Management Board, if, as a result of such prohibition,<br />
the Management Board does no longer have the necessary number of members in order to conduct the business<br />
(Section 46 (2) of the <strong>Bank</strong>ing Act).<br />
Rules Governing the Amendment of the Articles of Association<br />
Any amendment of the Articles of Association requires a resolution of the General Meeting (Section 179 of the<br />
Stock Corporation Act). The authority to amend the Articles of Association in so far as such amendments merely<br />
relate to the wording, such as changes of the share capital as a result of the issuance of authorized capital, has<br />
been assigned to the Supervisory Board by the Articles of Association of <strong>Deutsche</strong> <strong>Bank</strong> (Section 20 (3)). Pursuant<br />
to the Articles of Association, the resolutions of the General Meeting are taken by a simple majority of votes and,<br />
in so far as a majority of capital stock is required, by a simple majority of capital stock, except where law or the<br />
Articles of Association determine otherwise (Section 20 (1)). Amendments to the Articles of Association become<br />
effective upon their entry in the Commercial Register (Section 181 (3) of the Stock Corporation Act).<br />
Powers of the Management Board to Issue or Buy Back Shares<br />
The Management Board is currently not authorized to increase the share capital by issuing new shares for cash<br />
or noncash consideration.<br />
The <strong>Annual</strong> General Meeting on May 29, 2008 authorized the Management Board to issue once or more than<br />
once, bearer or registered participatory notes with bearer warrants and/or convertible participatory notes, bonds<br />
with warrants, and/or convertible bonds on or before April 30, 2013. For this purpose share capital was increased<br />
conditionally by up to € 150,000,000. This conditional capital became effective upon entry into the Commercial<br />
Register on June 25, 2009.<br />
The <strong>Annual</strong> General Meeting on May 26, 2009 authorized the Management Board to issue once or more than<br />
once, bearer or registered participatory notes with bearer warrants and/or convertible participatory notes, bonds<br />
with warrants, and/or convertible bonds on or before April 30, 2014. For this purpose share capital was increased<br />
conditionally by up to € 256,000,000. This conditional capital became effective upon entry into the Commercial<br />
Register on September 9, 2009.
<strong>Deutsche</strong> <strong>Bank</strong> 01 – Management <strong>Report</strong> 125<br />
Financial <strong>Report</strong> 2010 Information pursuant to Section 315 (4) of the German Commercial Code and Explanatory <strong>Report</strong><br />
The <strong>Annual</strong> General Meeting on May 27, 2010 authorized the Management Board to issue once or more than<br />
once, bearer or registered participatory notes with bearer warrants and/or convertible participatory notes, bonds<br />
with warrants, and/or convertible bonds on or before April 30, 2015. For this purpose share capital was increased<br />
conditionally by up to € 230,400,000. This conditional capital became effective upon entry into the Commercial<br />
Register on September 13, 2010.<br />
The <strong>Annual</strong> General Meeting of May 27, 2010 authorized the Management Board pursuant to Section 71 (1)<br />
No. 7 of the Stock Corporation Act to buy and sell, for the purpose of securities trading, own shares of <strong>Deutsche</strong><br />
<strong>Bank</strong> AG on or before November 30, 2014, at prices which do not exceed or fall short of the average of the<br />
share prices (closing auction prices of the <strong>Deutsche</strong> <strong>Bank</strong> share in Xetra trading and/or in a comparable successor<br />
system on the Frankfurt Stock Exchange) on the respective three preceding stock exchange trading<br />
days by more than 10 %. In this context, the shares acquired for this purpose may not, at the end of any day,<br />
exceed 5 % of the share capital of <strong>Deutsche</strong> <strong>Bank</strong> AG.<br />
The <strong>Annual</strong> General Meeting of May 27, 2010 authorized the Management Board pursuant to Section 71 (1)<br />
No. 8 of the Stock Corporation Act to buy, on or before November 30, 2014, own shares of <strong>Deutsche</strong> <strong>Bank</strong> AG<br />
in a total volume of up to 10 % of the present share capital. Together with own shares acquired for trading purposes<br />
and/or for other reasons and which are from time to time in the company’s possession or attributable to<br />
the company pursuant to Sections 71a et seq. of the Stock Corporation Act, the own shares purchased on the<br />
basis of this authorization may not at any time exceed 10 % of the company’s share capital. The own shares<br />
may be bought through the stock exchange or by means of a public purchase offer to all shareholders. The<br />
countervalue for the purchase of shares (excluding ancillary purchase costs) through the stock exchange may<br />
not be more than 10 % higher or lower than the average of the share prices (closing auction prices of the<br />
<strong>Deutsche</strong> <strong>Bank</strong> share in Xetra trading and/or in a comparable successor system on the Frankfurt Stock Exchange)<br />
on the last three stock exchange trading days before the obligation to purchase. In the case of a public purchase<br />
offer, it may not be more than 10 % higher or lower than the average of the share prices (closing auction<br />
prices of the <strong>Deutsche</strong> <strong>Bank</strong> share in Xetra trading and/or in a comparable successor system on the Frankfurt<br />
Stock Exchange) on the last three stock exchange trading days before the day of publication of the offer. If the<br />
volume of shares offered in a public purchase offer exceeds the planned buyback volume, acceptance must be<br />
in proportion to the shares offered in each case. The preferred acceptance of small quantities of up to 50 of the<br />
company’s shares offered for purchase per shareholder may be provided for.<br />
The Management Board has also been authorized to dispose of the purchased shares and of any shares purchased<br />
on the basis of previous authorizations pursuant to Section 71 (1) No. 8 of the Stock Corporation Act in<br />
a way other than through the stock exchange or by an offer to all shareholders, provided this is done against<br />
contribution-in-kind and excluding shareholders’ pre-emptive rights for the purpose of acquiring companies or<br />
shareholdings in companies. In addition, the Management Board has been authorized, in case it disposes of<br />
such own shares by offer to all shareholders, to grant to the holders of the option rights, convertible bonds and<br />
convertible participatory rights issued by the company and its affiliated companies pre-emptive rights to the<br />
extent to which they would be entitled to such rights if they exercised their option and/or conversion rights.<br />
Shareholders’ pre-emptive rights are excluded for these cases and to this extent.<br />
The Management Board has also been authorized with the exclusion of shareholders’ pre-emptive rights to use<br />
such own shares to issue staff shares to employees and retired employees of the company and its affiliated<br />
companies or to use them to service option rights on shares of the company and/or rights or duties to purchase<br />
shares of the company granted to employees or members of executive or non-executive management bodies<br />
of the company and of affiliated companies.
<strong>Deutsche</strong> <strong>Bank</strong> 01 – Management <strong>Report</strong> 126<br />
Financial <strong>Report</strong> 2010 Information pursuant to Section 315 (4) of the German Commercial Code and Explanatory <strong>Report</strong><br />
Furthermore, the Management Board has been authorized with the exclusion of shareholders’ pre-emptive<br />
rights to sell such own shares to third parties against cash payment if the purchase price is not substantially<br />
lower than the price of the shares on the stock exchange at the time of sale. Use may only be made of this<br />
authorization if it has been ensured that the number of shares sold on the basis of this authorization does not<br />
exceed 10 % of the company’s share capital at the time this authorization is exercised. Shares that are issued<br />
or sold during the validity of this authorization with the exclusion of pre-emptive rights, in direct or analogous<br />
application of Section 186 (3) sentence 4 Stock Corporation Act, are to be included in the maximum limit of 10 %<br />
of the share capital. Also to be included are shares that are to be issued to service option and/or conversion<br />
rights from convertible bonds, bonds with warrants, convertible participatory rights or participatory rights, if<br />
these bond or participatory rights are issued during the validity of this authorization with the exclusion of preemptive<br />
rights in corresponding application of Section 186 (3) sentence 4 Stock Corporation Act.<br />
The Management Board has also been authorized to cancel shares acquired on the basis of this authorization<br />
without the execution of this cancellation process requiring a further resolution by the General Meeting.<br />
The <strong>Annual</strong> General Meeting of May 27, 2010 authorized the Management Board pursuant to Section 71 (1)<br />
No. 8 of the Stock Corporation Act to execute the purchase of shares under the resolved authorization also<br />
with the use of put and call options or forward purchase contracts. The company may accordingly sell to third<br />
parties put options based on physical delivery and buy call options from third parties if it is ensured by the<br />
option conditions that these options are fulfilled only with shares which themselves were acquired subject to<br />
compliance with the principle of equal treatment. All share purchases based on put or call options are limited to<br />
shares in a maximum volume of 5 % of the actual share capital at the time of the resolution by the General<br />
Meeting on this authorization. The maturities of the options must end no later than on November 30, 2014.<br />
The purchase price to be paid for the shares upon exercise of the options or upon the maturity of the forward<br />
purchase may not exceed or fall short by more than 10 % of the average of the share prices (closing auction<br />
prices of the <strong>Deutsche</strong> <strong>Bank</strong> share in Xetra trading and/or in a comparable successor system on the Frankfurt<br />
Stock Exchange) on the last three stock exchange trading days before conclusion of the respective option<br />
transaction in each case excluding ancillary purchase costs but taking into account the option premium received<br />
or paid. The call option may only be exercised if the purchase price to be paid does not exceed by more than<br />
10 % or fall below 10 % of the average of the share prices (closing auction prices of the <strong>Deutsche</strong> <strong>Bank</strong> share<br />
in Xetra trading and/or in a comparable successor system on the Frankfurt Stock Exchange) on the last three<br />
stock exchange trading days before the acquisition of the shares.<br />
To the sale and cancellation of shares acquired with the use of derivatives the general rules established by the<br />
General Meeting apply.<br />
Significant Agreements which Take Effect, Alter or Terminate upon a Change of Control of the<br />
Company Following a Takeover Bid<br />
Significant agreements which take effect, alter or terminate upon a change of control of the company following<br />
a takeover bid have not been entered into.
<strong>Deutsche</strong> <strong>Bank</strong> 01 – Management <strong>Report</strong> 127<br />
Financial <strong>Report</strong> 2010 Information pursuant to Section 315 (4) of the German Commercial Code and Explanatory <strong>Report</strong><br />
Agreements for Compensation in Case of a Takeover Bid<br />
If a member of the Management Board leaves the bank within the scope of a change of control, he receives a<br />
one-off compensation payment described in greater detail in the following Compensation <strong>Report</strong>.<br />
If the employment relationship with certain executives with global or strategically important responsibility is<br />
terminated within a defined period within the scope of a change of control, without a reason for which the<br />
executives are responsible, or if these executives terminate their employment relationship because the company<br />
has taken certain measures leading to reduced responsibilities, the executives are entitled to a severance<br />
payment. The calculation of the severance payment is, in principle, based on 1.5 times to 2.5 times the total<br />
annual remuneration (base salary as well as variable – cash and equity-based – compensation) granted before<br />
change of control. Here, the development of total remuneration in the three calendar years before change of<br />
control is taken into consideration accordingly.
<strong>Deutsche</strong> <strong>Bank</strong> 01 – Management <strong>Report</strong> 128<br />
Financial <strong>Report</strong> 2010 Compensation <strong>Report</strong><br />
Compensation <strong>Report</strong><br />
The Compensation <strong>Report</strong> explains the principles applied in determining the compensation of the members of<br />
the Management Board and Supervisory Board of <strong>Deutsche</strong> <strong>Bank</strong> AG as well as the structure and amount of<br />
the Management Board and Supervisory Board members’ compensation. This Compensation <strong>Report</strong> has been<br />
prepared in accordance with the requirements of Section 314 (1) No. 6 of the German Commercial Code (HGB),<br />
German Accounting Standard (GAS) 17 “<strong>Report</strong>ing on Executive Body Remuneration” as well as the recommendations<br />
of the German Corporate Governance Code.<br />
Principles of the Compensation System for Management Board Members<br />
Responsibility<br />
Since the Act on the Appropriateness of Management Board Compensation (“VorstAG”) came into effect on<br />
August 5, 2009, decisions on the compensation system, including the material contract elements as well as the<br />
determination of the compensation of the Management Board members, have been taken by the Supervisory<br />
Board as a whole. The Chairman’s Committee of the Supervisory Board performs an important advisory function<br />
in this context and prepares resolutions for the approval of the Supervisory Board.<br />
Principles<br />
The compensation system takes applicable statutory and regulatory requirements into account. The Supervisory<br />
Board already dealt in detail with the alterations resulting from VorstAG back in 2009 and adjusted the contractual<br />
agreements with the Management Board members accordingly. Most recently, the provisions of the Regulation<br />
on Remuneration in Financial Institutions (“InstitutsVergV”), which came into effect on October 13, 2010, as well<br />
as their effects on the current compensation system, were reviewed in detail. Changes to contractual agreements<br />
with the Management Board members resulting from such regulation have been implemented and the variable<br />
compensation for the 2010 financial year was already determined under these new requirements.<br />
Central criteria of the design of the structure of the Management Board members’ compensation are appropriateness<br />
and sustainability, linked to the objective of preventing incentives to undertake unreasonably high risks.<br />
Therefore, a limit on the relationship between fixed and variable compensation is to be determined. Nonetheless,<br />
variable compensation is to be measured such that the Management Board members are effectively motivated<br />
to achieve the objectives set out in the bank’s strategies and thus to contribute to the sustainable development<br />
of the company. The compensation for the Management Board is determined on the basis of several criteria.<br />
These include the overall results of <strong>Deutsche</strong> <strong>Bank</strong> AG as well as the relative performance of the <strong>Deutsche</strong> <strong>Bank</strong><br />
share in comparison to selected peer institutions. Moreover, risk aspects, cost of capital, the contributions to<br />
company success of the respective organizational unit as well as that of the individual Management Board<br />
member himself, the latter one measured based on financial and non-financial parameters, are also taken into<br />
account. The variable compensation components are determined considering a multi-year basis of assessment.<br />
The Supervisory Board regularly reviews and adjusts, if necessary, the structure of the Management Board<br />
members’ compensation. In this context – and in determining the variable compensation – the Supervisory Board<br />
draws on the expertise of independent external compensation and legal consultants.
<strong>Deutsche</strong> <strong>Bank</strong> 01 – Management <strong>Report</strong> 129<br />
Financial <strong>Report</strong> 2010 Compensation <strong>Report</strong><br />
Compensation Structure<br />
The compensation structure is governed by the contractual agreements with the Management Board members<br />
and comprises both non-performance-related and performance-related components.<br />
Non-Performance-Related Components<br />
The non-performance-related components primarily consist of the base salary and also include other benefits.<br />
The base salary of a full member of the Management Board amounts to € 1,150,000 gross per annum, and that<br />
of the Management Board Chairman amounts to € 1,650,000 gross per annum. The base salaries are disbursed<br />
in each case in equal monthly installments. The last adjustment took place with effect as of January 1, 2010.<br />
Other benefits comprise the monetary value of non-cash benefits such as company cars and driver services,<br />
insurance premiums, expenses for company-related social functions and security measures, including payments,<br />
if applicable, of taxes on these benefits as well as taxable reimbursements of expenses.<br />
Performance-Related Components (Variable Compensation)<br />
These consist of the bonus and the Long-Term Performance Award (“LTPA”). Management Board members<br />
with responsibility for the CIB Group Division also receive an additional division-related compensation component<br />
(“Division Incentive”).<br />
The bonus, for which an individual target figure has been defined (full Management Board member € 1,150,000,<br />
Management Board Chairman € 4,000,000) comprises of two components; these components have a multi-year<br />
basis of assessment and their amounts are each calculated with the half of the target figure and a respective<br />
factor. The first factor depends on our achieved two year average return on equity in comparison to our internal<br />
plan for each respective year. The second factor depends on the amount of our two year achieved average<br />
return on equity to which a pre-defined multiplier is linked. For the 2010 financial year for the second factor only<br />
our 2010 return on equity is considered, as a respective measure for the previous year was not contractually<br />
agreed. Extraordinary effects are not taken into account when determining the return on equity which is basis<br />
for the factors. The bonus calculated accordingly is limited to 150 % of the target figure (a “cap”). The bonus is<br />
not payable if certain previously defined minimum levels are not reached. The calculated bonus may be increased<br />
or reduced by up to 50 % especially in consideration of the individual’s contributions and risk-based factors.<br />
Accordingly, the maximum bonus may amount to 225 % of the target figure.<br />
The LTPA is based on the performance of the <strong>Deutsche</strong> <strong>Bank</strong> share. The LTPA reflects the ratio between our<br />
total shareholder return based on a three year period and the corresponding average figure for a select group<br />
of comparable companies of six leading banks. Of these, two are from the eurozone, two are from Europe<br />
outside the eurozone and another two are from the United States of America (eurozone: Banco Santander and<br />
BNP Paribas; Europe outside the eurozone: Barclays and Credit Suisse; USA: Goldman Sachs and J.P. Morgan<br />
Chase). The amount of the LTPA to be paid to the Management Board members is based on an individual target<br />
figure (full Management Board member € 2,175,000, Management Board Chairman € 4,800,000) and derived<br />
from the achieved relative total shareholder return. In case of an over-performance, a limit of 125 % of the target<br />
figure applies. If our total shareholder return as described is less than the corresponding average of the group<br />
of comparable companies, the disbursal of the LTPA is reduced on a greater than one-to-one basis. If the ratio<br />
specified above moves below a defined minimum value, disbursal is fully forfeited.
<strong>Deutsche</strong> <strong>Bank</strong> 01 – Management <strong>Report</strong> 130<br />
Financial <strong>Report</strong> 2010 Compensation <strong>Report</strong><br />
The amount of the Division Incentive is determined by considering the individual contribution of the Management<br />
Board member with such entitlement as well as the performance of the CIB Group Division (e.g., on the basis<br />
of net income before taxes), also in relation to peers and set targets, as well as risk aspects (e.g., the development<br />
of risk-weighted assets or Value-at-Risk).<br />
Long-Term Incentive<br />
At least 60 % of the variable compensation (bonus, LTPA and if applicable the Division Incentive) is granted as<br />
deferred compensation, so that its delivery is spread out over a longer vesting period and it is subject to forfeiture<br />
until vesting. A minimum of 50 % of deferred compensation is granted as equity-based compensation (Restricted<br />
Equity Awards). The final value of the Restricted Equity Awards depends on the value of the <strong>Deutsche</strong> <strong>Bank</strong><br />
share upon their delivery. The part of the deferred compensation that is not equity-based is granted as deferred<br />
cash-based compensation (Restricted Incentive Awards).<br />
Both the Restricted Equity Awards and the Restricted Incentive Awards vest in four equal tranches, starting<br />
approximately one and a half years after grant and then in intervals of one year, in each case, so that their<br />
vesting stretches over a total period of approximately four and a half years. All deferred compensation components<br />
(Restricted Equity Awards and Restricted Incentive Awards) have a long-term incentive effect as they are subject<br />
to certain forfeiture conditions until they vest. Awards may be forfeited based on a negative Group result, but<br />
also due to individual misconduct (e.g., upon a breach of regulations) or individual negative contributions to<br />
results. Members of the Management Board are not permitted to limit or cancel out the risk in connection with<br />
the deferred compensation components through hedging transactions or other countermeasures.<br />
Holding Periods (Retention Periods)<br />
Once the individual tranches of the Restricted Equity Awards vest, they are subsequently subject to an additional<br />
holding period; only after this holding period has expired may the equities of the respective tranche be disposed<br />
of. The holding period of the first tranche of the Restricted Equity Awards, which vest after approximately one<br />
and a half years, is three years; the holding period of the second tranche of the awards, which vest after approximately<br />
two and a half years, is two years; and the holding period of the third and fourth tranches, which<br />
vest after approximately three and a half and four and a half years, is one year in each case. Accordingly,<br />
Management Board members are first permitted to dispose of the first three tranches of the Restricted Equity<br />
Awards approximately four and half years after they are granted, and of the fourth tranche only after approximately<br />
five and a half years. Not only until they vest, but also during the holding period, the Restricted Equity<br />
Awards are subject to the performance of the <strong>Deutsche</strong> <strong>Bank</strong> share and thus depend on a sustained development<br />
of long-term value.
<strong>Deutsche</strong> <strong>Bank</strong> 01 – Management <strong>Report</strong> 131<br />
Financial <strong>Report</strong> 2010 Compensation <strong>Report</strong><br />
Of the portion of the variable compensation that vests immediately, i.e. up to a maximum of 40 % of the total of<br />
all variable compensation components, a maximum of 50 % of this is paid out immediately and at least 50 % is<br />
granted as equity-based compensation in the form of Equity Upfront Awards. Contrary to the Restricted Equity<br />
Awards, the Equity Upfront Awards are not subject to forfeiture conditions; however, they have a holding period<br />
of three years, and only after this holding period has expired may the awards be disposed of. During this time,<br />
their value is subject to the sustained development of long-term value due to the link to the performance of the<br />
<strong>Deutsche</strong> <strong>Bank</strong> share.<br />
Restricted Equity Awards and Equity Upfront Awards are granted on the basis of the DB Equity Plan, Restricted<br />
Incentive Awards on the basis of the DB Restricted Incentive Plan. For further information on our DB Equity Plan<br />
and DB Restricted Incentive Plan see Note 32 “Share-Based Compensation Plans” and Note 33 “Employee<br />
Benefits” to the consolidated financial statements.<br />
Limitations<br />
In the event of exceptional developments, the total compensation for each Management Board member, including<br />
all variable components, is limited to a maximum amount. A payment of variable compensation elements will not<br />
take place if the payment of variable compensation components is prohibited or restricted by the German Federal<br />
Financial Supervisory Authority in accordance with existing statutory requirements.<br />
The foregoing explains the compensation structure applicable to the 2010 financial year. The compensation<br />
structure applicable to the 2009 financial year differs in certain aspects and is described in the previous year’s<br />
publication. Among other things, for the 2009 financial year, the determination of the bonus was based on the<br />
actually achieved return on equity as compared to a pre-defined plan figure, the average value of total shareholder<br />
returns for purposes of the former MTI was calculated based on a two-year average, the holding period<br />
for both the Restricted Equity Awards and the Restricted Incentive Awards was just below four years, with the<br />
Restricted Equity Awards mainly cliff vesting in November 2013 (with a smaller part thereof vesting in nine equal<br />
tranches) and the Restricted Incentive Awards vesting in three equal tranches, and additional holding periods<br />
did not exist.<br />
Management Board Compensation<br />
In respect of the 2010 financial year, the members of the Management Board received compensation components<br />
for their service on the Management Board totaling € 32,434,836 (2009: € 34,174,619). Thereof,<br />
€ 9,412,500 was base salary (2009: € 5,950,000), € 17,816,227 was performance-related components with<br />
long-term incentives (2009: € 18,637,350) and € 5,206,109 was performance-related components without<br />
long-term incentives (2009: € 9,587,269). In addition, there were other benefits amounting to € 795,338<br />
(2009: € 849,346), so that total compensation of the Management Board members was € 33,230,174 (2009:<br />
€ 35,023,965) collectively. On an individual basis, the Management Board members received the following<br />
compensation components for their service on the Management Board for the years 2010 and 2009.
<strong>Deutsche</strong> <strong>Bank</strong> 01 – Management <strong>Report</strong> 132<br />
Financial <strong>Report</strong> 2010 Compensation <strong>Report</strong><br />
Members of the Management Board<br />
in € Base salary<br />
Nonperformancerelated<br />
components Performance-related components<br />
without long-term<br />
incentives 1<br />
Equity Upfront<br />
Award(s)<br />
(retention) 2<br />
with long-term incentives<br />
Restricted Equity<br />
Award(s)<br />
(deferred plus<br />
retention) 2<br />
Dr. Josef Ackermann 2010 1,650,000 1,034,322 1,086,038 2,534,089 6,304,449<br />
2009 1,150,000 1,575,000 – 4,747,500 7,472,500<br />
Dr. Hugo Bänziger 2010 1,150,000 523,428 549,599 824,399 3,047,426<br />
2009 800,000 1,231,425 – 1,657,500 3,688,925<br />
Michael Cohrs 3 2010 862,500 577,533 606,410 1,350,943 3,397,386<br />
2009 600,000 905,428 – 1,546,575 3,052,003<br />
Jürgen Fitschen 4 2010 1,150,000 507,790 533,180 799,770 2,990,740<br />
2009 600,000 923,569 – 1,243,125 2,766,694<br />
Anshuman Jain 4 2010 1,150,000 992,752 1,042,390 4,367,413 7,552,555<br />
2009 600,000 1,565,428 – 4,884,525 7,049,953<br />
Stefan Krause 2010 1,150,000 539,066 566,019 849,029 3,104,114<br />
2009 800,000 1,231,425 – 1,657,500 3,688,925<br />
Hermann-Josef Lamberti 2010 1,150,000 507,790 533,180 799,770 2,990,740<br />
2009 800,000 1,231,425 – 1,657,500 3,688,925<br />
Rainer Neske 4 2010 1,150,000 523,428 549,599 824,399 3,047,426<br />
2009 600,000 923,569 – 1,243,125 2,766,694<br />
Total 2010 9,412,500 5,206,109 5,466,415 12,349,812 32,434,836<br />
Total 2009 5,950,000 9,587,269 – 18,637,350 34,174,619<br />
1 Immediately paid out.<br />
2 The number of share awards in the form of Equity Upfront Awards (EUA) and Restricted Equity Awards (REA) granted in 2011 for the year 2010 to each member of<br />
the Management Board was determined by dividing the respective Euro amounts by € 44.42, the XETRA closing price of the DB share as of February 2, 2011. As a<br />
result, the number of share awards granted was as follows (rounded): Dr. Ackermann: 24,449 EUA and 57,048 REA, Dr. Bänziger: 12,372 EUA and 18,559 REA, Mr.<br />
Cohrs: 13,651 EUA and 30,412 REA, Mr. Fitschen: 12,003 EUA and 18,004 REA, Mr. Jain: 23,466 EUA and 98,320 REA, Mr. Krause: 12,742 EUA and 19,113 REA,<br />
Mr. Lamberti: 12,003 EUA and 18,004 REA, and Mr. Neske: 12,372 EUA and 18,559 REA.<br />
3 Member of the Management Board from April 1, 2009 until September 30, 2010. Due to U.S. tax rules applicable to Mr. Cohrs the vesting of all awards granted to him<br />
for the financial year 2009 was accelerated prior to maturity and the awards were immediately taxed when he left the <strong>Bank</strong>. The net euro amount of cash awards was<br />
booked into a euro account and the net amount of shares was booked into a securities account both blocked in favor of the <strong>Bank</strong>. They are subject to the payment<br />
and forfeiture conditions which already applied to these awards before their premature vesting. This procedure also applies for the awards granted to him for the<br />
service performed in the financial year 2010.<br />
4 Member of the Management Board since April 1, 2009.<br />
In February 2011, members of the Management Board were granted a total of 401,077 shares in the form of<br />
Restricted Equity Awards and Equity Upfront Awards for their performance in 2010 (2009: 405,349 shares in<br />
the form of Restricted Equity Awards only).<br />
In accordance with German Accounting Standard 17, any claims resulting from deferred cash compensation<br />
subject to further conditions must be disclosed as part of the total compensation only in the financial year of<br />
their vesting (i.e., unconditional payout) and not in the year of grant, which also applies now with respect to the<br />
presentation of the previous year’s compensation data.<br />
Conditional deferred cash compensation totaling € 12,349,812 was granted to the members of the Management<br />
Board as Restrictive Incentive Awards for the 2010 financial year. For each Management Board member such<br />
grants vest beginning in August <strong>2012</strong> in four equal annual tranches in a total amount granted as follows:<br />
Dr. Ackermann € 2,534,089; Dr. Bänziger € 824,399; Mr. Cohrs € 1,350,943 (see note 3 to the table above for<br />
procedure); Mr. Fitschen € 799,770; Mr. Jain € 4,367,413; Mr. Krause € 849,029; Mr. Lamberti € 799,770 and<br />
Mr. Neske € 824,399.<br />
Total
<strong>Deutsche</strong> <strong>Bank</strong> 01 – Management <strong>Report</strong> 133<br />
Financial <strong>Report</strong> 2010 Compensation <strong>Report</strong><br />
For the 2009 financial year the members of the Management Board were granted Restricted Incentive Awards<br />
totaling € 3,955,007. For each Management Board member such grants vest beginning in February 2011 in<br />
three equal annual tranches, in a total amount granted as follows: Dr. Ackermann € 1,925,000; Dr. Bänziger<br />
€ 268,575; Mr. Cohrs € 130,210 (see note 3 to the table above for procedure); Mr. Fitschen € 201,431; Mr. Jain<br />
€ 691,210; Mr. Krause € 268,575; Mr. Lamberti € 268,575 and Mr. Neske € 201,431.<br />
The following table shows the other non-performance-related benefits for the 2010 and 2009 financial years.<br />
Members of the Management Board Other benefits<br />
in € 2010 2009<br />
Dr. Josef Ackermann 148,723 154,030<br />
Dr. Hugo Bänziger 54,833 51,388<br />
Michael Cohrs 1 56,218 39,661<br />
Jürgen Fitschen 2 130,171 131,111<br />
Anshuman Jain 2 77,671 52,697<br />
Stefan Krause 136,953 58,267<br />
Hermann-Josef Lamberti 91,505 102,123<br />
Rainer Neske 2 99,264 260,069<br />
Total 795,338 849,346<br />
1 Member of the Management Board from April 1, 2009 until September 30, 2010.<br />
2 Member of the Management Board since April 1, 2009.<br />
Management Board members do not receive any compensation for mandates on boards of our subsidiaries.<br />
Pension benefits and transition payments<br />
The members of the Management Board are entitled to a contribution-oriented pension plan. Under this contribution-oriented<br />
pension plan, a personal pension account has been set up for each participating member of the<br />
Management Board (after appointment to the Management Board). A contribution is made annually by us into<br />
this pension account. This annual contribution is calculated using an individual contribution rate on the basis of<br />
each member’s base salary and bonus up to a defined ceiling and accrues interest credited in advance, determined<br />
by means of an age-related factor, at an average rate of 6 % per year up to the age of 60. From the age<br />
of 61 on, the pension account is credited with an annual interest payment of 6 % up to the date of retirement.<br />
The annual payments, taken together, form the pension amount which is available to pay the future pension<br />
benefit. Under defined conditions, the pension may as well fall due for payment before a regular pension event<br />
(age limit, disability or death) has occurred. The pension right is vested from the start. Management Board<br />
members entitled to a Division Incentive do not participate in this pension plan.<br />
Based on former contractual agreements individual Management Board members have additional entitlements:<br />
Dr. Ackermann and Mr. Lamberti are entitled, under defined conditions, after they have left the Management<br />
Board, to a monthly pension payment of € 29,400 each under a prior pension entitlement.<br />
Dr. Ackermann, Dr. Bänziger and Mr. Lamberti are entitled to a transition payment for a period of six months<br />
under defined conditions. Exceptions to this arrangement exist where, for instance, the Management Board<br />
member gives cause for summary dismissal. The transition payment a Management Board member would<br />
have received over this six months period, if he had left on December 31, 2010 or on December 31, 2009, was<br />
for Dr. Ackermann € 2,825,000 and for each of Dr. Bänziger and Mr. Lamberti € 1,150,000.
<strong>Deutsche</strong> <strong>Bank</strong> 01 – Management <strong>Report</strong> 134<br />
Financial <strong>Report</strong> 2010 Compensation <strong>Report</strong><br />
If Dr. Ackermann and Mr. Lamberti leave office after reaching the age of 60, they are each subsequently entitled,<br />
under defined conditions, directly after the end of the six-month transition period, to payment of first 75 % and<br />
then 50 % of the sum of his salary and last target bonus, each for a period of 24 months. This payment ends no<br />
later than six months after the end of the <strong>Annual</strong> General Meeting in the year in which the Board member reaches<br />
his 65th birthday.<br />
The following table shows the annual additions to provisions for obligations regarding pension benefits and<br />
transition payments for the years ended December 31, 2010 and December 31, 2009 and the related Defined<br />
Benefit Obligation at the respective dates for the individual members of the Management Board. The different<br />
sizes of the balances are due to the different length of services on the Management Board, the respective agerelated<br />
factors, the different contribution rates as well as the individual pensionable compensation amounts and<br />
the previously mentioned additional individual entitlements.<br />
Members of the Management Board 1<br />
Additions to provisions for<br />
Present value of the defined<br />
benefit obligation for pension<br />
pension benefits and transition benefits and transition<br />
in €<br />
payments, year ended payments, end of year<br />
Dr. Josef Ackermann 2010 1,263,161 13,236,187<br />
2009 – 3<br />
11,973,026<br />
Dr. Hugo Bänziger 2010 670,727 2,161,491<br />
2009 342,949 1,490,764<br />
Jürgen Fitschen 2 2010 244,364 307,348<br />
2009 62,984 62,984<br />
Stefan Krause 2010 550,405 825,181<br />
2009 166,891 274,776<br />
Hermann-Josef Lamberti 2010 1,223,474 11,177,275<br />
2009 2,488,164 9,953,801<br />
Rainer Neske 2 2010 461,013 575,398<br />
2009 114,385 114,385<br />
1 Other members of the Management Board are not entitled to such benefits after appointment to the Management Board.<br />
2 Member of the Management Board since April 1, 2009.<br />
3 No addition to provision required in 2009.<br />
Other termination benefits<br />
The Management Board members are principally entitled to receive a severance payment upon a premature<br />
termination of their appointment at our initiative, without us having been entitled to revoke the appointment or<br />
give notice under the contractual agreement for cause. The severance payment, as a rule, will not exceed the<br />
lesser of two annual compensation amounts and the claims to compensation for the remaining term of the<br />
contract (compensation calculated on the basis of the annual compensation for the previous financial year).<br />
If a Management Board member departs in connection with a change of control, he is under certain conditions<br />
in principle entitled to a severance payment. The severance payment, as a rule, will not exceed the lesser of<br />
three annual compensation amounts and the claims to compensation for the remaining term of the contract.<br />
The calculation of the compensation is based on the annual compensation for the previous financial year.<br />
The severance payment mentioned before is determined by the Supervisory Board in its reasonable discretion.<br />
In principle, the disbursement of the severance payment takes place in two installments; the second installment<br />
is subject to certain forfeiture conditions until vesting.
<strong>Deutsche</strong> <strong>Bank</strong> 01 – Management <strong>Report</strong> 135<br />
Financial <strong>Report</strong> 2010 Compensation <strong>Report</strong><br />
Expense for Long-Term Incentive Components<br />
The following table presents the compensation expense recognized in the respective years for long-term incentive<br />
components of compensation granted for service on the Management Board.<br />
Members of the Management Board Amount expensed<br />
in € 2010 2009<br />
Dr. Josef Ackermann 2,822,092 2,013,402<br />
Dr. Hugo Bänziger 710,357 810,967<br />
Michael Cohrs 1,2 1,610,543 –<br />
Jürgen Fitschen 2,3 399,153 –<br />
Anshuman Jain 2,3 2,227,846 –<br />
Stefan Krause 2 529,864 –<br />
Hermann-Josef Lamberti 729,448 902,559<br />
Rainer Neske 2,3 399,153 –<br />
1 Member of the Management Board from April 1, 2009 until September 30, 2010.<br />
2 No long-term incentive component was granted before 2009 for service on the Management Board.<br />
3 Member of the Management Board since April 1, 2009.<br />
Management Board Share Ownership<br />
As of February 18, 2011 and February 19, 2010, respectively, the current members of our Management Board<br />
held the following numbers of our shares and share awards.<br />
Members of the Management Board<br />
Number of<br />
shares<br />
Number of<br />
share awards 1<br />
Dr. Josef Ackermann 2011 560,589 259,596<br />
2010 355,474 197,260<br />
Dr. Hugo Bänziger 2011 55,531 100,520<br />
2010 36,116 89,402<br />
Jürgen Fitschen 2011 169,008 92,671<br />
2010 98,339 86,747<br />
Anshuman Jain 2011 457,192 414,906<br />
2010 338,717 433,046<br />
Stefan Krause 2011 – 71,363<br />
2010 – 36,049<br />
Hermann-Josef Lamberti 2011 125,291 98,626<br />
2010 97,740 78,190<br />
Rainer Neske 2011 60,509 90,875<br />
2010 42,547 75,395<br />
Total 2011 1,428,120 1,128,557 2<br />
Total 2010 968,933 996,089<br />
1 Including the share awards Mr. Fitschen, Mr. Jain and Mr. Neske received in connection with their employment by us prior to their appointment as member of the<br />
Management Board. The share awards listed in the table have different vesting and allocation dates. The last share awards will be allocated in August 2016.<br />
2 Thereof 89,904 vested.
<strong>Deutsche</strong> <strong>Bank</strong> 01 – Management <strong>Report</strong> 136<br />
Financial <strong>Report</strong> 2010 Compensation <strong>Report</strong><br />
To counterbalance the economic disadvantages for share award owners resulting from the capital increase<br />
which took place in September 2010, additional share awards were granted. Each Management Board member<br />
who was appointed in September 2010 received additional share awards of approximately 9.59 % of his outstanding<br />
share awards as of September 21, 2010 of the same category (in total 76,767 share awards for all<br />
Management Board members together). The respective share awards are included in the number of share<br />
awards for 2011 as presented in the table above.<br />
The current members of our Management Board held an aggregate of 1,428,120 of our shares on February 18,<br />
2011, amounting to approximately 0.16 % of our shares issued on that date. They held an aggregate of 968,933<br />
of our shares on February 19, 2010, amounting to approximately 0.16 % of our shares issued on that date.<br />
The number of shares delivered in 2010 to the members of the Management Board active in 2010 from deferred<br />
compensation awards granted in prior years amounted to 726,208.<br />
For more information on share awards in the table above granted under the share plans, see Note 32 “Share-<br />
Based Compensation Plans” to the consolidated financial statements.<br />
Compensation System for Supervisory Board Members<br />
The principles of the compensation of the Supervisory Board members are set forth in our Articles of Association,<br />
which our shareholders amend from time to time at their <strong>Annual</strong> General Meetings. Such compensation<br />
provisions were last amended at our <strong>Annual</strong> General Meeting on May 24, 2007. The following provisions apply<br />
to the 2010 financial year:<br />
Compensation consists of a fixed compensation of € 60,000 per year and a dividend-based bonus of € 100 per<br />
year for every full or fractional € 0.01 increment by which the dividend we distribute to our shareholders exceeds<br />
€ 1.00 per share. The members of the Supervisory Board also receive annual remuneration linked to our longterm<br />
profits in the amount of € 100 each for each € 0.01 by which the average earnings per share (diluted),<br />
reported in our financial statements in accordance with the accounting principles to be applied in each case on<br />
the basis of the net income figures for the three previous financial years, exceed the amount of € 4.00.<br />
These amounts increase by 100 % for each membership in a committee of the Supervisory Board. For the<br />
chairperson of a committee the rate of increment is 200 %. These provisions do not apply to the Mediation<br />
Committee formed pursuant to Section 27 (3) of the Co-determination Act. We pay the Supervisory Board<br />
Chairman four times the total compensation of a regular member, without any such increment for committee<br />
work, and we pay his deputy one and a half times the total compensation of a regular member. In addition, the<br />
members of the Supervisory Board receive a meeting fee of € 1,000 for each Supervisory Board and committee<br />
meeting which they attend. Furthermore, in our interest, the members of the Supervisory Board will be<br />
included in any financial liability insurance policy held in an appropriate amount by us, with the corresponding<br />
premiums being paid by us.<br />
We also reimburse members of the Supervisory Board for all cash expenses and any value added tax (Umsatzsteuer,<br />
at present 19 %) they incur in connection with their roles as members of the Supervisory Board.<br />
Employee representatives on the Supervisory Board also continue to receive their employee benefits. For<br />
Supervisory Board members who served on the board for only part of the year, we pay a fraction of their total<br />
compensation based on the number of months they served, rounding up to whole months.
<strong>Deutsche</strong> <strong>Bank</strong> 01 – Management <strong>Report</strong> 137<br />
Financial <strong>Report</strong> 2010 Compensation <strong>Report</strong><br />
The members of the Nomination Committee, which has been newly formed after the <strong>Annual</strong> General Meeting<br />
2008, waived all remuneration, including the meeting fee, for such Nomination Committee work for 2009 and<br />
the following years, as in the previous years.<br />
Supervisory Board Compensation for Fiscal Year 2010<br />
We compensate our Supervisory Board members after the end of each fiscal year. In January 2011, we paid<br />
each Supervisory Board member the fixed portion of their remuneration and meeting fees for services in 2010.<br />
In addition, we will generally pay each Supervisory Board member a remuneration linked to our long-term<br />
performance as well as a dividend-based bonus, as defined in our Articles of Association, for their services in<br />
2010. Assuming that the <strong>Annual</strong> General Meeting in May 2011 approves the proposed dividend of € 0.75 per<br />
share, the Supervisory Board will not receive any variable remuneration. The total remuneration will be<br />
€ 2,453,000 (2009: € 2,561,316).<br />
Individual members of the Supervisory Board received the following compensation for the 2010 financial year<br />
(excluding statutory value added tax).<br />
Members of the Supervisory Board Compensation for fiscal year 2010 Compensation for fiscal year 2009<br />
in € Fixed Variable Meeting fee Total Fixed Variable Meeting fee Total<br />
Dr. Clemens Börsig 240,000 – 31,000 271,000 240,000 13,733 28,000 281,733<br />
Karin Ruck 210,000 – 25,000 235,000 210,000 12,017 23,000 245,017<br />
Wolfgang Böhr 60,000 – 9,000 69,000 60,000 3,433 7,000 70,433<br />
Dr. Karl-Gerhard Eick 180,000 – 13,000 193,000 180,000 10,300 16,000 206,300<br />
Heidrun Förster 1 70,000 – 14,000 84,000 120,000 6,867 14,000 140,867<br />
Alfred Herling 85,000 – 12,000 97,000 60,000 3,433 7,000 70,433<br />
Gerd Herzberg 60,000 – 9,000 69,000 60,000 3,433 7,000 70,433<br />
Sir Peter Job 180,000 – 14,000 194,000 180,000 10,300 22,000 212,300<br />
Prof. Dr. Henning Kagermann 120,000 – 13,000 133,000 120,000 6,867 12,000 138,867<br />
Peter Kazmierczak 2 30,000 – 3,000 33,000 – – – –<br />
Martina Klee 60,000 – 9,000 69,000 60,000 3,433 7,000 70,433<br />
Suzanne Labarge 120,000 – 13,000 133,000 120,000 6,867 12,000 138,867<br />
Maurice Lévy 60,000 – 7,000 67,000 60,000 3,433 6,000 69,433<br />
Henriette Mark 120,000 – 15,000 135,000 120,000 6,867 16,000 142,867<br />
Gabriele Platscher 60,000 – 9,000 69,000 60,000 3,433 7,000 70,433<br />
Dr. Theo Siegert 120,000 – 12,000 132,000 120,000 6,867 12,000 138,867<br />
Dr. Johannes Teyssen 60,000 – 8,000 68,000 60,000 3,433 7,000 70,433<br />
Marlehn Thieme 120,000 – 13,000 133,000 120,000 6,867 15,000 141,867<br />
Tilman Todenhöfer 120,000 – 18,000 138,000 120,000 6,867 14,000 140,867<br />
Stefan Viertel 3 25,000 – 2,000 27,000 – – – –<br />
Werner Wenning 60,000 – 8,000 68,000 60,000 3,433 7,000 70,433<br />
Leo Wunderlich 4 30,000 – 6,000 36,000 60,000 3,433 7,000 70,433<br />
Total 2,190,000 – 263,000 2,453,000 2,190,000 125,316 246,000 2,561,316<br />
1 Member until July 31, 2010.<br />
2 Member since July 1, 2010.<br />
3 Member since August 1, 2010<br />
4 Member until June 30, 2010.
<strong>Deutsche</strong> <strong>Bank</strong> 01 – Management <strong>Report</strong> 138<br />
Financial <strong>Report</strong> 2010 Corporate and Social Responsibility<br />
Corporate and Social Responsibility<br />
Employees and Social Responsibility<br />
Employees<br />
As of December 31, 2010, we employed a total of 102,062 staff members as compared to 77,053 as of December<br />
31, 2009. We calculate our employee figures on a full-time equivalent basis, meaning we include proportionate<br />
numbers of part-time employees.<br />
The following table shows our numbers of full-time equivalent employees as of December 31, 2010, 2009 and<br />
2008.<br />
Employees 1 Dec 31, 2010 Dec 31, 2009 Dec 31, 2008<br />
Germany 49,265 27,321 27,942<br />
Europe (outside Germany), Middle East and Africa 23,806 22,031 23,073<br />
Asia/Pacific 17,779 16,518 17,120<br />
North America 2,3 10,811 10,815 11,947<br />
Central and South America 401 368 374<br />
Total employees 3 102,062 77,053 80,456<br />
1 Full-time equivalent employees; in 2010, the employees of Kazakhstan previously shown in Asia/Pacific were assigned to Europe (outside Germany), Middle East<br />
and Africa; numbers for 2009 (6 employees) and 2008 (6 employees) have been reclassified to reflect this.<br />
2 Primarily the United States.<br />
3 The nominal headcount of The Cosmopolitan of Las Vegas is 4,147 as of December 31, 2010 and is composed of full time and part time employees. It is not part of<br />
the full time equivalent employees figures.<br />
The number of our employees increased in 2010 by 25,009 or 32.5 % due to the following factors:<br />
— The number of Corporate & Investment <strong>Bank</strong> Group Division staff increased by 1,752 primarily due to the<br />
acquisition of parts of ABN AMRO in the Netherlands (1,195). Furthermore, the number of Markets staff increased<br />
by 374 as a result of the market recovery.<br />
— The number of our PCAM staff increased by 21,973 primarily due to the acquisitions of <strong>Deutsche</strong> Postbank<br />
AG in Germany (20,361) and of Sal Oppenheim Group (2,910 as at year end 2010).<br />
— In Infrastructure, the number of our global service centers staff, in particular in India, the Philippines, Birmingham<br />
(U.K.) and Jacksonville (U.S.), increased by approximately 1,200 employees. The headcount in the<br />
other infrastructure areas remained, on balance, unchanged from 2009.<br />
The commitment index, a measure of staff loyalty to the company based on a Groupwide survey that has been<br />
performed anonymously by an independent institution for more than ten years, remained strong in 2010 at 74<br />
points. This is the second highest value since the survey began, indicating that employees continue to closely<br />
identify with the bank and are particularly willing to put in a strong performance. The slight reduction in comparison<br />
to the record of 77 points in 2009 primarily reflects an easing of economic tension or return to normality after<br />
the financial crisis.<br />
Post-Employment Benefit Plans<br />
We sponsor a number of post-employment benefit plans of behalf of our employees, both defined contribution<br />
plans and defined benefit plans.<br />
Defined benefit plans with a benefit obligation exceeding € 2 million are included in our globally coordinated<br />
accounting process. Reviewed by our global actuary, the plans in each country are evaluated by locally appointed<br />
actuaries.
<strong>Deutsche</strong> <strong>Bank</strong> 01 – Management <strong>Report</strong> 139<br />
Financial <strong>Report</strong> 2010 Corporate and Social Responsibility<br />
By applying our global principles for determining the financial and demographic assumptions we ensure that<br />
the assumptions are unbiased and mutually compatible and that they follow the best estimate and ongoing<br />
plan principles.<br />
For a further discussion on our employee benefit plans see Note 33 “Employee Benefits” to our consolidated<br />
financial statements.<br />
Corporate Social Responsibility<br />
Building social capital<br />
<strong>Deutsche</strong> <strong>Bank</strong> was one of the main initiators and first signatories of the “Code of Responsible Conduct for<br />
Business”, launched in November 2010 of 21 German companies. With this code, we intend to integrate social<br />
responsibility even more closely in our business processes and duly consider it in all our decisions.<br />
Corporate Social Responsibility means more to us than donating money: we want to build social capital – for<br />
our own good. In the year under review, the bank and its staff took part in a wide range of social projects both<br />
in Germany and abroad. We invested nearly € 100 million – more than ever – in educational, social, art and music<br />
projects, in addition to our employee volunteering activities.<br />
Sustainability: Ensuring viability<br />
<strong>Deutsche</strong> <strong>Bank</strong> has been committed to the principle of sustainable development and consistently implements it<br />
along the accepted Environmental, Social and Governance dimensions of sustainability. On the way to full<br />
carbon-neutrality of our operational activities from 2013 onwards we achieved our annual carbon reduction<br />
objective for 2010 and moved back into our headquarters in Frankfurt after a 3-year retrofit program to become<br />
one of the most environmental-friendly skyscrapers worldwide. The bank’s internal guidelines for risk management<br />
have been expanded by a “Green Filter” tool in order to include the carbon impact of transactions in our<br />
decision processes. Our commitment to sustainability is documented in particular by our long-time membership<br />
in the UN Global Compact and the signing of the Principles for Responsible Investment (PRI) of the United<br />
Nations.<br />
The Global Metro Summit in 2010, organized by <strong>Deutsche</strong> <strong>Bank</strong>’s Alfred Herrhausen Society, focused on stable<br />
and sustainable economic concepts for metropolitan regions. The conference expands the Urban Age network,<br />
first established in 2005, providing a forum for international experts to discuss the challenges facing the world’s<br />
mega cities.<br />
Education: Enabling talent<br />
Even today, it is not talent but social origin which, in many cases, determines a person’s educational advancement.<br />
<strong>Deutsche</strong> <strong>Bank</strong> is strongly committed to equality of opportunity and the fair promotion of talent. In 2010<br />
we launched “FairTalent”, an initiative that provides targeted individual assistance to underprivileged, but highly<br />
talented children. <strong>Deutsche</strong> <strong>Bank</strong> employees also serve as mentors.
<strong>Deutsche</strong> <strong>Bank</strong> 01 – Management <strong>Report</strong> 140<br />
Financial <strong>Report</strong> 2010 Corporate and Social Responsibility<br />
In order to intensify the exchange between the academic and the business world <strong>Deutsche</strong> <strong>Bank</strong> has established<br />
a chair of finance at Bocconi University in Milan and the Luxembourg School of Finance. Moreover, we facilitated<br />
a new professorship at the Goethe University Frankfurt’s House of Finance and significantly increased our<br />
financial support for the European School of Management and Technology in Berlin.<br />
Social Investments: Creating opportunity<br />
In 2010 <strong>Deutsche</strong> <strong>Bank</strong> successfully completed the Eye Fund, an innovative investment vehicle amounting to<br />
USD 14.5 million, which provides start-up financing for the expansion of eye care clinics in the world’s poorer<br />
regions. We support the renewal of infrastructure in economically deprived communities in the United States<br />
through loans and investments. For this work, the Federal Reserve <strong>Bank</strong> awarded us an “outstanding” rating<br />
for the 19th time.<br />
The year was overshadowed by a number of natural catastrophes, among them earthquakes in Haiti and<br />
Chile and floods in Pakistan. <strong>Deutsche</strong> <strong>Bank</strong>, its foundations, clients and staff together contributed more than<br />
€ 5 million to the people affected by these disasters. Wherever possible, our employees support relief action<br />
locally – fulfilling our claim of giving more than money.<br />
Art and Music: Fostering creativity<br />
The <strong>Deutsche</strong> <strong>Bank</strong> Collection in the newly renovated Head Office in Frankfurt am Main has been rejuvenated<br />
and made clearly more international. Around 1,500 artworks by 100 artists from more than 40 countries invite<br />
the viewer to embark on a journey through the contemporary global art scene. Our ongoing commitment to art<br />
in the workplace of more than 900 <strong>Deutsche</strong> <strong>Bank</strong> locations worldwide was honoured by the 2010 Art & Work<br />
award.<br />
The work of the Kenyan-born and New York-based artist Wangechi Mutu, selected in 2010 to be our first “Artist<br />
of the Year”, was the subject of an exhibition at the <strong>Deutsche</strong> Guggenheim in Berlin. With this new award, we<br />
promote aspiring young artists from around the world.<br />
Via an exclusive partnership, <strong>Deutsche</strong> <strong>Bank</strong> has enjoyed close links with the Berliner Philharmoniker for many<br />
years. In 2010, the orchestra toured Australia for the first time and realized a Zukunft@BPhil project there.<br />
Zukunft@BPhil aims to open up new and creative experiences for children and young people and introduce<br />
them to classical music through workshops and dance projects. More than 18,000 children and young people<br />
have participated in the program worldwide since 2002.<br />
Corporate Volunteering: Committing ourselves<br />
In the year under review, more than 17,000 of our employees supported over 3,000 community projects around<br />
the world. <strong>Deutsche</strong> <strong>Bank</strong> supports this personal commitment with either paid leave or donations to the charitable<br />
partners.<br />
The “Partners in Leadership” program, in which <strong>Deutsche</strong> <strong>Bank</strong> senior managers advise school administrators<br />
on management issues, was the winner of the “European Employee Volunteering Award – Germany”. In the<br />
United Kingdom, the bank raised 1 million pounds for the AfriKids program as part of the “Charity of the Year<br />
2010” initiative.<br />
Further information on our corporate social responsibility activities can be found in our “Corporate Social<br />
Responsibility <strong>Report</strong> 2010” and at www.db.com / csr.
<strong>Deutsche</strong> <strong>Bank</strong> 01 – Management <strong>Report</strong> 141<br />
Financial <strong>Report</strong> 2010 Outlook<br />
Outlook<br />
The Global Economy<br />
The V-shaped economic recovery in key industrialized economies, and especially emerging markets, came to<br />
an end in autumn 2010 as the impact of special factors tapered off and growth normalized. Furthermore, several<br />
countries, particularly those on the periphery of the eurozone, have implemented restrictive fiscal policies and<br />
many other countries will follow suit in the course of 2011. The same can be said of monetary policy. A number<br />
of countries have already implemented a monetary policy turnaround, such as Australia, Norway, China and<br />
many other emerging market economies. The European Central <strong>Bank</strong> will probably start to exit its extremely<br />
lax monetary policy around the middle of the year, and the U.S. Federal Reserve may follow towards the end of<br />
the year. Global economic growth is therefore likely to slow to around 4.25 % in 2011. However, this would still<br />
be distinctly above the average growth rate of the past three decades. There has been a noticeable decline in<br />
the risks to U.S. growth recently, not least thanks to improved economic indicators. The U.S. economy could<br />
grow by 3.75 % this year. For the Asian emerging markets, we are expecting more balanced and sustainable<br />
growth of around 8 %, following 9.5 % in 2010.<br />
The exceptional situation facing monetary and fiscal policymakers in the wake of the crisis may entail risks for<br />
the global economy. While a smooth exit from the highly expansive policies would be desirable to counter the<br />
risk of inflation, this poses a huge challenge given the major uncertainty about economic fundamentals, the<br />
stability of individual areas of the financial system, and market reactions to specific exit measures. Sovereign<br />
risk may remain an issue in 2011 if some countries fail to convince the financial markets that they will be able<br />
to stabilize their fiscal position in the long term. A worsening of the debt crisis in some eurozone countries could<br />
also lead to a destabilization of the banking systems, which would pose major difficulties for a change in monetary<br />
policy direction. In China and other emerging market economies, there is a risk not only of price bubbles in<br />
the real estate sector but also of a general acceleration in inflation. All of these factors may result in turmoil in<br />
the financial markets, which would in turn dampen the pace of the global economic recovery.<br />
Persistent underutilized production capacity in the industrialized countries should contain inflationary pressures,<br />
which are stemming primarily from rising energy and food prices. In the U.S, we expect the inflation rate to<br />
accelerate to a good 2 % this year. The eurozone inflation is likely to accelerate from 1.6 % to 2.25 %, also<br />
driven by some steep tax increases in the peripheral states.<br />
Economic growth in the eurozone is expected to slow to almost 1.5 % in 2011, with the uneven trend continuing.<br />
The Greek and Portuguese economies are likely to contract during the course of this year in view of drastic<br />
consolidation measures, and the Spanish and Irish economies will more or less stagnate. Among the larger<br />
eurozone countries, Germany should again have the highest growth rate of 2.5 %, continuing to expand<br />
beyond potential. German private consumption should expand by almost 1.5 % after almost stagnating in recent<br />
years. Unemployment in Germany is expected to decline further. In 2011, the average number of people<br />
unemployed could fall below the 3 million mark, with the unemployment rate close to 7 %, compared with 7.7 %<br />
in 2010. Strong economic activity and the effects of the austerity package should ensure that the general government<br />
deficit in Germany is brought below the 3 % Maastricht limit in 2011.
<strong>Deutsche</strong> <strong>Bank</strong> 01 – Management <strong>Report</strong> 142<br />
Financial <strong>Report</strong> 2010 Outlook<br />
In Germany, we are expecting inflation of 2 % in 2011, compared with 1.1 % in 2010. Rising food prices pose an<br />
inflation risk for some emerging market countries, in particular, as the proportion of food in their basket of goods<br />
is higher than in industrialized countries.<br />
In <strong>2012</strong> we expect global growth to pick up again by about 0.25 percentage points to 4.5 % with all major regions<br />
showing some gain. Among the industrial countries the biggest improvement should be seen in Japan, whereas<br />
the German economy will decelerate towards its potential growth rate. Within emerging markets growth rates<br />
should remain more or less unchanged in Asia and Latin America compared to 2011, but should increase slightly<br />
in the EMEA countries.<br />
Inflation rates in the emerging markets as well as in the industrialized economies are expected to decline a little<br />
in <strong>2012</strong>, after this year’s energy and food driven spike in 2011. Industrial economies will – with the exception of<br />
Japan – continue to tighten monetary and fiscal policy. In the emerging markets the stance of monetary policy<br />
should not change that much overall, given more active policy in 2010 and 2011.<br />
The <strong>Bank</strong>ing Industry<br />
<strong>Bank</strong>s across the globe will face major challenges in 2011 and <strong>2012</strong>. On the one hand, they will focus on raising<br />
revenues and profitability further in a new macroeconomic environment, while at the same time maintaining<br />
cost discipline. On the other hand, financial institutions must be ready to meet numerous new regulatory requirements,<br />
which in some cases will necessitate substantial adjustments to their business models.<br />
Both household and corporate lending have shown the first signs of recovery and the trend is expected to<br />
continue. Sustained low interest rates and improving income and earnings prospects could well boost risk<br />
appetite and prompt a noticeable increase in lending volumes for the first time since the financial crisis. At the<br />
same time, however, growth potential is limited as the private sector remains highly indebted in many countries;<br />
in addition, as soon as interest rates begin to normalize, debt service payments will rise again. Persistent and<br />
relatively high unemployment in a number of countries is also likely to dampen loan demand.<br />
Deposit business is expected to be influenced by several opposing trends. On the one hand, as the Basel III<br />
liquidity and funding rules are implemented in the coming years, stable funding sources grow in importance for<br />
banks and their demand for private-sector deposits may increase. On the other hand, the ongoing economic<br />
upswing and a growing risk of inflation make this stable but relatively low return asset class less attractive for<br />
households and companies. As a result, banks will very likely encounter higher deposit funding costs.<br />
Asset management ought to be driven by the key factors described above over the next two years. The improved<br />
state of the economy with higher incomes and reduced unemployment, increased valuations and greater risk<br />
appetite should lead to growing inflows, which in turn have a positive effect on valuations.
<strong>Deutsche</strong> <strong>Bank</strong> 01 – Management <strong>Report</strong> 143<br />
Financial <strong>Report</strong> 2010 Outlook<br />
Revenues and profits in investment banking, by contrast, will probably remain under pressure for the time being,<br />
even though client activity should be relatively supportive. Despite the financial crisis, the consolidation of providers<br />
has made little headway; in fact, since the end of the crisis, some market participants have invested in expanding<br />
their capacities again, thereby giving rise to intense competition. In addition, primarily because of regulatory<br />
requirements, the financial service providers’ cost base has become less flexible and now involves a higher<br />
proportion of fixed costs, making banks more vulnerable to volatile revenue developments. This effect is augmented<br />
by cutbacks in proprietary trading and a stronger concentration on flow business for clients, as endorsed<br />
by banks, supervisors and legislators. Finally, the new regulations under Basel 2.5 and Basel III will doubtless<br />
lead to higher (capital) costs and narrower margins (in derivatives business, for instance), create greater hurdles<br />
for securitizations and substantially reduce volumes in certain market segments.<br />
The general outlook for capital markets business is also mixed. While debt issuance could be strong across<br />
financial institutions and corporates, there are substantial downside risks, especially in the high-yield segment.<br />
Equity capital raisings, on the other hand, are likely to remain at a solid level, and companies may significantly<br />
intensify their M&A activities.<br />
Global risks for the banking industry above all relate to an unexpectedly weak recovery of the world economy<br />
from the financial and economic crisis, a potential sovereign default and overly costly and internationally fragmented<br />
new regulations. In the latter respect, it is not just a question of how to implement the new Basel rules<br />
as consistently as possible, but also of establishing clear resolution mechanisms for failed banks and avoiding<br />
discriminatory specific bank levies.<br />
The <strong>Deutsche</strong> <strong>Bank</strong> Group<br />
<strong>Deutsche</strong> <strong>Bank</strong> Management has taken a series of steps to ensure that the bank is positioned strongly to exploit<br />
the competitive opportunities which are arising after the crisis. We have made progress on all four elements set<br />
out in Phase 4 of our Management Agenda. This ensures that the foundation for achievement of the 2011<br />
target is in place. In particular, in our CIB businesses, we have further integrated the investment bank, which is<br />
expected to deliver € 0.5 billion net benefit in 2011. Furthermore, we have increased our market presence in<br />
the Netherlands via the acquisition of the commercial banking activities of ABN AMRO. This progress was<br />
achieved while maintaining our risk discipline. In PCAM, we have strengthened our leading position in our<br />
home market Germany with the takeover of Postbank, concluded the alignment of Sal. Oppenheim and completed<br />
the restructuring of our Asset Management business. Meanwhile, we have continued to build out our<br />
platform in Asia, where we are already well-positioned in all our core businesses, and decided to increase our<br />
stake in Hua Xia <strong>Bank</strong>. We are also continuing to focus on our performance and improving efficiency and<br />
accountability with our Complexity Reduction Program, which is on track to have all prerequisites in place by<br />
the end of 2011 to deliver annual efficiency gains of € 1 billion, starting in <strong>2012</strong>. In 2011, the program should<br />
achieve € 0.6 billion net savings.
<strong>Deutsche</strong> <strong>Bank</strong> 01 – Management <strong>Report</strong> 144<br />
Financial <strong>Report</strong> 2010 Outlook<br />
Like comparable institutions in the banking industry, <strong>Deutsche</strong> <strong>Bank</strong> will continue to be impacted both by the<br />
changing competitive landscape and a stricter regulatory environment. The impact of any potential bank levies<br />
currently being discussed in a number of countries cannot yet be quantified with a reasonable degree of accuracy.<br />
We will continue to participate constructively in the discussions with law makers and regulators to promote a<br />
globally coordinated approach. Having successfully raised equity and Tier 1 capital, we feel well equipped with<br />
capital. We expect to satisfy the new capital requirements under Basel III, which have to be implemented by<br />
2019, already in 2013. Capital adequacy, risk management and balance sheet efficiency will therefore remain<br />
increasingly important as competitive differentiators. <strong>Deutsche</strong> <strong>Bank</strong> will retain a balanced dividend policy which<br />
also considers these factors.<br />
As part of Phase 4 of <strong>Deutsche</strong> <strong>Bank</strong>’s Management Agenda, we outlined a target for income before income<br />
taxes from our core businesses CIB and PCAM of € 10 billion in 2011. Achievement of this target is contingent<br />
upon the successful implementation of the Complexity Reduction Program and the CIB integration as well as<br />
certain environmental assumptions. These assumptions include continued macroeconomic recovery, no further<br />
market dislocations and a normalization of asset valuations. While interest rates are factored in at current low<br />
levels, we expect growth in global fee pools and margins to remain above pre-crisis levels. Further assumptions<br />
and the contribution of our businesses to the target are detailed in the sections below.<br />
Our Corporate Investments group division, which is not part of our target for 2011, has management responsibility<br />
for certain assets that were transferred from other corporate divisions. The division is exposed to the<br />
opportunities and risks arising from the business environment could be impacted by the business environment<br />
of the key holdings in its portfolio in which these companies operate as well as equity risk from nonconsolidated<br />
investments.<br />
Beyond 2011, we should be able to reap further benefits from our strengthened set-up as a home market leader<br />
and a global investment bank. The new <strong>Deutsche</strong> <strong>Bank</strong> will be well capitalized, with an expected Core Tier 1<br />
ratio above 8 %. We also expect a more balanced earnings mix, with our classical banking businesses PCAM<br />
and GTB contributing more than 40 % of pre-tax profit and more efficient operations with a cost-income ratio of<br />
around 65 %.<br />
Corporate <strong>Bank</strong>ing & Securities<br />
The investment banking environment in 2011 and <strong>2012</strong> should remain relatively supportive, although uncertainty<br />
around the impact of regulation and the sovereign debt crisis will persist, impacting activity. Nevertheless, capital<br />
markets activity should remain robust, especially in emerging markets. Corporate Finance fee pools should<br />
continue to recover in 2011 and <strong>2012</strong>, as corporate balance sheets remain healthy and high yield companies<br />
and financial institutions continue to issue debt. Trading volumes will remain robust and may increase if investor<br />
sentiment improves and the shift to centralized clearing of over-the-counter derivatives may also increase activity<br />
in these products. After significant normalization to lower levels over the past two years, margins should now<br />
remain stable and could increase if regulatory reform creates barriers to entry in the industry.
<strong>Deutsche</strong> <strong>Bank</strong> 01 – Management <strong>Report</strong> 145<br />
Financial <strong>Report</strong> 2010 Outlook<br />
Corporate <strong>Bank</strong>ing & Securities is expected to benefit from the further integration of the investment bank. This<br />
will help us to better service corporate clients across a broad range of products, eliminate any duplication of<br />
activity across front office and support functions and increase collaboration between all areas of the business,<br />
including Global Transaction <strong>Bank</strong>ing. We will continue to focus on good asset efficiency and careful management<br />
of risk exposures, especially those that will be impacted by the evolving regulatory landscape during the next<br />
two years.<br />
In sales and trading, revenues from flow products such as foreign exchange, money markets, interest rate<br />
trading and cash equities will be supported by increased global activity. We expect to continue to generate<br />
substantial revenues through our leading client market shares in these products as well as to benefit from our<br />
continued investments in electronic trading and direct market access platforms. Our strategic focus on prime<br />
finance platform has now developed this business into a market leader. Emerging markets trading and commodities<br />
also remain key growth areas as demand for these products increases. We have now recalibrated our<br />
credit and equity derivatives businesses after substantial losses during the crisis, focusing on both client flow<br />
trading and solutions with appropriate risk appetite and resource utilization. During 2010 we exited our designated<br />
proprietary equity trading business, following the closure of our designated proprietary credit trading business<br />
in 2009. Our unique cross asset class structuring group will play a key role in delivering sales and trading<br />
products as well as solutions to both corporate and institutional clients under the newly integrated Corporate &<br />
Investment <strong>Bank</strong>.<br />
Assuming a stable macro-economic environment the corporate finance fee pool will increase. Debt issuance is<br />
expected to be strong across financial institutions and corporates, as companies continue to refinance and take<br />
advantage of an attractive market environment for acquisition financing. We anticipate equity issuance will<br />
continue to be strong given the IPO pipeline, growth in Asia and as financial institutions continue to recapitalize.<br />
M&A activity is expected to increase as we move through a cyclical recovery and corporate clients reposition<br />
themselves. <strong>Deutsche</strong> <strong>Bank</strong> aims to capitalize on all these trends and build on increased momentum in its<br />
corporate finance franchise, which attained its target of a top five position by fees (source: Dealogic) in 2010.<br />
CB&S aims to achieve a contribution to the target in 2011 of € 6.4 billion income before income taxes, based<br />
on the assumptions set out above. Risks to this forecast include lower margins and loss of key talent due to<br />
increased competition, reduced volumes or continued uncertainty around regulation and its potential implications<br />
including higher costs or capital requirements. A significant turn in the macroeconomic environment would also<br />
impact issuer and investor activity. Although progress has been made in the further integration of the investment<br />
bank, failure to successfully complete this program would result in lower-than-expected revenue and cost synergies.
<strong>Deutsche</strong> <strong>Bank</strong> 01 – Management <strong>Report</strong> 146<br />
Financial <strong>Report</strong> 2010 Outlook<br />
Global Transaction <strong>Bank</strong>ing<br />
The outlook for global transaction banking over the next two years will likely be influenced by both negative<br />
and positive factors. The low interest rate levels seen in most markets during 2009 and 2010 will likely continue<br />
to adversely impact net interest income in the near term, while the ongoing recovery in global GDP, international<br />
trade volumes, cross-border payments and corporate actions should partially offset the aforementioned. However,<br />
an anew, double-dip recession would imperil growth prospects. Furthermore, the new Basel regulations pose a<br />
challenge analog to the overall banking industry.<br />
<strong>Deutsche</strong> <strong>Bank</strong>’s Global Transaction <strong>Bank</strong>ing (GTB) business will likely be impacted by the environmental<br />
challenges outlined above. The sustained momentum of profitable growth and client acquisition in recent years,<br />
together with its leading position in major markets, leaves Global Transaction <strong>Bank</strong>ing well-placed to attract<br />
new clients even in challenging conditions. The business is focusing on deepening its client relationships with<br />
Complex Corporates and Institutional Clients in existing regions while pushing further growth in Asia. In addition,<br />
initiatives have been launched to further re-balance our earnings mix to reduce dependency on interest rates.<br />
The successful consolidation of parts of ABN AMRO’s corporate and commercial banking activities in the<br />
Netherlands in 2010 will further strengthen Global Transaction <strong>Bank</strong>ing’s footprint in Europe by creating a<br />
second home market for corporate clients and achieving deeper client coverage and complementary product<br />
offerings. The business is expected to capitalize on synergies resulting from the integration of the Corporate &<br />
Investment <strong>Bank</strong>ing activities. Closer co-operation with other areas of the Corporate & Investment <strong>Bank</strong> as part<br />
of the ongoing integration will ensure that a wider range of clients will benefit from Global Transaction <strong>Bank</strong>ing’s<br />
services.<br />
Global Transaction <strong>Bank</strong>ing is well-positioned and aims to achieve a contribution to the 2011Group Target of<br />
€ 1.0 billion income before income taxes, based on the assumptions set out above.<br />
Asset and Wealth Management<br />
The outlook for the asset and wealth management business will be influenced by multiple factors in 2011 and<br />
<strong>2012</strong>. Recovery in equity markets that started in late 2009, and accelerated in 2010, if continued in the next<br />
two years, will foster an increase in revenues from commissions and performance fees. Market appetite to regain<br />
prior years’ losses may stimulate investments in multi-asset, alternative and equity products, while signs of broad<br />
based recovery in the real estate market should improve prospects in alternative investments over the next two<br />
years as well. Long term trends, including the ongoing shift from state pension dependency to private retirement<br />
funding, ageing populations in mature markets, and growing wealth in emerging economies, will also positively<br />
impact revenues and new invested assets opportunities over the next two years. Conversely, revenues may come<br />
under pressure in the near term if market volatility reoccurs and investors continue to retreat to cash or simpler,<br />
lower fee products.<br />
<strong>Deutsche</strong> <strong>Bank</strong>’s Asset and Wealth Management (AWM) continues to be a leading and diversified global service<br />
provider, strongly positioned to benefit from the market indicators outlined above.
<strong>Deutsche</strong> <strong>Bank</strong> 01 – Management <strong>Report</strong> 147<br />
Financial <strong>Report</strong> 2010 Outlook<br />
AWM is comprised of our Asset Management and Private Wealth Management businesses.<br />
In Asset Management (AM), operating leverage obtained via platform re-engineering and cost efficiency efforts<br />
that began in 2008 and continued throughout 2009 and 2010 underpins the business’s ability to benefit from<br />
improved capital markets and growth in the economy, as well as absorb the potential for modest market volatility<br />
or investor comfort towards fixed income, lower fee products. In addition, AM is well positioned to gain from the<br />
aforementioned long term trends in the industry.<br />
Private Wealth Management (PWM) expects for 2011 – <strong>2012</strong> to benefit of growing wealth markets and maintain<br />
or increase market share in fragmented competitive environment. With Invested Assets exceeding pre-crisis<br />
level at the end of 2010 PWM is aiming to grow through focus on asset gathering and asset allocation shifts in<br />
the mid-term. Fundamental economic recovery during the past months however shows considerable divergence<br />
between regions and markets. Within the eurozone PWM will benefit from home market leadership with its two<br />
strong brands of <strong>Deutsche</strong> <strong>Bank</strong> and Sal. Oppenheim. Asia/Pacific growth strategy is aligned to <strong>Deutsche</strong> <strong>Bank</strong>’s<br />
management agenda with organic growth through hiring and intensified corporation with CIB. PWM’s business<br />
model with strong coverage of emerging markets will allow to balance challenges in mature markets, increased<br />
regulatory framework and political environment. Fiscal policy will have a decisive impact on the financial markets<br />
in 2011. The Americas and UK will continue to deliver solid growth while rest of eurozone (except home market)<br />
might see further Invested Assets outflows.<br />
Trend of client buying patterns, toward lower margin, simpler and capital protected products has been confirmed<br />
in 2010 and a short term reversal of this situation for PWM is unlikely. Uncertainties in Euro and U.S. dollar<br />
zone with regard to expected sustainable client returns will impact PWM results in affluent and High Net Worth<br />
Individual (HNWI) client segments. Focus on Ultra High Net Worth Individuals (UHNWI) and Key Client segment<br />
will contribute significant results due to strong leverage of the existing platform within <strong>Deutsche</strong> <strong>Bank</strong> Group and<br />
close corporation with Corporate & Investment <strong>Bank</strong>ing (CIB). For all client segments PWM will deliver a more<br />
flexible asset allocation process in order to be prepared for upcoming opportunities but also limit risk. By enforcing<br />
a global platform servicing regional markets with investment advice for Advisory and Discretionary portfolios PWM<br />
will support client facing teams and execute Group Investment Committee (GIC) recommendations. These<br />
alignments will contribute to complexity reduction and improve efficiency. Margin improvements are expected<br />
for selective products only. Invested Assets growth through UHNWI and Key Clients with efficiency and productivity<br />
enhancements will be key drivers for business success.<br />
The Sal. Oppenheim integration and positioning within <strong>Deutsche</strong> <strong>Bank</strong> Group was successfully concluded in<br />
2010 and should start to deliver positive results from year 2011.
<strong>Deutsche</strong> <strong>Bank</strong> 01 – Management <strong>Report</strong> 148<br />
Financial <strong>Report</strong> 2010 Outlook<br />
The above mentioned development in particular achieving high Net New Assets inflows in the next years and<br />
increased Lending Business with improved risk profile and overall focus on operational efficiency should allow<br />
resizing of PWM’s cost base in order to achieve target of Euro 0.4 billion income before income taxes in 2011.<br />
Asset and Wealth Management aims to achieve a contribution of € 1.0 billion income before income taxes to the<br />
target in 2011, based on the assumptions set out above.<br />
Private & Business Clients<br />
The success of Private & Business Clients is based on a solid business model with a leading position in our home<br />
market, Germany, strong positions in other important European markets, and growth options in key Asian countries.<br />
With our strong advisory proposition, we should be able to gain market share in Germany via customer and<br />
volume acquisition, especially in the low-risk mortgage business. On the cost side we should be able to reap<br />
benefits from the efficiency program launched in 2009. In addition, the acquisition of Postbank will create a<br />
strong pillar in the German market and will enable us to generate significant synergies.<br />
Capitalizing on our advisory strength, we intend to further develop PBC’s profitable European franchise as an<br />
affluent proposition with a focus on wealthy regions. The expansion of our branch network in India and the<br />
increase of our stake in Hua Xia <strong>Bank</strong> in China to 19.99 % will benefit PBC’s Asian high growth option.<br />
PBC continues to face uncertainties in its operating environment in 2011and <strong>2012</strong>, particularly with respect to<br />
the development of investment product markets, although they have further stabilized in 2010. From a macroeconomic<br />
perspective, GDP growth in the home market has a generally positive outlook for 2011 and <strong>2012</strong>.<br />
However, a sharp drop in the economic growth might result in higher unemployment rates and increasing credit<br />
loss provisions. Continued low interest rates in 2011 might further negatively affect revenues in PBC.<br />
Part of PBC’s future priorities is to achieve synergies between Postbank and <strong>Deutsche</strong> <strong>Bank</strong> both on the revenue<br />
and cost side within a five year plan horizon. The generation of synergies is developing very favorable until today.<br />
However, the above economic risks are also relevant to the <strong>Deutsche</strong> <strong>Bank</strong>/Postbank cooperation. On the cost<br />
side, there is a risk that synergies do not realize or realize later than foreseen. Additionally, there is a risk that<br />
the costs to achieve the synergies are higher than foreseen. These risks are mitigated by a bottom up revalidation<br />
of synergy measures with ongoing tracking and reporting to senior management.<br />
Including Postbank and higher contribution from Hua Xia <strong>Bank</strong>, PBC aims to achieve a contribution to the target<br />
in 2011 of € 1.6 billion income before income taxes, based on the assumptions set out above. After the full<br />
successful integration of Postbank, PBC aims to achieve a target of € 3 billion.
Consolidated Financial Statements<br />
Consolidated Statement of Income – 151<br />
Consolidated Statement of Comprehensive Income – 152<br />
Consolidated Balance Sheet – 153<br />
Consolidated Statement of Changes in Equity – 154<br />
Consolidated Statement of Cash Flows – 156<br />
Notes to the Consolidated Financial Statements including Table of Content – 157
<strong>Deutsche</strong> <strong>Bank</strong> 02 – Consolidated Financial Statements 150<br />
Financial <strong>Report</strong> 2010<br />
(This page intentionally left blank)
<strong>Deutsche</strong> <strong>Bank</strong> 02 – Consolidated Financial Statements 151<br />
Financial <strong>Report</strong> 2010 Consolidated Statement of Income<br />
Consolidated Statement of Income<br />
in € m. Notes 2010 2009 2008<br />
Interest and similar income 6 28,779 26,953 54,549<br />
Interest expense 6 13,196 14,494 42,096<br />
Net interest income 6 15,583 12,459 12,453<br />
Provision for credit losses 19 1,274 2,630 1,076<br />
Net interest income after provision for credit losses 14,309 9,829 11,377<br />
Commissions and fee income 7 10,669 8,911 9,741<br />
Net gains (losses) on financial assets/liabilities<br />
at fair value through profit or loss 6 3,354 7,109 (9,992)<br />
Net gains (losses) on financial assets available for sale 8 201 (403) 666<br />
Net income (loss) from equity method investments 17 (2,004) 59 46<br />
Other income (loss) 9 764 (183) 699<br />
Total noninterest income 12,984 15,493 1,160<br />
Compensation and benefits 32, 33 12,671 11,310 9,606<br />
General and administrative expenses 10 10,133 8,402 8,339<br />
Policyholder benefits and claims 485 542 (252)<br />
Impairment of intangible assets 24 29 (134) 585<br />
Restructuring activities 28 – – –<br />
Total noninterest expenses 23,318 20,120 18,278<br />
Income (loss) before income taxes 3,975 5,202 (5,741)<br />
Income tax expense (benefit) 34 1,645 244 (1,845)<br />
Net income (loss) 2,330 4,958 (3,896)<br />
Net income (loss) attributable to noncontrolling interests 20 (15) (61)<br />
Net income (loss) attributable to <strong>Deutsche</strong> <strong>Bank</strong> shareholders 2,310 4,973 (3,835)<br />
Earnings per Common Share<br />
in € Notes 2010 2009 2008<br />
Earnings per common share: 1 11<br />
Basic € 3.07 € 7.21 € (6.87)<br />
Diluted 2 € 2.92 € 6.94 € (6.87)<br />
Number of shares in million: 1<br />
Denominator for basic earnings per share –<br />
weighted-average shares outstanding 753.3 689.4 558.5<br />
Denominator for diluted earnings per share –<br />
adjusted weighted-average shares after assumed conversions 790.8 716.7 558.6<br />
1 The number of average basic and diluted shares outstanding has been adjusted for all periods before October 6, 2010 to reflect the effect of the bonus element of the<br />
subscription rights issue in connection with the capital increase.<br />
2 Includes numerator effect of assumed conversions. For further detail please see Note 11 “Earnings per Common Share”.<br />
The accompanying notes are an integral part of the Consolidated Financial Statements.
<strong>Deutsche</strong> <strong>Bank</strong> 02 – Consolidated Financial Statements 152<br />
Financial <strong>Report</strong> 2010 Consolidated Statement of Comprehensive Income<br />
Consolidated Statement of Comprehensive Income<br />
in € m. 2010 2009 2008<br />
Net income (loss) recognized in the income statement 2,330 4,958 (3,896)<br />
Actuarial gains (losses) related to defined benefit plans, net of tax<br />
Other comprehensive income<br />
Unrealized net gains (losses) on financial assets available for sale:<br />
106 (679) (1)<br />
1<br />
Unrealized net gains (losses) arising during the period, before tax 83 523 (4,516)<br />
Net (gains) losses reclassified to profit or loss, before tax<br />
Unrealized net gains (losses) on derivatives hedging variability of cash flows:<br />
39 556 (666)<br />
1<br />
Unrealized net gains (losses) arising during the period, before tax (78) 118 (263)<br />
Net (gains) losses reclassified to profit or loss, before tax 4 6 2<br />
Unrealized net gains (losses) on assets classified as held for sale, before tax 2 Foreign currency translation:<br />
(25) – –<br />
1<br />
Unrealized net gains (losses) arising during the period, before tax 920 40 (1,144)<br />
Net (gains) losses reclassified to profit or loss, before tax (6) 11 (3)<br />
Unrealized net gains (losses) from equity method investments 1 (26) 85 (15)<br />
Tax on net gains (losses) in other comprehensive income 240 (254) 731<br />
Other comprehensive income, net of tax 1,151 3<br />
1,085 4<br />
(5,874) 5<br />
Total comprehensive income, net of tax<br />
Attributable to:<br />
3,587 5,364 (9,771)<br />
Noncontrolling interests 4 (1) (37)<br />
<strong>Deutsche</strong> <strong>Bank</strong> shareholders 3,583 5,365 (9,734)<br />
1 The unrealized net gains (losses) from equity method investments are disclosed separately starting December 31, 2009. These amounts were included in the other<br />
categories of other comprehensive income in prior periods.<br />
2 Please refer to Note 25 “Assets held for Sale” for additional information.<br />
3 Represents the change in the balance sheet in accumulated other comprehensive income (net of tax) between December 31, 2009 of € (3.780) million and December<br />
31, 2010 of € (2.601) million, adjusted for changes in noncontrolling interest attributable to these components of € (28) million.<br />
4 Represents the change in the balance sheet in accumulated other comprehensive income (net of tax) between December 31, 2008 of € (4,851) million and December<br />
31, 2009 of € (3,780) million, adjusted for changes in noncontrolling interest attributable to these components of € 14 million.<br />
5 Represents the change in the balance sheet in accumulated other comprehensive income (net of tax) between December 31, 2007 of € 1,047 million and December<br />
31, 2008 of € (4,851) million, adjusted for changes in noncontrolling interest attributable to these components of € 24 million.<br />
The accompanying notes are an integral part of the Consolidated Financial Statements.
<strong>Deutsche</strong> <strong>Bank</strong> 02 – Consolidated Financial Statements 153<br />
Financial <strong>Report</strong> 2010 Consolidated Balance Sheet<br />
Consolidated Balance Sheet<br />
in € m. Notes Dec 31, 2010 Dec 31, 2009<br />
Assets:<br />
Cash and due from banks 17,157 9,346<br />
Interest-earning deposits with banks 92,377 47,233<br />
Central bank funds sold and securities purchased under resale agreements 20, 21 20,365 6,820<br />
Securities borrowed 20, 21 28,916 43,509<br />
Financial assets at fair value through profit or loss<br />
Trading assets 271,291 234,910<br />
Positive market values from derivative financial instruments 657,780 596,410<br />
Financial assets designated at fair value through profit or loss 171,926 134,000<br />
Total financial assets at fair value through profit or loss<br />
of which € 91 billion and € 79 billion were pledged to creditors and can be sold or<br />
repledged at December 31, 2010, and 2009, respectively 12, 14, 21, 35 1,100,997 965,320<br />
Financial assets available for sale<br />
of which € 3.9 billion and € 0.5 billion were pledged to creditors and can be sold or<br />
repledged at December 31, 2010, and 2009, respectively 16, 20, 21 54,266 18,819<br />
Equity method investments 17 2,608 7,788<br />
Loans 18, 19 407,729 258,105<br />
Property and equipment 22 5,802 2,777<br />
Goodwill and other intangible assets 24 15,594 10,169<br />
Other assets 25, 26 149,229 121,538<br />
Assets for current tax 34 2,249 2,090<br />
Deferred tax assets 34 8,341 7,150<br />
Total assets 1,905,630 1,500,664<br />
Liabilities and equity:<br />
Deposits 27 533,984 344,220<br />
Central bank funds purchased and securities sold under repurchase agreements 20 ,21 27,922 45,495<br />
Securities loaned 20, 21 3,276 5,564<br />
Financial liabilities at fair value through profit or loss 12, 14, 35<br />
Trading liabilities 68,859 64,501<br />
Negative market values from derivative financial instruments 647,171 576,973<br />
Financial liabilities designated at fair value through profit or loss 130,154 73,522<br />
Investment contract liabilities 7,898 7,278<br />
Total financial liabilities at fair value through profit or loss 854,082 722,274<br />
Other short-term borrowings 29 64,990 42,897<br />
Other liabilities 25, 26 181,827 154,281<br />
Provisions 19, 28 2,204 1,307<br />
Liabilities for current tax 34 2,736 2,141<br />
Deferred tax liabilities 34 2,307 2,157<br />
Long-term debt 30 169,660 131,782<br />
Trust preferred securities 30 12,250 10,577<br />
Obligation to purchase common shares – –<br />
Total liabilities 1,855,238 1,462,695<br />
Common shares, no par value, nominal value of € 2.56 31 2,380 1,589<br />
Additional paid-in capital 23,515 14,830<br />
Retained earnings 25,999 24,056<br />
Common shares in treasury, at cost 31 (450) (48)<br />
Equity classified as obligation to purchase common shares – –<br />
Accumulated other comprehensive income, net of tax (2,601) (3,780)<br />
Total shareholders’ equity 48,843 36,647<br />
Noncontrolling interests 1,549 1,322<br />
Total equity 50,392 37,969<br />
Total liabilities and equity 1,905,630 1,500,664<br />
The accompanying notes are an integral part of the Consolidated Financial Statements.
<strong>Deutsche</strong> <strong>Bank</strong> 02 – Consolidated Financial Statements 154<br />
Financial <strong>Report</strong> 2010 Consolidated Statement of Changes in Equity<br />
Consolidated Statement of Changes in Equity<br />
Common<br />
shares in<br />
treasury,<br />
Equity<br />
classified as<br />
obligation to<br />
purchase<br />
common shares<br />
Common shares Additional Retained<br />
in € m.<br />
(no par value) paid-in capital<br />
earnings 1<br />
at cost<br />
Balance as of December 31, 2007 1,358 15,808 26,051 (2,819) (3,552)<br />
Total comprehensive income2 – – (3,835) – –<br />
Common shares issued 102 2,098 – – –<br />
Cash dividends paid – – (2,274) – –<br />
Dividend related to equity classified as obligation to purchase common shares – – 226 – –<br />
Actuarial gains (losses) related to defined benefit plans, net of tax – – (1) – –<br />
Net change in share awards – 225 – – –<br />
Treasury shares distributed under share-based compensation plans – – – 1,072 –<br />
Tax benefits related to share-based compensation plans – (136) – – –<br />
Amendment of derivative instruments indexed to <strong>Deutsche</strong> <strong>Bank</strong> common shares – (1,815) – – 2,690<br />
Common shares issued under share-based compensation plans 1 17 – – –<br />
Additions to Equity classified as obligation to purchase common shares – – – – (366)<br />
Deductions from Equity classified as obligation to purchase common shares – – – – 1,225<br />
Option premiums and other effects from options on common shares – 3 (4) – –<br />
Purchases of treasury shares – – – (21,736) –<br />
Sale of treasury shares – – – 22,544 –<br />
Net gains (losses) on treasury shares sold – (1,191) – – –<br />
Other – (48) (89) – –<br />
Balance as of December 31, 2008 1,461 14,961 20,074 (939) (3)<br />
Total comprehensive income2 – – 4,973 – –<br />
Common shares issued 128 830 – – –<br />
Cash dividends paid – – (309) – –<br />
Dividend related to equity classified as obligation to purchase common shares – – – – –<br />
Actuarial gains (losses) related to defined benefit plans, net of tax – – (679) – –<br />
Net change in share awards – (688) – – –<br />
Treasury shares distributed under share-based compensation plans – – – 1,313 –<br />
Tax benefits related to share-based compensation plans – 35 – – –<br />
Amendment of derivative instruments indexed to <strong>Deutsche</strong> <strong>Bank</strong> common shares – – – – –<br />
Common shares issued under share-based compensation plans – – – – –<br />
Additions to Equity classified as obligation to purchase common shares – – – – (5)<br />
Deductions from Equity classified as obligation to purchase common shares – – – – 8<br />
Option premiums and other effects from options on common shares – (149) – – –<br />
Purchases of treasury shares – – – (19,238) –<br />
Sale of treasury shares – – – 18,816 –<br />
Net gains (losses) on treasury shares sold – (177) – – –<br />
Other – 18 (3) – –<br />
Balance as of December 31, 2009 1,589 14,830 24,056 (48) –<br />
Total comprehensive income2 – – 2,310 – –<br />
Common shares issued 791 9,413 – – –<br />
Cash dividends paid – – (465) – –<br />
Dividend related to equity classified as obligation to purchase common shares – – – – –<br />
Actuarial gains (losses) related to defined benefit plans, net of tax – – 94 – –<br />
Net change in share awards – (296) – – –<br />
Treasury shares distributed under share-based compensation plans – – – 1,439 –<br />
Tax benefits related to share-based compensation plans – (11) – – –<br />
Amendment of derivative instruments indexed to <strong>Deutsche</strong> <strong>Bank</strong> common shares – – – – –<br />
Common shares issued under share-based compensation plans – – – – –<br />
Additions to Equity classified as obligation to purchase common shares – – – – (93)<br />
Deductions from Equity classified as obligation to purchase common shares – – – – 93<br />
Option premiums and other effects from options on common shares – (115) – – –<br />
Purchases of treasury shares – – – (15,366) –<br />
Sale of treasury shares – – – 13,525 –<br />
Net gains (losses) on treasury shares sold – – – – –<br />
Other – (306) 4 – –<br />
Balance as of December 31, 2010 2,380 23,515 25,999 (450) –<br />
1 The balance as of December 31, 2007 was increased by € 935 million for a change in accounting policy (change from corridor approach to immediate recognition of actuarial gains and losses<br />
related to defined benefit plans in shareholders’ equity) and for a retrospective adjustment of current tax liabilities, both in 2008.<br />
2 Excluding actuarial gains (losses) related to defined benefit plans, net of tax.
<strong>Deutsche</strong> <strong>Bank</strong> 02 – Consolidated Financial Statements 155<br />
Financial <strong>Report</strong> 2010 Consolidated Statement of Changes in Equity<br />
Unrealized net<br />
gains (losses) on<br />
financial assets<br />
available for sale,<br />
net of applicable<br />
tax and other 3<br />
Unrealized net<br />
gains (losses) on<br />
derivatives<br />
hedging variability<br />
of cash flows,<br />
net of tax 3<br />
Unrealized net<br />
gains (losses) on<br />
assets classified<br />
as held for sale,<br />
net of tax<br />
Foreign currency<br />
translation,<br />
net of tax 3,4<br />
Unrealized net<br />
gains (losses)<br />
from equity<br />
method<br />
investments<br />
Accumulated<br />
other<br />
comprehensive<br />
income, net of tax<br />
Total<br />
shareholders’<br />
equity<br />
Noncontrolling<br />
interests Total equity<br />
3,629 (52) – (2,524) (6) 1,047 37,893 1,422 39,315<br />
(4,484) (294) – (1,104) (16) (5,898) (9,733) (37) (9,770)<br />
– – – – – – 2,200 – 2,200<br />
– – – – – – (2,274) – (2,274)<br />
– – – – – – 226 – 226<br />
– – – – – – (1) – (1)<br />
– – – – – – 225 – 225<br />
– – – – – – 1,072 – 1,072<br />
– – – – – – (136) – (136)<br />
– – – – – – 875 – 875<br />
– – – – – – 18 – 18<br />
– – – – – – (366) – (366)<br />
– – – – – – 1,225 – 1,225<br />
– – – – – – (1) – (1)<br />
– – – – – – (21,736) – (21,736)<br />
– – – – – – 22,544 – 22,544<br />
– – – – – – (1,191) – (1,191)<br />
– – – – – – (137) (174) (311)<br />
(855) (346) – (3,628) (22) (4,851) 30,703 1,211 31,914<br />
669 212 – 107 83 1,071 6,044 (1) 6,043<br />
– – – – – – 958 – 958<br />
– – – – – – (309) – (309)<br />
– – – – – – – – –<br />
– – – – – – (679) – (679)<br />
– – – – – – (688) – (688)<br />
– – – – – – 1,313 – 1,313<br />
– – – – – – 35 – 35<br />
– – – – – – – – –<br />
– – – – – – – – –<br />
– – – – – – (5) – (5)<br />
– – – – – – 8 – 8<br />
– – – – – – (149) – (149)<br />
– – – – – – (19,238) – (19,238)<br />
– – – – – – 18,816 – 18,816<br />
– – – – – – (177) – (177)<br />
– – – – – – 15 112 127<br />
(186) (134) – (3,521) 61 (3,780) 36,647 1,322 37,969<br />
73 (45) (11) 1,188 (26) 1,179 3,489 (8) 3,481<br />
– – – – – – 10,204 – 10,204<br />
– – – – – – (465) – (465)<br />
– – – – – – – – –<br />
– – – – – – 94 12 106<br />
– – – – – – (296) – (296)<br />
– – – – – – 1,439 – 1,439<br />
– – – – – – (11) – (11)<br />
– – – – – – – – –<br />
– – – – – – – – –<br />
– – – – – – (93) – (93)<br />
– – – – – – 93 – 93<br />
– – – – – – (115) – (115)<br />
– – – – – – (15,366) – (15,366)<br />
– – – – – – 13,525 – 13,525<br />
– – – – – – – – –<br />
– – – – – – (302) 223 (79)<br />
(113) (179) (11) (2,333) 35 (2,601) 48,843 1,549 50,392<br />
3 Excluding unrealized net gains (losses) from equity method investments.<br />
4 The balance as of December 31, 2007 was reduced by € 86 million for a change in accounting policy (change from corridor approach to immediate recognition of<br />
actuarial gains and losses related to defined benefit plans in shareholders’ equity) and for a retrospective adjustment of current tax liabilities, both in 2008.<br />
The accompanying notes are an integral part of the Consolidated Financial Statements.
<strong>Deutsche</strong> <strong>Bank</strong> 02 – Consolidated Financial Statements 156<br />
Financial <strong>Report</strong> 2010 Consolidated Statement of Cash Flows<br />
Consolidated Statement of Cash Flows<br />
in € m. 2010 2009 2008<br />
Net income (loss) 2,330 4,958 (3,896)<br />
Cash flows from operating activities:<br />
Adjustments to reconcile net income to net cash provided by (used in) operating activities:<br />
Provision for credit losses 1,274 2,630 1,076<br />
Restructuring activities – – –<br />
Gain on sale of financial assets available for sale, equity method investments, and other (363) (656) (1,732)<br />
Deferred income taxes, net 315 (296) (1,525)<br />
Impairment, depreciation and other amortization, and accretion 4,255 1,782 3,047<br />
Share of net income from equity method investments (457) (189) (53)<br />
Income (loss) adjusted for noncash charges, credits and other items 7,354 8,229 (3,083)<br />
Adjustments for net change in operating assets and liabilities:<br />
Interest-earning time deposits with banks (34,806) 4,583 (3,964)<br />
Central bank funds sold, securities purchased under resale agreements, securities borrowed 26,368 (4,203) 24,363<br />
Trading assets and positive market values from derivative financial instruments (27,237) 726,237 (472,203)<br />
Financial assets designated at fair value through profit or loss (24,502) 24,890 169,423<br />
Loans (2,823) 17,213 (37,981)<br />
Other assets (5,894) 21,960 38,573<br />
Deposits 22,656 (57,330) (56,918)<br />
Trading liabilities and negative market values from derivative financial instruments 9,549 (686,214) 655,218<br />
Financial liabilities designated at fair value through profit or loss and investment contract liabilities 53,450 (7,061) (159,613)<br />
Central bank funds purchased, securities sold under repurchase agreements, securities loaned (40,709) (40,644) (97,009)<br />
Other short-term borrowings 18,509 2,592 (14,216)<br />
Other liabilities 2,851 (15,645) (15,482)<br />
Senior long-term debt (3,457) (7,150) 12,769<br />
Other, net (4,985) (1,243) (2,760)<br />
Net cash provided by (used in) operating activities (3,676) (13,786) 37,117<br />
Cash flows from investing activities:<br />
Proceeds from:<br />
Sale of financial assets available for sale 10,652 9,023 19,433<br />
Maturities of financial assets available for sale 4,181 8,938 18,713<br />
Sale of equity method investments 250 574 680<br />
Sale of property and equipment 108 39 107<br />
Purchase of:<br />
Financial assets available for sale (14,087) (12,082) (37,819)<br />
Equity method investments (145) (3,730) (881)<br />
Property and equipment (873) (592) (939)<br />
Net cash received in (paid for) business combinations/divestitures 8,580 (20) (24)<br />
Other, net (1,189) (1,749) (39)<br />
Net cash provided by (used in) investing activities 7,477 401 (769)<br />
Cash flows from financing activities:<br />
Issuances of subordinated long-term debt 1,341 457 523<br />
Repayments and extinguishments of subordinated long-term debt (229) (1,448) (659)<br />
Issuances of trust preferred securities 90 1,303 3,404<br />
Repayments and extinguishments of trust preferred securities (51) – –<br />
Common shares issued under share-based compensation plans – – 19<br />
Capital increase 10,060 – 2,200<br />
Purchases of treasury shares (15,366) (19,238) (21,736)<br />
Sale of treasury shares 13,519 18,111 21,426<br />
Dividends paid to noncontrolling interests (7) (5) (14)<br />
Net change in noncontrolling interests 200 109 331<br />
Cash dividends paid (465) (309) (2,274)<br />
Net cash provided by (used in) financing activities 9,092 (1,020) 3,220<br />
Net effect of exchange rate changes on cash and cash equivalents 1,911 690 (402)<br />
Net increase (decrease) in cash and cash equivalents 14,804 (13,715) 39,166<br />
Cash and cash equivalents at beginning of period 51,549 65,264 26,098<br />
Cash and cash equivalents at end of period 66,353 51,549 65,264<br />
Net cash provided by (used in) operating activities include<br />
Income taxes paid (received), net 784 (520) (2,495)<br />
Interest paid 13,740 15,878 43,724<br />
Interest and dividends received 29,456 28,211 54,549<br />
Cash and cash equivalents comprise<br />
Cash and due from banks 17,157 9,346 9,826<br />
Interest-earning demand deposits with banks (not included: time deposits of € 43,181 m. as of December<br />
31, 2010, and € 5,030 m. and € 9,301 m. as of December 31, 2009 and 2008) 49,196 42,203 55,438<br />
Total 66,353 51,549 65,264<br />
The accompanying notes are an integral part of the Consolidated Financial Statements.<br />
The acquisition of <strong>Deutsche</strong> Postbank AG shares, including the non-cash portion, is described in detail in Note 04 “Acquisitions and Dispositions”. The restructuring of<br />
loans the Group held with the Icelandic generic pharmaceutical group Actavis Group hF resulted in a non-cash reclassification of the subordinated financing arrange-<br />
ment from operating to investing activities for the purposes of the Consolidated Statement of Cash Flows. The transaction is described in detail in Note 17 “Equity<br />
Method Investments”.
<strong>Deutsche</strong> <strong>Bank</strong> 02 – Consolidated Financial Statements 157<br />
Financial <strong>Report</strong> 2010 Notes to the Consolidated Financial Statements<br />
Notes to the Consolidated Financial Statements<br />
Notes to the Consolidated Financial Statements<br />
01 – Significant Accounting Policies – 158<br />
02 – Critical Accounting Estimates – 188<br />
03 – Recently Adopted and New Accounting Pronouncements – 196<br />
04 – Acquisitions and Dispositions – 198<br />
05 – Business Segments and Related Information – 216<br />
Notes to the Consolidated Income Statement<br />
06 – Net Interest Income and Net Gains (Losses) on Financial Assets/Liabilities at Fair Value through Profit or Loss – 228<br />
07 – Commissions and Fee Income – 230<br />
08 – Net Gains (Losses) on Financial Assets Available for Sale – 231<br />
09 – Other Income – 231<br />
10 – General and Administrative Expenses – 232<br />
11 – Earnings per Common Share – 232<br />
Notes to the Consolidated Balance Sheet<br />
12 – Financial Assets/Liabilities at Fair Value through Profit or Loss – 235<br />
13 – Amendments to IAS 39 and IFRS 7, “Reclassification of Financial Assets” – 238<br />
14 – Financial Instruments carried at Fair Value – 240<br />
15 – Fair Value of Financial Instruments not carried at Fair Value – 254<br />
16 – Financial Assets Available for Sale – 257<br />
17 – Equity Method Investments – 258<br />
18 – Loans – 260<br />
19 – Allowance for Credit Losses – 261<br />
20 – Derecognition of Financial Assets – 262<br />
21 – Assets Pledged and Received as Collateral – 263<br />
22 – Property and Equipment – 264<br />
23 – Leases – 265<br />
24 – Goodwill and Other Intangible Assets – 267<br />
25 – Assets Held for Sale – 278<br />
26 – Other Assets and Other Liabilities – 282<br />
27 – Deposits – 283<br />
28 – Provisions – 284<br />
29 – Other Short-Term Borrowings – 288<br />
30 – Long-Term Debt and Trust Preferred Securities – 289<br />
Additional Notes<br />
31 – Common Shares – 290<br />
32 – Share-Based Compensation Plans – 291<br />
33 – Employee Benefits – 296<br />
34 – Income Taxes – 303<br />
35 – Derivatives – 307<br />
36 – Regulatory Capital – 309<br />
37 – Related Party Transactions – 314<br />
38 – Information on Subsidiaries – 317<br />
39 – Insurance and Investment Contracts – 319<br />
40 – Current and Non-Current Assets and Liabilities – 322<br />
41 – Supplementary Information to the Consolidated Financial Statements according to Section 315a HGB – 324<br />
42 – Shareholdings – 326
<strong>Deutsche</strong> <strong>Bank</strong> 02 – Consolidated Financial Statements 158<br />
Financial <strong>Report</strong> 2010 Notes to the Consolidated Financial Statements<br />
01 – Significant Accounting Policies<br />
01 –<br />
Significant Accounting Policies<br />
Basis of Accounting<br />
<strong>Deutsche</strong> <strong>Bank</strong> Aktiengesellschaft (“<strong>Deutsche</strong> <strong>Bank</strong>” or the “Parent”) is a stock corporation organized under the<br />
laws of the Federal Republic of Germany. <strong>Deutsche</strong> <strong>Bank</strong> together with all entities in which <strong>Deutsche</strong> <strong>Bank</strong> has<br />
a controlling financial interest (the “Group”) is a global provider of a full range of corporate and investment banking,<br />
private clients and asset management products and services. For a discussion of the Group’s business segment<br />
information, see Note 05 “Business Segments and Related Information”.<br />
The accompanying consolidated financial statements are stated in euros, the presentation currency of the Group.<br />
All financial information presented in million euros has been rounded to the nearest million. The consolidated<br />
financial statements have been prepared in accordance with International Financial <strong>Report</strong>ing Standards (“IFRS”)<br />
as issued by the International Accounting Standards Board (“IASB”) and endorsed by the European Union (“EU”).<br />
The Group’s application of IFRS results in no differences between IFRS as issued by the IASB and IFRS as<br />
endorsed by the EU.<br />
Risk disclosures under IFRS 7, “Financial Instruments: Disclosures” about the nature and extent of risks arising<br />
from financial instruments are incorporated herein by reference to the portions marked by a bracket in the margins<br />
of the Risk <strong>Report</strong>.<br />
The preparation of financial statements under IFRS requires management to make estimates and assumptions<br />
for certain categories of assets and liabilities. Areas where this is required include the fair value of certain financial<br />
assets and liabilities, the allowance for loan losses, the impairment of assets other than loans, goodwill and<br />
other intangibles, the recognition and measurement of deferred tax assets, provisions for uncertain income tax<br />
positions, legal and regulatory contingencies, reserves for insurance and investment contracts, reserves for<br />
pensions and similar obligations. These estimates and assumptions affect the reported amounts of assets and<br />
liabilities and disclosure of contingent assets and liabilities at the balance sheet date, and the reported amounts<br />
of revenue and expenses during the reporting period. Actual results could differ from management’s estimates.<br />
Refer to Note 02 “Critical Accounting Estimates” for a description of the critical accounting estimates and judgments<br />
used in the preparation of the financial statements.<br />
Financial Guarantees<br />
In the second quarter 2009, retrospective adjustments were made in the consolidated statement of income to<br />
present premiums paid for financial guarantees as expenses, instead of offsetting them against revenues,<br />
because they are not directly related to a revenue generating activity. The adjustment did not have an impact<br />
on net income or shareholders’ equity but resulted in an increase in both Other income and General and administrative<br />
expenses of € 36 million and € 131 million in 2009 and 2008, respectively.
<strong>Deutsche</strong> <strong>Bank</strong> 02 – Consolidated Financial Statements 159<br />
Financial <strong>Report</strong> 2010 Notes to the Consolidated Financial Statements<br />
01 – Significant Accounting Policies<br />
Assignment of Revenue Components in CIB<br />
The presentation of prior period CIB revenues was adjusted during the first half of 2010 following a review of<br />
the assignment of specific revenue components to the product categories. The review resulted in a transfer of<br />
negative revenues of € 325 million and revenues of € 97 million from Loan Products to Sales & Trading (debt and<br />
other products) in 2009 and 2008, respectively. In addition, Sales & Trading (equity) revenues were reduced by<br />
€ 83 million in 2009 and € 105 million in 2008, respectively, with corresponding offsetting effects in Sales &<br />
Trading (debt and other products). These adjustments had no impact on CIB’s total revenues.<br />
Insurance<br />
During the second quarter 2010, the Group changed the presentation of the fees and net settlements associated<br />
with longevity insurance and reinsurance contracts. It was determined that the net presentation of cash flows<br />
under individual longevity insurance and reinsurance contracts reflected the actual settlement of those cash<br />
flows and therefore better reflected the nature of such contracts. This change in presentation resulted in a transfer<br />
of € 117 million of expenses from Other income to Policyholder benefits and claims in 2010.<br />
Software Amortization Periods<br />
In the second quarter 2010, the Group changed the amortization periods for capitalized costs relating to certain<br />
purchased or internally developed software from three years to five or ten years. The change did not have a<br />
material impact on the Group’s consolidated financial statements in 2010.<br />
Allowance for Loan Losses<br />
The Group applies estimates in determining the allowance for loan losses in its homogeneous loan portfolio<br />
which use statistical models based on historical experience. On a regular basis the Group performs procedures<br />
to align input parameters and model assumptions with historically evidenced loss levels. Alignment of input<br />
parameters and model assumptions in 2009 led to a lower level of provisions for credit losses of € 28 million<br />
and € 145.8 million in 2010 and 2009, respectively.<br />
Change in the Functional Currency of a Significant Operation<br />
On January 1, 2010, the functional currency of <strong>Deutsche</strong> <strong>Bank</strong> Aktiengesellschaft London Branch (‘London<br />
Branch’) and certain other London-based subsidiaries was changed from pound sterling to euro.<br />
These entities’ functional currency had previously been determined to be pound sterling on the basis that the<br />
currency of their primary economic environment was based on pound sterling. However during 2009 it was<br />
determined that the London Branch’s operating environment, mix of business and balance sheet composition<br />
had gradually changed over time. To better reflect this change, London Branch management undertook to<br />
manage their operations in euro from January 1, 2010. To implement this decision, procedures were put in<br />
place for London Branch to hedge all non-euro exposures, sell profits into euro and report internally in euro.
<strong>Deutsche</strong> <strong>Bank</strong> 02 – Consolidated Financial Statements 160<br />
Financial <strong>Report</strong> 2010 Notes to the Consolidated Financial Statements<br />
01 – Significant Accounting Policies<br />
The effect of the change in functional currency to euro was applied prospectively in these consolidated financial<br />
statements. The Group translated all items into the new functional currency using the exchange rate as at<br />
January 1, 2010. Exchange differences arising from the translation of the foreign operation previously recorded<br />
in other comprehensive income were not reclassified to profit or loss and remain in other comprehensive income<br />
until the entities are disposed of or sold.<br />
Significant Accounting Policies<br />
The following is a description of the significant accounting policies of the Group. Other than as previously<br />
described, these policies have been consistently applied for 2008, 2009 and 2010.<br />
Principles of Consolidation<br />
The financial information in the consolidated financial statements includes that for the parent company, <strong>Deutsche</strong><br />
<strong>Bank</strong> AG, together with its subsidiaries, including certain special purpose entities (“SPEs”), presented as a<br />
single economic unit.<br />
Subsidiaries<br />
The Group’s subsidiaries are those entities which it controls. The Group controls entities when it has the power<br />
to govern the financial and operating policies of the entity, generally accompanying a shareholding, either<br />
directly or indirectly, of more than one half of the voting rights. The existence and effect of potential voting<br />
rights that are currently exercisable or convertible are considered in assessing whether the Group controls an<br />
entity.<br />
The Group sponsors the formation of SPEs and interacts with non-sponsored SPEs for a variety of reasons,<br />
including allowing clients to hold investments in separate legal entities, allowing clients to invest jointly in<br />
alternative assets, for asset securitization transactions, and for buying or selling credit protection. When<br />
assessing whether to consolidate an SPE, the Group evaluates a range of factors, including whether (1) the<br />
activities of the SPE are being conducted on behalf of the Group according to its specific business needs so<br />
that the Group obtains the benefits from the SPE’s operations, (2) the Group has decision-making powers to<br />
obtain the majority of the benefits, (3) the Group obtains the majority of the benefits of the activities of the<br />
SPE, or (4) the Group retains the majority of the residual ownership risks related to the assets in order to<br />
obtain the benefits from its activities. The Group consolidates an SPE if an assessment of the relevant factors<br />
indicates that it controls the SPE.<br />
Subsidiaries are consolidated from the date on which control is transferred to the Group and are no longer<br />
consolidated from the date that control ceases.<br />
The Group reassesses consolidation status at least at every quarterly reporting date. Therefore, any changes<br />
in structure are considered when they occur. This includes changes to any contractual arrangements the<br />
Group has, including those newly executed with the entity, and is not only limited to changes in ownership.
<strong>Deutsche</strong> <strong>Bank</strong> 02 – Consolidated Financial Statements 161<br />
Financial <strong>Report</strong> 2010 Notes to the Consolidated Financial Statements<br />
01 – Significant Accounting Policies<br />
The Group reassesses its treatment of SPEs for consolidation when there is an overall change in the SPE’s<br />
arrangements or when there has been a substantive change in the relationship between the Group and an<br />
SPE. The circumstances that would indicate that a reassessment for consolidation is necessary include, but<br />
are not limited to, the following:<br />
— substantive changes in ownership of the SPE, such as the purchase of more than an insignificant additional<br />
interest or disposal of more than an insignificant interest in the SPE;<br />
— changes in contractual or governance arrangements of the SPE;<br />
— additional activities undertaken in the structure, such as providing a liquidity facility beyond the terms<br />
established originally or entering into a transaction with an SPE that was not contemplated originally; and<br />
— changes in the financing structure of the entity.<br />
In addition, when the Group concludes that the SPE might require additional support to continue in business,<br />
and such support was not contemplated originally, and, if required, the Group would provide such support for<br />
reputational or other reasons, the Group reassesses the need to consolidate the SPE.<br />
The reassessment of control over the existing SPEs does not automatically lead to consolidation or deconsolidation.<br />
In making such a reassessment, the Group may need to change its assumptions with respect to<br />
loss probabilities, the likelihood of additional liquidity facilities being drawn in the future and the likelihood of<br />
future actions being taken for reputational or other purposes. All currently available information, including<br />
current market parameters and expectations (such as loss expectations on assets), which would incorporate<br />
any market changes since inception of the SPE, is used in the reassessment of consolidation conclusions.<br />
All intercompany transactions, balances and unrealized gains on transactions between Group companies are<br />
eliminated on consolidation. Consistent accounting policies are applied throughout the Group for the purposes<br />
of consolidation. Issuances of a subsidiary’s stock to third parties are treated as noncontrolling interests.<br />
At the date that control of a subsidiary is lost, the Group a) derecognizes the assets (including any goodwill) and<br />
liabilities of the subsidiary at their carrying amounts, b) derecognizes the carrying amount of any noncontrolling<br />
interests in the former subsidiary (including any components in accumulated other comprehensive income<br />
attributable to the subsidiary), c) recognizes the fair value of the consideration received and any distribution of<br />
the shares of the subsidiary, d) recognizes any investment retained in the former subsidiary at its fair value and<br />
e) recognizes any resulting difference of the above items as a gain or loss in the income statement. Any amounts<br />
recognized in prior periods in other comprehensive income in relation to that subsidiary would be reclassified to<br />
the consolidated statement of income at the date that control is lost.<br />
Assets held in an agency or fiduciary capacity are not assets of the Group and are not included in the Group’s<br />
consolidated balance sheet.
<strong>Deutsche</strong> <strong>Bank</strong> 02 – Consolidated Financial Statements 162<br />
Financial <strong>Report</strong> 2010 Notes to the Consolidated Financial Statements<br />
01 – Significant Accounting Policies<br />
Business Combinations and Noncontrolling Interests<br />
The Group uses the acquisition method to account for business combinations. At the date the Group obtains<br />
control of the subsidiary, the cost of an acquisition is measured at the fair value of the consideration given,<br />
including any cash or non cash consideration (equity instruments) transferred, any contingent consideration,<br />
any previously held equity interest in the acquiree and liabilities incurred or assumed. The excess of the<br />
aggregate of the cost of an acquisition and any noncontrolling interest in the acquiree over the Group’s share<br />
of the fair value of the identifiable net assets acquired is recorded as goodwill. If the aggregate of the acquisition<br />
cost and any noncontrolling interest is below the fair value of the identifiable net assets (negative goodwill), a<br />
gain may be reported in other income. Acquisition costs are recognized as expenses in the period in which<br />
they are incurred.<br />
In business combinations achieved in stages (“step acquisitions”), a previously held equity interest in the<br />
acquiree is remeasured to its acquisition-date fair value and the resulting gain or loss, if any, is recognized in<br />
profit or loss. Amounts recognized in prior periods in other comprehensive income associated with the<br />
previously held investment would be reclassified to the consolidated statement of income at the date that<br />
control is obtained, as if the Group had disposed of the previously held equity interest.<br />
Noncontrolling interests are shown in the consolidated balance sheet as a separate component of equity,<br />
which is distinct from the Group’s shareholders’ equity. The net income attributable to noncontrolling interests is<br />
separately disclosed on the face of the consolidated statement of income. Changes in the ownership interest in<br />
subsidiaries which do not result in a change of control are treated as transactions between equity holders and<br />
are reported in additional paid-in capital (APIC).<br />
Associates and Jointly Controlled Entities<br />
An associate is an entity in which the Group has significant influence, but not a controlling interest, over the<br />
operating and financial management policy decisions of the entity. Significant influence is generally presumed<br />
when the Group holds between 20 % and 50 % of the voting rights. The existence and effect of potential voting<br />
rights that are currently exercisable or convertible are considered in assessing whether the Group has significant<br />
influence. Among the other factors that are considered in determining whether the Group has significant influence<br />
are representation on the board of directors (supervisory board in the case of German stock corporations) and<br />
material intercompany transactions. The existence of these factors could require the application of the equity<br />
method of accounting for a particular investment even though the Group’s investment is for less than 20 % of<br />
the voting stock.<br />
A jointly controlled entity exists when the Group has a contractual arrangement with one or more parties to<br />
undertake activities through entities which are subject to joint control.
<strong>Deutsche</strong> <strong>Bank</strong> 02 – Consolidated Financial Statements 163<br />
Financial <strong>Report</strong> 2010 Notes to the Consolidated Financial Statements<br />
01 – Significant Accounting Policies<br />
Investments in associates and jointly controlled entities are accounted for under the equity method of accounting.<br />
The Group’s share of the results of associates and jointly controlled entities is adjusted to conform to the<br />
accounting policies of the Group and are reported in the consolidated statement of income as net income (loss)<br />
from equity method investments. The Group’s share in the associate’s profits and losses resulting from<br />
intercompany sales is eliminated on consolidation.<br />
If the Group previously held an equity interest in an entity (for example, as available for sale) and subsequently<br />
gained significant influence, the previously held equity interest held is remeasured to fair value and any gain or<br />
loss is recognized in the consolidated statement of income. Any amounts previously recognized in other<br />
comprehensive income associated with the equity interest would be reclassified to the consolidated statement<br />
of income at the date the Group gains significant influence, as if the Group had disposed of the previously held<br />
equity interest.<br />
Under the equity method of accounting, the Group’s investments in associates and jointly controlled entities are<br />
initially recorded at cost, and subsequently increased (or decreased) to reflect both the Group’s pro-rata share<br />
of the post-acquisition net income (or loss) of the associate or jointly controlled entity and other movements<br />
included directly in the equity of the associate or jointly controlled entity. Goodwill arising on the acquisition of<br />
an associate or a jointly controlled entity is included in the carrying value of the investment (net of any<br />
accumulated impairment loss). As goodwill is not reported separately it is not specifically tested for impairment.<br />
Rather, the <strong>entire</strong> equity method investment is tested for impairment.<br />
At each balance sheet date, the Group assesses whether there is any objective evidence that the investment<br />
in an associate or jointly controlled entity is impaired. If there is objective evidence of an impairment, an<br />
impairment test is performed by comparing the investment’s recoverable amount, which is the higher of its<br />
value in use and fair value less costs to sell, with its carrying amount. An impairment loss recognized in prior<br />
periods is only reversed if there has been a change in the estimates used to determine the investment’s<br />
recoverable amount since the last impairment loss was recognized. If this is the case the carrying amount of<br />
the investment is increased to its higher recoverable amount. That increase is a reversal of an impairment loss.<br />
Equity method losses in excess of the Group’s carrying value of the investment in the entity are charged against<br />
other assets held by the Group related to the investee. If those assets are written down to zero, a determination<br />
is made whether to report additional losses based on the Group’s obligation to fund such losses.<br />
At the date that the Group ceases to have significant influence over the associate or jointly controlled entity the<br />
Group recognizes a gain or loss on the disposal of the equity method investment equal to the difference<br />
between the sum of the fair value of any retained investment and the proceeds from disposing of the associate<br />
and the then carrying amount of the investment. Amounts recognized in prior periods in other comprehensive<br />
income in relation to the associate or jointly controlled entity would be reclassified to the consolidated statement<br />
of income.
<strong>Deutsche</strong> <strong>Bank</strong> 02 – Consolidated Financial Statements 164<br />
Financial <strong>Report</strong> 2010 Notes to the Consolidated Financial Statements<br />
01 – Significant Accounting Policies<br />
Any retained investment is accounted for as a financial instrument as described in the section entitled<br />
‘Financial Assets and Liabilities’ as follows.<br />
Foreign Currency Translation<br />
The consolidated financial statements are prepared in euros, which is the presentation currency of the Group.<br />
Various entities in the Group use a different functional currency, being the currency of the primary economic<br />
environment in which the entity operates.<br />
An entity records foreign currency revenues, expenses, gains and losses in its functional currency using the<br />
exchange rates prevailing at the dates of recognition.<br />
Monetary assets and liabilities denominated in currencies other than the entity’s functional currency are<br />
translated at the period end closing rate. Foreign exchange gains and losses resulting from the translation and<br />
settlement of these items are recognized in the consolidated statement of income as net gains (losses) on<br />
financial assets/liabilities at fair value through profit or loss in order to align the translation amounts with those<br />
recognized from foreign currency related transactions (derivatives) which hedge these monetary assets and<br />
liabilities.<br />
Nonmonetary items that are measured at historical cost are translated using the historical exchange rate at the<br />
date of the transaction. Translation differences on nonmonetary items which are held at fair value through profit<br />
or loss are recognized in profit or loss. Translation differences on available for sale nonmonetary items (equity<br />
securities) are included in other comprehensive income. Once the available for sale nonmonetary item is sold,<br />
the related cumulative translation difference is transferred to the consolidated statement of income as part of<br />
the overall gain or loss on sale of the item.<br />
For purposes of translation into the presentation currency, assets, liabilities and equity of foreign operations are<br />
translated at the period end closing rate, and items of income and expense are translated into euro at the rates<br />
prevailing on the dates of the transactions, or average rates of exchange where these approximate actual rates.<br />
The exchange differences arising on the translation of a foreign operation are included in other comprehensive<br />
income. For foreign operations that are subsidiaries the amount of exchange differences attributable to any<br />
noncontrolling interest is recognized directly in noncontrolling interests.<br />
Upon disposal of a foreign subsidiary and associate operation (which results in loss of control or significant<br />
influence over that operation) the total cumulative exchange differences recognized in other comprehensive<br />
income are reclassified to profit or loss.<br />
Interest, Fees and Commissions<br />
Revenue is recognized when the amount of revenue and associated costs can be reliably measured, it is probable<br />
that economic benefits associated with the transaction will be realized, and the stage of completion of the<br />
transaction can be reliably measured. This concept is applied to the key revenue generating activities of the<br />
Group as follows.
<strong>Deutsche</strong> <strong>Bank</strong> 02 – Consolidated Financial Statements 165<br />
Financial <strong>Report</strong> 2010 Notes to the Consolidated Financial Statements<br />
01 – Significant Accounting Policies<br />
Net Interest Income. Interest from all interest-bearing assets and liabilities is recognized as net interest<br />
income using the effective interest method. The effective interest rate is a method of calculating the amortized<br />
cost of a financial asset or a financial liability and of allocating the interest income or expense over the relevant<br />
period using the estimated future cash flows. The estimated future cash flows used in this calculation include<br />
those determined by the contractual terms of the asset or liability, all fees that are considered to be integral to<br />
the effective interest rate, direct and incremental transaction costs, and all other premiums or discounts.<br />
Once an impairment loss has been recognized on a loan or available for sale debt security financial asset,<br />
although the accrual of interest in accordance with the contractual terms of the instrument is discontinued,<br />
interest income is recognized based on the rate of interest that was used to discount future cash flows for the<br />
purpose of measuring the impairment loss. For a loan this would be the original effective interest rate, but a<br />
new effective interest rate would be established each time an available for sale debt security is impaired as<br />
impairment is measured to fair value and would be based on a current market rate.<br />
When financial assets are reclassified from trading or available for sale to loans a new effective interest rate is<br />
established based on the fair value at the date of the reclassification and on a best estimate of future expected<br />
cash flows.<br />
Commission and Fee Income. The recognition of fee revenue (including commissions) is determined by the<br />
purpose of the fees and the basis of accounting for any associated financial instruments. If there is an associated<br />
financial instrument, fees that are an integral part of the effective interest rate of that financial instrument are<br />
included within the effective yield calculation. However, if the financial instrument is carried at fair value through<br />
profit or loss, any associated fees are recognized in profit or loss when the instrument is initially recognized,<br />
provided there are no significant unobservable inputs used in determining its fair value. Fees earned from<br />
services that are provided over a specified service period are recognized over that service period. Fees earned<br />
for the completion of a specific service or significant event are recognized when the service has been completed<br />
or the event has occurred.<br />
Loan commitment fees related to commitments that are not accounted for at fair value through profit or loss<br />
are recognized in commissions and fee income over the life of the commitment if it is unlikely that the Group<br />
will enter into a specific lending arrangement. If it is probable that the Group will enter into a specific lending<br />
arrangement, the loan commitment fee is deferred until the origination of a loan and recognized as an adjustment<br />
to the loan’s effective interest rate.<br />
Performance-linked fees or fee components are recognized when the performance criteria are fulfilled.<br />
The following fee income is predominantly earned from services that are provided over a period of time:<br />
investment fund management fees, fiduciary fees, custodian fees, portfolio and other management and<br />
advisory fees, credit-related fees and commission income. Fees predominantly earned from providing<br />
transaction-type services include underwriting fees, corporate finance fees and brokerage fees.
<strong>Deutsche</strong> <strong>Bank</strong> 02 – Consolidated Financial Statements 166<br />
Financial <strong>Report</strong> 2010 Notes to the Consolidated Financial Statements<br />
01 – Significant Accounting Policies<br />
Arrangements involving multiple services or products. If the Group contracts to provide multiple products,<br />
services or rights to a counterparty, an evaluation is made as to whether an overall fee should be allocated to<br />
the different components of the arrangement for revenue recognition purposes. Structured trades executed by<br />
the Group are the principal example of such arrangements and are assessed on a transaction by transaction<br />
basis. The assessment considers the value of items or services delivered to ensure that the Group’s continuing<br />
involvement in other aspects of the arrangement are not essential to the items delivered. It also assesses the<br />
value of items not yet delivered and, if there is a right of return on delivered items, the probability of future<br />
delivery of remaining items or services. If it is determined that it is appropriate to look at the arrangements as<br />
separate components, the amounts received are allocated based on the relative value of each component.<br />
If there is no objective and reliable evidence of the value of the delivered item or an individual item is required<br />
to be recognized at fair value then the residual method is used. The residual method calculates the amount to<br />
be recognized for the delivered component as being the amount remaining after allocating an appropriate amount<br />
of revenue to all other components.<br />
Financial Assets and Liabilities<br />
The Group classifies its financial assets and liabilities into the following categories: financial assets and<br />
liabilities at fair value through profit or loss, loans, financial assets available for sale (“AFS”) and other financial<br />
liabilities. The Group does not classify any financial instruments under the held-to-maturity category. Appropriate<br />
classification of financial assets and liabilities is determined at the time of initial recognition or when reclassified<br />
in the consolidated balance sheet.<br />
Financial instruments classified at fair value through profit or loss and financial assets classified as AFS are<br />
recognized on trade date, which is the date on which the Group commits to purchase or sell the asset or issue<br />
or repurchase the financial liability. All other financial instruments are recognized on a settlement date basis.<br />
Financial Assets and Liabilities at Fair Value through Profit or Loss<br />
The Group classifies certain financial assets and financial liabilities as either held for trading or designated at<br />
fair value through profit or loss. They are carried at fair value and presented as financial assets at fair value<br />
through profit or loss and financial liabilities at fair value through profit or loss, respectively. Related realized<br />
and unrealized gains and losses are included in net gains (losses) on financial assets/liabilities at fair value<br />
through profit or loss. Interest on interest earning assets such as trading loans and debt securities and dividends<br />
on equity instruments are presented in interest and similar income for financial instruments at fair value through<br />
profit or loss.
<strong>Deutsche</strong> <strong>Bank</strong> 02 – Consolidated Financial Statements 167<br />
Financial <strong>Report</strong> 2010 Notes to the Consolidated Financial Statements<br />
01 – Significant Accounting Policies<br />
Trading Assets and Liabilities. Financial instruments are classified as held for trading if they have been<br />
originated, acquired or incurred principally for the purpose of selling or repurchasing them in the near term, or<br />
they form part of a portfolio of identified financial instruments that are managed together and for which there is<br />
evidence of a recent actual pattern of short-term profit-taking. Also included in this category are physical<br />
commodities held by the Group’s commodity trading business, at fair value less costs to sell.<br />
Financial Instruments Designated at Fair Value through Profit or Loss. Certain financial assets and liabilities<br />
that do not meet the definition of trading assets and liabilities are designated at fair value through profit or loss<br />
using the fair value option. To be designated at fair value through profit or loss, financial assets and liabilities<br />
must meet one of the following criteria: (1) the designation eliminates or significantly reduces a measurement<br />
or recognition inconsistency; (2) a group of financial assets or liabilities or both is managed and its performance<br />
is evaluated on a fair value basis in accordance with a documented risk management or investment strategy;<br />
or (3) the instrument contains one or more embedded derivatives unless: (a) the embedded derivative does not<br />
significantly modify the cash flows that otherwise would be required by the contract; or (b) it is clear with little or<br />
no analysis that separation is prohibited. In addition, the Group allows the fair value option to be designated<br />
only for those financial instruments for which a reliable estimate of fair value can be obtained.<br />
Loan Commitments<br />
Certain loan commitments are designated at fair value through profit or loss under the fair value option. As<br />
indicated under the discussion of ‘Derivatives and Hedge Accounting’, some loan commitments are classified<br />
as financial liabilities at fair value through profit or loss. All other loan commitments remain off-balance sheet.<br />
Therefore, the Group does not recognize and measure changes in fair value of these off-balance sheet loan<br />
commitments that result from changes in market interest rates or credit spreads. However, as specified in the<br />
discussion “Impairment of loans and provision for off-balance sheet positions”, these off-balance sheet loan<br />
commitments are assessed for impairment individually and, where appropriate, collectively.<br />
Loans<br />
Loans include originated and purchased non-derivative financial assets with fixed or determinable payments<br />
that are not quoted in an active market and which are not classified as financial assets at fair value through<br />
profit or loss or financial assets AFS. An active market exists when quoted prices are readily and regularly<br />
available from an exchange, dealer, broker, industry group, pricing service or regulatory agency and those<br />
prices represent actual and regularly occurring market transactions on an arm’s length basis.<br />
Loans not acquired in a business combination or in an asset purchase are initially recognized at their transaction<br />
price, which is the cash amount advanced to the borrower. In addition, the net of direct and incremental<br />
transaction costs and fees are included in the initial carrying amount of loans. These loans are subsequently<br />
measured at amortized cost using the effective interest method less impairment.
<strong>Deutsche</strong> <strong>Bank</strong> 02 – Consolidated Financial Statements 168<br />
Financial <strong>Report</strong> 2010 Notes to the Consolidated Financial Statements<br />
01 – Significant Accounting Policies<br />
Loans which have been acquired as either part of a business combination or as an asset purchase are initially<br />
recognized at fair value at the acquisition date. The fair value at the acquisition date incorporates expected<br />
cash flows which consider the credit quality of these loans including any incurred losses. Interest income is<br />
recognized using the effective interest method. Subsequent to the acquisition date the Group assesses<br />
whether there is objective evidence of impairment in line with the policies described in the section entitled<br />
‘Impairment of Loans and Provisions for Off Balance Sheet Positions’. If the loans are determined to be<br />
impaired then a loan loss allowance is recognized with a corresponding charge to the provision for credit<br />
losses line in the consolidated statement of income. Any subsequent improvements in the credit quality of<br />
these loans above the acquisition date fair value are recorded as an increase in the loan carrying amount with<br />
a corresponding gain recognized in interest income.<br />
Financial Assets Classified as Available for Sale<br />
Financial assets that are not classified as at fair value through profit or loss or as loans are classified as AFS.<br />
A financial asset classified as AFS is initially recognized at its fair value plus transaction costs that are directly<br />
attributable to the acquisition of the financial asset. The amortization of premiums and accretion of discount are<br />
recorded in net interest income. Financial assets classified as AFS are carried at fair value with the changes in<br />
fair value reported in other comprehensive income, unless the asset is subject to a fair value hedge, in which<br />
case changes in fair value resulting from the risk being hedged are recorded in other income. For monetary<br />
financial assets classified as AFS (debt instruments), changes in carrying amounts relating to changes in<br />
foreign exchange rate are recognized in the consolidated statement of income and other changes in carrying<br />
amount are recognized in other comprehensive income as indicated above. For financial assets classified as<br />
AFS that are nonmonetary items (equity instruments), the gain or loss that is recognized in other comprehensive<br />
income includes any related foreign exchange component.<br />
Financial assets classified as AFS are assessed for impairment as discussed in the section entitled “Impairment<br />
of financial assets classified as Available for Sale”. Realized gains and losses are reported in net gains (losses)<br />
on financial assets available for sale. Generally, the weighted-average cost method is used to determine the<br />
cost of financial assets. Unrealized gains and losses recorded in other comprehensive income are transferred<br />
to the consolidated statement of income on disposal of an available for sale asset and reported in net gains<br />
(losses) on financial assets available for sale.<br />
Financial Liabilities<br />
Except for financial liabilities at fair value through profit or loss, financial liabilities are measured at amortized<br />
cost using the effective interest method.<br />
Financial liabilities include long-term and short-term debt issued which are initially measured at fair value,<br />
which is the consideration received, net of transaction costs incurred. Repurchases of issued debt in the<br />
market are treated as extinguishments and any related gain or loss is recorded in the consolidated statement<br />
of income. A subsequent sale of own bonds in the market is treated as a reissuance of debt.
<strong>Deutsche</strong> <strong>Bank</strong> 02 – Consolidated Financial Statements 169<br />
Financial <strong>Report</strong> 2010 Notes to the Consolidated Financial Statements<br />
01 – Significant Accounting Policies<br />
Reclassification of Financial Assets<br />
The Group may reclassify certain financial assets out of the financial assets at fair value through profit or loss<br />
classification (trading assets) and the AFS classification into the loans classification. For assets to be reclassified<br />
there must be a clear change in management intent with respect to the assets since initial recognition and<br />
the financial asset must meet the definition of a loan at the reclassification date. Additionally, there must be an<br />
intent and ability to hold the asset for the foreseeable future at the reclassification date. There is no single specific<br />
period that defines foreseeable future. Rather, it is a matter requiring management judgment. In exercising this<br />
judgment, the Group established the following minimum requirements for what constitutes foreseeable future.<br />
At the time of reclassification,<br />
— there must be no intent to dispose of the asset through sale or securitization within one year and no internal<br />
or external requirement that would restrict the Group’s ability to hold or require sale; and<br />
— the business plan going forward should not be to profit from short-term movements in price.<br />
Financial assets proposed for reclassification which meet these criteria are considered based on the facts and<br />
circumstances of each financial asset under consideration. A positive management assertion is required after<br />
taking into account the ability and plausibility to execute the strategy to hold.<br />
In addition to the above criteria the Group also requires that persuasive evidence exists to assert that the expected<br />
repayment of the asset exceeds the estimated fair value and the returns on the asset will be optimized by<br />
holding it for the foreseeable future.<br />
Financial assets are reclassified at their fair value at the reclassification date. Any gain or loss already recognized<br />
in the consolidated statement of income is not reversed. The fair value of the instrument at reclassification date<br />
becomes the new amortized cost of the instrument. The expected cash flows on the financial instruments are<br />
estimated at the reclassification date and these estimates are used to calculate a new effective interest rate for<br />
the instruments. If there is a subsequent increase in expected future cash flows on reclassified assets as a result<br />
of increased recoverability, the effect of that increase is recognized as an adjustment to the effective interest rate<br />
from the date of the change in estimate rather than as an adjustment to the carrying amount of the asset at the<br />
date of the change in estimate. If there is a subsequent decrease in expected future cash flows the asset would<br />
be assessed for impairment as discussed in the section entitled “Impairment of Loans and Provision for Off-Balance<br />
Sheet Positions”. Any change in the timing of the cash flows of reclassified assets which are not deemed impaired<br />
are recorded as an adjustment to the carrying amount of the asset.<br />
For instruments reclassified from AFS to loans any unrealized gain or loss recognized in other comprehensive<br />
income is subsequently amortized into interest income using the effective interest rate of the instrument. If the<br />
instrument is subsequently impaired any unrealized loss which is held in accumulated other comprehensive<br />
income for that instrument at that date is immediately recognized in the consolidated statement of income as a<br />
loan loss provision.
<strong>Deutsche</strong> <strong>Bank</strong> 02 – Consolidated Financial Statements 170<br />
Financial <strong>Report</strong> 2010 Notes to the Consolidated Financial Statements<br />
01 – Significant Accounting Policies<br />
To the extent that assets categorized as loans are repaid, restructured or eventually sold and the amount<br />
received is less than the carrying value at that time, then a loss would be recognized in the consolidated<br />
statement of income as a component of the provision for credit losses, if the loan is impaired, or otherwise in<br />
other income, if the loan is not impaired.<br />
Determination of Fair Value<br />
Fair value is defined as the price at which an asset or liability could be exchanged in a current transaction<br />
between knowledgeable, willing parties, other than in a forced or liquidation sale. The fair value of instruments<br />
that are quoted in active markets is determined using the quoted prices where they represent those at which<br />
regularly and recently occurring transactions take place. The Group uses valuation techniques to establish<br />
the fair value of instruments where prices quoted in active markets are not available. Therefore, where possible,<br />
parameter inputs to the valuation techniques are based on observable data derived from prices of relevant<br />
instruments traded in an active market. These valuation techniques involve some level of management estimation<br />
and judgment, the degree of which will depend on the price transparency for the instrument or market and the<br />
instrument’s complexity. Refer to Note 02 “Critical Accounting Estimates – Fair Value Estimates – Methods of<br />
Determining Fair Value” for further discussion of the accounting estimates and judgments required in the<br />
determination of fair value.<br />
Recognition of Trade Date Profit<br />
If there are significant unobservable inputs used in the valuation technique, the financial instrument is recognized<br />
at the transaction price and any profit implied from the valuation technique at trade date is deferred. Using<br />
systematic methods, the deferred amount is recognized over the period between trade date and the date when<br />
the market is expected to become observable, or over the life of the trade (whichever is shorter). Such<br />
methodology is used because it reflects the changing economic and risk profile of the instrument as the market<br />
develops or as the instrument itself progresses to maturity. Any remaining trade date deferred profit is recognized<br />
in the consolidated statement of income when the transaction becomes observable or the Group enters into<br />
off-setting transactions that substantially eliminate the instrument’s risk. In the rare circumstances that a trade<br />
date loss arises, it would be recognized at inception of the transaction to the extent that it is probable that a<br />
loss has been incurred and a reliable estimate of the loss amount can be made. Refer to Note 02 “Critical<br />
Accounting Estimates – Fair Value Estimates – Methods of Determining Fair Value” for further discussion of the<br />
estimates and judgments required in assessing observability of inputs and risk mitigation.<br />
Derivatives and Hedge Accounting<br />
Derivatives are used to manage exposures to interest rate, foreign currency, credit and other market price risks,<br />
including exposures arising from forecast transactions. All freestanding contracts that are considered derivatives<br />
for accounting purposes are carried at fair value on the consolidated balance sheet regardless of whether they<br />
are held for trading or nontrading purposes.<br />
Gains and losses on derivatives held for trading are included in net gains (losses) on financial assets/liabilities<br />
at fair value through profit or loss.
<strong>Deutsche</strong> <strong>Bank</strong> 02 – Consolidated Financial Statements 171<br />
Financial <strong>Report</strong> 2010 Notes to the Consolidated Financial Statements<br />
01 – Significant Accounting Policies<br />
The Group makes commitments to originate loans it intends to sell. Such positions are classified as financial<br />
assets/liabilities at fair value through profit or loss, and related gains and losses are included in net gains<br />
(losses) on financial assets/liabilities at fair value through profit or loss. Loan commitments that can be settled<br />
net in cash or by delivering or issuing another financial instrument are classified as derivatives. Market value<br />
guarantees provided on specific mutual fund products offered by the Group are also accounted for as derivatives<br />
and carried at fair value, with changes in fair value recorded in net gains (losses) on financial assets/liabilities<br />
at fair value through profit or loss.<br />
Certain derivatives entered into for nontrading purposes, which do not qualify for hedge accounting but are<br />
otherwise effective in offsetting the effect of transactions on noninterest income and expenses, are recorded in<br />
other assets or other liabilities with both realized and unrealized changes in fair value recorded in the same<br />
noninterest income and expense captions as those affected by the transaction being offset. The changes in fair<br />
value of all other derivatives not qualifying for hedge accounting are recorded in net gains and losses on financial<br />
assets/liabilities at fair value through profit or loss.<br />
Embedded Derivatives<br />
Some hybrid contracts contain both a derivative and a non-derivative component. In such cases, the derivative<br />
component is termed an embedded derivative, with the non-derivative component representing the host contract.<br />
If the economic characteristics and risks of embedded derivatives are not closely related to those of the host<br />
contract, and the hybrid contract itself is not carried at fair value through profit or loss, the embedded derivative<br />
is bifurcated and reported at fair value, with gains and losses recognized in net gains (losses) on financial assets/<br />
liabilities at fair value through profit or loss. The host contract will continue to be accounted for in accordance<br />
with the appropriate accounting standard. The carrying amount of an embedded derivative is reported in the<br />
same consolidated balance sheet line item as the host contract. Certain hybrid instruments have been designated<br />
at fair value through profit or loss using the fair value option.<br />
Hedge Accounting<br />
For accounting purposes there are three possible types of hedges: (1) hedges of changes in the fair value of<br />
assets, liabilities or unrecognized firm commitments (fair value hedges); (2) hedges of the variability of future<br />
cash flows from highly probable forecast transactions and floating rate assets and liabilities (cash flow hedges);<br />
and (3) hedges of the translation adjustments resulting from translating the functional currency financial<br />
statements of foreign operations into the presentation currency of the parent (hedges of net investments in<br />
foreign operations).<br />
When hedge accounting is applied, the Group designates and documents the relationship between the hedging<br />
instrument and the hedged item as well as its risk management objective and strategy for undertaking the<br />
hedging transactions, and the nature of the risk being hedged. This documentation includes a description of<br />
how the Group will assess the hedging instrument’s effectiveness in offsetting the exposure to changes in the<br />
hedged item’s fair value or cash flows attributable to the hedged risk. Hedge effectiveness is assessed at<br />
inception and throughout the term of each hedging relationship. Hedge effectiveness is always assessed, even<br />
when the terms of the derivative and hedged item are matched.
<strong>Deutsche</strong> <strong>Bank</strong> 02 – Consolidated Financial Statements 172<br />
Financial <strong>Report</strong> 2010 Notes to the Consolidated Financial Statements<br />
01 – Significant Accounting Policies<br />
Hedging derivatives are reported as other assets and other liabilities. In the event that a derivative is subsequently<br />
de-designated from a hedging relationship, it is transferred to financial assets/liabilities at fair value through<br />
profit or loss. Subsequent changes in fair value are recognized in net gains (losses) on financial assets/liabilities<br />
at fair value through profit or loss.<br />
For hedges of changes in fair value, the changes in the fair value of the hedged asset, liability or unrecognized<br />
firm commitment, or a portion thereof, attributable to the risk being hedged are recognized in the consolidated<br />
statement of income along with changes in the <strong>entire</strong> fair value of the derivative. When hedging interest rate<br />
risk, any interest accrued or paid on both the derivative and the hedged item is reported in interest income or<br />
expense and the unrealized gains and losses from the hedge accounting fair value adjustments are reported in<br />
other income. When hedging the foreign exchange risk of an AFS security, the fair value adjustments related to<br />
the security’s foreign exchange exposures are also recorded in other income. Hedge ineffectiveness is reported<br />
in other income and is measured as the net effect of changes in the fair value of the hedging instrument and<br />
changes in the fair value of the hedged item arising from changes in the market rate or price related to the<br />
risk(s) being hedged.<br />
If a fair value hedge of a debt instrument is discontinued prior to the instrument’s maturity because the derivative<br />
is terminated or the relationship is de-designated, any remaining interest rate-related fair value adjustments<br />
made to the carrying amount of the debt instrument (basis adjustments) are amortized to interest income or<br />
expense over the remaining term of the original hedging relationship. For other types of fair value adjustments<br />
and whenever a fair value hedged asset or liability is sold or otherwise derecognized any basis adjustments<br />
are included in the calculation of the gain or loss on derecognition.<br />
For hedges of variability in future cash flows, there is no change to the accounting for the hedged item and the<br />
derivative is carried at fair value, with changes in value reported initially in other comprehensive income to the<br />
extent the hedge is effective. These amounts initially recorded in other comprehensive income are subsequently<br />
reclassified into the consolidated statement of income in the same periods during which the forecast transaction<br />
affects the consolidated statement of income. Thus, for hedges of interest rate risk, the amounts are amortized<br />
into interest income or expense at the same time as the interest is accrued on the hedged transaction.<br />
Hedge ineffectiveness is recorded in other income and is measured as changes in the excess (if any) in the<br />
absolute cumulative change in fair value of the actual hedging derivative over the absolute cumulative change<br />
in the fair value of the hypothetically perfect hedge.<br />
When hedges of variability in cash flows attributable to interest rate risk are discontinued, amounts remaining<br />
in accumulated other comprehensive income are amortized to interest income or expense over the remaining<br />
life of the original hedge relationship, unless the hedged transaction is no longer expected to occur in which<br />
case the amount will be reclassified into other income immediately. When hedges of variability in cash flows<br />
attributable to other risks are discontinued, the related amounts in accumulated other comprehensive income<br />
are reclassified into either the same consolidated statement of income caption and period as profit or loss from<br />
the forecast transaction, or into other income when the forecast transaction is no longer expected to occur.
<strong>Deutsche</strong> <strong>Bank</strong> 02 – Consolidated Financial Statements 173<br />
Financial <strong>Report</strong> 2010 Notes to the Consolidated Financial Statements<br />
01 – Significant Accounting Policies<br />
For hedges of the translation adjustments resulting from translating the functional currency financial statements<br />
of foreign operations (hedges of net investments in foreign operations) into the functional currency of the parent,<br />
the portion of the change in fair value of the derivative due to changes in the spot foreign exchange rates is<br />
recorded as a foreign currency translation adjustment in other comprehensive income to the extent the hedge<br />
is effective; the remainder is recorded as other income in the consolidated statement of income.<br />
Changes in fair value of the hedging instrument relating to the effective portion of the hedge are subsequently<br />
recognized in profit or loss on disposal of the foreign operations.<br />
Impairment of Financial Assets<br />
At each balance sheet date, the Group assesses whether there is objective evidence that a financial asset or<br />
a group of financial assets is impaired. A financial asset or group of financial assets is impaired and impairment<br />
losses are incurred if:<br />
— there is objective evidence of impairment as a result of a loss event that occurred after the initial recognition<br />
of the asset and up to the balance sheet date (“a loss event”);<br />
— the loss event had an impact on the estimated future cash flows of the financial asset or the group of<br />
financial assets and<br />
— a reliable estimate of the loss amount can be made.<br />
Impairment of Loans and Provision for Off-Balance Sheet Positions<br />
The Group first assesses whether objective evidence of impairment exists individually for loans that are<br />
individually significant. It then assesses collectively for loans that are not individually significant and loans which<br />
are significant but for which there is no objective evidence of impairment under the individual assessment.<br />
To allow management to determine whether a loss event has occurred on an individual basis, all significant<br />
counterparty relationships are reviewed periodically. This evaluation considers current information and events<br />
related to the counterparty, such as the counterparty experiencing significant financial difficulty or a breach of<br />
contract, for example, default or delinquency in interest or principal payments.<br />
If there is evidence of impairment leading to an impairment loss for an individual counterparty relationship, then<br />
the amount of the loss is determined as the difference between the carrying amount of the loan(s), including<br />
accrued interest, and the present value of expected future cash flows discounted at the loan’s original effective<br />
interest rate or the effective interest rate established upon reclassification to loans, including cash flows that<br />
may result from foreclosure less costs for obtaining and selling the collateral. The carrying amount of the loans<br />
is reduced by the use of an allowance account and the amount of the loss is recognized in the consolidated<br />
statement of income as a component of the provision for credit losses.<br />
The collective assessment of impairment is principally to establish an allowance amount relating to loans that<br />
are either individually significant but for which there is no objective evidence of impairment, or are not individually<br />
significant but for which there is, on a portfolio basis, a loss amount that is probable of having occurred and is<br />
reasonably estimable. The loss amount has three components. The first component is an amount for transfer<br />
and currency convertibility risks for loan exposures in countries where there are serious doubts about the ability<br />
of counterparties to comply with the repayment terms due to the economic or political situation prevailing in the<br />
respective country of domicile. This amount is calculated using ratings for country risk and transfer risk which<br />
are established and regularly reviewed for each country in which the Group does business. The second<br />
component is an allowance amount representing the incurred losses on the portfolio of smaller-balance<br />
homogeneous loans, which are loans to individuals and small business customers of the private and retail
<strong>Deutsche</strong> <strong>Bank</strong> 02 – Consolidated Financial Statements 174<br />
Financial <strong>Report</strong> 2010 Notes to the Consolidated Financial Statements<br />
01 – Significant Accounting Policies<br />
business. The loans are grouped according to similar credit risk characteristics and the allowance for each<br />
group is determined using statistical models based on historical experience. The third component represents<br />
an estimate of incurred losses inherent in the group of loans that have not yet been individually identified or<br />
measured as part of the smaller-balance homogeneous loans. Loans that were found not to be impaired when<br />
evaluated on an individual basis are included in the scope of this component of the allowance.<br />
Once a loan is identified as impaired, although the accrual of interest in accordance with the contractual terms<br />
of the loan is discontinued, the accretion of the net present value of the written down amount of the loan due to<br />
the passage of time is recognized as interest income based on the original effective interest rate of the loan.<br />
At each balance sheet date, all impaired loans are reviewed for changes to the present value of expected future<br />
cash flows discounted at the loan’s original effective interest rate. Any change to the previously recognized<br />
impairment loss is recognized as a change to the allowance account and recorded in the consolidated<br />
statement of income as a component of the provision for credit losses.<br />
When it is considered that there is no realistic prospect of recovery and all collateral has been realized or<br />
transferred to the Group, the loan and any associated allowance is written off. Subsequent recoveries, if any,<br />
are credited to the allowance account and recorded in the consolidated statement of income as a component<br />
of the provision for credit losses.<br />
The process to determine the provision for off-balance sheet positions is similar to the methodology used for<br />
loans. Any loss amounts are recognized as an allowance in the consolidated balance sheet within other liabilities<br />
and charged to the consolidated statement of income as a component of the provision for credit losses.<br />
If in a subsequent period the amount of a previously recognized impairment loss decreases and the decrease<br />
is due to an event occurring after the impairment was recognized, the impairment loss is reversed by reducing<br />
the allowance account accordingly. Such reversal is recognized in profit or loss.<br />
Impairment of Financial Assets Classified as Available for Sale<br />
For financial assets classified as AFS, management assesses at each balance sheet date whether there is<br />
objective evidence that an individual asset is impaired.<br />
In the case of equity investments classified as AFS, objective evidence includes a significant or prolonged decline<br />
in the fair value of the investment below cost. In the case of debt securities classified as AFS, impairment is<br />
assessed based on the same criteria as for loans.
<strong>Deutsche</strong> <strong>Bank</strong> 02 – Consolidated Financial Statements 175<br />
Financial <strong>Report</strong> 2010 Notes to the Consolidated Financial Statements<br />
01 – Significant Accounting Policies<br />
If there is evidence of impairment, any amounts previously recognized in other comprehensive income are<br />
recognized in the consolidated statement of income for the period, reported in net gains (losses) on financial<br />
assets available for sale. This amount is determined as the difference between the acquisition cost (net of any<br />
principal repayments and amortization) and current fair value of the asset less any impairment loss on that<br />
investment previously recognized in the consolidated statement of income.<br />
When an AFS debt security is impaired, any subsequent decreases in fair value are recognized in the<br />
consolidated statement of income as it is considered further impairment. Any subsequent increases are also<br />
recognized in the consolidated statement of income until the asset is no longer considered impaired. When the<br />
fair value of the AFS debt security recovers to at least amortized cost it is no longer considered impaired and<br />
subsequent changes in fair value are reported in other comprehensive income.<br />
Reversals of impairment losses on equity investments classified as AFS are not reversed through the<br />
consolidated statement of income; increases in their fair value after impairment are recognized in other<br />
comprehensive income.<br />
Derecognition of Financial Assets and Liabilities<br />
Financial Asset Derecognition<br />
A financial asset is considered for derecognition when the contractual rights to the cash flows from the financial<br />
asset expire, or the Group has either transferred the contractual right to receive the cash flows from that asset,<br />
or has assumed an obligation to pay those cash flows to one or more recipients, subject to certain criteria.<br />
The Group derecognizes a transferred financial asset if it transfers substantially all the risks and rewards of<br />
ownership.<br />
The Group enters into transactions in which it transfers previously recognized financial assets but retains<br />
substantially all the associated risks and rewards of those assets; for example, a sale to a third party in which<br />
the Group enters into a concurrent total return swap with the same counterparty. These types of transactions<br />
are accounted for as secured financing transactions.<br />
In transactions in which substantially all the risks and rewards of ownership of a financial asset are neither<br />
retained nor transferred, the Group derecognizes the transferred asset if control over that asset is not retained,<br />
i.e., if the transferee has the practical ability to sell the transferred asset. The rights and obligations retained in<br />
the transfer are recognized separately as assets and liabilities, as appropriate. If control over the asset is<br />
retained, the Group continues to recognize the asset to the extent of its continuing involvement, which is<br />
determined by the extent to which it remains exposed to changes in the value of the transferred asset.
<strong>Deutsche</strong> <strong>Bank</strong> 02 – Consolidated Financial Statements 176<br />
Financial <strong>Report</strong> 2010 Notes to the Consolidated Financial Statements<br />
01 – Significant Accounting Policies<br />
The derecognition criteria are also applied to the transfer of part of an asset, rather than the asset as a whole,<br />
or to a group of similar financial assets in their <strong>entire</strong>ty, when applicable. If transferring a part of an asset, such<br />
part must be a specifically identified cash flow, a fully proportionate share of the asset, or a fully proportionate<br />
share of a specifically-identified cash flow.<br />
If an existing financial asset is replaced by another asset from the same counterparty on substantially different<br />
terms, or if the terms of the financial asset are substantially modified, the existing financial asset is derecognized<br />
and a new asset is recognized. Any difference between the respective carrying amounts is recognized in the<br />
consolidated statement of income.<br />
Securitization<br />
The Group securitizes various consumer and commercial financial assets, which is achieved via the sale of<br />
these assets to an SPE, which in turn issues securities to investors. The transferred assets may qualify for<br />
derecognition in full or in part, under the policy on derecognition of financial assets. Synthetic securitization<br />
structures typically involve derivative financial instruments for which the policies in the “Derivatives and Hedge<br />
Accounting” section would apply. Those transfers that do not qualify for derecognition may be reported as<br />
secured financing or result in the recognition of continuing involvement liabilities. The investors and the<br />
securitization vehicles generally have no recourse to the Group’s other assets in cases where the issuers of<br />
the financial assets fail to perform under the original terms of those assets.<br />
Interests in the securitized financial assets may be retained in the form of senior or subordinated tranches,<br />
interest only strips or other residual interests (collectively referred to as ‘retained interests’). Provided the<br />
Group’s retained interests do not result in consolidation of an SPE, nor in continued recognition of the transferred<br />
assets, these interests are typically recorded in financial assets at fair value through profit or loss and carried at<br />
fair value. Consistent with the valuation of similar financial instruments, fair value of retained tranches or the<br />
financial assets is initially and subsequently determined using market price quotations where available or<br />
internal pricing models that utilize variables such as yield curves, prepayment speeds, default rates, loss<br />
severity, interest rate volatilities and spreads. The assumptions used for pricing are based on observable<br />
transactions in similar securities and are verified by external pricing sources, where available. Where observable<br />
transactions in similar securities and other external pricing sources are not available, management judgment<br />
as described in the section entitled “Fair Value Estimates” must be used to determine fair value.<br />
Gains or losses on securitization depend in part on the carrying amount of the transferred financial assets,<br />
allocated between the financial assets derecognized and the retained interests based on their relative fair<br />
values at the date of the transfer.
<strong>Deutsche</strong> <strong>Bank</strong> 02 – Consolidated Financial Statements 177<br />
Financial <strong>Report</strong> 2010 Notes to the Consolidated Financial Statements<br />
01 – Significant Accounting Policies<br />
Derecognition of Financial Liabilities<br />
A financial liability is derecognized when the obligation under the liability is discharged or canceled or expires.<br />
If an existing financial liability is replaced by another from the same lender on substantially different terms, or<br />
the terms of the existing liability are substantially modified, such an exchange or modification is treated as a<br />
derecognition of the original liability and the recognition of a new liability, and the difference in the respective<br />
carrying amounts is recognized in the consolidated statement of income.<br />
Repurchase and Reverse Repurchase Agreements<br />
Securities purchased under resale agreements (“reverse repurchase agreements”) and securities sold under<br />
agreements to repurchase (“repurchase agreements”) are treated as collateralized financings and are recognized<br />
initially at fair value, being the amount of cash disbursed and received, respectively. The party disbursing the<br />
cash takes possession of the securities serving as collateral for the financing and having a market value equal<br />
to, or in excess of the principal amount loaned. The securities received under reverse repurchase agreements<br />
and securities delivered under repurchase agreements are not recognized on, or derecognized from, the balance<br />
sheet, unless the risks and rewards of ownership are obtained or relinquished. Securities delivered under<br />
repurchase agreements which are not derecognized from the balance sheet and where the counterparty has<br />
the right by contract or custom to sell or repledge the collateral are disclosed as such on the face of the<br />
consolidated balance sheet.<br />
The Group has chosen to apply the fair value option to certain repurchase and reverse repurchase portfolios<br />
that are managed on a fair value basis.<br />
Interest earned on reverse repurchase agreements and interest incurred on repurchase agreements is reported<br />
as interest income and interest expense, respectively.<br />
Securities Borrowed and Securities Loaned<br />
Securities borrowed transactions generally require the Group to deposit cash with the securities lender. In a<br />
securities loaned transaction, the Group generally receives either cash collateral, in an amount equal to or in<br />
excess of the market value of securities loaned, or securities. The Group monitors the fair value of securities<br />
borrowed and securities loaned and additional collateral is disbursed or obtained, if necessary.<br />
The amount of cash advanced or received is recorded as securities borrowed and securities loaned, respectively.<br />
The securities borrowed are not themselves recognized in the financial statements. If they are sold to third parties,<br />
the obligation to return the securities is recorded as a financial liability at fair value through profit or loss and<br />
any subsequent gain or loss is included in the consolidated statement of income in net gain (loss) on financial<br />
assets/liabilities at fair value through profit or loss. Securities lent to counterparties are also retained on the<br />
consolidated balance sheet.<br />
Fees received or paid are reported in interest income and interest expense, respectively. Securities lent to<br />
counterparties which are not derecognized from the consolidated balance sheet and where the counterparty<br />
has the right by contract or custom to sell or repledge the collateral are disclosed as such on the face of the<br />
consolidated balance sheet.
<strong>Deutsche</strong> <strong>Bank</strong> 02 – Consolidated Financial Statements 178<br />
Financial <strong>Report</strong> 2010 Notes to the Consolidated Financial Statements<br />
01 – Significant Accounting Policies<br />
Offsetting Financial Instruments<br />
Financial assets and liabilities are offset, with the net amount presented in the consolidated balance sheet,<br />
only if the Group holds a currently enforceable legal right to set off the recognized amounts, and there is an<br />
intention to settle on a net basis or to realize an asset and settle the liability simultaneously. In all other situations<br />
they are presented gross. When financial assets and financial liabilities are offset in the consolidated balance<br />
sheet, the associated income and expense items will also be offset in the consolidated statement of income,<br />
unless specifically prohibited by an applicable accounting standard.<br />
Property and Equipment<br />
Property and equipment includes own-use properties, leasehold improvements, furniture and equipment and<br />
software (operating systems only). Own-use properties are carried at cost less accumulated depreciation and<br />
accumulated impairment losses. Depreciation is generally recognized using the straight-line method over the<br />
estimated useful lives of the assets. The range of estimated useful lives is 25 to 50 years for property and 3 to<br />
10 years for furniture and equipment. Leasehold improvements are capitalized and subsequently depreciated<br />
on a straight-line basis over the shorter of the term of the lease and the estimated useful life of the improvement,<br />
which generally ranges from 3 to 10 years. Depreciation of property and equipment is included in general and<br />
administrative expenses. Maintenance and repairs are also charged to general and administrative expenses.<br />
Gains and losses on disposals are included in other income.<br />
Property and equipment are tested for impairment at least annually and an impairment charge is recorded to<br />
the extent the recoverable amount, which is the higher of fair value less costs to sell and value in use, is less<br />
than its carrying amount. Value in use is the present value of the future cash flows expected to be derived from<br />
the asset. After the recognition of impairment of an asset, the depreciation charge is adjusted in future periods<br />
to reflect the asset’s revised carrying amount. If an impairment is later reversed, the depreciation charge is<br />
adjusted prospectively.<br />
Properties leased under a finance lease are capitalized as assets in property and equipment and depreciated<br />
over the terms of the leases.<br />
Investment Property<br />
The Group generally uses the cost model for valuation of investment property, and the carrying value is included<br />
on the consolidated balance sheet in other assets. When the Group issues liabilities that are backed by<br />
investment property, which pay a return linked directly to the fair value of, or returns from, specified investment<br />
property assets, it has elected to apply the fair value model to those specific investment property assets. The<br />
Group engages, as appropriate, external real estate experts to determine the fair value of the investment<br />
property by using recognized valuation techniques. In cases in which prices of recent market transactions of<br />
comparable properties are available, fair value is determined by reference to these transactions.
<strong>Deutsche</strong> <strong>Bank</strong> 02 – Consolidated Financial Statements 179<br />
Financial <strong>Report</strong> 2010 Notes to the Consolidated Financial Statements<br />
01 – Significant Accounting Policies<br />
Goodwill and Other Intangible Assets<br />
Goodwill arises on the acquisition of subsidiaries, associates and jointly controlled entities, and represents the<br />
excess of the aggregate of the cost of an acquisition and any noncontrolling interest in the acquiree over the<br />
fair value of the identifiable net assets acquired at the date of the acquisition. For each business combination<br />
any noncontrolling interest in the acquiree is measured either at fair value or at the noncontrolling interest’s<br />
proportionate share of the acquiree’s identifiable net assets.<br />
For the purpose of calculating goodwill, fair values of acquired assets, liabilities and contingent liabilities are<br />
determined by reference to market values or by discounting expected future cash flows to present value. This<br />
discounting is either performed using market rates or by using risk-free rates and risk-adjusted expected future<br />
cash flows.<br />
Goodwill on the acquisition of subsidiaries is capitalized and reviewed for impairment annually, or more<br />
frequently if there are indications that impairment may have occurred. For the purposes of impairment testing,<br />
goodwill acquired in a business combination is allocated to cash generating units which are the smallest<br />
identifiable groups of assets that generate cash inflows largely independent of the cash inflows from other<br />
assets or groups of assets and that are expected to benefit from the synergies of the combination and<br />
considering the business level at which goodwill is monitored for internal management purposes. In identifying<br />
whether cash inflows from an asset (or a group of assets) are largely independent of the cash inflows from<br />
other assets (or groups of assets) various factors are considered including how management monitors the<br />
entity’s operations or makes decisions about continuing or disposing of the entity’s assets and operations. On<br />
this basis, the Group’s primary cash-generating units are Corporate <strong>Bank</strong>ing & Securities, Global Transaction<br />
<strong>Bank</strong>ing, Asset Management and Private Wealth Management within the Asset and Wealth Management<br />
segment, Private & Business Clients and Corporate Investments.<br />
In addition, for certain nonintegrated investments which are not allocated to the respective segments’ primary<br />
cash-generating units, goodwill is tested individually for impairment on the level of each of these nonintegrated<br />
investments.<br />
Goodwill on the acquisitions of associates and jointly controlled entities is included in the cost of the investments<br />
and the <strong>entire</strong> carrying amount of the equity method investment is reviewed for impairment annually, or more<br />
frequently if there is an indication that impairment may have occurred.<br />
If goodwill has been allocated to a cash-generating unit and an operation within that unit is disposed of, the<br />
attributable goodwill is included in the carrying amount of the operation when determining the gain or loss on<br />
its disposal.<br />
Intangible assets are recognized separately from goodwill when they are separable or arise from contractual or<br />
other legal rights and their fair value can be measured reliably. Intangible assets that have a finite useful life<br />
are stated at cost less any accumulated amortization and accumulated impairment losses. Customer-related<br />
intangible assets that have a finite useful life are amortized over periods of between 1 and 20 years on a<br />
straight-line basis based on their expected useful life. Mortgage servicing rights are carried at cost and amortized<br />
in proportion to, and over the estimated period of, net servicing revenue. The assets are tested for impairment<br />
and their useful lives reaffirmed at least annually.
<strong>Deutsche</strong> <strong>Bank</strong> 02 – Consolidated Financial Statements 180<br />
Financial <strong>Report</strong> 2010 Notes to the Consolidated Financial Statements<br />
01 – Significant Accounting Policies<br />
Certain intangible assets have an indefinite useful life; these are primarily investment management agreements<br />
related to retail mutual funds. These indefinite life intangibles are not amortized but are tested for impairment at<br />
least annually or more frequently if events or changes in circumstances indicate that impairment may have<br />
occurred.<br />
Costs related to software developed or obtained for internal use are capitalized if it is probable that future<br />
economic benefits will flow to the Group, and the cost can be measured reliably. Capitalized costs are amortized<br />
using the straight-line method over the asset’s useful life which is deemed to be either three years, five years<br />
or ten years. Eligible costs include external direct costs for materials and services, as well as payroll and payroll-<br />
related costs for employees directly associated with an internal-use software project. Overhead costs, as well as<br />
costs incurred during the research phase or after software are ready for use, are expensed as incurred.<br />
On acquisition of insurance businesses, the excess of the purchase price over the acquirer’s interest in the net<br />
fair value of the identifiable assets, liabilities and contingent liabilities is accounted for as an intangible asset.<br />
This intangible asset represents the present value of future cash flows over the reported liability at the date of<br />
acquisition. This is known as value of business acquired (“VOBA”).<br />
The VOBA is amortized at a rate determined by considering the profile of the business acquired and the expected<br />
depletion in its value. The VOBA acquired is reviewed regularly for any impairment in value and any reductions<br />
are charged as an expense to the consolidated statement of income.<br />
Financial Guarantees<br />
Financial guarantee contracts are contracts that require the issuer to make specified payments to reimburse<br />
the holder for a loss it incurs because a specified debtor fails to make payments when due in accordance with<br />
the terms of a debt instrument. Such financial guarantees are given to banks, financial institutions and other<br />
parties on behalf of customers to secure loans, overdrafts and other banking facilities.<br />
The Group has chosen to apply the fair value option to certain written financial guarantees that are managed<br />
on a fair value basis. Financial guarantees that the Group has not designated at fair value are recognized<br />
initially in the financial statements at fair value on the date the guarantee is given. Subsequent to initial recognition,<br />
the Group’s liabilities under such guarantees are measured at the higher of the amount initially recognized,<br />
less cumulative amortization, and the best estimate of the expenditure required to settle any financial obligation<br />
as of the balance sheet date. These estimates are determined based on experience with similar transactions<br />
and history of past losses, and management’s determination of the best estimate.
<strong>Deutsche</strong> <strong>Bank</strong> 02 – Consolidated Financial Statements 181<br />
Financial <strong>Report</strong> 2010 Notes to the Consolidated Financial Statements<br />
01 – Significant Accounting Policies<br />
Any increase in the liability relating to guarantees is recorded in the consolidated statement of income in provision<br />
for credit losses.<br />
Leasing Transactions<br />
The Group enters into lease contracts, predominantly for premises, as a lessor and a lessee. The terms and<br />
conditions of these contracts are assessed and the leases are classified as operating leases or finance leases<br />
according to their economic substance at inception of the lease.<br />
Lessor<br />
Assets leased to customers under agreements which transfer substantially all the risks and rewards of ownership,<br />
with or without ultimate legal title, are classified as finance leases. When assets held are subject to a finance<br />
lease, the leased assets are derecognized and a receivable is recognized which is equal to the present value<br />
of the minimum lease payments, discounted at the interest rate implicit in the lease. Initial direct costs incurred<br />
in negotiating and arranging a finance lease are incorporated into the receivable through the discount rate<br />
applied to the lease. Finance lease income is recognized over the lease term based on a pattern reflecting a<br />
constant periodic rate of return on the net investment in the finance lease.<br />
Assets leased to customers under agreements which do not transfer substantially all the risks and rewards of<br />
ownership are classified as operating leases. The leased assets are included within premises and equipment<br />
on the Group’s consolidated balance sheet and depreciation is provided on the depreciable amount of these<br />
assets on a systematic basis over their estimated useful lives. Rental income is recognized on a straight-line<br />
basis over the period of the lease. Initial direct costs incurred in negotiating and arranging an operating lease<br />
are added to the carrying amount of the leased asset and recognized as an expense on a straight-line basis<br />
over the lease term.<br />
Lessee<br />
Assets held under finance leases are initially recognized on the consolidated balance sheet at an amount equal<br />
to the fair value of the leased property or, if lower, the present value of the minimum lease payments. The<br />
corresponding liability to the lessor is included in the consolidated balance sheet as a finance lease obligation.<br />
The discount rate used in calculating the present value of the minimum lease payments is either the interest<br />
rate implicit in the lease, if it is practicable to determine, or the incremental borrowing rate. Contingent rentals<br />
are recognized as expense in the periods in which they are incurred.<br />
Operating lease rentals payable are recognized as an expense on a straight-line basis over the lease term, which<br />
commences when the lessee controls the physical use of the property. Lease incentives are treated as a<br />
reduction of rental expense and are also recognized over the lease term on a straight-line basis. Contingent<br />
rentals arising under operating leases are recognized as an expense in the period in which they are incurred.<br />
Sale-Leaseback Arrangements<br />
If a sale-leaseback transaction results in a finance lease, any excess of sales proceeds over the carrying amount<br />
of the asset is not immediately recognized as income by a seller-lessee but is deferred and amortized over the<br />
lease term.
<strong>Deutsche</strong> <strong>Bank</strong> 02 – Consolidated Financial Statements 182<br />
Financial <strong>Report</strong> 2010 Notes to the Consolidated Financial Statements<br />
01 – Significant Accounting Policies<br />
If a sale-leaseback transaction results in an operating lease, the timing of the profit recognition is a function of<br />
the difference between the sales price and fair value. When it is clear that the sales price is at fair value, the<br />
profit (the difference between the sales price and carrying value) is recognized immediately. If the sales price is<br />
below fair value, any profit or loss is recognized immediately, except that if the loss is compensated for by<br />
future lease payments at below market price, it is deferred and amortized in proportion to the lease payments<br />
over the period the asset is expected to be used. If the sales price is above fair value, the excess over fair<br />
value is deferred and amortized over the period the asset is expected to be used.<br />
Employee Benefits<br />
Pension Benefits<br />
The Group provides a number of pension plans. In addition to defined contribution plans, there are retirement<br />
benefit plans accounted for as defined benefit plans. The assets of all the Group’s defined contribution plans<br />
are held in independently-administered funds. Contributions are generally determined as a percentage of<br />
salary and are expensed based on employee services rendered, generally in the year of contribution.<br />
All retirement benefit plans accounted for as defined benefit plans are valued using the projected unit-credit<br />
method to determine the present value of the defined benefit obligation and the related service costs. Under<br />
this method, the determination is based on actuarial calculations which include assumptions about demographics,<br />
salary increases and interest and inflation rates. Actuarial gains and losses are recognized in shareholders’<br />
equity and presented in the consolidated statement of comprehensive income in the period in which they occur.<br />
The majority of the Group’s benefit plans are funded.<br />
Other Post-Employment Benefits<br />
In addition, the Group maintains unfunded contributory post-employment medical plans for a number of current<br />
and retired employees who are mainly located in the United States. These plans pay stated percentages of<br />
eligible medical and dental expenses of retirees after a stated deductible has been met. The Group funds<br />
these plans on a cash basis as benefits are due. Analogous to retirement benefit plans these plans are valued<br />
using the projected unit-credit method. Actuarial gains and losses are recognized in full in the period in which<br />
they occur in shareholders’ equity and presented in the consolidated statement of comprehensive income.<br />
Refer to Note 33 “Employee Benefits” for further information on the accounting for pension benefits and other<br />
post-employment benefits.<br />
Termination benefits<br />
Termination benefits arise when employment is terminated by the Group before the normal retirement date, or<br />
whenever an employee accepts voluntary redundancy in exchange for these benefits. The Group recognizes<br />
termination benefits as a liability and an expense if the Group is demonstrably committed to a detailed formal<br />
plan without realistic possibility of withdrawal. In the case of an offer made to encourage voluntary redundancy,<br />
termination benefits are measured based on the number of employees expected to accept the offer. Benefits<br />
falling due more than twelve months after the end of the reporting period are discounted to their present value.<br />
The discount rate is determined by reference to market yields on high-quality corporate bonds.
<strong>Deutsche</strong> <strong>Bank</strong> 02 – Consolidated Financial Statements 183<br />
Financial <strong>Report</strong> 2010 Notes to the Consolidated Financial Statements<br />
01 – Significant Accounting Policies<br />
Share-Based Compensation<br />
Compensation expense for awards classified as equity instruments is measured at the grant date based on the<br />
fair value of the share-based award. For share awards, the fair value is the quoted market price of the share<br />
reduced by the present value of the expected dividends that will not be received by the employee and adjusted<br />
for the effect, if any, of restrictions beyond the vesting date. In case an award is modified such that its fair value<br />
immediately after modification exceeds its fair value immediately prior to modification, a remeasurement takes<br />
place and the resulting increase in fair value is recognized as additional compensation expense.<br />
The Group records the offsetting amount to the recognized compensation expense in additional paid-in capital<br />
(APIC). Compensation expense is recorded on a straight-line basis over the period in which employees<br />
perform services to which the awards relate or over the period of the tranches for those awards delivered in<br />
tranches. Estimates of expected forfeitures are periodically adjusted in the event of actual forfeitures or for<br />
changes in expectations. The timing of expense recognition relating to grants which, due to early retirement<br />
provisions, include a nominal but nonsubstantive service period are accelerated by shortening the amortization<br />
period of the expense from the grant date to the date when the employee meets the eligibility criteria for the<br />
award, and not the vesting date. For awards that are delivered in tranches, each tranche is considered a separate<br />
award and amortized separately.<br />
Compensation expense for share-based awards payable in cash is remeasured to fair value at each balance<br />
sheet date, and recognized over the vesting period in which the related employee services are rendered. The<br />
related obligations are included in other liabilities until paid.<br />
Obligations to Purchase Common Shares<br />
Forward purchases of <strong>Deutsche</strong> <strong>Bank</strong> shares, and written put options where <strong>Deutsche</strong> <strong>Bank</strong> shares are the<br />
underlying, are reported as obligations to purchase common shares if the number of shares is fixed and physical<br />
settlement for a fixed amount of cash is required. At inception the obligation is recorded at the present value of<br />
the settlement amount of the forward or option. For forward purchases and written put options of <strong>Deutsche</strong> <strong>Bank</strong><br />
shares, a corresponding charge is made to shareholders’ equity and reported as equity classified as an obligation<br />
to purchase common shares.<br />
The liabilities are accounted for on an accrual basis, and interest costs, which consist of time value of money<br />
and dividends, on the liability are reported as interest expense. Upon settlement of such forward purchases and<br />
written put options, the liability is extinguished and the charge to equity is reclassified to common shares in<br />
treasury.<br />
<strong>Deutsche</strong> <strong>Bank</strong> common shares subject to such forward contracts are not considered to be outstanding for<br />
purposes of basic earnings per share calculations, but are for dilutive earnings per share calculations to the<br />
extent that they are, in fact, dilutive.
<strong>Deutsche</strong> <strong>Bank</strong> 02 – Consolidated Financial Statements 184<br />
Financial <strong>Report</strong> 2010 Notes to the Consolidated Financial Statements<br />
01 – Significant Accounting Policies<br />
Put and call option contracts with <strong>Deutsche</strong> <strong>Bank</strong> shares as the underlying where the number of shares is fixed<br />
and physical settlement is required are not classified as derivatives. They are transactions in the Group’s equity.<br />
All other derivative contracts in which <strong>Deutsche</strong> <strong>Bank</strong> shares are the underlying are recorded as financial assets/<br />
liabilities at fair value through profit or loss.<br />
Income Taxes<br />
The Group recognizes the current and deferred tax consequences of transactions that have been included in<br />
the consolidated financial statements using the provisions of the respective jurisdictions’ tax laws. Current and<br />
deferred taxes are charged or credited to other comprehensive income if the tax relates to items that are charged<br />
or credited directly to other comprehensive income.<br />
Deferred tax assets and liabilities are recognized for future tax consequences attributable to temporary differences<br />
between the financial statement carrying amounts of existing assets and liabilities and their respective tax bases,<br />
unused tax losses and unused tax credits. Deferred tax assets are recognized only to the extent that it is probable<br />
that sufficient taxable profit will be available against which those unused tax losses, unused tax credits and<br />
deductible temporary differences can be utilized.<br />
Deferred tax assets and liabilities are measured based on the tax rates that are expected to apply in the period<br />
that the asset is realized or the liability is settled, based on tax rates and tax laws that have been enacted or<br />
substantively enacted at the balance sheet date.<br />
Current tax assets and liabilities are offset when (1) they arise from the same tax reporting entity or tax group<br />
of reporting entities, (2) the legally enforceable right to offset exists and (3) they are intended to be settled net<br />
or realized simultaneously.<br />
Deferred tax assets and liabilities are offset when the legally enforceable right to offset current tax assets and<br />
liabilities exists and the deferred tax assets and liabilities relate to income taxes levied by the same taxing<br />
authority on either the same tax reporting entity or tax group of reporting entities.<br />
Deferred tax liabilities are provided on taxable temporary differences arising from investments in subsidiaries,<br />
branches and associates and interests in joint ventures except when the timing of the reversal of the temporary<br />
difference is controlled by the Group and it is probable that the difference will not reverse in the foreseeable<br />
future. Deferred income tax assets are provided on deductible temporary differences arising from such investments<br />
only to the extent that it is probable that the differences will reverse in the foreseeable future and sufficient<br />
taxable income will be available against which those temporary differences can be utilized.<br />
Deferred tax related to fair value remeasurement of AFS investments, cash flow hedges and other items, which<br />
are charged or credited directly to other comprehensive income, is also credited or charged directly to other<br />
comprehensive income and subsequently recognized in the consolidated statement of income once the underlying<br />
gain or loss to which the deferred tax relates is realized.
<strong>Deutsche</strong> <strong>Bank</strong> 02 – Consolidated Financial Statements 185<br />
Financial <strong>Report</strong> 2010 Notes to the Consolidated Financial Statements<br />
01 – Significant Accounting Policies<br />
For share-based payment transactions, the Group may receive a tax deduction related to the compensation<br />
paid in shares. The amount deductible for tax purposes may differ from the cumulative compensation expense<br />
recorded. At any reporting date, the Group must estimate the expected future tax deduction based on the<br />
current share price. If the amount deductible, or expected to be deductible, for tax purposes exceeds the<br />
cumulative compensation expense, the excess tax benefit is recognized in other comprehensive income. If the<br />
amount deductible, or expected to be deductible, for tax purposes is less than the cumulative compensation<br />
expense, the shortfall is recognized in the Group’s consolidated statement of income for the period.<br />
The Group’s insurance business in the United Kingdom (Abbey Life Assurance Company Limited) is subject to<br />
income tax on the policyholder’s investment returns (policyholder tax). This tax is included in the Group’s income<br />
tax expense/benefit even though it is economically the income tax expense/benefit of the policyholder, which<br />
reduces/increases the Group’s liability to the policyholder.<br />
Provisions<br />
Provisions are recognized if the Group has a present legal or constructive obligation as a result of past events,<br />
if it is probable that an outflow of resources will be required to settle the obligation, and a reliable estimate can<br />
be made of the amount of the obligation.<br />
The amount recognized as a provision is the best estimate of the consideration required to settle the present<br />
obligation as of the balance sheet date, taking into account the risks and uncertainties surrounding the obligation.<br />
If the effect of the time value of money is material, provisions are discounted and measured at the present value<br />
of the expenditure expected to be required to settle the obligation, using a pre-tax rate that reflects the current<br />
market assessments of the time value of money and the risks specific to the obligation. The increase in the<br />
provision due to the passage of time is recognized as interest expense.<br />
When some or all of the economic benefits required to settle a provision are expected to be recovered from a<br />
third party (for example, because the obligation is covered by an insurance policy), an asset is recognized if it<br />
is virtually certain that reimbursement will be received.<br />
Consolidated Statement of Cash Flows<br />
For purposes of the consolidated statement of cash flows, the Group’s cash and cash equivalents include highly<br />
liquid investments that are readily convertible into cash and which are subject to an insignificant risk of change in<br />
value. Such investments include cash and balances at central banks and demand deposits with banks.<br />
The Group’s assignment of cash flows to the operating, investing or financing category depends on the business<br />
model (“management approach”). For the Group the primary operating activity is to manage financial assets<br />
and financial liabilities. Therefore, the issuance and management of long-term borrowings is a core operating<br />
activity which is different than for a non-financial company, where borrowing is not a principal revenue producing<br />
activity and thus is part of the financing category.
<strong>Deutsche</strong> <strong>Bank</strong> 02 – Consolidated Financial Statements 186<br />
Financial <strong>Report</strong> 2010 Notes to the Consolidated Financial Statements<br />
01 – Significant Accounting Policies<br />
The Group views the issuance of senior long-term debt as an operating activity. Senior long-term debt comprises<br />
structured notes and asset backed securities, which are designed and executed by CIB business lines and which<br />
are revenue generating activities. The other component is debt issued by Treasury, which is considered<br />
interchangeable with other funding sources; all of the funding costs are allocated to business activities to<br />
establish their profitability.<br />
Cash flows related to subordinated long-term debt and trust preferred securities are viewed differently than<br />
those related to senior-long term debt because they are managed as an integral part of the Group’s capital,<br />
primarily to meet regulatory capital requirements. As a result they are not interchangeable with other operating<br />
liabilities, but can only be interchanged with equity and thus are considered part of the financing category.<br />
The amounts shown in the consolidated statement of cash flows do not precisely match the movements in the<br />
consolidated balance sheet from one period to the next as they exclude non-cash items such as movements<br />
due to foreign exchange translation and movements due to changes in the group of consolidated companies.<br />
Movements in balances carried at fair value through profit or loss represent all changes affecting the carrying<br />
value. This includes the effects of market movements and cash inflows and outflows. The movements in balances<br />
carried at fair value are usually presented in operating cash flows.<br />
Insurance<br />
The Group’s insurance business issues two types of contracts:<br />
Insurance Contracts. These are annuity and universal life contracts under which the Group accepts significant<br />
insurance risk from another party (the policyholder) by agreeing to compensate the policyholder if a specific<br />
uncertain future event adversely affects the policyholder. Such contracts remain insurance contracts until all<br />
rights and obligations are extinguished or expire. As allowed by IFRS, the Group retained the accounting<br />
policies for insurance contracts which it applied prior to the adoption of IFRS. These accounting policies are<br />
described further below.<br />
Non-Participating Investment Contracts (“Investment Contracts”). These contracts do not contain significant<br />
insurance risk or discretionary participation features. These are measured and reported consistently with other<br />
financial liabilities, which are classified as financial liabilities at fair value through profit or loss.<br />
Financial assets held to back annuity contracts have been classified as financial instruments AFS. Financial<br />
assets held for other insurance and investment contracts have been designated as fair value through profit or<br />
loss under the fair value option.
<strong>Deutsche</strong> <strong>Bank</strong> 02 – Consolidated Financial Statements 187<br />
Financial <strong>Report</strong> 2010 Notes to the Consolidated Financial Statements<br />
01 – Significant Accounting Policies<br />
Insurance Contracts<br />
Premiums for single premium business are recognized as income when received. This is the date from which<br />
the policy is effective. For regular premium contracts, receivables are recognized at the date when payments<br />
are due. Premiums are shown before deduction of commissions. When policies lapse due to non-receipt of<br />
premiums, all related premium income accrued but not received from the date they are deemed to have lapsed,<br />
net of related expense, is offset against premiums.<br />
Claims are recorded as an expense when they are incurred, and reflect the cost of all claims arising during the<br />
year, including policyholder profit participations allocated in anticipation of a participation declaration.<br />
The aggregate policy reserves for universal life insurance contracts are equal to the account balance, which<br />
represents premiums received and investment returns credited to the policy, less deductions for mortality costs<br />
and expense charges. For other unit-linked insurance contracts the policy reserve represents the fair value of<br />
the underlying assets.<br />
For annuity contracts, the liability is calculated by estimating the future cash flows over the duration of the in<br />
force contracts and discounting them back to the valuation date allowing for the probability of occurrence. The<br />
assumptions are fixed at the date of acquisition with suitable provisions for adverse deviations (PADs). This<br />
calculated liability value is tested against a value calculated using best estimate assumptions and interest rates<br />
based on the yield on the amortized cost of the underlying assets. Should this test produce a higher value, the<br />
liability amount would be reset.<br />
Aggregate policy reserves include liabilities for certain options attached to the Group’s unit-linked pension<br />
products. These liabilities are calculated based on contractual obligations using actuarial assumptions.<br />
Liability adequacy tests are performed for the insurance portfolios on the basis of estimated future claims, costs,<br />
premiums earned and proportionate investment income. For long duration contracts, if actual experience<br />
regarding investment yields, mortality, morbidity, terminations or expense indicate that existing contract liabilities,<br />
along with the present value of future gross premiums, will not be sufficient to cover the present value of future<br />
benefits and to recover deferred policy acquisition costs, then a premium deficiency is recognized.<br />
The costs directly attributable to the acquisition of incremental insurance and investment business are deferred<br />
to the extent that they are expected to be recoverable out of future margins in revenues on these contracts.<br />
These costs will be amortized systematically over a period no longer than that in which they are expected to be<br />
recovered out of these future margins.<br />
Investment Contracts<br />
All of the Group’s investment contracts are unit-linked. These contract liabilities are determined using current<br />
unit prices multiplied by the number of units attributed to the contract holders as of the balance sheet date.
<strong>Deutsche</strong> <strong>Bank</strong> 02 – Consolidated Financial Statements 188<br />
Financial <strong>Report</strong> 2010 Notes to the Consolidated Financial Statements<br />
02 – Critical Accounting Estimates<br />
As this amount represents fair value, the liabilities have been classified as financial liabilities at fair value<br />
through profit or loss. Deposits collected under investment contracts are accounted for as an adjustment to the<br />
investment contract liabilities. Investment income attributable to investment contracts is included in the<br />
consolidated statement of income. Investment contract claims reflect the excess of amounts paid over the<br />
account balance released. Investment contract policyholders are charged fees for policy administration,<br />
investment management, surrenders or other contract services.<br />
The financial assets for investment contracts are recorded at fair value with changes in fair value, and offsetting<br />
changes in the fair value of the corresponding financial liabilities, recorded in profit or loss.<br />
Reinsurance<br />
Premiums ceded for reinsurance and reinsurance recoveries on policyholder benefits and claims incurred are<br />
reported in income and expense as appropriate. Assets and liabilities related to reinsurance are reported on a<br />
gross basis when material. Amounts ceded to reinsurers from reserves for insurance contracts are estimated in<br />
a manner consistent with the reinsured risk. Accordingly, revenues and expenses related to reinsurance<br />
agreements are recognized in a manner consistent with the underlying risk of the business reinsured.<br />
02 –<br />
Critical Accounting Estimates<br />
Certain of the accounting policies described in Note 01 “Significant Accounting Policies” require critical<br />
accounting estimates that involve complex and subjective judgments and the use of assumptions, some of<br />
which may be for matters that are inherently uncertain and susceptible to change. Such critical accounting<br />
estimates could change from period to period and have a material impact on the Group’s financial condition,<br />
changes in financial condition or results of operations. Critical accounting estimates could also involve<br />
estimates where management could have reasonably used another estimate in the current accounting period.<br />
The Group has identified the following significant accounting policies that involve critical accounting estimates.<br />
Fair Value Estimates<br />
Certain of the Group’s financial instruments are carried at fair value with changes in fair value recognized in the<br />
consolidated statement of income. This includes trading assets and liabilities and financial assets and liabilities<br />
designated at fair value through profit or loss. In addition, financial assets that are classified as AFS are carried<br />
at fair value with the changes in fair value reported in other comprehensive income. Derivatives held for nontrading<br />
purposes are carried at fair value with changes in value recognized through the consolidated statement<br />
of income, except where they are designated in cash flow or net investment hedge accounting relationships<br />
when changes in fair value of the effective portion of the hedge are reflected directly in other comprehensive<br />
income.
<strong>Deutsche</strong> <strong>Bank</strong> 02 – Consolidated Financial Statements 189<br />
Financial <strong>Report</strong> 2010 Notes to the Consolidated Financial Statements<br />
02 – Critical Accounting Estimates<br />
Trading assets include debt and equity securities, derivatives held for trading purposes, commodities and trading<br />
loans. Trading liabilities consist primarily of derivative liabilities and short positions. Financial assets and liabilities<br />
which are designated at fair value through profit or loss, under the fair value option, include repurchase and<br />
reverse repurchase agreements, certain loans and loan commitments, debt and equity securities and structured<br />
note liabilities. Private equity investments in which the Group does not have a controlling financial interest or<br />
significant influence, are also carried at fair value either as trading instruments, designated as at fair value through<br />
profit or loss or as AFS instruments.<br />
Fair value is defined as the price at which an asset or liability could be exchanged in a current transaction<br />
between knowledgeable, willing parties, other than in a forced or liquidation sale.<br />
In reaching estimates of fair value management judgment needs to be exercised. The areas requiring significant<br />
management judgment are identified, documented and reported to senior management as part of the valuation<br />
control framework and the standard monthly reporting cycle. The Group’s specialist model validation and valuation<br />
groups focus attention on the areas of subjectivity and judgment.<br />
The level of management judgment required in establishing fair value of financial instruments for which there is<br />
a quoted price in an active market is minimal. Similarly there is little subjectivity or judgment required for<br />
instruments valued using valuation models that are standard across the industry and where all parameter<br />
inputs are quoted in active markets.<br />
The level of subjectivity and degree of management judgment required is more significant for those instruments<br />
valued using specialized and sophisticated models and those where some or all of the parameter inputs are<br />
not observable. Management judgment is required in the selection and application of appropriate parameters,<br />
assumptions and modeling techniques. In particular, where data are obtained from infrequent market transactions<br />
extrapolation and interpolation techniques must be applied. In addition, where no market data are available<br />
parameter inputs are determined by assessing other relevant sources of information such as historical data,<br />
fundamental analysis of the economics of the transaction and proxy information from similar transactions with<br />
appropriate adjustments to reflect the terms of the actual instrument being valued and current market conditions.<br />
Where different valuation techniques indicate a range of possible fair values for an instrument, management<br />
has to establish what point within the range of estimates best represents fair value. Further, some valuation<br />
adjustments may require the exercise of management judgment to achieve fair value.<br />
Methods of Determining Fair Value<br />
A substantial percentage of the Group’s financial assets and liabilities carried at fair value are based on, or<br />
derived from, observable prices or inputs. The availability of observable prices or inputs varies by product and<br />
market, and may change over time. For example, observable prices or inputs are usually available for: liquid<br />
securities; exchange traded derivatives; over the counter (OTC) derivatives transacted in liquid trading markets<br />
such as interest rate swaps, foreign exchange forward and option contracts in G7 currencies; and equity swap<br />
and option contracts on listed securities or indices. If observable prices or inputs are available, they are utilized<br />
in the determination of fair value and, as such, fair value can be determined without significant judgment. This<br />
includes instruments for which the fair value is derived from a valuation model that is standard across the industry<br />
and the inputs are directly observable. This is the case for many generic swap and option contracts.
<strong>Deutsche</strong> <strong>Bank</strong> 02 – Consolidated Financial Statements 190<br />
Financial <strong>Report</strong> 2010 Notes to the Consolidated Financial Statements<br />
02 – Critical Accounting Estimates<br />
In other markets or for certain instruments, observable prices or inputs are not available, and fair value is<br />
determined using valuation techniques appropriate for the particular instrument. For example, instruments<br />
subject to valuation techniques include: trading loans and other loans or loan commitments designated at fair<br />
value through profit or loss, under the fair value option; new, complex and long-dated OTC derivatives;<br />
transactions in immature or limited markets; distressed debt securities and loans; private equity securities and<br />
retained interests in securitizations of financial assets. The application of valuation techniques to determine fair<br />
value involves estimation and management judgment, the extent of which will vary with the degree of complexity<br />
and liquidity in the market. Valuation techniques include industry standard models based on discounted cash<br />
flow analysis, which are dependent upon estimated future cash flows and the discount rate used. For more<br />
complex products, the valuation models include more complex modeling techniques, parameters and<br />
assumptions, such as volatility, correlation, prepayment speeds, default rates and loss severity. Management<br />
judgment is required in the selection and application of the appropriate parameters, assumptions and modeling<br />
techniques. Because the objective of using a valuation technique is to establish the price at which market<br />
participants would currently transact, the valuation techniques incorporate all factors that the Group believes<br />
market participants would consider in setting a transaction price.<br />
Valuation adjustments are an integral part of the fair value process that requires the exercise of judgment. In<br />
making appropriate valuation adjustments, the Group follows methodologies that consider factors such as bidoffer<br />
spread valuation adjustments, liquidity, and credit risk (both counterparty credit risk in relation to financial<br />
assets and the Group’s own credit risk in relation to financial liabilities which are at fair value through profit or loss).<br />
The fair value of the Group’s financial liabilities which are at fair value through profit or loss (e.g., OTC derivative<br />
liabilities and structured note liabilities designated at fair value through profit or loss) incorporates the change in<br />
the Group’s own credit risk of the financial liability. For derivative liabilities the Group considers its own<br />
creditworthiness by assessing all counterparties’ potential future exposure to us, taking into account any collateral<br />
provided, the effect of any master netting agreements, expected loss given default and the Group’s own credit<br />
risk based on historic default levels. The change in the Group’s own credit risk for structured note liabilities is<br />
calculated by discounting the contractual cash flows of the instrument using the rate at which similar instruments<br />
would be issued at the measurement date. The resulting fair value is an estimate of the price at which the specific<br />
liability would be exchanged at the measurement date with another market participant.<br />
Under IFRS, if there are significant unobservable inputs used in the valuation technique as of the trade date the<br />
financial instrument is recognized at the transaction price and any trade date profit is deferred. Management<br />
judgment is required in determining whether there exist significant unobservable inputs in the valuation technique.<br />
Once deferred the decision to subsequently recognize the trade date profit requires a careful assessment of the<br />
then current facts and circumstances supporting observability of parameters and/or risk mitigation.
<strong>Deutsche</strong> <strong>Bank</strong> 02 – Consolidated Financial Statements 191<br />
Financial <strong>Report</strong> 2010 Notes to the Consolidated Financial Statements<br />
02 – Critical Accounting Estimates<br />
The Group has established internal control procedures over the valuation process to provide assurance over<br />
the appropriateness of the fair values applied. If fair value is determined by valuation models, the assumptions<br />
and techniques within the models are independently validated by a specialist group. Price and parameter inputs,<br />
assumptions and valuation adjustments are subject to verification and review processes. If the price and<br />
parameter inputs are observable, they are verified against independent sources.<br />
If prices and parameter inputs or assumptions are not observable, the appropriateness of fair value is subject<br />
to additional procedures to assess its reasonableness. Such procedures include performing revaluations using<br />
independently generated models, assessing the valuations against appropriate proxy instruments, performing<br />
sensitivity analysis and extrapolation techniques, and considering other benchmarks. Assessment is made as<br />
to whether the valuation techniques yield fair value estimates that are reflective of the way the market operates<br />
by calibrating the results of the valuation models against market transactions. These procedures require the<br />
application of management judgment.<br />
Other valuation controls include review and analysis of daily profit and loss, validation of valuation through close<br />
out profit and loss and Value-at-Risk back-testing.<br />
Fair Value Estimates Used in Disclosures<br />
Under IFRS, the financial assets and liabilities carried at fair value are required to be disclosed according to the<br />
valuation method used to determine their fair value. Specifically, segmentation is required between those valued<br />
using quoted market prices in an active market (level 1), valuation techniques based on observable parameters<br />
(level 2) and valuation techniques using significant unobservable parameters (level 3). This disclosure is provided<br />
in Note 14 “Financial Instruments carried at Fair Value”. The financial assets held at fair value categorized in<br />
level 3 were € 47.3 billion at December 31, 2010, compared to € 58.2 billion at December 31, 2009. The financial<br />
liabilities held at fair value categorized in level 3 were € 13.0 billion at December 31, 2010 and € 18.2 billion at<br />
December 31, 2009. Management judgment is required in determining the category to which certain instruments<br />
should be allocated. This specifically arises when the valuation is determined by a number of parameters, some<br />
of which are observable and others are not. Further, the classification of an instrument can change over time to<br />
reflect changes in market liquidity and therefore price transparency.<br />
In addition to the fair value hierarchy disclosure in Note 14 “Financial Instruments carried at Fair Value” the<br />
Group provides a sensitivity analysis of the impact upon the level 3 financial instruments of using a reasonably<br />
possible alternative for the unobservable parameter. The determination of reasonably possible alternatives<br />
requires significant management judgment.<br />
For financial instruments measured at amortized cost (which includes loans, deposits and short and long term<br />
debt issued) the Group discloses the fair value. This disclosure is provided in Note 15 “Fair Value of Financial<br />
Instruments not carried at Fair Value”. Generally there is limited or no trading activity in these instruments and<br />
therefore the fair value determination requires significant management judgment.
<strong>Deutsche</strong> <strong>Bank</strong> 02 – Consolidated Financial Statements 192<br />
Financial <strong>Report</strong> 2010 Notes to the Consolidated Financial Statements<br />
02 – Critical Accounting Estimates<br />
Reclassification of Financial Assets<br />
The Group classifies financial assets into the following categories: financial assets at fair value through profit or<br />
loss, financial assets AFS or loans. The appropriate classification of financial assets is determined at the time<br />
of initial recognition. In addition, under the amendments to IAS 39 and IFRS 7, “Reclassification of Financial<br />
Assets” which were approved by the IASB and endorsed by the EU in October 2008, it is permissible to reclassify<br />
certain financial assets out of financial assets at fair value through profit or loss (trading assets) and the AFS<br />
classifications into the loans classification. For assets to be reclassified there must be a clear change in<br />
management intent with respect to the assets since initial recognition and the financial asset must meet the<br />
definition of a loan at the reclassification date. Additionally, there must be an intent and ability to hold the asset<br />
for the foreseeable future at the reclassification date. There is no ability for subsequent reclassification back to<br />
the trading or AFS classifications. Refer to Note 13 “Amendments to IAS 39 and IFRS 7, ‘Reclassification of<br />
Financial Assets’” for further information on the assets reclassified by the Group.<br />
Significant management judgment and assumptions are required to identify assets eligible under the amendments<br />
for which expected repayment exceeds estimated fair value. Significant management judgment and assumptions<br />
are also required to estimate the fair value of the assets identified (as described in “Fair Value Estimates”) at<br />
the date of reclassification, which becomes the amortized cost base under the loan classification. The task<br />
facing management in both these matters can be particularly challenging in the highly volatile and uncertain<br />
economic and financial market conditions such as those which existed in the third and fourth quarters of 2008.<br />
The change of intent to hold for the foreseeable future is another matter requiring significant management<br />
judgment. The change in intent is not simply determined because of an absence of attractive prices nor is<br />
foreseeable future defined as the period until the return of attractive prices. Refer to Note 01 “Significant<br />
Accounting Policies – Reclassification of Financial Assets” for the Group’s minimum requirements for what<br />
constitutes foreseeable future.<br />
Impairment of Loans and Provision for Off-Balance Sheet Positions<br />
The accounting estimates and judgments related to the impairment of loans and provision for off-balance sheet<br />
positions is a critical accounting estimate for the Corporate <strong>Bank</strong>ing & Securities and Private & Business Clients<br />
corporate divisions because the underlying assumptions used for both the individually and collectively assessed<br />
impairment can change from period to period and may significantly affect the Group’s results of operations.<br />
In assessing assets for impairment, management judgment is required, particularly in circumstances of economic<br />
and financial uncertainty, such as those of the recent financial crisis, when developments and changes to expected<br />
cash flows can occur both with greater rapidity and less predictability.
<strong>Deutsche</strong> <strong>Bank</strong> 02 – Consolidated Financial Statements 193<br />
Financial <strong>Report</strong> 2010 Notes to the Consolidated Financial Statements<br />
02 – Critical Accounting Estimates<br />
The provision for credit losses totaled € 1,273 million, € 2,630 million and € 1,075 million for the years ended<br />
December 31, 2010, 2009 and 2008.<br />
The determination of the impairment allowance required for loans which are deemed to be individually significant<br />
often requires the use of considerable management judgment concerning such matters as local economic<br />
conditions, the financial performance of the counterparty and the value of any collateral held, for which there<br />
may not be a readily accessible market. In certain situations, such as for certain leveraged loans, the Group<br />
may assess the enterprise value of the borrower to assess impairment. This requires use of considerable<br />
management judgment regarding timing of exit and the market value of the borrowing entity. The actual amount<br />
of the future cash flows and their timing may differ from the estimates used by management and consequently<br />
may cause actual losses to differ from the reported allowances.<br />
The impairment allowance for portfolios of smaller-balance homogenous loans, such as those to individuals<br />
and small business customers of the private and retail business, and for those loans which are individually<br />
significant but for which no objective evidence of impairment exists, is determined on a collective basis. The<br />
collective impairment allowance is calculated on a portfolio basis using statistical models which incorporate<br />
numerous estimates and judgments. The Group performs a regular review of the models and underlying data<br />
and assumptions. The probability of defaults, loss recovery rates, and judgments concerning the ability of<br />
borrowers in foreign countries to transfer the foreign currency necessary to comply with debt repayments,<br />
among other things, are all taken into account during this review. For further discussion of the methodologies<br />
used to determine the Group’s allowance for credit losses, see Note 01 “Significant Accounting Policies”.<br />
Impairment of Other Financial Assets<br />
Equity method investments, and financial assets classified as AFS are evaluated for impairment on a quarterly<br />
basis, or more frequently if events or changes in circumstances indicate that these assets are impaired. If there<br />
is objective evidence of an impairment of an associate or jointly-controlled entity, an impairment test is performed<br />
by comparing the investments’ recoverable amount, which is the higher of its value in use and fair value less<br />
costs to sell, with its carrying amount. In the case of equity investments classified as AFS, objective evidence<br />
of impairment would include a significant or prolonged decline in fair value of the investment below cost. It could<br />
also include specific conditions in an industry or geographical area or specific information regarding the financial<br />
condition of the company, such as a downgrade in credit rating. In the case of debt securities classified as AFS,<br />
impairment is assessed based on the same criteria as for loans. If information becomes available after the Group<br />
makes its evaluation, the Group may be required to recognize impairment in the future. Because the estimate<br />
for impairment could change from period to period based upon future events that may or may not occur, the<br />
Group considers this to be a critical accounting estimate. The impairment reviews for equity method investments<br />
and financial assets AFS resulted in net impairment charges of € 2,588 million in 2010, € 1,125 million in 2009<br />
and € 970 million in 2008. For additional information see Note 08 “Net Gains (Losses) on Financial Assets<br />
Available for Sale” and Note 17 “Equity Method Investments”.
<strong>Deutsche</strong> <strong>Bank</strong> 02 – Consolidated Financial Statements 194<br />
Financial <strong>Report</strong> 2010 Notes to the Consolidated Financial Statements<br />
02 – Critical Accounting Estimates<br />
Impairment of Non-financial Assets<br />
Certain non-financial assets, including goodwill and other intangible assets, are subject to impairment review.<br />
The Group records impairment losses on assets in this category when the Group believes that their carrying<br />
value may not be recoverable. A reversal of an impairment loss (excluding goodwill) is recognized immediately.<br />
Goodwill and other intangible assets are tested for impairment on an annual basis, or more frequently if events<br />
or changes in circumstances, such as an adverse change in business climate, indicate that these assets may<br />
be impaired. The determination of the recoverable amount in the impairment assessment requires estimates<br />
based on quoted market prices, prices of comparable businesses, present value or other valuation techniques,<br />
or a combination thereof, necessitating management to make subjective judgments and assumptions. Because<br />
these estimates and assumptions could result in significant differences to the amounts reported if underlying<br />
circumstances were to change, the Group considers this estimate to be critical. As of December 31, 2010 and<br />
2009, goodwill had carrying amounts of € 10.8 billion and € 7.4 billion, respectively, and other intangible assets<br />
had carrying amounts of € 4.8 billion and € 2.7 billion, respectively. Evaluation of impairment of these assets is<br />
a significant estimate for multiple businesses.<br />
In 2010, other intangible assets impairment losses of € 41 million were recorded, of which € 29 million related<br />
to customer-related intangible assets recorded in GTB and a loss of € 12 million recorded on the write-down of<br />
purchased software included in AWM. In 2009, goodwill and other intangible assets impairment losses of<br />
€ 157 million were recorded, of which € 151 million related to investments in Corporate Investments. In addition,<br />
€ 291 million were recorded as reversals of impairment losses of other intangible assets in Asset and Wealth<br />
Management, which had been taken in the fourth quarter of 2008. In 2008, goodwill and other intangible assets<br />
impairment losses of € 586 million were recorded, of which € 580 million related to investments in Asset and<br />
Wealth Management. For further discussion on goodwill and other intangible assets, see Note 24 “Goodwill<br />
and Other Intangible Assets”.<br />
Deferred Tax Assets<br />
The Group recognizes deferred tax assets and liabilities for the future tax consequences attributable to temporary<br />
differences between the financial statement carrying amounts of existing assets and liabilities and their respective<br />
tax bases, unused tax losses and unused tax credits. Deferred tax assets are recognized only to the extent<br />
that it is probable that sufficient taxable profit will be available against which those unused tax losses, unused<br />
tax credits or deductible temporary differences can be utilized. This assessment requires significant management<br />
judgments and assumptions. In determining the amount of deferred tax assets, the Group uses historical tax<br />
capacity and profitability information and, if relevant, forecasted operating results, based upon approved<br />
business plans, including a review of the eligible carry-forward periods, available tax planning opportunities<br />
and other relevant considerations. Each quarter, the Group re-evaluates its estimate related to deferred tax<br />
assets, including its assumptions about future profitability. As of December 31, 2010 and December 31, 2009<br />
the amount of unrecognized deferred tax assets was € 2.6 billion and € 1.3 billion, respectively and the amount<br />
of recognized deferred tax assets was € 8.3 billion and € 7.2 billion, respectively.
<strong>Deutsche</strong> <strong>Bank</strong> 02 – Consolidated Financial Statements 195<br />
Financial <strong>Report</strong> 2010 Notes to the Consolidated Financial Statements<br />
02 – Critical Accounting Estimates<br />
The Group believes that the accounting estimate related to the deferred tax assets is a critical accounting<br />
estimate because the underlying assumptions can change from period to period. For example, tax law changes<br />
or variances in future projected operating performance could result in a change of the deferred tax asset. If the<br />
Group was not able to realize all or part of its net deferred tax assets in the future, an adjustment to its deferred<br />
tax assets would be charged to income tax expense or directly to equity in the period such determination was<br />
made. If the Group was to recognize previously unrecognized deferred tax assets in the future, an adjustment<br />
to its deferred tax asset would be credited to income tax expense or directly to equity in the period such<br />
determination was made.<br />
For further information on the Group’s deferred taxes see Note 34 “Income Taxes”.<br />
Legal and Regulatory Contingencies and Uncertain Tax Positions<br />
The Group conducts its business in many different legal, regulatory and tax environments, and, accordingly,<br />
legal claims, regulatory proceedings or uncertain income tax positions may arise.<br />
The use of estimates is important in determining provisions for potential losses that may arise from litigation,<br />
regulatory proceedings and uncertain income tax positions. The Group estimates and provides for potential<br />
losses that may arise out of litigation, regulatory proceedings and uncertain income tax positions to the extent<br />
that such losses are probable and can be estimated, in accordance with IAS 37, “Provisions, Contingent<br />
Liabilities and Contingent Assets” or IAS 12, “Income Taxes”, respectively. Significant judgment is required in<br />
making these estimates and the Group’s final liabilities may ultimately be materially different.<br />
Contingencies in respect of legal matters are subject to many uncertainties and the outcome of individual matters<br />
is not predictable with assurance. Significant judgment is required in assessing probability and making estimates<br />
in respect of contingencies, and the Group’s final liability may ultimately be materially different. The Group’s<br />
total liability in respect of litigation, arbitration and regulatory proceedings is determined on a case-by-case<br />
basis and represents an estimate of probable losses after considering, among other factors, the progress of<br />
each case, the Group’s experience and the experience of others in similar cases, and the opinions and views<br />
of legal counsel. Predicting the outcome of the Group’s litigation matters is inherently difficult, particularly in<br />
cases in which claimants seek substantial or indeterminate damages. See Note 28 “Provisions” for information<br />
on the Group’s judicial, regulatory and arbitration proceedings.
<strong>Deutsche</strong> <strong>Bank</strong> 02 – Consolidated Financial Statements 196<br />
Financial <strong>Report</strong> 2010 Notes to the Consolidated Financial Statements<br />
03 – Recently Adopted and New Accounting Pronouncements<br />
03 –<br />
Recently Adopted and New Accounting Pronouncements<br />
Recently Adopted Accounting Pronouncements<br />
The following are those accounting pronouncements which are relevant to the Group and which have been<br />
adopted during 2010 in the preparation of these consolidated financial statements.<br />
IFRS 3 and IAS 27<br />
In January 2008, the IASB issued a revised version of IFRS 3, “Business Combinations” (“IFRS 3 R”), and an<br />
amended version of IAS 27, “Consolidated and Separate Financial Statements” (“IAS 27 R”).The main changes<br />
under these standards are that a) acquisition costs are recognized as an expense in the period in which they<br />
are incurred, b) contingent consideration is recognized and measured at fair value at the date the Group obtains<br />
control and subsequent changes in fair value are recorded through the consolidated statement of income,<br />
c) previously held equity interests are remeasured to fair value through earnings at the date the Group obtains<br />
control and d) changes in the Group’s ownership interest in a subsidiary that do not result in a change in control<br />
are reported as equity. The Group adopted IFRS 3 R and IAS 27 R prospectively for all business combinations<br />
completed from January 1, 2010 and as such the impacts of these recently adopted standards have been<br />
applied to the acquisitions of the Sal. Oppenheim Group, parts of ABN AMRO’s commercial banking activities<br />
in the Netherlands, and <strong>Deutsche</strong> Postbank Group (amongst others). During 2010 € 29 million of acquisitionrelated<br />
costs were expensed related to these acquisitions. No material amounts were recognized in earnings<br />
related to the fair value changes for contingent consideration in respect of the acquisitions during 2010. A loss<br />
of € 22 million was recognized in the consolidated statement of income related to the remeasurement of<br />
previously held equity interests for which the Group subsequently obtained control. Finally € 45 million were<br />
credited to equity for changes in the Group’s ownership interests which did not result in a loss of control. For<br />
further information refer to Note 04 “Acquisitions and Dispositions”.<br />
Improvements to IFRS 2009<br />
In April 2009, the IASB issued amendments to IFRS, which resulted from the IASB’s annual improvement project.<br />
They comprise amendments that result in accounting changes for presentation, recognition or measurement<br />
purposes as well as terminology or editorial amendments related to a variety of individual IFRS. The amendments<br />
were effective at the latest for annual periods beginning on or after January 1, 2010. The adoption of the amendments<br />
did not have a material impact on the Group’s consolidated financial statements.<br />
New Accounting Pronouncements<br />
The following accounting pronouncements will be relevant to the Group but were not effective as at December 31,<br />
2010 and therefore have not been applied in preparing these financial statements.<br />
Improvements to IFRS 2010<br />
In May 2010, the IASB issued amendments to IFRS, which resulted from the IASB’s annual improvement<br />
project. They comprise amendments that result in accounting changes for presentation, recognition or<br />
measurement purposes as well as terminology or editorial amendments related to a variety of individual IFRS.<br />
Most of the amendments are effective for annual periods beginning on or after January 1, 2011, with earlier<br />
application permitted. The adoption of the amendments is not expected to have a material impact on the Group’s<br />
consolidated financial statements.
<strong>Deutsche</strong> <strong>Bank</strong> 02 – Consolidated Financial Statements 197<br />
Financial <strong>Report</strong> 2010 Notes to the Consolidated Financial Statements<br />
03 – Recently Adopted and New Accounting Pronouncements<br />
IAS 24<br />
In November 2009, the IASB issued a revised version of IAS 24, “Related Party Disclosures” (“IAS 24 R”).<br />
IAS 24 R provides a partial exemption from the disclosure requirements for government-related entities.<br />
Additionally, the definition of a related party is amended to clarify that an associate includes subsidiaries of an<br />
associate and a joint venture includes subsidiaries of the joint venture. Following this clarification, the Group<br />
expects the number of related parties to increase. The revised standard is effective for annual periods beginning<br />
on or after January 1, 2011, with earlier application permitted. The adoption of the revised standard will not have<br />
a material impact on the Group’s consolidated financial statements.<br />
IFRS 7<br />
In October 2010, the IASB issued amendments to IFRS 7, “Disclosures – Transfers of Financial Assets”.<br />
The amendments comprise additional disclosures on transfer transactions of financial assets (for example,<br />
securitizations), including possible effects of any risks that may remain with the transferor of the assets. Additional<br />
disclosures are also required if a disproportionate amount of transfer transactions are undertaken around the<br />
end of a reporting period. The amendments are effective for annual periods beginning on or after July 1, 2011,<br />
with earlier application permitted. While approved by the IASB, the amendments have yet to be endorsed by<br />
the EU. The Group is currently evaluating the potential impact that the adoption of the amended disclosure<br />
requirements will have on the disclosures in its consolidated financial statements.<br />
IFRS 9<br />
In November 2009, the IASB issued IFRS 9, “Financial Instruments”, as a first step in its project to replace IAS 39,<br />
“Financial Instruments: Recognition and Measurement”. IFRS 9 introduces new requirements for how an entity<br />
should classify and measure financial assets that are in the scope of IAS 39. The standard requires all financial<br />
assets to be classified on the basis of the entity’s business model for managing the financial assets, and the<br />
contractual cash flow characteristics of the financial asset. A financial asset is measured at amortized cost if<br />
two criteria are met: (a) the objective of the business model is to hold the financial asset for the collection of the<br />
contractual cash flows, and (b) the contractual cash flows under the instrument solely represent payments of<br />
principal and interest. If a financial asset meets the criteria to be measured at amortized cost, it can be designated<br />
at fair value through profit or loss under the fair value option, if doing so would significantly reduce or eliminate<br />
an accounting mismatch. If a financial asset does not meet the business model and contractual terms criteria<br />
to be measured at amortized cost, then it is subsequently measured at fair value. IFRS 9 also removes the<br />
requirement to separate embedded derivatives from financial asset hosts. It requires a hybrid contract with a<br />
financial asset host to be classified in its <strong>entire</strong>ty at either amortized cost or fair value. IFRS 9 requires<br />
reclassifications when the entity’s business model changes, which is expected to be an infrequent occurrence;<br />
in this case, the entity is required to reclassify affected financial assets prospectively. There is specific guidance<br />
for contractually linked instruments that create concentrations of credit risk, which is often the case with investment<br />
tranches in a securitization. In addition to assessing the instrument itself against the IFRS 9 classification<br />
criteria, management should also ‘look through’ to the underlying pool of instruments that generate cash flows<br />
to assess their characteristics. To qualify for amortized cost, the investment must have equal or lower credit<br />
risk than the weighted-average credit risk in the underlying pool of instruments, and those instruments must<br />
meet certain criteria. If a ‘look through’ is impracticable, the tranche must be classified at fair value through<br />
profit or loss. Under IFRS 9, all equity investments should be measured at fair value. However, management<br />
has an option to present in other comprehensive income unrealized and realized fair value gains and losses on<br />
equity investments that are not held for trading. Such designation is available on initial recognition on an<br />
instrument-by-instrument basis and is irrevocable. There is no subsequent recycling of fair value gains and<br />
losses to profit or loss; however, dividends from such investments will continue to be recognized in profit or loss.
<strong>Deutsche</strong> <strong>Bank</strong> 02 – Consolidated Financial Statements 198<br />
Financial <strong>Report</strong> 2010 Notes to the Consolidated Financial Statements<br />
04 – Acquisitions and Dispositions<br />
IFRS 9 is effective for annual periods beginning on or after January 1, 2013, with earlier application permitted.<br />
IFRS 9 should be applied retrospectively; however, if adopted before January 1, <strong>2012</strong>, comparative periods do<br />
not need to be restated. IFRS 9 is superseded by IFRS 9 R as mentioned below. However, for annual periods<br />
beginning before January 1, 2013, an entity may elect to apply IFRS 9 or IFRS 9 R. While approved by the<br />
IASB, IFRS 9 has yet to be endorsed by the EU. The Group is currently evaluating the potential impact that the<br />
adoption of IFRS 9 will have on its consolidated financial statements.<br />
IFRS 9 R<br />
In October 2010, the IASB issued a revised version of IFRS 9, “Financial Instruments” (“IFRS 9 R”). The revised<br />
standard adds guidance on the classification and measurement of financial liabilities. IFRS 9 R requires entities<br />
with financial liabilities designated at fair value through profit or loss to recognize changes in the fair value due<br />
to changes in the liability’s credit risk in other comprehensive income. However, if recognizing these changes in<br />
other comprehensive income creates an accounting mismatch, an entity would present the <strong>entire</strong> change in fair<br />
value within profit or loss. There is no subsequent recycling of the amounts recorded in other comprehensive<br />
income to profit or loss, but accumulated gains or losses may be transferred within equity. IFRS 9 R supersedes<br />
IFRS 9 and is effective for annual periods beginning on or after January 1, 2013, with earlier application permitted.<br />
For annual periods beginning before January 1, 2013, an entity may elect to apply IFRS 9 R or IFRS 9. While<br />
approved by the IASB, IFRS 9 R has yet to be endorsed by the EU. The Group is currently evaluating the<br />
potential impact that the adoption of IFRS 9 R will have on its consolidated financial statements.<br />
04 –<br />
Acquisitions and Dispositions<br />
The following business combinations which have been completed in 2010 are accounted for in accordance<br />
with the revised IFRS 3 R, “Business Combinations”, which the Group adopted as of January 1, 2010. Accordingly,<br />
disclosures provided for these transactions are made on the basis of IFRS 3 R. However, both the accounting<br />
applied as well as disclosures provided for business combinations which were completed prior to January 1,<br />
2010 remain under the governance of the predecessor standard IFRS 3 (2004).
<strong>Deutsche</strong> <strong>Bank</strong> 02 – Consolidated Financial Statements 199<br />
Financial <strong>Report</strong> 2010 Notes to the Consolidated Financial Statements<br />
04 – Acquisitions and Dispositions<br />
In view of its significance, the Postbank elements of certain disclosures are separately identified in those other<br />
notes to the consolidated financial statements where Postbank has a material impact.<br />
Business Combinations completed in 2010<br />
<strong>Deutsche</strong> Postbank<br />
Following the successful conclusion of the voluntary public takeover offer (“PTO”) to the shareholders of <strong>Deutsche</strong><br />
Postbank AG (“Postbank”), the PTO settled on December 3, 2010 (“closing date”). Together with Postbank shares<br />
already held before the PTO, the Group gained control by holding 113.7 million Postbank shares, equal to 51.98 %<br />
of all voting rights in Postbank. Accordingly, the Group commenced consolidation of Postbank Group as of<br />
December 3, 2010. Taking into account certain financial instruments on Postbank shares held by the Group prior<br />
to the closing date (see ‘Treatment of the Group’s equity investment and other financial instruments on Postbank<br />
held at the closing date’ below), as of the closing date the consolidation of Postbank is based on a total<br />
equity interest of 79.40 %.<br />
The following paragraphs provide detailed disclosures on the Postbank acquisition, specifically: a description of<br />
Postbank’s business activities and the expected impact from their integration on the Group; the takeover offer;<br />
the <strong>Deutsche</strong> <strong>Bank</strong> capital increase; the treatment of the Group’s equity investment and other financial instruments<br />
on Postbank shares held at the closing date; the purchase price allocation and other acquisition-related<br />
information.<br />
Description of Postbank’s business activities and the expected impact from their integration on the Group.<br />
With approximately 14 million domestic customers, more than 20,000 employees, 1,100 branches and total<br />
assets of € 240 billion, Postbank Group is one of the major providers of banking and other financial services in<br />
Germany. Its business activities comprise retail banking, business with corporate customers, money and capital<br />
markets activities as well as home savings loans (via the BHW Group which is part of the Postbank Group). In<br />
its Transaction <strong>Bank</strong>ing division, Postbank offers back office services for other financial services providers. Its<br />
business focuses on Germany and is complemented by selected engagements, principally in Western Europe<br />
and North America.<br />
The Group’s Management Agenda Phase 4 provides for a focus on core businesses in the Private Clients and<br />
Asset Management Group Division and home market leadership. In this context, the majority shareholding in<br />
Postbank further strengthens the PCAM Group Division, in particular the Private & Business Clients (PBC)<br />
Corporate Division, and enables the Group to strengthen and expand its leading position in the German home<br />
market. The combination of <strong>Deutsche</strong> <strong>Bank</strong> and Postbank offers significant cost and revenue synergy potential<br />
and growth opportunities. Furthermore, the inclusion of Postbank businesses in the Group’s consolidated results<br />
will increase the level of retail banking earnings and strengthen and diversify the Group’s refinancing basis due<br />
to the increased volumes in retail customer deposits.<br />
Takeover Offer. The price per Postbank share offered in the PTO amounted to € 25.00. The acceptance period<br />
under the PTO commenced with the publication of the offer document on October 7, 2010 and ended with expiry<br />
of the additional acceptance period on November 24, 2010. The offer was accepted for 48.2 million Postbank<br />
shares, corresponding to 22.03 % of the Postbank share capital and voting rights. Therefore, the total cash<br />
consideration paid on December 3, 2010 for the Postbank shares acquired in the PTO amounted to € 1,205 million.
<strong>Deutsche</strong> <strong>Bank</strong> 02 – Consolidated Financial Statements 200<br />
Financial <strong>Report</strong> 2010 Notes to the Consolidated Financial Statements<br />
04 – Acquisitions and Dispositions<br />
<strong>Deutsche</strong> <strong>Bank</strong> announced on November 30, 2010 that it had sold 0.5 million Postbank shares and on December 3,<br />
2010 that it had sold a further 3.9 million Postbank shares both to a third party for a consideration of € 23.96 and<br />
€ 21.75 per Postbank share, respectively. The sale, which was intended to avoid a delayed completion of the PTO<br />
that would have resulted from U.S. merger control proceedings, led to an intermediate legal shareholding of less<br />
than 50 % in Postbank. Along with the sale, <strong>Deutsche</strong> <strong>Bank</strong> concluded forward purchase contracts corresponding<br />
to the aforementioned number of Postbank shares with this third party for a cash consideration of € 23.96 and<br />
€ 21.75 per Postbank share, respectively, plus a transaction fee of approximately € 0.03 and € 0.015 per share,<br />
respectively. The forward purchase contracts settled on December 10, 2010, following satisfaction of U.S. antitrust<br />
review and bank regulatory approval requirements. As a result, the Group increased its shareholding in Postbank<br />
to 51.98 % (equal to 113.7 million Postbank shares), the ultimate level achieved through the PTO. Although the<br />
shares had been legally sold to a third party, the Group retained the risks and rewards of those shares. It was<br />
deemed to be virtually certain that U.S. antitrust approval would be obtained so that the potential voting rights<br />
from those shares were included in the consolidation analysis for financial reporting purposes. Accordingly, the<br />
date of acquisition of the Postbank Group was determined as December 3, 2010.<br />
Capital Increase of <strong>Deutsche</strong> <strong>Bank</strong>. In close coordination with the PTO, <strong>Deutsche</strong> <strong>Bank</strong> also implemented a<br />
capital increase from authorized capital against cash contributions. The capital increase was completed on<br />
October 6, 2010. In total, 308.6 million new registered no-par value shares (common shares) were issued,<br />
resulting in gross proceeds of € 10.2 billion. The net proceeds of € 10.1 billion raised from the issuance (after<br />
expenses of about € 0.1 billion net of tax) are primarily intended to cover the capital consumption from the<br />
consolidation of the Postbank Group, and, in addition, to support the existing capital base. Please refer to<br />
Note 31 “Common Shares” for additional information on the capital increase.<br />
Treatment of the Group’s equity investment and other financial instruments on Postbank held at the closing date.<br />
Prior to obtaining control, the Group directly held 29.95 % of the shares and voting rights of Postbank, giving it<br />
the ability to significantly influence Postbank’s financial and operating policies. Accordingly, this investment was<br />
accounted for using the equity method.<br />
In addition, the Group had subscribed to a mandatory exchangeable bond (“MEB”) issued by <strong>Deutsche</strong> Post.<br />
The MEB was acquired by <strong>Deutsche</strong> <strong>Bank</strong> in February 2009 as part of a wider acquisition agreement with<br />
<strong>Deutsche</strong> Post regarding Postbank shares. According to the acquisition agreement, the MEB will be fully<br />
exchanged in <strong>2012</strong> for 60 million Postbank shares, or a 27.42 % stake. For accounting purposes, the MEB<br />
constitutes an equity investment which has risk and reward characteristics substantially similar to an ownership<br />
interest in the Postbank shares and therefore was included as part of the equity method investment. Upon<br />
recognition of the MEB, the equity method investment also contained an embedded derivative related to a profit<br />
sharing agreement with <strong>Deutsche</strong> Post on <strong>Deutsche</strong> <strong>Bank</strong> shares issued which were received as consideration<br />
by <strong>Deutsche</strong> Post. The embedded derivative was bifurcated as the risks and rewards from the profit sharing<br />
were not clearly and closely related to the host contract. The initial fair value of the embedded derivative was<br />
€ 201 million which reduced the cost of the equity method investment in Postbank. Subsequent changes in the<br />
fair value of the options were reflected in profit or loss. The final value of the receivable arising from the embedded<br />
derivative, which is no longer remeasured since <strong>Deutsche</strong> Post sold all <strong>Deutsche</strong> <strong>Bank</strong> shares received as<br />
consideration for the initial acquisition of 50 million Postbank shares, amounted to € 677 million. The receivable<br />
is reported separately in other assets and will offset with the corresponding collateral received (liability) once the<br />
MEB matures, at which time both items will offset against each other.
<strong>Deutsche</strong> <strong>Bank</strong> 02 – Consolidated Financial Statements 201<br />
Financial <strong>Report</strong> 2010 Notes to the Consolidated Financial Statements<br />
04 – Acquisitions and Dispositions<br />
During the third quarter 2010, the carrying amount of the equity method investment had been adjusted for a<br />
charge of approximately € 2.3 billion recognized in the Group’s income statement within the line item “Net income<br />
(loss) from equity method investments”. Since the Group had a clearly documented intention to gain control over<br />
Postbank and to commence consolidation in the fourth quarter 2010, this had to be reflected in the determination<br />
of the value in use of the equity method investment. Therefore, the charge had been determined based on the<br />
carrying amount of the Group’s equity method investment in Postbank as of September 30, 2010 and an assumed<br />
fair value of the Postbank shares equal to the price of € 25.00 offered by <strong>Deutsche</strong> <strong>Bank</strong> in the PTO. This charge<br />
was allocated to the Corporate Investments Group Division.<br />
On December 3, 2010, the date when control over Postbank was obtained, the Group remeasured to fair value<br />
its existing equity method investment in Postbank in accordance with IFRS 3 R. The fair value of the equity<br />
method investment was determined on the basis of the offer price of € 25.00, totaling an acquisition-date fair<br />
value of € 3,139 million. Considering the net share of profits attributable to the existing Postbank investment in<br />
the fourth quarter 2010, the balance of the equity method investment had increased by approximately € 22 million.<br />
Accordingly, as of the closing date the remeasurement resulted in a corresponding loss of € 22 million recognized<br />
in the Group’s income statement of the fourth quarter 2010 within the line item “Net income (loss) from equity<br />
method investments”. In accordance with IFRS 3 R, net losses recognized in other comprehensive income of<br />
€ 6 million attributable to the Group’s equity method investment in Postbank up to the closing date have been<br />
reclassified to the Group’s income statement of the fourth quarter 2010. These effects were allocated to the<br />
Corporate Investments Group Division.<br />
Along with the MEB, <strong>Deutsche</strong> <strong>Bank</strong> and <strong>Deutsche</strong> Post had also entered into put and call options for another<br />
26.4 million Postbank shares held by <strong>Deutsche</strong> Post (12.07 % stake) which are exercisable between February<br />
<strong>2012</strong> and February 2013. The put and call options were reported as a derivative financial instrument measured<br />
at fair value through profit or loss.<br />
Upon consolidation, the put and call option structure with <strong>Deutsche</strong> Post on Postbank shares was reclassified<br />
to an equity instrument due to the fact that it became a physically settled derivative on shares in a consolidated<br />
subsidiary settled for a fixed amount of cash. Therefore, its fair value of € 560 million (derivative liability) was<br />
reclassified into equity (additional paid-in capital). Correspondingly, for the respective shares under the put and<br />
call option structure, a liability was recognized at the present value of the expected purchase price, due to the<br />
requirement to purchase these shares under the put option agreement. The liability to purchase of € 1,286 million<br />
was recognized with a corresponding debt to equity (additional paid-in capital).
<strong>Deutsche</strong> <strong>Bank</strong> 02 – Consolidated Financial Statements 202<br />
Financial <strong>Report</strong> 2010 Notes to the Consolidated Financial Statements<br />
04 – Acquisitions and Dispositions<br />
The following table summarizes the direct shareholdings and the MEB held by the Group in Postbank as well as<br />
the noncontrolling interests as of the acquisition date.<br />
Number of Postbank<br />
shares<br />
(in million)<br />
Direct shareholding in Postbank before the PTO 65.5 29.95<br />
Shares acquired in PTO 48.2 22.03<br />
Total direct ownership 113.7 51.98<br />
MEB 60.0 27.42<br />
Total Group equity interest 173.7 79.40<br />
Noncontrolling interests in Postbank 45.1 20.60<br />
Total Postbank shares 218.8 100.00<br />
Purchase Price Allocation and Other Acquisition-related Information. The following table summarizes the<br />
consideration transferred and the fair value of the Postbank equity method investment held before the business<br />
combination. It also details, as of December 3, 2010, the preliminary fair value amounts of assets acquired and<br />
liabilities assumed for the Postbank Group, a noncontrolling interest and goodwill acquired in the business<br />
combination.<br />
Provisional Fair Value of Assets Acquired and Liabilities Assumed as of the Acquisition Date<br />
in € m.<br />
Consideration transferred<br />
Cash consideration transferred for PTO settlement 1,205<br />
Deduction for settlement of pre-existing relationship 176<br />
Net consideration transferred 1,029<br />
Fair value of the Group’s equity interests in Postbank held before the business combination<br />
Equity method investment 1 (excluding embedded derivative) 3,139<br />
Total purchase consideration 4,168<br />
Recognized amounts of identifiable assets acquired and liabilities assumed 2<br />
Cash and cash equivalents 8,752<br />
Financial assets at fair value through profit or loss 36,961<br />
Financial assets available for sale 33,716<br />
Loans 129,300<br />
Intangible assets 1,557<br />
All other assets 27,840<br />
Deposits 139,859<br />
Financial liabilities at fair value through profit or loss 31,983<br />
Long-term debt 38,577<br />
All other liabilities 24,813<br />
Total identifiable net assets 2,894<br />
Noncontrolling interest in Postbank 599<br />
Deduction for settlement of pre-existing relationship 176<br />
Total identifiable net assets attributable to DB shareholders 2,119<br />
Preliminary Goodwill acquired by the Group 2,049<br />
Total identifiable net assets and Goodwill acquired attributable to DB shareholders 4,168<br />
1 Included a 29.95 % direct shareholding and the MEB which were both accounted for under the equity method.<br />
2 By major class of assets acquired and liabilities assumed.<br />
Stake<br />
in %
<strong>Deutsche</strong> <strong>Bank</strong> 02 – Consolidated Financial Statements 203<br />
Financial <strong>Report</strong> 2010 Notes to the Consolidated Financial Statements<br />
04 – Acquisitions and Dispositions<br />
Compared to the “Illustrative economic purchase price value” for a 100 % of Postbank of € 6.4 billion as shown<br />
in the Investor Presentation on September 22, 2010, the difference to the above mentioned total purchase<br />
consideration for Postbank of € 4.2 billion mainly reflects effects from equity method accounting on the Postbank<br />
investment, the revaluation charges recorded in the third and fourth quarter 2010, lower volume of shares acquired<br />
under the PTO as in a full take-up scenario and excludes the put and call option from the purchase consideration.<br />
The following table provides information about major classes of receivables that were acquired from Postbank<br />
on December 3, 2010 and that the Group classified as loans as of the acquisition date.<br />
in € m.<br />
Contractually required cash flows including interest (undiscounted) 118,062<br />
Less: Best estimate at the acquisition date of such contractual cash flows not expected to be collected 3,910<br />
Cash flows expected to be collected 1 114,152<br />
1 Represents undiscounted expected principal and interest cash flows upon acquisition.<br />
The acquisition-date fair value corresponding to these acquired receivables as derived by the Group amounted<br />
to € 106.8 billion, comprising both loans and advances to customers and to banks. This amount however did<br />
not include investment securities which the Group classified as loans with a fair value of € 22.5 billion and a<br />
notional amount of € 23.2 billion. The gross contractual amount of € 118.1 billion above represents the best<br />
estimate for the contractual cash flows of the loans and advances to customers and to banks. Consistent with<br />
the acquisition-date fair value of € 106.8 billion, this amount excludes investment securities which the Group<br />
classified as loans.<br />
As part of the preliminary purchase price allocation, the Group recognized intangible assets of approximately<br />
€ 1.6 billion included in the fair value of identifiable net assets acquired. These amounts represented both<br />
intangible assets included in the balance sheet of Postbank as well as those intangible assets which were<br />
identified in the purchase price allocation. The intangible assets mainly comprise customer relationships<br />
(€ 836 million), the Postbank trademark (€ 382 million) as well as software (€ 298 million).<br />
Goodwill arising from the acquisition of Postbank was determined under the proportionate interest approach<br />
(“partial goodwill method”) pursuant to IFRS 3 R. The goodwill largely reflects the value from revenue and cost<br />
synergies expected from the acquisition of Postbank. The goodwill, which has been fully assigned to PBC, is<br />
not expected to be deductible for tax purposes.<br />
Included in all other liabilities of the opening balance sheet is the preliminary fair value of contingent liabilities<br />
recognized for certain obligations identified in the purchase price allocation. Their aggregated amount totaled<br />
€ 110 million. The timing and actual amount of outflow are uncertain. It is expected that the majority of the<br />
liabilities will be settled over the next 5 to 14 years. The Group continues to analyze the development of these<br />
obligations and the potential timing of outflows.
<strong>Deutsche</strong> <strong>Bank</strong> 02 – Consolidated Financial Statements 204<br />
Financial <strong>Report</strong> 2010 Notes to the Consolidated Financial Statements<br />
04 – Acquisitions and Dispositions<br />
The noncontrolling interests of € 599 million presented in the table of fair value of assets acquired and liabilities<br />
assumed above were determined at their proportionate share of Postbank’s identifiable net assets (“partial<br />
goodwill method”) measured at fair value as of the closing date.<br />
Before the business combination, <strong>Deutsche</strong> <strong>Bank</strong> and Postbank were parties to certain transactions considered<br />
as pre-existing relationships. Among these transactions were various financial instruments included in the<br />
course of the parties’ regular interbank and hedging activities, certain bonds issued by the Group or by Postbank<br />
which were held by the other party and specific payment services provided to the Group by Postbank. As of the<br />
acquisition date, the settlement of certain financial instruments issued by <strong>Deutsche</strong> <strong>Bank</strong> and held by Postbank<br />
resulted in an extinguishment loss of € 1 million included in other income of the Group’s consolidated income<br />
statement of the fourth quarter 2010. Likewise, the determination of the consideration transferred and its<br />
allocation to Postbank’s net assets acquired had been adjusted for € 176 million, the fair value of the related<br />
instruments as of the acquisition date.<br />
In addition, the Group and Postbank are parties to a comprehensive, mutually beneficial cooperation agreement.<br />
The agreement was entered into in 2008 in context of the acquisition of a noncontrolling interest in Postbank<br />
and encompassed financing and investment products, business banking and commercial loans as well as<br />
customer-oriented services. The agreement also covered areas such as sourcing and IT-infrastructure.<br />
Following consolidation commencing on December 3, 2010, Postbank contributed net revenues and net income<br />
after tax (including amortization of fair value adjustments from the preliminary purchase price allocation) of<br />
€ 423 million and € 62 million, respectively, to the Group’s income statement. Considering certain transaction<br />
and integration costs of € 48 million recorded on the Group level, the Postbank consolidation impact on PBC’s<br />
income before income taxes attributable to DB shareholders in 2010 amounted to € 30 million.<br />
If consolidation had been effective as of January 1, 2010, Postbank’s pro-forma contribution to the Group’s net<br />
revenues and net income after tax in 2010 would have been € 3,805 million and € 138 million, respectively.<br />
This pro-forma performance information was determined on the basis of Postbank’s preliminary stand-alone<br />
results for the year 2010 and does not include any amortization of notional fair value adjustments from the<br />
purchase price allocation for the period January 1, 2010 through December 31, 2010, any consolidation<br />
adjustments or the revaluation charge which the Group had actually recorded in the third and fourth quarter of<br />
2010 on its previous equity method investment in Postbank.<br />
Acquisition-related costs borne by the Group as the acquirer amounted to € 12 million which were recognized<br />
in general and administrative expenses in the Group’s income statement for 2010.<br />
Due to closing of the transaction only shortly before year-end and given its complexity, the initial acquisition<br />
accounting for the business combination is not yet completed.
<strong>Deutsche</strong> <strong>Bank</strong> 02 – Consolidated Financial Statements 205<br />
Financial <strong>Report</strong> 2010 Notes to the Consolidated Financial Statements<br />
04 – Acquisitions and Dispositions<br />
ABN AMRO<br />
On April 1, 2010, <strong>Deutsche</strong> <strong>Bank</strong> completed the acquisition of parts of ABN AMRO <strong>Bank</strong> N.V.’s (“ABN AMRO”)<br />
commercial banking activities in the Netherlands for an initial consideration of € 700 million paid in cash in the<br />
second quarter 2010. The amount of the consideration was reduced in the fourth quarter 2010 by € 13 million<br />
following preliminary adjustments made to the closing balance sheet of the acquired businesses. The adjusted<br />
total consideration of € 687 million is considered preliminary until the closing balance sheet has been finalized.<br />
The closing of the acquisition followed the approval by the European Commission (EC) and other regulatory<br />
bodies. As of the closing date, <strong>Deutsche</strong> <strong>Bank</strong> obtained control over the acquired businesses and accordingly<br />
commenced consolidation in the second quarter 2010. The acquisition is a key element in <strong>Deutsche</strong> <strong>Bank</strong>’s<br />
strategy of further expanding its classic banking businesses. With the acquisition, the Group has become the<br />
fourth-largest provider of commercial banking services in the Netherlands.<br />
The acquisition included 100 % of the voting equity interests in the acquired businesses and encompasses the<br />
following activities:<br />
— two corporate client units in Amsterdam and Eindhoven, serving large corporate clients,<br />
— 13 commercial branches that serve small and medium-sized enterprises,<br />
— Rotterdam-based bank Hollandsche <strong>Bank</strong> Unie N.V. (“HBU”), and<br />
— IFN Finance B.V., the Dutch part of ABN AMRO’s factoring unit IFN Group.<br />
The two corporate client units, the 13 branches and HBU were included in a separate legal entity prior to the<br />
acquisition which was renamed as <strong>Deutsche</strong> <strong>Bank</strong> Nederland N.V. immediately after the acquisition. Both<br />
<strong>Deutsche</strong> <strong>Bank</strong> Nederland N.V. and IFN Finance B.V. have become direct subsidiaries of <strong>Deutsche</strong> <strong>Bank</strong>. The<br />
acquired businesses, which serve over 34,000 clients and employ 1,300 people, are using the <strong>Deutsche</strong> <strong>Bank</strong><br />
brand name and are part of the Group’s Global Transaction <strong>Bank</strong>ing Corporate Division.<br />
Pending the finalization of the initial acquisition accounting of the business combination, as of the reporting<br />
date the determination and allocation of the purchase price and the net fair values of identifiable assets and<br />
liabilities for ABN AMRO as of the acquisition date are not yet complete. This includes the completion of the<br />
closing balance sheet and the finalization of fair value adjustments for certain parts of the opening balance<br />
sheet of the aquiree. Accordingly, the business combination is still subject to finalization within the applicable<br />
measurement period.
<strong>Deutsche</strong> <strong>Bank</strong> 02 – Consolidated Financial Statements 206<br />
Financial <strong>Report</strong> 2010 Notes to the Consolidated Financial Statements<br />
04 – Acquisitions and Dispositions<br />
At year-end 2010, the provisional fair value amounts recognized for ABN AMRO as of the acquisition date were<br />
as follows:<br />
Provisional Fair Value of Assets Acquired and Liabilities Assumed as of the Acquisition Date<br />
in € m.<br />
Consideration transferred<br />
Cash consideration transferred 700<br />
Preliminary purchase price adjustment (13)<br />
Total purchase consideration 687<br />
Recognized amounts of identifiable assets acquired and liabilities assumed 1<br />
Cash and cash equivalents 113<br />
Interest-earning time deposits with banks 71<br />
Financial assets at fair value through profit or loss 779<br />
Loans 9,802<br />
Intangible assets 168<br />
All other assets 810<br />
Deposits 8,211<br />
Financial liabilities at fair value through profit or loss 786<br />
All other liabilities 1,843<br />
Total identifiable net assets 903<br />
Preliminary Negative Goodwill 216<br />
Total identifiable net assets acquired, less Negative Goodwill 687<br />
1 By major class of assets acquired and liabilities assumed.<br />
As part of the purchase price allocation, customer relationships of € 168 million were identified as amortizing<br />
intangible assets.<br />
The excess of the fair value of identifiable net assets acquired over the fair value of the total consideration<br />
transferred resulted in the recognition of negative goodwill of € 216 million which was recorded as a gain in other<br />
income on the Group’s income statement for 2010. The main reason that led to the recognition of negative<br />
goodwill was the divestiture of parts of ABN AMRO’s Dutch commercial banking business and factoring services<br />
as required by the EC, following the acquisition of ABN AMRO Holding N.V. through a consortium of The Royal<br />
<strong>Bank</strong> of Scotland, Fortis <strong>Bank</strong> and Banco Santander in October 2007. The gain recognized is tax-exempt.<br />
Under the terms and conditions of the acquisition, ABN AMRO is providing initial credit risk coverage for 75 %<br />
of ultimate credit losses of the acquired loan portfolio (excluding IFN Finance B.V.). The maximum credit risk<br />
coverage is capped at 10 % of the portfolio volume. As of the acquisition date, the fair value of the guarantee<br />
totaled € 544 million, which is amortized over the expected average life-time of the underlying portfolio.
<strong>Deutsche</strong> <strong>Bank</strong> 02 – Consolidated Financial Statements 207<br />
Financial <strong>Report</strong> 2010 Notes to the Consolidated Financial Statements<br />
04 – Acquisitions and Dispositions<br />
The following table provides information about financial assets that were acquired from ABN AMRO on April 1,<br />
2010 and that the Group classified as loans of the acquisition date.<br />
in € m.<br />
Contractually required cash flows including interest (undiscounted) 11,503<br />
Less: Best estimate at the acquisition date of such contractual cash flows not expected to be collected 245<br />
Cash flows expected to be collected 1 11,258<br />
1 Represents undiscounted expected principal and interest cash flows upon acquisition.<br />
In respect of acquisition-related costs, € 15 million were recognized in general and administrative expenses in<br />
the Group’s income statement for 2010, and € 8 million were incurred and recognized in 2009 and 2008.<br />
Since the acquisition and excluding the above gain recognized from negative goodwill, the acquired businesses<br />
contributed net revenues and net income after tax of € 405 million and € 35 million, respectively, to the Group’s<br />
income statement. If the acquisition had been effective as of January 1, 2010, the effect on the Group’s net<br />
revenues and net income after tax in 2010 (excluding the above mentioned gain from negative goodwill) would<br />
have been € 501 million and € 77 million, respectively.<br />
Sal. Oppenheim<br />
On March 15, 2010, <strong>Deutsche</strong> <strong>Bank</strong> closed the acquisition of 100 % of the voting equity interests in Luxembourgbased<br />
Sal. Oppenheim jr. & Cie. S.C.A. (“Sal. Oppenheim S.C.A.”), the holding company of the Sal. Oppenheim<br />
Group, for a total purchase price of € 1,261 million paid in cash. Of the purchase price, € 275 million was paid<br />
for BHF Asset Servicing GmbH (“BAS”), which, at the date of acquisition, had already been classified as asset<br />
held for sale and therefore was treated as a separate transaction distinct from the remaining Sal. Oppenheim<br />
Group. As all significant legal and regulatory approvals had been obtained by January 29, 2010, the date of<br />
acquisition was set at that date and, accordingly, the Group commenced consolidation of Sal. Oppenheim in<br />
the first quarter 2010. According to the framework agreement reached in the fourth quarter 2009, the former<br />
shareholders of Sal. Oppenheim S.C.A. have the option of acquiring a long-term shareholding of up to 20 % in<br />
the German subsidiary Sal. Oppenheim jr. & Cie. AG & Co. KGaA. As of the reporting date, the acquisition-date<br />
fair value of the option is zero.<br />
The acquisition enables the Group to strengthen its Asset and Wealth Management activities among high-networth<br />
private clients, family offices and trusts in Europe and especially in Germany. Sal. Oppenheim Group’s<br />
independent wealth management activities are being expanded under the established brand name of the<br />
traditional private bank, while preserving its private bank character. Its integrated asset management concept<br />
for private and institutional clients is to be retained.
<strong>Deutsche</strong> <strong>Bank</strong> 02 – Consolidated Financial Statements 208<br />
Financial <strong>Report</strong> 2010 Notes to the Consolidated Financial Statements<br />
04 – Acquisitions and Dispositions<br />
As a result of the acquisition, the Group obtained control over Sal. Oppenheim S.C.A., which subsequently<br />
became a wholly-owned subsidiary of <strong>Deutsche</strong> <strong>Bank</strong>. All Sal. Oppenheim Group operations, including all of its<br />
asset and wealth management activities, the investment bank, BHF-BANK Group (“BHF-BANK”), BAS and the<br />
private equity fund of funds business managed in the separate holding Sal. Oppenheim Private Equity Partners<br />
S.A. were transferred to <strong>Deutsche</strong> <strong>Bank</strong>. Upon the acquisition, all of the Sal. Oppenheim Group businesses<br />
were integrated into the Group’s Asset and Wealth Management Corporate Division, except that BHF-BANK<br />
and BAS initially became part of the Corporate Investments Group Division. During the second quarter 2010,<br />
BHF-BANK and BAS were also transferred to the Corporate Division Asset and Wealth Management.<br />
The sale of BAS to <strong>Bank</strong> of New York Mellon was consummated in August 2010. Also, as part of the Sal.<br />
Oppenheim Group, the Group acquired Services Généraux de Gestion S.A. and its subsidiaries, which were<br />
on-sold in the first quarter 2010. Over the course of the year 2010, Sal. Oppenheim Group discontinued most<br />
of its investment banking activities via sale or wind-down. The Equity Trading & Derivatives and Capital Markets<br />
Sales and Research units were acquired by Australia’s Macquarie Group in the second quarter 2010. On<br />
December 23, 2010, <strong>Deutsche</strong> <strong>Bank</strong> announced that it had agreed with Liechtenstein’s LGT Group on important<br />
aspects of the sale of BHF-BANK and to conduct exclusive negotiations with LGT Group concerning the<br />
contemplated sale of BHF-BANK. The negotiations to finalize the contractual details are expected to be<br />
completed during the first quarter of 2011. Accordingly, the Group classified BHF-BANK as a disposal group<br />
held for sale as of December 31, 2010. For further information, please also refer to Note 25 “Assets held for<br />
Sale”.<br />
As of the reporting date, the acquisition-date fair value of the total consideration transferred for the Sal. Oppenheim<br />
Group and BAS is € 1,261 million. According to the framework agreement reached with the former shareholders<br />
of Sal. Oppenheim S.C.A., the purchase price might increase by up to € 476 million net payable in 2015, provided<br />
that certain risk positions (in particular legal and credit risk) do not materialize through 2015. As of the reporting<br />
date, the fair value estimate of the contingent consideration is zero.
<strong>Deutsche</strong> <strong>Bank</strong> 02 – Consolidated Financial Statements 209<br />
Financial <strong>Report</strong> 2010 Notes to the Consolidated Financial Statements<br />
04 – Acquisitions and Dispositions<br />
The fair value amounts recognized for the Sal. Oppenheim Group (excluding BAS) as of the acquisition date<br />
were as follows:<br />
Fair Value of Assets Acquired and Liabilities Assumed as of the Acquisition Date<br />
in € m.<br />
Consideration transferred<br />
Cash consideration transferred 986<br />
Fair value of contingent consideration 0<br />
Total purchase consideration 986<br />
Recognized amounts of identifiable assets acquired and liabilities assumed 1<br />
Cash and cash equivalents 2,638<br />
Interest-earning time deposits with banks 3,298<br />
Central bank funds sold and securities purchased under resale agreements 889<br />
Financial assets at fair value through profit or loss 6,626<br />
Financial assets available for sale 6,174<br />
Loans 5,609<br />
Intangible assets 162<br />
Assets classified as held for sale 1,884<br />
All other assets 2,677<br />
Deposits 18,461<br />
Central bank funds purchased and securities sold under repurchase agreements 796<br />
Financial liabilities at fair value through profit or loss 5,443<br />
Long-term debt 1,737<br />
Liabilities classified as held for sale 1,836<br />
All other liabilities 1,534<br />
Total identifiable net assets 150<br />
Noncontrolling interests in Sal. Oppenheim Group 8<br />
Total identifiable net assets attributable to DB shareholders 142<br />
Goodwill 844<br />
Total identifiable net assets and Goodwill acquired attributable to DB shareholders 986<br />
1 By major class of assets acquired and liabilities assumed.<br />
The acquisition resulted in the recognition of goodwill of € 844 million which largely consists of synergies<br />
expected by combining certain operations in the asset and wealth management areas as well as an increased<br />
market presence in these businesses in Germany, Luxembourg, Switzerland and Austria. The goodwill is not<br />
expected to be deductible for tax purposes. Intangible assets included in the identifiable net assets acquired<br />
mainly represent software, customer relationships and the Sal. Oppenheim trademark. As part of the purchase<br />
price allocation, <strong>Deutsche</strong> <strong>Bank</strong> recognized a contingent liability of € 251 million for a large population of items<br />
relating to certain businesses acquired from Sal. Oppenheim Group. The timing and actual amount of outflow<br />
are uncertain. It is expected that these obligations will be settled over the next five years. The Group continues<br />
to analyze the risks and the potential timing of outflows.
<strong>Deutsche</strong> <strong>Bank</strong> 02 – Consolidated Financial Statements 210<br />
Financial <strong>Report</strong> 2010 Notes to the Consolidated Financial Statements<br />
04 – Acquisitions and Dispositions<br />
The following table provides information about financial assets that were acquired from Sal. Oppenheim and<br />
that the Group classified as loans as of the acquisition date.<br />
in € m.<br />
Contractually required cash flows including interest (undiscounted) 6,940<br />
Less: Best estimate at the acquisition date of such contractual cash flows not expected to be collected 1,187<br />
Cash flows expected to be collected 1 5,753<br />
1 Represents undiscounted expected principal and interest cash flows upon acquisition.<br />
Following the acquisition but on the date of closing, <strong>Deutsche</strong> <strong>Bank</strong> made a capital injection of € 195 million<br />
into the new subsidiary Sal. Oppenheim S.C.A. This amount does not form part of the purchase consideration<br />
and accordingly is not included in the aforementioned goodwill calculation.<br />
In respect of acquisition-related costs, € 2 million were recognized in general and administrative expenses in<br />
the Group’s income statement for 2010. In addition, € 11 million were incurred and recognized in 2009.<br />
Following the acquisition, the Sal. Oppenheim Group (excluding BAS) contributed net revenues and a net loss<br />
after tax of € 568 million and € 308 million, respectively, to the Group’s income statement. If the acquisition had<br />
been effective as of January 1, 2010, the contribution to the Group’s net revenues and net income in 2010<br />
would have been € 599 million and a loss of € 336 million, respectively.<br />
Other Business Combinations completed in 2010<br />
Other business combinations, not being individually material, which were finalized in 2010, included the stepacquisition<br />
of an additional 47.5 % interest in an existing associate domiciled in the Philippines. The acquisition<br />
resulted in a controlling ownership interest of 95 % and the consolidation of the investment in the first quarter<br />
2010. The total consideration of € 6 million paid in cash was allocated to net assets acquired (including liabilities<br />
assumed) of € 10 million, resulting in negative goodwill of € 4 million which was recognized in other income in<br />
the Group’s income statement of the first quarter 2010. The investment was integrated into CB&S.<br />
Also in 2010, the Group acquired 100 % of the voting rights of a U.S. based investment advisor company for a<br />
total consideration of € 2 million which was fully allocated to goodwill. Consolidation of the company commenced<br />
in the fourth quarter 2010. The investment was integrated into CB&S.
<strong>Deutsche</strong> <strong>Bank</strong> 02 – Consolidated Financial Statements 211<br />
Financial <strong>Report</strong> 2010 Notes to the Consolidated Financial Statements<br />
04 – Acquisitions and Dispositions<br />
The fair value amounts recognized for these business combinations as of the acquisition date were as follows.<br />
in € m.<br />
Total purchase consideration, including fair value of the Group’s equity interest held before the business combination 8<br />
Recognized amounts of identifiable assets acquired and liabilities assumed 1 :<br />
Cash and cash equivalents 3<br />
Financial assets available for sale 14<br />
All other assets 1<br />
Long-term debt 7<br />
All other liabilities 1<br />
Total identifiable net assets 10<br />
Noncontrolling interests 0<br />
Total identifiable net assets attributable to DB shareholders 10<br />
Goodwill 2<br />
Negative Goodwill 4<br />
Total identifiable net assets and Goodwill acquired attributable to DB shareholders, less Negative Goodwill 8<br />
1 By major class of assets acquired and liabilities assumed.<br />
Since the acquisition, these businesses collectively contributed net revenues and net income after tax of<br />
€ 2 million each to the Group’s income statement. If the acquisitions had been effective as of January 1, 2010,<br />
the effect on the Group’s net revenues and net income after tax in 2010 also would have been € 2 million each.<br />
Business Combinations finalized in 2009<br />
In 2009, the Group finalized several acquisitions that were accounted for as business combinations. Of these<br />
transactions, none were individually significant and are, therefore, presented in the aggregate. These transactions<br />
involved the acquisition of interests of 100 % respectively for a total consideration of € 22 million, including cash<br />
payments of € 20 million and costs of € 2 million directly related to these acquisitions. The aggregated purchase<br />
prices were initially allocated as other intangible assets of € 21 million, reflecting customer relationships, and<br />
goodwill of € 1 million. Among these transactions is the acquisition of Dresdner <strong>Bank</strong>’s Global Agency Securities<br />
Lending business which closed on November 30, 2009. The business is operating from offices in London, New<br />
York and Frankfurt and was integrated into Global Transaction <strong>Bank</strong>ing. The completion of this transaction added<br />
one of the largest third-party agency securities lending providers to the Group’s existing custody platform, closing<br />
a strategic product gap in the securities servicing area.
<strong>Deutsche</strong> <strong>Bank</strong> 02 – Consolidated Financial Statements 212<br />
Financial <strong>Report</strong> 2010 Notes to the Consolidated Financial Statements<br />
04 – Acquisitions and Dispositions<br />
The aggregate impact from these acquisitions on the Group’s 2009 balance sheet was as follows.<br />
in € m.<br />
Carrying value<br />
before the<br />
acquisition<br />
Adjustments to<br />
fair value Fair value<br />
Assets:<br />
Cash and due from banks – – –<br />
Goodwill – 1 1<br />
Other intangible assets – 21 21<br />
All remaining assets – – –<br />
Total assets – 22 22<br />
Liabilities:<br />
Long-term debt – – –<br />
All remaining liabilities – 3 3<br />
Total liabilities – 3 3<br />
Net assets – 19 19<br />
Total liabilities and equity – 22 22<br />
In finalizing these business combinations in 2010, the aggregated purchase prices were allocated as other<br />
intangible assets of € 16 million, reflecting customer relationships, and goodwill of € 6 million.<br />
Their related effect on net revenues and net profit or loss after tax of the Group in 2009 was € 1 million and<br />
€ (1) million, respectively.<br />
Potential Profit or Loss Impact of Business Combinations finalized in 2009<br />
If the business combinations described above which were finalized in 2009 had all been effective as of January 1,<br />
2009, the effect on the Group’s net revenues and net profit or loss after tax in 2009 would have been € 22 million<br />
and less than € 1 million, respectively.<br />
Business Combinations finalized in 2008<br />
In 2008, the Group finalized several acquisitions that were accounted for as business combinations. Of these<br />
transactions, the reacquisition of Maher Terminals LLC and Maher Terminals of Canada Corp. and the acquisition<br />
of DB HedgeWorks, LLC were individually significant and are, therefore, presented separately. The other business<br />
combinations, which were not individually significant, are presented in the aggregate.<br />
Maher Terminals LLC and Maher Terminals of Canada Corp.<br />
Commencing June 30, 2008, the Group has consolidated Maher Terminals LLC and Maher Terminals of Canada<br />
Corp., collectively and hereafter referred to as Maher Terminals, a privately held operator of port terminal facilities<br />
in North America. Maher Terminals was acquired as seed asset for the North American Infrastructure Fund.<br />
The Group initially owned 100 % of Maher Terminals and following a partial sale of an 11.4 % minority stake to<br />
the RREEF North America Infrastructure Fund in 2007, the Group retained a noncontrolling interest which was<br />
accounted for as equity method investment under the held for sale category at December 31, 2007. In a<br />
subsequent effort to restructure the fund in 2008, RREEF Infrastructure reacquired all outstanding interests in<br />
the North America Infrastructure Fund, whose sole investment was Maher Terminals, for a cash consideration<br />
of € 109 million.
<strong>Deutsche</strong> <strong>Bank</strong> 02 – Consolidated Financial Statements 213<br />
Financial <strong>Report</strong> 2010 Notes to the Consolidated Financial Statements<br />
04 – Acquisitions and Dispositions<br />
In discontinuing the held for sale accounting for the investment at the end of the third quarter 2008, the assets<br />
and liabilities of Maher Terminals were reclassified from the held for sale category, with the reacquisition<br />
accounted for as a purchase transaction. The cost of this acquisition was allocated as goodwill of € 33 million<br />
and net tangible assets of € 76 million. At acquisition, Maher Terminals was included in AWM. Following a<br />
change in management responsibility, Maher Terminals was transferred to CI effective January 1, 2009.<br />
As of the acquisition date, the impact on the Group’s balance sheet was as follows.<br />
in € m.<br />
Carrying value before<br />
the acquisition and<br />
included under<br />
held-for-sale category<br />
Reclassification from<br />
held-for-sale category<br />
and Adjustments to<br />
fair value Fair value<br />
Assets:<br />
Interest-earning time deposits with banks – 30 30<br />
Property and equipment – 169 169<br />
Goodwill – 597 597<br />
Other intangible assets – 770 770<br />
All remaining assets 1,840 (1,656) 184<br />
Total assets 1,840 (90) 1,750<br />
Liabilities:<br />
Long-term debt – 839 839<br />
All remaining liabilities 983 (845) 138<br />
Total liabilities 983 (6) 977<br />
Net assets 857 (84) 773<br />
Total liabilities and equity 1,840 (90) 1,750<br />
Post-acquisition net revenues and net losses after tax related to Maher Terminals in 2008 amounted to negative<br />
€ 7 million and € 256 million, respectively. The latter included a charge of € 175 million net of tax reflecting a<br />
goodwill impairment loss recognized in the fourth quarter 2008.<br />
DB HedgeWorks, LLC<br />
On January 31, 2008, the Group acquired 100 % of HedgeWorks, LLC, a hedge fund administrator based in<br />
the United States which it subsequently renamed DB HedgeWorks, LLC (“DB HedgeWorks”). The acquisition<br />
further strengthened the Group’s service offering to the hedge fund industry. The cost of this business combination<br />
consisted of a cash payment of € 19 million and another € 15 million subject to the acquiree exceeding certain<br />
performance targets over the following three years. The purchase price was allocated as goodwill of € 28 million,<br />
other intangible assets of € 5 million and net tangible assets of € 1 million. DB HedgeWorks is included in GTB.<br />
The impact of this acquisition on the Group’s balance sheet was as follows.
<strong>Deutsche</strong> <strong>Bank</strong> 02 – Consolidated Financial Statements 214<br />
Financial <strong>Report</strong> 2010 Notes to the Consolidated Financial Statements<br />
04 – Acquisitions and Dispositions<br />
in € m.<br />
Carrying value<br />
before the<br />
acquisition<br />
Adjustments to<br />
fair value Fair value<br />
Assets:<br />
Cash and due from banks 1 – 1<br />
Goodwill – 28 28<br />
Other intangible assets – 5 5<br />
All remaining assets 1 – 1<br />
Total assets 2 33 35<br />
Liabilities:<br />
Long-term debt – 15 15<br />
All remaining liabilities 1 – 1<br />
Total liabilities 1 15 16<br />
Net assets 1 18 19<br />
Total liabilities and equity 2 33 35<br />
Following the acquisition in 2008, DB HedgeWorks recorded net revenues and net losses after tax of € 6 million<br />
and € 2 million, respectively.<br />
Other Business Combinations finalized in 2008<br />
Other business combinations, not being individually material, which were finalized in 2008, are presented in<br />
the aggregate, and, among others, included the acquisition of Far Eastern Alliance Asset Management Co.<br />
Limited, a Taiwanese investment management firm, as well as the acquisition of the operating platform of Pago<br />
eTransaction GmbH, a cash management and merchant acquiring business domiciled in Germany. These<br />
transactions involved the acquisition of majority interests ranging between more than 50 % and up to 100 % for<br />
a total consideration of € 7 million, including less than € 1 million of costs directly related to these acquisitions.<br />
Their impact on the Group’s balance sheet was as follows.<br />
in € m.<br />
Carrying value<br />
before the<br />
acquisition<br />
Adjustments to<br />
fair value Fair value<br />
Assets:<br />
Cash and due from banks 4 6 10<br />
Interest-earning demand deposits with banks 6 3 9<br />
Interest-earning time deposits with banks 2 3 5<br />
Other intangible assets – 1 1<br />
All remaining assets 20 2 22<br />
Total assets 32 15 47<br />
Liabilities:<br />
Other liabilities 1 7 8<br />
All remaining liabilities – 1 1<br />
Total liabilities 1 8 9<br />
Net assets 31 7 38<br />
Total liabilities and equity 32 15 47<br />
The effect of these acquisitions on net revenues and net profit or loss after tax of the Group in 2008 was<br />
€ 2 million and € (4) million, respectively.
<strong>Deutsche</strong> <strong>Bank</strong> 02 – Consolidated Financial Statements 215<br />
Financial <strong>Report</strong> 2010 Notes to the Consolidated Financial Statements<br />
04 – Acquisitions and Dispositions<br />
Potential Profit or Loss Impact of Business Combinations finalized in 2008<br />
If the business combinations described above which were finalized in 2008 had all been effective as of January 1,<br />
2008, the effect on the Group’s net revenues and net profit or loss after tax in 2008 would have been € 44 million<br />
and € (223) million, respectively. The latter included a charge of € 175 million net of tax reflecting a goodwill<br />
impairment related to Maher Terminals recognized in the fourth quarter 2008.<br />
Acquisitions and Dispositions of Noncontrolling Interests while Retaining Control<br />
During 2010, the Group completed acquisitions and dispositions of noncontrolling interests related to its<br />
investments in subsidiaries where the Group is not the sole owner and which did not result in the loss of control<br />
over the respective subsidiaries. In accordance with IAS 27 R, they were accounted for as equity transactions<br />
between the Group and outside shareholders with no gain or loss recognized in the income statement. The net<br />
cash consideration paid on these transactions totaled € 13 million. The carrying amounts of the related controlling<br />
and noncontrolling interests were adjusted to reflect the changes regarding the Group’s interests in these<br />
subsidiaries. Any difference between the fair values of the consideration transferred or received and the<br />
amounts by which the noncontrolling interests were adjusted is recognized directly in shareholders’ equity.<br />
The following table summarizes the aggregated effect of changes in the Group’s ownership interests in these<br />
subsidiaries recognized in 2010.<br />
in € m. 2010<br />
DB’s ownership interests as of January 1, 2010 136<br />
Net increase in <strong>Deutsche</strong> <strong>Bank</strong>’s ownership interests 76<br />
Group’s share of net income or loss (11)<br />
Group’s share of other comprehensive income 29<br />
Group’s share of other equity changes (49)<br />
DB’s ownership interests as of December 31, 2010 181<br />
Dispositions<br />
During 2010, 2009 and 2008, the Group finalized several dispositions of subsidiaries/businesses. These disposals<br />
included the sale of BAS in the third quarter 2010, a business already classified as held for sale as part of the<br />
acquisition of the Sal. Oppenheim Group in the first quarter 2010. For a list and further details about these<br />
dispositions, please see Note 05 “Business Segments and Related Information”. The total cash consideration<br />
received for these dispositions in 2010, 2009 and 2008 was € 281 million, € 51 million and € 182 million,<br />
respectively. The table below includes the assets and liabilities that were included in these disposals.<br />
in € m. 2010 2009 2008<br />
Cash and cash equivalents 45 49 66<br />
All remaining assets 2,180 15 4,079<br />
Total assets disposed 2,225 64 4,145<br />
Total liabilities disposed 1,932 73 3,490
<strong>Deutsche</strong> <strong>Bank</strong> 02 – Consolidated Financial Statements 216<br />
Financial <strong>Report</strong> 2010 Notes to the Consolidated Financial Statements<br />
05 – Business Segments and Related Information<br />
Also included in these dispositions completed in 2010 were several divestitures in which the Group retained<br />
noncontrolling interests in the former subsidiaries. None of these disposal transactions were individually significant.<br />
The interests retained in the former subsidiaries were recognized initially at fair value as of the date when control<br />
was lost, on which date these interests were subsequently accounted for under the equity method. The resulting<br />
net gain recognized on these divestitures totaled € 15 million and is included in other income. Of that net gain,<br />
€ 5 million are related to the remeasurement to fair value of the interests retained in these former subsidiaries.<br />
05 –<br />
Business Segments and Related Information<br />
The following segment information has been prepared in accordance with the “management approach”, which<br />
requires presentation of the segments on the basis of the internal reports about components of the entity which<br />
are regularly reviewed by the chief operating decision-maker in order to allocate resources to a segment and to<br />
assess its performance.<br />
Business Segments<br />
The following business segments represent the Group’s organizational structure as reflected in its internal<br />
management reporting systems.<br />
The Group is organized into three group divisions, which are further subdivided into corporate divisions. As of<br />
December 31, 2010, the group divisions and corporate divisions were as follows:<br />
The Corporate & Investment <strong>Bank</strong> (CIB), which combines the Group’s corporate banking and securities activities<br />
(including sales and trading and corporate finance activities) with the Group’s transaction banking activities. CIB<br />
serves corporate and institutional clients, ranging from medium-sized enterprises to multinational corporations,<br />
banks and sovereign organizations. Within CIB, the Group manages these activities in two global Corporate<br />
Divisions: Corporate <strong>Bank</strong>ing & Securities (CB&S) and Global Transaction <strong>Bank</strong>ing (GTB).<br />
— CB&S is made up of the Markets and Corporate Finance business divisions. These businesses offer<br />
financial products worldwide, ranging from the underwriting of stocks and bonds to the tailoring of structured<br />
solutions for complex financial requirements.<br />
— GTB is primarily engaged in the gathering, transferring, safeguarding and controlling of assets for its clients<br />
throughout the world. It provides processing, fiduciary and trust services to corporations, financial institutions<br />
and governments and their agencies.
<strong>Deutsche</strong> <strong>Bank</strong> 02 – Consolidated Financial Statements 217<br />
Financial <strong>Report</strong> 2010 Notes to the Consolidated Financial Statements<br />
05 – Business Segments and Related Information<br />
Private Clients and Asset Management (PCAM), which combines the Group’s asset management, private wealth<br />
management and private and business client activities. Within PCAM, the Group manages these activities in<br />
two global Corporate Divisions: Asset and Wealth Management (AWM) and Private & Business Clients (PBC).<br />
— AWM is composed of the business divisions Asset Management (AM), which focuses on managing assets<br />
on behalf of institutional clients and providing mutual funds and other retail investment vehicles, and Private<br />
Wealth Management (PWM), which focuses on the specific needs of high net worth clients, their families<br />
and selected institutions.<br />
— PBC serves retail and affluent clients as well as small corporate customers with a full range of retail banking<br />
products.<br />
Corporate Investments (CI), which manages certain alternative assets of the Group and other debt and equity<br />
positions.<br />
Changes in the composition of segments can arise from either changes in management responsibility, or from<br />
acquisitions and divestitures.<br />
The following describes changes in management responsibilities with a significant impact on segmental reporting:<br />
— With effect from July 1, 2010, an integrated management structure for the whole of the Corporate & Investment<br />
<strong>Bank</strong> Group Division (CIB) was implemented following changes in the Management Board, and in the<br />
responsibility for Corporate Finance and Global Transaction <strong>Bank</strong>ing. The new structure is intended to<br />
accelerate growth as a top-tier corporate and investment bank and allow for delivery of the Group’s targets<br />
but has no impact on the composition of the business segments.<br />
— On April 1, 2009, management responsibility for The Cosmopolitan of Las Vegas property changed from the<br />
Corporate Division CB&S to the Corporate Division CI.<br />
— During the first quarter 2009, management responsibility for certain assets changed from the Corporate<br />
Division AWM to the Group Division CI. These assets included Maher Terminals, a consolidated infrastructure<br />
investment, and RREEF Global Opportunity Fund III, a consolidated real estate investment fund.<br />
The following describes acquisitions and divestitures which had a significant impact on the Group’s segment<br />
operations:<br />
— On December 3, 2010, the Group consolidated <strong>Deutsche</strong> Postbank AG for the first time following the<br />
successful conclusion and settlement of a voluntary public takeover offer. As of that date, the investment in<br />
Postbank is included in the Corporate Division PBC.<br />
— On April 1, 2010, the Group completed the acquisition of parts of the commercial banking activities of ABN<br />
AMRO <strong>Bank</strong> N.V. (“ABN AMRO”) in the Netherlands. These are included in the Corporate Division GTB.
<strong>Deutsche</strong> <strong>Bank</strong> 02 – Consolidated Financial Statements 218<br />
Financial <strong>Report</strong> 2010 Notes to the Consolidated Financial Statements<br />
05 – Business Segments and Related Information<br />
— On March 15, 2010, the Group acquired the Sal. Oppenheim Group, which was included in the Corporate<br />
Division AWM, with the exception of its BHF-BANK operations, which were included in the Group Division CI.<br />
In the second quarter 2010, the BHF-BANK operations were transferred to the Business Division PWM<br />
within the Corporate Division AWM. This change is reflected in the presentation of the year ended<br />
December 31, 2010.<br />
— In November 2009, the Group completed the acquisition of Dresdner <strong>Bank</strong>’s Global Agency Securities<br />
Lending business from Commerzbank AG. The business is included in the Corporate Division GTB.<br />
— On February 25, 2009, the Group completed the acquisition of a minority stake in <strong>Deutsche</strong> Postbank AG,<br />
one of Germany’s major financial services providers. As of that date, the Group also entered into a<br />
mandatorily-exchangeable bond as well as options to increase its stake in the future. All components of the<br />
transaction were included in the Group Division CI until the first-time consolidation of Postbank on<br />
December 3, 2010.<br />
— In December 2008, RREEF Alternative Investments acquired a significant noncontrolling interests in Rosen<br />
Real Estate Securities LLC (RRES), a long/short real estate investment advisor. The investment is included<br />
in the Corporate Division AWM.<br />
— In November 2008, the Group acquired a 40 % stake in UFG Invest, the Russian investment management<br />
company of UFG Asset Management, with an option to become a 100 % owner in the future. The business<br />
is branded <strong>Deutsche</strong> UFG Capital Management. The investment is included in the corporate division AWM.<br />
— In October 2008, the Group completed the acquisition of the operating platform of Pago eTransaction GmbH<br />
into the <strong>Deutsche</strong> Card Services GmbH, based in Germany. The investment is included in the Corporate<br />
Division GTB.<br />
— In June 2008, the Group consolidated Maher Terminals LLC and Maher Terminals of Canada Corp, collectively<br />
and hereafter referred to as Maher Terminals, a privately held operator of port terminal facilities in North<br />
America. RREEF Infrastructure acquired all third party investors’ interests in the North America Infrastructure<br />
Fund, whose sole underlying investment was Maher Terminals. The investment is included in the Group<br />
Division CI since the first quarter of 2009.<br />
— In June 2008, the Group sold DWS Investments Schweiz AG, comprising the Swiss fund administration<br />
business of the Corporate Division AWM, to State Street <strong>Bank</strong>.<br />
— Effective June 2008, the Group sold its Italian life insurance company DWS Vita S.p.A. to Zurich Financial<br />
Services Group. The business was included in the corporate division AWM.<br />
— Effective March 2008, the Group completed the acquisition of a 60 % interest in Far Eastern Alliance Asset<br />
Management Co. Limited, a Taiwanese investment management firm. The investment is included in the<br />
Corporate Division AWM.<br />
— In February 2008, the 50 % interest in the management company of the Australia based DEXUS Property<br />
Group was sold by RREEF Alternative Investments to DEXUS’ unitholders. The investment was included in<br />
the Corporate Division AWM.<br />
— In January 2008, the Group acquired HedgeWorks LLC, a hedge fund administrator based in the United<br />
States. The investment is included in the Corporate Division GTB.<br />
— In January 2008, the Group increased its stake in Harvest Fund Management Company Limited to 30 %.<br />
Harvest is a mutual fund manager in China. The investment is included in the Corporate Division AWM.
<strong>Deutsche</strong> <strong>Bank</strong> 02 – Consolidated Financial Statements 219<br />
Financial <strong>Report</strong> 2010 Notes to the Consolidated Financial Statements<br />
05 – Business Segments and Related Information<br />
Measurement of Segment Profit or Loss<br />
Segment reporting requires a presentation of the segment results based on management reporting methods,<br />
including a reconciliation between the results of the business segments and the consolidated financial statements,<br />
which is presented in the “Reconciliation of Segmental Results of Operations to Consolidated Results of<br />
Operations” section of this note. The information provided about each segment is based on the internal reports<br />
about segment profit or loss, assets and other information which are regularly reviewed by the chief operating<br />
decision-maker.<br />
Management reporting for the Group is generally based on IFRS. Non-IFRS compliant accounting methods are<br />
rarely used and represent either valuation or classification differences. The largest valuation differences relate to<br />
mark-to-market accounting in management reporting versus accrual accounting under IFRS (for example, for<br />
certain financial instruments in the Group’s treasury books in CB&S and PBC) and to the recognition of trading<br />
results from own shares in revenues in management reporting (mainly in CB&S) and in equity under IFRS. The<br />
major classification difference relates to noncontrolling interest, which represents the net share of minority<br />
shareholders in revenues, provision for credit losses, noninterest expenses and income tax expenses.<br />
Noncontrolling interest is reported as a component of pre-tax income for the businesses in management reporting<br />
(with a reversal in Consolidation & Adjustments, or C&A) and a component of net income appropriation under<br />
IFRS.<br />
Revenues from transactions between the business segments are allocated on a mutually-agreed basis. Internal<br />
service providers, which operate on a nonprofit basis, allocate their noninterest expenses to the recipient of the<br />
service. The allocation criteria are generally based on service level agreements and are either determined<br />
based upon “price per unit”, “fixed price” or “agreed percentages”. Since the Group’s business activities are<br />
diverse in nature and its operations are integrated, certain estimates and judgments have been made to apportion<br />
revenue and expense items among the business segments.<br />
The management reporting systems follow a “matched transfer pricing concept” in which the Group’s external<br />
net interest income is allocated to the business segments based on the assumption that all positions are funded<br />
or invested via the wholesale money and capital markets. Therefore, to create comparability with those<br />
competitors who have legally independent units with their own equity funding, the Group allocates the net<br />
notional interest credit on its consolidated capital (after deduction of certain related charges such as hedging of<br />
net investments in certain foreign operations) to the business segments, in proportion to each business<br />
segment’s allocated average active equity.<br />
The Group reviewed its internal funding systems as a reaction to the significant changes of funding costs<br />
during the financial crisis, and adopted in 2009 a refinement of internal funding rates used to more adequately<br />
reflect risk of certain assets and the value of liquidity provided by unsecured funding sources.
<strong>Deutsche</strong> <strong>Bank</strong> 02 – Consolidated Financial Statements 220<br />
Financial <strong>Report</strong> 2010 Notes to the Consolidated Financial Statements<br />
05 – Business Segments and Related Information<br />
The financial impact on the business segments for 2010 was as follows:<br />
— GTB (€ 106 million), AWM (€ 16 million) and PBC (€ 1 million) received additional funding benefit.<br />
— CB&S (€ 93 million) and CI (€ 30 million) received additional funding costs.<br />
The financial impact on the business segments for 2009 was as follows:<br />
— GTB (€ 160 million), AWM (€ 32 million) and PBC (€ 4 million) received additional funding benefit.<br />
— CB&S (€ 167 million) and CI (€ 30 million) received additional funding costs.<br />
Management uses certain measures for equity and related ratios as part of its internal reporting system because<br />
it believes that these measures provide it with a more useful indication of the financial performance of the<br />
business segments. The Group discloses such measures to provide investors and analysts with further insight<br />
into how management operates the Group’s businesses and to enable them to better understand the Group’s<br />
results. These measures include:<br />
— Average Active Equity: The Group calculates active equity to facilitate comparison to its peers. The Group<br />
uses average active equity to calculate several ratios. However, active equity is not a measure provided for<br />
in IFRS and therefore the Group’s ratios based on average active equity should not be compared to other<br />
companies’ ratios without considering the differences in the calculation. The items for which the average<br />
shareholders’ equity is adjusted are average accumulated other comprehensive income excluding foreign<br />
currency translation (all components net of applicable taxes) as well as average dividends, for which a<br />
proposal is accrued on a quarterly basis and which are paid after the approval by the <strong>Annual</strong> General Meeting<br />
following each year. Tax rates applied in the calculation of average active equity are those used in the financial<br />
statements for the individual items and not an average overall tax rate. The Group’s average active equity is<br />
allocated to the business segments and to C&A in proportion to their economic risk exposures, which consist<br />
of economic capital, goodwill and unamortized other intangible assets. The total amount allocated is the<br />
higher of the Group’s overall economic risk exposure or regulatory capital demand. In 2008, this demand for<br />
regulatory capital was derived by assuming a Tier 1 ratio of 8.5 %. In 2009 and 2010, the Group derived its<br />
internal demand for regulatory capital assuming a Tier 1 ratio of 10.0 %. If the Group’s average active equity<br />
exceeds the higher of the overall economic risk exposure or the regulatory capital demand, this surplus is<br />
assigned to C&A.<br />
— Return on Average Active Equity in % is defined as income before income taxes less noncontrolling interest<br />
as a percentage of average active equity. These returns, which are based on average active equity, should<br />
not be compared to those of other companies without considering the differences in the calculation of such<br />
ratios.
<strong>Deutsche</strong> <strong>Bank</strong> 02 – Consolidated Financial Statements 221<br />
Financial <strong>Report</strong> 2010 Notes to the Consolidated Financial Statements<br />
05 – Business Segments and Related Information<br />
Segmental Results of Operations<br />
The following tables present the results of the business segments, including the reconciliation to the consolidated<br />
results under IFRS, for the years ended December 31, 2010, 2009 and 2008, respectively. In 2009, the presentation<br />
of revenues and noninterest expenses in prior periods has been adjusted for changes in accounting<br />
policy relating to premiums paid for financial guarantees, in accordance with Note 01 “Significant Accounting<br />
Policies”.<br />
2010 Corporate & Investment <strong>Bank</strong> Private Clients and Asset Management<br />
in € m.<br />
(unless stated otherwise)<br />
Corporate<br />
<strong>Bank</strong>ing &<br />
Securities<br />
Global<br />
Transaction<br />
<strong>Bank</strong>ing Total<br />
Asset and<br />
Wealth<br />
Management<br />
Private &<br />
Business<br />
Clients Total<br />
Corporate<br />
Investments<br />
Total<br />
Management<br />
<strong>Report</strong>ing<br />
Net revenues 1 17,490 3,439 5<br />
20,929 3,907 6,136 10,043 (2,020) 6<br />
28,953<br />
Provision for credit losses 348 140 488 43 746 789 (4) 1,273<br />
Total noninterest expenses<br />
therein:<br />
Depreciation, depletion and<br />
12,028 2,394 14,422 3,765 4,493 8,258 637 23,318<br />
amortization 74 6 80 87 74 161 8 248<br />
Severance payments 215 71 286 117 33 149 1 436<br />
Policyholder benefits and claims 486 – 486 0 – 0 – 486<br />
Impairment of intangible assets – 29 29 – – – – 29<br />
Restructuring activities – – – – – – – –<br />
Noncontrolling interests 20 – 20 (1) 8 6 (2) 24<br />
Income (loss) before income taxes 5,094 905 5,999 100 890 989 (2,649) 4,339<br />
Cost/income ratio 69 % 70 % 69 % 96 % 73 % 82 % N/M 81 %<br />
Assets 2, 3 Expenditures for additions to<br />
1,468,863 71,877 1,519,983 65,508 346,998 412,477 17,766 1,894,282<br />
long-lived assets 52 1 53 11 67 78 776 907<br />
Risk-weighted assets 185,784 25,331 211,115 23,339 104,488 127,827 4,580 343,522<br />
Average active equity 4 17,096 1,548 18,644 6,737 3,897 10,635 4,168 33,446<br />
Pre-tax return on average active equity<br />
1 Includes:<br />
30 % 58 % 32 % 1 % 23 % 9 % (64)% 13 %<br />
Net interest income<br />
Net revenues from external<br />
9,848 1,281 11,128 668 3,850 4,518 (118) 15,528<br />
customers 18,069 3,222 21,290 3,945 5,707 9,652 (2,033) 28,910<br />
Net intersegment revenues<br />
Net income (loss) from<br />
(578) 217 (361) (38) 429 391 13 43<br />
equity method investments<br />
2 Includes:<br />
(57) 1 (56) 6 (12) (6) (1,947) (2,010)<br />
Equity method investments<br />
N/M – Not meaningful<br />
2,108 41 2,149 259 34 292 116 2,558<br />
3 The sum of corporate divisions does not necessarily equal the total of the corresponding group division because of consolidation items between corporate divisions, which are eliminated at<br />
the group division level. The same approach holds true for the sum of group divisions compared to Total Management <strong>Report</strong>ing.<br />
4 For management reporting purposes goodwill and other intangible assets with indefinite useful lives are explicitly assigned to the respective divisions. The Group’s average active equity is<br />
allocated to the business segments and to Consolidation & Adjustments in proportion to their economic risk exposures, which comprise economic capital, goodwill and unamortized other<br />
intangible assets.<br />
5 Includes a gain from the recognition of negative goodwill related to the acquisition of parts of ABN AMRO’s commercial banking activities in the Netherlands of € 208 million as reported in the<br />
second quarter 2010, which is excluded from the Group’s target definition.<br />
6<br />
Includes a charge related to the investment in <strong>Deutsche</strong> Postbank AG of € 2,338 million, which is excluded from the Group’s target definition.
<strong>Deutsche</strong> <strong>Bank</strong> 02 – Consolidated Financial Statements 222<br />
Financial <strong>Report</strong> 2010 Notes to the Consolidated Financial Statements<br />
05 – Business Segments and Related Information<br />
2009 Corporate & Investment <strong>Bank</strong> Private Clients and Asset Management<br />
in € m.<br />
(unless stated otherwise)<br />
Corporate<br />
<strong>Bank</strong>ing &<br />
Securities<br />
Global<br />
Transaction<br />
<strong>Bank</strong>ing Total<br />
Asset and<br />
Wealth<br />
Management<br />
Private &<br />
Business<br />
Clients Total<br />
Corporate<br />
Investments<br />
Total<br />
Management<br />
<strong>Report</strong>ing 5<br />
Net revenues 1 16,197 2,609 18,807 2,685 5,576 8,261 1,044 28,112<br />
Provision for credit losses 1,789 27 1,816 17 790 806 8 2,630<br />
Total noninterest expenses<br />
therein:<br />
Depreciation, depletion and<br />
10,891 1,788 12,679 2,475 4,328 6,803 581 20,063<br />
amortization 72 5 77 18 69 87 8 172<br />
Severance payments 138 7 145 105 192 297 0 442<br />
Policyholder benefits and claims 541 – 541 0 – 0 – 541<br />
Impairment of intangible assets 5 – 5 (291) – (291) 151 (134)<br />
Restructuring activities – – – – – – – –<br />
Noncontrolling interests (2) – (2) (7) 0 (7) (1) (10)<br />
Income (loss) before income taxes 3,520 795 4,314 200 458 658 456 5,428<br />
Cost/income ratio 67 % 69 % 67 % 92 % 78 % 82 % 56 % 71 %<br />
Assets 2, 3 Expenditures for additions to<br />
1,308,222 47,414 1,343,824 43,761 131,014 174,739 28,456 1,491,108<br />
long-lived assets 73 17 89 56 42 98 395 583<br />
Risk-weighted assets 188,118 15,844 203,962 12,201 36,872 49,073 16,935 269,969<br />
Average active equity 4 17,881 1,160 19,041 4,791 3,617 8,408 4,323 31,772<br />
Pre-tax return on average active equity<br />
1 Includes:<br />
20 % 68 % 23 % 4 % 13 % 8 % 11 % 17 %<br />
Net interest income<br />
Net revenues from external<br />
7,480 1,040 8,519 379 3,493 3,871 (108) 12,283<br />
customers 17,000 2,127 19,127 2,528 5,372 7,900 1,053 28,079<br />
Net intersegment revenues<br />
Net income (loss) from<br />
(802) 479 (323) 160 204 364 (9) 33<br />
equity method investments<br />
2 Includes:<br />
(77) 1 (76) (14) 1 (12) 155 67<br />
Equity method investments 1,543 40 1,584 202 42 244 5,911 7,739<br />
3 The sum of corporate divisions does not necessarily equal the total of the corresponding group division because of consolidation items between corporate divisions, which are eliminated at<br />
the group division level. The same approach holds true for the sum of group divisions compared to Total Management <strong>Report</strong>ing.<br />
4 For management reporting purposes goodwill and other intangible assets with indefinite useful lives are explicitly assigned to the respective divisions. The Group’s average active equity is<br />
allocated to the business segments and to Consolidation & Adjustments in proportion to their economic risk exposures, which comprise economic capital, goodwill and unamortized other<br />
intangible assets.<br />
5 Includes a gain from the sale of industrial holdings (Daimler AG) of € 236 million, a reversal of impairment of intangible assets (Asset Management) of € 291 million (the related impairment<br />
had been recorded in 2008), an impairment charge of € 278 million on industrial holdings and an impairment of intangible assets (Corporate Investments) of € 151 million which are excluded<br />
from the Group’s target definition.
<strong>Deutsche</strong> <strong>Bank</strong> 02 – Consolidated Financial Statements 223<br />
Financial <strong>Report</strong> 2010 Notes to the Consolidated Financial Statements<br />
05 – Business Segments and Related Information<br />
2008 Corporate & Investment <strong>Bank</strong> Private Clients and Asset Management<br />
in € m.<br />
(unless stated otherwise)<br />
Corporate<br />
<strong>Bank</strong>ing &<br />
Securities<br />
Global<br />
Transaction<br />
<strong>Bank</strong>ing Total<br />
Asset and<br />
Wealth<br />
Management<br />
Private &<br />
Business<br />
Clients Total<br />
Corporate<br />
Investments<br />
Total<br />
Management<br />
<strong>Report</strong>ing 5<br />
Net revenues 1 428 2,784 3,211 3,254 5,777 9,031 1,290 13,532<br />
Provision for credit losses 402 5 408 15 653 668 (1) 1,075<br />
Total noninterest expenses<br />
therein:<br />
Depreciation, depletion and<br />
8,568 1,646 10,214 3,793 4,178 7,971 95 18,279<br />
amortization 52 6 58 16 77 93 8 159<br />
Severance payments 334 3 337 29 84 113 0 450<br />
Policyholder benefits and claims (273) – (273) 18 – 18 – (256)<br />
Impairment of intangible assets 5 – 5 580 – 580 – 585<br />
Restructuring activities – – – – – – – –<br />
Noncontrolling interests (48) – (48) (20) 0 (20) 2 (66)<br />
Income (loss) before income taxes (8,494) 1,132 (7,362) (534) 945 411 1,194 (5,756)<br />
Cost/income ratio N/M 59 % N/M 117 % 72 % 88 % 7 % 135 %<br />
Assets 2, 3 Expenditures for additions to<br />
2,012,002 49,469 2,047,181 50,473 138,350 188,785 18,297 2,189,313<br />
long-lived assets 1,167 38 1,205 13 56 70 0 1,275<br />
Risk-weighted assets 234,389 15,355 249,744 16,051 37,482 53,533 2,677 305,953<br />
Average active equity 4 19,181 1,081 20,262 4,870 3,445 8,315 403 28,979<br />
Pre-tax return on average active equity<br />
1 Includes:<br />
(44)% 105 % (36)% (11)% 27 % 5 % N/M (20)%<br />
Net interest income<br />
Net revenues from external<br />
7,683 1,167 8,850 486 3,249 3,736 7 12,592<br />
customers 546 2,814 3,359 3,418 5,463 8,881 1,259 13,499<br />
Net intersegment revenues<br />
Net income (loss) from<br />
(118) (40) (158) (154) 314 160 31 33<br />
equity method investments<br />
2 Includes:<br />
(110) 2 (108) 87 2 88 62 42<br />
Equity method investments<br />
N/M – Not meaningful<br />
1,687 40 1,727 321 44 365 71 2,163<br />
3 The sum of corporate divisions does not necessarily equal the total of the corresponding group division because of consolidation items between corporate divisions, which are eliminated at<br />
the group division level. The same approach holds true for the sum of group divisions compared to Total Management <strong>Report</strong>ing.<br />
4 For management reporting purposes goodwill and other intangible assets with indefinite useful lives are explicitly assigned to the respective divisions. The Group’s average active equity is<br />
allocated to the business segments and to Consolidation & Adjustments in proportion to their economic risk exposures, which comprise economic capital, goodwill and unamortized other<br />
intangible assets.<br />
5 Includes gains from the sale of industrial holdings (Daimler AG, Allianz SE and Linde AG) of € 1,228 million, a gain from the sale of the investment in Arcor AG & Co. KG of € 97 million and an<br />
impairment of intangible assets (Asset Management) of € 572 million, which are excluded from the Group’s target definition.
<strong>Deutsche</strong> <strong>Bank</strong> 02 – Consolidated Financial Statements 224<br />
Financial <strong>Report</strong> 2010 Notes to the Consolidated Financial Statements<br />
05 – Business Segments and Related Information<br />
Reconciliation of Segmental Results of Operations to Consolidated Results of Operations<br />
The following table presents a reconciliation of the total results of operations and total assets of the Group’s<br />
business segments under management reporting systems to the consolidated financial statements for the<br />
years ended December 31, 2010, 2009 and 2008, respectively.<br />
in € m.<br />
Total<br />
Management<br />
<strong>Report</strong>ing<br />
Consoli-<br />
dation &<br />
Adjustments<br />
Total<br />
Consolidated<br />
2010 2009 2008<br />
Total<br />
Management<br />
<strong>Report</strong>ing<br />
Consolidation<br />
&<br />
Adjustments<br />
Total<br />
Consolidated<br />
Total<br />
Management<br />
<strong>Report</strong>ing<br />
Consoli-<br />
dation &<br />
Adjustments<br />
Total<br />
Consolidated<br />
Net revenues 1 28,953 (386) 28,567 28,112 (159) 27,952 13,532 82 13,613<br />
Provision for credit<br />
losses 1,273 0 1,274 2,630 (0) 2,630 1,075 1 1,076<br />
Noninterest expenses 23,318 1 23,318 20,063 57 20,120 18,279 (0) 18,278<br />
Noncontrolling<br />
interests 24 (24) – (10) 10 – (66) 66 –<br />
Income (loss) before<br />
income taxes 4,339 (363) 3,975 5,428 (226) 5,202 (5,756) 15 (5,741)<br />
Assets 1,894,282 11,348 1,905,630 1,491,108 9,556 1,500,664 2,189,313 13,110 2,202,423<br />
Risk-weighted assets 343,522 2,683 346,204 269,969 3,507 273,476 305,953 1,779 307,732<br />
Average active equity 33,446 7,907 41,353 31,772 2,840 34,613 28,979 3,100 32,079<br />
1 Net interest income and noninterest income.<br />
In 2010, loss before income taxes in Consolidation & Adjustments (C&A) was € 363 million. Noninterest expenses<br />
included the receipt of insurance payments which were partly offset by charges for litigation provisions as well<br />
as other items outside the management responsibility of the business segments. The main adjustments to net<br />
revenues in C&A in 2010 were:<br />
— Adjustments related to positions which were marked-to-market for management reporting purposes and<br />
accounted for on an accrual basis under IFRS. These adjustments, which decreased net revenues by<br />
approximately € 210 million, relate to economically hedged short-term positions as well as economically<br />
hedged debt issuance trades and were mainly driven by movements in interest rates in both euro and<br />
U.S. dollar.<br />
— Hedging of net investments in certain foreign operations decreased net revenues by approximately<br />
€ 245 million.<br />
— The remainder of net revenues was due to net interest expenses which were not allocated to the business<br />
segments and items outside the management responsibility of the business segments. Such items include<br />
net funding expenses on non-divisionalized assets/liabilities, e.g. deferred tax assets/liabilities, and net<br />
interest expenses related to tax refunds and accruals.
<strong>Deutsche</strong> <strong>Bank</strong> 02 – Consolidated Financial Statements 225<br />
Financial <strong>Report</strong> 2010 Notes to the Consolidated Financial Statements<br />
05 – Business Segments and Related Information<br />
In 2009, loss before income taxes in C&A was € 226 million. Noninterest expenses included charges related to<br />
litigation provisions and other items outside the management responsibility of the business segments. Partly<br />
offsetting were value-added tax benefits. The main adjustments to net revenues in C&A in 2009 were:<br />
— Adjustments related to positions which were marked-to-market for management reporting purposes and<br />
accounted for on an accrual basis under IFRS. These adjustments, which decreased net revenues by<br />
approximately € 535 million, relate to economically hedged short-term positions as well as economically<br />
hedged debt issuance trades and were mainly driven by movements in short-term interest rates in both euro<br />
and U.S. dollar.<br />
— Hedging of net investments in certain foreign operations decreased net revenues by approximately<br />
€ 225 million.<br />
— Derivative contracts used to hedge effects on shareholders’ equity, resulting from obligations under sharebased<br />
compensation plans, resulted in an increase of approximately € 460 million.<br />
— The remainder of net revenues was due to net interest expenses which were not allocated to the business<br />
segments and items outside the management responsibility of the business segments. Such items include<br />
net funding expenses on non-divisionalized assets/liabilities, e.g. deferred tax assets/liabilities, and net interest<br />
expenses related to tax refunds and accruals.<br />
In 2008, income before income taxes in C&A was € 15 million. Noninterest expenses included charges related<br />
to litigation provisions offset by value-added tax benefits. The main adjustments to net revenues in C&A in<br />
2008 were:<br />
— Adjustments related to positions which were marked-to-market for management reporting purposes and<br />
accounted for on an accrual basis under IFRS. These adjustments, which increased net revenues by<br />
approximately € 450 million, relate to economically hedged short-term positions and were driven by the<br />
significant volatility and overall decline of short-term interest rates.<br />
— Hedging of net investments in certain foreign operations decreased net revenues by approximately<br />
€ 160 million.<br />
— Trading results from the Group’s own shares and certain derivatives indexed to own shares are reflected in<br />
CB&S. The elimination of such results under IFRS resulted in an increase of approximately € 80 million.<br />
— Decreases related to the elimination of intra-Group rental income were € 37 million.<br />
— The remainder of net revenues was due to net interest expenses which were not allocated to the business<br />
segments and items outside the management responsibility of the business segments. Such items include<br />
net funding expenses on non-divisionalized assets/liabilities, e.g. deferred tax assets/liabilities, and net interest<br />
expenses related to tax refunds and accruals.
<strong>Deutsche</strong> <strong>Bank</strong> 02 – Consolidated Financial Statements 226<br />
Financial <strong>Report</strong> 2010 Notes to the Consolidated Financial Statements<br />
05 – Business Segments and Related Information<br />
Assets and risk-weighted assets in C&A reflect corporate assets, such as deferred tax assets and central clearing<br />
accounts, outside of the management responsibility of the business segments.<br />
Average active equity assigned to C&A reflects the residual amount of equity that is not allocated to the segments<br />
as described in the “Measurement of Segment Profit or Loss” section of this Note.<br />
Entity-Wide Disclosures<br />
The following tables present the net revenue components of the CIB and PCAM Group Divisions, for the years<br />
ended December 31, 2010, 2009 and 2008, respectively.<br />
Corporate & Investment <strong>Bank</strong><br />
in € m. 2010 2009 2008<br />
Sales & Trading (equity) 3,108 2,650 (736)<br />
Sales & Trading (debt and other products) 9,740 9,557 323<br />
Total Sales & Trading 12,849 12,208 (413)<br />
Origination (equity) 706 663 334<br />
Origination (debt) 1,199 1,127 (717)<br />
Total origination 1,904 1,790 (383)<br />
Advisory 573 402 589<br />
Loan products 1,736 1,949 1,296<br />
Transaction services 3,223 2,609 2,784<br />
Other products 644 (151) (661)<br />
Total 1 20,929 18,807 3,211<br />
1 Total net revenues presented above include net interest income, net gains (losses) on financial assets/liabilities at fair value through profit or loss and other revenues<br />
such as commissions and fee income.<br />
During the first half of 2010 product revenue categories were reviewed. As a result, certain product revenues in<br />
CIB have been reclassified as described in more detail in Note 01 “Significant Accounting Policies” in the<br />
section “Basis of Accounting”.<br />
Private Clients and Asset Management<br />
in € m. 2010 2009 2008<br />
Discretionary portfolio/fund management 2,560 2,083 2,433<br />
Advisory/brokerage 1,745 1,531 2,045<br />
Credit products 2,708 2,605 2,232<br />
Deposits and payment services 2,029 1,875 1,968<br />
Other products 1,001 167 353<br />
Total 1 10,043 8,261 9,031<br />
1<br />
Total net revenues presented above include net interest income, net gains (losses) on financial assets/liabilities at fair value through profit or loss and other revenues<br />
such as commissions and fee income.
<strong>Deutsche</strong> <strong>Bank</strong> 02 – Consolidated Financial Statements 227<br />
Financial <strong>Report</strong> 2010 Notes to the Consolidated Financial Statements<br />
05 – Business Segments and Related Information<br />
The presentation of PCAM product revenues was modified during the first half of 2010 following a review and<br />
refinement of product classifications. These changes primarily impacted the classification of revenues from<br />
deposits, which had previously been reported jointly with loan revenues. Revenues from deposits of € 1,501 million<br />
for the full year 2009 have now been combined with revenues from payment services. Revenues from credit<br />
products are now reported separately. Insurance brokerage revenues of € 143 million in the full year 2009,<br />
previously reported under payments, account and remaining financial services, are now reported under Advisory/<br />
brokerage. These changes enhance transparency and better reflect how products are managed internally. Prior<br />
periods were amended retrospectively. The adjustments had no impact on PCAM’s total revenues.<br />
The following table presents total net revenues (before provisions for credit losses) by geographic area for the<br />
years ended December 31, 2010, 2009 and 2008, respectively. The information presented for CIB and PCAM<br />
has been classified based primarily on the location of the Group’s office in which the revenues are recorded.<br />
The information for CI and C&A is presented on a global level only, as management responsibility for these<br />
areas is held centrally.<br />
in € m. 2010 2009 2008<br />
Germany:<br />
CIB 2,864 2,353 2,997<br />
PCAM 5,932 4,769 5,208<br />
Total Germany 8,796 7,122 8,205<br />
Europe, Middle East and Africa:<br />
CIB 8,258 8,485 (619)<br />
PCAM 2,693 2,479 2,381<br />
Total Europe, Middle East and Africa 1 10,951 10,964 1,762<br />
Americas (primarily United States):<br />
CIB 6,420 5,295 (838)<br />
PCAM 1,032 724 971<br />
Total Americas 7,452 6,020 133<br />
Asia/Pacific:<br />
CIB 3,387 2,672 1,671<br />
PCAM 387 289 471<br />
Total Asia/Pacific 3,774 2,961 2,142<br />
CI (2,020) 1,044 1,290<br />
Consolidation & Adjustments (386) (159) 82<br />
Consolidated net revenues 2 28,567 27,952 13,613<br />
1 For the years ended December 31, 2010 and December 31, 2009 the United Kingdom accounted for roughly 60 % of these revenues. The United Kingdom reported<br />
negative revenues for the year ended December 31, 2008.<br />
2 Consolidated net revenues comprise interest and similar income, interest expenses and total noninterest income (including net commission and fee income).<br />
Revenues are attributed to countries based on the location in which the Group’s booking office is located. The location of a transaction on the Group’s books is<br />
sometimes different from the location of the headquarters or other offices of a customer and different from the location of the Group’s personnel who entered into or<br />
facilitated the transaction. Where the Group records a transaction involving its staff and customers and other third parties in different locations frequently depends on<br />
other considerations, such as the nature of the transaction, regulatory considerations and transaction processing considerations.
<strong>Deutsche</strong> <strong>Bank</strong> 02 – Consolidated Financial Statements 228<br />
Financial <strong>Report</strong> 2010 Notes to the Consolidated Income Statement<br />
06 – Net Interest Income and Net Gains (Losses) on Financial Assets/Liabilities at Fair Value through Profit<br />
or Loss<br />
Notes to the Consolidated Income Statement<br />
06 –<br />
Net Interest Income and Net Gains (Losses) on Financial Assets/Liabilities at Fair Value<br />
through Profit or Loss<br />
Net Interest Income<br />
The following are the components of interest and similar income and interest expense.<br />
in € m. 2010 2009 2008<br />
Interest and similar income:<br />
Interest-earning deposits with banks 691 633 1,313<br />
Central bank funds sold and securities purchased under resale agreements 446 320 964<br />
Securities borrowed 133 67 1,011<br />
Financial assets at fair value through profit or loss 15,589 13,634 34,938<br />
Interest income on financial assets available for sale 700 496 1,260<br />
Dividend income on financial assets available for sale 137 91 312<br />
Loans 10,222 10,555 12,269<br />
Other 861 1,157 2,482<br />
Total interest and similar income 28,779 26,953 54,549<br />
Interest expense:<br />
Interest-bearing deposits 3,800 5,119 13,015<br />
Central bank funds purchased and securities sold under repurchase agreements 301 280 4,425<br />
Securities loaned 278 269 304<br />
Financial liabilities at fair value through profit or loss 6,019 4,503 14,811<br />
Other short-term borrowings 375 798 1,905<br />
Long-term debt 1,490 2,612 5,273<br />
Trust preferred securities 781 680 571<br />
Other 152 233 1,792<br />
Total interest expense 13,196 14,494 42,096<br />
Net interest income 15,583 12,459 12,453<br />
Interest income recorded on impaired financial assets was € 146 million, € 133 million and € 65 million for the<br />
years ended December 31, 2010, 2009 and 2008, respectively.
<strong>Deutsche</strong> <strong>Bank</strong> 02 – Consolidated Financial Statements 229<br />
Financial <strong>Report</strong> 2010 Notes to the Consolidated Income Statement<br />
06 – Net Interest Income and Net Gains (Losses) on Financial Assets/Liabilities at Fair Value through Profit<br />
or Loss<br />
Net Gains (Losses) on Financial Assets/Liabilities at Fair Value through Profit or Loss<br />
The following are the components of net gains (losses) on financial assets/liabilities at fair value through profit<br />
or loss.<br />
in € m. 2010 2009 2008<br />
Trading income:<br />
Sales & Trading (equity) 198 2,148 (9,615)<br />
Sales & Trading (debt and other products) 3,429 5,440 (25,212)<br />
Total Sales & Trading 3,627 7,588 (34,827)<br />
Other trading income 31 (1,954) 998<br />
Total trading income 3,658 5,634 (33,829)<br />
Net gains (losses) on financial assets/liabilities designated at fair value through profit<br />
or loss:<br />
Breakdown by financial asset/liability category:<br />
Securities purchased/sold under resale/repurchase agreements 35 (73) –<br />
Securities borrowed/loaned – (2) (4)<br />
Loans and loan commitments (331) 3,929 (4,016)<br />
Deposits (13) (162) 139<br />
Long-term debt 1 83 (2,550) 28,630<br />
Other financial assets/liabilities designated at fair value through profit or loss (78) 333 (912)<br />
Total net gains (losses) on financial assets/liabilities<br />
designated at fair value through profit or loss (304) 1,475 23,837<br />
Total net gains (losses) on financial assets/liabilities<br />
at fair value through profit or loss 3,354 7,109 (9,992)<br />
1 Includes € 39 million, € (176) million and € 17.9 billion from securitization structures for the years ended December 31, 2010, December 31, 2009 and December 31,<br />
2008, respectively. Fair value movements on related instruments of € 163 million, € (49) million and € (20.1) billion for December 31, 2010, December 31, 2009 and<br />
December 31, 2008, respectively, are reported within trading income. Both are reported under Sales & Trading (debt and other products). The total of these gains and<br />
losses represents the Group’s share of the losses in these consolidated securitization structures.<br />
Combined Overview<br />
The Group’s trading and risk management businesses include significant activities in interest rate instruments<br />
and related derivatives. Under IFRS, interest and similar income earned from trading instruments and financial<br />
instruments designated at fair value through profit or loss (e.g., coupon and dividend income), and the costs of<br />
funding net trading positions, are part of net interest income. The Group’s trading activities can periodically shift<br />
income between net interest income and net gains (losses) of financial assets/liabilities at fair value through<br />
profit or loss depending on a variety of factors, including risk management strategies. In order to provide a more<br />
business-focused presentation, the Group combines net interest income and net gains (losses) of financial<br />
assets/liabilities at fair value through profit or loss by group division and by product within the Corporate &<br />
Investment <strong>Bank</strong>.
<strong>Deutsche</strong> <strong>Bank</strong> 02 – Consolidated Financial Statements 230<br />
Financial <strong>Report</strong> 2010 Notes to the Consolidated Income Statement<br />
07 – Commissions and Fee Income<br />
The following table presents data relating to the Group’s combined net interest and net gains (losses) on financial<br />
assets/liabilities at fair value through profit or loss by group division and, for the Corporate & Investment <strong>Bank</strong>,<br />
by product, for the years ended December 31, 2010, 2009 and 2008, respectively.<br />
in € m. 2010 2009 2008<br />
Net interest income 15,583 12,459 12,453<br />
Net gains (losses) on financial assets/liabilities<br />
at fair value through profit or loss 3,354 7,109 (9,992)<br />
Total net interest income and net gains (losses)<br />
on financial assets/liabilities at fair value through profit or loss 18,937 19,568 2,461<br />
Net interest income and net gains (losses) on financial assets/liabilities at fair value<br />
through profit or loss by Group Division/CIB product:<br />
Sales & Trading (equity) 2,266 2,047 (1,895)<br />
Sales & Trading (debt and other products) 9,204 9,725 409<br />
Total Sales & Trading 11,469 11,772 (1,486)<br />
Loan products 1 778 777 922<br />
Transaction services 1,497 1,180 1,368<br />
Remaining products 2 336 240 (1,821)<br />
Total Corporate & Investment <strong>Bank</strong> 14,081 13,969 (1,017)<br />
Private Clients and Asset Management 4,708 4,157 3,861<br />
Corporate Investments (184) 793 (172)<br />
Consolidation & Adjustments 331 649 (211)<br />
Total net interest income and net gains (losses)<br />
on financial assets/liabilities at fair value through profit or loss 18,937 19,568 2,461<br />
1 Includes the net interest spread on loans as well as the fair value changes of credit default swaps and loans designated at fair value through profit or loss.<br />
2 Includes net interest income and net gains (losses) on financial assets/liabilities at fair value through profit or loss of origination, advisory and other products.<br />
07 –<br />
Commissions and Fee Income<br />
The following are the components of commission and fee income and expense.<br />
in € m. 2010 2009 2008<br />
Commission and fee income and expense:<br />
Commission and fee income 13,652 11,377 12,449<br />
Commission and fee expense 2,983 2,466 2,708<br />
Net commissions and fee income 10,669 8,911 9,741<br />
in € m. 2010 2009 2008<br />
Net commissions and fee income:<br />
Net commissions and fees from fiduciary activities 3,529 2,925 3,414<br />
Net commissions, brokers’ fees, mark-ups on securities underwriting and other<br />
securities activities 3,873 3,449 3,790<br />
Net fees for other customer services 3,267 2,537 2,537<br />
Net commissions and fee income 10,669 8,911 9,741
<strong>Deutsche</strong> <strong>Bank</strong> 02 – Consolidated Financial Statements 231<br />
Financial <strong>Report</strong> 2010 Notes to the Consolidated Income Statement<br />
09 – Other Income<br />
08 –<br />
Net Gains (Losses) on Financial Assets Available for Sale<br />
The following are the components of net gains (losses) on financial assets available for sale.<br />
in € m. 2010 2009 2008<br />
Net gains (losses) on financial assets available for sale:<br />
Net gains (losses) on debt securities: 58 37 (534)<br />
Net gains (losses) from disposal 74 119 17<br />
Impairments (16) (82) (551)<br />
Net gains (losses) on equity securities: 120 (295) 1,156<br />
Net gains (losses) from disposal 164 443 1,428<br />
Impairments (44) (738) (272)<br />
Net gains (losses) on loans: 18 (56) (63)<br />
Net gains (losses) from disposal 36 9 (12)<br />
Impairments (18) (81) (52)<br />
Reversal of impairments 0 16 1<br />
Net gains (losses) on other equity interests: 5 (89) 107<br />
Net gains (losses) from disposal 40 – 108<br />
Impairments (35) (89) (1)<br />
Total net gains (losses) on financial assets available for sale 201 (403) 666<br />
09 –<br />
Other Income<br />
The following are the components of other income.<br />
in € m. 2010 2009 2008<br />
Other income:<br />
Net income (loss) from investment properties (3) (117) 8<br />
Net gains (losses) on disposal of investment properties 5 (2) –<br />
Net gains (losses) on disposal of consolidated subsidiaries 18 61 85<br />
Net gains (losses) on disposal of loans (87) 2 50<br />
Insurance premiums 1,2 252 129 308<br />
Remaining other income 3 579 (256) 248<br />
Total other income 764 (183) 699<br />
1 Net of reinsurance premiums paid. The development is primarily driven by Abbey Life Assurance Company Limited.<br />
2 Includes the impact of a change in presentation of longevity insurance and reinsurance contracts. In 2010, this change in presentation resulted in a transfer of<br />
€ 117 million of expenses from Other income to Policyholder benefits and claims.<br />
3 The increase from 2009 to 2010 in remaining other income was mainly driven by significantly lower impairments on The Cosmopolitan of Las Vegas property in 2010,<br />
higher results from derivatives qualifying for hedge accounting and a gain representing negative goodwill related to the commercial banking activities acquired from<br />
ABN AMRO in the Netherlands. The decrease from 2008 to 2009 in remaining other income was primarily driven by an impairment charge of € 575 million on The<br />
Cosmopolitan of Las Vegas recorded in 2009.
<strong>Deutsche</strong> <strong>Bank</strong> 02 – Consolidated Financial Statements 232<br />
Financial <strong>Report</strong> 2010 Notes to the Consolidated Income Statement<br />
11 – Earnings per Common Share<br />
10 –<br />
General and Administrative Expenses<br />
The following are the components of general and administrative expenses.<br />
in € m. 2010 2009 2008<br />
General and administrative expenses:<br />
IT costs 2,274 1,759 1,818<br />
Occupancy, furniture and equipment expenses 1,665 1,457 1,434<br />
Professional service fees 1,616 1,088 1,164<br />
Communication and data services 785 672 698<br />
Travel and representation expenses 558 408 504<br />
Payment, clearing and custodian services 418 406 415<br />
Marketing expenses 341 278 373<br />
Other expenses 2,476 2,334 1,933<br />
Total general and administrative expenses 10,133 8,402 8,339<br />
Other expenses include, among other items, regulatory and insurance related costs, other taxes, costs for<br />
consolidated investments, operational losses and other non-compensation staff related expenses.<br />
In 2010, other expenses included higher regulatory fees and higher operating costs related to our consolidated<br />
investments, particularly The Cosmopolitan of Las Vegas, which commenced operations in December 2010.<br />
In 2009, other expenses included charges of € 316 million from a legal settlement with Huntsman Corp. and of<br />
€ 200 million related to the Group’s offer to repurchase certain products from private investors.<br />
11 –<br />
Earnings per Common Share<br />
Basic earnings per common share amounts are computed by dividing net income (loss) attributable to <strong>Deutsche</strong><br />
<strong>Bank</strong> shareholders by the average number of common shares outstanding during the year. The average number<br />
of common shares outstanding is defined as the average number of common shares issued, reduced by the<br />
average number of shares in treasury and by the average number of shares that will be acquired under<br />
physically-settled forward purchase contracts, and increased by undistributed vested shares awarded under<br />
deferred share plans.<br />
Diluted earnings per share assumes the conversion into common shares of outstanding securities or other<br />
contracts to issue common stock, such as share options, convertible debt, unvested deferred share awards<br />
and forward contracts. The aforementioned instruments are only included in the calculation of diluted earnings<br />
per share if they are dilutive in the respective reporting period.
<strong>Deutsche</strong> <strong>Bank</strong> 02 – Consolidated Financial Statements 233<br />
Financial <strong>Report</strong> 2010 Notes to the Consolidated Income Statement<br />
11 – Earnings per Common Share<br />
In December 2008, the Group decided to amend existing forward purchase contracts covering 33.6 million<br />
<strong>Deutsche</strong> <strong>Bank</strong> common shares from physical to net-cash settlement and these instruments are no longer<br />
included in the computation of basic and diluted earnings per share.<br />
The following table presents the computation of basic and diluted earnings per share for the years ended<br />
December 31, 2010, 2009 and 2008, respectively.<br />
in € m. 2010 2009 2008<br />
Net income (loss) attributable to <strong>Deutsche</strong> <strong>Bank</strong> shareholders –<br />
numerator for basic earnings per share 2,310 4,973 (3,835)<br />
Effect of dilutive securities:<br />
Forwards and options – – –<br />
Convertible debt 3 2 (1)<br />
Net income (loss) attributable to <strong>Deutsche</strong> <strong>Bank</strong> shareholders after assumed<br />
conversions – numerator for diluted earnings per share 2,313 4,975 (3,836)<br />
Number of shares in m.<br />
Weighted-average shares outstanding – denominator for basic earnings per share 753.3 689.4 558.5<br />
Effect of dilutive securities:<br />
Forwards 0.0 0.0 0.0<br />
Employee stock compensation options 0.0 0.1 0.0<br />
Convertible debt 2.1 0.7 0.1<br />
Deferred shares 35.4 26.4 0.0<br />
Other (including trading options) 0.0 0.1 0.0<br />
Dilutive potential common shares 37.5 27.3 0.1<br />
Adjusted weighted-average shares after assumed conversions –<br />
denominator for diluted earnings per share 790.8 716.7 558.6<br />
in € 2010 2009 2008<br />
Basic earnings per share 3.07 7.21 (6.87)<br />
Diluted earnings per share 2.92 6.94 (6.87)<br />
On October 6, 2010, <strong>Deutsche</strong> <strong>Bank</strong> AG completed a capital increase with subscription rights. As the subscription<br />
price of the new shares was lower than the market price of the existing shares, the capital increase included a<br />
bonus element. According to IAS 33, the bonus element is the result of an implicit change in the number of<br />
shares outstanding for all periods prior to the capital increase without a fully proportionate change in resources.<br />
As a consequence, the weighted average number of shares outstanding has been adjusted retrospectively for<br />
all periods before October 6, 2010.<br />
Due to the net loss situation, potentially dilutive instruments were generally not considered for the calculation<br />
of diluted earnings per share for the year ended December 31, 2008, because to do so would have been antidilutive.<br />
Under a net income situation however, the number of adjusted weighted-average shares after assumed<br />
conversions for the year ended December 31, 2008 would have increased by 31.2 million shares.
<strong>Deutsche</strong> <strong>Bank</strong> 02 – Consolidated Financial Statements 234<br />
Financial <strong>Report</strong> 2010 Notes to the Consolidated Income Statement<br />
11 – Earnings per Common Share<br />
As of December 31, 2010, 2009 and 2008, the following instruments were outstanding and were not included<br />
in the calculation of diluted earnings per share, because to do so would have been anti-dilutive.<br />
Number of shares in m. 2010 2009 2008<br />
Forward purchase contracts 0.0 0.0 0.0<br />
Put options sold 0.0 0.0 0.1<br />
Call options sold 0.0 0.0 0.3<br />
Employee stock compensation options 0.4 0.3 1.8<br />
Deferred shares 0.0 0.0 26.9
<strong>Deutsche</strong> <strong>Bank</strong> 02 – Consolidated Financial Statements 235<br />
Financial <strong>Report</strong> 2010 Notes to the Consolidated Balance Sheet<br />
12 – Financial Assets/Liabilities at Fair Value through Profit or Loss<br />
Notes to the Consolidated Balance Sheet<br />
12 –<br />
Financial Assets/Liabilities at Fair Value through Profit or Loss<br />
The following are the components of financial assets and liabilities at fair value through profit or loss.<br />
in € m. Dec 31, 2010 Dec 31, 2009<br />
Trading assets:<br />
Trading securities 238,283 206,710<br />
Other trading assets 1 33,008 28,200<br />
Total trading assets 271,291 234,910<br />
Positive market values from derivative financial instruments 657,780 596,410<br />
Financial assets designated at fair value through profit or loss:<br />
Securities purchased under resale agreements 108,912 89,977<br />
Securities borrowed 27,887 19,987<br />
Loans 23,254 2 12,964<br />
Other financial assets designated at fair value through profit or loss 11,873 11,072<br />
Total financial assets designated at fair value through profit or loss 171,926 134,000<br />
Total financial assets at fair value through profit or loss 1,100,997 965,320<br />
1 Includes traded loans of € 23,080 million and € 21,847 million at December 31, 2010 and 2009 respectively.<br />
2 Includes € 8 billion of Postbank loans designated at fair value through the profit or loss.<br />
in € m. Dec 31, 2010 Dec 31, 2009<br />
Trading liabilities:<br />
Trading securities 65,183 62,402<br />
Other trading liabilities 3,676 2,099<br />
Total trading liabilities 68,859 64,501<br />
Negative market values from derivative financial instruments 647,171 576,973<br />
Financial liabilities designated at fair value through profit or loss:<br />
Securities sold under repurchase agreements 107,999 52,795<br />
Loan commitments 572 447<br />
Long-term debt 15,280 15,395<br />
Other financial liabilities designated at fair value through profit or loss 6,303 4,885<br />
Total financial liabilities designated at fair value through profit or loss 130,154 73,522<br />
Investment contract liabilities 1 7,898 7,278<br />
Total financial liabilities at fair value through profit or loss 854,082 722,274<br />
1 These are investment contracts where the policy terms and conditions result in their redemption value equaling fair value. See Note 39 “Insurance and Investment<br />
Contracts”, for more detail on these contracts.<br />
Loans and Loan Commitments designated at Fair Value through Profit or Loss<br />
The Group has designated various lending relationships at fair value through profit or loss. Lending facilities<br />
consist of drawn loan assets and undrawn irrevocable loan commitments. The maximum exposure to credit<br />
risk on a drawn loan is its fair value. The Group’s maximum exposure to credit risk on drawn loans, including<br />
securities purchased under resale agreements and securities borrowed, was € 160 billion and € 123 billion as<br />
of December 31, 2010, and 2009, respectively. Exposure to credit risk also exists for undrawn irrevocable loan<br />
commitments.
<strong>Deutsche</strong> <strong>Bank</strong> 02 – Consolidated Financial Statements 236<br />
Financial <strong>Report</strong> 2010 Notes to the Consolidated Balance Sheet<br />
12 – Financial Assets/Liabilities at Fair Value through Profit or Loss<br />
The credit risk on the securities purchased under resale agreements and securities borrowed designated under<br />
the fair value option was € 136.8 billion and € 110.0 billion at December 31, 2010 and December 31, 2009<br />
respectively, this credit risk is mitigated by the holding of collateral. The valuation of these instruments takes<br />
into account the credit enhancement in the form of the collateral received. As such there is no material movement<br />
during the year or cumulatively due to movements in counterparty credit risk on these instruments. The credit<br />
risk on the loans designated under the fair value option of € 23.3 billion and € 13.0 billion as of December 31,<br />
2010 and 2009, respectively, is mitigated in a number of ways. The majority of the drawn loan balance is mitigated<br />
through the purchase of credit default swaps, the remainder is mitigated by the holding of collateral.<br />
The valuation of collateralized loans takes into account the credit enhancement received. Where the instruments<br />
are over-collateralized there is no material movement in valuation during the year or cumulatively due to<br />
movements in counterparty credit risk, rather the fair value movement of the instruments is due to market risk<br />
movements in the value of the collateral and interest rates.<br />
Of the total drawn and undrawn lending facilities designated at fair value, the Group managed counterparty<br />
credit risk by purchasing credit default swap protection on facilities with a notional value of € 57.3 billion and<br />
€ 50.9 billion as of December 31, 2010, and 2009, respectively. The notional value of credit derivatives used<br />
specifically to mitigate the exposure to credit risk on these drawn loans and undrawn irrevocable loan<br />
commitments designated at fair value was € 38.0 billion and € 34.7 billion as of December 31, 2010, and 2009,<br />
respectively.<br />
The changes in fair value attributable to movements in counterparty credit risk for instruments held at the<br />
reporting date are detailed in the table below.<br />
in € m. Loans<br />
Dec 31, 2010 Dec 31, 2009 1<br />
Loan<br />
commitments Loans<br />
Loan<br />
commitments<br />
Changes in fair value of loans and loan commitments<br />
due to credit risk<br />
Cumulative change in the fair value 3 490 143 66<br />
<strong>Annual</strong> change in the fair value in 2010/2009 – 394 938 1,703<br />
Changes in fair value of credit derivatives specifically used to<br />
mitigate credit risk<br />
Cumulative change in the fair value (9) (151) (47) (82)<br />
<strong>Annual</strong> change in the fair value in 2010/2009 (27) (230) (1,250) (1,470)<br />
1 Prior year amounts have been adjusted.
<strong>Deutsche</strong> <strong>Bank</strong> 02 – Consolidated Financial Statements 237<br />
Financial <strong>Report</strong> 2010 Notes to the Consolidated Balance Sheet<br />
12 – Financial Assets/Liabilities at Fair Value through Profit or Loss<br />
The change in fair value of the loans and loan commitments attributable to movements in the counterparty’s<br />
credit risk is determined as the amount of change in its fair value that is not attributable to changes in market<br />
conditions that give rise to market risk. For collateralized loans, including securities purchased under resale<br />
agreements and securities borrowed, the collateral received acts to mitigate the counterparty credit risk. The<br />
fair value movement due to counterparty credit risk on securities purchased under resale agreements was not<br />
material due to the credit enhancement received.<br />
Financial Liabilities designated at Fair Value through Profit or Loss<br />
The fair value of a financial liability incorporates the credit risk of that financial liability. The changes in fair value<br />
of financial liabilities designated at fair value through profit or loss in issue at the year-end attributable to<br />
movements in the Group’s credit risk are detailed in the table below. The changes in the fair value of financial<br />
liabilities designated at fair value through profit or loss issued by consolidated SPEs have been excluded as<br />
this is not related to the Group’s credit risk but to that of the legally isolated SPE, which is dependent on the<br />
collateral it holds.<br />
in € m. Dec 31, 2010 Dec 31, 2009<br />
Cumulative change in the fair value 76 30<br />
<strong>Annual</strong> change in the fair value in 2010/2009 43 (264)<br />
The fair value of the debt issued takes into account the credit risk of the Group. Where the instrument is quoted<br />
in an active market, the movement in fair value due to credit risk is calculated as the amount of change in fair<br />
value that is not attributable to changes in market conditions that give rise to market risk. Where the instrument<br />
is not quoted in an active market, the fair value is calculated using a valuation technique that incorporates credit<br />
risk by discounting the contractual cash flows on the debt using a credit-adjusted yield curve which reflects the<br />
level at which the Group could issue similar instruments at the reporting date.<br />
The credit risk on undrawn irrevocable loan commitments is predominantly counterparty credit risk. The change<br />
in fair value due to counterparty credit risk on undrawn irrevocable loan commitments has been disclosed with<br />
the counterparty credit risk on the drawn loans.<br />
For all financial liabilities designated at fair value through profit or loss the amount that the Group would<br />
contractually be required to pay at maturity was € 23.7 billion and € 36.8 billion more than the carrying amount<br />
as of December 31, 2010 and 2009, respectively. The amount contractually required to pay at maturity assumes<br />
the liability is extinguished at the earliest contractual maturity that the Group can be required to repay. When<br />
the amount payable is not fixed, the amount the Group would contractually be required to pay is determined by<br />
reference to the conditions existing at the reporting date.
<strong>Deutsche</strong> <strong>Bank</strong> 02 – Consolidated Financial Statements 238<br />
Financial <strong>Report</strong> 2010 Notes to the Consolidated Balance Sheet<br />
13 – Amendments to IAS 39 and IFRS 7, “Reclassification of Financial Assets”<br />
The majority of the difference between the fair value of financial liabilities designated at fair value through profit<br />
or loss and the contractual cash flows which will occur at maturity is attributable to undrawn loan commitments<br />
where the contractual cash flow at maturity assumes full drawdown of the facility. The difference between the<br />
fair value and the contractual amount repayable at maturity excluding the amount of undrawn loan commitments<br />
designated at fair value through profit or loss was € 0.6 billion and € 0.6 billion as of December 31, 2010, and<br />
2009, respectively.<br />
13 –<br />
Amendments to IAS 39 and IFRS 7, “Reclassification of Financial Assets”<br />
Under the amendments to IAS 39 and IFRS 7 certain financial assets were reclassified in the second half of<br />
2008 and the first quarter of 2009 from the financial assets at fair value through profit or loss and the available<br />
for sale classifications into the loans classification. Assets were reclassified at the fair value as of the effective<br />
date of their reclassification. No reclassifications were made during 2010. The reclassifications were made in<br />
instances where management believed that the expected repayment of the assets exceeded their estimated<br />
fair values, which reflected the significantly reduced liquidity in the financial markets, and that returns on these<br />
assets would be optimized by holding them for the foreseeable future. Where this clear change of intent existed<br />
and was supported by an ability to hold and fund the underlying positions, the Group concluded that the<br />
reclassifications aligned the accounting more closely with the business intent.<br />
The following table details the carrying values, unrealized fair value losses in accumulated other comprehensive<br />
income, ranges of effective interest rates based on weighted average rates by business and expected<br />
recoverable cash flows estimated at reclassification date.<br />
in € bn.<br />
(unless stated otherwise)<br />
Trading assets<br />
reclassified to<br />
loans<br />
Financial assets<br />
available for sale<br />
reclassified to<br />
loans<br />
Carrying value at reclassification date 26.6 11.4<br />
Unrealized fair value losses in accumulated other comprehensive income – (1.1)<br />
Effective interest rates at reclassification date:<br />
upper range 13.1 % 9.9 %<br />
lower range 2.8 % 3.9 %<br />
Expected recoverable cash flows at reclassification date 39.6 17.6
<strong>Deutsche</strong> <strong>Bank</strong> 02 – Consolidated Financial Statements 239<br />
Financial <strong>Report</strong> 2010 Notes to the Consolidated Balance Sheet<br />
13 – Amendments to IAS 39 and IFRS 7, “Reclassification of Financial Assets”<br />
The following table shows carrying values and fair values as of December 31, 2010 and December 31, 2009 of<br />
the assets reclassified in 2008 and 2009.<br />
Dec 31, 2010 Dec 31, 2009<br />
in € m. Carrying value Fair value Carrying value Fair Value<br />
Trading assets reclassified to loans 17,998 15,903 24,287 21,552<br />
Financial assets available for sale reclassified to loans 8,684 7,805 9,267 8,290<br />
Total financial assets reclassified to loans 26,682 23,708 33,554 29,842<br />
The unrealized fair value gains (losses) that would have been recognized in profit or loss and the net gains<br />
(losses) that would have been recognized in other comprehensive income if the reclassifications had not been<br />
made are shown in the table below.<br />
in € m. 2010 2009 2008 1<br />
Unrealized fair value gains (losses) on the reclassified trading assets,<br />
gross of provisions for credit losses 120 (884) (3,230)<br />
Impairment losses on the reclassified financial assets available for sale which were<br />
impaired (7) (9) (209)<br />
Net gains (losses) recognized in other comprehensive income representing additional<br />
unrealized fair value gains (losses) on the reclassified financial assets available for<br />
sale which were not impaired 251 1,147 (1,826)<br />
1 Reclassifications were made from July 1, 2008 and so the 2008 balances represent a six month period.<br />
After reclassification, the pre-tax contribution of all reclassified assets to the income statement was as follows.<br />
in € m. 2010 2009 2008 1<br />
Interest income 1,154 1,368 659<br />
Provision for credit losses (278) (1,047) (166)<br />
Other income 2 1 – –<br />
Income before income taxes on reclassified trading assets 877 321 493<br />
Interest income 146 227 258<br />
Provision for credit losses – (205) (91)<br />
Other income 2 (1) – –<br />
Income before income taxes on reclassified financial assets available for sale 145 22 167<br />
1 Reclassifications were made from July 1, 2008 and so the 2008 balances represent a six month period.<br />
2 The net loss on sale of loans which have settled in 2010 was € 3 million. The net amount comprises a loss of € 3 million in provision for credit losses and no net gain<br />
or loss in other income.<br />
Prior to their reclassification, assets reclassified in 2009 contributed fair value losses of € 252 million to the<br />
income statement for the year ended December 31, 2008 and fair value losses of € 48 million to the income<br />
statement for the year ended December 31, 2009.
<strong>Deutsche</strong> <strong>Bank</strong> 02 – Consolidated Financial Statements 240<br />
Financial <strong>Report</strong> 2010 Notes to the Consolidated Balance Sheet<br />
14 – Financial Instruments carried at Fair Value<br />
Prior to their reclassification, assets reclassified from trading in 2008 contributed fair value losses of € 1.8 billion<br />
to the income statement for the year ended December 31, 2008. Assets reclassified from available for sale<br />
during 2008 contributed, prior to their reclassification, impairment charges of € 174 million to the income<br />
statement and additional unrealized losses of € 736 million to the consolidated statement of comprehensive<br />
income for the year ended December 31, 2008.<br />
14 –<br />
Financial Instruments carried at Fair Value<br />
Valuation Methods and Control<br />
The Group has an established valuation control framework which governs internal control standards,<br />
methodologies, and procedures over the valuation process.<br />
Prices Quoted in Active Markets: The fair value of instruments that are quoted in active markets are determined<br />
using the quoted prices where they represent those at which regularly and recently occurring transactions take<br />
place.<br />
Valuation Techniques: The Group uses valuation techniques to establish the fair value of instruments where<br />
prices, quoted in active markets, are not available. Valuation techniques used for financial instruments include<br />
modeling techniques, the use of indicative quotes for proxy instruments, quotes from less recent and less regular<br />
transactions and broker quotes.<br />
For some financial instruments a rate or other parameter, rather than a price, is quoted. Where this is the case<br />
then the market rate or parameter is used as an input to a valuation model to determine fair value. For some<br />
instruments, modeling techniques follow industry standard models for example, discounted cash flow analysis<br />
and standard option pricing models. These models are dependent upon estimated future cash flows, discount<br />
factors and volatility levels. For more complex or unique instruments, more sophisticated modeling techniques<br />
are required, and may rely upon assumptions or more complex parameters such as correlations, prepayment<br />
speeds, default rates and loss severity.<br />
Frequently, valuation models require multiple parameter inputs. Where possible, parameter inputs are based<br />
on observable data or are derived from the prices of relevant instruments traded in active markets. Where<br />
observable data is not available for parameter inputs then other market information is considered. For example,<br />
indicative broker quotes and consensus pricing information is used to support parameter inputs where they are<br />
available. Where no observable information is available to support parameter inputs then they are based on<br />
other relevant sources of information such as prices for similar transactions, historic data, economic fundamentals,<br />
and research information, with appropriate adjustment to reflect the terms of the actual instrument being valued<br />
and current market conditions.
<strong>Deutsche</strong> <strong>Bank</strong> 02 – Consolidated Financial Statements 241<br />
Financial <strong>Report</strong> 2010 Notes to the Consolidated Balance Sheet<br />
14 – Financial Instruments carried at Fair Value<br />
Valuation Adjustments: Valuation adjustments are an integral part of the valuation process. In making appropriate<br />
valuation adjustments, the Group follows methodologies that consider factors such as bid/offer spreads, liquidity<br />
and counterparty credit risk. Bid/offer spread valuation adjustments are required to adjust mid market valuations<br />
to the appropriate bid or offer valuation. The bid or offer valuation is the best representation of the fair value for<br />
an instrument, and therefore its fair value. The carrying value of a long position is adjusted from mid to bid, and<br />
the carrying value of a short position is adjusted from mid to offer. Bid/offer valuation adjustments are determined<br />
from bid-offer prices observed in relevant trading activity and in quotes from other broker-dealers or other<br />
knowledgeable counterparties. Where the quoted price for the instrument is already a bid/offer price then no<br />
bid/offer valuation adjustment is necessary. Where the fair value of financial instruments is derived from a modeling<br />
technique then the parameter inputs into that model are normally at a mid-market level. Such instruments are<br />
generally managed on a portfolio basis and valuation adjustments are taken to reflect the cost of closing out the<br />
net exposure the <strong>Bank</strong> has to each of the input parameters. These adjustments are determined from bid-offer<br />
prices observed in relevant trading activity and quotes from other broker-dealers.<br />
Where complex valuation models are used, or where less-liquid positions are being valued, then bid/offer levels<br />
for those positions may not be available directly from the market, and therefore the close-out cost of these<br />
positions, models and parameters must be estimated. When these adjustments are designed, the Group closely<br />
examines the valuation risks associated with the model as well as the positions themselves, and the resulting<br />
adjustments are closely monitored on an ongoing basis.<br />
Counterparty credit valuation adjustments are required to cover expected credit losses to the extent that the<br />
valuation technique does not already include an expected credit loss factor. For example, a valuation adjustment<br />
is required to cover expected credit losses on over-the-counter derivatives which are typically not reflected in<br />
mid-market or bid/offer quotes. The adjustment amount is determined at each reporting date by assessing the<br />
potential credit exposure to all counterparties taking into account any collateral held, the effect of any master<br />
netting agreements, expected loss given default and the credit risk for each counterparty based on market<br />
evidence, which may include historic default levels, fundamental analysis of financial information, and CDS<br />
spreads.<br />
Similarly, in establishing the fair value of derivative liabilities the Group considers its own creditworthiness on<br />
derivatives by assessing all counterparties potential future exposure to the Group, taking into account any<br />
collateral held, the effect of any master netting agreements, expected loss given default and the credit risk of<br />
the Group based on historic default levels of entities of the same credit quality. The impact of this valuation<br />
adjustment was that an insignificant gain was recognized for the year ended December 31, 2010.
<strong>Deutsche</strong> <strong>Bank</strong> 02 – Consolidated Financial Statements 242<br />
Financial <strong>Report</strong> 2010 Notes to the Consolidated Balance Sheet<br />
14 – Financial Instruments carried at Fair Value<br />
Where there is uncertainty in the assumptions used within a modeling technique, an additional adjustment is<br />
taken to calibrate the model price to the expected market price of the financial instrument. Typically, such<br />
transactions have bid-offer levels which are less-observable, and these adjustments aim to estimate the bid-offer<br />
by computing the risk-premium associated with the transaction. Where a financial instrument is part of a group<br />
of transactions risk managed on a portfolio basis, but where the trade itself is of sufficient complexity that the<br />
cost of closing it out would be higher than the cost of closing out its component risks, then an additional<br />
adjustment is taken to reflect this fact.<br />
Validation and Control: The Group has an independent specialist valuation group within the Finance function<br />
which oversees and develops the valuation control framework and manages the valuation control processes.<br />
The mandate of this specialist function includes the performance of the valuation control process for the complex<br />
derivative businesses as well as the continued development of valuation control methodologies and the valuation<br />
policy framework. Results of the valuation control process are collected and analyzed as part of a standard<br />
monthly reporting cycle. Variances of differences outside of preset and approved tolerance levels are escalated<br />
both within the Finance function and with Senior Business Management for review, resolution and, if required,<br />
adjustment.<br />
For instruments where fair value is determined from valuation models, the assumptions and techniques used<br />
within the models are independently validated by an independent specialist model validation group that is part<br />
of the Group’s Risk Management function.<br />
Quotes for transactions and parameter inputs are obtained from a number of third party sources including<br />
exchanges, pricing service providers, firm broker quotes and consensus pricing services. Price sources are<br />
examined and assessed to determine the quality of fair value information they represent, with greater emphasis<br />
given to those possessing greater valuation certainty and relevance. The results are compared against actual<br />
transactions in the market to ensure the model valuations are calibrated to market prices.<br />
Price and parameter inputs to models, assumptions and valuation adjustments are verified against independent<br />
sources. Where they cannot be verified to independent sources due to lack of observable information, the<br />
estimate of fair value is subject to procedures to assess its reasonableness. Such procedures include performing<br />
revaluation using independently generated models (including where existing models are independently<br />
recalibrated), assessing the valuations against appropriate proxy instruments and other benchmarks, and<br />
performing extrapolation techniques. Assessment is made as to whether the valuation techniques yield fair<br />
value estimates that are reflective of market levels by calibrating the results of the valuation models against<br />
market transactions where possible.
<strong>Deutsche</strong> <strong>Bank</strong> 02 – Consolidated Financial Statements 243<br />
Financial <strong>Report</strong> 2010 Notes to the Consolidated Balance Sheet<br />
14 – Financial Instruments carried at Fair Value<br />
Management Judgment: In reaching estimates of fair value management judgment needs to be exercised. The<br />
areas requiring significant management judgment are identified, documented and reported to senior management<br />
as part of the valuation control framework and the standard monthly reporting cycle. The specialist model<br />
validation and valuation groups focus attention on the areas of subjectivity and judgment.<br />
The level of management judgment required in establishing fair value of financial instruments for which there is<br />
a quoted price in an active market is usually minimal. Similarly there is little subjectivity or judgment required<br />
for instruments valued using valuation models which are standard across the industry and where all parameter<br />
inputs are quoted in active markets.<br />
The level of subjectivity and degree of management judgment required is more significant for those instruments<br />
valued using specialized and sophisticated models and where some or all of the parameter inputs are not<br />
observable. Management judgment is required in the selection and application of appropriate parameters,<br />
assumptions and modeling techniques. In particular, where data is obtained from infrequent market transactions<br />
then extrapolation and interpolation techniques must be applied. In addition, where no market data is available<br />
then parameter inputs are determined by assessing other relevant sources of information such as historical<br />
data, fundamental analysis of the economics of the transaction and proxy information from similar transactions<br />
and making appropriate adjustment to reflect the actual instrument being valued and current market conditions.<br />
Where different valuation techniques indicate a range of possible fair values for an instrument then management<br />
has to establish what point within the range of estimates best represents the fair value. Further, some valuation<br />
adjustments may require the exercise of management judgment to ensure they achieve fair value.<br />
Fair Value Hierarchy<br />
The financial instruments carried at fair value have been categorized under the three levels of the IFRS fair value<br />
hierarchy as follows:<br />
Level 1 – Instruments valued using quoted prices in active markets: These are instruments where the fair value<br />
can be determined directly from prices which are quoted in active, liquid markets and where the instrument<br />
observed in the market is representative of that being priced in the Group’s inventory.<br />
These instruments include: high-liquidity treasuries and derivative, equity and cash products traded on highliquidity<br />
exchanges.<br />
Level 2 – Instruments valued with valuation techniques using observable market data: These are instruments<br />
where the fair value can be determined by reference to similar instruments trading in active markets, or where<br />
a technique is used to derive the valuation but where all inputs to that technique are observable.
<strong>Deutsche</strong> <strong>Bank</strong> 02 – Consolidated Financial Statements 244<br />
Financial <strong>Report</strong> 2010 Notes to the Consolidated Balance Sheet<br />
14 – Financial Instruments carried at Fair Value<br />
These instruments include: many OTC (over the counter) derivatives; many investment-grade listed credit bonds;<br />
some CDS’s (credit default swaps); many CDO’s (collateralized debt obligations); and many less-liquid equities.<br />
Level 3 – Instruments valued using valuation techniques using market data which is not directly observable:<br />
These are instruments where the fair value cannot be determined directly by reference to market-observable<br />
information, and some other pricing technique must be employed. Instruments classified in this category have<br />
an element which is unobservable and which has a significant impact on the fair value.<br />
These instruments include: more-complex OTC derivatives; distressed debt; highly-structured bonds; illiquid<br />
ABS (asset-backed securities, including some referencing residential mortgages); illiquid CDO’s (cash and<br />
synthetic); monoline exposures; private equity placements; many CRE (commercial real-estate) loans; illiquid<br />
loans; and some municipal bonds.<br />
The following table presents the carrying value of the financial instruments held at fair value across the three<br />
levels of the fair value hierarchy. Amounts in this table are generally presented on a gross basis, in line with the<br />
Group’s accounting policy regarding offsetting of financial instruments, as described in Note 01 “Significant<br />
Accounting Policies”.<br />
in € m.<br />
Quoted<br />
prices in<br />
active market<br />
(Level 1)<br />
Valuation<br />
technique<br />
observable<br />
parameters<br />
(Level 2)<br />
Dec 31, 2010 Dec 31, 2009<br />
Valuation<br />
technique<br />
unobservable<br />
parameters<br />
(Level 3)<br />
Quoted<br />
prices in<br />
active market<br />
(Level 1)<br />
Valuation<br />
technique<br />
observable<br />
parameters<br />
(Level 2)<br />
Valuation<br />
technique<br />
unobservable<br />
parameters<br />
(Level 3)<br />
Financial assets held at fair value:<br />
Trading securities 96,828 126,594 14,861 84,833 106,268 15,609<br />
Positive market values from derivative<br />
financial instruments 14,976 624,961 17,843 19,684 551,514 25,211<br />
Other trading assets 692 26,249 6,067 456 16,963 10,782<br />
Financial assets designated at fair value<br />
through profit or loss 7,674 160,966 3,286 5,698 124,892 3,410<br />
Financial assets available for sale 17,186 31,858 5,222 10,789 4,863 3,167<br />
Other financial assets at fair value 1 – 8,504 (623) – 7,014 41<br />
Total financial assets held at fair value 137,356 979,132 46,656 121,460 811,514 58,220<br />
Financial liabilities held at fair value:<br />
Trading securities 43,967 20,966 251 43,182 18,787 431<br />
Negative market values from derivative<br />
financial instruments 12,379 623,876 10,916 18,699 542,683 15,591<br />
Other trading liabilities 1 3,669 5 1 1,817 283<br />
Financial liabilities designated at fair value<br />
through profit or loss 348 127,736 2,070 177 70,724 2,621<br />
Investment contract liabilities 2 – 7,898 – – 7,278 –<br />
Other financial liabilities at fair value 1 – 6,526 (239) – 2,698 (757)<br />
Total financial liabilities held at fair value 56,695 790,671 13,003 62,059 643,987 18,169<br />
1 Derivatives which are embedded in contracts where the host contract is not held at fair value through the profit or loss but for which the embedded derivative is<br />
separated are presented within other financial assets/liabilities at fair value for the purposes of this disclosure. The separated embedded derivatives may have a<br />
positive or a negative fair value but have been presented in this table to be consistent with the classification of the host contract. The separated embedded derivatives<br />
are held at fair value on a recurring basis and have been split between the fair value hierarchy classifications.<br />
2 These are investment contracts where the policy terms and conditions result in their redemption value equaling fair value. See Note 39 “Insurance and Investment<br />
Contracts” for more detail on these contracts.
<strong>Deutsche</strong> <strong>Bank</strong> 02 – Consolidated Financial Statements 245<br />
Financial <strong>Report</strong> 2010 Notes to the Consolidated Balance Sheet<br />
14 – Financial Instruments carried at Fair Value<br />
There have been no significant transfers of instruments between level 1 and level 2 of the fair value hierarchy.<br />
Valuation Techniques<br />
The following is an explanation of the valuation techniques used in establishing the fair value of the different<br />
types of financial instruments that the Group trades.<br />
Sovereign, Quasi-sovereign and Corporate Debt and Equity Securities: Where there are no recent transactions<br />
then fair value may be determined from the last market price adjusted for all changes in risks and information<br />
since that date. Where a close proxy instrument is quoted in an active market then fair value is determined by<br />
adjusting the proxy value for differences in the risk profile of the instruments. Where close proxies are not<br />
available then fair value is estimated using more complex modeling techniques. These techniques include<br />
discounted cash flow models using current market rates for credit, interest, liquidity and other risks. For equity<br />
securities modeling techniques may also include those based on earnings multiples.<br />
Mortgage and Other Asset Backed Securities (“ABS”): These instruments include residential and commercial<br />
mortgage backed securities and other asset backed securities including collateralized debt obligations (CDO).<br />
Asset backed securities have specific characteristics as they have different underlying assets and the issuing<br />
entities have different capital structures. The complexity increases further where the underlying assets are<br />
themselves asset backed securities, as is the case with many of the CDO instruments.<br />
Where no reliable external pricing is available, ABS are valued, where applicable, using either relative value<br />
analysis which is performed based on similar transactions observable in the market, or industry-standard<br />
valuation models incorporating available observable inputs. The industry standard external models calculate<br />
principal and interest payments for a given deal based on assumptions that can be independently price tested.<br />
The inputs include prepayment speeds, loss assumptions (timing and severity) and a discount rate (spread,<br />
yield or discount margin). These inputs/assumptions are derived from actual transactions, external market<br />
research and market indices where appropriate.<br />
Loans: For certain loans fair value may be determined from the market price on a recently occurring transaction<br />
adjusted for all changes in risks and information since that transaction date. Where there are no recent market<br />
transactions then broker quotes, consensus pricing, proxy instruments or discounted cash flow models are used<br />
to determine fair value. Discounted cash flow models incorporate parameter inputs for credit risk, interest rate<br />
risk, foreign exchange risk, loss given default estimates and amounts utilized given default, as appropriate. Credit<br />
risk, loss given default and utilization given default parameters are determined using information from the loan<br />
or CDS markets, where available and appropriate.
<strong>Deutsche</strong> <strong>Bank</strong> 02 – Consolidated Financial Statements 246<br />
Financial <strong>Report</strong> 2010 Notes to the Consolidated Balance Sheet<br />
14 – Financial Instruments carried at Fair Value<br />
Leveraged loans can have transaction-specific characteristics which can limit the relevance of market-observed<br />
transactions. Where similar transactions exist for which observable quotes are available from external pricing<br />
services then this information is used with appropriate adjustments to reflect the transaction differences. When<br />
no similar transactions exist, a discounted cash flow valuation technique is used with credit spreads derived<br />
from the appropriate leveraged loan index, incorporating the industry classification, subordination of the loan,<br />
and any other relevant information on the loan and loan counterparty.<br />
Over-The-Counter (OTC) Derivative Financial Instruments: Market standard transactions in liquid trading markets,<br />
such as interest rate swaps, foreign exchange forward and option contracts in G7 currencies, and equity swap<br />
and option contracts on listed securities or indices are valued using market standard models and quoted parameter<br />
inputs. Parameter inputs are obtained from pricing services, consensus pricing services and recently occurring<br />
transactions in active markets wherever possible.<br />
More complex instruments are modeled using more sophisticated modeling techniques specific for the instrument<br />
and are calibrated to available market prices. Where the model output value does not calibrate to a relevant<br />
market reference then valuation adjustments are made to the model output value to adjust for any difference.<br />
In less active markets, data is obtained from less frequent market transactions, broker quotes and through<br />
extrapolation and interpolation techniques. Where observable prices or inputs are not available, management<br />
judgment is required to determine fair values by assessing other relevant sources of information such as<br />
historical data, fundamental analysis of the economics of the transaction and proxy information from similar<br />
transactions.<br />
Financial Liabilities Designated at Fair Value through Profit or Loss under the Fair Value Option: The fair value<br />
of financial liabilities designated at fair value through profit or loss under the fair value option incorporates all<br />
market risk factors including a measure of the Group’s credit risk relevant for that financial liability. The financial<br />
liabilities include structured note issuances, structured deposits, and other structured securities issued by<br />
consolidated vehicles, which may not be quoted in an active market. The fair value of these financial liabilities<br />
is determined by discounting the contractual cash flows using the relevant credit-adjusted yield curve. The<br />
market risk parameters are valued consistently to similar instruments held as assets, for example, any derivatives<br />
embedded within the structured notes are valued using the same methodology discussed in the “OTC derivative<br />
financial instruments” section above.<br />
Where the financial liabilities designated at fair value through profit or loss under the fair value option are<br />
collateralized, such as securities loaned and securities sold under repurchase agreements, the credit<br />
enhancement is factored into the fair valuation of the liability.
<strong>Deutsche</strong> <strong>Bank</strong> 02 – Consolidated Financial Statements 247<br />
Financial <strong>Report</strong> 2010 Notes to the Consolidated Balance Sheet<br />
14 – Financial Instruments carried at Fair Value<br />
Investment Contract Liabilities: Assets which are linked to the investment contract liabilities are owned by the<br />
Group. The investment contract obliges the Group to use these assets to settle these liabilities. Therefore, the<br />
fair value of investment contract liabilities is determined by the fair value of the underlying assets (i.e., amount<br />
payable on surrender of the policies).<br />
Analysis of Financial Instruments with Fair Value Derived from Valuation Techniques Containing<br />
Significant Unobservable Parameters (Level 3)<br />
The table below presents the financial instruments categorized in the third level followed by an analysis and<br />
discussion of the financial instruments so categorized. Some of the instruments in the third level of the fair value<br />
hierarchy have identical or similar offsetting exposures to the unobservable input. However, according to IFRS<br />
they are required to be presented as gross assets and liabilities in the table below.
<strong>Deutsche</strong> <strong>Bank</strong> 02 – Consolidated Financial Statements 248<br />
Financial <strong>Report</strong> 2010 Notes to the Consolidated Balance Sheet<br />
14 – Financial Instruments carried at Fair Value<br />
in € m. Dec 31, 2010 Dec 31, 2009<br />
Financial assets held at fair value:<br />
Trading securities:<br />
Sovereign and quasi-sovereign obligations 576 335<br />
Mortgage and other asset-backed securities 6,302 7,068<br />
Corporate debt securities and other debt obligations 7,406 7,444<br />
Equity securities 577 762<br />
Total trading securities 14,861 15,609<br />
Positive market values from derivative financial instruments 17,843 25,211<br />
Other trading assets 6,067 10,782<br />
Financial assets designated at fair value through profit or loss:<br />
Loans 2,740 2,905<br />
Other financial assets designated at fair value through profit or loss 546 505<br />
Total financial assets designated at fair value through profit or loss 3,286 3,410<br />
Financial assets available for sale 5,222 3,167<br />
Other financial assets at fair value (623) 41<br />
Total financial assets held at fair value 46,656 58,220<br />
Financial liabilities held at fair value:<br />
Trading securities 251 431<br />
Negative market values from derivative financial instruments 10,916 15,591<br />
Other trading liabilities 5 283<br />
Financial liabilities designated at fair value through profit or loss:<br />
Loan commitments 572 447<br />
Long-term debt 1,481 1,723<br />
Other financial liabilities designated at fair value through profit or loss 17 451<br />
Total financial liabilities designated at fair value through profit or loss 2,070 2,621<br />
Other financial liabilities at fair value (239) (757)<br />
Total financial liabilities held at fair value 13,003 18,169<br />
Trading Securities: Certain illiquid emerging market corporate bonds and illiquid highly structured corporate<br />
bonds are included in this level of the hierarchy. In addition, some of the holdings of notes issued by securitization<br />
entities, commercial and residential mortgage-backed securities, collateralized debt obligation securities and<br />
other asset-backed securities are reported here.<br />
Positive and Negative Market Values from Derivative Instruments: Derivatives categorized in this level of the<br />
fair value hierarchy are valued based on one or more significant unobservable parameters. The unobservable<br />
parameters may include certain correlations, certain longer-term volatilities, certain prepayment rates, credit<br />
spreads and other transaction-specific parameters.<br />
The following derivatives are included within this level of the hierarchy: customized CDO derivatives in which<br />
the underlying reference pool of corporate assets is not closely comparable to regularly market-traded indices;<br />
certain tranched index credit derivatives; certain options where the volatility is unobservable; certain basket<br />
options in which the correlations between the referenced underlying assets are unobservable; longer-term<br />
interest rate option derivatives; multi-currency foreign exchange derivatives; and certain credit default swaps<br />
for which the credit spread is not observable.
<strong>Deutsche</strong> <strong>Bank</strong> 02 – Consolidated Financial Statements 249<br />
Financial <strong>Report</strong> 2010 Notes to the Consolidated Balance Sheet<br />
14 – Financial Instruments carried at Fair Value<br />
During 2010, the market value of derivatives instruments in the level 3 of the hierarchy has declined primarily<br />
as a result of changes to input parameters, in particular tightening credit spreads. In addition there has been an<br />
increase in liquidity for some products which has enabled some migration to level 2 of the fair value hierarchy.<br />
Other Trading Instruments: Other trading instruments classified in level 3 of the fair value hierarchy mainly consist<br />
of traded loans valued using valuation models based on one or more significant unobservable parameters. The<br />
loan balance reported in this level of the fair value hierarchy comprises illiquid leveraged loans and illiquid<br />
residential and commercial mortgage loans. The balance was reduced in the year mainly due to migration into<br />
level 2 of the hierarchy as a result of increased observability of parameter inputs into the valuation models.<br />
Financial Assets/Liabilities designated at Fair Value through Profit or Loss: Certain corporate loans and structured<br />
liabilities which were designated at fair value through profit or loss under the fair value option are categorized in<br />
this level of the fair value hierarchy. The corporate loans are valued using valuation techniques which incorporate<br />
observable credit spreads, recovery rates and unobservable utilization parameters. Revolving loan facilities are<br />
reported in the third level of the hierarchy because the utilization in the event of the default parameter is significant<br />
and unobservable.<br />
In addition, certain hybrid debt issuances designated at fair value through profit or loss containing embedded<br />
derivatives are valued based on significant unobservable parameters. These unobservable parameters include<br />
single stock volatility correlations.<br />
Financial Assets Available for Sale: Unlisted equity instruments are reported in this level of the fair value hierarchy<br />
where there is no close proxy and the market is very illiquid. The increase in the level 3 balance during the period<br />
is predominantly due to the consolidation of Postbank.<br />
Reconciliation of financial instruments classified in Level 3<br />
The table below presents a reconciliation of financial instruments categorized in level 3 of the fair value hierarchy.<br />
Some of the instruments in level 3 of the fair value hierarchy have identical or similar offsetting exposures to<br />
the unobservable input, however; they are required to be presented as gross assets and liabilities in the table<br />
below. Further, certain instruments are hedged with instruments in level 1 or level 2 but the table below does<br />
not include the gains and losses on these hedging instruments. Additionally, both observable and unobservable<br />
parameters may be used to determine the fair value of an instrument classified within level 3 of the fair value<br />
hierarchy; the gains and losses presented below are attributable to movements in both the observable and<br />
unobservable parameters.
<strong>Deutsche</strong> <strong>Bank</strong> 02 – Consolidated Financial Statements 250<br />
Financial <strong>Report</strong> 2010 Notes to the Consolidated Balance Sheet<br />
14 – Financial Instruments carried at Fair Value<br />
Transfers in and transfers out of level 3 during the year are recorded at their fair value at the beginning of year<br />
in the table below. For instruments transferred into level 3 the table shows the gains and losses and cash flows<br />
on the instruments as if they had been transferred at the beginning of the year. Similarly for instruments<br />
transferred out of level 3 the table does not show any gains or losses or cash flows on the instruments during<br />
the year since the table is presented as if they have been transferred out at the beginning of the year.<br />
Dec 31, 2010<br />
in € m.<br />
Financial assets held at<br />
fair value:<br />
Balance,<br />
beginning of<br />
year<br />
Changes in<br />
the group of<br />
consolidated<br />
companies 1<br />
Total<br />
gains/losses 2 Purchases Sales Issuances 6<br />
Settlements 7<br />
Transfers<br />
into<br />
Level 3<br />
Transfers<br />
out of<br />
Level 3<br />
Balance,<br />
end of year<br />
Trading securities<br />
Positive market values<br />
from derivative financial<br />
15,609 6 1,437 5,479 (6,292) – (1,412) 4,299 (4,265) 14,861<br />
instruments 25,211 74 589 32 (71) – (2,997) 1,111 (6,106) 17,843<br />
Other trading assets<br />
Financial assets<br />
designated at fair value<br />
10,782 – (1) 1,439 (1,427) 173 (1,511) 424 (3,812) 6,067<br />
through profit or loss<br />
Financial assets available<br />
3,410 – (97) 294 (23) 1,627 (1,909) 54 (70) 3,286<br />
for sale 3,167 1,340 151 3 Other financial assets at<br />
1,648 (491) – (351) 881 (1,123) 5,222<br />
fair value<br />
Total financial assets held<br />
41 (623) – – – – (41) – – (623)<br />
at fair value 58,220 797 2,079 4,5 8,892 (8,304) 1,800 (8,221) 6,769 8 (15,376) 8<br />
Financial liabilities held at<br />
fair value:<br />
46,656<br />
Trading securities<br />
Negative market values<br />
from derivative financial<br />
431 – 119 – – – (182) 3 (120) 251<br />
instruments 15,591 11 2,092 – – – (1,952) 1,531 (6,357) 10,916<br />
Other trading liabilities<br />
Financial liabilities<br />
designated at fair value<br />
283 17 (271) – – – – – (24) 5<br />
through profit or loss:<br />
Other financial liabilities<br />
2,621 – 258 – – 448 (977) 180 (460) 2,070<br />
at fair value<br />
Total financial liabilities<br />
(757) – 40 – – – 32 446 – (239)<br />
held at fair value 18,169 28 2,238 4,5 – – 448 (3,079) 2,160 (6,961) 13,003<br />
1 Amounts recorded in the changes in the group of consolidated companies predominantly relate to the consolidation of Postbank at December 3, 2010.<br />
2 Total gains and losses predominantly relate to net gains (losses) on financial assets/liabilities at fair value through profit or loss reported in the consolidated statement of income. The balance<br />
also includes net gains (losses) on financial assets available for sale reported in the consolidated statement of income and unrealized net gains (losses) on financial assets available for sale<br />
and exchange rate changes reported in other comprehensive income, net of tax.<br />
3<br />
Total gains and losses on available for sale include a gain of € 21 million recognized in other comprehensive income, net of tax, and a gain of € 38 million recognized in the income statement<br />
presented in Net gains (losses) on financial assets available for sale.<br />
4 This amount includes the effect of exchange rate changes. For total financial assets held at fair value this effect is a positive € 1.3 billion and for total financial liabilities held at fair value this is<br />
a negative € 184 million. This predominately relates to derivatives. The effect of exchange rate changes is reported in other comprehensive income, net of tax.<br />
5<br />
For assets positive balances represent gains, negative balances represent losses. For liabilities positive balances represent losses, negative balances represent gains.<br />
6<br />
Issuances relate to the cash amount received on the issuance of a liability and the cash amount paid on the primary issuance of a loan to a borrower.<br />
7<br />
Settlements represent cash flows to settle the asset or liability. For debt and loan instruments this includes principal on maturity, principal amortizations and principal repayments.<br />
For derivatives all cash flows are presented in settlements.<br />
8<br />
Includes € 2.0 billion of assets which were incorrectly categorized in 2009. This has been reflected through the transfers in and transfers out column and has not impacted the prior year<br />
balance sheet or overall level 3 assets balance.
<strong>Deutsche</strong> <strong>Bank</strong> 02 – Consolidated Financial Statements 251<br />
Financial <strong>Report</strong> 2010 Notes to the Consolidated Balance Sheet<br />
14 – Financial Instruments carried at Fair Value<br />
Dec 31, 2009 Balance,<br />
in € m.<br />
Financial assets held at fair value:<br />
beginning<br />
of year<br />
Total<br />
gains/losses 1<br />
Purchases Sales Issuances 5 Settlements 6<br />
Transfers<br />
into<br />
Level 3<br />
Transfers<br />
out of<br />
Level 3<br />
Balance,<br />
end of year<br />
Trading securities<br />
Positive market values from derivative<br />
17,268 (2,304) 2,883 (5,084) – (1,570) 8,410 (3,994) 15,609<br />
financial instruments 48,792 (15,563) 7<br />
– – – (6,397) 7,510 (9,131) 25,211<br />
Other trading assets<br />
Financial assets designated at fair<br />
13,560 1,832 1,919 (3,057) 246 (3,184) 2,309 (2,843) 10,782<br />
value through profit or loss 5,805 1,507 222 (60) 952 (5,267) 695 (444) 3,410<br />
Financial assets available for sale 1,450 (221) 2<br />
136 (143) – (97) 2,135 (93) 3,167<br />
Other financial assets at fair value 788 70 9 – – – – (826) 41<br />
Total financial assets held at fair value 87,663 (14,679) 3,4<br />
Financial liabilities held at fair value:<br />
5,169 (8,344) 1,198 (16,515) 21,059 (17,331) 58,220<br />
Trading securities<br />
Negative market values from derivative<br />
666 26 – – – 113 186 (560) 431<br />
financial instruments 28,738 (4,374) 7<br />
– – – (5,546) 5,034 (8,261) 15,591<br />
Other trading liabilities<br />
Financial liabilities designated at fair<br />
174 68 – – – 205 – (164) 283<br />
value through profit or loss: 6,030 (1,753) – – 208 (269) 1,443 (3,038) 2,621<br />
Other financial liabilities at fair value (1,249) 649 – – – 93 (253) 3 (757)<br />
Total financial liabilities held at fair value 34,359 (5,384) 3,4<br />
– – 208 (5,404) 6,410 (12,020) 18,169<br />
1 Total gains and losses predominantly relate to net gains (losses) on financial assets/liabilities at fair value through profit or loss reported in the consolidated statement of income.<br />
The balance also includes net gains (losses) on financial assets available for sale reported in the consolidated statement of income and unrealized net gains (losses) on financial assets<br />
available for sale and exchange rate changes reported in other comprehensive income, net of tax.<br />
2 Total gains and losses on available for sale include a gain of € 177 million recognized in other comprehensive income, net of tax, and a loss of € 398 million recognized in the income<br />
statement presented in net gains (losses) on financial assets available for sale.<br />
3 This amount includes the effect of exchange rate changes. For total financial assets held at fair value this effect is a positive € 6.6 billion and for total financial liabilities held at fair value this is<br />
a negative € 2.3 billion. This predominately relates to derivatives. The effect of exchange rate changes is reported in other comprehensive income, net of tax.<br />
4 For assets positive balances represent gains, negative balances represent losses. For liabilities positive balances represent losses, negative balances represent gains.<br />
5 Issuances relate to the cash amount received on the issuance of a liability and the cash amount paid on the primary issuance of a loan to a borrower.<br />
6 Settlements represent cash flows to settle the asset or liability. For debt and loan instruments this includes principal on maturity, principal amortizations and principal repayments.<br />
For derivatives all cash flows are presented in settlements.<br />
7 The gains and losses on derivatives arise as a result of changes to input parameters, in particular tightening of credit spreads.<br />
Sensitivity Analysis of Unobservable Parameters<br />
Where the value of financial instruments is dependent on unobservable parameter inputs, the precise level for<br />
these parameters at the balance sheet date might be drawn from a range of reasonably possible alternatives.<br />
In preparing the financial statements, appropriate levels for these unobservable input parameters are chosen<br />
so that they are consistent with prevailing market evidence and in line with the Group’s approach to valuation<br />
control detailed above. Were the Group to have marked the financial instruments concerned using parameter<br />
values drawn from the extremes of the ranges of reasonably possible alternatives then as of December 31,<br />
2010, it could have increased fair value by as much as € 3.6 billion or decreased fair value by as much as<br />
€ 3.9 billion. As of December 31, 2009, it could have increased fair value by as much as € 4.3 billion or<br />
decreased fair value by as much as € 3.9 billion. In estimating these impacts, the Group either re-valued<br />
certain financial instruments using reasonably possible alternative parameter values, or used an approach<br />
based on its valuation adjustment methodology for bid/offer spread valuation adjustments. Bid/offer spread<br />
valuation adjustments reflect the amount that must be paid in order to close out a holding in an instrument or<br />
component risk and as such they reflect factors such as market illiquidity and uncertainty.
<strong>Deutsche</strong> <strong>Bank</strong> 02 – Consolidated Financial Statements 252<br />
Financial <strong>Report</strong> 2010 Notes to the Consolidated Balance Sheet<br />
14 – Financial Instruments carried at Fair Value<br />
This disclosure is intended to illustrate the potential impact of the relative uncertainty in the fair value of financial<br />
instruments for which valuation is dependent on unobservable input parameters. However, it is unlikely in<br />
practice that all unobservable parameters would be simultaneously at the extremes of their ranges of reasonably<br />
possible alternatives. Hence, the estimates disclosed above are likely to be greater than the true uncertainty in<br />
fair value at the balance sheet date. Furthermore, the disclosure is not predictive or indicative of future<br />
movements in fair value.<br />
For many of the financial instruments considered here, in particular derivatives, unobservable input parameters<br />
represent only a subset of the parameters required to price the financial instrument, the remainder being<br />
observable. Hence for these instruments the overall impact of moving the unobservable input parameters to<br />
the extremes of their ranges might be relatively small compared with the total fair value of the financial instrument.<br />
For other instruments, fair value is determined based on the price of the <strong>entire</strong> instrument, for example, by<br />
adjusting the fair value of a reasonable proxy instrument. In addition, all financial instruments are already<br />
carried at fair values which are inclusive of valuation adjustments for the cost to close out that instrument and<br />
hence already factor in uncertainty as it reflects itself in market pricing. Any negative impact of uncertainty<br />
calculated within this disclosure, then, will be over and above that already included in the fair value contained<br />
in the financial statements.<br />
The table below provides a breakdown of the sensitivity analysis by type of instrument. Where the exposure to an<br />
unobservable parameter is offset across different instruments then only the net impact is disclosed in the table.<br />
in € m.<br />
Positive fair value<br />
movement from using<br />
reasonable possible<br />
alternatives<br />
Dec 31, 2010 Dec 31, 2009<br />
Negative fair value<br />
movement from using<br />
reasonable possible<br />
alternatives<br />
Positive fair value<br />
movement from using<br />
reasonable possible<br />
alternatives<br />
Negative fair value<br />
movement from using<br />
reasonable possible<br />
alternatives<br />
Derivatives:<br />
Credit 2,065 2,724 2,585 2,689<br />
Equity 185 103 213 106<br />
Interest Related 143 157 103 117<br />
Hybrid 321 121 342 168<br />
Other 117 69 264 314<br />
Securities:<br />
Debt securities 303 282 311 277<br />
Equity securities 91 60 36 28<br />
Mortgage and asset backed 77 59 206 50<br />
Loans:<br />
Leveraged loans 3 3 5 5<br />
Commercial loans 51 9 88 88<br />
Traded loans 278 287 136 83<br />
Total 3,634 3,874 4,289 3,925
<strong>Deutsche</strong> <strong>Bank</strong> 02 – Consolidated Financial Statements 253<br />
Financial <strong>Report</strong> 2010 Notes to the Consolidated Balance Sheet<br />
14 – Financial Instruments carried at Fair Value<br />
Total gains or losses on level 3 instruments held or in issue at the reporting date<br />
The total gains or losses are not due solely to unobservable parameters. Many of the parameter inputs to the<br />
valuation of instruments in this level of the hierarchy are observable and the gain or loss is partly due to<br />
movements in these observable parameters over the period. Many of the positions in this level of the hierarchy<br />
are economically hedged by instruments which are categorized in other levels of the fair value hierarchy. The<br />
offsetting gains and losses that have been recorded on all such hedges are not included in the table below,<br />
which only shows the gains and losses related to the level 3 classified instruments themselves, in accordance<br />
with IFRS 7.<br />
An analysis of the total gains and losses recorded in profit or loss.<br />
Total gains or losses recorded in net gains (losses) on financial instruments at fair value through profit or loss<br />
in € m.<br />
Financial assets held at fair value:<br />
Dec 31, 2010 Dec 31, 2009<br />
Trading securities 943 (433)<br />
Positive market values from derivative financial instruments 2,755 (10,325)<br />
Other trading assets 150 (404)<br />
Financial assets designated at fair value through profit or loss (61) 554<br />
Financial assets available for sale 1 (30) (200)<br />
Other financial assets at fair value (31) (8)<br />
Total financial assets held at fair value<br />
Financial liabilities held at fair value:<br />
3,726 (10,816)<br />
Trading securities (109) (15)<br />
Negative market values from derivative financial instruments (75) 2,226<br />
Other trading liabilities (4) (35)<br />
Financial liabilities designated at fair value through profit or loss (194) 1,121<br />
Other financial liabilities at fair value 29 (197)<br />
Total financial liabilities held at fair value (353) 3,100<br />
Total 3,373 (7,716)<br />
1 This amount relates to impairment losses on level 3 financial assets available for sale.<br />
Recognition of Trade Date Profit<br />
In accordance with the Group’s accounting policy as described in Note 01 “Significant Accounting Policies”, if<br />
there are significant unobservable inputs used in a valuation technique, the financial instrument is recognized<br />
at the transaction price and any trade date profit is deferred. The table below presents the year-to-year movement<br />
of the trade date profits deferred due to significant unobservable parameters for financial instruments classified<br />
at fair value through profit or loss. The balance is predominantly related to derivative instruments.<br />
in € m. 2010 2009<br />
Balance, beginning of year 822 697<br />
New trades during the period 268 467<br />
Amortization (243) (182)<br />
Matured trades (135) (138)<br />
Subsequent move to observability (117) (41)<br />
Exchange rate changes 27 19<br />
Balance, end of year 622 822
<strong>Deutsche</strong> <strong>Bank</strong> 02 – Consolidated Financial Statements 254<br />
Financial <strong>Report</strong> 2010 Notes to the Consolidated Balance Sheet<br />
15 – Fair Value of Financial Instruments not carried at Fair Value<br />
15 –<br />
Fair Value of Financial Instruments not carried at Fair Value<br />
The valuation techniques used to establish fair value for the Group’s financial instruments which are not carried<br />
at fair value in the balance sheet are consistent with those outlined in Note 14 “Financial Instruments carried at<br />
Fair Value”.<br />
As described in Note 13 “Amendments to IAS 39 and IFRS 7, Reclassification of Financial Assets”, the Group<br />
reclassified certain eligible assets from the trading and available for sale classifications to loans. The Group<br />
continues to apply the relevant valuation techniques set out in Note 14 “Financial Instruments carried at Fair<br />
Value”, to the reclassified assets.<br />
Other financial instruments not carried at fair value are not managed on a fair value basis, for example, retail<br />
loans and deposits and credit facilities extended to corporate clients. For these instruments fair values are<br />
calculated for disclosure purposes only and do not impact the balance sheet or income statement. Additionally,<br />
since the instruments generally do not trade there is significant management judgment required to determine<br />
these fair values.<br />
The valuation techniques the Group applies are as follows:<br />
Short-term financial instruments: The carrying value represents a reasonable estimate of fair value for the<br />
following financial instruments which are predominantly short-term.<br />
Assets Liabilities<br />
Cash and due from banks Deposits<br />
Interest-earning deposits with banks Central bank funds purchased and securities sold under<br />
repurchase agreements<br />
Central bank funds sold and securities purchased under resale<br />
agreements<br />
Securities loaned<br />
Securities borrowed Other short-term borrowings<br />
Other assets Other liabilities<br />
For longer-term financial instruments within these categories, fair value is determined by discounting contractual<br />
cash flows using rates which could be earned for assets with similar remaining maturities and credit risks and,<br />
in the case of liabilities, rates at which the liabilities with similar remaining maturities could be issued, at the<br />
balance sheet date.
<strong>Deutsche</strong> <strong>Bank</strong> 02 – Consolidated Financial Statements 255<br />
Financial <strong>Report</strong> 2010 Notes to the Consolidated Balance Sheet<br />
15 – Fair Value of Financial Instruments not carried at Fair Value<br />
Loans: Fair value is determined using discounted cash flow models that incorporate parameter inputs for credit<br />
risk, interest rate risk, foreign exchange risk, loss given default estimates and amounts utilized given default, as<br />
appropriate. Credit risk, loss given default and utilization given default parameters are determined using<br />
information from the loan or credit default swap (CDS) markets, where available and appropriate.<br />
For retail lending portfolios with a large number of homogenous loans (e.g., German residential mortgages),<br />
the fair value is calculated on a portfolio basis by discounting the portfolio’s contractual cash flows using riskfree<br />
interest rates. This present value calculation is then adjusted for credit risk by discounting at the margins<br />
which could be earned on similar loans if issued at the balance sheet date. For other portfolios the present<br />
value calculation is adjusted for credit risk by calculating the expected loss over the estimated life of the loan<br />
based on various parameters including probability of default and loss given default and level of collateralization.<br />
The fair value of corporate lending portfolios is estimated by discounting a projected margin over expected<br />
maturities using parameters derived from the current market values of collateralized lending obligation (CLO)<br />
transactions collateralized with loan portfolios that are similar to the Group’s corporate lending portfolio.<br />
Securities purchased under resale agreements, securities borrowed, securities sold under repurchase<br />
agreements and securities loaned: Fair value is derived from valuation techniques by discounting future cash<br />
flows using the appropriate credit risk-adjusted discount rate. The credit risk-adjusted discount rate includes<br />
consideration of the collateral received or pledged in the transaction. These products are typically short-term<br />
and highly collateralized, therefore the fair value is not significantly different to the carrying value.<br />
Long-term debt and trust preferred securities: Fair value is determined from quoted market prices, where<br />
available. Where quoted market prices are not available, fair value is estimated using a valuation technique<br />
that discounts the remaining contractual cash at a rate at which an instrument with similar characteristics could<br />
be issued at the balance sheet date.
<strong>Deutsche</strong> <strong>Bank</strong> 02 – Consolidated Financial Statements 256<br />
Financial <strong>Report</strong> 2010 Notes to the Consolidated Balance Sheet<br />
15 – Fair Value of Financial Instruments not carried at Fair Value<br />
The following table presents the estimated fair value of the Group’s financial instruments which are not carried<br />
at fair value in the balance sheet.<br />
Dec 31, 2010 Dec 31, 2009<br />
in € m. Carrying value Fair value Carrying value Fair value<br />
Financial assets:<br />
Cash and due from banks 17,157 17,157 9,346 9,346<br />
Interest-earning deposits with banks 92,377 92,378 47,233 47,236<br />
Central bank funds sold and securities purchased under resale<br />
agreements 20,365 20,310 6,820 6,820<br />
Securities borrowed 28,916 28,916 43,509 43,509<br />
Loans 407,729 401,813 258,105 249,661<br />
Other assets 1 116,589 116,565 105,004 104,995<br />
Financial liabilities:<br />
Deposits 533,984 534,442 344,220 344,700<br />
Central bank funds purchased and securities sold under<br />
repurchase agreements 27,922 27,954 45,495 45,511<br />
Securities loaned 3,276 3,276 5,564 5,564<br />
Other short-term borrowings 64,990 64,912 42,897 42,833<br />
Other liabilities 1 135,389 135,386 127,777 127,789<br />
Long-term debt 169,660 168,211 131,782 132,577<br />
Trust preferred securities 12,250 11,462 10,577 9,518<br />
1 Only includes financial assets or financial liabilities.<br />
Amounts in this table are generally presented on a gross basis, in line with the Group’s accounting policy<br />
regarding offsetting of financial instruments as described in Note 01 “Significant Accounting Policies”.<br />
The acquisition of Postbank contributed to the increase in the amount of financial assets and liabilities not<br />
carried at fair value since December 31, 2009. Postbank’s contribution was primarily related to its loans, deposits<br />
and long-term debt that were recognized at fair value on the Group’s balance sheet on acquisition date. As of<br />
December 31, 2010, the carrying value of these financial instruments was € 129.4 billion, € 131.6 billion and<br />
€ 33.5 billion respectively. As there has been no material change in the fair value of Postbank’s loans since<br />
acquisition date, the Group estimated the fair value to be equal to the carrying value at December 31, 2010. As<br />
of December 31, 2010 the Group estimated that the fair value of deposits is equal to the carrying value and the<br />
fair value of long-term debt is € 48 million lower than the carrying value.<br />
Loans: The difference between fair value and carrying value does not reflect the economic benefits and costs<br />
that the Group expects to receive from these instruments. The difference arose predominantly due to an increase<br />
in expected default rates and reduction in liquidity as implied from market pricing since initial recognition. These<br />
reductions in fair value are partially offset by an increase in fair value due to interest rate movements on fixed<br />
rate instruments.<br />
Long-term debt and trust preferred securities: The difference between fair value and carrying value is due to the<br />
effect of changes in the rates at which the Group could issue debt with similar maturity and subordination at the<br />
balance sheet date compared to when the instrument was issued.
<strong>Deutsche</strong> <strong>Bank</strong> 02 – Consolidated Financial Statements 257<br />
Financial <strong>Report</strong> 2010 Notes to the Consolidated Balance Sheet<br />
16 – Financial Assets Available for Sale<br />
16 –<br />
Financial Assets Available for Sale<br />
The following are the components of financial assets available for sale.<br />
in € m. Dec 31, 2010 Dec 31, 2009<br />
Debt securities:<br />
German government 4,053 2,585<br />
U.S. Treasury and U.S. government agencies 1,633 901<br />
U.S. local (municipal) governments 563 1<br />
Other foreign governments 17,688 3,832<br />
Corporates 19,901 4,280<br />
Other asset-backed securities 1,780 999<br />
Mortgage-backed securities, including obligations of U.S. federal agencies 154 815<br />
Other debt securities 442 438<br />
Total debt securities 46,214 13,851<br />
Equity securities:<br />
Equity shares 3,296 3,192<br />
Investment certificates and mutual funds 132 76<br />
Total equity securities 3,428 3,268<br />
Other equity interests 2,251 699<br />
Loans 2,373 1,001<br />
Total financial assets available for sale 54,266 18,819<br />
The acquisition of Postbank contributed to the increase of financial assets available for sale, especially in debt<br />
securities, by € 33 billion.<br />
On May 6, 2010, <strong>Deutsche</strong> <strong>Bank</strong> announced that it had signed a binding agreement to subscribe to newly<br />
issued shares in Hua Xia <strong>Bank</strong> Co. Ltd. (“Hua Xia <strong>Bank</strong>”) for a total subscription price of up to RMB 5.7 billion<br />
(€ 649 million as of December 31, 2010). <strong>Deutsche</strong> <strong>Bank</strong>’s subscription is part of a private placement of Hua Xia<br />
<strong>Bank</strong> shares to its three largest shareholders with an overall issuance value of up to RMB 20.8 billion (€ 2.4 billion<br />
as of December 31, 2010). Subject to regulatory approvals and upon final settlement of the transaction, this investment<br />
will increase <strong>Deutsche</strong> <strong>Bank</strong>’s existing equity stake in Hua Xia <strong>Bank</strong>, which is accounted for as financial<br />
asset available for sale, from 17.12 % to 19.99 % of issued capital, the maximum single foreign ownership<br />
level as permitted by Chinese regulations.
<strong>Deutsche</strong> <strong>Bank</strong> 02 – Consolidated Financial Statements 258<br />
Financial <strong>Report</strong> 2010 Notes to the Consolidated Balance Sheet<br />
17 – Equity Method Investments<br />
17 –<br />
Equity Method Investments<br />
Investments in associates and jointly controlled entities are accounted for using the equity method of accounting.<br />
As of December 31, 2010 the following investees were significant, representing 75 % of the carrying value of<br />
equity method investments.<br />
Investment 1<br />
Ownership<br />
percentage<br />
Actavis Equity S.à r.l., Luxembourg 2 0.00 %<br />
AKA Ausfuhrkredit-Gesellschaft mit beschränkter Haftung, Frankfurt 28.85 %<br />
BATS Global Markets, Inc., Wilmington 3 8.46 %<br />
BrisConnections Investment Trust, Kedron 35.59 %<br />
Challenger Infrastructure Fund, Sydney 20.21 %<br />
Compañía Logística de Hidrocarburos CLH, S.A., Madrid 3 5.00 %<br />
DMG & Partners Securities Pte Ltd, Singapore 49.00 %<br />
Gemeng International Energy Group Company Limited, Taiyuan 3 9.00 %<br />
Harvest Fund Management Company Limited, Shanghai 30.00 %<br />
HHG Private Capital Portfolio No.1 L.P., London 3 17.57 %<br />
Huamao Property Holdings Ltd., George Town 3 0.00 %<br />
K & N Kenanga Holdings Bhd, Kuala Lumpur 3 16.55 %<br />
Marblegate Special Opportunities Master Fund, L.P., George Town 44.62 %<br />
MFG Flughafen-Grundstücksverwaltungsgesellschaft mbH & Co. BETA KG, Gruenwald 29.58 %<br />
Nexus LLC, Wilmington 3 12.22 %<br />
Rongde Asset Management Company Limited, Beijing 40.70 %<br />
Spark Infrastructure Group, Sydney 3 2.28 %<br />
1 All significant equity method investments are investments in associates.<br />
2 Equity method accounting based on subordinated financing arrangement, for further information please see below.<br />
3 The Group has significant influence over the investee through board seats or other measures.<br />
Actavis. On November 24, 2010, <strong>Deutsche</strong> <strong>Bank</strong> completed the restructuring of loans it held with the Icelandic<br />
generic pharmaceutical group Actavis Group hF. (“Actavis”).<br />
The restructuring resulted in <strong>Deutsche</strong> <strong>Bank</strong> continuing to provide both senior and subordinated debt financing<br />
to Actavis as well as a new Payment in Kind (“PIK”) financing arrangement. The terms of the subordinated<br />
financing arrangement resulted in <strong>Deutsche</strong> <strong>Bank</strong> having an equity method investment in Actavis Equity S.à r.l.<br />
(“Actavis Equity”), a 100 percent holding company of Actavis.<br />
The terms of the subordinated financing arrangement give <strong>Deutsche</strong> <strong>Bank</strong> certain noncontrolling rights, consents<br />
and vetoes over certain financial and operating decisions of Actavis Equity. In addition, the terms of the subordinated<br />
financing arrangement subordinate repayments of amounts owing where the borrower is unable to<br />
pay its debts or on the sale of Actavis Equity or its subsidiaries. The effect of these rights and restrictions resulted<br />
in the treatment of the subordinated financing arrangement as equity for accounting purposes.<br />
The terms of the PIK financing arrangement also provide for the subordination of amounts owed to <strong>Deutsche</strong><br />
<strong>Bank</strong> (in the form of interest or repayment premium) under such arrangements where the borrower is unable to<br />
pay its debts or on the sale of Actavis Equity or its subsidiaries.
<strong>Deutsche</strong> <strong>Bank</strong> 02 – Consolidated Financial Statements 259<br />
Financial <strong>Report</strong> 2010 Notes to the Consolidated Balance Sheet<br />
17 – Equity Method Investments<br />
The carrying value of Actavis, which reflects the subordinated financing arrangement, is based on its financial<br />
position to September 30, 2010 adjusted to take into account transactions after that date.<br />
Postbank. As of December 31, 2009, <strong>Deutsche</strong> Postbank AG, was the Group’s only significant equity method<br />
investment, representing approximately 75 % of the carrying value of equity method investments individually.<br />
On December 3, 2010, <strong>Deutsche</strong> <strong>Bank</strong> gained a controlling majority in Postbank shares and commenced<br />
consolidation of the Postbank Group as of that date. As a consequence the Group ceased equity method<br />
accounting for its investment in Postbank. For information on the Postbank acquisition please refer to Note 04<br />
“Acquisitions and Dispositions”.<br />
Summarized aggregated financial information of significant equity method investees follows.<br />
in € m. Dec 31, 2010 Dec 31, 2009<br />
Total assets 17,317 15,945<br />
Total liabilities 12,393 11,415<br />
Revenues 3,145 3,385<br />
Net income (loss) 428 378<br />
The following are the components of the net income (loss) from all equity method investments.<br />
in € m. 2010 2009<br />
Net income (loss) from equity method investments:<br />
Pro-rata share of investees’ net income (loss) 457 189<br />
Net gains (losses) on disposal of equity method investments 14 21<br />
Impairments (2,475) (151)<br />
Total net income (loss) from equity method investments (2,004) 59<br />
In 2010 a charge of approximately € 2.3 billion attributable to the equity method investment in <strong>Deutsche</strong><br />
Postbank AG prior to consolidation is included. For further detail please see Note 04 “Acquisitions and<br />
Dispositions”.<br />
There was no unrecognized share of losses of an investee, neither for the period, nor cumulatively.<br />
Equity method investments for which there were published price quotations had a carrying value of € 280 million<br />
and a fair value of € 561 million as of December 31, 2010, and a carrying value of € 6.1 billion and a fair value<br />
of € 3.8 billion as of December 31, 2009.<br />
The investees have no significant contingent liabilities to which the Group is exposed.<br />
Except as otherwise noted, in 2010 and 2009, none of the Group’s investees experienced any significant<br />
restrictions to transfer funds in the form of cash dividends, or repayment of loans or advances.
<strong>Deutsche</strong> <strong>Bank</strong> 02 – Consolidated Financial Statements 260<br />
Financial <strong>Report</strong> 2010 Notes to the Consolidated Balance Sheet<br />
18 – Loans<br />
18 –<br />
Loans<br />
The following are the principal components of loans by industry classification.<br />
in € m. Dec 31, 2010 Dec 31, 2009<br />
<strong>Bank</strong>s and insurance 38,798 22,002<br />
Manufacturing 20,748 17,314<br />
Households (excluding mortgages) 35,115 27,002<br />
Households – mortgages 132,235 58,673<br />
Public sector 24,113 9,572<br />
Wholesale and retail trade 13,637 10,938<br />
Commercial real estate activities 44,120 28,959<br />
Lease financing 2,321 2,078<br />
Fund management activities 27,964 26,462<br />
Other 72,841 59,698<br />
Gross loans 411,892 262,698<br />
(Deferred expense)/unearned income 867 1,250<br />
Loans less (deferred expense)/unearned income 411,025 261,448<br />
Less: Allowance for loan losses 3,296 3,343<br />
Total loans 407,729 258,105<br />
Commitments and Contingent Liabilities<br />
The table below summarizes the contractual amounts of the Group’s irrevocable lending-related commitments<br />
and contingent liabilities. Contingent liabilities mainly consist of financial and performance guarantees, standby<br />
letters of credit and indemnity agreements. The contractual amount of these commitments is the maximum<br />
amount at risk for the Group if the customer fails to meet its obligations. Probable losses under these contracts<br />
are recognized as provisions.<br />
in € m. Dec 31, 2010 Dec 31, 2009<br />
Irrevocable lending commitments 123,881 104,125<br />
Contingent liabilities 68,055 52,183<br />
Total 191,936 156,308<br />
Commitments and contingent liabilities stated above do not represent expected future cash flows as many of<br />
these contracts will expire without being drawn. The Group may require collateral to mitigate the credit risk of<br />
commitments and contingent liabilities.<br />
Government Assistance<br />
In the course of its business, the Group regularly applies for and receives government support by means of<br />
Export Credit Agency (“ECA”) guarantees covering transfer and default risks for the financing of exports and<br />
investments into Emerging Markets and, to a lesser extent, developed markets for Structured Trade & Export<br />
Finance business. Almost all export-oriented states have established such ECAs to support their domestic<br />
exporters. The ECAs act in the name and on behalf of the government of their respective country and are either<br />
constituted directly as governmental departments or organized as private companies vested with the official<br />
mandate of the government to act on its behalf. Terms and conditions of such ECA guarantees granted for<br />
short-term, mid-term and long-term financings are quite comparable due to the fact that most of the ECAs act<br />
within the scope of the Organisation for Economic Cooperation and Development (“OECD”) consensus rules.<br />
The OECD consensus rules, an intergovernmental agreement of the OECD member states, define benchmarks<br />
to ensure that a fair competition between different exporting nations will take place.
<strong>Deutsche</strong> <strong>Bank</strong> 02 – Consolidated Financial Statements 261<br />
Financial <strong>Report</strong> 2010 Notes to the Consolidated Balance Sheet<br />
19 – Allowance for Credit Losses<br />
In some countries dedicated funding programs with governmental support are offered for ECA-covered financings.<br />
On a selective basis, the Group makes use of such programs. In certain financings, the Group also receives<br />
government guarantees from national and international governmental institutions as collateral to support<br />
financings in the interest of the respective governments. The majority of such ECA guarantees received by the<br />
Group were issued either by the Euler-Hermes Kreditversicherungs AG acting on behalf of the Federal Republic<br />
of Germany or by the Commodity Credit Corporation acting on behalf of the United States.<br />
19 –<br />
Allowance for Credit Losses<br />
The allowance for credit losses consists of an allowance for loan losses and an allowance for off-balance sheet<br />
positions.<br />
The following table presents a breakdown of the movements in the Group’s allowance for loan losses for the<br />
periods specified.<br />
in € m.<br />
Individually<br />
assessed<br />
Collectively<br />
assessed Total<br />
2010 2009 2008<br />
Individually<br />
assessed<br />
Collectively<br />
assessed Total<br />
Individually<br />
assessed<br />
Collectively<br />
assessed Total<br />
Allowance, beginning of year 2,029 1,314 3,343 977 961 1,938 930 775 1,705<br />
Provision for loan losses 562 751 1,313 1,789 808 2,597 382 702 1,084<br />
Net charge-offs: (896) (404) (1,300) (637) (419) (1,056) (301) (477) (778)<br />
Charge-offs (934) (509) (1,443) (670) (552) (1,222) (364) (626) (990)<br />
Recoveries 38 104 143 33 133 166 63 149 212<br />
Changes in the group of consolidated<br />
companies – – – – – – – – –<br />
Exchange rate changes/other (52) (8) (60) (101) (36) (137) (34) (39) (74)<br />
Allowance, end of year 1,643 1,653 3,296 2,029 1,314 3,343 977 961 1,938<br />
The following table presents the activity in the Group’s allowance for off-balance sheet positions, which consists<br />
of contingent liabilities and lending-related commitments.<br />
in € m.<br />
Individually<br />
assessed<br />
Collectively<br />
assessed Total<br />
2010 2009 2008<br />
Individually<br />
assessed<br />
Collectively<br />
assessed Total<br />
Individually<br />
assessed<br />
Collectively<br />
assessed Total<br />
Allowance, beginning of year 83 124 207 98 112 210 101 118 219<br />
Provision for off-balance sheet<br />
positions (18) (21) (39) 21 12 33 (2) (6) (8)<br />
Usage – – – (45) – (45) – – –<br />
Changes in the group of consolidated<br />
companies 42 – 42 – – – – – –<br />
Exchange rate changes/other 1 7 8 10 – 10 (1) – (1)<br />
Allowance, end of year 108 110 218 83 124 207 98 112 210<br />
In 2010 we recorded changes in the group of consolidated companies for off-balance sheet allowances<br />
following the consolidation of acquisitions amounting to € 34 million for Postbank Group and € 8 million for<br />
Sal. Oppenheim/BHF-BANK.
<strong>Deutsche</strong> <strong>Bank</strong> 02 – Consolidated Financial Statements 262<br />
Financial <strong>Report</strong> 2010 Notes to the Consolidated Balance Sheet<br />
20 – Derecognition of Financial Assets<br />
20 –<br />
Derecognition of Financial Assets<br />
The Group enters into transactions in which it transfers previously recognized financial assets, such as debt<br />
securities, equity securities and traded loans, but retains substantially all of the risks and rewards of those<br />
assets. Due to this retention, the transferred financial assets are not derecognized and the transfers are<br />
accounted for as secured financing transactions. The most common transactions of this nature entered into by<br />
the Group are repurchase agreements, securities lending agreements and total return swaps, in which the<br />
Group retains substantially all of the associated credit, equity price, interest rate and foreign exchange risks<br />
and rewards associated with the assets as well as the associated income streams.<br />
The following table provides further information on the asset types and the associated transactions that did not<br />
qualify for derecognition, and their associated liabilities.<br />
in € m. Dec 31, 2010 Dec 31, 2009 1<br />
Carrying amount of transferred assets<br />
Trading securities not derecognized due to the following transactions:<br />
Repurchase agreements 1 54,022 56,831<br />
Securities lending agreements 1 39,454 26,858<br />
Total return swaps 8,854 10,028<br />
Total trading securities 102,330 93,717<br />
Other trading assets 2,455 2,915<br />
Financial assets available for sale 4,391 492<br />
Loans 3,700 2,049<br />
Total 112,876 99,173<br />
Carrying amount of associated liability 99,957 90,543<br />
1 Prior year amounts have been adjusted.<br />
Continuing involvement accounting is typically applied when the Group retains the rights to future cash flows of<br />
an asset, continues to be exposed to a degree of default risk in the transferred assets or holds a residual interest<br />
in, or enters into derivative contracts with, securitization or special purpose entities.<br />
The following table provides further detail on the carrying value of the assets transferred in which the Group still<br />
has continuing involvement.<br />
in € m. Dec 31, 2010 Dec 31, 2009 1<br />
Carrying amount of the original assets transferred:<br />
Trading securities 2,197 4,688<br />
Other trading assets 6,011 5,007<br />
Carrying amount of the assets continued to be recognized:<br />
Trading securities 2,186 2,899<br />
Other trading assets 1,713 1,429<br />
Carrying amount of associated liability 3,910 4,253<br />
1 Prior year amounts have been adjusted.
<strong>Deutsche</strong> <strong>Bank</strong> 02 – Consolidated Financial Statements 263<br />
Financial <strong>Report</strong> 2010 Notes to the Consolidated Balance Sheet<br />
21 – Assets Pledged and Received as Collateral<br />
21 –<br />
Assets Pledged and Received as Collateral<br />
The Group pledges assets primarily for repurchase agreements and securities borrowing agreements which<br />
are generally conducted under terms that are usual and customary to standard securitized borrowing contracts.<br />
In addition the Group pledges collateral against other borrowing arrangements and for margining purposes on<br />
OTC derivative liabilities. The carrying value of the Group’s assets pledged as collateral for liabilities or contingent<br />
liabilities is as follows.<br />
in € m. Dec 31, 2010 Dec 31, 2009 1<br />
Interest-earning deposits with banks 930 59<br />
Financial assets at fair value through profit or loss 101,109 97,088<br />
Financial assets available for sale 2 3,362 558<br />
Loans 15,867 19,537<br />
Other 3 181 56<br />
Total 121,449 117,298<br />
1 Prior year amounts have been adjusted.<br />
2 Increase in financial assets available for sale predominantly due to consolidation of Postbank.<br />
3 Includes Property and equipment pledged as collateral.<br />
Assets transferred where the transferee has the right to sell or repledge are disclosed on the face of the balance<br />
sheet. As of December 31, 2010, and December 31, 2009, these amounts were € 95 billion and € 80 billion,<br />
respectively.<br />
As of December 31, 2010, and December 31, 2009, the Group had received collateral with a fair value of<br />
€ 269 billion and € 225 billion, respectively, arising from securities purchased under reverse repurchase<br />
agreements, securities borrowed derivatives transactions, customer margin loans and other transactions.<br />
These transactions were generally conducted under terms that are usual and customary for standard secured<br />
lending activities and the other transactions described. The Group, as the secured party, has the right to sell or<br />
repledge such collateral, subject to the Group returning equivalent securities upon completion of the transaction.<br />
As of December 31, 2010, and 2009, the Group had resold or repledged € 249 billion and € 200 billion,<br />
respectively. This was primarily to cover short sales, securities loaned and securities sold under repurchase<br />
agreements.
<strong>Deutsche</strong> <strong>Bank</strong> 02 – Consolidated Financial Statements 264<br />
Financial <strong>Report</strong> 2010 Notes to the Consolidated Balance Sheet<br />
22 – Property and Equipment<br />
22 –<br />
Property and Equipment<br />
in € m.<br />
Owner<br />
occupied<br />
properties<br />
Furniture and<br />
equipment<br />
Leasehold<br />
improvements<br />
Construction-<br />
in-progress Total<br />
Cost of acquisition:<br />
Balance as of January 1, 2009 1,467 2,500 1,513 1,317 6,797<br />
Changes in the group of consolidated companies 5 (2) (2) – 1<br />
Additions 4 242 70 276 592<br />
Transfers 2 23 20 (1,121) (1,076)<br />
Reclassifications (to)/from ‘held for sale’ (2) – – – (2)<br />
Disposals 11 75 34 – 120<br />
Exchange rate changes 4 53 25 (6) 76<br />
Balance as of December 31, 2009 1,469 2,741 1,592 466 6,268<br />
Changes in the group of consolidated companies 1,045 200 (8) 4 1,241<br />
Additions 115 417 156 185 873<br />
Transfers 2,208 398 60 (361) 2,305<br />
Reclassifications (to)/from ‘held for sale’ (161) (21) (4) – (186)<br />
Disposals 33 247 55 – 335<br />
Exchange rate changes 3 133 72 4 212<br />
Balance as of December 31, 2010 4,646 3,621 1,813 298 10,378<br />
Accumulated depreciation and impairment:<br />
Balance as of January 1, 2009 556 1,705 824 – 3,085<br />
Changes in the group of consolidated companies (1) (3) (2) – (6)<br />
Depreciation 35 232 150 – 417<br />
Impairment losses 5 – 11 5 21<br />
Reversals of impairment losses – – – – –<br />
Transfers (1) 10 3 – 12<br />
Reclassifications (to)/from ‘held for sale’ – – – – –<br />
Disposals 5 55 25 – 85<br />
Exchange rate changes – 37 10 – 47<br />
Balance as of December 31, 2009 589 1,926 971 5 3,491<br />
Changes in the group of consolidated companies – (1) (13) – (14)<br />
Depreciation 47 293 154 – 494<br />
Impairment losses 6 22 – – 28<br />
Reversals of impairment losses – – – – –<br />
Transfers 704 (13) (4) (5) 682<br />
Reclassifications (to)/from ‘held for sale’ (2) – – – (2)<br />
Disposals 16 187 39 – 242<br />
Exchange rate changes 2 92 45 – 139<br />
Balance as of December 31, 2010 1,330 2,132 1,114 – 4,576<br />
Carrying amount:<br />
Balance as of December 31, 2009 880 815 621 461 2,777<br />
Balance as of December 31, 2010 3,316 1,489 699 298 5,802<br />
In 2009, following a change in the relevant accounting standards, the Group changed the accounting treatment<br />
of an asset previously accounted for as construction-in-progress in Property and Equipment and reclassified it<br />
to investment property under Other Assets, in the 2009 financial statements. This asset was again reclassified<br />
to Property and Equipment in the 2010 financial statements, triggered by a change of its economic characteristics.
<strong>Deutsche</strong> <strong>Bank</strong> 02 – Consolidated Financial Statements 265<br />
Financial <strong>Report</strong> 2010 Notes to the Consolidated Balance Sheet<br />
23 – Leases<br />
Impairment losses on property and equipment are recorded within General and administrative expenses in the<br />
income statement.<br />
The carrying value of items of property and equipment on which there is a restriction on sale was € 192 million<br />
as of December 31, 2010.<br />
Commitments for the acquisition of property and equipment were € 18 million at year-end 2010.<br />
23 –<br />
Leases<br />
The Group is lessee under lease arrangements covering property and equipment.<br />
Finance Lease Commitments<br />
Most of the Group’s finance lease arrangements are made under usual terms and conditions. The Group has<br />
one significant lease contract that includes a bargain purchase option to acquire the building at expiration of<br />
the leasing contract.<br />
The following table presents the net carrying value for each class of leasing assets held under finance leases.<br />
in € m. Dec 31, 2010 Dec 31, 2009<br />
Land and buildings 87 91<br />
Furniture and equipment 2 2<br />
Other 3 –<br />
Net carrying value 92 93<br />
Additionally, the Group has sublet leased assets classified as finance leases with a net carrying value of<br />
€ 5 million as of December 31, 2010, and € 67 million as of December 31, 2009.<br />
The future minimum lease payments required under the Group’s finance leases were as follows.<br />
in € m. Dec 31, 2010 Dec 31, 2009<br />
Future minimum lease payments:<br />
not later than one year 17 25<br />
later than one year and not later than five years 65 106<br />
later than five years 73 144<br />
Total future minimum lease payments 155 275<br />
less: Future interest charges 111 108<br />
Present value of finance lease commitments 44 167
<strong>Deutsche</strong> <strong>Bank</strong> 02 – Consolidated Financial Statements 266<br />
Financial <strong>Report</strong> 2010 Notes to the Consolidated Balance Sheet<br />
23 – Leases<br />
Future minimum sublease payments of € 105 million are expected to be received under non-cancelable<br />
subleases as of December 31, 2010. As of December 31, 2009, future minimum sublease payments of<br />
€ 111 million were expected. As of December 31, 2010, the amount of contingent rent recognized in the income<br />
statement was € 1 million. As of December 31, 2009, contingent rent was € (0.7) million. The contingent rent is<br />
based on market interest rates, such as 3-months EURIBOR; below a certain rate the Group receives a rebate.<br />
Operating Lease Commitments<br />
The Group leases the majority of its offices and branches under long-term agreements. Most of the lease contracts<br />
are made under usual terms and conditions. The Group has one significant lease contract which contains five<br />
options to extend the lease each for a period of five years and there is no purchase option in this specific lease.<br />
The future minimum lease payments required under the Group’s operating leases were as follows.<br />
in € m. Dec 31, 2010 Dec 31, 2009<br />
Future minimum rental payments:<br />
not later than one year 831 728<br />
later than one year and not later than five years 2,316 2,046<br />
later than five years 2,074 2,352<br />
Total future minimum rental payments 5,221 5,126<br />
less: Future minimum rentals to be received 248 255<br />
Net future minimum rental payments 1 4,973 4,871<br />
1 The total of 2010 payments included an amount relating to Postbank of € 425 million.<br />
In 2010, the rental payments for lease and sublease agreements amounted to € 890 million. This included<br />
charges of € 927 million for minimum lease payments and € 2 million for contingent rents as well as € 39 million<br />
related to sublease rentals received.
<strong>Deutsche</strong> <strong>Bank</strong> 02 – Consolidated Financial Statements 267<br />
Financial <strong>Report</strong> 2010 Notes to the Consolidated Balance Sheet<br />
24 – Goodwill and Other Intangible Assets<br />
24 –<br />
Goodwill and Other Intangible Assets<br />
Goodwill<br />
Changes in Goodwill<br />
The changes in the carrying amount of goodwill, as well as gross amounts and accumulated impairment losses<br />
of goodwill, for the years ended December 31, 2010, and 2009, are shown below by business segment.<br />
in € m.<br />
Corporate<br />
<strong>Bank</strong>ing &<br />
Securities<br />
Global<br />
Transaction<br />
<strong>Bank</strong>ing<br />
Asset and<br />
Wealth<br />
Management<br />
Private &<br />
Business<br />
Clients<br />
Corporate<br />
Investments Total<br />
Balance as of January 1, 2009 3,128 456 2,975 974 – 7,533<br />
Purchase accounting adjustments – – – – – –<br />
Goodwill acquired during the year 2 1 – – – 3<br />
Transfers – – (306) – 306 –<br />
Reclassification from (to) ‘held for sale’ (14) – – – – (14)<br />
Goodwill related to dispositions without being<br />
classified as ‘held for sale’ – – – – – –<br />
Impairment losses 1 – – – – (151) (151)<br />
Exchange rate changes/other (11) (4) 46 – 18 49<br />
Balance as of December 31, 2009 3,105 453 2,715 974 173 7,420<br />
Gross amount of goodwill 3,109 453 2,715 974 849 8,100<br />
Accumulated impairment losses (4) – – – (676) (680)<br />
Balance as of January 1, 2010 3,105 453 2,715 974 173 7,420<br />
Purchase accounting adjustments – 5 (4) – – 1<br />
Goodwill acquired during the year 2 – 844 2,049 – 2,895<br />
Transfers – 3 (3) – – –<br />
Reclassification from (to) ‘held for sale’ – – (20) – – (20)<br />
Goodwill related to dispositions without being<br />
classified as ‘held for sale’ – – – – – –<br />
Impairment losses – – – – – –<br />
Exchange rate changes/other 225 26 192 2 21 466<br />
Balance as of December 31, 2010 3,332 487 3,724 3,025 194 10,762<br />
Gross amount of goodwill 3,337 487 3,724 3,025 903 11,476<br />
Accumulated impairment losses (5) – – – (709) (714)<br />
1 Impairment losses of goodwill are recorded as impairment of intangible assets in the income statement.<br />
In 2010, additions to goodwill totaled approximately € 2.9 billion. This included an amount of € 2,049 million<br />
related to the acquisition of a controlling interest in <strong>Deutsche</strong> Postbank AG (“Postbank”) in December 2010,<br />
which had been allocated to Private & Business Clients (PBC). The acquisition of the Sal. Oppenheim Group<br />
(including its subsidiary BHF-BANK AG (“BHF-BANK”), excluding BHF Asset Servicing GmbH) in the first quarter<br />
2010 resulted in the recognition of goodwill of € 844 million which was assigned to Asset and Wealth Management<br />
(AWM). Following the contemplated sale of BHF-BANK and its classification as a disposal group held for sale,<br />
goodwill of € 13 million associated with the acquisition of that unit was reclassified to the disposal group in the<br />
fourth quarter 2010. Furthermore, the acquisition of a U.S. based investment advisor contributed € 2 million of<br />
goodwill to Corporate <strong>Bank</strong>ing & Securities (CB&S). Due to the designated sale of a subsidiary in the AWM<br />
Corporate Division, an amount of € 7 million had been assigned to the respective disposal group held for sale.
<strong>Deutsche</strong> <strong>Bank</strong> 02 – Consolidated Financial Statements 268<br />
Financial <strong>Report</strong> 2010 Notes to the Consolidated Balance Sheet<br />
24 – Goodwill and Other Intangible Assets<br />
No impairment of goodwill was recorded in 2010.<br />
In 2009, additions to goodwill totaled € 3 million and included € 2 million in CB&S resulting from the acquisition<br />
of outstanding noncontrolling interests in an Algerian financial advisory company and € 1 million in Global<br />
Transaction <strong>Bank</strong>ing (GTB) related to the acquisition of Dresdner <strong>Bank</strong>’s Global Agency Securities Lending<br />
business. Effective January 1, 2009 and following a change in management responsibility, goodwill of<br />
€ 306 million related to Maher Terminals LLC and Maher Terminals of Canada Corp., collectively and hereafter<br />
referred to as Maher Terminals, was transferred from AWM to Corporate Investments (CI). Due to their<br />
reclassification to the held for sale category in the third quarter 2009, goodwill of € 14 million (CB&S) related to<br />
a nonintegrated investment in a renewable energy development project was transferred as part of a disposal<br />
group to other assets (see Note 25 “Assets Held For Sale”).<br />
A goodwill impairment loss of € 151 million was recorded in the second quarter of 2009 in CI related to its<br />
nonintegrated investment in Maher Terminals, following the continued negative outlook for container and<br />
business volumes. The fair value less costs to sell of the investment was determined based on a discounted<br />
cash flow model.<br />
In 2008, a total goodwill impairment loss of € 275 million was recorded. Of this total, € 270 million related to an<br />
investment in AWM and € 5 million related to a listed investment in CB&S. Both impairment losses related to<br />
investments which were not integrated into the primary cash-generating units within AWM and CB&S. The<br />
impairment review of the investment Maher Terminals in AWM was triggered by a significant decline in business<br />
volume as a result of the economic climate at that time. The fair value less costs to sell of the investment was<br />
determined based on a discounted cash flow model. The impairment review of the investment in CB&S was<br />
triggered by write-downs of certain other assets and the negative business outlook of the investment. The fair<br />
value less costs to sell of the listed investment was determined based on its market price.<br />
Goodwill Impairment Test<br />
For the purposes of impairment testing, goodwill acquired in a business combination is allocated to cash<br />
generating units which are the smallest identifiable groups of assets that generate cash inflows largely<br />
independent of the cash inflows from other assets or groups of assets and that are expected to benefit from the<br />
synergies of the combination. In identifying whether cash inflows from an asset (or a group of assets) are largely<br />
independent of the cash inflows from other assets (or groups of assets) various factors are considered, including<br />
how management monitors the entity’s operations or makes decisions about continuing or disposing of the<br />
entity’s assets and operations.<br />
Following a transfer in responsibility for leadership of the Corporate & Investment <strong>Bank</strong> (CIB) announced in<br />
mid-2010, the reorganization to create an integrated CIB structure has significantly progressed. This integration<br />
is expected to deliver synergies including more coordinated corporate client coverage, maximizing cross selling<br />
opportunities and bringing together best practices from across the franchise. As a consequence, the two former<br />
cash-generating units Global Markets and Corporate Finance have been merged into one single CGU Corporate<br />
<strong>Bank</strong>ing & Securities effective October 1, 2010. The Group verified that the change in the cash-generating unit<br />
structure within the CB&S segment did not trigger, defer or avoid an impairment of goodwill.
<strong>Deutsche</strong> <strong>Bank</strong> 02 – Consolidated Financial Statements 269<br />
Financial <strong>Report</strong> 2010 Notes to the Consolidated Balance Sheet<br />
24 – Goodwill and Other Intangible Assets<br />
On this basis, the Group’s primary cash-generating units are Corporate <strong>Bank</strong>ing & Securities, Global Transaction<br />
<strong>Bank</strong>ing, Asset Management and Private Wealth Management within the Asset and Wealth Management segment,<br />
Private & Business Clients and Corporate Investments.<br />
The carrying amounts of goodwill as well as their relative share by cash-generating unit for the years ended<br />
December 31, 2010, and 2009, are as follows.<br />
Corporate<br />
<strong>Bank</strong>ing &<br />
Securities<br />
Global<br />
Transaction<br />
<strong>Bank</strong>ing<br />
Asset<br />
Management<br />
Private<br />
Wealth<br />
Management<br />
Private &<br />
Business<br />
Clients<br />
Corporate<br />
Investments Others<br />
Total<br />
Goodwill<br />
As of December 31, 2009<br />
in € m. 3,105 453 1,788 927 974 – 174 7,420<br />
in % 42 % 6 % 24 % 12 % 13 % N/M 2 % 100 %<br />
As of December 31, 2010<br />
in € m. 3,332 487 1,988 1,736 3,025 – 194 10,762<br />
in % 31 % 5 % 18 % 16 % 28 % N/M 2 % 100 %<br />
N/M – not meaningful<br />
In addition to the primary CGUs, the segments CB&S and CI carry goodwill resulting from the acquisition of<br />
nonintegrated investments which are not allocated to the respective segments’ primary cash-generating units.<br />
Such goodwill is tested individually for impairment on the level of each of the nonintegrated investments and<br />
summarized as Others in the table above. The nonintegrated investment in CI constitutes Maher Terminals,<br />
which was transferred from AWM to CI effective January 1, 2009.<br />
Goodwill is tested for impairment annually in the fourth quarter by comparing the recoverable amount of each<br />
goodwill carrying cash-generating unit with its carrying amount. The carrying amount of a cash-generating unit<br />
is derived based on the amount of equity allocated to a cash-generating unit. The carrying amount also considers<br />
the amount of goodwill and unamortized intangible assets of a cash-generating unit. The recoverable amount<br />
is the higher of a cash-generating unit’s fair value less costs to sell and its value in use. The annual goodwill<br />
impairment tests in 2010, 2009 and 2008 did not result in an impairment loss of goodwill of the Group’s primary<br />
cash-generating units as the recoverable amount for these cash-generating units was higher than their respective<br />
carrying amount.<br />
The following sections describe how the Group determines the recoverable amount of its primary goodwill<br />
carrying cash-generating units and provides information on certain key assumptions on which management<br />
based its determination of the recoverable amount.
<strong>Deutsche</strong> <strong>Bank</strong> 02 – Consolidated Financial Statements 270<br />
Financial <strong>Report</strong> 2010 Notes to the Consolidated Balance Sheet<br />
24 – Goodwill and Other Intangible Assets<br />
Recoverable Amount<br />
The Group determines the recoverable amount of its primary cash-generating units on the basis of value in use<br />
and employs a valuation model based on discounted cash flows (“DCF”). The DCF model employed by the<br />
Group reflects the specifics of the banking business and its regulatory environment. The model calculates the<br />
present value of the estimated future earnings that are distributable to shareholders after fulfilling the respective<br />
regulatory capital requirements.<br />
The DCF model uses earnings projections and respective capitalization assumptions based on financial plans<br />
agreed by management which, for purposes of the goodwill impairment test, are extrapolated to a five-year<br />
period and are discounted to their present value. Estimating future earnings and capital requirements involves<br />
judgment, considering past and actual performance as well as expected developments in the respective markets,<br />
in the overall macroeconomic and regulatory environment. Earnings projections beyond the initial five-year period<br />
are, where applicable, adjusted to derive a sustainable level and assumed to increase by or converging towards<br />
a constant long-term growth rate of 3.7 %, which is based on expectations for the development of gross domestic<br />
product and inflation, and are captured in the terminal value.<br />
Key Assumptions and Sensitivities<br />
Key Assumptions: The value in use of a cash-generating unit is sensitive to the earnings projections, to the<br />
discount rate applied and, to a much lesser extent, to the long-term growth rate. The discount rates applied<br />
have been determined based on the capital asset pricing model which is comprised of a risk-free interest rate,<br />
a market risk premium and a factor covering the systematic market risk (beta factor). The values for the riskfree<br />
interest rate, the market risk premium and the beta factors are determined using external sources of<br />
information. Business-specific beta factors are determined based on a respective group of peer companies.<br />
Variations in all of these components might impact the calculation of the discount rates.<br />
The following table summarizes descriptions of key assumptions underlying the projected future earnings,<br />
management’s approach to determining the values assigned to key assumptions as well as the uncertainty<br />
associated with the key assumption and potential events and circumstances that could have a negative effect<br />
for the Group’s primary cash-generating units.
<strong>Deutsche</strong> <strong>Bank</strong> 02 – Consolidated Financial Statements 271<br />
Financial <strong>Report</strong> 2010 Notes to the Consolidated Balance Sheet<br />
24 – Goodwill and Other Intangible Assets<br />
Primary cashgenerating<br />
unit Description of key assumptions<br />
Corporate <strong>Bank</strong>ing<br />
& Securities<br />
Global Transaction<br />
<strong>Bank</strong>ing<br />
Asset Management<br />
- Cost savings in light of Group-wide<br />
infrastructure efficiency increase and<br />
Complexity Reduction Program<br />
- Successful integration of the investment<br />
bank<br />
- Robust, possibly increasing trading<br />
volumes and margins<br />
- Focus on flow products and benefiting<br />
from leading client market shares<br />
- Increased focus on EM Debt,<br />
commodities and electronic trading<br />
- Corporate Finance fee pools continue to<br />
recover<br />
- Cost savings in light of Group-wide<br />
infrastructure efficiency increase and<br />
Complexity Reduction Program<br />
- Capitalize on synergies resulting from<br />
CIB integration<br />
- Stable macroeconomic environment<br />
- Interest rate levels<br />
- Recovery in international trade volumes,<br />
cross-border payments and corporate<br />
actions<br />
- Deepening relationships with Complex<br />
Corporates and Institutional Clients in<br />
existing regions while pushing further<br />
growth in Asia<br />
- Successful integration of parts of ABN<br />
AMRO’s corporate and commercial<br />
banking activities in the Netherlands<br />
- Cost savings in light of Group-wide<br />
infrastructure efficiency increase and<br />
Complexity Reduction Program as well as<br />
re-engineered AM platform<br />
- Market appetite to regain prior year<br />
losses stimulating alternative assets<br />
investments<br />
- Growing allocations into alternative<br />
assets<br />
- Continuing recovery in equity and real<br />
estate markets<br />
- Ongoing growing wealth in emerging<br />
economies and Sovereign Wealth Funds<br />
- Ongoing shift from state pension to<br />
private retirement funding and benefiting<br />
from product innovation<br />
- Outsourcing of investment management<br />
mandates by insurance companies<br />
- Increased interest and appetite for<br />
Climate Change investments<br />
Management’s approach to determining the<br />
values assigned to key assumptions<br />
- The key assumptions have been based on<br />
a combination of internal and external<br />
studies (consulting firms, research)<br />
- Management estimates concerning CIB<br />
integration and cost reduction program are<br />
also based on progress made to date<br />
across various initiatives<br />
- The key assumptions have been based on<br />
a combination of internal and external<br />
sources<br />
- Macroeconomic trends are supported by<br />
studies while internal growth plans and<br />
impact from efficiency initiatives have<br />
been based on management/high level<br />
business case assumptions<br />
- Equity Markets growth assumptions are<br />
based on internal studies from DB<br />
Research<br />
- Other business growth and efficiency<br />
assumptions are based on business<br />
management input validated by internal<br />
independent function<br />
- Platform cost reductions are derived from<br />
analysis of competitors and trend<br />
analyses within PCAM<br />
Uncertainty associated with key assumption and<br />
potential events/circumstances that could have a<br />
negative effect<br />
- Uncertainty around regulation and its<br />
potential implications not yet anticipated<br />
- Unforeseen macroeconomic environment<br />
leading to slowdown in activity<br />
- Attrition and loss of key talent in certain<br />
sectors and resurgence of competition<br />
- Cost savings are not achieved to the<br />
extent planned<br />
- Unexpected weak recovery of the world<br />
economy and its impact on trade volumes,<br />
interest rate and foreign exchange rates<br />
- Delay in implementation of efficiency<br />
measures<br />
- Uncertainty around regulation and its<br />
potential implications not yet anticipated<br />
- Reoccurrence of market volatility<br />
- Investors continue to retreat to cash or<br />
simpler, lower fee products<br />
- Cost savings are not achieved to the<br />
extent planned
<strong>Deutsche</strong> <strong>Bank</strong> 02 – Consolidated Financial Statements 272<br />
Financial <strong>Report</strong> 2010 Notes to the Consolidated Balance Sheet<br />
24 – Goodwill and Other Intangible Assets<br />
Primary cashgenerating<br />
unit Description of key assumptions<br />
Private Wealth<br />
Management<br />
Private & Business<br />
Clients<br />
- Cost savings in light of Group-wide<br />
infrastructure efficiency increase and<br />
Complexity Reduction Program<br />
- Market appetite to regain prior year<br />
losses stimulating alternative assets<br />
investments<br />
- Continuing recovery in equity and real<br />
estate markets<br />
- Growing wealth pools in mature and<br />
emerging markets<br />
- Market share increases in fragmented<br />
competitive environment<br />
- Asset gathering and allocation shifts<br />
- Benefiting from home market leadership<br />
- Positive results from Sal. Oppenheim<br />
integration<br />
- Organic growth in Asia/Pacific with hiring<br />
and intensified cooperation with CIB<br />
- Complexity reductions and efficiency<br />
improvements by enforcing a global PWM<br />
platform<br />
- Cost savings in light of Group-wide<br />
infrastructure efficiency increase and<br />
Complexity Reduction Program<br />
- Leading position in home market,<br />
Germany, strong position in other<br />
European markets and growth options in<br />
key Asian countries<br />
- Achievement of synergies between<br />
<strong>Deutsche</strong> <strong>Bank</strong> and Postbank on revenue<br />
and cost side<br />
- Market share gains in Germany via<br />
customer and volume gains using the<br />
strong advisory proposition<br />
- Benefiting from branch network<br />
expansion in India and stake increase in<br />
Hua Xia <strong>Bank</strong> in China<br />
Management’s approach to determining the<br />
values assigned to key assumptions<br />
- Complexity Reduction expectations<br />
based on internal input<br />
- Macroeconomic data and market data<br />
(e.g. asset classes recovery) based on<br />
DB Research input<br />
- Growth potential across markets based<br />
on external sources (strategy consultancies)<br />
and historical performance<br />
- Sal. Oppenheim targets based on<br />
separate integration analyses and<br />
strategy<br />
- All assumptions regarding PBC’s future<br />
development are backed with respective<br />
projects and initiatives<br />
- All initiatives were based on a business<br />
case developed by management<br />
validated by internal and external data<br />
Uncertainty associated with key assumption and<br />
potential events/circumstances that could have a<br />
negative effect<br />
- Unfavorable fiscal policy for off-shore<br />
banking<br />
- Uncertainties in Euro and USD zone<br />
and overall unstable foreign exchange<br />
environment<br />
- Volatility in emerging markets<br />
- Sharp drop in economic growth<br />
- Continued low interest rates<br />
- Risk that synergies related to Postbank<br />
acquisition do not realize or realize later<br />
than foreseen<br />
- Costs to achieve the synergies are higher<br />
than foreseen<br />
Pre-tax discount rates applied to determine the value in use of the primary cash-generating units in 2010 and<br />
2009 are as follows.
<strong>Deutsche</strong> <strong>Bank</strong> 02 – Consolidated Financial Statements 273<br />
Financial <strong>Report</strong> 2010 Notes to the Consolidated Balance Sheet<br />
24 – Goodwill and Other Intangible Assets<br />
Primary cash generating units<br />
Discount rate (pre-tax)<br />
2010 2009<br />
Corporate & Investment <strong>Bank</strong><br />
Corporate <strong>Bank</strong>ing & Securities 13.9 % N/A 1<br />
Global Transaction <strong>Bank</strong>ing<br />
Private Clients and Asset Management<br />
11.7 % 12.5 %<br />
Asset Management 12.5 % 13.5 %<br />
Private Wealth Management 12.2 % 13.2 %<br />
Private & Business Clients 13.1 % 13.1 %<br />
N/A – Not applicable<br />
1 Respective pre-tax discount rates in 2009 were 14.7 % for Global Markets and 14.5 % for Corporate Finance.<br />
Sensitivities: In validating the value in use determined for the cash-generating units, the major value drivers of<br />
each cash-generating unit are reviewed annually. In addition, key assumptions used in the DCF model (for<br />
example, the discount rate and the earnings projections) are sensitized to test the resilience of value in use.<br />
The recoverable amounts of all primary cash-generating units were substantially in excess of their respective<br />
carrying amounts. On this basis, management believes that reasonably possible changes in key assumptions<br />
used to determine the recoverable amount of the Group’s primary cash-generating units would not result in an<br />
impairment.<br />
However, certain global risks for the banking industry such as an unexpected weak recovery of the world economy,<br />
a potential sovereign default and overly costly and internationally fragmented new regulation may negatively<br />
impact the performance forecasts of certain of the Group’s cash-generating units and, thus, could result in an<br />
impairment of goodwill in the future.<br />
Other Intangible Assets<br />
Other intangible assets are separated into purchased and internally-generated intangible assets. While purchased<br />
intangible assets are further split into unamortized and amortized other intangible assets, internally- generated<br />
intangible assets consist only of internally-generated software.<br />
The changes of other intangible assets by asset class for the years ended December 31, 2010, and 2009, are<br />
as follows.
<strong>Deutsche</strong> <strong>Bank</strong> 02 – Consolidated Financial Statements 274<br />
Financial <strong>Report</strong> 2010 Notes to the Consolidated Balance Sheet<br />
24 – Goodwill and Other Intangible Assets<br />
in € m.<br />
Retail<br />
investment<br />
management<br />
agreements Other<br />
Purchased intangible assets Internally<br />
generated<br />
intangible<br />
Unamortized Amortized assets<br />
Total<br />
unamortized<br />
purchased<br />
intangible<br />
assets<br />
Customerrelated<br />
intangible<br />
assets<br />
Value of<br />
business<br />
acquired<br />
Contractbased<br />
intangible<br />
assets<br />
Software<br />
and<br />
other<br />
Total<br />
amortized<br />
purchased<br />
intangible<br />
assets Software<br />
Total other<br />
intangible<br />
assets<br />
Cost of acquisition/manufacture:<br />
Balance as of January 1, 2009 817 17 834 563 654 708 495 2,420 411 3,665<br />
Additions<br />
Changes in the group of<br />
– – – 37 12 15 35 99 128 227<br />
consolidated companies – – – – – – (1) (1) – (1)<br />
Disposals<br />
Reclassifications from<br />
– – – – – 28 3 31 14 45<br />
(to) ‘held for sale’ – (11) (11) – – – – – – (11)<br />
Transfers – – – – 14 – 21 35 (22) 13<br />
Exchange rate changes (9) 3 (6) 9 63 (5) 4 71 4 69<br />
Balance as of December 31, 2009 808 9 817 609 743 690 551 2,593 507 3,917<br />
Additions<br />
Changes in the group of<br />
– 2 2 29 11 13 68 121 316 439<br />
consolidated companies – 413 413 1,055 – 14 251 1,320 163 1,896<br />
Disposals<br />
Reclassifications from<br />
– 10 10 – – 6 16 22 52 84<br />
(to) ‘held for sale’ – 3 3 (27) – – (30) (57) (7) (61)<br />
Transfers – – – (10) – – 3 (7) (2) (9)<br />
Exchange rate changes 62 1 63 33 26 52 30 141 30 234<br />
Balance as of December 31, 2010<br />
Accumulated amortization<br />
and impairment:<br />
870 418 1,288 1,689 780 763 857 4,089 955 6,332<br />
Balance as of January 1, 2009 380 – 380 221 40 100 251 612 329 1,321<br />
Amortization for the year – – – 61 29 40 31 161 13 174 1<br />
Changes in the group of<br />
consolidated companies – – – – – – (1) (1) – (1)<br />
Disposals<br />
Reclassifications from<br />
– – – – – 27 2 29 14 43<br />
(to) ‘held for sale’ – (2) (2) – – – – – – (2)<br />
Impairment losses – 1 1 – – 4 – 4 – 5 2<br />
Reversals of impairment losses 287 – 287 4 – – – 4 – 291 3<br />
Transfers – – – – – – (1) (1) – (1)<br />
Exchange rate changes (4) 1 (3) 1 4 (3) 4 6 3 6<br />
Balance as of December 31, 2009 89 – 89 279 73 114 282 748 331 1,168<br />
Amortization for the year – – – 80 28 41 77 226 36 262 4<br />
Changes in the group of<br />
consolidated companies – – – – – – 36 36 – 36<br />
Disposals<br />
Reclassifications from<br />
– – – (1) – 5 13 17 49 66<br />
(to) ‘held for sale’ – – – (2) – – (2) (4) (1) (5)<br />
Impairment losses – – – 29 – – 12 41 – 41 5<br />
Reversals of impairment losses – – – – – – – – – –<br />
Transfers – – – (1) – – 3 2 2 4<br />
Exchange rate changes 7 1 8 15 3 7 11 36 15 59<br />
Balance as of December 31, 2010<br />
Carrying amount:<br />
96 1 97 401 104 157 406 1,068 334 1,499<br />
As of December 31, 2009 719 9 728 330 670 576 269 1,845 176 2,749<br />
As of December 31, 2010 774 417 1,191 1,288 676 606 451 3,021 621 4,833<br />
1 Of which € 162 million were included in general and administrative expenses and € 12 million were recorded in commissions and fee income. The latter related to the amortization of mortgage<br />
servicing rights.<br />
2 Of which € 5 million were recorded as impairment of intangible assets.<br />
3 € 291 million were recorded as reversal of a prior year’s impairment and are included under impairment of intangible assets.<br />
4 Of which € 249 million were included in general and administrative expenses and € 13 million were recorded in commissions and fee income. The latter related to the amortization of mortgage<br />
servicing rights.<br />
5 Of which € 29 million were recorded as impairment of intangible assets.
<strong>Deutsche</strong> <strong>Bank</strong> 02 – Consolidated Financial Statements 275<br />
Financial <strong>Report</strong> 2010 Notes to the Consolidated Balance Sheet<br />
24 – Goodwill and Other Intangible Assets<br />
Amortized Intangible Assets<br />
Following the acquisitions of Postbank, Sal. Oppenheim (including BHF-BANK, but excluding BAS) and the<br />
Dutch commercial banking activities from ABN AMRO during 2010, the purchase price allocations for these<br />
transactions resulted in the identification and initial recognition of amortized intangible assets of approximately<br />
€ 1.3 billion capitalized in the Group’s consolidated balance sheet. The amount included mainly customerrelated<br />
intangible assets of approximately € 1.1 billion (Postbank € 836 million, ABN AMRO € 168 million, Sal.<br />
Oppenheim € 66 million) and purchased software of € 214 million (Postbank € 142 million, Sal. Oppenheim<br />
€ 72 million). Also, these acquisitions involved the capitalization of € 163 million of self-developed software to<br />
the Group’s consolidated balance sheet, of which € 156 million were attributable to Postbank.<br />
Furthermore, in 2010 the Group recorded additions to amortized intangible assets of € 121 million, mainly<br />
representing capitalized expenses for purchased software of € 68 million, customer-related intangible assets of<br />
€ 29 million and the capitalization of € 11 million of deferred policy acquisition costs (DAC) related to incremental<br />
costs of acquiring investment management contracts. Such acquisition costs are commissions payable to<br />
intermediaries and business counterparties of the Group’s insurance business (see Note 39 “Insurance and<br />
Investment Contracts”). Due to the Group classifying its subsidiary BHF-BANK as a disposal group held for sale,<br />
the related carrying amounts for amortizing intangible assets of € 55 million were reclassified to other assets.<br />
In 2010, impairments recorded on other intangible assets of € 41 million included a charge of € 29 million relating<br />
to the client portfolio of an acquired domestic custody services business recorded in GTB and a loss of € 12 million<br />
recorded in the retirement of purchased software included in AWM.<br />
In 2009, additions and transfers to amortized intangible assets amounted to € 134 million and included<br />
purchased software of € 35 million, the capitalization of DACs of € 26 million related to incremental costs of<br />
acquiring investment management contracts, which are commissions payable to intermediaries and business<br />
counterparties of the Group’s insurance business, and the recognition of customer relationships resulting from<br />
the acquisition of Dresdner <strong>Bank</strong>’s Global Agency Securities Lending business of € 21 million (see Note 04<br />
“Acquisitions and Dispositions”).<br />
In 2009, impairment of intangible assets in the income statement included an impairment loss of € 4 million<br />
relating to contract-based intangible assets as well as a reversal of an impairment loss of € 4 million relating to<br />
customer-related intangible assets, which had been taken in the fourth quarter of 2008. The impairment loss<br />
was included in CB&S, the impairment reversal was recorded in AWM.<br />
In 2008, impairment losses relating to customer-related intangible assets and contract-based intangible assets<br />
(mortgage servicing rights) amounting to € 6 million and € 1 million were recognized as impairment of intangible<br />
assets and in commissions and fee income, respectively, in the income statement. The impairment of<br />
customer-related intangible assets was recorded in AWM and the impairment of contract-based intangible<br />
assets was recorded in CB&S.
<strong>Deutsche</strong> <strong>Bank</strong> 02 – Consolidated Financial Statements 276<br />
Financial <strong>Report</strong> 2010 Notes to the Consolidated Balance Sheet<br />
24 – Goodwill and Other Intangible Assets<br />
Other intangible assets with finite useful lives are generally amortized over their useful lives based on the straightline<br />
method (except for the VOBA, as explained in Note 01 “Significant Accounting Policies” and Note 39<br />
“Insurance and Investment Contracts”, and for mortgage servicing rights).<br />
Mortgage servicing rights are amortized in proportion to and over the estimated period of net servicing revenues.<br />
The useful lives of other amortized intangible assets by asset class are as follows.<br />
Useful lives in<br />
years<br />
Internally generated intangible assets:<br />
Software up to 10<br />
Purchased intangible assets:<br />
Customer-related intangible assets up to 25<br />
Contract-based intangible assets up to 40<br />
Value of business acquired up to 30<br />
Other up to 20<br />
Unamortized Intangible Assets<br />
Within this asset class, the Group recognizes certain contract-based and marketing-related intangible assets<br />
which are deemed to have an indefinite useful life. In particular, the asset class comprises investment<br />
management agreements related to retail mutual funds and certain trademarks. Due to the specific nature of<br />
these intangible assets, market prices are ordinarily not observable and, therefore, the Group values such<br />
assets based on the income approach of valuation, using a post-tax discounted cash flow methodology.<br />
Retail investment management agreements: This asset, amounting to € 774 million, relates to the Group’s U.S.<br />
retail mutual fund business and is allocated to the Asset Management cash-generating unit. Retail investment<br />
management agreements are contracts that give DWS Investments the exclusive right to manage a variety of<br />
mutual funds for a specified period. Since the contracts are easily renewable, the cost of renewal is minimal,<br />
and they have a long history of renewal, these agreements are not expected to have a foreseeable limit on the<br />
contract period. Therefore, the rights to manage the associated assets under management are expected to<br />
generate cash flows for an indefinite period of time. The intangible asset was valued at fair value based upon a<br />
third party valuation at the date of the Group’s acquisition of Zurich Scudder Investments, Inc. in 2002.<br />
In 2010, there was no impairment as the recoverable amount of the retail investment management agreements,<br />
calculated as fair value less costs to sell, exceeded its carrying amount. The fair value was determined using<br />
the multi-period excess earnings method.<br />
In 2009, a reversal of an impairment loss of € 287 million was recognized and recorded as impairment of<br />
intangible assets in the income statement. A related impairment loss had been taken in the fourth quarter of<br />
2008. The impairment reversal was related to retail investment management agreements for certain open end<br />
funds and was recorded in AWM. The impairment reversal was due to an increase in fair value as a result of<br />
increases in market values of invested assets as well as current and projected operating results and cash flows<br />
of investment management agreements. The recoverable amount of the asset was calculated as fair value less<br />
costs to sell, using the multi-period excess earnings method.
<strong>Deutsche</strong> <strong>Bank</strong> 02 – Consolidated Financial Statements 277<br />
Financial <strong>Report</strong> 2010 Notes to the Consolidated Balance Sheet<br />
24 – Goodwill and Other Intangible Assets<br />
In 2008, an impairment loss of € 304 million was recognized in the income statement as impairment of intangible<br />
assets. The loss related to retail investment management agreements and was recorded in AWM. The impairment<br />
loss was due to a decrease in fair values as a result of declines in market values of invested assets as well as<br />
current and projected operating results and cash flows of investment management agreements. The impairment<br />
related to certain open end and closed end funds. The recoverable amounts of the assets were calculated as<br />
fair value less costs to sell, using the multi-period excess earnings method.<br />
Postbank trademark: As a result of the preliminary purchase price allocation, the Group identified and recognized<br />
in December 2010 the Postbank trademark amounting to € 382 million (see Note 04 “Acquisitions and<br />
Dispositions”). The asset is allocated to the Private & Business Clients cash-generating unit. Since the<br />
trademark is expected to generate cash flows for an indefinite period of time, it is classified as unamortized<br />
intangible asset. The trademark intangible was valued at fair value based on a preliminary third party valuation<br />
as of the acquisition date which is subject to finalization within the respective measurement period.<br />
In 2010, there was no indication that the fair value of the Postbank trademark differed from the initial fair value<br />
determination. Since the Postbank consolidation occurred in December 2010, the determination of the fair<br />
value for this trademark coincided with the regular impairment testing. The fair value of the trademark was<br />
determined based on the income approach, using the relief-from-royalty approach. As the purchase price<br />
allocation is subject to finalization within the regular measurement period, the fair value of the Postbank<br />
trademark may change during the 12-months-period following the acquisition date.<br />
Sal. Oppenheim trademark: The purchase price allocation performed in relation to the acquisition of the<br />
Sal. Oppenheim Group in 2010 resulted in the identification and recognition of the Sal. Oppenheim trademark<br />
amounting to € 27 million. The asset is allocated to the Private Wealth Management cash-generating unit. The<br />
useful life for the trademark is assumed to be indefinite and, hence, not subject to amortization. The intangible<br />
asset was valued at fair value based upon a third party valuation performed as of the acquisition date.<br />
In 2010, there was no indication that the fair value of the trademark differed from the fair value determination in<br />
the purchase price allocation. The valuation of the trademark intangible asset was performed in context of the<br />
respective purchase price allocation for the Sal. Oppenheim acquisition. The fair value of the Sal. Oppenheim<br />
trademark was determined using the relief-from-royalty approach.
<strong>Deutsche</strong> <strong>Bank</strong> 02 – Consolidated Financial Statements 278<br />
Financial <strong>Report</strong> 2010 Notes to the Consolidated Balance Sheet<br />
25 – Assets Held for Sale<br />
25 –<br />
Assets Held for Sale<br />
Assets Held for Sale as of December 31, 2010<br />
As of the balance sheet date, total assets held for sale amounted to € 13,468 million. They were reported in<br />
other assets. The Group valued the non-current assets and disposal groups classified as held for sale at the<br />
lower of their carrying amount and fair value less costs to sell. Financial instruments were measured following<br />
the general provisions of IAS 39.<br />
BHF-BANK<br />
On December 23, 2010, <strong>Deutsche</strong> <strong>Bank</strong> announced that it had agreed with Liechtenstein’s LGT Group on<br />
important aspects of the sale of BHF-BANK AG (“BHF-BANK”) and to conduct exclusive negotiations with LGT<br />
Group concerning the contemplated sale of BHF-BANK. The negotiations to finalize the contractual details are<br />
expected to be completed during the first quarter of 2011 and the Group expects BHF-BANK to be sold within<br />
one year. Accordingly and as of December 31, 2010, the Group classified BHF-BANK as a disposal group held<br />
for sale. BHF-BANK was previously acquired as a part of the acquisition of the Sal. Oppenheim Group and is<br />
allocated to the Corporate Division Asset and Wealth Management (AWM). The reclassification to the held-forsale<br />
category triggered an impairment loss of € 62 million before tax which was recorded in other income of the<br />
Group’s income statement of the fourth quarter 2010. Regarding this impairment there has been a release of<br />
€ 16 million of deferred taxes.<br />
The following are the principal components of BHF-BANK’s assets and liabilities which the Group classified as<br />
held for sale as of December 31, 2010.<br />
in € m. Dec 31, 2010<br />
Cash, due and deposits from banks, Central bank funds sold and securities purchased under resale agreements 1,109<br />
Trading assets, Derivatives, Financial assets designated at fair value through P&L 3,653<br />
Financial assets available for sale 4,253<br />
Loans 1,763<br />
Other assets 1,501<br />
Total assets classified as held for sale 12,280<br />
Deposits, Central bank funds purchased and securities sold under repurchase agreements 7,534<br />
Trading liabilities (excl. derivatives), Derivatives, Financial liabilities designated at fair value through P&L 2,650<br />
Other liabilities 608<br />
Long-term debt 981<br />
Total liabilities classified as held for sale 11,773<br />
Relating to BHF-BANK’s available-for-sale portfolio, unrealized net losses of € 27 million were recognized<br />
directly in accumulated other comprehensive income (net of applicable tax). These unrealized net losses will<br />
remain in equity until such time as the investment in BHF-BANK is sold, at which time the losses shall be<br />
reclassified from equity to profit or loss.
<strong>Deutsche</strong> <strong>Bank</strong> 02 – Consolidated Financial Statements 279<br />
Financial <strong>Report</strong> 2010 Notes to the Consolidated Balance Sheet<br />
25 – Assets Held for Sale<br />
Other non-current assets and disposal groups classified as held for sale<br />
With the closing of a majority shareholding in Postbank on December 3, 2010, the Group also obtained control<br />
over Postbank’s Indian subsidiary <strong>Deutsche</strong> Postbank Home Finance Ltd. (“DPHFL”) which is allocated to the<br />
Corporate Division Private & Business Clients (PBC). As announced by Postbank already on December 1, 2010,<br />
Postbank had resolved to finalize an agreement with a buyer consortium led by Dewan Housing Finance Ltd.<br />
to sell DPHFL. The transaction is expected to close in the first quarter 2011 and is subject to approval by the<br />
National Housing <strong>Bank</strong>, the Indian supervisory authority.<br />
As part of the acquisition of the Sal. Oppenheim Group, the Group acquired several investments that are<br />
allocated to the Corporate Division Asset and Wealth Management (AWM) and expected to be sold within one<br />
year. Accordingly, the Group classified several private equity investments that were previously acquired as part<br />
of the acquisition of the Sal. Oppenheim Group and are allocated to the Corporate Division Asset and Wealth<br />
Management (AWM) as held for sale as of December 31, 2010.<br />
As of December 31, 2010, the Group also classified a subsidiary that is allocated to the Corporate Division Asset<br />
and Wealth Management (AWM) as held for sale. The transaction has been approved by local authorities and is<br />
expected to be completed during the first quarter of 2011. The reclassification to held for sale resulted in the<br />
reclassification of the related goodwill of € 7 million as of December 31, 2010 to assets held for sale.<br />
As of December 31, 2010, the Group also classified an investment in an associate allocated to the Corporate<br />
Division Corporate <strong>Bank</strong>ing & Securities (CB&S) as held for sale. The initial reclassification of the investment<br />
on September 30, 2010 resulted in an impairment loss of € 72 million recorded in the third quarter 2010 which<br />
was included in net income (loss) from equity method investments. During the fourth quarter 2010, the other<br />
noncontrolling shareholders agreed the sale of their stakes and, under the terms of the shareholder’s agreement,<br />
the Group could be forced to sell its stake at the same price. Accordingly, the investment was written down to<br />
fair value less costs to sell which resulted in an additional charge of € 40 million recognized in the fourth quarter<br />
2010 included in other income. The sale of the company including DB’s stake closed on January 11, 2011.<br />
As of December 31, 2010, the Group also classified a subsidiary as a disposal group held for sale and reported<br />
the related balance sheet items within other assets and other liabilities. The disposal group is allocated to the<br />
Corporate Division Corporate <strong>Bank</strong>ing & Securities (CB&S) and mainly included a German real estate investment<br />
property asset. The entity is expected to be sold within one year.
<strong>Deutsche</strong> <strong>Bank</strong> 02 – Consolidated Financial Statements 280<br />
Financial <strong>Report</strong> 2010 Notes to the Consolidated Balance Sheet<br />
25 – Assets Held for Sale<br />
The following table summarizes the principal components of other non-current assets and disposal groups<br />
which the Group classified as held for sale for the years ended December 31, 2010, and 2009, respectively.<br />
in € m. Dec 31, 2010 Dec 31, 2009<br />
Cash, due from banks and Interest-earning deposits with banks 15 16<br />
Financial assets available for sale 235 –<br />
Investments in associates – 18<br />
Loans 867 –<br />
Property and equipment 45 21<br />
Other assets 25 51<br />
Total assets classified as held for sale 1,188 106<br />
Long-term debt 815 21<br />
Other liabilities 10 2<br />
Total liabilities classified as held for sale 825 23<br />
Unrealized net gains of € 16 million relating to the other assets and liabilities which the Group classified as held<br />
for sale were recognized directly in accumulated other comprehensive income. These unrealized net gains will<br />
remain in equity until such time as the investments are sold, at which time the net gains shall be reclassified<br />
from equity to profit or loss.<br />
Disposals during 2010<br />
In August 2010, the Group sold its subsidiary BHF Asset Servicing GmbH which was allocated to AWM and<br />
was previously classified as held for sale. The purchase of this subsidiary was treated as a separate transaction<br />
apart from the acquisition of the Sal. Oppenheim Group in the first quarter 2010. In 2010 an impairment loss of<br />
€ 4 million was recorded in other income.<br />
In the fourth quarter of 2010, the Group sold several assets held for sale that were allocated to the Corporate<br />
Division Asset and Wealth Management (AWM). These investments were previously acquired as part of the<br />
acquisition of the Sal. Oppenheim Group.<br />
A further impairment of € 2 million, which was recorded in the second quarter 2010 in CB&S, related to a disposal<br />
group which was sold in June 2010.<br />
Changes in Classification during 2010<br />
In 2010 the market conditions in different regions changed and hence the timing of the ultimate disposal of<br />
several investments became uncertain. Accordingly, several disposal groups, investments in associates and a<br />
loan allocated to CB&S were no longer classified as held for sale in the third quarter 2010, due to the current<br />
market conditions. These changes in classification did not result in any additional impairment loss. However,<br />
an impairment loss before reclassification of € 3 million was recorded in other income in CB&S in the second<br />
quarter 2010.
<strong>Deutsche</strong> <strong>Bank</strong> 02 – Consolidated Financial Statements 281<br />
Financial <strong>Report</strong> 2010 Notes to the Consolidated Balance Sheet<br />
25 – Assets Held for Sale<br />
Assets Held for Sale as of December 31, 2009<br />
As of December 31, 2009, the Group classified several disposal groups (comprising nineteen subsidiaries),<br />
three investments in associates, a loan and several real estate assets allocated to the Corporate Division<br />
Corporate <strong>Bank</strong>ing & Securities (CB&S) as held for sale. The Group reported these items in other assets and<br />
other liabilities and valued them at the lower of their carrying amount or fair value less costs to sell resulting in<br />
an impairment loss of € 10 million relating to the disposal groups which was recorded in other income in CB&S.<br />
The disposal groups, the three investments in associates and the loan related to a series of renewable energy<br />
development projects. The real estate assets included commercial and residential property in North America<br />
owned through foreclosure. In 2010, these items were no longer classified as held for sale due to the current<br />
market conditions that made the timing of the ultimate disposal of these investments uncertain.<br />
Assets Held for Sale as of December 31, 2008<br />
As of December 31, 2008, the Group classified several real estate assets as held for sale. The Group reported<br />
these items in other assets and valued them at the lower of their carrying amount or fair value less costs to sell,<br />
which did not lead to an impairment loss in 2008. The real estate assets included commercial and residential<br />
property in Germany and North America owned by CB&S through foreclosure. The real estate assets in Germany<br />
and most of the items in North America were sold in 2009.<br />
As of December 31, 2007, the Group classified three disposal groups (two subsidiaries and a consolidated fund)<br />
and several non-current assets as held for sale. The Group reported these items in other assets and other<br />
liabilities, and valued them at the lower of their carrying amount or fair value less costs to sell, resulting in an<br />
impairment loss of € 2 million in 2007, which was recorded in income before income taxes of the Group Division<br />
Corporate Investments (CI).<br />
The three disposal groups included two in the Corporate Division Asset and Wealth Management (AWM). One<br />
was an Italian life insurance company for which a disposal contract was signed in December 2007 and which<br />
was sold in the first half of 2008, and a second related to a real estate fund in North America, which ceased to<br />
be classified as held for sale as of December 31, 2008. The expenses which were not to be recognized during<br />
the held for sale period, were recognized at the date of reclassification. This resulted in an increase of other<br />
expenses of € 13 million in AWM in 2008. This amount included expenses of € 3 million which related to 2007.<br />
Due to the market conditions the timing of the ultimate disposal of this investment was uncertain. The last<br />
disposal group, a subsidiary in CI, was classified as held for sale at year-end 2006 but, due to circumstances<br />
arising in 2007 that were previously considered unlikely, was not sold in 2007. In 2008, the Group changed its<br />
plans to sell the subsidiary because the envisaged sales transaction did not materialize due to the lack of interest<br />
of the designated buyer. In the light of the weak market environment there were no sales activities regarding<br />
this subsidiary. The reclassification did not lead to any impact on revenues and expenses.
<strong>Deutsche</strong> <strong>Bank</strong> 02 – Consolidated Financial Statements 282<br />
Financial <strong>Report</strong> 2010 Notes to the Consolidated Balance Sheet<br />
26 – Other Assets and Other Liabilities<br />
Non-current assets classified as held for sale as of December 31, 2007 included two alternative investments of<br />
AWM in North America, several office buildings in CI and in the Corporate Division Private & Business Clients<br />
(PBC), and other real estate assets in North America, obtained by CB&S through foreclosure. While the office<br />
buildings in CI and PBC and most of the real estate in CB&S were sold during 2008, the ownership structure of<br />
the two alternative investments Maher Terminals LLC and Maher Terminals of Canada Corp. was restructured<br />
and the Group consolidated these investments commencing June 30, 2008. Due to the market conditions the<br />
timing of the ultimate disposal of these investments was uncertain. As a result, the assets and liabilities were<br />
no longer classified as held for sale at the end of the third quarter 2008. The revenues and expenses which<br />
were not to be recognized during the held for sale period were recognized at the date of reclassification. This<br />
resulted in a negative impact on other income of € 62 million and an increase of other expenses of € 38 million<br />
in AWM in 2008. These amounts included a charge to revenues of € 20 million and expenses of € 21 million<br />
which related to 2007.<br />
26 –<br />
Other Assets and Other Liabilities<br />
The following are the components of other assets and other liabilities.<br />
in € m. Dec 31, 2010 Dec 31, 2009<br />
Other assets:<br />
Brokerage and securities related receivables<br />
Cash/margin receivables 46,132 43,890<br />
Receivables from prime brokerage 11,324 6,837<br />
Pending securities transactions past settlement date 4,834 9,229<br />
Receivables from unsettled regular way trades 41,133 33,496<br />
Total brokerage and securities related receivables 103,423 93,452<br />
Accrued interest receivable 3,941 3,426<br />
Assets held for sale 13,468 106<br />
Other 28,397 24,554<br />
Total other assets 149,229 121,538<br />
As of December 31, 2009, “Other” in the table above included the investment property The Cosmopolitan of<br />
Las Vegas with a carrying value of € 946 million (please see Note 01 “Significant Accounting Policies” for the<br />
valuation model applied for investment property). This investment was reclassified to Property and Equipment<br />
when it commenced its business activity in December 2010.<br />
For further details on the assets held for sale please refer to Note 25 “Assets Held for Sale”.
<strong>Deutsche</strong> <strong>Bank</strong> 02 – Consolidated Financial Statements 283<br />
Financial <strong>Report</strong> 2010 Notes to the Consolidated Balance Sheet<br />
27 – Deposits<br />
in € m. Dec 31, 2010 Dec 31, 2009<br />
Other liabilities:<br />
Brokerage and securities related payables<br />
Cash/margin payables 42,596 40,448<br />
Payables from prime brokerage 27,772 31,427<br />
Pending securities transactions past settlement date 3,137 5,708<br />
Payables from unsettled regular way trades 42,641 33,214<br />
Total brokerage and securities related payables 116,146 110,797<br />
Accrued interest payable 3,956 3,713<br />
Liabilities held for sale 12,598 23<br />
Other 49,127 39,748<br />
Total other liabilities 181,827 154,281<br />
For further details on the liabilities held for sale please refer to Note 25 “Assets Held for Sale”.<br />
27 –<br />
Deposits<br />
The following are the components of deposits.<br />
in € m. Dec 31, 2010 Dec 31, 2009<br />
Noninterest-bearing demand deposits 89,068 51,731<br />
Interest-bearing deposits<br />
Demand deposits 120,154 117,955<br />
Time deposits 183,861 108,730<br />
Savings deposits 140,901 65,804<br />
Total interest-bearing deposits 444,916 292,489<br />
Total deposits 533,984 344,220<br />
The increase in deposits is primarily related to the first-time consolidation of Postbank.
<strong>Deutsche</strong> <strong>Bank</strong> 02 – Consolidated Financial Statements 284<br />
Financial <strong>Report</strong> 2010 Notes to the Consolidated Balance Sheet<br />
28 – Provisions<br />
28 –<br />
Provisions<br />
The following table presents movements by class of provisions.<br />
in € m.<br />
Operational/<br />
Litigation Other Total 1<br />
Balance as of January 1, 2009 762 446 1,208<br />
Changes in the group of consolidated companies 2 4 6<br />
New provisions 338 152 490<br />
Amounts used (164) (155) (319)<br />
Unused amounts reversed (183) (115) (298)<br />
Effects from exchange rate fluctuations/Unwind of discount 3 9 12<br />
Other – – –<br />
Balance as of December 31, 2009 758 341 1,099<br />
Changes in the group of consolidated companies 44 1,148 2<br />
1,192<br />
New provisions 318 225 543<br />
Amounts used (511) (141) (652)<br />
Unused amounts reversed (130) (102) (232)<br />
Effects from exchange rate fluctuations/Unwind of discount 44 15 59<br />
Other 3 (7) (17) (24)<br />
Balance as of December 31, 2010 516 1,469 1,985<br />
1 For the remaining portion of provisions as disclosed on the consolidated balance sheet, please see Note 19 “Allowance for Credit Losses”, in which allowances for<br />
credit related off-balance sheet positions are disclosed.<br />
2 The increase is mainly attributable to the consolidation of <strong>Deutsche</strong> Postbank AG. Included in this amount are provisions in the home savings business of<br />
€ 842 million as of December 31, 2010.<br />
3 Includes mainly reclassifications to liabilities held for sale.<br />
Operational and Litigation<br />
The Group defines operational risk as the potential for incurring losses in relation to staff, technology, projects,<br />
assets, customer relationships, other third parties or regulators, such as through unmanageable events, business<br />
disruption, inadequately-defined or failed processes or control and system failure.<br />
The Group operates in a legal and regulatory environment that exposes it to significant litigation risks. As a<br />
result, the Group is involved in litigation, arbitration and regulatory proceedings in Germany and in a number of<br />
jurisdictions outside Germany, including the United States, arising in the ordinary course of business. The<br />
Group provides for potential losses that may arise out of contingencies, including contingencies in respect of<br />
such matters, when it is probable that a liability exists, and the amount can be reasonably estimated. In<br />
accordance with IAS 37, Provisions, Contingent Liabilities and Contingent Assets, for certain contingencies<br />
information generally required is not disclosed, if the Group concludes that the disclosure can be expected to<br />
seriously prejudice the outcome of the proceeding.<br />
Contingencies in respect of legal matters are subject to many uncertainties and the outcome of individual matters<br />
is not predictable with assurance. Significant judgment is required in assessing probability and making<br />
estimates in respect of contingencies, and the Group’s final liabilities may ultimately be materially different. The<br />
Group’s total liability recorded in respect of litigation, arbitration and regulatory proceedings is determined on a<br />
case-by-case basis and represents an estimate of probable losses after considering, among other factors, the<br />
progress of each case, the Group’s experience and the experience of others in similar cases, and the opinions<br />
and views of legal counsel. Although the final resolution of any such matters could have a material effect on the<br />
Group’s consolidated operating results for a particular reporting period, the Group believes that it will not<br />
materially affect its consolidated financial position. In respect of each of the matters specifically described below,<br />
some of which consist of a number of claims, it is the Group’s belief that the reasonably possible losses relating<br />
to each claim in excess of any provisions are either not material or not estimable.
<strong>Deutsche</strong> <strong>Bank</strong> 02 – Consolidated Financial Statements 285<br />
Financial <strong>Report</strong> 2010 Notes to the Consolidated Balance Sheet<br />
28 – Provisions<br />
The Group’s significant legal proceedings, which are required to be disclosed in accordance with IAS 37, are<br />
described below.<br />
Kirch Litigation. In May 2002, Dr. Leo Kirch personally and as an assignee of two entities of the former Kirch<br />
Group, i.e., PrintBeteiligungs GmbH and the group holding company TaurusHolding GmbH & Co. KG, initiated<br />
legal action against Dr. Rolf-E. Breuer and <strong>Deutsche</strong> <strong>Bank</strong> AG alleging that a statement made by Dr. Breuer<br />
(then the Spokesman of <strong>Deutsche</strong> <strong>Bank</strong> AG’s Management Board) in an interview with Bloomberg television<br />
on February 4, 2002 regarding the Kirch Group was in breach of laws and resulted in financial damage.<br />
On January 24, 2006, the German Federal Supreme Court sustained the action for the declaratory judgment<br />
only in respect of the claims assigned by PrintBeteiligungs GmbH. Such action and judgment did not require a<br />
proof of any loss caused by the statement made in the interview. PrintBeteiligungs GmbH is the only company<br />
of the Kirch Group which was a borrower of <strong>Deutsche</strong> <strong>Bank</strong> AG. Claims by Dr. Kirch personally and by Taurus-<br />
Holding GmbH & Co. KG were dismissed. In May 2007, Dr. Kirch filed an action for payment as assignee of<br />
PrintBeteiligungs GmbH against <strong>Deutsche</strong> <strong>Bank</strong> AG and Dr. Breuer. After having changed the basis for the<br />
computation of his alleged damages in the meantime, Dr. Kirch currently claims payment of approximately<br />
€ 1.3 billion plus interest. On February 22, 2011, the District Court Munich I dismissed the lawsuit in its <strong>entire</strong>ty.<br />
Dr. Kirch can file a notice of appeal against the decision. In these proceedings Dr. Kirch had to prove that such<br />
statement caused financial damages to PrintBeteiligungs GmbH and the amount thereof.<br />
On December 31, 2005, KGL Pool GmbH filed a lawsuit against <strong>Deutsche</strong> <strong>Bank</strong> AG and Dr. Breuer. The lawsuit<br />
is based on alleged claims assigned from various subsidiaries of the former Kirch Group. KGL Pool GmbH<br />
seeks a declaratory judgment to the effect that <strong>Deutsche</strong> <strong>Bank</strong> AG and Dr. Breuer are jointly and severally<br />
liable for damages as a result of the interview statement and the behavior of <strong>Deutsche</strong> <strong>Bank</strong> AG in respect of<br />
several subsidiaries of the Kirch Group. In December 2007, KGL Pool GmbH supplemented this lawsuit by a<br />
motion for payment of approximately € 2.0 billion plus interest as compensation for the purported damages<br />
which two subsidiaries of the former Kirch Group allegedly suffered as a result of the statement by Dr. Breuer.<br />
On March 31, 2009 the District Court Munich I dismissed the lawsuit in its <strong>entire</strong>ty. The plaintiff appealed the<br />
decision. In the view of <strong>Deutsche</strong> <strong>Bank</strong>, due to the lack of a relevant contractual relationship with any of these<br />
subsidiaries there is no basis for such claims and neither the causality in respect of the basis and scope of the<br />
claimed damages nor the effective assignment of the alleged claims to KGL Pool GmbH has been sufficiently<br />
substantiated.
<strong>Deutsche</strong> <strong>Bank</strong> 02 – Consolidated Financial Statements 286<br />
Financial <strong>Report</strong> 2010 Notes to the Consolidated Balance Sheet<br />
28 – Provisions<br />
Asset Backed Securities Matters. <strong>Deutsche</strong> <strong>Bank</strong> AG, along with certain affiliates (collectively referred to as<br />
“<strong>Deutsche</strong> <strong>Bank</strong>”), has received subpoenas and requests for information from certain regulators and government<br />
entities concerning its activities regarding the origination, purchase, securitization, sale and trading of asset<br />
backed securities, asset backed commercial paper and credit derivatives, including, among others, residential<br />
mortgage backed securities, collateralized debt obligations and credit default swaps. <strong>Deutsche</strong> <strong>Bank</strong> is cooperating<br />
fully in response to those subpoenas and requests for information. <strong>Deutsche</strong> <strong>Bank</strong> has also been named as<br />
defendant in various civil litigations (including putative class actions), brought under federal and state securities<br />
laws and state common law, related to residential mortgage backed securities. Included in those litigations are (1)<br />
a putative class action pending in California Superior Court in Los Angeles County regarding the role of <strong>Deutsche</strong><br />
<strong>Bank</strong>’s subsidiary <strong>Deutsche</strong> <strong>Bank</strong> Securities Inc. (“DBSI”), along with other financial institutions, as an underwriter<br />
of offerings of certain securities issued by Countrywide Financial Corporation or an affiliate (“Countrywide”), as<br />
to which there is a settlement agreement that has been preliminarily but not yet finally approved by the Court,<br />
and a putative class action pending in the United States District Court for the Central District of California<br />
regarding the role of DBSI, along with other financial institutions, as an underwriter of offerings of certain<br />
mortgage pass-through certificates issued by Countrywide; (2) a putative class action pending in the United<br />
States District Court for the Southern District of New York regarding the role of DBSI, along with other financial<br />
institutions, as an underwriter of offerings of certain mortgage pass-through certificates issued by affiliates of<br />
Novastar Mortgage Funding Corporation; (3) a putative class action pending in the United States District Court<br />
for the Southern District of New York regarding the role of DBSI, along with other financial institutions, as an<br />
underwriter of offerings of certain mortgage pass-through certificates issued by affiliates of IndyMac MBS, Inc.;<br />
(4) a putative class action pending in the United States District Court for the Northern District of California<br />
regarding the role of DBSI, along with other financial institutions, as an underwriter of offerings of certain mortgage<br />
pass-through certificates issued by affiliates of Wells Fargo Asset Securities Corporation; (5) a putative class<br />
action in the United States District Court for the Southern District of New York regarding the role of a number of<br />
financial institutions, including DBSI, as underwriter, of certain mortgage pass-through certificates issued by<br />
affiliates of Residential Accredit Loans, Inc.; and (6) a lawsuit filed by the Federal Home Loan <strong>Bank</strong> of San<br />
Francisco (“FHLB SF”) pending in the United States District Court for the Northern District of California regarding<br />
the role of a number of financial institutions, including certain affiliates of <strong>Deutsche</strong> <strong>Bank</strong>, as issuer and underwriter<br />
of certain mortgage pass-through certificates purchased by FHLB SF. In addition, certain affiliates of <strong>Deutsche</strong><br />
<strong>Bank</strong>, including DBSI, have been named in a putative class action pending in the United States District Court for<br />
the Eastern District of New York regarding their roles as issuer and underwriter of certain mortgage pass-through<br />
securities. On April 5, 2010, the Court granted in part and denied in part <strong>Deutsche</strong> <strong>Bank</strong>’s motion to dismiss this<br />
complaint. Each of the civil litigations is otherwise in its early stages.<br />
From 2005 through 2008, as part of our U.S. residential mortgage loan business, we sold approximately<br />
U.S.$ 85 billion of loans into private label securitizations and U.S.$ 71 billion through whole loan sales, including<br />
to U.S. government-sponsored entities such as the Federal Home Loan Mortgage Corporation and the Federal<br />
National Mortgage Association. We have been presented with demands to repurchase loans or indemnify<br />
purchasers, other investors or financial insurers with respect to losses allegedly caused by material breaches of<br />
representations and warranties. Our general practice is to process valid repurchase claims that are presented in<br />
compliance with contractual rights. Where we believe no such valid basis for repurchase claims exists, we reject<br />
them and no longer consider them outstanding for our tracking purposes. As of December 31, 2010, we have<br />
approximately U.S.$ 588 million of outstanding mortgage repurchase demands (based on original principal<br />
balance of the loans). Against these claims, we have established reserves that are not material and that we<br />
believe to be adequate. As of December 31, 2010, we have completed repurchases and otherwise settled<br />
claims on loans with an original principal balance of approximately U.S.$ 1.8 billion. In connection with those<br />
repurchases and settlements, we have obtained releases for potential claims on approximately U.S.$ 21.9 billion<br />
of loans sold by us as described above.
<strong>Deutsche</strong> <strong>Bank</strong> 02 – Consolidated Financial Statements 287<br />
Financial <strong>Report</strong> 2010 Notes to the Consolidated Balance Sheet<br />
28 – Provisions<br />
Auction Rate Securities. <strong>Deutsche</strong> <strong>Bank</strong> AG and DBSI are the subjects of a putative class action, filed in the<br />
United States District Court for the Southern District of New York, asserting various claims under the federal<br />
securities laws on behalf of all persons or entities who purchased and continue to hold auction rate preferred<br />
securities and auction rate securities (together “ARS”) offered for sale by <strong>Deutsche</strong> <strong>Bank</strong> AG and DBSI between<br />
March 17, 2003 and February 13, 2008. On December 9, 2010, the court dismissed the putative class action<br />
with prejudice. By agreement, Plaintiff has until August 18, 2011 to file a notice of appeal of the dismissal.<br />
<strong>Deutsche</strong> <strong>Bank</strong> AG, DBSI and/or <strong>Deutsche</strong> <strong>Bank</strong> Alex. Brown, a division of DBSI, have also been named as<br />
defendants in 17 individual actions asserting various claims under the federal securities laws and state common<br />
law arising out of the sale of ARS. Nine of the individual actions are pending, and eight of the individual actions<br />
have been resolved and dismissed with prejudice. <strong>Deutsche</strong> <strong>Bank</strong> AG was also named as a defendant, along<br />
with ten other financial institutions, in two putative class actions, filed in the United States District Court for the<br />
Southern District of New York, asserting violations of the antitrust laws. The putative class actions allege that<br />
the defendants conspired to artificially support and then, in February 2008, restrain the ARS market. On or<br />
about January 26, 2010, the court dismissed the two putative class actions. The plaintiffs have filed appeals of<br />
the dismissals.<br />
<strong>Deutsche</strong> <strong>Bank</strong> AG and DBSI have also been the subjects of proceedings by state and federal securities<br />
regulatory and enforcement agencies relating to the marketing and sale of ARS. In August 2008, <strong>Deutsche</strong><br />
<strong>Bank</strong> AG and its subsidiaries entered into agreements in principle with the New York Attorney General’s Office<br />
(“NYAG”) and the North American Securities Administration Association, representing a consortium of other<br />
states and U.S. territories, pursuant to which <strong>Deutsche</strong> <strong>Bank</strong> AG and its subsidiaries agreed to purchase from<br />
their retail, certain smaller and medium-sized institutional, and charitable clients, ARS that those clients<br />
purchased from <strong>Deutsche</strong> <strong>Bank</strong> AG and its subsidiaries prior to February 13, 2008; to work expeditiously to<br />
provide liquidity solutions for their larger institutional clients who purchased ARS from <strong>Deutsche</strong> <strong>Bank</strong> AG and<br />
its subsidiaries; to pay an aggregate penalty of U.S.$ 15 million to state regulators; and to be subject to state<br />
orders requiring future compliance with applicable state laws. On June 3, 2009, DBSI finalized settlements with<br />
the NYAG and the New Jersey Bureau of Securities that were consistent with the August 2008 agreements in<br />
principle, and DBSI entered into a settlement with the Securities and Exchange Commission (“SEC”) that<br />
incorporated the terms of the agreements in principle with the states. DBSI has since received proposed<br />
settled orders from a number of state and territorial agencies pursuant to which those agencies have claimed<br />
their respective shares of the U.S.$ 15 million penalty. DBSI expects to finalize those settled orders and pay<br />
the requisite shares of the penalty to the requesting states over the next several months.
<strong>Deutsche</strong> <strong>Bank</strong> 02 – Consolidated Financial Statements 288<br />
Financial <strong>Report</strong> 2010 Notes to the Consolidated Balance Sheet<br />
29 – Other Short-Term Borrowings<br />
Trust Preferred Securities. <strong>Deutsche</strong> <strong>Bank</strong> AG and certain of its affiliates and officers are the subject of a<br />
consolidated putative class action, filed in the United States District Court for the Southern District of New York,<br />
asserting claims under the federal securities laws on behalf of persons who purchased certain trust preferred<br />
securities issued by <strong>Deutsche</strong> <strong>Bank</strong> and its affiliates between October 2006 and May 2008. Claims are asserted<br />
under Sections 11, 12(a)(2), and 15 of the Securities Act of 1933. An amended and consolidated class action<br />
complaint was filed on January 25, 2010. A motion to dismiss is pending.<br />
Other Provisions<br />
Other provisions primarily include provisions in the home savings business of <strong>Deutsche</strong> Postbank Group which<br />
relate to payments for interest bonuses, reimbursements of arrangement fees of customers and changes in the<br />
interest rates. Other provisions also include non-staff related provisions that are not captured on other specific<br />
provision accounts.<br />
29 –<br />
Other Short-Term Borrowings<br />
The following are the components of other short-term borrowings.<br />
in € m. Dec 31, 2010 Dec 31, 2009<br />
Other short-term borrowings:<br />
Commercial paper 31,322 20,906<br />
Other 33,668 21,991<br />
Total other short-term borrowings 64,990 42,897
<strong>Deutsche</strong> <strong>Bank</strong> 02 – Consolidated Financial Statements 289<br />
Financial <strong>Report</strong> 2010 Notes to the Consolidated Balance Sheet<br />
30 – Long-Term Debt and Trust Preferred Securities<br />
30 –<br />
Long-Term Debt and Trust Preferred Securities<br />
Long-Term Debt<br />
The following table presents the Group’s long-term debt by contractual maturity.<br />
in € m.<br />
Due in<br />
2011<br />
Due in<br />
<strong>2012</strong><br />
Due in<br />
2013<br />
Due in<br />
2014<br />
Due in<br />
2015<br />
Due after<br />
2015<br />
Total<br />
Dec 31,<br />
2010<br />
Total<br />
Dec 31,<br />
2009<br />
Senior debt: 1<br />
Bonds and notes:<br />
Fixed rate 15,096 13,570 10,480 10,636 16,130 39,799 105,711 76,536<br />
Floating rate 10,446 11,432 6,127 3,205 3,374 17,012 51,596 47,646<br />
Subordinated debt: 1<br />
Bonds and notes:<br />
Fixed rate 446 439 1,637 689 845 3,157 7,213 3,548<br />
Floating rate 2,882 509 102 277 547 823 5,140 4,052<br />
Total long-term debt 1 28,870 25,950 18,346 14,807 20,896 60,791 169,660 131,782<br />
1 Inclusion of Postbank increased long-term debt in 2010 by € 38 billion.<br />
The Group did not have any defaults of principal, interest or other breaches with respect to its liabilities in 2010<br />
and 2009.<br />
Trust Preferred Securities<br />
The following table summarizes the Group’s fixed and floating rate trust preferred securities, which are perpetual<br />
instruments, redeemable at specific future dates at the Group’s option.<br />
in € m. Dec 31, 2010 Dec 31, 2009<br />
Fixed rate 11,218 9,971<br />
Floating rate 1,032 606<br />
Total trust preferred securities 12,250 10,577
<strong>Deutsche</strong> <strong>Bank</strong> 02 – Consolidated Financial Statements 290<br />
Financial <strong>Report</strong> 2010 Additional Notes<br />
31 – Common Shares<br />
Additional Notes<br />
31 –<br />
Common Shares<br />
Common Shares<br />
<strong>Deutsche</strong> <strong>Bank</strong>’s share capital consists of common shares issued in registered form without par value. Under<br />
German law, each share represents an equal stake in the subscribed capital. Therefore, each share has a<br />
nominal value of € 2.56, derived by dividing the total amount of share capital by the number of shares.<br />
Number of shares<br />
Issued and<br />
fully paid Treasury shares Outstanding<br />
Common shares, January 1, 2009 570,859,015 (8,192,060) 562,666,955<br />
Shares issued under share-based compensation plans – – –<br />
Capital increase 50,000,000 – 50,000,000<br />
Shares purchased for treasury – (476,284,991) (476,284,991)<br />
Shares sold or distributed from treasury – 483,793,356 483,793,356<br />
Common shares, December 31, 2009 620,859,015 (683,695) 620,175,320<br />
Shares issued under share-based compensation plans – – –<br />
Capital increase 308,640,625 – 308,640,625<br />
Shares purchased for treasury – (325,966,381) (325,966,381)<br />
Shares sold or distributed from treasury – 316,212,796 316,212,796<br />
Common shares, December 31, 2010 929,499,640 (10,437,280) 919,062,360<br />
There are no issued ordinary shares that have not been fully paid.<br />
Shares purchased for treasury consist of shares held by the Group for a period of time, as well as any shares<br />
purchased with the intention of being resold in the short-term. In addition, the Group has bought back shares<br />
for equity compensation purposes and for the implementation of a subscription ratio of 2:1 in the 2010 share<br />
capital increase. All such transactions were recorded in shareholders’ equity and no revenues and expenses<br />
were recorded in connection with these activities. As of December 31, 2010, the number of shares held in<br />
Treasury totaled 10,437,280 shares. This treasury stock will be used for future share-based compensation.<br />
On October 6, 2010, <strong>Deutsche</strong> <strong>Bank</strong> AG completed a capital increase from authorized capital against cash<br />
contributions. In total, 308,640,625 new registered no par value shares (common shares) were issued, resulting<br />
in net proceeds of € 10.1 billion (after expenses of approximately € 0.1 billion, net of tax). The new shares were<br />
issued with full dividend rights for the year 2010 through subscription rights. 99.31 % of the subscription rights<br />
were exercised, and thus 306,511,140 new shares were issued at a subscription price of € 33.00 per share.<br />
The remaining 2,129,485 new shares were placed in Xetra trading at a weighted average price of € 41.34.<br />
Authorized and Conditional Capital<br />
<strong>Deutsche</strong> <strong>Bank</strong>’s share capital was increased by issuing new shares for cash consideration through the aforementioned<br />
capital increase. The General Meeting had granted the Management Board authorizations to increase<br />
the share capital – with the consent of the Supervisory Board – through the issue of new shares by up to a total<br />
of € 790,120,000. As of December 31, 2010, the previously authorized but unissued capital of <strong>Deutsche</strong> <strong>Bank</strong><br />
was <strong>entire</strong>ly utilized.
<strong>Deutsche</strong> <strong>Bank</strong> 02 – Consolidated Financial Statements 291<br />
Financial <strong>Report</strong> 2010 Additional Notes<br />
32 – Share-Based Compensation Plans<br />
<strong>Deutsche</strong> <strong>Bank</strong> also had a total conditional capital of € 636,400,000 as of December 31, 2010. Conditional capital<br />
is available for various instruments that may potentially be converted into common shares.<br />
The <strong>Annual</strong> General Meeting on May 27, 2010 authorized the Management Board to issue, once or more than<br />
once, bearer or registered participatory notes with bearer warrants and/or convertible participatory notes, bonds<br />
with warrants, and/or convertible bonds on or before April 30, 2015. For this purpose, share capital was increased<br />
conditionally by up to € 230,400,000.<br />
Dividends<br />
The following table presents the amount of dividends proposed or declared for the years ended December 31,<br />
2010, 2009 and 2008, respectively.<br />
2010<br />
(proposed) 2009 2008<br />
Cash dividends declared 1 (in € m.) 697 466 309<br />
Cash dividends declared per common share (in €) 0.75 0.75 0.50<br />
1 Cash dividend for 2010 is based on the number of shares issued as of December 31, 2010.<br />
No dividends have been declared since the balance sheet date.<br />
32 –<br />
Share-Based Compensation Plans<br />
Share-Based Compensation Plans used for Granting New Awards in 2010<br />
In 2010, the Group made grants of share-based compensation under the DB Equity Plan. All awards represent<br />
a contingent right to receive <strong>Deutsche</strong> <strong>Bank</strong> common shares after a specified period of time. The award recipient<br />
is not entitled to receive dividends before the settlement of the award. The basic terms of the DB Equity Plan<br />
are presented in the table below.<br />
An award, or portions of it, granted under the terms and conditions of the DB Equity Plan may be forfeited fully<br />
or partly if the recipient voluntarily terminates employment before the end of the relevant vesting period. Vesting<br />
usually continues after termination of employment in cases such as redundancy or retirement. Vesting is<br />
accelerated if the recipient’s termination of employment is due to death or disability.<br />
Based on new regulatory requirements the award for selected senior employees comprises an additional<br />
forfeiture rule if employees are in breach of internal policies or law.<br />
In countries where legal or other restrictions hinder the delivery of shares, a cash plan variant of the DB Equity<br />
Plan was used for making awards (as in previous years from 2007 onwards).<br />
In 2010 the Group introduced a new broad-based employee share ownership plan named Global Share Purchase<br />
Plan (GSPP). As per December 31, 2010, entities in 27 countries enrolled to the new plan.
<strong>Deutsche</strong> <strong>Bank</strong> 02 – Consolidated Financial Statements 292<br />
Financial <strong>Report</strong> 2010 Additional Notes<br />
32 – Share-Based Compensation Plans<br />
Plan Vesting schedule Early retirement provisions Eligibility<br />
DB Equity<br />
Plan<br />
Global Share<br />
Purchase Plan<br />
(GSPP)<br />
<strong>Annual</strong> Award<br />
Graded vesting in nine equal<br />
tranches between 12 months<br />
and 45 months after grant<br />
or cliff vesting after 45 months<br />
Retention/New Hire Individual specification 1<br />
Broad-based employee share<br />
ownership plan<br />
1 Weighted average relevant service period: 28 months.<br />
Yes<br />
100 % : 12 months No<br />
The Group has other local share-based compensation plans, none of which, individually or in the aggregate,<br />
are material to the consolidated financial statements.<br />
Share-Based Compensation Plans used for Granting Awards prior to 2010<br />
Share Plans<br />
Prior to 2010, the Group granted share-based compensation under a number of other plans. The following<br />
table summarizes the main features of these prior plans.<br />
Plan Vesting schedule<br />
Restricted Equity Units (REU) Plan <strong>Annual</strong> Award<br />
80 % : 48 months 1<br />
20 % : 54 months<br />
1/3 : 6 months<br />
<strong>Annual</strong> Award 1/3 : 18 months<br />
DB Share Scheme<br />
1/3 : 30 months<br />
Off Cycle Award<br />
Individual<br />
specification<br />
DB Key Employee Equity Plan (KEEP) –<br />
Individual<br />
specification<br />
Global Share Plan – 100 % : 12 months No<br />
Global Partnership Plan Equity Units <strong>Annual</strong> Award<br />
80 % : 24 months 2<br />
20 % : 42 months<br />
Global Share Plan – Germany – 100 % : 12 months No<br />
DB Equity Plan<br />
<strong>Annual</strong> Award<br />
Retention/New Hire<br />
50 % : 24 months<br />
25 % : 36 months<br />
25 % : 48 months<br />
Individual<br />
specification<br />
1 With delivery after further 6 months.<br />
2 With delivery after further 18 months.<br />
3 Participant must have been active and working for the Group for at least one year at date of grant.<br />
Select employees as annual<br />
retention<br />
Select employees to attract or<br />
retain key staff<br />
Employee plan in select<br />
countries granting up to<br />
10 shares per employee<br />
Early retirement<br />
provisions Eligibility Last grant in<br />
Yes<br />
Select employees as<br />
annual retention<br />
2006<br />
No<br />
No<br />
Select employees as<br />
annual retention<br />
Select employees to attract<br />
or retain key staff<br />
2006<br />
2006<br />
No Select executives 2005<br />
All employee plan granting<br />
up to 10 shares per<br />
employee<br />
2007<br />
No Group Board 2008<br />
No<br />
No<br />
Employee plan granting up<br />
to 10 shares per employee<br />
in Germany 3<br />
Select employees as<br />
annual retention<br />
Select employees to attract<br />
or retain key staff<br />
2008<br />
2009<br />
(under this<br />
vesting<br />
schedule)
<strong>Deutsche</strong> <strong>Bank</strong> 02 – Consolidated Financial Statements 293<br />
Financial <strong>Report</strong> 2010 Additional Notes<br />
32 – Share-Based Compensation Plans<br />
All Plans represent a contingent right to receive <strong>Deutsche</strong> <strong>Bank</strong> common shares after a specified period of time.<br />
The award recipient is not entitled to receive dividends before the settlement of the award.<br />
An award, or portion of it, may be forfeited if the recipient voluntarily terminates employment before the end of the<br />
relevant vesting period. Early retirement provisions for the REU Plan or DB Equity Plan, however, allow continued<br />
vesting after voluntary termination of employment when certain conditions regarding age or tenure are fulfilled.<br />
Vesting usually continues after termination of employment in certain cases, such as redundancy or retirement.<br />
Vesting is accelerated if the recipient’s termination of employment is due to death or disability.<br />
In countries where legal or other restrictions hinder the delivery of shares, a cash plan variant of the DB Equity Plan<br />
and DB Global Share Plan was used for granting awards from 2007 onwards.<br />
Activity for Share Plans<br />
The following table summarizes the activity in plans involving share awards, which are those plans granting a<br />
contingent right to receive <strong>Deutsche</strong> <strong>Bank</strong> common shares after a specified period of time. It also includes the<br />
grants under the cash plan variant of the DB Equity Plan and DB Global Share Plan. In addition the table comprises<br />
the number of additional notional share awards granted to employees to account for the economic effect from the<br />
Capital Increase measure conducted in September 2010. The economic effect was calculated based on an<br />
acknowledged adjustment metric resulting in approximately 9.59 % additional notional shares based on the<br />
outstanding awards as per September 21, 2010. The new awards are subject to the plan rules and vesting<br />
schedules of the initial grants.<br />
in thousands of units<br />
(except per share data)<br />
Global Partnership<br />
Plan Equity Units<br />
DB Share<br />
Scheme/<br />
DB KEEP/REU/<br />
DB Equity Plan<br />
Global Share Plan/<br />
Global Share<br />
Purchase Plan Total<br />
Weighted-average<br />
grant date fair<br />
value per unit<br />
Balance as of December 31, 2008 335 48,267 258 48,860 € 70.22<br />
Granted – 23,809 – 23,809 € 22.02<br />
Issued (93) (18,903) (253) (19,249) € 68.76<br />
Forfeited – (3,059) (5) (3,064) € 43.51<br />
Balance as of December 31, 2009 242 50,114 – 50,356 € 49.61<br />
Granted – 43,942 151 44,093 € 43.46<br />
Issued (92) (20,668) – (20,760) € 69.75<br />
Forfeited – (4,774) – (4,774) € 39.19<br />
Balance as of December 31, 2010 150 68,614 151 68,915 € 40.31<br />
Approximately 12.1 million shares were issued to plan participants in February 2011, resulting from the vesting of<br />
DB Equity Plan and DB Share Scheme awards granted in prior years.<br />
In addition to the amounts shown in the table above, in February 2011 the Group granted awards of approximately<br />
25.0 million units, with an average fair value of € 42.02 per unit under the DB Equity Plan with modified plan<br />
conditions for 2011. Approximately 0.7 million units of these grants were made under cash plan variant of this<br />
DB Equity Plan.<br />
Performance Options<br />
<strong>Deutsche</strong> <strong>Bank</strong> used performance options as a remuneration instrument under the Global Partnership Plan and<br />
the pre-2004 Global Share Plan. No new options were issued under these plans after February 2004.
<strong>Deutsche</strong> <strong>Bank</strong> 02 – Consolidated Financial Statements 294<br />
Financial <strong>Report</strong> 2010 Additional Notes<br />
32 – Share-Based Compensation Plans<br />
The following table summarizes the main features related to performance options granted under the pre-2004<br />
Global Share Plan and the Global Partnership Plan.<br />
Plan Grant Year Exercise price<br />
Additional Partnership<br />
Appreciation Rights<br />
(PAR) Exercisable until Eligibility<br />
Global Share Plan (pre-2004)<br />
2002 € 55.39 No Nov 2008 All employees<br />
Performance Options<br />
1<br />
2003 € 75.24 No Dec 2009 All employees 1<br />
Global<br />
2002 € 89.96 Yes Feb 2008 Select executives<br />
Partnership Plan<br />
2003 € 47.53 Yes Feb 2009 Select executives<br />
Performance Options<br />
2004 € 76.61 Yes Feb 2010 Group Board<br />
1 Participant must have been active and working for the Group for at least one year at date of grant.<br />
Under both plans, the option represents the right to purchase one <strong>Deutsche</strong> <strong>Bank</strong> common share at an exercise<br />
price equal to 120 % of the reference price. This reference price was set as the higher of the fair market value<br />
of the common shares on the date of grant or an average of the fair market value of the common shares for the<br />
ten trading days on the Frankfurt Stock Exchange up to, and including, the date of grant.<br />
Performance options under the Global Partnership Plan were granted to select executives in the years 2002 to<br />
2004. Participants were granted one Partnership Appreciation Right (PAR) for each option granted. PARs<br />
represent a right to receive a cash award in an amount equal to 20 % of the reference price. The reference<br />
price was determined in the same way as described above for the performance options. PARs vested at the<br />
same time and to the same extent as the performance options. They are automatically exercised at the same<br />
time, and in the same proportion, as the performance options.<br />
Performance options under the Global Share Plan (pre-2004), a broad-based employee plan, were granted in<br />
the years 2002 to 2003. The plan allowed the purchase of up to 20 shares in both 2002 and 2003. For each<br />
share purchased, participants were granted five performance options in 2002 and 2003. Performance options<br />
under the Global Share Plan (pre-2004) are forfeited upon termination of employment. Participants who retire<br />
or become permanently disabled retain the right to exercise the performance options.<br />
Activity for Performance Options<br />
The following table summarizes the activity for performance options granted under the Global Partnership Plan<br />
and the DB Global Share Plan (pre-2004).<br />
in thousands of units<br />
(except per share data)<br />
Global<br />
Partnership Plan<br />
Performance<br />
Options<br />
Weighted-average<br />
exercise price 1<br />
DB Global Share<br />
Plan (pre-2004)<br />
Performance<br />
Options<br />
Weighted-average<br />
exercise price<br />
Balance as of December 31, 2008 980 € 47.53 510 € 75.24<br />
Exercised – – – –<br />
Forfeited – – (9) € 75.24<br />
Expired (980) € 47.53 (501) € 75.24<br />
Balance as of December 31, 2009 – – – –<br />
Exercised – – – –<br />
Forfeited – – – –<br />
Expired – – – –<br />
Balance as of December 31, 2010 – – – –<br />
1 The weighted-average exercise price does not include the effect of the Partnership Appreciation Rights for the DB Global Partnership Plan.
<strong>Deutsche</strong> <strong>Bank</strong> 02 – Consolidated Financial Statements 295<br />
Financial <strong>Report</strong> 2010 Additional Notes<br />
32 – Share-Based Compensation Plans<br />
The weighted average share price at the date of exercise was € 64.31 in the year ended December 31, 2008.<br />
As of December 31, 2009 no more performance options were outstanding since those granted in 2004 were<br />
already exercised and all others not previously exercised expired in 2009.<br />
Compensation Expense<br />
Compensation expense for awards classified as equity instruments is measured at the grant date based on the<br />
fair value of the share-based award.<br />
Compensation expense for share-based awards payable in cash is re-measured to fair value at each balance<br />
sheet date, and the related obligations are included in other liabilities until paid. For awards granted under the<br />
cash plan version of the DB Equity Plan and DB Global Share Plan, re-measurement is based on the current<br />
market price of <strong>Deutsche</strong> <strong>Bank</strong> common shares.<br />
A further description of the underlying accounting principles can be found in Note 01 “Significant Accounting<br />
Policies”.<br />
The Group recognized compensation expense related to its significant share-based compensation plans as<br />
follows:<br />
in € m. 2010 2009 2008<br />
DB Global Partnership Plan 1 4 10<br />
DB Global Share Plan/DB Global Share Purchase Plan 3 6 39<br />
DB Share Scheme/Restricted Equity Units Plan/DB KEEP/DB Equity Plan 1,173 637 1,249<br />
Total 1,177 647 1,298<br />
Of the compensation expense recognized in 2010, 2009 and 2008 approximately € 24 million, € 22 million and<br />
€ 4 million, respectively, was attributable to the cash-settled variant of the DB Global Share Plan and the DB<br />
Equity Plan.<br />
Share-based payment transactions which will result in a cash payment give rise to a liability, which amounted<br />
to approximately € 33 million, € 26 million and € 10 million for the years ended December 31, 2010, 2009 and<br />
2008 respectively.<br />
As of December 31, 2010, 2009 and 2008, unrecognized compensation cost related to non-vested share-based<br />
compensation was approximately € 1.0 billion, € 0.4 billion and € 0.6 billion respectively.
<strong>Deutsche</strong> <strong>Bank</strong> 02 – Consolidated Financial Statements 296<br />
Financial <strong>Report</strong> 2010 Additional Notes<br />
33 – Employee Benefits<br />
33 –<br />
Employee Benefits<br />
Deferred Compensation<br />
The Group granted cash awards to selected employees with deferred settlement. Each award consists of three<br />
tranches each amounting to one third of the grant volume. The three tranches vest one, two and three years,<br />
respectively, after grant date. As soon as a tranche vests it is paid out, net of those parts of the awards forfeited<br />
before vesting. Generally each tranche is expensed over its vesting period. As a rule, the awards are only paid<br />
out to the employee if there is a non-terminated employment relationship between the employee and <strong>Deutsche</strong><br />
<strong>Bank</strong> at the respective vesting date. The awards are subject to additional forfeiture rules, for example if<br />
employees are in breach of internal policies or law.<br />
From 2010 onwards the awards granted to selected employees at the senior management level are also<br />
subject to performance-indexed forfeiture rules based on regulatory rules requiring that parts of the awards will<br />
not be paid out if defined performance metrics are not met.<br />
The volume of awards granted in February 2010 under the terms and conditions of the DB Restricted Incentive<br />
Plan was approximately € 0.5 billion. In February 2009 awards of approximately € 1.0 billion were granted<br />
under the terms and conditions of the DB Restricted Cash Plan.<br />
From 2011 onwards certain forfeiture rules are only applicable to senior management and employees who are<br />
specifically identified under the regulatory requirements of the new German Compensation Regulation for<br />
Institutions (“InstitutsVergV”).<br />
In February 2011, new awards totaling approximately € 1.0 billion were granted under the terms and conditions<br />
of the DB Restricted Incentive Plan.<br />
In addition, the Group granted share awards which are described in Note 32 “Share-Based Compensation Plans”.
<strong>Deutsche</strong> <strong>Bank</strong> 02 – Consolidated Financial Statements 297<br />
Financial <strong>Report</strong> 2010 Additional Notes<br />
33 – Employee Benefits<br />
Post-employment Benefit Plans<br />
Nature of Plans<br />
The Group sponsors a number of post-employment benefit plans on behalf of its employees, both defined<br />
contribution plans and defined benefit plans. The Group’s plans are accounted for based on the nature and<br />
substance of the plan. The Group’s defined benefit plans are classified into retirement benefit plans, such as<br />
pension plans, and post-employment medical plans.<br />
The majority of the Group’s defined benefit commitments relate to beneficiaries of retirement benefit plans in<br />
Germany, the United Kingdom and the United States. For such plans, the value of a participant’s accrued<br />
benefit is based primarily on each employee’s remuneration and length of service. The Group maintains various<br />
external pension trusts to fund the majority of its retirement benefit plan obligations.<br />
The Group’s funding policy is to maintain coverage of the defined benefit obligation (“DBO”) by plan assets<br />
within a range of 90 % to 100 % of the obligation, subject to meeting any local statutory requirements.<br />
Nevertheless, the Group has determined that certain plans should remain unfunded, e.g. where it is not taxefficient<br />
to fund. Obligations for the Group’s unfunded plans are accrued for as book provisions.<br />
The Group also maintains various unfunded post-employment medical plans for a number of current and retired<br />
employees who are mainly located in the United States. These plans pay stated percentages of medical<br />
expenses of eligible retirees after a stated deductible has been met. The Group accrues for these obligations<br />
over the service of the employee and pays the benefits from Group assets when the benefits become due.<br />
The Group’s Pensions Risk Committee oversees risks related to the Group’s postemployment benefit plans<br />
around the world. Within this context it develops and maintains guidelines for governance and risk management,<br />
including funding, asset allocation and actuarial assumption setting.
<strong>Deutsche</strong> <strong>Bank</strong> 02 – Consolidated Financial Statements 298<br />
Financial <strong>Report</strong> 2010 Additional Notes<br />
33 – Employee Benefits<br />
Reconciliation in Movement of Liabilities and Assets – Impact on Balance sheet<br />
The following table provides reconciliations of opening and closing balances of the DBO and of the fair value of<br />
plan assets of the Group’s defined benefit plans over the years ended December 31, 2010 and 2009, a statement<br />
of the funded status as well as its reconciliation to the amounts recognized on the balance sheet as of<br />
December 31 of each year.<br />
Retirement benefit plans Post-employment medical plans<br />
in € m. 2010 2009 2010 2009<br />
Change in defined benefit obligation:<br />
Balance, beginning of year 9,416 8,189 136 119<br />
Current service cost 243 186 3 3<br />
Interest cost 527 457 9 7<br />
Contributions by plan participants 14 6 – –<br />
Actuarial loss (gain) 81 846 3 14<br />
Exchange rate changes 231 181 10 –<br />
Benefits paid (465) (467) (7) (7)<br />
Past service cost (credit) (77) 18 – –<br />
Acquisitions 1 2,129 – – –<br />
Divestitures – – – –<br />
Settlements/curtailments (30) – – –<br />
Other 2 2 – – –<br />
Balance, end of year 12,071 9,416 154 136<br />
thereof: unfunded 1,124 201 154 136<br />
thereof: funded 10,947 9,215 – –<br />
Change in fair value of plan assets:<br />
Balance, beginning of year 9,352 8,755 – –<br />
Expected return on plan assets 490 403 – –<br />
Actuarial gain (loss) 224 92 – –<br />
Exchange rate changes 210 231 – –<br />
Contributions by the employer 388 264 – –<br />
Contributions by plan participants 14 6 – –<br />
Benefits paid 3 (423) (398) – –<br />
Acquisitions 1 846 – – –<br />
Divestitures – – – –<br />
Settlements (17) (1) – –<br />
Other 2 (8) – – –<br />
Balance, end of year 11,076 9,352 – –<br />
Funded status, end of year (995) (64) (154) (136)<br />
Past service cost (credit) not recognized – – – –<br />
Asset ceiling (3) (7) – –<br />
Reclassification as held for sale 4 5 – – –<br />
Net asset (liability) recognized (993) (71) (154) (136)<br />
thereof: other assets 609 276 – –<br />
thereof: other liabilities (1,602) (347) (154) (136)<br />
1 Postbank, Sal. Oppenheim, BHF-BANK.<br />
2 Includes opening balance of first time application of smaller plans.<br />
3 For funded plans only.<br />
4 BHF-BANK.
<strong>Deutsche</strong> <strong>Bank</strong> 02 – Consolidated Financial Statements 299<br />
Financial <strong>Report</strong> 2010 Additional Notes<br />
33 – Employee Benefits<br />
Actuarial Methodology and Assumptions<br />
December 31 is the measurement date for all plans. All plans are valued using the projected unit credit method.<br />
The principal actuarial assumptions applied to determine the DBO and expenses were as follows. They are<br />
provided in the form of weighted averages.<br />
2010 2009 2008<br />
Assumptions used for retirement benefit plans<br />
to determine defined benefit obligations, end of year<br />
Discount rate 5.1 % 5.4 % 5.6 %<br />
Rate of price inflation 2.5 % 2.7 % 2.1 %<br />
Rate of nominal increase in future compensation levels 3.3 % 3.4 % 3.0 %<br />
Rate of nominal increase for pensions in payment<br />
to determine expense, year ended<br />
2.4 % 2.4 % 1.8 %<br />
Discount rate 5.4 % 5.6 % 5.5 %<br />
Rate of price inflation 2.7 % 2.1 % 2.1 %<br />
Rate of nominal increase in future compensation levels 3.4 % 3.0 % 3.3 %<br />
Rate of nominal increase for pensions in payment 2.4 % 1.8 % 1.8 %<br />
Expected rate of return on plan assets 1 Assumptions used for post-employment medical plans<br />
to determine defined benefit obligations, end of year<br />
5.0 % 4.5 % 5.0 %<br />
Discount rate<br />
to determine expense, year ended<br />
5.3 % 5.9 % 6.1 %<br />
Discount rate<br />
Assumed life expectancy at age 65<br />
5.9 % 6.1 % 6.1 %<br />
for a male aged 65 at measurement date 19.4 19.4 19.1<br />
for a male aged 45 at measurement date 21.6 21.5 21.1<br />
for a female aged 65 at measurement date 22.8 22.8 22.6<br />
for a female aged 45 at measurement date 24.9 24.8 24.5<br />
1 The expected rate of return on assets for determining expense in 2011 is 4.9 %.<br />
For the Group’s most significant plans, the discount rate assumption at each measurement date is set based on<br />
a high quality corporate bond yield curve approach reflecting the actual timing and amount of the future benefit<br />
payments for the respective plan. A consistent assumption is used across the eurozone based on the assumption<br />
applicable for Germany. For the other plans, the discount rate is based on high quality corporate or government<br />
bond yields at each measurement date with a duration consistent with the respective plan’s obligations.<br />
The price inflation assumptions in the U.K. and eurozone are set with reference to market implied measures of<br />
inflation based on inflation swap rates in those markets at measurement date. For the other countries, it is<br />
typically based on long term consensus forecasts.<br />
The future compensation level increase assumptions are developed separately for each plan, where relevant,<br />
reflecting a building block approach from the price inflation assumption and reflecting the Group’s reward structure<br />
or policies in each market.
<strong>Deutsche</strong> <strong>Bank</strong> 02 – Consolidated Financial Statements 300<br />
Financial <strong>Report</strong> 2010 Additional Notes<br />
33 – Employee Benefits<br />
The nominal increase for pensions in payment assumptions are developed separately, where relevant, for each<br />
plan, reflecting a building block approach from the price inflation assumption and reflecting relevant local statutory<br />
and plan-specific requirements.<br />
The expected rate of return on assets is developed separately for each funded plan, using a building block<br />
approach recognizing each plan’s target asset allocation at the measurement date and the assumed return on<br />
assets for each asset category. The general principle is to use a risk-free rate as a benchmark, with adjustments<br />
for the effect of duration and specific relevant factors for each major category of plan assets where appropriate.<br />
For example, the expected rate of return for equities and property is derived by adding a respective risk premium<br />
to the risk-free rate.<br />
Mortality assumptions can be significant in measuring the Group’s obligations under its defined benefit plans.<br />
These assumptions have been set in accordance with current best practice in the respective countries. Future<br />
longevity improvements have been considered and included where appropriate.<br />
In determining expenses for post-employment medical plans, an annual weighted-average rate of increase of<br />
8.2 % in the per capita cost of covered health care benefits was assumed for 2011. The rate is assumed to<br />
decrease gradually to 4.9 % by the end of 2017 and to remain at that level thereafter.<br />
Pension Fund Investments<br />
The Group’s primary investment objective is to immunize broadly the Group to large swings in the funded status<br />
of its retirement benefit plans, with some limited amount of risk-taking through duration mismatches and asset<br />
class diversification to reduce the Group’s costs of providing the benefits to employees in the long term. The<br />
aim is to maximize returns within the Group’s risk tolerance.<br />
The weighted-average asset allocation of the Group’s funded retirement benefit plans as of December 31,<br />
2010 and 2009, as well as the target allocation by asset category are as follows.<br />
Percentage of plan assets<br />
Target allocation Dec 31, 2010 Dec 31, 2009<br />
Asset categories:<br />
Equity instruments 11 % 9 % 8 %<br />
Debt instruments (including Cash and Derivatives) 85 % 88 % 90 %<br />
Alternative Investments (including Property) 4 % 3 % 2 %<br />
Total asset categories 100 % 100 % 100 %<br />
The actual return on plan assets for the years ended December 31, 2010, and December 31, 2009, was<br />
€ 714 million and € 495 million, respectively.<br />
Plan assets as of December 31, 2010, include derivative transactions with Group entities with a negative market<br />
value of € 2 million. In addition, there are € 99 million of securities issued by the Group included in the plan assets.
<strong>Deutsche</strong> <strong>Bank</strong> 02 – Consolidated Financial Statements 301<br />
Financial <strong>Report</strong> 2010 Additional Notes<br />
33 – Employee Benefits<br />
Impact on Cashflows<br />
The Group expects to contribute approximately € 300 million to its retirement benefit plans in 2011. It is not<br />
expected that any plan assets will be returned to the Group during the year ending December 31, 2011.<br />
The table below reflects the benefits expected to be paid by the plans in each of the next five years, and in<br />
the aggregate for the five years thereafter. The amounts include benefits attributable to employees’ past and<br />
estimated future service, and include both amounts paid from the Group’s pension funds in respect of funded<br />
plans and by the Group in respect of unfunded plans.<br />
Post-employment medical plans<br />
in € m.<br />
Retirement<br />
benefit plans Gross amount Reimbursement 1<br />
2011 517 11 (1)<br />
<strong>2012</strong> 522 11 (2)<br />
2013 538 12 (2)<br />
2014 547 12 (2)<br />
2015 568 13 (2)<br />
2016 – 2020 3,229 69 (11)<br />
1 Expected reimbursements from Medicare for prescription drugs.<br />
Impact on Equity<br />
The Group applies the policy of recognizing actuarial gains and losses in the period in which they occur.<br />
Actuarial gains and losses are taken directly to shareholders’ equity and are presented in the Consolidated<br />
Statement of Comprehensive Income and in the Consolidated Statement of Changes in Equity.<br />
The following table shows the cumulative amounts recognized as at December 31, 2010 since the Group’s<br />
adoption of IFRS on January 1, 2006 as well as the amounts recognized in the years ended December 31,<br />
2010 and 2009, respectively, not taking deferred taxes into account. Deferred taxes are disclosed in a separate<br />
table for income taxes taken to equity in Note 34 “Income Taxes”.<br />
Amount recognized in<br />
comprehensive income (gain(loss))<br />
in € m. Dec 31, 2010 1<br />
Retirement benefit plans:<br />
2010 2009<br />
Actuarial gain (loss) 28 143 (754)<br />
Asset ceiling (3) 4 1<br />
Total retirement benefit plans<br />
Post-employment medical plans:<br />
25 147 (753)<br />
Actuarial gain (loss) 37 (3) (14)<br />
Total post-employment medical plans 37 (3) (14)<br />
Total amount recognized 62 144 (767)<br />
1 Accumulated since inception of IFRS and inclusive of the impact of exchange rate changes.
<strong>Deutsche</strong> <strong>Bank</strong> 02 – Consolidated Financial Statements 302<br />
Financial <strong>Report</strong> 2010 Additional Notes<br />
33 – Employee Benefits<br />
Experience Impacts on Liabilities and Assets<br />
The following table shows the amounts for the current and the previous four measurement dates of the DBO,<br />
the fair value of plan assets and the funded status as well as the experience adjustments on the obligation and<br />
the plan assets for the annual periods up to the measurement date.<br />
in € m. Dec 31, 2010 Dec 31, 2009 Dec 31, 2008 Dec 31, 2007 Dec 31, 2006<br />
Retirement benefit plans:<br />
Defined benefit obligation 12,071 9,416 8,189 8,518 9,129<br />
thereof: experience adjustments (loss (gain)) (83) (72) 24 (68) 18<br />
Fair Value of plan assets 11,076 9,352 8,755 9,331 9,447<br />
thereof: experience adjustments (gain (loss)) 224 92 (221) (266) (368)<br />
Funded status (995) (64) 566 813 318<br />
Post-employment medical plans:<br />
Defined benefit obligation 154 136 119 116 147<br />
thereof: experience adjustments (loss (gain)) 1 – (5) (17) (27)<br />
Funded status (154) (136) (119) (116) (147)<br />
Impact on Expense<br />
The Group’s compensation and benefits expenses include the following expenses for defined benefit plans and<br />
other selected employee benefits, recognized in the Consolidated Statement of Income for the years ended<br />
December 31, 2010, 2009 and 2008.<br />
in € m. 2010 2009 2008<br />
Expenses for retirement benefit plans:<br />
Current service cost 243 186 264<br />
Interest cost 527 457 453<br />
Expected return on plan assets (490) (403) (446)<br />
Past service cost (credit) recognized immediately (77) 18 14<br />
Settlements/curtailments (14) 1 –<br />
Recognition of actuarial losses (gains) due to settlements/curtailments 1 – – 9<br />
Amortization of actuarial losses (gains) 1 – – 1<br />
Asset ceiling 1 – – (2)<br />
Total retirement benefit plans 189 259 293<br />
Expenses for post-employment medical plans:<br />
Current service cost 3 3 2<br />
Interest cost 9 7 7<br />
Amortization of actuarial losses (gains) 1 – – 2<br />
Total post-employment medical plans 12 10 11<br />
Total expenses defined benefit plans 201 269 304<br />
Total expenses for defined contribution plans 239 203 206<br />
Total expenses for post-employment benefits 440 472 510<br />
Disclosures of other selected employee benefits<br />
Employer contributions to mandatory German social security pension plan 171 162 159<br />
Expenses for cash retention plans 662 688 13<br />
Expenses for severance payments 588 629 555<br />
1 Items accrued under the corridor approach in 2006 and 2007 were reversed in 2008 due to the change in accounting policy.
<strong>Deutsche</strong> <strong>Bank</strong> 02 – Consolidated Financial Statements 303<br />
Financial <strong>Report</strong> 2010 Additional Notes<br />
34 – Income Taxes<br />
Expected expenses for 2011 are € 320 million for the retirement benefit plans and € 11 million for the postemployment<br />
medical plans. The expected increase compared to 2010 is mainly caused by the consolidation of<br />
Postbank and the change in indexation of occupational pensions in deferment from Retail Price Index (RPI) to<br />
Consumer Price Index (CPI) due to a UK Government announcement which led to a past service credit of<br />
€ 104 million recognized in the 2010 expense.<br />
The weighted average remaining service period of active plan members at measurement date for retirement<br />
benefit plans is ten years and for post-employment medical plans is six years.<br />
Sensitivity to Key Assumptions<br />
The following table presents the sensitivity to key assumptions of the defined benefit obligation as of<br />
December 31, 2010 and 2009, respectively, and the aggregate of the key expense elements (service costs,<br />
interest costs, expected return on plan assets) for the year ended December 31, 2011 and 2010, respectively.<br />
The figures reflect the effect of adjusting each assumption in isolation.<br />
Increase/decrease (–) Defined benefit obligation as at Expenses for<br />
in € m.<br />
Retirement benefit plans sensitivity:<br />
Dec 31, 2010 Dec 31, 2009 2011 2010<br />
Discount rate (fifty basis point decrease) 935 695 5 5<br />
Rate of price inflation (fifty basis point increase)<br />
Rate of real increase in future compensation levels (fifty basis<br />
545 420 35 30<br />
point increase) 105 80 10 10<br />
Longevity (improvement by ten percent) 1 245 175 15 10<br />
Expected rate of return (fifty basis point decrease)<br />
Post-employment medical plans sensitivity:<br />
– – 55 45<br />
Health care cost rate (100 basis point increase) 19 16 2 2<br />
Health care cost rate (100 basis point decrease) (17) (14) (2) (1)<br />
1 Improvement by ten percent on longevity means that the probability of death at each age is reduced by ten percent. The sensitivity has, broadly, the effect of<br />
increasing the expected longevity at age 65 by about one year.<br />
34 –<br />
Income Taxes<br />
The components of income tax expense (benefit) for 2010, 2009 and 2008 are as follows.<br />
in € m. 2010 2009 2008<br />
Current tax expense (benefit):<br />
Tax expense (benefit) for current year 1,339 970 (32)<br />
Adjustments for prior years (9) (430) (288)<br />
Total current tax expense (benefit) 1,330 540 (320)<br />
Deferred tax expense (benefit):<br />
Origination and reversal of temporary difference, unused tax losses and tax credits 700 570 (1,346)<br />
Effects of changes in tax rates 7 3 26<br />
Adjustments for prior years (392) (869) (205)<br />
Total deferred tax expense (benefit) 315 (296) (1,525)<br />
Total income tax expense (benefit) 1,645 244 (1,845)
<strong>Deutsche</strong> <strong>Bank</strong> 02 – Consolidated Financial Statements 304<br />
Financial <strong>Report</strong> 2010 Additional Notes<br />
34 – Income Taxes<br />
Income tax expense (benefit) includes policyholder tax attributable to policyholder earnings, amounting to an<br />
income tax expense of € 37 million in 2010 and income tax benefits of € 1 million and € 79 million in 2009 and<br />
2008, respectively.<br />
Total current tax expense includes benefits from previously unrecognized tax losses, tax credits and deductible<br />
temporary differences, which reduced the current tax expense by € 6 million in 2010. In 2009 these effects<br />
reduced the current tax expense by € 0.2 million and increased the current tax benefit by € 45 million in 2008.<br />
Total deferred tax expense includes expenses arising from write-downs of deferred tax assets and benefits from<br />
previously unrecognized tax losses (tax credits/deductible temporary differences) and the reversal of previous<br />
write-downs of deferred tax assets, which increased the deferred tax expense by € 173 million in 2010. In 2009<br />
these effects increased the deferred tax benefit by € 537 million and reduced the deferred tax benefit by<br />
€ 971 million in 2008.<br />
The following is an analysis of the difference between the amount that results from applying the German statutory<br />
(domestic) income tax rate to income before tax and the Group’s actual income tax expense.<br />
in € m. 2010 2009 2008<br />
Expected tax expense at domestic income tax rate of 30.7 %<br />
(30.7 % for 2009 and 2008) 1,219 1,595 (1,760)<br />
Foreign rate differential 63 (63) (665)<br />
Tax-exempt gains on securities and other income (556) (763) (746)<br />
Loss (income) on equity method investments (87) (29) (36)<br />
Nondeductible expenses 335 624 403<br />
<strong>Deutsche</strong> Postbank AG related charge with no tax benefit 668 – –<br />
Goodwill impairment – – 1<br />
Changes in recognition and measurement of deferred tax assets 167 (537) 926<br />
Effect of changes in tax law or tax rate 7 3 26<br />
Effect related to share-based payments 48 (95) 227<br />
Effect of policyholder tax 37 (1) (79)<br />
Other (256) (490) (142)<br />
Actual income tax expense (benefit) 1,645 244 (1,845)<br />
The line item Other in the preceding table mainly reflects improved income tax positions in the U.S. including a<br />
new basis for filing the U.S. federal income tax return in 2010 and the nonrecurring effect of settling examinations<br />
in 2009.<br />
The domestic income tax rate, including corporate tax, solidarity surcharge, and trade tax, used for calculating<br />
deferred tax assets and liabilities was 30.7 % for the years ended December 31, 2010, 2009 and 2008.
<strong>Deutsche</strong> <strong>Bank</strong> 02 – Consolidated Financial Statements 305<br />
Financial <strong>Report</strong> 2010 Additional Notes<br />
34 – Income Taxes<br />
Income taxes charged or credited to equity (other comprehensive income/additional paid in capital) are as follows.<br />
in € m. 2010 2009 2008<br />
Tax (charge)/credit on actuarial gains (losses) related to defined benefit plans (29) 113 1<br />
Financial assets available for sale<br />
Unrealized net gains (losses) arising during the period (59) (195) 892<br />
Net (gains) losses reclassified to profit or loss (47) (214) (194)<br />
Derivatives hedging variability of cash flows<br />
Unrealized net gains (losses) arising during the period 30 90 (34)<br />
Net (gains) losses reclassified to profit or loss (1) (2) –<br />
Other equity movement<br />
Unrealized net gains (losses) arising during the period 320 54 67<br />
Net (gains) losses reclassified to profit or loss (3) 13 –<br />
Income taxes (charged) credited to other comprehensive income 240 (254) 731<br />
Other income taxes (charged) credited to equity 30 (35) (75)<br />
Major components of the Group’s gross deferred income tax assets and liabilities are as follows.<br />
in € m. Dec 31, 2010 Dec 31, 2009<br />
Deferred tax assets:<br />
Unused tax losses 2,637 2,986<br />
Unused tax credits 189 218<br />
Deductible temporary differences:<br />
Trading activities 8,627 7,244<br />
Property and equipment 450 654<br />
Other assets 1,522 1,544<br />
Securities valuation 1,117 563<br />
Allowance for loan losses 593 353<br />
Other provisions 1,314 1,088<br />
Other liabilities 1,941 439<br />
Total deferred tax assets pre offsetting 18,390 15,089<br />
Deferred tax liabilities:<br />
Taxable temporary differences:<br />
Trading activities 8,070 6,666<br />
Property and equipment 62 55<br />
Other assets 1,669 652<br />
Securities valuation 758 652<br />
Allowance for loan losses 124 122<br />
Other provisions 897 932<br />
Other liabilities 776 1,017<br />
Total deferred tax liabilities pre offsetting 12,356 10,096<br />
After offsetting, deferred tax assets and liabilities are presented on the balance sheet as follows.<br />
in € m. Dec 31, 2010 Dec 31, 2009<br />
Presented as deferred tax assets 8,341 7,150<br />
Presented as deferred tax liabilities 2,307 2,157<br />
Net deferred tax assets 6,034 4,993
<strong>Deutsche</strong> <strong>Bank</strong> 02 – Consolidated Financial Statements 306<br />
Financial <strong>Report</strong> 2010 Additional Notes<br />
34 – Income Taxes<br />
The change in the balance of deferred tax assets and deferred tax liabilities does not equal the deferred tax<br />
expense. This is due to (1) deferred taxes that are booked directly to equity, (2) the effects of exchange rate<br />
changes on tax assets and liabilities denominated in currencies other than euro, (3) the acquisition and disposal<br />
of entities as part of ordinary activities and (4) the reclassification of deferred tax assets and liabilities which are<br />
presented on the face of the balance sheet as components of other assets and liabilities.<br />
As of December 31, 2010 and 2009, no deferred tax assets were recognized for the following items.<br />
in € m. Dec 31, 2010 1<br />
Dec 31, 2009 1<br />
Deductible temporary differences (676) (69)<br />
Not expiring (4,206) (1,598)<br />
Expiring in subsequent period (6) 0<br />
Expiring after subsequent period (1,801) (659)<br />
Unused tax losses (6,013) (2,257)<br />
Expiring in subsequent period – –<br />
Expiring after subsequent period (67) (87)<br />
Unused tax credits (67) (87)<br />
1 Amounts in the table refer to deductible temporary differences, unused tax losses and tax credits for federal income tax purposes.<br />
Deferred tax assets were not recognized on these items because it is not probable that future taxable profit will<br />
be available against which the unused tax losses, unused tax credits and deductible temporary differences can<br />
be utilized.<br />
As of December 31, 2010 and December 31, 2009, the Group recognized deferred tax assets of € 3.3 billion<br />
and € 6 billion, respectively that exceed deferred tax liabilities in entities which have suffered a loss in either the<br />
current or preceding period. This is based on management’s assessment that it is probable that the respective<br />
entities will have taxable profits against which the unused tax losses, unused tax credits and deductible temporary<br />
differences can be utilized. Generally, in determining the amounts of deferred tax assets to be recognized,<br />
management uses historical profitability information and, if relevant, forecasted operating results, based upon<br />
approved business plans, including a review of the eligible carry-forward periods, tax planning opportunities and<br />
other relevant considerations.<br />
As of December 31, 2010 and December 31, 2009, the Group had temporary differences associated with the<br />
Group’s parent company’s investments in subsidiaries, branches and associates and interests in joint ventures<br />
of € 106 million and € 105 million respectively, in respect of which no deferred tax liabilities were recognized.
<strong>Deutsche</strong> <strong>Bank</strong> 02 – Consolidated Financial Statements 307<br />
Financial <strong>Report</strong> 2010 Additional Notes<br />
35 – Derivatives<br />
35 –<br />
Derivatives<br />
Derivative Financial Instruments and Hedging Activities<br />
Derivative contracts used by the Group include swaps, futures, forwards, options and other similar types of<br />
contracts. In the normal course of business, the Group enters into a variety of derivative transactions for both<br />
trading and risk management purposes. The Group’s objectives in using derivative instruments are to meet<br />
customers’ risk management needs, to manage the Group’s exposure to risks and to generate revenues<br />
through proprietary trading activities.<br />
In accordance with the Group’s accounting policy relating to derivatives and hedge accounting as described in<br />
Note 01 “Significant Accounting Policies”, all derivatives are carried at fair value in the balance sheet regardless<br />
of whether they are held for trading or non-trading purposes.<br />
Derivatives held for Trading Purposes<br />
Sales and Trading<br />
The majority of the Group’s derivatives transactions relate to sales and trading activities. Sales activities include<br />
the structuring and marketing of derivative products to customers to enable them to take, transfer, modify or<br />
reduce current or expected risks. Trading includes market-making, positioning and arbitrage activities. Marketmaking<br />
involves quoting bid and offer prices to other market participants, enabling revenue to be generated<br />
based on spreads and volume. Positioning means managing risk positions in the expectation of benefiting from<br />
favorable movements in prices, rates or indices. Arbitrage involves identifying and profiting from price differentials<br />
between markets and products.<br />
Risk Management<br />
The Group uses derivatives in order to reduce its exposure to credit and market risks as part of its asset and<br />
liability management. This is achieved by entering into derivatives that hedge specific portfolios of fixed rate<br />
financial instruments and forecast transactions as well as strategic hedging against overall balance sheet<br />
exposures. The Group actively manages interest rate risk through, among other things, the use of derivative<br />
contracts. Utilization of derivative financial instruments is modified from time to time within prescribed limits in<br />
response to changing market conditions, as well as to changes in the characteristics and mix of the related<br />
assets and liabilities.<br />
Derivatives qualifying for Hedge Accounting<br />
The Group applies hedge accounting if derivatives meet the specific criteria described in Note 01 “Significant<br />
Accounting Policies”.
<strong>Deutsche</strong> <strong>Bank</strong> 02 – Consolidated Financial Statements 308<br />
Financial <strong>Report</strong> 2010 Additional Notes<br />
35 – Derivatives<br />
Fair Value Hedge Accounting<br />
The Group enters into fair value hedges, using primarily interest rate swaps and options, in order to protect itself<br />
against movements in the fair value of fixed-rate financial instruments due to movements in market interest rates.<br />
The following table presents the value of derivatives held as fair value hedges.<br />
Assets<br />
Liabilities<br />
Assets<br />
Liabilities<br />
in € m.<br />
2010<br />
2010<br />
2009<br />
2009<br />
Derivatives held as fair value hedges 1 8,447 5,823 6,726 3,240<br />
1 Inclusion of Postbank increased the assets in 2010 by € 0.7 billion and liabilities by € 1.5 billion.<br />
For the years ended December 31, 2010 and 2009, a gain of € 0.7 billion and a loss of € 1.6 billion, respectively,<br />
were recognized on the hedging instruments. For the same periods, the results on the hedged items, which were<br />
attributable to the hedged risk, were a loss of € 0.6 billion and a gain of € 1.5 billion, respectively.<br />
Since consolidation Postbank has reflected a gain of € 0.3 billion within hedging instruments and a loss of<br />
€ 0.3 billion attributable to the hedged risk for the year ended December 31, 2010, which are included within<br />
the above results.<br />
Cash Flow Hedge Accounting<br />
The Group enters into cash flow hedges, using equity futures, interest rate swaps and foreign exchange forwards,<br />
in order to protect itself against exposure to variability in equity indices, interest rates and exchange rates.<br />
The following table presents the value of derivatives held as cash flow hedges.<br />
Assets<br />
Liabilities<br />
Assets<br />
Liabilities<br />
in € m.<br />
2010<br />
2010<br />
2009<br />
2009<br />
Derivatives held as cash flow hedges 1 268 2 197<br />
A schedule indicating the periods when hedged cash flows are expected to occur and when they are expected<br />
to affect the income statement is as follows.<br />
in € m. Within 1 year 1–3 years 3–5 years Over five years<br />
As of December 31, 2010<br />
Cash inflows from assets 47 84 56 254<br />
Cash outflows from liabilities (27) (50) (39) (63)<br />
Net cash flows 20 34 17 191<br />
As of December 31, 2009<br />
Cash inflows from assets 42 79 65 106<br />
Cash outflows from liabilities (40) (58) (27) (140)<br />
Net cash flows 2 21 38 (34)
<strong>Deutsche</strong> <strong>Bank</strong> 02 – Consolidated Financial Statements 309<br />
Financial <strong>Report</strong> 2010 Additional Notes<br />
36 – Regulatory Capital<br />
Of these expected future cash flows, most will arise in relation to the Group’s two largest cash flow hedging<br />
programs, Maher Terminals LLC and Abbey Life Assurance Company Limited.<br />
For the years ended December 31, 2010 and December 31, 2009, balances of € (321) million and € (217) million,<br />
respectively, were reported in equity related to cash flow hedging programs. Of these, € (44) million and<br />
€ (48) million, respectively, related to terminated programs. These amounts will be released to the income<br />
statement as appropriate.<br />
For the years ended December 31, 2010 and December 31, 2009, a loss of € 44 million and a gain of € 119 million,<br />
respectively, were recognized in other comprehensive income in respect of effective cash flow hedging.<br />
For the years ended December 31, 2010 and December 31, 2009, a gain of € 60 million and a loss of € 6 million,<br />
respectively, were removed from equity and included in the income statement.<br />
For the years ended December 31, 2010 and December 31, 2009, losses of € 3 million and € 7 million,<br />
respectively, were recognized due to hedge ineffectiveness.<br />
As of December 31, 2010 the longest term cash flow hedge matures in 2027.<br />
Net Investment Hedge Accounting<br />
Using foreign exchange forwards and swaps, the Group enters into hedges of translation adjustments resulting<br />
from translating the financial statements of net investments in foreign operations into the reporting currency of<br />
the parent at period end spot rates.<br />
The following table presents the value of derivatives held as net investment hedges.<br />
Assets<br />
Liabilities<br />
Assets<br />
Liabilities<br />
in € m.<br />
2010<br />
2010<br />
2009<br />
2009<br />
Derivatives held as net investment hedges 81 528 94 364<br />
For the years ended December 31, 2010 and December 31, 2009, losses of € 197 million and € 238 million,<br />
respectively, were recognized due to hedge ineffectiveness which includes the forward points element of the<br />
hedging instruments.<br />
36 –<br />
Regulatory Capital<br />
Capital Management<br />
The Group’s Treasury function manages its capital at Group level and locally in each region, except that Postbank<br />
manages its capital on a group level and locally on its own. The allocation of financial resources, in general, and<br />
capital, in particular, favors business portfolios with the highest positive impact on the Group’s profitability and<br />
shareholder value. As a result, Treasury periodically reallocates capital among business portfolios.
<strong>Deutsche</strong> <strong>Bank</strong> 02 – Consolidated Financial Statements 310<br />
Financial <strong>Report</strong> 2010 Additional Notes<br />
36 – Regulatory Capital<br />
Treasury implements the Group’s capital strategy, which itself is developed by the Capital and Risk Committee<br />
and approved by the Management Board, including the issuance and repurchase of shares. The Group is<br />
committed to maintain its sound capitalization. Overall capital demand and supply are constantly monitored<br />
and adjusted, if necessary, to meet the need for capital from various perspectives. These include shareholders’<br />
equity based on IFRS accounting standards, active book equity, regulatory capital and economic capital. The<br />
Group’s target for the Tier 1 capital ratio continues to be at 10 % or above.<br />
The allocation of capital, determination of the Group’s funding plan and other resource issues are framed by<br />
the Capital and Risk Committee.<br />
Regional capital plans covering the capital needs of the Group’s branch offices and subsidiaries are prepared<br />
on a semi-annual basis and presented to the Group Investment Committee. Most of the Group’s subsidiaries<br />
are subject to legal and regulatory capital requirements. Local Asset and Liability Committees attend to those<br />
needs under the stewardship of regional Treasury teams. Furthermore, they safeguard compliance with<br />
requirements such as restrictions on dividends allowable for remittance to <strong>Deutsche</strong> <strong>Bank</strong> AG or on the ability<br />
of the Group’s subsidiaries to make loans or advances to the parent bank. In developing, implementing and<br />
testing the Group’s capital and liquidity, the Group takes such legal and regulatory requirements into account.<br />
On October 6, 2010, the Group completed a capital increase from authorized capital against cash contributions.<br />
In total, 308.6 million new registered no-par value shares (common shares) were issued, resulting in gross<br />
proceeds of € 10.2 billion. The net proceeds of € 10.1 billion raised in the issuance (after expenses of<br />
approximately € 0.1 billion, net of tax) were primarily used to cover the capital consumption from the consolidation<br />
of the Postbank Group, and, in addition, to support the existing capital base.<br />
Treasury executes the repurchase of shares. As of January 1, 2010, the number of shares held in Treasury<br />
from buybacks totaled 0.6 million. The 2009 <strong>Annual</strong> General Meeting granted the Group’s management board<br />
the authority to buy back up to 62.1 million shares before the end of October 2010. During the period from<br />
January 1, 2010 until the 2010 <strong>Annual</strong> General Meeting, 11.1 million shares were purchased. Thereof 10.6 million<br />
were used for equity compensation purposes. As at the 2010 <strong>Annual</strong> General Meeting on May 27, 2010, the<br />
number of shares held in Treasury from buybacks totaled 1.0 million. The 2010 <strong>Annual</strong> General Meeting granted<br />
the Group’s management board the authority to buy back up to 62.1 million shares before the end of November<br />
2014. Thereof 31.0 million shares may be purchased by using derivatives. During the period from the 2010<br />
<strong>Annual</strong> General Meeting until December 31, 2010, 18.8 million shares were purchased, thereof 0.5 million via<br />
sold put options which were executed by the counterparty at maturity date. 9.8 million of the total 18.8 million<br />
shares repurchased were used for equity compensation purposes in 2010 and 9.0 million shares were used to<br />
increase the Group’s Treasury position for later use for future equity compensation. As at December 31, 2010,<br />
the number of shares held in Treasury from buybacks totaled 10.0 million.<br />
Total outstanding hybrid Tier 1 capital (substantially all noncumulative trust preferred securities) as of December<br />
31, 2010, amounted to € 12.6 billion compared to € 10.6 billion as of December 31, 2009. This<br />
increase was mainly due to the consolidation of € 1.6 billion hybrid Tier 1 capital issued by <strong>Deutsche</strong> Postbank<br />
and foreign exchange effects of the strengthened U.S. dollar to the U.S. dollar denominated hybrid Tier 1 capital.<br />
During the first half year, 2010 the Group raised € 0.1 billion of hybrid Tier 1 capital by increasing an outstanding<br />
issue.
<strong>Deutsche</strong> <strong>Bank</strong> 02 – Consolidated Financial Statements 311<br />
Financial <strong>Report</strong> 2010 Additional Notes<br />
36 – Regulatory Capital<br />
In 2010, the Group issued € 1.2 billion of lower Tier 2 capital (qualified subordinated liabilities). Consolidation of<br />
Tier 2 capital issued by Postbank added € 2.2 billion of lower Tier 2 capital and € 1.2 billion of profit participation<br />
rights. Profit participation rights amounted to € 1.2 billion after and nil before consolidation of Postbank. Total<br />
lower Tier 2 capital as of December 31, 2010, amounted to € 10.7 billion compared to € 7.1 billion as of<br />
December 31, 2009. Cumulative preferred securities amounted to € 0.3 billion as of December 31, 2010,<br />
unchanged to December 31, 2009.<br />
Capital Adequacy<br />
Since 2008, <strong>Deutsche</strong> <strong>Bank</strong> has calculated and published consolidated capital ratios for the <strong>Deutsche</strong> <strong>Bank</strong><br />
group of institutions pursuant to the <strong>Bank</strong>ing Act and the Solvency Regulation (“Solvabilitätsverordnung”), which<br />
implemented the revised capital framework of the Basel Committee from 2004 (“Basel II”) into German law.<br />
The group of companies consolidated for banking regulatory purposes (“group of institutions”) includes all<br />
subsidiaries as defined in the German <strong>Bank</strong>ing Act that are classified as banks, financial services institutions,<br />
investment management companies, financial enterprises, payment institutions or ancillary services enterprises.<br />
It does not include insurance companies or companies outside the finance sector.<br />
For financial conglomerates, however, insurance companies are included in an additional capital adequacy<br />
(also “solvency margin”) calculation. Since October 2007, the Group is a financial conglomerate. The Group’s<br />
solvency margin as a financial conglomerate remains dominated by its banking activities.<br />
A bank’s total regulatory capital, also referred to as “Own Funds”, is divided into three tiers: Tier 1, Tier 2 and<br />
Tier 3 capital, and the sum of Tier 1 and Tier 2 capital is also referred to as “Regulatory <strong>Bank</strong>ing Capital”.<br />
— Tier 1 capital consists primarily of common share capital, additional paid-in capital, retained earnings and<br />
certain hybrid capital components such as noncumulative trust preferred securities, also referred to as<br />
“Additional Tier 1 capital”. Common shares in treasury, goodwill and other intangible assets are deducted<br />
from Tier 1. Other regulatory adjustments entail the exclusion of capital from entities outside the group of<br />
institutions and the reversal of capital effects under the fair value option on financial liabilities due to own<br />
credit risk. Tier 1 capital without hybrid capital components is referred to as Core Tier 1 capital.<br />
— Tier 2 capital consists primarily of cumulative trust preferred securities, certain profit participation rights and<br />
long-term subordinated debt, as well as 45 % of unrealized gains on certain listed securities.<br />
Certain items must be deducted from Tier 1 and Tier 2 capital. Primarily these include deductible investments<br />
in unconsolidated banking, financial and insurance entities where the Group holds more than 10 % of the<br />
capital (in case of insurance entities 20 % either of the capital or of voting rights unless included in the solvency<br />
margin calculation of the financial conglomerate), the amount by which the expected loss for exposures to<br />
central governments, institutions and corporate and retail exposures as measured under the bank’s internal<br />
ratings based approach (“IRBA”) model exceeds the value adjustments and provisions for such exposures,<br />
the expected losses for certain equity exposures, securitization positions not included in the risk-weighted<br />
assets and the value of securities delivered to a counterparty plus any replacement cost to the extent the<br />
required payment by the counterparty has not been made within five business days after delivery provided<br />
the transaction has been allocated to the bank’s trading book.
<strong>Deutsche</strong> <strong>Bank</strong> 02 – Consolidated Financial Statements 312<br />
Financial <strong>Report</strong> 2010 Additional Notes<br />
36 – Regulatory Capital<br />
— Tier 3 capital consists mainly of certain short-term subordinated debt.<br />
The amount of subordinated debt that may be included as Tier 2 capital is limited to 50 % of Tier 1 capital. Total<br />
Tier 2 capital is limited to 100 % of Tier 1 capital.<br />
The Core Tier 1 and the Tier 1 capital ratio are the principal measures of capital adequacy for internationally<br />
active banks. The ratios compare a bank’s regulatory Core Tier 1 and Tier 1 capital with its credit risks, market<br />
risks and operational risks pursuant to Basel II (which the Group refers to collectively as the “risk-weighted<br />
assets” or “RWA”). In the calculation of the risk-weighted assets the Group uses BaFin approved internal models<br />
for all three risk types. More than 90 % of the Group’s exposure relating to asset and off-balance sheet credit<br />
risks (excluding Postbank) is measured using internal rating models under the so-called advanced IRBA. The<br />
vast majority of the Group’s market risk component is a multiple of its value-at-risk figure, which is calculated<br />
for regulatory purposes based on the Group’s internal models: standard calculation approaches are used for<br />
the remainder. For operational risk calculations, the Group uses the so-called Advanced Measurement Approach<br />
(“AMA”) pursuant to the German <strong>Bank</strong>ing Act.<br />
The following two tables present a summary of the Group’s risk-weighted assets, and the regulatory capital<br />
excluding transitional items pursuant to section 64h (3) of the German <strong>Bank</strong>ing Act.<br />
in € m.<br />
(unless stated otherwise) Dec 31, 2010 Dec 31, 2009<br />
Credit risk 285,218 217,003<br />
Market risk 1 23,660 24,880<br />
Operational risk 37,326 31,593<br />
Total risk-weighted assets 346,204 273,476<br />
Core Tier 1 capital 29,972 23,790<br />
Additional Tier 1 capital 12,593 10,616<br />
Tier 1 capital 42,565 34,406<br />
Tier 2 capital 6,123 3,523<br />
Tier 3 capital – –<br />
Total regulatory capital 48,688 37,929<br />
Core Tier 1 capital ratio 8.7 % 8.7 %<br />
Tier 1 capital ratio 12.3 % 12.6 %<br />
Total capital ratio 14.1 % 13.9 %<br />
1 A multiple of the Group’s value-at-risk, calculated with a confidence level of 99 % and a ten-day holding period.<br />
The Group’s total capital ratio was 14.1 % on December 31, 2010, compared to 13.9 % as of December 31, 2009,<br />
both significantly higher than the 8 % minimum ratio required.
<strong>Deutsche</strong> <strong>Bank</strong> 02 – Consolidated Financial Statements 313<br />
Financial <strong>Report</strong> 2010 Additional Notes<br />
36 – Regulatory Capital<br />
The Group’s Core Tier 1 capital amounted to € 30.0 billion on December 31, 2010 and € 23.8 billion on<br />
December 31, 2009 with an unchanged Core Tier 1 capital ratio of 8.7 %. The Group’s Tier 1 capital was<br />
€ 42.6 billion on December 31, 2010 and € 34.4 billion on December 31, 2009. The Tier 1 capital ratio was<br />
12.3 % as of December 31, 2010 and 12.6 % as of December 31, 2009, both exceeding the Group’s target ratio<br />
of 10 %.<br />
The Group’s Tier 2 capital was € 6.1 billion on December 31, 2010, and € 3.5 billion on December 31, 2009,<br />
amounting to 14 % and 10 % of Tier 1 capital, respectively.<br />
The German <strong>Bank</strong>ing Act and Solvency Regulation rules required the Group to cover its market risk as of<br />
December 31, 2010, with € 1,893 million of total regulatory capital (Tier 1 + 2 + 3) compared to € 1,990 million<br />
as of December 31, 2009. The Group met this requirement <strong>entire</strong>ly with Tier 1 and Tier 2 capital that was not<br />
required for the minimum coverage of credit and operational risk.<br />
The following table presents the components of Core Tier 1, Tier 1 and Tier 2 capital for the Group of companies<br />
consolidated for regulatory purposes as of December 31, 2010, and December 31, 2009, excluding transitional<br />
items pursuant to section 64h (3) German <strong>Bank</strong>ing Act.<br />
in € m. Dec 31, 2010 Dec 31, 2009<br />
Tier 1 capital:<br />
Core Tier 1 capital<br />
Common shares 2,380 1,589<br />
Additional paid-in capital 23,515 14,830<br />
Retained earnings, common shares in treasury, equity classified as obligation to purchase common<br />
shares, foreign currency translation, noncontrolling interests 24,797 21,807<br />
Items to be fully deducted from Tier 1 capital pursuant to Section 10 (2a) KWG (inter alia goodwill and<br />
intangible assets) (14,489) (10,238)<br />
Items to be partly deducted from Tier 1 capital pursuant to Section 10 (6) and (6a) KWG<br />
Deductible investments in banking, financial and insurance entities (954) (2,120)<br />
Securitization positions not included in risk-weighted assets (4,850) (1,033)<br />
Excess of expected losses over risk provisions (427) (1,045)<br />
Items to be partly deducted from Tier 1 capital pursuant to Section 10 (6) and (6a) KWG (6,231) (4,198)<br />
Core Tier 1 capital 29,972 23,790<br />
Additional Tier 1 capital<br />
Noncumulative trust preferred securities 1 12,593 10,616<br />
Additional Tier 1 capital 12,593 10,616<br />
Total Tier 1 capital pursuant to Section 10 (2a) KWG 42,565 34,406<br />
Tier 2 capital:<br />
Unrealized gains on listed securities (45 % eligible) 224 331<br />
Profit participation rights 1,151 –<br />
Cumulative preferred securities 299 294<br />
Qualified subordinated liabilities 10,680 7,096<br />
Items to be partly deducted from Tier 2 capital pursuant to Section 10 (6) and (6a) KWG (6,231) (4,198)<br />
Total Tier 2 capital pursuant to Section 10 (2b) KWG 6,123 3,523<br />
1 Included € 20 million silent participations as of December 31, 2010.
<strong>Deutsche</strong> <strong>Bank</strong> 02 – Consolidated Financial Statements 314<br />
Financial <strong>Report</strong> 2010 Additional Notes<br />
37 – Related Party Transactions<br />
The following table reconciles shareholders’ equity according to IFRS to Tier 1 capital pursuant to Basel II,<br />
excluding transitional items pursuant to section 64h (3) German <strong>Bank</strong>ing Act.<br />
in € m. Dec 31, 2010 Dec 31, 2009<br />
Total shareholders’ equity 48,843 36,647<br />
Total net gains (losses) not recognized in the income statement excluding foreign currency translation 298 257<br />
Accrued future dividend (697) (466)<br />
Active book equity 48,444 36,438<br />
Goodwill and intangible assets (15,594) (10,169)<br />
Noncontrolling interest 1,549 1,322<br />
Other (consolidation and regulatory adjustments) 1,804 397<br />
Noncumulative trust preferred securities 1 12,593 10,616<br />
Items to be partly deducted from Tier 1 capital (6,231) (4,198)<br />
Tier 1 capital 42,565 34,406<br />
1 Included € 20 million silent participations as of December 31, 2010.<br />
Basel II requires the deduction of goodwill from Tier 1 capital. However, for a transitional period the partial<br />
inclusion of certain goodwill components in Tier 1 capital is allowed pursuant to German <strong>Bank</strong>ing Act Section<br />
64h (3). While such goodwill components are not included in the regulatory capital and capital adequacy ratios<br />
shown above, the Group makes use of this transition rule in its capital adequacy reporting to the German<br />
regulatory authorities.<br />
As of December 31, 2010, the transitional item amounted to € 390 million compared to € 462 million as of<br />
December 31, 2009. In the Group’s reporting to the German regulatory authorities, the Tier 1 capital, total<br />
regulatory capital and the total risk-weighted assets shown above were increased by this amount. Correspondingly,<br />
the Group’s Tier 1 and total capital ratios reported to the German regulatory authorities including this item were<br />
12.4 % and 14.2 %, respectively, on December 31, 2010 compared to 12.7 % and 14.0 %, respectively, on<br />
December 31, 2009.<br />
Failure to meet minimum capital requirements can result in orders to suspend or reduce dividend payments or<br />
other profit distributions on regulatory capital and discretionary actions by the BaFin that, if undertaken, could<br />
have a direct material effect on the Group’s businesses. The Group complied with the regulatory capital adequacy<br />
requirements in 2010.<br />
37 –<br />
Related Party Transactions<br />
Parties are considered to be related if one party has the ability to directly or indirectly control the other party or<br />
exercise significant influence over the other party in making financial or operational decisions. The Group’s related<br />
parties include<br />
— key management personnel, close family members of key management personnel and entities which are<br />
controlled, significantly influenced by, or for which significant voting power is held by key management<br />
personnel or their close family members,<br />
— subsidiaries, joint ventures and associates, and<br />
— post-employment benefit plans for the benefit of <strong>Deutsche</strong> <strong>Bank</strong> employees.
<strong>Deutsche</strong> <strong>Bank</strong> 02 – Consolidated Financial Statements 315<br />
Financial <strong>Report</strong> 2010 Additional Notes<br />
37 – Related Party Transactions<br />
The Group has several business relationships with related parties. Transactions with such parties are made in<br />
the ordinary course of business and on substantially the same terms, including interest rates and collateral, as<br />
those prevailing at the time for comparable transactions with other parties. These transactions also did not involve<br />
more than the normal risk of collectibility or present other unfavorable features.<br />
Transactions with Key Management Personnel<br />
Key management personnel are those persons having authority and responsibility for planning, directing and<br />
controlling the activities of <strong>Deutsche</strong> <strong>Bank</strong>, directly or indirectly. The Group considers the members of the<br />
Management Board and of the Supervisory Board to constitute key management personnel for purposes of IAS 24.<br />
The following table presents the compensation expense of key management personnel.<br />
in € m. 2010 2009 2008<br />
Short-term employee benefits 23 22 9<br />
Post-employment benefits 3 3 3<br />
Other long-term benefits 3 – –<br />
Termination benefits 2 – –<br />
Share-based payment 6 7 8<br />
Total 37 32 20<br />
Among the Group’s transactions with key management personnel as of December 31, 2010 were loans and<br />
commitments of € 10 million and deposits of € 9 million.<br />
In addition, the Group provides banking services, such as payment and account services as well as investment<br />
advice, to key management personnel and their close family members.<br />
In 2010, a member of key management personnel received payments from a Group company. The contractually<br />
enforceable payments are not included within compensation expense of key management disclosed above. At<br />
the time the contractual arrangement was executed the payor company was not included in the Group of<br />
consolidated companies.<br />
Transactions with Subsidiaries, Joint Ventures and Associates<br />
Transactions between <strong>Deutsche</strong> <strong>Bank</strong> AG and its subsidiaries meet the definition of related party transactions.<br />
If these transactions are eliminated on consolidation, they are not disclosed as related party transactions.<br />
Transactions between the Group and its associated companies and joint ventures also qualify as related party<br />
transactions and are disclosed as follows.
<strong>Deutsche</strong> <strong>Bank</strong> 02 – Consolidated Financial Statements 316<br />
Financial <strong>Report</strong> 2010 Additional Notes<br />
37 – Related Party Transactions<br />
Loans<br />
in € m. 2010 2009<br />
Loans outstanding, beginning of year 965 834<br />
Loans issued during the year 1 3,564 366<br />
Loan repayment during the year 148 209<br />
Changes in the group of consolidated companies 2 (179) (83)<br />
Exchange rate changes/other 16 57<br />
Loans outstanding, end of year 3 4,218 965<br />
Other credit risk related transactions:<br />
Allowance for loan losses 31 4<br />
Provision for loan losses 26 31<br />
Guarantees and commitments 4 231 135<br />
1 The increase in loans issued as of December 31, 2010 is mainly due to the restructuring of a loan transaction. For further detail please see Note 17 “Equity Method<br />
Investments”. Related interest income to these loans amounted up to € 24 million.<br />
2<br />
In 2010, some entities were fully consolidated. In 2009, one entity that was accounted for using the equity method was sold. Therefore loans made to these investments<br />
were eliminated on consolidation.<br />
3<br />
Loans past due were nil as of December 31, 2010 and totaled € 15 million as of December 31, 2009. For the above loans the Group held collateral of € 299 million<br />
and € 375 million as of December 31, 2010 and as of December 31, 2009, respectively. Loans included loans to joint ventures of € 4 million both as of December 31,<br />
2010 and December 31, 2009. For these loans no loan loss allowance was required.<br />
4<br />
Includes financial and performance guarantees, standby letters of credit, indemnity agreements and irrevocable lending-related commitments.<br />
Deposits<br />
in € m. 2010 2009<br />
Deposits outstanding, beginning of year 367 246<br />
Deposits received during the year 160 287<br />
Deposits repaid during the year 220 161<br />
Changes in the group of consolidated companies 1 (93) (6)<br />
Exchange rate changes/other 2 1<br />
Deposits outstanding, end of year 2 216 367<br />
1 In 2010, some entities were fully consolidated. In 2009, one entity with related party deposits that was accounted for using the equity method was sold.<br />
2 The deposits are unsecured. Deposits include also € 0.4 million deposits from joint ventures both as of December 31, 2010 and December 31, 2009.<br />
Other Transactions<br />
Trading assets and positive market values from derivative financial transactions with associated companies<br />
amounted to € 140 million as of December 31, 2010 and € 3.7 billion as of December 31, 2009. Trading liabilities<br />
and negative market values from derivative financial transactions with associated companies amounted to<br />
€ 15 million as of December 31, 2010 and € 3.0 billion as of December 31, 2009. The decrease was mainly<br />
attributable to one entity that was fully consolidated and was previously accounted using the equity method.<br />
Other transactions with related parties also reflected the following:<br />
Xchanging etb GmbH:<br />
With the acquisition of Sal.Oppenheim in March 2010 the Group increased its stake in Xchanging etb GmbH<br />
from 44 % to 49 %. The Group accounts for it under the equity method. Xchanging etb GmbH is the holding<br />
company of Xchanging Transaction <strong>Bank</strong> GmbH (“XTB”). Two of the five executive directors of Xchanging etb<br />
GmbH and two members of the supervisory board of XTB are employees of the Group. The Group’s arrangements<br />
with Xchanging include a 12-year outsourcing agreement for security settlement services and a 10-year outsourcing<br />
agreement for the provision of security settlement to Sal. Oppenheim. The outsourcing arrangements<br />
are aimed at reducing costs without compromising service quality. In 2010 and 2009, the Group received services<br />
from XTB with volume of € 113 million and € 104 million, respectively. In 2010 and 2009, the Group provided<br />
supply services (e.g., IT and real estate-related services) with volumes of € 20 million and € 29 million,<br />
respectively, to XTB.
<strong>Deutsche</strong> <strong>Bank</strong> 02 – Consolidated Financial Statements 317<br />
Financial <strong>Report</strong> 2010 Additional Notes<br />
38 – Information on Subsidiaries<br />
Transactions with Pension Plans<br />
Under IFRS, certain post-employment benefit plans are considered related parties. The Group has business<br />
relationships with a number of its pension plans pursuant to which it provides financial services to these plans,<br />
including investment management services. The Group’s pension funds may hold or trade <strong>Deutsche</strong> <strong>Bank</strong><br />
shares or securities. A summary of transactions with related party pension plans follows.<br />
in € m. 2010 2009<br />
<strong>Deutsche</strong> <strong>Bank</strong> securities held in plan assets:<br />
Equity shares – –<br />
Bonds 16 –<br />
Other securities 83 26<br />
Total 99 26<br />
Property occupied by/other assets used by <strong>Deutsche</strong> <strong>Bank</strong> – –<br />
Derivatives: Market value for which DB (or subsidiary) is a counterparty (2) 177<br />
Derivatives: Notional amount for which DB (or subsidiary) is a counterparty 14,966 11,604<br />
Fees paid from Fund to any <strong>Deutsche</strong> <strong>Bank</strong> asset manager(s) 24 21<br />
38 –<br />
Information on Subsidiaries<br />
<strong>Deutsche</strong> <strong>Bank</strong> AG is the direct or indirect holding company for the Group’s subsidiaries.<br />
Significant Subsidiaries<br />
The following table presents the significant subsidiaries <strong>Deutsche</strong> <strong>Bank</strong> AG owns, directly or indirectly.<br />
Subsidiary Place of Incorporation<br />
Taunus Corporation 1 Delaware, United States<br />
<strong>Deutsche</strong> <strong>Bank</strong> Trust Company Americas 2 New York, United States<br />
<strong>Deutsche</strong> <strong>Bank</strong> Securities Inc. 3 Delaware, United States<br />
<strong>Deutsche</strong> <strong>Bank</strong> Luxembourg S.A. 4 Luxembourg<br />
<strong>Deutsche</strong> <strong>Bank</strong> Privat- und Geschäftskunden Aktiengesellschaft 5 Frankfurt am Main, Germany<br />
DB Valoren S.á.r.l. 6 Luxembourg<br />
DB Equity S.á.r.l. 7 Luxembourg<br />
<strong>Deutsche</strong> Postbank AG 8 Bonn, Germany<br />
1 This company is a holding company for most of the Group subsidiaries in the United States.<br />
2 This company is a subsidiary of Taunus Corporation. <strong>Deutsche</strong> <strong>Bank</strong> Trust Company Americas is a New York State-chartered bank which originates loans and other<br />
forms of credit, accepts deposits, arranges financings and provides numerous other commercial banking and financial services.<br />
3 <strong>Deutsche</strong> <strong>Bank</strong> Securities Inc. is a U.S. SEC-registered broker dealer and is a member of the New York Stock Exchange and regulated by the Financial Industry<br />
Regulatory Authority. It is also regulated by the individual state securities authorities in the states in which it operates.<br />
4 The primary business of this company comprises Treasury and Markets activities, especially as a major supplier of Euro liquidity for <strong>Deutsche</strong> <strong>Bank</strong> Group. Further<br />
business activities are the international loan business, where the bank acts as lending office for continental Europe and starting 2010 as risk hub for the loan<br />
exposure management group, and private banking.<br />
5 The company serves private individuals, affluent clients and small business clients with banking products.<br />
6 This company is a holding company for <strong>Deutsche</strong> <strong>Bank</strong> subgroups in Australia, New Zealand, and Singapore. It is also the holding company for DB Equity S.á.r.l.<br />
7 The company is the holding company for a part of the Group’s stake in <strong>Deutsche</strong> Postbank AG.<br />
8 The business activities of this company comprise retail banking, business with corporate customers, money and capital markets activities as well as home savings loans.
<strong>Deutsche</strong> <strong>Bank</strong> 02 – Consolidated Financial Statements 318<br />
Financial <strong>Report</strong> 2010 Additional Notes<br />
38 – Information on Subsidiaries<br />
The Group owns 100 % of the equity and voting interests in these significant subsidiaries, except for <strong>Deutsche</strong><br />
Postbank AG, of which the Group owns shares representing 52.03 % of the equity and voting rights as of<br />
December 31, 2010, and, taking into account certain financial instruments held by us, a total equity interest of<br />
79.45 %. They prepare financial statements as of December 31, 2010 and are included in the Group’s consolidated<br />
financial statements. Their principal countries of operation are the same as their countries of incorporation.<br />
Subsidiaries may have restrictions on their ability to transfer funds, including payment of dividends and repayment<br />
of loans, to <strong>Deutsche</strong> <strong>Bank</strong> AG. Reasons for the restrictions include:<br />
— Central bank restrictions relating to local exchange control laws<br />
— Central bank capital adequacy requirements<br />
— Local corporate laws, for example limitations regarding the transfer of funds to the parent when the<br />
respective entity has a loss carried forward not covered by retained earnings or other components of capital.<br />
Subsidiaries where the Group owns 50 percent or less of the Voting Rights<br />
The Group also consolidates certain subsidiaries although it owns 50 percent or less of the voting rights. Most<br />
of those subsidiaries are special purpose entities (“SPEs”) that are sponsored by the Group for a variety of<br />
purposes.<br />
In the normal course of business, the Group becomes involved with SPEs, primarily through the following types<br />
of transactions: asset securitizations, commercial paper programs, repackaging and investment products,<br />
mutual funds, structured transactions, leasing and closed-end funds. The Group’s involvement includes<br />
transferring assets to the entities, entering into derivative contracts with them, providing credit enhancement<br />
and liquidity facilities, providing investment management and administrative services, and holding ownership or<br />
other investment interests in the entities.<br />
Investees where the Group owns more than half of the Voting Rights<br />
The Group owns directly or indirectly more than half of the voting rights of investees but does not have control<br />
over these investees when<br />
— another investor has the power over more than half of the voting rights by virtue of an agreement with the<br />
Group, or<br />
— another investor has the power to govern the financial and operating policies of the investee under a statute<br />
or an agreement, or<br />
— another investor has the power to appoint or remove the majority of the members of the board of directors<br />
or equivalent governing body and the investee is controlled by that board or body, or when<br />
— another investor has the power to cast the majority of votes at meetings of the board of directors or<br />
equivalent governing body and control of the entity is by that board or body.
<strong>Deutsche</strong> <strong>Bank</strong> 02 – Consolidated Financial Statements 319<br />
Financial <strong>Report</strong> 2010 Additional Notes<br />
39 – Insurance and Investment Contracts<br />
39 –<br />
Insurance and Investment Contracts<br />
Liabilities arising from Insurance and Investment Contracts<br />
Dec 31, 2010 Dec 31, 2009<br />
in € m. Gross Reinsurance Net Gross Reinsurance Net<br />
Insurance contracts 4,899 (158) 1<br />
4,741 4,613 (1,534) 3,079<br />
Investment contracts 7,898 – 7,898 7,278 – 7,278<br />
Total 12,797 (158) 12,639 11,891 (1,534) 10,357<br />
1 In line with the change in presentation of longevity reinsurance contracts to show the net cash flows, the amount included as reinsurance contracts above reflects the<br />
net payments expected under such contracts. The effect of this change is to reduce 2010’s amount by an amount equivalent to the gross balance sheet value of<br />
annuity contracts subject to reinsurance which was € 1,423 million.<br />
Generally, amounts relating to reinsurance contracts are reported gross unless they have an immaterial impact<br />
to their respective balance sheet line items.<br />
Carrying Amount<br />
The following table presents an analysis of the change in insurance and investment contracts liabilities.<br />
in € m.<br />
Insurance<br />
contracts<br />
Investment<br />
contracts<br />
2010 2009<br />
Insurance<br />
contracts<br />
Investment<br />
contracts<br />
Balance, beginning of year 4,613 7,278 3,963 5,977<br />
New business 257 153 121 171<br />
Claims/withdrawals paid (463) (609) (285) (549)<br />
Other changes in existing business 331 843 427 1,145<br />
Exchange rate changes 161 233 387 534<br />
Balance, end of year 4,899 7,898 4,613 7,278<br />
Other changes in existing business for the investment contracts of € 843 million and € 1,145 million are principally<br />
attributable to changes in the underlying assets’ fair value for the years ended December 31, 2010 and<br />
December 31, 2009, respectively.<br />
Key Assumptions in relation to Insurance Business<br />
The liabilities will vary with movements in interest rates, which are applicable, in particular, to the cost of<br />
guaranteed benefits payable in the future, investment returns and the cost of life assurance and annuity benefits<br />
where future mortality is uncertain.<br />
Assumptions are made related to all material factors affecting future cash flows, including future interest rates,<br />
mortality and costs. The assumptions to which the long term business amount is most sensitive are the interest<br />
rates used to discount the cash flows and the mortality assumptions, particularly those for annuities.<br />
The assumptions are set out below:
<strong>Deutsche</strong> <strong>Bank</strong> 02 – Consolidated Financial Statements 320<br />
Financial <strong>Report</strong> 2010 Additional Notes<br />
39 – Insurance and Investment Contracts<br />
Interest Rates<br />
Interest rates are used that reflect a best estimate of future investment returns taking into account the nature<br />
and term of the assets used to support the liabilities. Suitable margins for default risk are allowed for in the<br />
assumed interest rate.<br />
Mortality<br />
Mortality rates are based on published tables, adjusted appropriately to take into account changes in the<br />
underlying population mortality since the table was published, company experience and forecast changes in<br />
future mortality. If appropriate, a margin is added to assurance mortality rates to allow for adverse future<br />
deviations. Annuitant mortality rates are adjusted to make allowance for future improvements in pensioner<br />
longevity. Improvements in annuitant mortality are based on a percentage of the medium cohort projection<br />
subject to a minimum of rate of improvement of 1.25 % per annum.<br />
Costs<br />
For non-linked contracts, allowance is made explicitly for future expected per policy costs.<br />
Other Assumptions<br />
The take-up rate of guaranteed annuity rate options on pension business is assumed to be 64 % for the year<br />
ended December 31, 2010 and 60 % for the year ended December 31, 2009.<br />
Key Assumptions impacting Value of Business Acquired (VOBA)<br />
The opening VOBA arising on the purchase of Abbey Life Assurance Company Limited was determined by<br />
capitalizing the present value of the future cash flows of the business over the reported liability at the date of<br />
acquisition. If assumptions were required about future mortality, morbidity, persistency and expenses, they were<br />
determined on a best estimate basis taking into account the business’s own experience. General economic<br />
assumptions were set considering the economic indicators at the date of acquisition.<br />
The rate of VOBA amortization is determined by considering the profile of the business acquired and the expected<br />
depletion in future value. At the end of each accounting period, the remaining VOBA is tested against the future<br />
net profit expected related to the business that was in force at the date of acquisition.<br />
If there is insufficient net profit, the VOBA will be written down to its supportable value.
<strong>Deutsche</strong> <strong>Bank</strong> 02 – Consolidated Financial Statements 321<br />
Financial <strong>Report</strong> 2010 Additional Notes<br />
39 – Insurance and Investment Contracts<br />
Key Changes in Assumptions<br />
Upon acquisition of Abbey Life Assurance Company Limited in October 2007, liabilities for insurance contracts<br />
were recalculated from a regulatory basis to a best estimate basis in line with the provisions of IFRS 4. The<br />
non-economic assumptions set at that time have not been changed but the economic assumptions have been<br />
reviewed in line with changes in key economic indicators. For annuity contracts, the liability was valued using<br />
the locked-in basis determined at the date of acquisition.<br />
Sensitivity Analysis (in respect of Insurance Contracts only)<br />
The following table presents the sensitivity of the Group’s profit before tax and equity to changes in some of the<br />
key assumptions used for insurance contract liability calculations. For each sensitivity test, the impact of a<br />
reasonably possible change in a single factor is shown with other assumptions left unchanged.<br />
Impact on profit before tax Impact on equity<br />
in € m. 2010 2009 2<br />
2010 2009 2<br />
Variable:<br />
Mortality 1 (worsening by ten percent) (12) (11) (9) (8)<br />
Renewal expense (ten percent increase) (2) (2) (1) (1)<br />
Interest rate (one percent increase) 14 7 (112) (108)<br />
1 The impact of mortality assumes a ten percent decrease in annuitant mortality and a ten percent increase in mortality for other business.<br />
2 Prior year amounts have been adjusted.<br />
For certain insurance contracts, the underlying valuation basis contains a Provision for Adverse Deviations<br />
(“PADs”). For these contracts any worsening of expected future experience would not change the level of<br />
reserves held until all the PADs have been eroded while any improvement in experience would not result in an<br />
increase to these reserves. Therefore, in the sensitivity analysis, if the variable change represents a worsening<br />
of experience, the impact shown represents the excess of the best estimate liability over the PADs held at the<br />
balance sheet date. As a result, the figures disclosed in this table should not be used to imply the impact of a<br />
different level of change, and it should not be assumed that the impact would be the same if the change occurred<br />
at a different point in time.
<strong>Deutsche</strong> <strong>Bank</strong> 02 – Consolidated Financial Statements 322<br />
Financial <strong>Report</strong> 2010 Additional Notes<br />
40 – Current and Non-Current Assets and Liabilities<br />
40 –<br />
Current and Non-Current Assets and Liabilities<br />
The following tables present an analysis of each asset and liability line item by amounts recovered or settled<br />
within or after one year as of December 31, 2010 and December 31, 2009.<br />
Asset items as of December 31, 2010, follow.<br />
Amounts recovered or settled Total<br />
in € m. within one year after one year Dec 31, 2010<br />
Cash and due from banks 17,157 – 17,157<br />
Interest-earning deposits with banks 91,471 906 92,377<br />
Central bank funds sold and securities purchased under resale agreements 19,923 442 20,365<br />
Securities borrowed 28,916 – 28,916<br />
Financial assets at fair value through profit or loss 1,069,579 31,418 1,100,997<br />
Financial assets available for sale 7,859 46,407 54,266<br />
Equity method investments – 2,608 2,608<br />
Loans 128,157 279,572 407,729<br />
Property and equipment – 5,802 5,802<br />
Goodwill and other intangible assets – 15,594 15,594<br />
Other assets 137,751 11,478 149,229<br />
Assets for current tax 2,048 201 2,249<br />
Total assets before deferred tax assets 1,502,861 394,428 1,897,289<br />
Deferred tax assets 8,341<br />
Total assets 1,905,630<br />
Liability items as of December 31, 2010, follow.<br />
Amounts recovered or settled Total<br />
in € m. within one year after one year Dec 31, 2010<br />
Deposits 475,255 58,729 533,984<br />
Central bank funds purchased and securities sold under repurchase agreements 26,314 1,608 27,922<br />
Securities loaned 3,078 198 3,276<br />
Financial liabilities at fair value through profit or loss 833,642 20,440 854,082<br />
Other short-term borrowings 64,990 – 64,990<br />
Other liabilities 169,192 12,635 181,827<br />
Provisions 2,204 – 2,204<br />
Liabilities for current tax 960 1,776 2,736<br />
Long-term debt 28,870 140,790 169,660<br />
Trust preferred securities 1,334 10,916 12,250<br />
Obligation to purchase common shares – – –<br />
Total liabilities before deferred tax liabilities 1,605,839 247,092 1,852,931<br />
Deferred tax liabilities 2,307<br />
Total liabilities 1,855,238
<strong>Deutsche</strong> <strong>Bank</strong> 02 – Consolidated Financial Statements 323<br />
Financial <strong>Report</strong> 2010 Additional Notes<br />
40 – Current and Non-Current Assets and Liabilities<br />
Asset items as of December 31, 2009, follow.<br />
Amounts recovered or settled Total<br />
in € m. within one year after one year Dec 31, 2009<br />
Cash and due from banks 9,346 – 9,346<br />
Interest-earning deposits with banks 46,383 850 47,233<br />
Central bank funds sold and securities purchased under resale agreements 6,587 233 6,820<br />
Securities borrowed 43,509 – 43,509<br />
Financial assets at fair value through profit or loss 943,143 22,177 965,320<br />
Financial assets available for sale 3,605 15,214 18,819<br />
Equity method investments – 7,788 7,788<br />
Loans 93,781 164,324 258,105<br />
Property and equipment – 2,777 2,777<br />
Goodwill and other intangible assets – 10,169 10,169<br />
Other assets 113,255 8,283 121,538<br />
Assets for current tax 1,247 843 2,090<br />
Total assets before deferred tax assets 1,260,856 232,658 1,493,514<br />
Deferred tax assets 7,150<br />
Total assets 1,500,664<br />
Liability items as of December 31, 2009, follow.<br />
Amounts recovered or settled Total<br />
in € m. within one year after one year Dec 31, 2009<br />
Deposits 310,805 33,415 344,220<br />
Central bank funds purchased and securities sold under repurchase agreements 45,453 42 45,495<br />
Securities loaned 5,098 466 5,564<br />
Financial liabilities at fair value through profit or loss 702,804 19,470 722,274<br />
Other short-term borrowings 42,897 – 42,897<br />
Other liabilities 147,506 6,775 154,281<br />
Provisions 1,307 – 1,307<br />
Liabilities for current tax 729 1,412 2,141<br />
Long-term debt 18,895 112,887 131,782<br />
Trust preferred securities 746 9,831 10,577<br />
Obligation to purchase common shares – – –<br />
Total liabilities before deferred tax liabilities 1,276,240 184,298 1,460,538<br />
Deferred tax liabilities 2,157<br />
Total liabilities 1,462,695
<strong>Deutsche</strong> <strong>Bank</strong> 02 – Consolidated Financial Statements 324<br />
Financial <strong>Report</strong> 2010 Additional Notes<br />
41 – Supplementary Information to the Consolidated Financial Statements according to Section 315a HGB<br />
41 –<br />
Supplementary Information to the Consolidated Financial Statements according to Section<br />
315a HGB<br />
As required by Section 315a German Commercial Code (“HGB”), the consolidated financial statements prepared<br />
in accordance with IFRS must provide additional disclosures which are given below.<br />
Staff Costs<br />
in € m. 2010 2009<br />
Staff costs:<br />
Wages and salaries 10,786 9,336<br />
Social security costs 1,885 1,974<br />
thereof: those relating to pensions 440 472<br />
Total 12,671 11,310<br />
Staff<br />
The average number of effective staff employed in 2010 was 82,434 (2009: 79,098) of whom 34,529<br />
(2009: 33,400) were women. Part-time staff is included in these figures proportionately. An average of 51,268<br />
(2009: 51,183) staff members worked outside Germany.<br />
Management Board and Supervisory Board Remuneration<br />
The total compensation of the Management Board was € 33,230,174 and € 35,023,965 for the years ended<br />
December 31, 2010 and 2009, respectively, thereof € 23,022,336 and € 28,224,619 for variable components.<br />
Former members of the Management Board of <strong>Deutsche</strong> <strong>Bank</strong> AG or their surviving dependents received<br />
€ 18,083,535 and € 19,849,430 for the years ended December 31, 2010 and 2009, respectively.<br />
The Supervisory Board received a fixed payment (including payments for meeting fees) of € 2,453,000 and<br />
€ 2,436,000 (excluding value-added tax) for the years 2010 and 2009 respectively. A performance-related<br />
remuneration was not payed for 2010, as the barriers as defined in the articles of association with regard to<br />
dividends and earnings per share (diluted) were not met in 2010 (variable remuneration amounted to<br />
€ 125,316 for the year ended December 31, 2009).<br />
Provisions for pension obligations to former members of the Management Board and their surviving dependents<br />
amounted to € 167,660,106 and € 171,135,197 at December 31, 2010 and 2009, respectively.<br />
Loans and advances granted and contingent liabilities assumed for members of the Management Board<br />
amounted to € 7,321,343 and € 8,128,645 and for members of the Supervisory Board of <strong>Deutsche</strong> <strong>Bank</strong> AG to<br />
€ 2,633,122 and € 1,166,445 for the years ended December 31, 2010 and 2009, respectively. Members of the<br />
Supervisory Board repaid € 174,314 loans in 2010.
<strong>Deutsche</strong> <strong>Bank</strong> 02 – Consolidated Financial Statements 325<br />
Financial <strong>Report</strong> 2010 Additional Notes<br />
41 – Supplementary Information to the Consolidated Financial Statements according to Section 315a HGB<br />
Corporate Governance<br />
<strong>Deutsche</strong> <strong>Bank</strong> AG has approved the Declaration of Conformity in accordance with section 161 of the German<br />
Corporation Act (AktG). The declaration is published on <strong>Deutsche</strong> <strong>Bank</strong>’s website (http://www.deutschebank.de/ir/en/content/declaration_of_conformity.htm).<br />
Principal Accounting Fees and Services<br />
The table below gives a breakdown of the fees charged by the Group’s auditor for the 2010 and 2009<br />
financial year.<br />
Fee category in € m. 2010 2009<br />
Audit fees 53 45<br />
thereof to KPMG Europe LLP 37 29<br />
Audit-related fees 9 6<br />
thereof to KPMG Europe LLP 7 4<br />
Tax-related fees 7 5<br />
thereof to KPMG Europe LLP 4 2<br />
All other fees 2 –<br />
thereof to KPMG Europe LLP 1 –<br />
Total fees 71 56<br />
For further information please refer to the Corporate Governance Statement/Corporate Governance <strong>Report</strong>.<br />
.
<strong>Deutsche</strong> <strong>Bank</strong> 02 – Consolidated Financial Statements 326<br />
Financial <strong>Report</strong> 2010 Additional Notes<br />
<strong>Deutsche</strong> <strong>Bank</strong><br />
Financial <strong>Report</strong> 2010<br />
42 –<br />
Shareholdings<br />
42 – Shareholdings<br />
02 – Consolidated Financial Statements<br />
Additional Notes<br />
42 – Shareholdings<br />
Consolidated Subsidiaries<br />
Consolidated Subsidiaries – 327<br />
Special Purpose Entities – 349<br />
Companies accounted for at equity – 364<br />
Other Companies, where the holding equals or exceeds 20% – 368<br />
Holdings in large corporations, where the holding exceeds 5% of the voting rights – 370<br />
The following pages show the Shareholdings of <strong>Deutsche</strong> <strong>Bank</strong> Group pursuant to Section 313 (2)<br />
of the German Commercial Code ("HGB").<br />
Footnotes:<br />
1 Controlled via managing general partner.<br />
2 Controlled due to board membership.<br />
3 Controlled, as potential currently exercisable voting rights are held, which can increase <strong>Deutsche</strong> <strong>Bank</strong> Group's interest to<br />
above 50%.<br />
4 Special Fund.<br />
5 Controlled.<br />
6 Classified as held for sale pursuant to IFRS 5.<br />
7 Only specified assets and related liabilities (silos) of this entity were consolidated.<br />
8 Consists of 768 individual Trusts (only variing in series number / duration) which purchase a municipal debt security and<br />
issue short puttable exempt adjusted receipts (SPEARs) and long inverse floating exempt receipts (LIFERs) which are then<br />
sold to investors.<br />
9 Accounted for at equity due to significant influence.<br />
10 Name of company changed per 18.01.2011 from Argon New S.à r.l.<br />
11 Not controlled.<br />
12 Classified as Special Purpose Entity not to be consolidated under IFRS.<br />
13 Classified as Special Purpose Entity not to be accounted for at equity under IFRS.<br />
14 Not consolidated or accounted for at equity as classified as securities available for sale.<br />
15 Shares are held as collateral.<br />
16 Not accounted for at equity as classified as at fair value.<br />
17 Parent company is accounted for at equity.<br />
326
<strong>Deutsche</strong> <strong>Bank</strong><br />
02 – Consolidated Financial Statements<br />
327<br />
<strong>Deutsche</strong> <strong>Bank</strong> 02 – Consolidated Financial Statements 327<br />
Financial <strong>Report</strong> 2010<br />
Additional Notes<br />
Financial <strong>Report</strong> 2010 Additional Notes<br />
42 – Shareholdings<br />
42 – Shareholdings<br />
Consolidated Subsidiaries<br />
Consolidated Subsidiaries<br />
Serial<br />
Share of<br />
capital<br />
No. Name of company Domicile of company Footnote in %<br />
1 <strong>Deutsche</strong> <strong>Bank</strong> Aktiengesellschaft Frankfurt am Main<br />
2 A-AT Gestion Paris 99.9<br />
3 Abbey Life Assurance Company Limited London 100.0<br />
4 Abbey Life Trust Securities Limited London 100.0<br />
5 Abbey Life Trustee Services Limited London 100.0<br />
6 ABFS I Incorporated Baltimore 100.0<br />
7 ABS Leasing Services Company Chicago 100.0<br />
8 ABS MB Limited Baltimore 100.0<br />
9 Absolute Energy S.r.l. Rome 100.0<br />
10 AC VII Privatkunden GmbH & Co. KG Munich 1 0.0<br />
11 Acanfeld Limited Bangkok 99.9<br />
12 Accounting Solutions Holding Company, Inc. Wilmington 100.0<br />
13 ADARA Beteiligungs- und Verwaltungs GmbH Cologne 100.0<br />
14 ADD ONE GmbH & Co. KG Munich 1 0.0<br />
15 Advent Chestnut VI GmbH & Co. KG Munich 1 0.1<br />
16 Affordable Housing I LLC Wilmington 100.0<br />
17 Agripower Buddosò Società Agricola a Responsabilità Limitata Pesaro 2, 3 9.0<br />
18 AheadCom Beteiligungs-GmbH Frankfurt 100.0<br />
19 Airport Club für International Executives GmbH Frankfurt 84.0<br />
20 Alex. Brown Financial Services Incorporated Baltimore 100.0<br />
21 Alex. Brown Investments Incorporated Baltimore 100.0<br />
22 Alex. Brown Management Services, Inc. Baltimore 100.0<br />
23 Alfred Herrhausen Gesellschaft - Das internationale Forum der <strong>Deutsche</strong>n <strong>Bank</strong> - mbH Berlin 100.0<br />
24 Allsar Inc. Wilmington 100.0<br />
25 Alpha Investment Management S.A.M. Monte Carlo 100.0<br />
26 Altamira LLC Wilmington 100.0<br />
27 "Alwa" Gesellschaft für Vermögensverwaltung mit beschränkter Haftung Frankfurt 100.0<br />
28 AMADEUS II 'D' GmbH & Co. KG Munich 99.9<br />
29 America/Asia Private Equity Portfolio (PE-US/ASIA) GmbH & Co. KG Munich 1 0.2<br />
30 Americas Trust Servicios de Consultoria, S.A. Madrid 100.0<br />
31 Anemos ITA 1 S.r.l. Rome 100.0<br />
32 Annandale LLC Wilmington 100.0<br />
33 Antelope Pension Trustee Services Limited London 100.0<br />
34 AO DB Securities (Kazakhstan) Almaty 100.0<br />
35 Apex Fleet Inc. Wilmington 100.0<br />
36 APOLLON Vermögensverwaltungsgesellschaft mbH Cologne 100.0<br />
37 Aqueduct Capital S.à r.l. Luxembourg 100.0<br />
38 Arche Investments Limited London 100.0<br />
39 Argent Incorporated Baltimore 100.0<br />
40 ATHOS Beteiligungs- und Verwaltungs-GmbH Cologne 100.0<br />
41 Atlantic No. 1 Limited (in member's voluntary liquidation) London 100.0<br />
42 Autumn Leasing Limited London 100.0<br />
43 Avatar Finance George Town 100.0<br />
44 AXOS Beteiligungs- und Verwaltungs-GmbH Cologne 100.0<br />
45 B.T. Vordertaunus (Luxembourg), S.à r.l. Luxembourg 100.0<br />
46 B.T.I. Investments London 100.0<br />
47 B.V. Matura Handelmaatschappij Amsterdam 100.0<br />
48 BAG Frankfurt 4 100.0<br />
49 BAG 2 Frankfurt 4 100.0<br />
50 Baincor Nominees Pty. Limited Sydney 100.0<br />
51 Bainpro Nominees Pty. Limited Sydney 100.0<br />
52 Bainsec Nominees Pty. Limited Sydney 100.0<br />
53 BAL Servicing Corporation Wilmington 100.0<br />
54 <strong>Bank</strong> Sal. Oppenheim jr. & Cie. (Schweiz) AG Zurich 100.0<br />
55 <strong>Bank</strong>ers Company, Inc. Trenton 100.0<br />
56 <strong>Bank</strong>ers International Corporation New York 100.0
<strong>Deutsche</strong> <strong>Bank</strong><br />
02 – Consolidated Financial Statements<br />
328<br />
<strong>Deutsche</strong> <strong>Bank</strong> 02 – Consolidated Financial Statements 328<br />
Financial <strong>Report</strong> 2010<br />
Additional Notes<br />
Financial <strong>Report</strong> 2010 Additional Notes<br />
42 – Shareholdings<br />
42 – Shareholdings<br />
Consolidated Subsidiaries<br />
Consolidated Subsidiaries<br />
Serial<br />
Share of<br />
capital<br />
No. Name of company Domicile of company Footnote in %<br />
57 <strong>Bank</strong>ers International Corporation (Brasil) Ltda. Sao Paulo 100.0<br />
58 <strong>Bank</strong>ers Trust Caribe Capital Markets, Inc. Hato Rey 100.0<br />
59 <strong>Bank</strong>ers Trust International Finance (Jersey) Limited St. Helier 100.0<br />
60 <strong>Bank</strong>ers Trust International Limited London 100.0<br />
61 <strong>Bank</strong>ers Trust Investments Limited London 100.0<br />
62 <strong>Bank</strong>ers Trust Nominees Limited London 100.0<br />
63 Barkly Investments Ltd. St. Helier 100.0<br />
64 Bayan Delinquent Loan Recovery 1 (SPV-AMC), Inc. Makati City 100.0<br />
65 Beachwood Properties Corp. Wilmington 5 0.0<br />
66 Bebek Varlik Yönetym A.S. Istanbul 100.0<br />
67 Beheer- en Beleggingsmaatschappij Evergreen Global Intellectual Transaction Services B.V. Amsterdam 100.0<br />
68 Bellstead Holdings Limited Gibraltar 100.0<br />
69 Berliner <strong>Bank</strong> Beteiligungs AG Berlin 100.0<br />
70 Beteiligungsgesellschaft für Flugzeugleasing mit beschränkter Haftung i.L. Frankfurt 100.0<br />
71 Betriebs-Center für <strong>Bank</strong>en AG Frankfurt 100.0<br />
72 Betriebs-Center für <strong>Bank</strong>en Processing GmbH Frankfurt 100.0<br />
73 BfI-Beteiligungsgesellschaft für Industriewerte mbH Frankfurt 100.0<br />
74 BHF Club Deal GmbH Frankfurt 100.0<br />
75 BHF Grundbesitz-Verwaltungsgesellschaft mbH Frankfurt 100.0<br />
76 BHF Grundbesitz-Verwaltungsgesellschaft mbH & Co. am Kaiserlei OHG Frankfurt 100.0<br />
77 BHF Immobilien-GmbH Frankfurt 100.0<br />
78 BHF Lux Immo S.A. Luxembourg 100.0<br />
79 BHF PEP I Beteiligungsgesellschaft mbH Munich 100.0<br />
80 BHF PEP II Beteiligungsgesellschaft mbH Munich 100.0<br />
81 BHF PEP III Beteiligungsgesellschaft mbH Munich 100.0<br />
82 BHF Private Equity Management GmbH Frankfurt 100.0<br />
83 BHF Private Equity Portfolio GmbH & Co. Beteiligungs KG Nr. 1 Munich 1 0.4<br />
84 BHF Private Equity Portfolio GmbH & Co. Beteiligungs KG Nr. 2 Munich 1 0.3<br />
85 BHF Private Equity Portfolio GmbH & Co. Beteiligungs KG Nr. 3 Munich 1 0.4<br />
86 BHF Private Equity Treuhand- und Beratungsgesellschaft mbH Frankfurt 100.0<br />
87 BHF Trust Management Gesellschaft für Vermögensverwaltung mbH Frankfurt 100.0<br />
88 BHF Zurich Family Office AG Zurich 100.0<br />
89 BHF-BANK (Schweiz) AG Zurich 100.0<br />
90 BHF-BANK Aktiengesellschaft Frankfurt 100.0<br />
91 BHF-BANK International S.A. Luxembourg 100.0<br />
92 BHF-Betriebsservice GmbH Frankfurt 100.0<br />
93 BHW - Gesellschaft für Wohnungswirtschaft mbH Hameln 100.0<br />
94 BHW - Gesellschaft für Wohnungswirtschaft mbH & Co. Immobilienverwaltungs KG Hameln 100.0<br />
95 BHW Bausparkasse Aktiengesellschaft Hameln 100.0<br />
96 BHW Direktservice GmbH Hameln 100.0<br />
97 BHW Eurofinance B.V. Arnhem 100.0<br />
98 BHW Financial S.r.l. Verona 100.0<br />
99 BHW Gesellschaft für Vorsorge mbH Hameln 100.0<br />
100 BHW Holding Aktiengesellschaft Berlin 100.0<br />
101 BHW Immobilien GmbH Hameln 100.0<br />
102 BHW Invest, Société à responsabilité limitée Luxembourg 100.0<br />
103 Billboard Partners L.P. George Town 99.9<br />
104 Biomass Holdings S.à r.l. Luxembourg 100.0<br />
105 Bleeker Investments Limited Wilmington 100.0<br />
106 Blue Cork, Inc. Wilmington 100.0<br />
107 Blue Ridge CLO Holding Company LLC Wilmington 100.0<br />
108 Bluewater Creek Management Co. Wilmington 100.0<br />
109 BNA Nominees Pty. Limited Sydney 100.0<br />
110 Bonsai Investment AG Frauenfeld 100.0<br />
111 Borfield S.A. Montevideo 100.0<br />
112 BRIMCO, S. de R.L. de C.V. Mexico City 100.0
<strong>Deutsche</strong> <strong>Bank</strong><br />
02 – Consolidated Financial Statements<br />
329<br />
<strong>Deutsche</strong> <strong>Bank</strong> 02 – Consolidated Financial Statements 329<br />
Financial <strong>Report</strong> 2010<br />
Additional Notes<br />
Financial <strong>Report</strong> 2010 Additional Notes<br />
42 – Shareholdings<br />
42 – Shareholdings<br />
Consolidated Subsidiaries<br />
Consolidated Subsidiaries<br />
Serial<br />
Share of<br />
capital<br />
No. Name of company Domicile of company Footnote in %<br />
113 Britannia Limited London 100.0<br />
114 Broome Investments Limited Wilmington 100.0<br />
115 BT (Far East) Limited Hong Kong 100.0<br />
116 BT American Securities (Luxembourg), S.à r.l. Luxembourg 100.0<br />
117 BT Azure No. 1 Limited George Town 100.0<br />
118 BT Ben Nevis Limited George Town 100.0<br />
119 BT Cayman Income No. 1 George Town 100.0<br />
120 BT Commercial Corporation Wilmington 100.0<br />
121 BT CTAG Nominees Limited London 100.0<br />
122 BT Devonport Limited George Town 100.0<br />
123 BT Globenet Nominees Limited London 100.0<br />
124 BT Harborside Urban Renewal Corporation West Trenton 100.0<br />
125 BT International (Nigeria) Limited Lagos 100.0<br />
126 BT Maulbronn GmbH Eschborn 100.0<br />
127 BT McKinley Limited George Town 100.0<br />
128 BT Milford (Cayman) Limited George Town 100.0<br />
129 BT Money Markets Fund No. 1 Limited (in member's voluntary liquidation) London 100.0<br />
130 BT Muritz GmbH Eschborn 100.0<br />
131 BT Nominees (Singapore) Pte Ltd Singapore 100.0<br />
132 BT Opera Trading S.A. Paris 100.0<br />
133 BT Pension Fund Trustees Limited London 100.0<br />
134 BT Sable LLC Wilmington 100.0<br />
135 BT Vordertaunus Verwaltungs- und Beteiligungsgesellschaft mbH Eschborn 100.0<br />
136 BT/ABKB Partnership Management Los Angeles 99.9<br />
137 BTAS Cayman GP George Town 100.0<br />
138 BTD Nominees Pty. Limited Sydney 100.0<br />
139 BTFIC - Portugal, Gestao e Investimentos (Sociedade Unipessoal) S.A. Funchal 100.0<br />
140 BTVR Investments No. 1 Limited St. Helier 100.0<br />
141 Buxtal Pty Limited Sydney 100.0<br />
142 C. J. Lawrence Inc. Wilmington 100.0<br />
143 CAM DREI Initiator GmbH & Co. KG Cologne 1 14.5<br />
144 CAM Initiator Treuhand GmbH & Co. KG Cologne 100.0<br />
145 CAM PE Verwaltungs GmbH & Co. KG Cologne 100.0<br />
146 CAM Private Equity Consulting & Verwaltungs-GmbH Cologne 100.0<br />
147 CAM Private Equity Evergreen GmbH & Co. KG UBG Cologne 1 0.0<br />
148 CAM Private Equity Nominee GmbH & Co. KG Cologne 100.0<br />
149 CAM Private Equity Verwaltungs-GmbH Cologne 100.0<br />
150 CAM Secondary Select I Beteiligungs GmbH Cologne 100.0<br />
151 CAM Secondary Select I GmbH & Co. KG Cologne 1 0.0<br />
152 CAM SEL I Initiator GmbH & Co. KG Cologne 1 15.3<br />
153 CAM SEL II Initiator GmbH & Co. KG Cologne 1 15.3<br />
154 CAM Select I Beteiligungs GmbH Cologne 100.0<br />
155 CAM Select I GmbH & Co. KG Cologne 1 0.0<br />
156 CAM Select II Beteiligungs GmbH Cologne 100.0<br />
157 CAM Select II GmbH & Co. KG Cologne 1 0.0<br />
158 Campanology Leasing Limited George Town 100.0<br />
159 3160343 Canada Inc. Toronto 100.0<br />
160 3613950 Canada, Inc. Toronto 100.0<br />
161 Caneel Bay Holding Corp. Chicago 5 0.0<br />
162 Cape Acquisition Corp. Wilmington 100.0<br />
163 CapeSuccess LLC Wilmington 82.6<br />
164 CapeSuccess, Inc. Wilmington 100.0<br />
165 Capital Solutions Exchange Inc. Wilmington 100.0<br />
166 Cardales UK Limited Liverpool 100.0<br />
167 Career Blazers Consulting Services, Inc. Albany 100.0<br />
168 Career Blazers Contingency Professionals, Inc. Albany 100.0
<strong>Deutsche</strong> <strong>Bank</strong><br />
02 – Consolidated Financial Statements<br />
330<br />
<strong>Deutsche</strong> <strong>Bank</strong> 02 – Consolidated Financial Statements 330<br />
Financial <strong>Report</strong> 2010<br />
Additional Notes<br />
Financial <strong>Report</strong> 2010 Additional Notes<br />
42 – Shareholdings<br />
42 – Shareholdings<br />
Consolidated Subsidiaries<br />
Consolidated Subsidiaries<br />
Serial<br />
Share of<br />
capital<br />
No. Name of company Domicile of company Footnote in %<br />
169 Career Blazers Learning Center of Los Angeles, Inc. Los Angeles 100.0<br />
170 Career Blazers LLC Wilmington 100.0<br />
171 Career Blazers Management Company, Inc. Albany 100.0<br />
172 Career Blazers New York, Inc. Albany 100.0<br />
173 Career Blazers of Ontario, Inc. London, Ontario 100.0<br />
174 Career Blazers Personnel Services of Washington, D.C., Inc. Washington D.C. 100.0<br />
175 Career Blazers Personnel Services, Inc. Albany 100.0<br />
176 Career Blazers Service Company, Inc. Wilmington 100.0<br />
177 Caribbean Resort Holdings, Inc. New York 5 0.0<br />
178 Cashforce International Credit Support B.V. Rotterdam 100.0<br />
179 Castlewood Expansion Partners, L.P. Wilmington 87.5<br />
180 Castor LLC Wilmington 5 0.0<br />
181 Cathay Advisory (Beijing) Company Ltd Beijing 100.0<br />
182 Cathay Asset Management Company Limited Port Louis 100.0<br />
183 Cathay Capital Company (No 2) Limited Port Louis 67.6<br />
184 CBI NY Training, Inc. Albany 100.0<br />
185 Cedar Investment Co. Wilmington 100.0<br />
186 CELENA Beteiligungs- und Verwaltungs GmbH Cologne 100.0<br />
187 Centennial River 1 Inc. Denver 100.0<br />
188 Centennial River 2 Inc. Austin 100.0<br />
189 Centennial River Acquisition I Corporation Wilmington 100.0<br />
190 Centennial River Acquisition II Corporation Wilmington 100.0<br />
191 Centennial River Corporation Wilmington 100.0<br />
192 Channel Nominees Limited London 100.0<br />
193 Charlton (Delaware), Inc. Wilmington 100.0<br />
194 China Recovery Fund LLC Wilmington 85.0<br />
195 Cinda - DB NPL Securitization Trust 2003-1 Wilmington 5 0.0<br />
196 CITAN Beteiligungsgesellschaft mbH Frankfurt 100.0<br />
197 City Leasing (Avonside) Limited London 100.0<br />
198 City Leasing (Clydeside) Limited London 100.0<br />
199 City Leasing (Donside) Limited London 100.0<br />
200 City Leasing (Fleetside) Limited London 100.0<br />
201 City Leasing (Medwayside) Limited London 100.0<br />
202 City Leasing (Severnside) Limited London 100.0<br />
203 City Leasing (Thameside) Limited London 100.0<br />
204 City Leasing (Wearside) Limited London 100.0<br />
205 City Leasing and Partners London 100.0<br />
206 City Leasing and Partners Limited London 100.0<br />
207 City Leasing Limited London 100.0<br />
208 Civic Investments Limited St. Helier 100.0<br />
209 Clark GmbH & Co. KG Frankfurt 100.0<br />
210 ClarksonX Inc. Wilmington 100.0<br />
211 CNS Cayman Holdings One Ltd. George Town 100.0<br />
212 Consumo Finance S.p.A. Milan 100.0<br />
213 Coronus L.P. St. Helier 100.0<br />
214 CREDA Objektanlage- und verwaltungsgesellschaft mbH Bonn 100.0<br />
215 Crosby Investments Limited Wilmington 100.0<br />
216 CTXL Achtzehnte Vermögensverwaltung GmbH Munich 100.0<br />
217 Custom Leasing Limited London 100.0<br />
218 Cyrus J. Lawrence Capital Holdings, Inc. Wilmington 100.0<br />
219 D B Rail Holdings (UK) No. 1 Limited London 100.0<br />
220 D F Japan Godo Kaisha Tokyo 100.0<br />
221 D.B. International Delaware, Inc. Wilmington 100.0<br />
222 Dahlbusch Projektentwicklungsgesellschaft Leipzig/Lindenau mbH i.L. Frankfurt 100.0<br />
223 DAHOC (UK) Limited London 100.0<br />
224 DAHOC Beteiligungsgesellschaft mbH Frankfurt 100.0
<strong>Deutsche</strong> <strong>Bank</strong><br />
02 – Consolidated Financial Statements<br />
331<br />
<strong>Deutsche</strong> <strong>Bank</strong> 02 – Consolidated Financial Statements 331<br />
Financial <strong>Report</strong> 2010<br />
Additional Notes<br />
Financial <strong>Report</strong> 2010 Additional Notes<br />
42 – Shareholdings<br />
42 – Shareholdings<br />
Consolidated Subsidiaries<br />
Consolidated Subsidiaries<br />
Serial<br />
Share of<br />
capital<br />
No. Name of company Domicile of company Footnote in %<br />
225 Dark Blue Investments Limited George Town 100.0<br />
226 DB (Gibraltar) Holdings Limited Gibraltar 100.0<br />
227 DB (Malaysia) Nominee (Asing) Sdn. Bhd. Kuala Lumpur 100.0<br />
228 DB (Malaysia) Nominee (Tempatan) Sdn. Bhd. Kuala Lumpur 100.0<br />
229 DB (Pacific) Limited Wilmington 100.0<br />
230 DB (Pacific) Limited, New York New York 100.0<br />
231 DB (Tip Top) Limited Partnership Toronto 99.9<br />
232 DB Advisors Risk Managed Alpha (RMA) Investment Trust Salem 100.0<br />
233 DB Advisors US Large Cap Core Investment Trust Salem 100.0<br />
234 DB Advisors US Large Cap Value Investment Trust Salem 100.0<br />
235 DB Advisors US Small Cap Growth Investment Trust Salem 100.0<br />
236 DB Alex. Brown Exchange Fund I, L.P. Baltimore 5 4.1<br />
237 DB Alex. Brown Holdings Incorporated Wilmington 100.0<br />
238 DB Alternative Trading Inc. Wilmington 100.0<br />
239 DB Americas Funding Corp. Wilmington 100.0<br />
240 DB Americas Infrastructure Holdings, L.L.C. Wilmington 100.0<br />
241 DB Anton Limited St. Helier 100.0<br />
242 DB Aotearoa Investments Limited George Town 100.0<br />
243 DB Athena S.à r.l. Luxembourg 100.0<br />
244 DB Bedford Investments Limited Wilmington 100.0<br />
245 DB Beteiligungs-Holding GmbH Frankfurt 100.0<br />
246 DB Bluebell Investments (Cayman) Partnership George Town 100.0<br />
247 DB Broker GmbH Frankfurt 100.0<br />
248 DB Canada GIPF - I Corp. Calgary 100.0<br />
249 DB Capital Advisers, Inc. Wilmington 100.0<br />
250 DB Capital Management, Inc. Wilmington 100.0<br />
251 DB Capital Markets (Deutschland) GmbH Frankfurt 100.0<br />
252 DB Capital Partners (Asia), L.P. George Town 99.7<br />
253 DB Capital Partners (Europe) 2000 - A Founder Partner LP Wilmington 80.0<br />
254 DB Capital Partners (Europe) 2000 - B Founder Partner LP Wilmington 80.0<br />
255 DB Capital Partners Asia GP, Limited George Town 100.0<br />
256 DB Capital Partners Europe 2002 Founder Partner LP Wilmington 80.0<br />
257 DB Capital Partners General Partner Limited London 100.0<br />
258 DB Capital Partners Latin America, G.P. Limited George Town 100.0<br />
259 DB Capital Partners, Inc. Wilmington 100.0<br />
260 DB Capital Partners, Latin America, LP George Town 80.2<br />
261 DB Capital, Inc. Wilmington 100.0<br />
262 DB Cartera de Inmuebles 1, S.A.U. Pozuelo de Alarcón 100.0<br />
263 DB Cartera de Inmuebles 2, S.A.U. Pozuelo de Alarcón 100.0<br />
264 DB Chambers LLC Wilmington 100.0<br />
265 DB Chestnut Holdings Limited George Town 100.0<br />
266 DB Commodities Canada Ltd. Toronto 100.0<br />
267 DB Commodity Services LLC Wilmington 100.0<br />
268 DB Concerto (LP) Limited George Town 100.0<br />
269 DB Concerto Limited George Town 100.0<br />
270 DB Consortium S. Cons. a r.l. in liquidazione Milan 100.0<br />
271 DB Consorzio S. Cons. a r. l. Milan 100.0<br />
272 DB Crest Limited St. Helier 100.0<br />
273 DB Delaware Holdings (Europe) Limited Wilmington 100.0<br />
274 DB Delaware Holdings (UK) Limited London 100.0<br />
275 DB Depositor Inc. Wilmington 100.0<br />
276 DB Elara LLC Wilmington 100.0<br />
277 DB Emerald Limited Dublin 100.0<br />
278 DB Energy Commodities Limited London 100.0<br />
279 DB Energy Trading LLC Wilmington 100.0<br />
280 DB Enfield Infrastructure Holdings Limited St. Helier 100.0
<strong>Deutsche</strong> <strong>Bank</strong><br />
02 – Consolidated Financial Statements<br />
332<br />
<strong>Deutsche</strong> <strong>Bank</strong> 02 – Consolidated Financial Statements 332<br />
Financial <strong>Report</strong> 2010<br />
Additional Notes<br />
Financial <strong>Report</strong> 2010 Additional Notes<br />
42 – Shareholdings<br />
42 – Shareholdings<br />
Consolidated Subsidiaries<br />
Consolidated Subsidiaries<br />
Serial<br />
Share of<br />
capital<br />
No. Name of company Domicile of company Footnote in %<br />
281 DB Enfield Infrastructure Investments Limited St. Helier 100.0<br />
282 DB Enterprise GmbH Soessen-Gostau 100.0<br />
283 DB Enterprise GmbH & Co. Zweite Beteiligungs KG Soessen-Gostau 100.0<br />
284 DB Equipment Leasing, Inc. New York 100.0<br />
285 DB Equity Limited London 100.0<br />
286 DB Equity S.à r.l. Luxembourg 100.0<br />
287 DB ESC Corporation Wilmington 100.0<br />
288 DB Export-Leasing GmbH Frankfurt 100.0<br />
289 DB Fillmore Lender Corp. Wilmington 100.0<br />
290 DB Finance (Delaware), LLC Wilmington 100.0<br />
291 DB Finance Holdings, Inc. Wilmington 100.0<br />
292 DB Finance International GmbH Eschborn 100.0<br />
293 DB Finanz-Holding GmbH Frankfurt 100.0<br />
294 DB Franklin Investments Inc. Wilmington 100.0<br />
295 DB Funding Corporation # 1 Wilmington 100.0<br />
296 DB Funding Corporation # 3 Wilmington 100.0<br />
297 DB Funding LLC #4 Wilmington 100.0<br />
298 DB Funding LLC #5 Wilmington 100.0<br />
299 DB Funding LLC #6 Wilmington 100.0<br />
300 DB Funding, L.P. Baltimore 100.0<br />
301 DB Galil Finance, Inc. Wilmington 100.0<br />
302 DB Gamla (Cayman) George Town 100.0<br />
303 DB Ganymede 2006 L.P. George Town 100.0<br />
304 DB Global Alternative Agribusiness Master Portfolio Ltd. George Town 100.0<br />
305 DB Global Markets Multi-Strategy Fund I Limited George Town 100.0<br />
306 DB Global Processing Services, Inc. Wilmington 100.0<br />
307 DB Global Technology, Inc. Wilmington 100.0<br />
308 DB Green Holdings Corp. Wilmington 100.0<br />
309 DB Green, Inc. New York 100.0<br />
310 DB Group Services (UK) Limited London 100.0<br />
311 DB Hawks Nest, Inc. Wilmington 100.0<br />
312 DB Hedgeworks Fund Services Limited George Town 100.0<br />
313 DB HedgeWorks, LLC Wilmington 100.0<br />
314 DB Holdings (New York), Inc. New York 100.0<br />
315 DB Holdings (South America) Limited Wilmington 100.0<br />
316 db home lending holdings llc Wilmington 100.0<br />
317 db home lending llc Lake Forest 100.0<br />
318 DB Horizon, Inc. Wilmington 100.0<br />
319 DB HR Solutions GmbH Eschborn 100.0<br />
320 DB Hubert Investments Limited Wilmington 100.0<br />
321 DB Hypernova LLC Wilmington 100.0<br />
322 DB iCON Investments Limited London 100.0<br />
323 DB Industrial Holdings Beteiligungs GmbH & Co. KG Soessen-Gostau 100.0<br />
324 DB Industrial Holdings GmbH Soessen-Gostau 100.0<br />
325 DB Infrastructure Holdings (UK) No.1 Limited London 100.0<br />
326 DB Infrastructure Holdings (UK) No.2 Limited London 100.0<br />
327 DB Infrastructure Holdings (UK) No.3 Limited London 100.0<br />
328 DB International (Asia) Limited Singapore 100.0<br />
329 DB International Investments Limited London 100.0<br />
330 DB International Trust (Singapore) Limited Singapore 100.0<br />
331 DB Invest Fundo de Investimento Multimercado Sao Paulo 100.0<br />
332 DB Investment Management, Inc. Wilmington 100.0<br />
333 DB Investment Managers, Inc. Wilmington 100.0<br />
334 DB Investment Partners, Inc. Wilmington 100.0<br />
335 DB Investment Resources (US) Corporation Wilmington 100.0<br />
336 DB Investment Resources Holdings Corp. Wilmington 100.0
<strong>Deutsche</strong> <strong>Bank</strong><br />
02 – Consolidated Financial Statements<br />
333<br />
<strong>Deutsche</strong> <strong>Bank</strong> 02 – Consolidated Financial Statements 333<br />
Financial <strong>Report</strong> 2010<br />
Additional Notes<br />
Financial <strong>Report</strong> 2010 Additional Notes<br />
42 – Shareholdings<br />
42 – Shareholdings<br />
Consolidated Subsidiaries<br />
Consolidated Subsidiaries<br />
Serial<br />
Share of<br />
capital<br />
No. Name of company Domicile of company Footnote in %<br />
337 DB Investments (GB) Limited London 100.0<br />
338 DB Io LP Wilmington 100.0<br />
339 DB IROC Leasing Corp. New York 100.0<br />
340 DB Jasmine (Cayman) Limited George Town 100.0<br />
341 DB Jefferson Investments Limited Wilmington 100.0<br />
342 DB Kamchatka Limited George Town 100.0<br />
343 DB Keystone, LLC Wilmington 100.0<br />
344 DB King Investments Limited Wilmington 100.0<br />
345 DB Kredit Service GmbH Berlin 100.0<br />
346 DB Lafayette Investments Limited Wilmington 100.0<br />
347 DB Laight Investments Limited Wilmington 100.0<br />
348 DB Leasing Services GmbH Frankfurt 100.0<br />
349 DB Legal, Risk & Capital Services GmbH Berlin 100.0<br />
350 DB Leroy Investments LLC Wilmington 100.0<br />
351 DB Lexington Investments Inc. Wilmington 100.0<br />
352 DB Liberty, Inc. Wilmington 100.0<br />
353 DB Like-Kind Exchange Services Corp. Wilmington 100.0<br />
354 DB Litigation Fee LLC Wilmington 100.0<br />
355 DB Madison, LLC Wilmington 100.0<br />
356 DB Maia LLC Wilmington 100.0<br />
357 DB Malta Commercial Services One Ltd. St. Julians 100.0<br />
358 DB Malta Commercial Services Two Ltd. St. Julians 100.0<br />
359 DB Malta Holdings Ltd. St. Julians 100.0<br />
360 DB Management Partners, L.P. Wilmington 100.0<br />
361 DB Management Support GmbH Frankfurt 100.0<br />
362 DB Managers, LLC West Trenton 100.0<br />
363 DB Marcassin (Cayman) Holdings Limited George Town 100.0<br />
364 DB Master Fundo de Investimento em Direitos Creditórios Não-Padronizados de Precatórios<br />
Federais<br />
Rio de Janeiro 100.0<br />
365 DB Mezzanine Fund Managing Member, LLC New York 100.0<br />
366 DB Moore Investments Limited Wilmington 100.0<br />
367 DB Mortgage Investment Inc. Baltimore 100.0<br />
368 DB Mortgage Services, LLC Wilmington 100.0<br />
369 DB Nexus Iberian Investments (UK) Limited London 100.0<br />
370 DB Nexus Investments (UK) Limited London 100.0<br />
371 DB Nominees (Hong Kong) Limited Hong Kong 100.0<br />
372 DB Nominees (Singapore) Pte Ltd Singapore 100.0<br />
373 DB Operaciones y Servicios Interactivos, A.I.E. Barcelona 99.9<br />
374 DB Overseas Finance Delaware, Inc. Wilmington 100.0<br />
375 DB Overseas Holdings Limited London 100.0<br />
376 DB Paris Investissements Paris 100.0<br />
377 DB Partnership Management II, LLC Wilmington 100.0<br />
378 DB Partnership Management Ltd. Wilmington 100.0<br />
379 DB Perry Investments Limited Wilmington 100.0<br />
380 DB Platinum Advisors Luxembourg 100.0<br />
381 DB Portfolio Southwest, Inc. Houston 100.0<br />
382 DB Print GmbH Frankfurt 100.0<br />
383 DB Private Clients Corp. Wilmington 100.0<br />
384 DB Private Equity GmbH Cologne 100.0<br />
385 DB Private Wealth Mortgage Ltd. New York 100.0<br />
386 DB PWM Collective Management Limited Liverpool 100.0<br />
387 DB Pyrus (Cayman) Limited George Town 100.0<br />
388 DB Rail Trading (UK) Limited London 100.0<br />
389 DB RE Global Real Estate Management 1A, Ltd. George Town 100.0<br />
390 DB RE Global Real Estate Management 1B, Ltd. George Town 100.0<br />
391 DB Re S.A. Luxembourg 100.0
<strong>Deutsche</strong> <strong>Bank</strong><br />
02 – Consolidated Financial Statements<br />
334<br />
<strong>Deutsche</strong> <strong>Bank</strong> 02 – Consolidated Financial Statements 334<br />
Financial <strong>Report</strong> 2010<br />
Additional Notes<br />
Financial <strong>Report</strong> 2010 Additional Notes<br />
42 – Shareholdings<br />
42 – Shareholdings<br />
Consolidated Subsidiaries<br />
Consolidated Subsidiaries<br />
Serial<br />
Share of<br />
capital<br />
No. Name of company Domicile of company Footnote in %<br />
392 DB Real Estate Canadainvest 1 Inc. Toronto 100.0<br />
393 DB Real Estate Opportunities Group Advisors (UK) Limited London 100.0<br />
394 DB Realty Resources, Inc. New York 5 0.0<br />
395 DB Renewable Holdings B.V. Amsterdam 100.0<br />
396 DB Rivington Investments Limited George Town 100.0<br />
397 DB RMS Leasing (Cayman) L.P. George Town 100.0<br />
398 DB Road (UK) Limited George Town 100.0<br />
399 DB Rugby Finance (Cayman) George Town 100.0<br />
400 DB Samay Finance No. 2, Inc. Wilmington 100.0<br />
401 DB Saturn Investments Limited London 100.0<br />
402 DB Second Funding Corp. Wilmington 100.0<br />
403 DB Securities S.A. Warsaw 100.0<br />
404 DB Securities Services NJ Inc. New York 100.0<br />
405 DB Sedanka Limited George Town 100.0<br />
406 DB Service Centre Limited Dublin 100.0<br />
407 DB Service Uruguay S.A. Montevideo 100.0<br />
408 DB Services Americas, Inc. Wilmington 100.0<br />
409 DB Services New Jersey, Inc. West Trenton 100.0<br />
410 DB Servicios México, S.A. de C.V. Mexico City 100.0<br />
411 DB Servizi Amministrativi S.r.l. Milan 100.0<br />
412 DB Shenandoah LLC Wilmington 100.0<br />
413 DB Sirius (Cayman) Limited George Town 100.0<br />
414 DB Stanton Investments LLC Wilmington 100.0<br />
415 DB Sterling Finance Limited George Town 100.0<br />
416 DB Strategic Advisors, Inc. Makati City 100.0<br />
417 DB Structured Derivative Products, LLC Wilmington 100.0<br />
418 DB Structured Products, Inc. Wilmington 100.0<br />
419 DB Structured Transaction VH-OJL Pty Limited Sydney 100.0<br />
420 DB Trips Investments Limited George Town 5 0.0<br />
421 DB Trust Company Limited Japan Tokyo 100.0<br />
422 DB Trustee Services Limited London 100.0<br />
423 DB Trustees (Hong Kong) Limited Hong Kong 100.0<br />
424 DB Tweed Limited George Town 100.0<br />
425 DB U.K. Nominees Limited London 100.0<br />
426 DB U.S. Financial Markets Holding Corporation Wilmington 100.0<br />
427 DB UK (Saturn) Limited London 100.0<br />
428 DB UK Australia Finance Limited George Town 100.0<br />
429 DB UK Australia Holdings Limited London 100.0<br />
430 DB UK <strong>Bank</strong> Limited London 100.0<br />
431 DB UK Holdings Limited London 100.0<br />
432 DB UK PCAM Holdings Limited London 100.0<br />
433 DB Valiant (Cayman) Limited George Town 100.0<br />
434 DB Valoren S.à r.l. Luxembourg 100.0<br />
435 DB Vandam Investments Limited Wilmington 100.0<br />
436 DB Vanquish (UK) Limited London 100.0<br />
437 DB Vantage (UK) Limited London 100.0<br />
438 DB Vantage No.2 (UK) Limited London 100.0<br />
439 DB Vantage No.3 (UK) Limited London 100.0<br />
440 DB Venture Partners (Europe) 2000 Founder Partner LP Wilmington 80.0<br />
441 DB Venture Partners (Europe) 2001 Founder Partner LP Wilmington 80.0<br />
442 DB Venture Partners General Partner Limited London 100.0<br />
443 DB Vestry Investments Limited Wilmington 100.0<br />
444 DB Vita S.A. Luxembourg 75.0<br />
445 DB Warren Investments Limited George Town 100.0<br />
446 DB Waverly Investments Limited Wilmington 100.0<br />
447 DB West Financing LLC Wilmington 100.0
<strong>Deutsche</strong> <strong>Bank</strong><br />
02 – Consolidated Financial Statements<br />
335<br />
<strong>Deutsche</strong> <strong>Bank</strong> 02 – Consolidated Financial Statements 335<br />
Financial <strong>Report</strong> 2010<br />
Additional Notes<br />
Financial <strong>Report</strong> 2010 Additional Notes<br />
42 – Shareholdings<br />
42 – Shareholdings<br />
Consolidated Subsidiaries<br />
Consolidated Subsidiaries<br />
Serial<br />
Share of<br />
capital<br />
No. Name of company Domicile of company Footnote in %<br />
448 DB Willow (UK) Limited (in member's voluntary liquidation) London 100.0<br />
449 DB Wilton Holdings, LLC Wilmington 5 0.0<br />
450 DBAB Wall Street, LLC Wilmington 100.0<br />
451 DBAH Capital, LLC Wilmington 100.0<br />
452 DBAH Funding Corp. Wilmington 100.0<br />
453 DBAS Cayman Holdings 1 Limited George Town 100.0<br />
454 DBAS Cayman Holdings 2 Limited George Town 100.0<br />
455 DBC Continuance Inc. Toronto 100.0<br />
456 DBCCA Investment Partners, Inc. Wilmington 100.0<br />
457 DBCIBZ1 George Town 100.0<br />
458 DBCIBZ2 George Town 100.0<br />
459 DBD Mezzanine Corp. Wilmington 100.0<br />
460 DBD Pilgrim America Corp. Wilmington 100.0<br />
461 DBFIC, Inc. Wilmington 100.0<br />
462 DBG Vermögensverwaltungsgesellschaft mbH Frankfurt 100.0<br />
463 DBIGB Finance (No. 2) Limited London 100.0<br />
464 DBNY Brazil Invest Co. Wilmington 100.0<br />
465 DBNZ Overseas Investments (No.1) Limited George Town 100.0<br />
466 DBOI Global Services (UK) Limited London 100.0<br />
467 DBOI Global Services Private Limited Mumbai 100.0<br />
468 DBP Commercial Mortgage LLC Wilmington 100.0<br />
469 DBRMS4 George Town 100.0<br />
470 DBRMSGP1 George Town 100.0<br />
471 DBRMSGP2 George Town 100.0<br />
472 DBS Technology Ventures, L.L.C. Wilmington 100.0<br />
473 DBUKH Finance Limited London 100.0<br />
474 DBUSBZ1, LLC Wilmington 100.0<br />
475 DBUSBZ2, LLC Wilmington 100.0<br />
476 DBUSH Funding Corp. Wilmington 100.0<br />
477 DBUSH Markets, Inc. Wilmington 100.0<br />
478 DBVR Investments No. 3 Ltd. Wilmington 100.0<br />
479 DBX Advisors LLC Wilmington 100.0<br />
480 DBX Strategic Advisors LLC Wilmington 100.0<br />
481 De Meng Innovative (Beijing) Consulting Company Limited Beijing 100.0<br />
482 DeAM Infrastructure Limited London 100.0<br />
483 DeAM Investor Services, Inc. Boston 100.0<br />
484 DEBEKO Immobilien GmbH & Co Grundbesitz OHG Eschborn 100.0<br />
485 DEE <strong>Deutsche</strong> Erneuerbare Energien GmbH Duesseldorf 100.0<br />
486 Deer River, L.P. Wilmington 100.0<br />
487 DEGRU Erste Beteiligungsgesellschaft mbH Eschborn 100.0<br />
488 DeKon Service GmbH Eschborn 100.0<br />
489 Delowrezham de México S. de R.L. de C.V. Mexico City 100.0<br />
490 DEMOS Beteiligungs- und Verwaltungs GmbH Cologne 100.0<br />
491 DEUFRAN Beteiligungs GmbH Frankfurt 100.0<br />
492 DEUKONA Versicherungs-Vermittlungs-GmbH Frankfurt 100.0<br />
493 <strong>Deutsche</strong> (Aotearoa) Capital Holdings New Zealand Auckland 100.0<br />
494 <strong>Deutsche</strong> (Aotearoa) Foreign Investments New Zealand Auckland 100.0<br />
495 <strong>Deutsche</strong> (New Munster) Holdings New Zealand Limited Auckland 100.0<br />
496 <strong>Deutsche</strong> (SRV) Investment Corporation Wilmington 100.0<br />
497 <strong>Deutsche</strong> Aeolia Power Production S.A. Athens 80.0<br />
498 <strong>Deutsche</strong> Alt-A Securities, Inc. Wilmington 100.0<br />
499 <strong>Deutsche</strong> Alternative Asset Management (Global) Limited London 100.0<br />
500 <strong>Deutsche</strong> Alternative Asset Management (UK) Limited London 100.0<br />
501 <strong>Deutsche</strong> Asia Pacific Finance, Inc. Wilmington 100.0<br />
502 <strong>Deutsche</strong> Asia Pacific Holdings Pte Ltd Singapore 100.0<br />
503 <strong>Deutsche</strong> Asset Management (Asia) Limited Singapore 100.0
<strong>Deutsche</strong> <strong>Bank</strong><br />
02 – Consolidated Financial Statements<br />
336<br />
<strong>Deutsche</strong> <strong>Bank</strong> 02 – Consolidated Financial Statements 336<br />
Financial <strong>Report</strong> 2010<br />
Additional Notes<br />
Financial <strong>Report</strong> 2010 Additional Notes<br />
42 – Shareholdings<br />
42 – Shareholdings<br />
Consolidated Subsidiaries<br />
Consolidated Subsidiaries<br />
Serial<br />
Share of<br />
capital<br />
No. Name of company Domicile of company Footnote in %<br />
504 <strong>Deutsche</strong> Asset Management (Australia) Limited Sydney 100.0<br />
505 <strong>Deutsche</strong> Asset Management (Hong Kong) Limited Hong Kong 100.0<br />
506 <strong>Deutsche</strong> Asset Management (India) Private Limited Mumbai 100.0<br />
507 <strong>Deutsche</strong> Asset Management (Japan) Limited Tokyo 100.0<br />
508 <strong>Deutsche</strong> Asset Management (Jersey) Limited St. Helier 100.0<br />
509 <strong>Deutsche</strong> Asset Management (Korea) Company Limited Seoul 100.0<br />
510 <strong>Deutsche</strong> Asset Management (UK) Limited London 100.0<br />
511 <strong>Deutsche</strong> Asset Management Canada Limited Toronto 100.0<br />
512 <strong>Deutsche</strong> Asset Management Group Limited London 100.0<br />
513 <strong>Deutsche</strong> Asset Management International GmbH Frankfurt 100.0<br />
514 <strong>Deutsche</strong> Asset Management Investmentgesellschaft mbH vormals DEGEF <strong>Deutsche</strong><br />
Gesellschaft für Fondsverwaltung mbH<br />
Frankfurt 100.0<br />
515 <strong>Deutsche</strong> Asset Management Schweiz Zurich 100.0<br />
516 <strong>Deutsche</strong> Auskunftei Service GmbH Hamburg 100.0<br />
517 <strong>Deutsche</strong> Australia Limited Sydney 100.0<br />
518 <strong>Deutsche</strong> Aviation Leasing Limited London 100.0<br />
519 <strong>Deutsche</strong> <strong>Bank</strong> (Cayman) Limited George Town 100.0<br />
520 DEUTSCHE BANK (CHILE) S.A. Santiago 100.0<br />
521 <strong>Deutsche</strong> <strong>Bank</strong> (China) Co., Ltd. Beijing 100.0<br />
522 <strong>Deutsche</strong> <strong>Bank</strong> (Malaysia) Berhad Kuala Lumpur 100.0<br />
523 <strong>Deutsche</strong> <strong>Bank</strong> (Malta) Ltd St. Julians 100.0<br />
524 <strong>Deutsche</strong> <strong>Bank</strong> (Mauritius) Limited Port Louis 100.0<br />
525 <strong>Deutsche</strong> <strong>Bank</strong> (Perú) S.A. Lima 100.0<br />
526 <strong>Deutsche</strong> <strong>Bank</strong> (Portugal), S.A. Lisbon 100.0<br />
527 <strong>Deutsche</strong> <strong>Bank</strong> (Suisse) SA Geneva 100.0<br />
528 <strong>Deutsche</strong> <strong>Bank</strong> (Uruguay) Sociedad Anónima Institución Financiera Externa Montevideo 100.0<br />
529 DEUTSCHE BANK A.S. Istanbul 100.0<br />
530 <strong>Deutsche</strong> <strong>Bank</strong> Americas Finance LLC Wilmington 100.0<br />
531 <strong>Deutsche</strong> <strong>Bank</strong> Americas Holding Corp. Wilmington 100.0<br />
532 <strong>Deutsche</strong> <strong>Bank</strong> Bauspar-Aktiengesellschaft Frankfurt 100.0<br />
533 <strong>Deutsche</strong> <strong>Bank</strong> Berkshire Mortgage, Inc. Wilmington 100.0<br />
534 <strong>Deutsche</strong> <strong>Bank</strong> Capital Holdings, Inc. Wilmington 100.0<br />
535 <strong>Deutsche</strong> <strong>Bank</strong> Capital Markets S.r.l. Milan 100.0<br />
536 <strong>Deutsche</strong> <strong>Bank</strong> Corretora de Valores S.A. Sao Paulo 100.0<br />
537 <strong>Deutsche</strong> <strong>Bank</strong> Europe GmbH Frankfurt 100.0<br />
538 <strong>Deutsche</strong> <strong>Bank</strong> Financial Inc. Wilmington 100.0<br />
539 <strong>Deutsche</strong> <strong>Bank</strong> Financial LLC Wilmington 100.0<br />
540 <strong>Deutsche</strong> <strong>Bank</strong> Holdings, Inc. Wilmington 100.0<br />
541 <strong>Deutsche</strong> <strong>Bank</strong> Insurance Agency Incorporated Baltimore 100.0<br />
542 <strong>Deutsche</strong> <strong>Bank</strong> Insurance Agency of Delaware Wilmington 100.0<br />
543 <strong>Deutsche</strong> <strong>Bank</strong> Insurance Agency of Massachusetts Incorporated Boston 100.0<br />
544 <strong>Deutsche</strong> <strong>Bank</strong> International Limited St. Helier 100.0<br />
545 <strong>Deutsche</strong> <strong>Bank</strong> International Trust Co. (Cayman) Limited George Town 100.0<br />
546 <strong>Deutsche</strong> <strong>Bank</strong> International Trust Co. (Jersey) Limited St. Helier 100.0<br />
547 <strong>Deutsche</strong> <strong>Bank</strong> International Trust Co. Limited St. Peter Port 100.0<br />
548 <strong>Deutsche</strong> <strong>Bank</strong> Investments (Guernsey) Limited St. Peter Port 100.0<br />
549 <strong>Deutsche</strong> <strong>Bank</strong> Luxembourg S.A. Luxembourg 100.0<br />
550 <strong>Deutsche</strong> <strong>Bank</strong> Mutui S.p.A. Milan 100.0<br />
551 <strong>Deutsche</strong> <strong>Bank</strong> México S.A. Institución de Banca Múltiple Mexico City 100.0<br />
552 <strong>Deutsche</strong> <strong>Bank</strong> National Trust Company Los Angeles 100.0<br />
553 <strong>Deutsche</strong> <strong>Bank</strong> Nederland N.V. Amsterdam 100.0<br />
554 <strong>Deutsche</strong> <strong>Bank</strong> Nominees (Jersey) Limited St. Helier 100.0<br />
555 <strong>Deutsche</strong> <strong>Bank</strong> PBC Spólka Akcyjna Warsaw 100.0<br />
556 <strong>Deutsche</strong> <strong>Bank</strong> Polska Spólka Akcyjna Warsaw 100.0<br />
557 <strong>Deutsche</strong> <strong>Bank</strong> Privat- und Geschäftskunden Aktiengesellschaft Frankfurt 100.0<br />
558 <strong>Deutsche</strong> <strong>Bank</strong> Real Estate (Japan) Y.K. Tokyo 100.0
<strong>Deutsche</strong> <strong>Bank</strong><br />
02 – Consolidated Financial Statements<br />
337<br />
<strong>Deutsche</strong> <strong>Bank</strong> 02 – Consolidated Financial Statements 337<br />
Financial <strong>Report</strong> 2010<br />
Additional Notes<br />
Financial <strong>Report</strong> 2010 Additional Notes<br />
42 – Shareholdings<br />
42 – Shareholdings<br />
Consolidated Subsidiaries<br />
Consolidated Subsidiaries<br />
Serial<br />
Share of<br />
capital<br />
No. Name of company Domicile of company Footnote in %<br />
559 <strong>Deutsche</strong> <strong>Bank</strong> Realty Advisors, Inc. New York 100.0<br />
560 <strong>Deutsche</strong> <strong>Bank</strong> S.A. Buenos Aires 100.0<br />
561 <strong>Deutsche</strong> <strong>Bank</strong> S.A. - Banco Alemão Sao Paulo 100.0<br />
562 <strong>Deutsche</strong> <strong>Bank</strong> S.A. / N.V. Brussels 100.0<br />
563 <strong>Deutsche</strong> <strong>Bank</strong> Securities Inc. Wilmington 100.0<br />
564 <strong>Deutsche</strong> <strong>Bank</strong> Securities Limited Toronto 100.0<br />
565 <strong>Deutsche</strong> <strong>Bank</strong> Services (Jersey) Limited St. Helier 100.0<br />
566 <strong>Deutsche</strong> <strong>Bank</strong> Società per Azioni Milan 99.8<br />
567 <strong>Deutsche</strong> <strong>Bank</strong> Trust Company Americas New York 100.0<br />
568 <strong>Deutsche</strong> <strong>Bank</strong> Trust Company Delaware Wilmington 100.0<br />
569 <strong>Deutsche</strong> <strong>Bank</strong> Trust Company New Jersey Ltd. Jersey City 100.0<br />
570 <strong>Deutsche</strong> <strong>Bank</strong> Trust Company, National Association New York 100.0<br />
571 <strong>Deutsche</strong> <strong>Bank</strong> Trust Corporation New York 100.0<br />
572 <strong>Deutsche</strong> <strong>Bank</strong> Trustee Services (Guernsey) Limited St. Peter Port 100.0<br />
573 <strong>Deutsche</strong> <strong>Bank</strong> Zártkörüen Müködö Részvénytársaság Budapest 100.0<br />
574 <strong>Deutsche</strong> <strong>Bank</strong> Österreich AG Vienna 100.0<br />
575 <strong>Deutsche</strong> <strong>Bank</strong>, Sociedad Anónima Española Madrid 99.7<br />
576 <strong>Deutsche</strong> Berri Paris 100.0<br />
577 <strong>Deutsche</strong> Capital Finance (2000) Limited George Town 100.0<br />
578 <strong>Deutsche</strong> Capital Financing (Singapore) Pte Ltd Singapore 100.0<br />
579 <strong>Deutsche</strong> Capital Hong Kong Limited Hong Kong 100.0<br />
580 <strong>Deutsche</strong> Capital Markets Algeria SPA Algiers 100.0<br />
581 <strong>Deutsche</strong> Capital Markets Australia Limited Sydney 100.0<br />
582 <strong>Deutsche</strong> Capital Singapore Limited Singapore 100.0<br />
583 <strong>Deutsche</strong> Card Services GmbH Frankfurt 100.0<br />
584 <strong>Deutsche</strong> Cayman Ltd. George Town 100.0<br />
585 <strong>Deutsche</strong> Climate Change Fixed Income QP Trust Salem 100.0<br />
586 <strong>Deutsche</strong> Clubholding GmbH Frankfurt 95.0<br />
587 <strong>Deutsche</strong> Colombia S.A. Bogota 100.0<br />
588 <strong>Deutsche</strong> Commodities Trading Co., Ltd. Shanghai 100.0<br />
589 <strong>Deutsche</strong> Courcelles Paris 100.0<br />
590 <strong>Deutsche</strong> Custody Global B.V. Amsterdam 100.0<br />
591 <strong>Deutsche</strong> Custody N.V. Amsterdam 100.0<br />
592 <strong>Deutsche</strong> Custody Nederland B.V. Amsterdam 100.0<br />
593 <strong>Deutsche</strong> Domus New Zealand Limited Auckland 100.0<br />
594 <strong>Deutsche</strong> Emerging Markets Investments (Netherlands) B.V. Amsterdam 99.9<br />
595 <strong>Deutsche</strong> Equities India Private Limited Mumbai 100.0<br />
596 <strong>Deutsche</strong> Equity Funds Holdings Limited London 100.0<br />
597 <strong>Deutsche</strong> Family Office GmbH Frankfurt 100.0<br />
598 <strong>Deutsche</strong> Far Eastern Asset Management Company Limited Taipei 60.0<br />
599 <strong>Deutsche</strong> Fiduciary Services (Suisse) SA Geneva 100.0<br />
600 <strong>Deutsche</strong> Finance Co 1 Pty Limited Sydney 100.0<br />
601 <strong>Deutsche</strong> Finance Co 2 Pty Limited Sydney 100.0<br />
602 <strong>Deutsche</strong> Finance Co 3 Pty Limited Sydney 100.0<br />
603 <strong>Deutsche</strong> Finance Co 4 Pty Limited Sydney 100.0<br />
604 <strong>Deutsche</strong> Finance No. 1 Limited London 100.0<br />
605 <strong>Deutsche</strong> Finance No. 2 (UK) Limited London 100.0<br />
606 <strong>Deutsche</strong> Finance No. 2 Limited George Town 100.0<br />
607 <strong>Deutsche</strong> Finance No. 3 (UK) Limited London 100.0<br />
608 <strong>Deutsche</strong> Finance No. 4 (UK) Limited London 100.0<br />
609 <strong>Deutsche</strong> Finance No. 6 (UK) Limited London 100.0<br />
610 <strong>Deutsche</strong> Financial Services Puerto Rico Corporation San Juan 100.0<br />
611 <strong>Deutsche</strong> Foras New Zealand Limited Auckland 100.0<br />
612 <strong>Deutsche</strong> Friedland Paris 100.0<br />
613 <strong>Deutsche</strong> Futures Singapore Pte Ltd Singapore 100.0<br />
614 <strong>Deutsche</strong> Global Markets Limited Tel Aviv 100.0
<strong>Deutsche</strong> <strong>Bank</strong><br />
02 – Consolidated Financial Statements<br />
338<br />
<strong>Deutsche</strong> <strong>Bank</strong> 02 – Consolidated Financial Statements 338<br />
Financial <strong>Report</strong> 2010<br />
Additional Notes<br />
Financial <strong>Report</strong> 2010 Additional Notes<br />
42 – Shareholdings<br />
42 – Shareholdings<br />
Consolidated Subsidiaries<br />
Consolidated Subsidiaries<br />
Serial<br />
Share of<br />
capital<br />
No. Name of company Domicile of company Footnote in %<br />
615 <strong>Deutsche</strong> Group Holdings (SA) (Proprietary) Limited Johannesburg 100.0<br />
616 <strong>Deutsche</strong> Group Services Pty Limited Sydney 100.0<br />
617 <strong>Deutsche</strong> Grundbesitz Beteiligungsgesellschaft mbH Eschborn 100.0<br />
618 <strong>Deutsche</strong> Grundbesitz-Anlagegesellschaft mbH & Co Löwenstein Palais Eschborn 100.0<br />
619 <strong>Deutsche</strong> Grundbesitz-Anlagegesellschaft mit beschränkter Haftung Eschborn 99.8<br />
620 <strong>Deutsche</strong> Haussmann, S.à r.l. Luxembourg 100.0<br />
621 <strong>Deutsche</strong> Holdings (BTI) Limited London 100.0<br />
622 <strong>Deutsche</strong> Holdings (Chile) S.A. Santiago 100.0<br />
623 <strong>Deutsche</strong> Holdings (Malta) Ltd. St. Julians 100.0<br />
624 <strong>Deutsche</strong> Holdings (SA) (Proprietary) Limited Johannesburg 100.0<br />
625 <strong>Deutsche</strong> Holdings Limited London 100.0<br />
626 <strong>Deutsche</strong> Holdings No. 2 Limited London 100.0<br />
627 <strong>Deutsche</strong> Holdings No. 3 Limited London 100.0<br />
628 <strong>Deutsche</strong> Holdings No. 4 Limited London 100.0<br />
629 <strong>Deutsche</strong> Hume Investments Pty Limited Sydney 100.0<br />
630 <strong>Deutsche</strong> Immobilien Leasing GmbH Duesseldorf 100.0<br />
631 <strong>Deutsche</strong> India Holdings Private Limited Mumbai 100.0<br />
632 <strong>Deutsche</strong> International Corporate Services (Delaware) LLC Wilmington 100.0<br />
633 <strong>Deutsche</strong> International Corporate Services (Ireland) Limited Dublin 100.0<br />
634 <strong>Deutsche</strong> International Corporate Services Limited St. Helier 100.0<br />
635 <strong>Deutsche</strong> International Custodial Services Limited St. Helier 100.0<br />
636 <strong>Deutsche</strong> International Finance (Ireland) Limited Dublin 100.0<br />
637 <strong>Deutsche</strong> International Holdings (UK) Limited London 100.0<br />
638 <strong>Deutsche</strong> International Trust Company N.V. Amsterdam 100.0<br />
639 <strong>Deutsche</strong> International Trust Corporation (Mauritius) Limited Port Louis 100.0<br />
640 <strong>Deutsche</strong> Inversiones Dos S.A. Santiago 100.0<br />
641 <strong>Deutsche</strong> Inversiones Limitada Santiago 100.0<br />
642 <strong>Deutsche</strong> Investment Management Americas Inc. Wilmington 100.0<br />
643 <strong>Deutsche</strong> Investments (Holland) B.V. Amsterdam 100.0<br />
644 <strong>Deutsche</strong> Investments (Netherlands) N.V. Amsterdam 100.0<br />
645 <strong>Deutsche</strong> Investments Australia Limited Sydney 100.0<br />
646 <strong>Deutsche</strong> Investments India Private Limited Mumbai 100.0<br />
647 <strong>Deutsche</strong> Investor Services Private Limited Mumbai 100.0<br />
648 <strong>Deutsche</strong> IT License GmbH Eschborn 100.0<br />
649 <strong>Deutsche</strong> Knowledge Services Pte. Ltd. Singapore 100.0<br />
650 <strong>Deutsche</strong> Leasing New York Corp. New York 100.0<br />
651 <strong>Deutsche</strong> Long Duration Government/Credit QP Trust Salem 100.0<br />
652 <strong>Deutsche</strong> Managed Investments Limited Sydney 100.0<br />
653 <strong>Deutsche</strong> Master Funding Corporation Wilmington 100.0<br />
654 <strong>Deutsche</strong> Morgan Grenfell Group Public Limited Company London 100.0<br />
655 <strong>Deutsche</strong> Morgan Grenfell Nominees Pte Ltd Singapore 100.0<br />
656 <strong>Deutsche</strong> Mortgage & Asset Receiving Corporation Wilmington 100.0<br />
657 <strong>Deutsche</strong> Mortgage Securities, Inc. Wilmington 100.0<br />
658 <strong>Deutsche</strong> New Zealand Limited Auckland 100.0<br />
659 <strong>Deutsche</strong> Nominees Limited London 100.0<br />
660 <strong>Deutsche</strong> Overseas Issuance New Zealand Limited Auckland 100.0<br />
661 <strong>Deutsche</strong> PM Nominees Pty Limited Sydney 100.0<br />
662 <strong>Deutsche</strong> Postbank AG Bonn 52.0<br />
663 <strong>Deutsche</strong> Postbank Finance Center Objekt GmbH Munsbach 100.0<br />
664 <strong>Deutsche</strong> Postbank Financial Services GmbH Frankfurt 100.0<br />
665 <strong>Deutsche</strong> Postbank Home Finance Limited New Delhi 100.0<br />
666 <strong>Deutsche</strong> Postbank International S.A. Munsbach 100.0<br />
667 <strong>Deutsche</strong> Postbank Vermögens-Management S.A. Munsbach 100.0<br />
668 <strong>Deutsche</strong> Private Asset Management Limited London 100.0<br />
669 <strong>Deutsche</strong> Representaciones y Mandatos S.A. Buenos Aires 100.0<br />
670 <strong>Deutsche</strong> Securities (India) Private Limited New Delhi 75.0
<strong>Deutsche</strong> <strong>Bank</strong><br />
02 – Consolidated Financial Statements<br />
339<br />
<strong>Deutsche</strong> <strong>Bank</strong> 02 – Consolidated Financial Statements 339<br />
Financial <strong>Report</strong> 2010<br />
Additional Notes<br />
Financial <strong>Report</strong> 2010 Additional Notes<br />
42 – Shareholdings<br />
42 – Shareholdings<br />
Consolidated Subsidiaries<br />
Consolidated Subsidiaries<br />
Serial<br />
Share of<br />
capital<br />
No. Name of company Domicile of company Footnote in %<br />
671 <strong>Deutsche</strong> Securities (Perú) S.A. Lima 100.0<br />
672 <strong>Deutsche</strong> Securities (Proprietary) Limited Johannesburg 75.0<br />
673 <strong>Deutsche</strong> Securities (SA) (Proprietary) Limited Johannesburg 75.0<br />
674 <strong>Deutsche</strong> Securities Algeria SPA Algiers 100.0<br />
675 <strong>Deutsche</strong> Securities Asia Limited Hong Kong 100.0<br />
676 <strong>Deutsche</strong> Securities Australia Limited Sydney 100.0<br />
677 <strong>Deutsche</strong> Securities Corredores de Bolsa Ltda. Santiago 100.0<br />
678 <strong>Deutsche</strong> Securities Inc. Tokyo 100.0<br />
679 <strong>Deutsche</strong> Securities Israel Ltd. Tel Aviv 100.0<br />
680 <strong>Deutsche</strong> Securities Korea Co. Seoul 100.0<br />
681 <strong>Deutsche</strong> Securities Limited Hong Kong 100.0<br />
682 <strong>Deutsche</strong> Securities Mauritius Limited Port Louis 100.0<br />
683 <strong>Deutsche</strong> Securities Menkul Degerler A.S. Istanbul 100.0<br />
684 <strong>Deutsche</strong> Securities New Zealand Limited Auckland 100.0<br />
685 <strong>Deutsche</strong> Securities Nominees Hong Kong Limited Hong Kong 100.0<br />
686 <strong>Deutsche</strong> Securities Saudi Arabia LLC Riyadh 100.0<br />
687 <strong>Deutsche</strong> Securities Sociedad de Bolsa S.A. Buenos Aires 100.0<br />
688 <strong>Deutsche</strong> Securities Venezuela S.A. Caracas 100.0<br />
689 <strong>Deutsche</strong> Securities, S.A. de C.V., Casa de Bolsa Mexico City 100.0<br />
690 <strong>Deutsche</strong> Securitisation Australia Pty Ltd Sydney 100.0<br />
691 <strong>Deutsche</strong> StiftungsTrust GmbH Frankfurt 100.0<br />
692 <strong>Deutsche</strong> Transaction France Paris 100.0<br />
693 <strong>Deutsche</strong> Transnational Trustee Corporation Inc Charlottetown 100.0<br />
694 <strong>Deutsche</strong> Trustee Company Limited London 100.0<br />
695 <strong>Deutsche</strong> Trustee Services (India) Private Limited Mumbai 100.0<br />
696 <strong>Deutsche</strong> Trustees Malaysia Berhad Kuala Lumpur 100.0<br />
697 <strong>Deutsche</strong> Ultra Core Fixed Income QP Trust Salem 100.0<br />
698 <strong>Deutsche</strong>s Institut für Altersvorsorge GmbH Frankfurt 78.0<br />
699 DFC Residual Corp. Reno 100.0<br />
700 DI <strong>Deutsche</strong> Immobilien Baugesellschaft mbH Eschborn 100.0<br />
701 DI <strong>Deutsche</strong> Immobilien Baugesellschaft mbH & Co. Vermietungs KG Eschborn 100.0<br />
702 DI <strong>Deutsche</strong> Immobilien Treuhandgesellschaft mbH Eschborn 100.0<br />
703 DIB-Consult <strong>Deutsche</strong> Immobilien- und Beteiligungs-Beratungsgesellschaft mbH Duesseldorf 100.0<br />
704 DIL CONTRACT Projektmanagement GmbH Duesseldorf 100.0<br />
705 DIL <strong>Deutsche</strong> Baumanagement GmbH Duesseldorf 100.0<br />
706 DIL Financial Services GmbH & Co. KG Duesseldorf 100.0<br />
707 DISCA Beteiligungsgesellschaft mbH Duesseldorf 100.0<br />
708 DIV Holding GmbH Frankfurt 100.0<br />
709 DMG Technology Management, L.L.C. Wilmington 100.0<br />
710 DMJV New York 5 0.0<br />
711 DNU Nominees Pty Limited Sydney 100.0<br />
712 DowningX LLC Wilmington 100.0<br />
713 DPB Financial Consultants Limited Gurgaon 100.0<br />
714 DPB Regent's Park Estates (GP) Holding Limited London 100.0<br />
715 DPB Regent's Park Estates (LP) Holding Limited London 100.0<br />
716 DPBI Immobilien KGaA Munsbach 100.0<br />
717 Dritte DB Immobilienfonds Beta Dr. Rühl KG Eschborn 94.2<br />
718 Drolla GmbH Frankfurt 100.0<br />
719 DRT Limited International SRL Bucharest 100.0<br />
720 DSL Holding Aktiengesellschaft Bonn 100.0<br />
721 DSL Portfolio GmbH & Co. KG Bonn 100.0<br />
722 DSL Portfolio Verwaltungs GmbH Bonn 100.0<br />
723 DTS Nominees Pty. Limited Sydney 100.0<br />
724 DVCG <strong>Deutsche</strong> Venture Capital Gesellschaft mbH & Co. Fonds II KG i.L. Munich 69.2<br />
725 DWS (Austria) Investmentgesellschaft mbH Vienna 100.0<br />
726 DWS Finanz-Service GmbH Frankfurt 100.0
<strong>Deutsche</strong> <strong>Bank</strong><br />
02 – Consolidated Financial Statements<br />
340<br />
<strong>Deutsche</strong> <strong>Bank</strong> 02 – Consolidated Financial Statements 340<br />
Financial <strong>Report</strong> 2010<br />
Additional Notes<br />
Financial <strong>Report</strong> 2010 Additional Notes<br />
42 – Shareholdings<br />
42 – Shareholdings<br />
Consolidated Subsidiaries<br />
Consolidated Subsidiaries<br />
Serial<br />
Share of<br />
capital<br />
No. Name of company Domicile of company Footnote in %<br />
727 DWS Helios Luxembourg 99.7<br />
728 DWS Holding & Service GmbH Frankfurt 100.0<br />
729 DWS Investment GmbH Frankfurt 100.0<br />
730 DWS Investment S.A. Luxembourg 100.0<br />
731 DWS Investments (Spain), S.G.I.I.C., S.A. Madrid 100.0<br />
732 DWS Investments Annuities and Life Services Inc. Wilmington 100.0<br />
733 DWS Investments Distributors, Inc. Wilmington 100.0<br />
734 DWS Investments Fund Accounting Corporation Wilmington 100.0<br />
735 DWS Investments Service Company Wilmington 100.0<br />
736 DWS Polska TFI S.A. Warsaw 100.0<br />
737 DWS Schweiz GmbH Zurich 100.0<br />
738 DWS Società di Intermediazione Mobiliare S.p.A. Milan 100.0<br />
739 DWS Trust Company Salem 100.0<br />
740 easyhyp GmbH Hameln 100.0<br />
741 EC EUROPA IMMOBILIEN FONDS NR. 3 GmbH & CO. KG Hamburg 65.2<br />
742 ECT Holdings Corp. Wilmington 100.0<br />
743 EDORA Funding GmbH Frankfurt 100.0<br />
744 Elba Finance GmbH Eschborn 100.0<br />
745 ELBI Funding GmbH Frankfurt 100.0<br />
746 ELDO ACHTE Vermögensverwaltungs GmbH Eschborn 100.0<br />
747 ELDO ERSTE Vermögensverwaltungs GmbH Eschborn 100.0<br />
748 Elizabethan Holdings Limited George Town 100.0<br />
749 Elizabethan Management Limited George Town 100.0<br />
750 Emerald GmbH Frankfurt 100.0<br />
751 Enterprise Fleet Management Exchange, Inc. Wilmington 100.0<br />
752 ERATO Beteiligungs- und Verwaltungs GmbH Cologne 100.0<br />
753 Erda Funding GmbH Eschborn 100.0<br />
754 Ero Properties, Inc. New York 100.0<br />
755 Erste DB Immobilienfonds Beta Dr. Rühl KG Eschborn 94.2<br />
756 Estate Holdings, Inc. St. Thomas 5 0.0<br />
757 EUROKNIGHTS IV GmbH & Co. Beteiligungs KG Munich 1 0.0<br />
758 European Asian <strong>Bank</strong> (Hong Kong) Nominees Limited Hong Kong 100.0<br />
759 European Private Equity Portfolio S.A., SICAR Luxembourg 1 1.1<br />
760 Evergreen International Holdings B.V. Amsterdam 100.0<br />
761 Evergreen International Investments B.V. Amsterdam 100.0<br />
762 Evergreen International Leasing B.V. Amsterdam 100.0<br />
763 Evergreen Overseas Investments B.V. Amsterdam 100.0<br />
764 Exinor SA Malmedy 100.0<br />
765 Exporterra GmbH Frankfurt 100.0<br />
766 EXTOREL Private Equity Advisers GmbH Munich 100.0<br />
767 FARAMIR Beteiligungs- und Verwaltungs GmbH Cologne 100.0<br />
768 Farezco I, S. de R.L. de C.V. Zapopan 100.0<br />
769 Farezco II, S. de R.L. de C.V. Zapopan 100.0<br />
770 Fenix Administración de Activos S. de R.L. de C.V. Mexico City 100.0<br />
771 Fiduciaria Sant' Andrea S.r.L. Milan 100.0<br />
772 Filaine, Inc. Wilmington 5 0.0<br />
773 Finanza & Futuro Banca SpA Milan 100.0<br />
774 Firstee Investments LLC Wilmington 100.0<br />
775 FJC Property Corp. Wilmington 100.0<br />
776 Fondo de Inversión Privado NPL Fund Two Santiago 4 70.0<br />
777 FRANKFURT CONSULT GmbH Frankfurt 100.0<br />
778 Frankfurt Family Office GmbH Frankfurt 100.0<br />
779 Frankfurt Finanz-Software GmbH Frankfurt 100.0<br />
780 FRANKFURT-TRUST Invest Luxemburg AG Luxembourg 100.0<br />
781 FRANKFURT-TRUST Investment-Gesellschaft mit beschränkter Haftung Frankfurt 100.0<br />
782 Frankfurter Beteiligungs-Treuhand Gesellschaft mit beschränkter Haftung Frankfurt 100.0
<strong>Deutsche</strong> <strong>Bank</strong><br />
02 – Consolidated Financial Statements<br />
341<br />
<strong>Deutsche</strong> <strong>Bank</strong> 02 – Consolidated Financial Statements 341<br />
Financial <strong>Report</strong> 2010<br />
Additional Notes<br />
Financial <strong>Report</strong> 2010 Additional Notes<br />
42 – Shareholdings<br />
42 – Shareholdings<br />
Consolidated Subsidiaries<br />
Consolidated Subsidiaries<br />
Serial<br />
Share of<br />
capital<br />
No. Name of company Domicile of company Footnote in %<br />
783 Frankfurter Vermögens-Treuhand Gesellschaft mit beschränkter Haftung Frankfurt 100.0<br />
784 Franz Urbig- und Oscar Schlitter-Stiftung Gesellschaft mit beschränkter Haftung Frankfurt 100.0<br />
785 Fundo de Investimento em Direitos Creditórios Nao-Padronizados-Precatório Federal 4870-1 Rio de Janeiro 100.0<br />
786 Fundo de Investimento em Direitos Creditórios Nao-Padronizados-Precatórios Federais DB I Rio de Janeiro 100.0<br />
787 Fundo de Investimento em Direitos Creditórios Nao-Padronizados-Precatórios Federais DB II Rio de Janeiro 100.0<br />
788 Fundo de Investimento em Quotas de Fundos de Investimento em Direitos Creditórios<br />
Nao-Padronizados Global Markets<br />
Rio de Janeiro 100.0<br />
789 Funds Nominees Limited London 100.0<br />
790 Fünfte DB Immobilienfonds Beta Dr. Rühl KG Eschborn 94.2<br />
791 Fünfte SAB Treuhand und Verwaltung GmbH & Co. Suhl >>Rimbachzentrum
<strong>Deutsche</strong> <strong>Bank</strong><br />
02 – Consolidated Financial Statements<br />
342<br />
<strong>Deutsche</strong> <strong>Bank</strong> 02 – Consolidated Financial Statements 342<br />
Financial <strong>Report</strong> 2010<br />
Additional Notes<br />
Financial <strong>Report</strong> 2010 Additional Notes<br />
42 – Shareholdings<br />
42 – Shareholdings<br />
Consolidated Subsidiaries<br />
Consolidated Subsidiaries<br />
Serial<br />
Share of<br />
capital<br />
No. Name of company Domicile of company Footnote in %<br />
837 Imodan Limited Port Louis 100.0<br />
838 Indigo (Cayman) Holding Limited George Town 100.0<br />
839 Industrie-Beteiligungs-Gesellschaft mit beschränkter Haftung Frankfurt 100.0<br />
840 International Operator Limited London 100.0<br />
841 IOS Finance EFC, S.A. Barcelona 100.0<br />
842 Iphigenie Verwaltungs GmbH Bonn 100.0<br />
843 Ironland Limited London 100.0<br />
844 ISTRON Beteiligungs- und Verwaltungs-GmbH Cologne 100.0<br />
845 ITAPEVA II Multicarteira FIDC Não-Padronizado Sao Paulo 100.0<br />
846 IVAF I Manager, S.à r.l. Luxembourg 100.0<br />
847 IVAF II Manager, S.à r.l. Luxembourg 100.0<br />
848 Ivy Kroner Unit Trust I George Town 4 0.0<br />
849 JADE Residential Property AG Eschborn 100.0<br />
850 JPCB-Bero GmbH Oberhausen 6 100.0<br />
851 JR Nominees (Proprietary) Limited Johannesburg 100.0<br />
852 Jyogashima Godo Kaisha Tokyo 100.0<br />
853 KAPPA IT VENTURES Zweite Beteiligungs GmbH i.L. Bonn 93.5<br />
854 KAPPA IT VENTURES Zweite Holding GmbH i.L. Bonn 100.0<br />
855 KARPATHOS Beteiligungs- und Verwaltungsgesellschaft mbH Cologne 100.0<br />
856 KEBA Gesellschaft für interne Services mbH Frankfurt 100.0<br />
857 KHP Knüppe, Huntebrinker & Co. GmbH Osnabrueck 100.0<br />
858 Kidson Pte Ltd Singapore 100.0<br />
859 Kiewo Ltd. George Town 100.0<br />
860 Kingfisher Nominees Limited Auckland 100.0<br />
861 KITHOS Beteiligungs- und Verwaltungsgesellschaft mbH Cologne 100.0<br />
862 Klöckner Industriebeteiligungsgesellschaft mbH Frankfurt 100.0<br />
863 Konsul Inkasso GmbH Essen 100.0<br />
864 KOS Beteiligungs- und Verwaltungsgesellschaft mbH Cologne 100.0<br />
865 LA Water Holdings Limited George Town 75.0<br />
866 Lammermuir Leasing Limited London 100.0<br />
867 Laser Leasing Limited George Town 100.0<br />
868 Latin America Recovery Fund LLC Wilmington 100.0<br />
869 LAWL Pte. Ltd. Singapore 100.0<br />
870 Leasing Verwaltungsgesellschaft Waltersdorf mbH Schoenefeld 100.0<br />
871 LGB Beteiligungs GmbH Cologne 100.0<br />
872 Liberty Investments Limited George Town 100.0<br />
873 Licorne Gestion Paris 100.0<br />
874 Linder LP George Town 100.0<br />
875 Lindoro LLC Wilmington 100.0<br />
876 Lokki Verwaltungsgesellschaft mbH Frankfurt 100.0<br />
877 London Industrial Leasing Limited London 100.0<br />
878 Long-Tail Risk Insurers, Ltd. Hamilton 100.0<br />
879 Luxembourg Family Office S.A. Luxembourg 100.0<br />
880 LWC Nominees Limited Auckland 100.0<br />
881 MAC Investments Ltd. George Town 100.0<br />
882 MacDougal Investments Limited Wilmington 100.0<br />
883 Makapuu Inc. Wilmington 100.0<br />
884 Mallard Place, Inc. Wilmington 100.0<br />
885 Marine Investments YK Tokyo 100.0<br />
886 Matura Vermögensverwaltung mit beschränkter Haftung Frankfurt 100.0<br />
887 Maxblue Americas Holdings, S.A. Madrid 100.0<br />
888 Mayfair Center, Inc. Wilmington 100.0<br />
889 Media Entertainment Filmmanagement GmbH Pullach 100.0<br />
890 MEF I Manager, S.à r.l. Luxembourg 100.0<br />
891 Mercer Investments Limited Wilmington 100.0<br />
892 Merkur I SICAV-FIS Luxembourg 100.0
<strong>Deutsche</strong> <strong>Bank</strong><br />
02 – Consolidated Financial Statements<br />
343<br />
<strong>Deutsche</strong> <strong>Bank</strong> 02 – Consolidated Financial Statements 343<br />
Financial <strong>Report</strong> 2010<br />
Additional Notes<br />
Financial <strong>Report</strong> 2010 Additional Notes<br />
42 – Shareholdings<br />
42 – Shareholdings<br />
Consolidated Subsidiaries<br />
Consolidated Subsidiaries<br />
Serial<br />
Share of<br />
capital<br />
No. Name of company Domicile of company Footnote in %<br />
893 Merkur II SICAV-FIS Luxembourg 100.0<br />
894 Metis Properties Limited London 100.0<br />
895 Mezzanine Capital Europe (MC-EU) GmbH & Co. KG Munich 1 0.1<br />
896 Mezzanine Capital Europe II (MC-EU II) GmbH & Co. KG Munich 1 0.0<br />
897 Mezzanine Capital USA (MC-US) GmbH & Co. KG Munich 1 0.1<br />
898 Mezzanine Capital USA II (MC-US II) GmbH & Co. KG Munich 1 0.1<br />
899 MHL Reinsurance Ltd. Burlington 100.0<br />
900 Miami MEI, LLC Dover 5 0.0<br />
901 Mira GmbH & Co. KG Frankfurt 100.0<br />
902 MIT Holdings, Inc. Baltimore 100.0<br />
903 MMDB Noonmark L.L.C. Wilmington 100.0<br />
904 "modernes Frankfurt" private Gesellschaft für Stadtentwicklung mbH Frankfurt 100.0<br />
905 Morgan Grenfell & Co. Limited London 100.0<br />
906 Morgan Grenfell (Local Authority Finance) Limited London 100.0<br />
907 Morgan Grenfell (Local Authority Services) Limited (in member's voluntary liquidation) London 100.0<br />
908 Morgan Grenfell Capital (G.P.) Limited (in member's voluntary liquidation) Edinburgh 100.0<br />
909 Morgan Grenfell Development Capital Holdings Limited London 100.0<br />
910 Morgan Grenfell Development Capital Nominees Limited (in member's voluntary liquidation) London 100.0<br />
911 Morgan Grenfell Development Capital Syndications Limited (in member's voluntary<br />
liquidation)<br />
London 100.0<br />
912 Morgan Grenfell Private Equity Limited London 100.0<br />
913 Morgan Nominees Limited London 100.0<br />
914 Mortgage Trading (UK) Limited London 100.0<br />
915 MortgageIT Securities Corp. Wilmington 100.0<br />
916 MortgageIT, Inc. New York 100.0<br />
917 MXB U.S.A., Inc. Wilmington 100.0<br />
918 Navegator - SGFTC, S.A. Lisbon 100.0<br />
919 NEPTUNO Verwaltungs- und Treuhand-Gesellschaft mit beschränkter Haftung Cologne 100.0<br />
920 New Prestitempo S.p.A. Milan 100.0<br />
921 Newhall LLC Wilmington 100.0<br />
922 Newport Harbor Corporation, Delaware Wilmington 100.0<br />
923 NewportX Inc. Wilmington 100.0<br />
924 NIDDA Grundstücks- und Beteiligungs-Gesellschaft mit beschränkter Haftung Frankfurt 100.0<br />
925 Nordwestdeutscher Wohnungsbauträger Gesellschaft mit beschränkter Haftung Frankfurt 100.0<br />
926 norisbank GmbH Berlin 100.0<br />
927 North American Income Fund PLC Dublin 67.1<br />
928 Novoquote Limited London 100.0<br />
929 Oakwood Properties Corp. Wilmington 100.0<br />
930 Office Grundstücksverwaltungsgesellschaft mbH Frankfurt 100.0<br />
931 OOO "<strong>Deutsche</strong> <strong>Bank</strong>" Moscow 100.0<br />
932 OP Cash Euro Plus Luxembourg 4 61.7<br />
933 OP-Fonds OPAL Cologne 4 100.0<br />
934 OP-INVEST CHF Management S.A. Luxembourg 100.0<br />
935 OPB KRITI GmbH Koenigstein 100.0<br />
936 OPB Verwaltungs- und Beteiligungs-GmbH Cologne 100.0<br />
937 OPB Verwaltungs- und Treuhand GmbH Cologne 100.0<br />
938 OPB-Decima GmbH Cologne 100.0<br />
939 OPB-Holding GmbH Cologne 100.0<br />
940 OPB-Mosel GmbH Cologne 100.0<br />
941 OPB-Nona GmbH Frankfurt 100.0<br />
942 OPB-Oktava GmbH Cologne 100.0<br />
943 OPB-Quarta GmbH Cologne 100.0<br />
944 OPB-Quinta GmbH Cologne 100.0<br />
945 OPB-Rhein GmbH Cologne 100.0<br />
946 OPB-Septima GmbH Cologne 100.0<br />
947 OPB-SIKINOS GmbH i.L. Cologne 100.0
<strong>Deutsche</strong> <strong>Bank</strong><br />
02 – Consolidated Financial Statements<br />
344<br />
<strong>Deutsche</strong> <strong>Bank</strong> 02 – Consolidated Financial Statements 344<br />
Financial <strong>Report</strong> 2010<br />
Additional Notes<br />
Financial <strong>Report</strong> 2010 Additional Notes<br />
42 – Shareholdings<br />
42 – Shareholdings<br />
Consolidated Subsidiaries<br />
Consolidated Subsidiaries<br />
Serial<br />
Share of<br />
capital<br />
No. Name of company Domicile of company Footnote in %<br />
948 OPB-Structuring GmbH Cologne 100.0<br />
949 Open joint-stock company "<strong>Deutsche</strong> <strong>Bank</strong> DBU" Kiev 100.0<br />
950 Oppenheim ACA GmbH Frankfurt 100.0<br />
951 Oppenheim AM GmbH Vienna 100.0<br />
952 OPPENHEIM Asia Select GmbH & Co. KG Cologne 100.0<br />
953 Oppenheim Asset Management Services S.à r.l. Luxembourg 100.0<br />
954 Oppenheim Beteiligungs-AG Cologne 100.0<br />
955 OPPENHEIM Beteiligungs-Treuhand GmbH Cologne 100.0<br />
956 OPPENHEIM Capital Advisory GmbH Cologne 100.0<br />
957 Oppenheim Capital Management GmbH Cologne 100.0<br />
958 Oppenheim Eunomia GmbH Cologne 100.0<br />
959 OPPENHEIM Flottenfonds IV GmbH & Co. KG Cologne 1 0.0<br />
960 OPPENHEIM Flottenfonds V GmbH & Co. KG Cologne 83.3<br />
961 Oppenheim Fonds Trust GmbH Cologne 100.0<br />
962 OPPENHEIM Immobilien Dachfonds III GmbH & Co. KG Cologne 100.0<br />
963 Oppenheim Immobilienfonds Rüttenscheider Tor GmbH & Co. KG Cologne 1 5.4<br />
964 Oppenheim International Finance Dublin 100.0<br />
965 OPPENHEIM Internet Fonds Manager GmbH i.L. Cologne 100.0<br />
966 Oppenheim Kapitalanlagegesellschaft mbH Cologne 100.0<br />
967 OPPENHEIM Mezzanine GmbH & Co. KG Frankfurt 1 2.6<br />
968 OPPENHEIM PRIVATE EQUITY Manager GmbH Cologne 100.0<br />
969 OPPENHEIM PRIVATE EQUITY Verwaltungsgesellschaft mbH Cologne 100.0<br />
970 Oppenheim Research GmbH Cologne 100.0<br />
971 Oppenheim VAM Kapitalanlagegesellschaft mbH Cologne 100.0<br />
972 Oppenheim Vermögenstreuhand GmbH Cologne 100.0<br />
973 OPS Nominees Pty. Limited Sydney 100.0<br />
974 OVT Trust 1 GmbH Cologne 100.0<br />
975 OVV Beteiligungs GmbH Cologne 100.0<br />
976 PacificX LLC Wilmington 100.0<br />
977 PADUS Grundstücks-Vermietungsgesellschaft mbH Duesseldorf 100.0<br />
978 Pan Australian Nominees Pty. Limited Sydney 100.0<br />
979 Paribus Köln I GmbH Cologne 100.0<br />
980 PB (USA) Holdings, Inc. Wilmington 100.0<br />
981 PB (USA) Realty Corporation New York 94.7<br />
982 PB Capital Corporation Wilmington 100.0<br />
983 PB EuroTurks Finanzdienstleistungen GmbH i.L. Bonn 100.0<br />
984 PB Factoring GmbH Bonn 100.0<br />
985 PB Finance (Delaware) Inc. Wilmington 100.0<br />
986 PB Firmenkunden AG Bonn 100.0<br />
987 PB Hollywood I Hollywood Station, LLC Dover 5 0.0<br />
988 PB Hollywood II Lofts, LLC Dover 5 0.0<br />
989 PB Sechste Beteiligungen GmbH Bonn 100.0<br />
990 PB Spezial-Investmentaktiengesellschaft mit Teilgesellschaftsvermögen Frankfurt 99.6<br />
991 PBC Carnegie, LLC Wilmington 5 0.0<br />
992 PBC Services GmbH der <strong>Deutsche</strong>n <strong>Bank</strong> Frankfurt 100.0<br />
993 PE-US/ASIA Beteiligungsgesellschaft mbH Munich 100.0<br />
994 PEIF II (Manager) Limited St. Helier 100.0<br />
995 Pelleport Investors, Inc. New York 100.0<br />
996 Pembol Nominees Limited London 100.0<br />
997 Percy Limited Gibraltar 100.0<br />
998 PHARMA/wHEALTH Management Company S.A. Luxembourg 99.9<br />
999 Philippine Opportunities for Growth and Income (SPV-AMC), INC. Manila 95.0<br />
1000 Phoebus Investments LP Wilmington 100.0<br />
1001 Phoebus Leasing Limited George Town 100.0<br />
1002 Pilgrim Financial Services LLP Wilmington 100.0<br />
1003 PLAKIAS Beteiligungs- und Verwaltungs-GmbH Cologne 100.0
<strong>Deutsche</strong> <strong>Bank</strong><br />
02 – Consolidated Financial Statements<br />
345<br />
<strong>Deutsche</strong> <strong>Bank</strong> 02 – Consolidated Financial Statements 345<br />
Financial <strong>Report</strong> 2010<br />
Additional Notes<br />
Financial <strong>Report</strong> 2010 Additional Notes<br />
42 – Shareholdings<br />
42 – Shareholdings<br />
Consolidated Subsidiaries<br />
Consolidated Subsidiaries<br />
Serial<br />
Share of<br />
capital<br />
No. Name of company Domicile of company Footnote in %<br />
1004 Plantation Bay, Inc. St. Thomas 100.0<br />
1005 Plinius Verwaltungs AG Zurich 100.0<br />
1006 PMG Collins, LLC Tallahassee 5 0.0<br />
1007 Pollus L.P. St. Helier 100.0<br />
1008 Polydeuce LLC Wilmington 100.0<br />
1009 POND VENTURES II GmbH & Co. KG Munich 99.9<br />
1010 POSEIDON Vermögensverwaltungsgesellschaft mbH Cologne 100.0<br />
1011 Postbank Akademie und Service GmbH Hameln 100.0<br />
1012 Postbank Beteiligungen GmbH Bonn 100.0<br />
1013 Postbank Direkt GmbH Bonn 100.0<br />
1014 Postbank Filial GmbH Bonn 100.0<br />
1015 Postbank Filialvertrieb AG Bonn 100.0<br />
1016 Postbank Finanzberatung AG Hameln 100.0<br />
1017 Postbank Immobilien und Baumanagement GmbH Bonn 100.0<br />
1018 Postbank Immobilien und Baumanagement GmbH & Co. Objekt Leipzig KG Bonn 90.0<br />
1019 Postbank Leasing GmbH Bonn 100.0<br />
1020 Postbank P.O.S. Transact GmbH Eschborn 100.0<br />
1021 Postbank Support GmbH Cologne 100.0<br />
1022 Postbank Systems AG Bonn 100.0<br />
1023 Postbank Versicherungsvermittlung GmbH Bonn 100.0<br />
1024 Primelux Insurance S.A. Luxembourg 100.0<br />
1025 Private Equity Asia Select Company III S.à r.l. Luxembourg 100.0<br />
1026 Private Equity Global Select Company IV S.à r.l. Luxembourg 100.0<br />
1027 Private Equity Global Select Company V S.à r.l. Luxembourg 100.0<br />
1028 Private Equity Select Company S.à r.l. Luxembourg 100.0<br />
1029 Private Financing Initiatives, S.L. Barcelona 51.0<br />
1030 PS plus Portfolio Software + Consulting GmbH Roedermark 80.2<br />
1031 PT. <strong>Deutsche</strong> Securities Indonesia Jakarta 99.0<br />
1032 Pyramid Acquisitions B.V. Amsterdam 100.0<br />
1033 Pyramid Investments Limited (in member's voluntary liquidation) London 100.0<br />
1034 Pyramid Office Properties Limited (in member's voluntary liquidation) London 100.0<br />
1035 Pyramid Ventures, Inc. Wilmington 100.0<br />
1036 RALOS Verwaltung GmbH & Co. Vermietungs-KG Pullach 94.0<br />
1037 RBM Nominees Pty. Limited Sydney 100.0<br />
1038 Reade, Inc. Wilmington 100.0<br />
1039 Red Lodge, L.P. Wilmington 100.0<br />
1040 registrar services GmbH Eschborn 100.0<br />
1041 Regula Limited Road Town 100.0<br />
1042 REIB Europe Investments Limited London 100.0<br />
1043 REIB International Holdings Limited London 100.0<br />
1044 REO Properties Corporation Wilmington 100.0<br />
1045 RHODOS Beteiligungs- und Verwaltungsgesellschaft mbH Cologne 100.0<br />
1046 Rimvalley Limited Dublin 100.0<br />
1047 Ripple Creek, L.P. Wilmington 100.0<br />
1048 Riverton Investments LLC Wilmington 100.0<br />
1049 RMS Investments (Cayman) George Town 100.0<br />
1050 RoCal, L.L.C. Wilmington 100.0<br />
1051 RoCalwest, Inc. Wilmington 100.0<br />
1052 Romeo U.S. Group, Inc. Wilmington 100.0<br />
1053 RoPro U.S. Holding, Inc. Wilmington 100.0<br />
1054 RoSmart LLC Wilmington 100.0<br />
1055 Route 28 Receivables, LLC Wilmington 100.0<br />
1056 RREEF Agency S.r.l. Milan 100.0<br />
1057 RREEF America L.L.C. Wilmington 100.0<br />
1058 RREEF China REIT Management Limited Hong Kong 100.0<br />
1059 RREEF European Value Added I (G.P.) Limited London 100.0
<strong>Deutsche</strong> <strong>Bank</strong><br />
02 – Consolidated Financial Statements<br />
346<br />
<strong>Deutsche</strong> <strong>Bank</strong> 02 – Consolidated Financial Statements 346<br />
Financial <strong>Report</strong> 2010<br />
Additional Notes<br />
Financial <strong>Report</strong> 2010 Additional Notes<br />
42 – Shareholdings<br />
42 – Shareholdings<br />
Consolidated Subsidiaries<br />
Consolidated Subsidiaries<br />
Serial<br />
Share of<br />
capital<br />
No. Name of company Domicile of company Footnote in %<br />
1060 RREEF Fondimmobiliari Società di Gestione del Risparmio S.p.A. Milan 100.0<br />
1061 RREEF India Advisors Private Limited Mumbai 100.0<br />
1062 RREEF Investment GmbH Eschborn 99.9<br />
1063 RREEF Management Company Wilmington 100.0<br />
1064 RREEF Management GmbH Eschborn 100.0<br />
1065 RREEF Management L.L.C. Wilmington 100.0<br />
1066 RREEF North American Infrastructure Onshore Fund A, L.P. Wilmington 99.9<br />
1067 RREEF Opportunities Management S.r.l. Milan 100.0<br />
1068 RREEF REFlex Fund L.P. Wilmington 86.7<br />
1069 RREEF REFlex Fund Ltd. George Town 92.3<br />
1070 RREEF Shanghai Investment Consultancy Company Shanghai 100.0<br />
1071 RREEF Spezial Invest GmbH Eschborn 100.0<br />
1072 RREEFSmart, L.L.C. Wilmington 95.0<br />
1073 RTS Nominees Pty Limited Sydney 100.0<br />
1074 Rüd Blass Vermögensverwaltung AG Zurich 100.0<br />
1075 SAB Real Estate Verwaltungs GmbH Hameln 100.0<br />
1076 Sagamore Limited London 100.0<br />
1077 SAGITA Grundstücks-Vermietungsgesellschaft mbH Duesseldorf 100.0<br />
1078 Sal. Oppenheim (France) Paris 100.0<br />
1079 Sal. Oppenheim Alternative Asset Management S.A. Luxembourg 100.0<br />
1080 Sal. Oppenheim Alternative Investments GmbH Cologne 100.0<br />
1081 Sal. Oppenheim Asia Alternative Investments GmbH Cologne 100.0<br />
1082 Sal. Oppenheim Boulevard Konrad Adenauer S.à r.l. Luxembourg 100.0<br />
1083 Sal. Oppenheim Corporate Finance North America Holding LLC Wilmington 100.0<br />
1084 Sal. Oppenheim Global Invest GmbH Cologne 100.0<br />
1085 Sal. Oppenheim Healthcare Beteiligungs GmbH Cologne 100.0<br />
1086 Sal. Oppenheim Investments GmbH Cologne 100.0<br />
1087 Sal. Oppenheim jr. & Cie. AG & Co. Kommanditgesellschaft auf Aktien Cologne 100.0<br />
1088 Sal. Oppenheim jr. & Cie. Beteiligungen S.A. (Luxembourg) Luxembourg 100.0<br />
1089 Sal. Oppenheim jr. & Cie. Beteiligungs GmbH Cologne 100.0<br />
1090 Sal. Oppenheim jr. & Cie. Corporate Finance (Schweiz) AG Zurich 100.0<br />
1091 Sal. Oppenheim jr. & Cie. Komplementär AG Cologne 100.0<br />
1092 Sal. Oppenheim jr. & Cie. Komplementär S.A. Luxembourg 100.0<br />
1093 Sal. Oppenheim jr. & Cie. S.C.A. Luxembourg 100.0<br />
1094 Sal. Oppenheim jr. & Cie. Securities Inc. Wilmington 100.0<br />
1095 Sal. Oppenheim PEP International S.à r.l. Luxembourg 100.0<br />
1096 Sal. Oppenheim PEP Treuhand GmbH Munich 100.0<br />
1097 Sal. Oppenheim Private Equity Partners S.A. Luxembourg 100.0<br />
1098 Sal. Oppenheim Private Equity Partners US L.P. Wilmington 100.0<br />
1099 Sal. Oppenheim Private Equity Partners US LLC Wilmington 100.0<br />
1100 SALOMON OPPENHEIM GmbH i.L. Cologne 100.0<br />
1101 SAMOS Vermögensverwaltungs GmbH Cologne 100.0<br />
1102 SAPIO Grundstücks-Vermietungsgesellschaft mbH Duesseldorf 100.0<br />
1103 Sapphire Aircraft Leasing and Trading Limited (in member's voluntary liquidation) London 100.0<br />
1104 Schiffsbetriebsgesellschaft Brunswik mit beschränkter Haftung Hamburg 100.0<br />
1105 Sechste DB Immobilienfonds Beta Dr. Rühl KG Eschborn 100.0<br />
1106 SENA Grundstücks-Vermietungsgesellschaft mbH & Co. Objekt Fehrenbach KG Duesseldorf 94.7<br />
1107 SENA Grundstücks-Vermietungsgesellschaft mbH & Co. Objekt Halle II KG Duesseldorf 100.0<br />
1108 Seneca Delaware, Inc. Wilmington 100.0<br />
1109 Seneca Leasing Partners, L.P. Wilmington 99.0<br />
1110 Service Company Two Limited Hong Kong 100.0<br />
1111 Serviced Office Investments Limited St. Helier 100.0<br />
1112 Servicegesellschaft der <strong>Deutsche</strong>n <strong>Bank</strong> Privat- und Geschäftskunden mbH Frankfurt 100.0<br />
1113 Sharps SP I LLC Wilmington 100.0<br />
1114 Sherwood Properties Corp. Wilmington 100.0<br />
1115 Shopready Limited London 100.0
<strong>Deutsche</strong> <strong>Bank</strong><br />
02 – Consolidated Financial Statements<br />
347<br />
<strong>Deutsche</strong> <strong>Bank</strong> 02 – Consolidated Financial Statements 347<br />
Financial <strong>Report</strong> 2010<br />
Additional Notes<br />
Financial <strong>Report</strong> 2010 Additional Notes<br />
42 – Shareholdings<br />
42 – Shareholdings<br />
Consolidated Subsidiaries<br />
Consolidated Subsidiaries<br />
Serial<br />
Share of<br />
capital<br />
No. Name of company Domicile of company Footnote in %<br />
1116 Silver Leaf 1 LLC Wilmington 100.0<br />
1117 SIMA Private Equity 1 Beteiligungs GmbH Cologne 100.0<br />
1118 SIMA Private Equity 1 GmbH & Co. KG Hamburg 1 0.0<br />
1119 SOAR European Equity Fund Public Limited Company Dublin 100.0<br />
1120 SolRenovable Fotov., S.L. Palma de Mallorca 67.7<br />
1121 SOPEP Global Infrastructure Fund, SICAV-FIS Luxembourg 100.0<br />
1122 Spring Leasing Limited (in member's voluntary liquidation) London 100.0<br />
1123 SSG Middle Market CLO LLC Wilmington 100.0<br />
1124 Stoneridge Apartments, Inc. Wilmington 5 0.0<br />
1125 Stores International Limited George Town 100.0<br />
1126 Story L.P. George Town 100.0<br />
1127 Structured Finance Americas, LLC Wilmington 100.0<br />
1128 Sunbelt Rentals Exchange Inc. Wilmington 100.0<br />
1129 Süddeutsche Vermögensverwaltung Gesellschaft mit beschränkter Haftung Frankfurt 100.0<br />
1130 Tapeorder Limited London 100.0<br />
1131 Taunus Corporation Wilmington 100.0<br />
1132 Technology Ventures Five GmbH i.L. Bonn 100.0<br />
1133 Technology Ventures Six GmbH i.L. Bonn 100.0<br />
1134 Telefon-Servicegesellschaft der <strong>Deutsche</strong>n <strong>Bank</strong> mbH Frankfurt 100.0<br />
1135 TELO Beteiligungsgesellschaft mbH Schoenefeld 100.0<br />
1136 Tempurrite Leasing Limited London 100.0<br />
1137 Tenedora de Valores S.A. Santiago 100.0<br />
1138 TeraGate Beteiligungs-GmbH Frankfurt 100.0<br />
1139 Tertia Büromaschinen Vermiet- und Leasing-Verwaltungsgesellschaft mbH Duesseldorf 100.0<br />
1140 TESATUR Beteiligungsgesellschaft mbH & Co. Objekt Halle I KG Duesseldorf 100.0<br />
1141 TESATUR Beteiligungsgesellschaft mbH & Co. Objekt Nordhausen I KG Duesseldorf 100.0<br />
1142 Thai Asset Enforcement and Recovery Asset Management Company Limited Bangkok 100.0<br />
1143 The World Markets Company GmbH i.L. Frankfurt 74.8<br />
1144 THEMIS Beteiligungs- und Verwaltungs GmbH Cologne 100.0<br />
1145 Tilney (Ireland) Limited Dublin 100.0<br />
1146 Tilney Acquisitions Limited Liverpool 100.0<br />
1147 Tilney Asset Management International Limited St. Peter Port 100.0<br />
1148 Tilney Funding Limited Liverpool 100.0<br />
1149 Tilney Group Limited Liverpool 100.0<br />
1150 Tilney Holdings Limited Liverpool 100.0<br />
1151 Tilney International Limited Hamilton 100.0<br />
1152 Tilney Investment Management Liverpool 100.0<br />
1153 Tilney Management Limited Liverpool 100.0<br />
1154 TILOS Vermögensverwaltungs GmbH Cologne 100.0<br />
1155 TIM (London) Limited Liverpool 100.0<br />
1156 TOKOS GmbH Soessen-Gostau 100.0<br />
1157 TQI Exchange, LLC Wilmington 100.0<br />
1158 Treuinvest Service GmbH Frankfurt 100.0<br />
1159 Trevona Limited Road Town 100.0<br />
1160 Triplereason Limited London 100.0<br />
1161 TTM Investor GmbH Frankfurt 100.0<br />
1162 U.F.G.I.S. Holdings (Cyprus) Limited Larnaca 100.0<br />
1163 Unter Sachsenhausen Beteiligungs GmbH i.L. Cologne 100.0<br />
1164 Urbistar Settlement Services, LLC Wilmington 100.0<br />
1165 US Real Estate Beteiligungs GmbH Frankfurt 100.0<br />
1166 Varick Investments Limited Wilmington 100.0<br />
1167 VB Glas-Großhandelsgesellschaft mit beschränkter Haftung Cologne 100.0<br />
1168 VCG Venture Capital Fonds III Verwaltungs GmbH Munich 100.0<br />
1169 VCG Venture Capital Gesellschaft mbH Munich 100.0<br />
1170 VCM Capital Management GmbH Munich 100.0<br />
1171 VCM Golding Mezzanine GmbH & Co. KG Munich 1 0.0
<strong>Deutsche</strong> <strong>Bank</strong><br />
02 – Consolidated Financial Statements<br />
348<br />
<strong>Deutsche</strong> <strong>Bank</strong> 02 – Consolidated Financial Statements 348<br />
Financial <strong>Report</strong> 2010<br />
Additional Notes<br />
Financial <strong>Report</strong> 2010 Additional Notes<br />
42 – Shareholdings<br />
42 – Shareholdings<br />
Consolidated Subsidiaries<br />
Consolidated Subsidiaries<br />
Serial<br />
Share of<br />
capital<br />
No. Name of company Domicile of company Footnote in %<br />
1172 VCM III Institutional Beteiligungsgesellschaft mbH Munich 100.0<br />
1173 VCM III Institutional Equity Partners GmbH & Co. KG Munich 1 0.1<br />
1174 VCM MIP 2001 GmbH & Co. KG Munich 1 0.0<br />
1175 VCM MIP 2002 GmbH & Co. KG Munich 1 0.0<br />
1176 VCM MIP II GmbH & Co. KG Munich 1 0.0<br />
1177 VCM MIP III GmbH & Co. KG Munich 1 8.0<br />
1178 VCM MIP IV GmbH & Co. KG Munich 1 0.0<br />
1179 VCM PEP I Beteiligungsgesellschaft mbH Munich 100.0<br />
1180 VCM PEP II Beteiligungsverwaltung GmbH Munich 100.0<br />
1181 VCM Private Equity Portfolio GmbH & Co. Beteiligungs KG II Munich 1 4.8<br />
1182 VCM Private Equity Portfolio GmbH & Co. KG Munich 1 0.0<br />
1183 VCM Private Equity Portfolio GmbH & Co. KG IV Munich 1 2.1<br />
1184 VCM REE Beteiligungstreuhand GmbH Munich 100.0<br />
1185 VCM Treuhand Beteiligungsverwaltung GmbH Munich 100.0<br />
1186 VCM VI Institutional Private Equity (B) GmbH & Co. KG Munich 1 0.0<br />
1187 VCP Treuhand Beteiligungsgesellschaft mbH Munich 100.0<br />
1188 VCP Verwaltungsgesellschaft mbH Munich 100.0<br />
1189 VCPII Beteiligungsverwaltungsgesellschaft mbH Tutzing 100.0<br />
1190 Vertriebsgesellschaft mbH der <strong>Deutsche</strong>n <strong>Bank</strong> Privat- und Geschäftskunden Berlin 100.0<br />
1191 VEXCO, LLC Wilmington 100.0<br />
1192 VI Resort Holdings, Inc. New York 5 0.0<br />
1193 Vierte DB Immobilienfonds Beta Dr. Rühl KG Eschborn 94.2<br />
1194 VÖB-ZVD <strong>Bank</strong> für Zahlungsverkehrsdienstleistungen GmbH Bonn 75.0<br />
1195 Wealthspur Investment Company Limited Labuan 100.0<br />
1196 WEBA Beteiligungsgesellschaft mbH Frankfurt 100.0<br />
1197 Welsh, Carson, Anderson & Stowe IX GmbH & Co. KG Munich 1 0.0<br />
1198 WEPLA Beteiligungsgesellschaft mbH Frankfurt 100.0<br />
1199 WERDA Beteiligungsgesellschaft mbH Frankfurt 100.0<br />
1200 WestX Inc. Wilmington 100.0<br />
1201 Whale Holdings S.à r.l. Luxembourg 100.0<br />
1202 Whispering Woods LLC Wilmington 100.0<br />
1203 Whistling Pines LLC Wilmington 100.0<br />
1204 Wilhelm von Finck AG Grasbrunn 100.0<br />
1205 Wilmington Trust B6 Wilmington 100.0<br />
1206 Wintercrest Inc. Wilmington 100.0<br />
1207 WMH (No. 1) Limited (in member's voluntary liquidation) London 100.0<br />
1208 WMH (No. 10) Limited (in member's voluntary liquidation) London 100.0<br />
1209 WMH (No. 15) Limited London 100.0<br />
1210 WMH (No. 16) Limited London 100.0<br />
1211 WMH (No. 17) Limited (in member's voluntary liquidation) London 100.0<br />
1212 WMH (No. 4) Limited (in member's voluntary liquidation) London 100.0<br />
1213 WMH (No. 5) Limited (in member's voluntary liquidation) London 100.0<br />
1214 WMH (No. 7) Limited (in member's voluntary liquidation) London 100.0<br />
1215 Woodwardia LLC Wilmington 100.0<br />
1216 World Trading (Delaware) Inc. Wilmington 100.0<br />
1217 5000 Yonge Street Toronto Inc. Toronto 100.0<br />
1218 ZAO "<strong>Deutsche</strong> Securities" Moscow 100.0<br />
1219 ZELLU Grundstücks-Vermietungsgesellschaft mbH Schoenefeld 100.0<br />
1220 Zweite DB Immobilienfonds Beta Dr. Rühl KG Eschborn 94.2<br />
1221 Zweite Industrie-Beteiligungs-Gesellschaft mbH Frankfurt 100.0<br />
1222 Zürich - Swiss Value AG Zurich 50.1<br />
1223 Zürich - Swiss Value Invest AG Steinhausen 100.0
<strong>Deutsche</strong> <strong>Bank</strong><br />
02 – Consolidated Financial Statements<br />
349<br />
<strong>Deutsche</strong> <strong>Bank</strong> 02 – Consolidated Financial Statements 349<br />
Financial <strong>Report</strong> 2010<br />
Additional Notes<br />
Financial <strong>Report</strong> 2010 Additional Notes<br />
42 – Shareholdings<br />
42 – Shareholdings<br />
Special Purpose Entities<br />
Special Purpose Entities<br />
Serial<br />
Share of<br />
capital<br />
No. Name of company Domicile of company Footnote in %<br />
1224 ABATE Grundstücks-Vermietungsgesellschaft mbH Duesseldorf 50.0<br />
1225 ABATIS Beteiligungsgesellschaft mbH Duesseldorf 50.0<br />
1226 ABRI Beteiligungsgesellschaft mbH Duesseldorf 50.0<br />
1227 ACHAP Beteiligungsgesellschaft mbH Duesseldorf 50.0<br />
1228 ACHTE PAXAS Treuhand- und Beteiligungsgesellschaft mbH Duesseldorf 50.0<br />
1229 ACHTUNDZWANZIGSTE PAXAS Treuhand- und Beteiligungsgesellschaft mbH Duesseldorf 50.0<br />
1230 ACHTZEHNTE PAXAS Treuhand- und Beteiligungsgesellschaft mbH Duesseldorf 50.0<br />
1231 ACIS Beteiligungsgesellschaft mbH Duesseldorf 50.0<br />
1232 ACTIO Grundstücks-Vermietungsgesellschaft mbH Duesseldorf 50.0<br />
1233 ACTIUM Leasobjekt GmbH & Co. Objekt Bietigheim OHG Duesseldorf<br />
1234 ADEO Beteiligungsgesellschaft mbH Duesseldorf 50.0<br />
1235 ADLAT Beteiligungsgesellschaft mbH Duesseldorf 50.0<br />
1236 ADMANU Beteiligungsgesellschaft mbH Duesseldorf 50.0<br />
1237 AETAS Beteiligungsgesellschaft mbH Duesseldorf 50.0<br />
1238 Affiliated Loan Program for Students Funding Trust 2009-1 Wilmington<br />
1239 AGLOM Beteiligungsgesellschaft mbH Duesseldorf 50.0<br />
1240 AGUM Beteiligungsgesellschaft mbH Duesseldorf 50.0<br />
1241 AKRUN Beteiligungsgesellschaft mbH Duesseldorf 50.0<br />
1242 ALANUM Beteiligungsgesellschaft mbH Duesseldorf 50.0<br />
1243 ALMO Beteiligungsgesellschaft mbH Duesseldorf 50.0<br />
1244 Almutkirk Limited Dublin<br />
1245 ALTA Beteiligungsgesellschaft mbH Duesseldorf 50.0<br />
1246 Alternative LN TR 2007-HY9 New York<br />
1247 Ameriquest NIM 05-RN111 New York<br />
1248 ANDOT Grundstücks-Vermietungsgesellschaft mbH Duesseldorf 50.0<br />
1249 Andramad Limited Dublin<br />
1250 Annapolis Funding Trust Toronto<br />
1251 Apexel LLC Wilmington 100.0<br />
1252 APUR Beteiligungsgesellschaft mbH Duesseldorf 50.0<br />
1253 AQ FIN NIM Trust 2001-2 New York<br />
1254 AQNIM 2001-2 New York<br />
1255 Asian Hybrid Investments LLP Singapore 0.0<br />
1256 Aspen Funding Corp. Charlotte<br />
1257 Asset Repackaging Trust B.V. Amsterdam 7<br />
1258 Asset Repackaging Trust Five B.V. Amsterdam 7<br />
1259 ATAUT Beteiligungsgesellschaft mbH Duesseldorf 50.0<br />
1260 Atlas Investment Company 1 S.à r.l. Luxembourg<br />
1261 Atlas Investment Company 2 S.à r.l. Luxembourg<br />
1262 Atlas Investment Company 3 S.à r.l. Luxembourg<br />
1263 Atlas Investment Company 4 S.à r.l. Luxembourg<br />
1264 Atlas Portfolio Select SPC George Town 0.0<br />
1265 Atlas SICAV - FIS Luxembourg 7<br />
1266 Avizandum Limited Dublin<br />
1267 AVOC Beteiligungsgesellschaft mbH Duesseldorf 50.0<br />
1268 Avon Investments S.à r.l. Luxembourg 100.0<br />
1269 BAKTU Beteiligungsgesellschaft mbH Schoenefeld 50.0<br />
1270 BALIT Beteiligungsgesellschaft mbH Schoenefeld 50.0<br />
1271 BAMAR Beteiligungsgesellschaft mbH Schoenefeld 50.0<br />
1272 BARDA Beteiligungsgesellschaft mbH Schoenefeld 50.0<br />
1273 BIMES Beteiligungsgesellschaft mbH Schoenefeld 50.0<br />
1274 BLI Beteiligungsgesellschaft für Leasinginvestitionen mbH Duesseldorf 33.2<br />
1275 Blue Ridge CLO 2009-1 Wilmington<br />
1276 BNP Paribas Flexi III - Fortis Bond Taiwan Luxembourg<br />
1277 BNP Paribas Flexi III - RMB Corporate Bonds Luxembourg 100.0<br />
1278 Bolsena Holding GmbH & Co. KG Frankfurt 100.0<br />
1279 Bozarche Limited George Town
<strong>Deutsche</strong> <strong>Bank</strong><br />
02 – Consolidated Financial Statements<br />
350<br />
<strong>Deutsche</strong> <strong>Bank</strong> 02 – Consolidated Financial Statements 350<br />
Financial <strong>Report</strong> 2010<br />
Additional Notes<br />
Financial <strong>Report</strong> 2010 Additional Notes<br />
42 – Shareholdings<br />
42 – Shareholdings<br />
Special Purpose Entities<br />
Special Purpose Entities<br />
Serial<br />
Share of<br />
capital<br />
No. Name of company Domicile of company Footnote in %<br />
1280 Bridge No.1 Pty Limited Sydney<br />
1281 BS 2 Y.K. Tokyo 100.0<br />
1282 Business Support One Y.K. Tokyo 100.0<br />
1283 Canadian Asset Acquisition Trust 2 Toronto 7<br />
1284 Canal New Orleans Holdings LLC Dover<br />
1285 Canal New Orleans Hotel LLC Wilmington<br />
1286 Canal New Orleans Mezz LLC Dover<br />
1287 Cathay Capital (Labuan) Company Limited Labuan<br />
1288 Cathay Capital Company Limited Port Louis 9.5<br />
1289 Cathay Strategic Investment Company Limited Hong Kong<br />
1290 Cathay Strategic Investment Company No. 2 Limited George Town<br />
1291 Cepangie Limited Dublin<br />
1292 Charitable Luxembourg Four S.à r.l. Luxembourg<br />
1293 Charitable Luxembourg Three S.à r.l. Luxembourg<br />
1294 Charitable Luxembourg Two S.à r.l. Luxembourg<br />
1295 CIBI Beteiligungsgesellschaft mbH Duesseldorf 50.0<br />
1296 CIG (Jersey) Limited St. Helier<br />
1297 CLASS Limited St. Helier 7<br />
1298 Compartment AXA PLAN 2005 Global of the FCPE Shareplan AXA Direct Global Paris 90.0<br />
1299 Comprehensive Trust - IBP Osaka<br />
1300 Comprehensive Trust - Sumitomo Chemical Co., Ltd. Tokyo<br />
1301 Comprehensive Trust - Wakachiku Construction Co., Ltd. Kita-Kyushu<br />
1302 Concept Fund Solutions PLC Dublin 7 19.6<br />
1303 Coriolanus Limited Dublin 7<br />
1304 COUNTS Trust Series 2007 - 3 Newark 7<br />
1305 Cranfield Aircraft Leasing Limited George Town<br />
1306 Crystal CLO, Ltd. George Town<br />
1307 D & S Capital Y.K. Tokyo 100.0<br />
1308 DAGOBA Beteiligungsgesellschaft mbH Duesseldorf<br />
1309 DAINA Beteiligungsgesellschaft mbH Duesseldorf<br />
1310 Dariconic Limited Dublin<br />
1311 DARKU Beteiligungsgesellschaft mbH Duesseldorf<br />
1312 DARUS Beteiligungsgesellschaft mbH Duesseldorf<br />
1313 Dawn-BV LLC Wilmington 100.0<br />
1314 Dawn-BV-Helios LLC Wilmington 100.0<br />
1315 Dawn-G LLC Wilmington 100.0<br />
1316 Dawn-G-Helios LLC Wilmington 100.0<br />
1317 DB Aircraft Leasing Master Trust Wilmington 0.0<br />
1318 DB Aircraft Leasing Master Trust II Wilmington 0.0<br />
1319 DB Akela, S.à r.l. Luxembourg 100.0<br />
1320 DB Alternative Strategies Limited George Town 100.0<br />
1321 DB Artemis Investments GP Wilmington 68.1<br />
1322 DB Asia Pacific Holdings Limited George Town 100.0<br />
1323 DB Bagheera, S.à r.l. Luxembourg 100.0<br />
1324 DB CRE Empire Hawkeye HoldCo LLC Wilmington 100.0<br />
1325 DB Cross Limited St. Helier 100.0<br />
1326 DB Dawn, Inc. Wilmington 100.0<br />
1327 db ETC Index plc St. Helier 7<br />
1328 db ETC plc St. Helier 7<br />
1329 DB Global Masters Multi-Strategy Trust George Town 100.0<br />
1330 DB Immobilienfonds 1 Wieland KG Eschborn<br />
1331 DB Immobilienfonds 4 GmbH & Co. KG Frankfurt 0.2<br />
1332 DB Immobilienfonds 5 Wieland KG Frankfurt<br />
1333 db Investor Solutions Dublin 7<br />
1334 DB Jasmine Holdings Limited London 100.0<br />
1335 DB Platinum Luxembourg 7 4.7
<strong>Deutsche</strong> <strong>Bank</strong><br />
02 – Consolidated Financial Statements<br />
351<br />
<strong>Deutsche</strong> <strong>Bank</strong> 02 – Consolidated Financial Statements 351<br />
Financial <strong>Report</strong> 2010<br />
Additional Notes<br />
Financial <strong>Report</strong> 2010 Additional Notes<br />
42 – Shareholdings<br />
42 – Shareholdings<br />
Special Purpose Entities<br />
Special Purpose Entities<br />
Serial<br />
Share of<br />
capital<br />
No. Name of company Domicile of company Footnote in %<br />
1336 DB Platinum II Luxembourg 7 1.1<br />
1337 DB Platinum III Luxembourg 7 1.9<br />
1338 DB Platinum IV Luxembourg 7 4.5<br />
1339 DB Platinum V Luxembourg 7 100.0<br />
1340 DB Safe Harbour Investment Projects Limited London 100.0<br />
1341 DB Silver Finance (Luxembourg) S.à r.l. Luxembourg 100.0<br />
1342 DB Sylvester Funding Limited George Town 100.0<br />
1343 DB Venture Partners (Europe) 2000 LP St. Helier 20.0<br />
1344 db x-trackers Luxembourg 7 2.5<br />
1345 db x-trackers (Proprietary) Limited Johannesburg 100.0<br />
1346 db x-trackers Holdings (Proprietary) Limited Johannesburg 100.0<br />
1347 db x-trackers II Luxembourg 7 9.4<br />
1348 DB Xylophone Holdings Limited George Town 100.0<br />
1349 DB-New York Nuclear Uranium Fund Wilmington 100.0<br />
1350 DBARN Series 2007-AR3N1 Trust George Town<br />
1351 DBARN Series 2007-OA3N Trust George Town<br />
1352 DBARN Series 2007-OA4N Trust George Town<br />
1353 DBARN Series 2007-OA5N Trust George Town<br />
1354 DBVP Europe GP (Jersey) Limited St. Helier 20.0<br />
1355 De Heng Asset Management Company Limited Beijing<br />
1356 Deco 17 - Pan Europe 7 Limited Dublin<br />
1357 Decofinance S.A. Luxembourg 66.2<br />
1358 Defeased Loan Trust 2010-2 Wilmington<br />
1359 <strong>Deutsche</strong> Alt-A Series 2007-2 Wilmington<br />
1360 <strong>Deutsche</strong> Alt-A Series 2007-3 Wilmington<br />
1361 <strong>Deutsche</strong> Alt-A Series 2007-OA5 Wilmington<br />
1362 <strong>Deutsche</strong> Alt-A Series 2007-RS1 New York<br />
1363 <strong>Deutsche</strong> <strong>Bank</strong> Capital Finance LLC I Wilmington 100.0<br />
1364 <strong>Deutsche</strong> <strong>Bank</strong> Capital Finance Trust I Wilmington 0.0<br />
1365 <strong>Deutsche</strong> <strong>Bank</strong> Capital Funding LLC I Wilmington 100.0<br />
1366 <strong>Deutsche</strong> <strong>Bank</strong> Capital Funding LLC IV Wilmington 100.0<br />
1367 <strong>Deutsche</strong> <strong>Bank</strong> Capital Funding LLC IX Wilmington 100.0<br />
1368 <strong>Deutsche</strong> <strong>Bank</strong> Capital Funding LLC V Wilmington 100.0<br />
1369 <strong>Deutsche</strong> <strong>Bank</strong> Capital Funding LLC VI Wilmington 100.0<br />
1370 <strong>Deutsche</strong> <strong>Bank</strong> Capital Funding LLC VII Wilmington 100.0<br />
1371 <strong>Deutsche</strong> <strong>Bank</strong> Capital Funding LLC VIII Wilmington 100.0<br />
1372 <strong>Deutsche</strong> <strong>Bank</strong> Capital Funding LLC X Wilmington 100.0<br />
1373 <strong>Deutsche</strong> <strong>Bank</strong> Capital Funding LLC XI Wilmington 100.0<br />
1374 <strong>Deutsche</strong> <strong>Bank</strong> Capital Funding LLC XII Wilmington 100.0<br />
1375 <strong>Deutsche</strong> <strong>Bank</strong> Capital Funding LLC XIII Wilmington 100.0<br />
1376 <strong>Deutsche</strong> <strong>Bank</strong> Capital Funding LLC XIV Wilmington 100.0<br />
1377 <strong>Deutsche</strong> <strong>Bank</strong> Capital Funding LLC XV Wilmington 100.0<br />
1378 <strong>Deutsche</strong> <strong>Bank</strong> Capital Funding LLC XVI Wilmington 100.0<br />
1379 <strong>Deutsche</strong> <strong>Bank</strong> Capital Funding Trust I Newark 0.0<br />
1380 <strong>Deutsche</strong> <strong>Bank</strong> Capital Funding Trust IV Wilmington 0.0<br />
1381 <strong>Deutsche</strong> <strong>Bank</strong> Capital Funding Trust IX Wilmington 0.0<br />
1382 <strong>Deutsche</strong> <strong>Bank</strong> Capital Funding Trust V Wilmington 0.0<br />
1383 <strong>Deutsche</strong> <strong>Bank</strong> Capital Funding Trust VI Wilmington 0.0<br />
1384 <strong>Deutsche</strong> <strong>Bank</strong> Capital Funding Trust VII Wilmington 0.0<br />
1385 <strong>Deutsche</strong> <strong>Bank</strong> Capital Funding Trust VIII Wilmington 0.0<br />
1386 <strong>Deutsche</strong> <strong>Bank</strong> Capital Funding Trust X Wilmington 0.0<br />
1387 <strong>Deutsche</strong> <strong>Bank</strong> Capital Funding Trust XI Wilmington 0.0<br />
1388 <strong>Deutsche</strong> <strong>Bank</strong> Capital Funding Trust XII Wilmington 100.0<br />
1389 <strong>Deutsche</strong> <strong>Bank</strong> Capital Funding Trust XIII Wilmington 100.0<br />
1390 <strong>Deutsche</strong> <strong>Bank</strong> Capital Funding Trust XIV Wilmington 100.0<br />
1391 <strong>Deutsche</strong> <strong>Bank</strong> Capital Funding Trust XV Wilmington 100.0
<strong>Deutsche</strong> <strong>Bank</strong><br />
02 – Consolidated Financial Statements<br />
352<br />
<strong>Deutsche</strong> <strong>Bank</strong> 02 – Consolidated Financial Statements 352<br />
Financial <strong>Report</strong> 2010<br />
Additional Notes<br />
Financial <strong>Report</strong> 2010 Additional Notes<br />
42 – Shareholdings<br />
42 – Shareholdings<br />
Special Purpose Entities<br />
Special Purpose Entities<br />
Serial<br />
Share of<br />
capital<br />
No. Name of company Domicile of company Footnote in %<br />
1392 <strong>Deutsche</strong> <strong>Bank</strong> Capital Funding Trust XVI Wilmington 100.0<br />
1393 <strong>Deutsche</strong> <strong>Bank</strong> Capital LLC I Wilmington 100.0<br />
1394 <strong>Deutsche</strong> <strong>Bank</strong> Capital LLC II Wilmington 100.0<br />
1395 <strong>Deutsche</strong> <strong>Bank</strong> Capital LLC III Wilmington 100.0<br />
1396 <strong>Deutsche</strong> <strong>Bank</strong> Capital LLC IV Wilmington 100.0<br />
1397 <strong>Deutsche</strong> <strong>Bank</strong> Capital LLC V Wilmington 100.0<br />
1398 <strong>Deutsche</strong> <strong>Bank</strong> Capital Trust I Newark 0.0<br />
1399 <strong>Deutsche</strong> <strong>Bank</strong> Capital Trust II Newark 0.0<br />
1400 <strong>Deutsche</strong> <strong>Bank</strong> Capital Trust III Newark 0.0<br />
1401 <strong>Deutsche</strong> <strong>Bank</strong> Capital Trust IV Newark 0.0<br />
1402 <strong>Deutsche</strong> <strong>Bank</strong> Capital Trust V Newark 0.0<br />
1403 <strong>Deutsche</strong> <strong>Bank</strong> Contingent Capital LLC I Wilmington 100.0<br />
1404 <strong>Deutsche</strong> <strong>Bank</strong> Contingent Capital LLC II Wilmington 100.0<br />
1405 <strong>Deutsche</strong> <strong>Bank</strong> Contingent Capital LLC III Wilmington 100.0<br />
1406 <strong>Deutsche</strong> <strong>Bank</strong> Contingent Capital LLC IV Wilmington 100.0<br />
1407 <strong>Deutsche</strong> <strong>Bank</strong> Contingent Capital LLC V Wilmington 100.0<br />
1408 <strong>Deutsche</strong> <strong>Bank</strong> Contingent Capital Trust I Wilmington 0.0<br />
1409 <strong>Deutsche</strong> <strong>Bank</strong> Contingent Capital Trust II Wilmington 0.0<br />
1410 <strong>Deutsche</strong> <strong>Bank</strong> Contingent Capital Trust III Wilmington 0.0<br />
1411 <strong>Deutsche</strong> <strong>Bank</strong> Contingent Capital Trust IV Wilmington 0.0<br />
1412 <strong>Deutsche</strong> <strong>Bank</strong> Contingent Capital Trust V Wilmington 0.0<br />
1413 <strong>Deutsche</strong> <strong>Bank</strong> SPEARs/LIFERs Trusts (DB Series) New York 8<br />
1414 <strong>Deutsche</strong> Beta Finance GmbH Frankfurt 100.0<br />
1415 <strong>Deutsche</strong> Gesellschaft für Immobilien-Leasing mit beschränkter Haftung Duesseldorf 100.0<br />
1416 <strong>Deutsche</strong> GUO Mao Investments (Netherlands) B.V. Amsterdam 100.0<br />
1417 <strong>Deutsche</strong> Mortgage Securities, Inc. Series 2007-RS1 New York<br />
1418 <strong>Deutsche</strong> Mortgage Securities, Inc. Series 2007-RS3 New York<br />
1419 <strong>Deutsche</strong> Mortgage Securities, Inc. Series 2007-RS4 New York<br />
1420 <strong>Deutsche</strong> Mortgage Securities, Inc. Series 2007-RS5 New York<br />
1421 <strong>Deutsche</strong> Mortgage Securities, Inc. Series 2007-RS6 New York<br />
1422 <strong>Deutsche</strong> Mortgage Securities, Inc. Series 2007-RS7 New York<br />
1423 <strong>Deutsche</strong> Mortgage Securities, Inc. Series 2007-RS8 New York<br />
1424 <strong>Deutsche</strong> Mortgage Securities, Inc. Series 2008-RS1 New York<br />
1425 <strong>Deutsche</strong> Mortgage Securities, Inc. Series 2009-RS4 Santa Ana<br />
1426 <strong>Deutsche</strong> OBU Pty Limited Sydney 100.0<br />
1427 <strong>Deutsche</strong> Postbank Funding LLC I Wilmington 100.0<br />
1428 <strong>Deutsche</strong> Postbank Funding LLC II Wilmington 100.0<br />
1429 <strong>Deutsche</strong> Postbank Funding LLC III Wilmington 100.0<br />
1430 <strong>Deutsche</strong> Postbank Funding LLC IV Wilmington 100.0<br />
1431 <strong>Deutsche</strong> Postbank Funding Trust I Wilmington 100.0<br />
1432 <strong>Deutsche</strong> Postbank Funding Trust II Wilmington 100.0<br />
1433 <strong>Deutsche</strong> Postbank Funding Trust III Wilmington 100.0<br />
1434 <strong>Deutsche</strong> Postbank Funding Trust IV Wilmington 100.0<br />
1435 DI 2 Y.K. Tokyo 100.0<br />
1436 DI Investments Corporation Y.K. Tokyo 100.0<br />
1437 DIL Beteiligungs-Stiftung Duesseldorf<br />
1438 DIL Europa-Beteiligungsgesellschaft mbH i.L. Duesseldorf 100.0<br />
1439 DIL Fonds-Beteiligungsgesellschaft mbH Duesseldorf 100.0<br />
1440 DONARUM Holding GmbH Duesseldorf 50.0<br />
1441 DREIUNDZWANZIGSTE PAXAS Treuhand- und Beteiligungsgesellschaft mbH Duesseldorf 50.0<br />
1442 DREIZEHNTE PAXAS Treuhand- und Beteiligungsgesellschaft mbH Duesseldorf 50.0<br />
1443 DRITTE Fonds-Beteiligungsgesellschaft mbH Duesseldorf 50.0<br />
1444 DRITTE PAXAS Treuhand- und Beteiligungsgesellschaft mbH Duesseldorf 50.0<br />
1445 Dusk LLC Wilmington 100.0<br />
1446 DWS Bond Flexible Luxembourg 100.0<br />
1447 DWS Institutional Money plus Luxembourg
<strong>Deutsche</strong> <strong>Bank</strong><br />
02 – Consolidated Financial Statements<br />
353<br />
<strong>Deutsche</strong> <strong>Bank</strong> 02 – Consolidated Financial Statements 353<br />
Financial <strong>Report</strong> 2010<br />
Additional Notes<br />
Financial <strong>Report</strong> 2010 Additional Notes<br />
42 – Shareholdings<br />
42 – Shareholdings<br />
Special Purpose Entities<br />
Special Purpose Entities<br />
Serial<br />
Share of<br />
capital<br />
No. Name of company Domicile of company Footnote in %<br />
1448 DWS Institutional USD Money plus Luxembourg<br />
1449 Dyna Holding GmbH Eschborn 100.0<br />
1450 Earls Eight Limited George Town 7<br />
1451 EARLS Trading Limited George Town<br />
1452 Earls Twelve Limited George Town 7<br />
1453 1221 East Denny Owner, LLC Wilmington<br />
1454 EBEMUS Beteiligungsgesellschaft mbH Schoenefeld<br />
1455 EGOM Beteiligungsgesellschaft mbH Schoenefeld<br />
1456 EINATUS Beteiligungsgesellschaft mbH Schoenefeld 10.0<br />
1457 EINUNDZWANZIGSTE PAXAS Treuhand- und Beteiligungsgesellschaft mbH Duesseldorf 50.0<br />
1458 Eirles Four Limited Dublin 7<br />
1459 Eirles Three Limited Dublin 7<br />
1460 Eirles Two Limited Dublin 7<br />
1461 ELC Logistik-Centrum Verwaltungs-GmbH Erfurt 50.0<br />
1462 ELFTE PAXAS Treuhand- und Beteiligungsgesellschaft mbH Duesseldorf 50.0<br />
1463 Elmo Funding GmbH Eschborn 100.0<br />
1464 Elmo Leasing Achte GmbH Eschborn 100.0<br />
1465 Elmo Leasing Dreiundzwanzigste GmbH Eschborn 100.0<br />
1466 Elmo Leasing Dreizehnte GmbH Eschborn 100.0<br />
1467 Elmo Leasing Dritte GmbH Eschborn 100.0<br />
1468 Elmo Leasing Elfte GmbH Eschborn 100.0<br />
1469 Elmo Leasing Neunte GmbH Eschborn 100.0<br />
1470 Elmo Leasing Sechste GmbH Eschborn 100.0<br />
1471 Elmo Leasing Siebte GmbH Eschborn 100.0<br />
1472 Elmo Leasing Vierzehnte GmbH Eschborn 100.0<br />
1473 Elmo Leasing Zwölfte GmbH Eschborn 100.0<br />
1474 Emerging Markets Capital Protected Investments Ltd George Town 7<br />
1475 EOP Manager, LLC Wilmington 100.0<br />
1476 EOP Pool 1 Manager, LLC Wilmington 100.0<br />
1477 Equinox Credit Funding Public Limited Company Dublin 7<br />
1478 Equipment Management Services LLC Wilmington 100.0<br />
1479 Erste Frankfurter Hoist GmbH Frankfurt 100.0<br />
1480 Escoyla Limited Dublin<br />
1481 Eurohome (Italy) Mortgages S.r.l. Conegliano<br />
1482 Fandaro Limited Dublin<br />
1483 Farsala Investment SRL Bucharest<br />
1484 Film Asset Securitization Trust 2009-1 New York<br />
1485 Fortis Flexi IV - Bond Medium Term RMB Luxembourg 100.0<br />
1486 FÜNFTE Fonds-Beteiligungsgesellschaft mbH Duesseldorf 50.0<br />
1487 FÜNFTE PAXAS Treuhand- und Beteiligungsgesellschaft mbH Duesseldorf 50.0<br />
1488 FÜNFUNDZWANZIGSTE PAXAS Treuhand- und Beteiligungsgesellschaft mbH Duesseldorf 50.0<br />
1489 FÜNFZEHNTE PAXAS Treuhand- und Beteiligungsgesellschaft mbH Duesseldorf 50.0<br />
1490 G.O. III Luxembourg Oxford S.à r.l. Luxembourg<br />
1491 GC Re Hamilton 7<br />
1492 GEM ERI Limited George Town<br />
1493 Gemini Securitization Corp., LLC Boston<br />
1494 Gestione Partecipazioni S.p.A. Milan 100.0<br />
1495 GEWE-Falkenberg Beteiligungsgesellschaft mbH Duesseldorf 50.0<br />
1496 Global Diversified Investment Grade Private Trust Toronto 100.0<br />
1497 Global Kamala, S.L. Madrid 100.0<br />
1498 Global Opportunities Co-Investment Feeder, LLC Wilmington<br />
1499 Global Opportunities Co-Investment, LLC Wilmington<br />
1500 GMS Global Investment Strategy Fund Frankfurt 100.0<br />
1501 Godo Kaisha Jupiter Two Tokyo<br />
1502 Godo Kaisha Mars Capital Tokyo 50.0<br />
1503 GOPLA Beteiligungsgesellschaft mbH Hanover 38.6
<strong>Deutsche</strong> <strong>Bank</strong><br />
02 – Consolidated Financial Statements<br />
354<br />
<strong>Deutsche</strong> <strong>Bank</strong> 02 – Consolidated Financial Statements 354<br />
Financial <strong>Report</strong> 2010<br />
Additional Notes<br />
Financial <strong>Report</strong> 2010 Additional Notes<br />
42 – Shareholdings<br />
42 – Shareholdings<br />
Special Purpose Entities<br />
Special Purpose Entities<br />
Serial<br />
Share of<br />
capital<br />
No. Name of company Domicile of company Footnote in %<br />
1504 Gottex ABI II Fund Limited George Town<br />
1505 HABILIS Grundstücks-Vermietungsgesellschaft mbH & Co. Objekt Solingen KG Duesseldorf<br />
1506 Hamildak Limited Dublin<br />
1507 Harbour Finance Limited Dublin<br />
1508 Hatsushima Godo Kaisha Tokyo 50.0<br />
1509 HAWSER Trust Series 2007-1 Santa Ana 7<br />
1510 Herodotus Limited George Town 5 0.0<br />
1511 HESTA Grundstücks-Vermietungsgesellschaft mbH & Co. Objekt Frankfurt KG Duesseldorf<br />
1512 Hotel Majestic LLC Wilmington 100.0<br />
1513 HSBC Funding (Deutschland) GmbH Bad Soden am Taunus 14.4<br />
1514 Huron Leasing, LLC Wilmington 98.5<br />
1515 IKB Leasing Limited Partnership London 100.0<br />
1516 ILV Anlagen Vermietungsgesellschaft mbH Duesseldorf<br />
1517 Immobilien-Vermietungsgesellschaft von Quistorp GmbH & Co. Objekt Altlandsberg KG Duesseldorf<br />
1518 Infigate GmbH i.K. Essen 48.0<br />
1519 Infrastructure Holdings (Cayman) SPC George Town<br />
1520 IQ-Markets SA Luxembourg<br />
1521 IRADO Funding, S.à r.l Luxembourg 100.0<br />
1522 IRADO Holding Limited George Town 100.0<br />
1523 Ital Gas Storage S.r.l. Rome 60.0<br />
1524 IVAF (Jersey) Limited St. Helier<br />
1525 Ixion Public Limited Company Dublin 7<br />
1526 Izumo Capital YK Tokyo 100.0<br />
1527 Japan Asset Eleven Holding Tokutei Mokuteki Kaisha Tokyo<br />
1528 Kelsey Street LLC Wilmington 100.0<br />
1529 Kelvivo Limited Dublin<br />
1530 Kingfisher (Ontario) LP Toronto 100.0<br />
1531 Kingfisher Canada Holdings LLC Wilmington 100.0<br />
1532 Kingfisher Holdings I (Nova Scotia) ULC Halifax 100.0<br />
1533 Kingfisher Holdings II (Nova Scotia) ULC Halifax 100.0<br />
1534 Kingfisher Holdings LLC Wilmington 100.0<br />
1535 KOMPASS 3 Beteiligungsgesellschaft mbH Duesseldorf 50.0<br />
1536 KOMPASS 3 Erste Beteiligungsgesellschaft mbH & Co. Euro KG Duesseldorf<br />
1537 KOMPASS 3 Zweite Beteiligungsgesellschaft mbH & Co. USD KG Duesseldorf<br />
1538 Kradavimd UK Lease Holdings Limited London 100.0<br />
1539 La Fayette Dedicated Basket Ltd. Road Town<br />
1540 Labuan (Cranfield) Aircraft Leasing Limited Labuan<br />
1541 Lambourn Spólka z ograniczona odpowiedzialnoscia Warsaw 100.0<br />
1542 LARS Grundstücks-Vermietungsgesellschaft mbH & Co. Objekt Hagen KG Duesseldorf<br />
1543 Lebus L.P. George Town 100.0<br />
1544 LECTIO Grundstücks-Vermietungsgesellschaft mbH & Co. Objekt Weimar KG Duesseldorf<br />
1545 Legacy BCC Receivables, LLC Wilmington 100.0<br />
1546 Leo Consumo 1 S.r.l. Conegliano<br />
1547 Leo Consumo 2 S.r.l. Conegliano<br />
1548 Leonardo Charitable 1 LLC Wilmington 9.9<br />
1549 Linker Finance plc Dublin 7<br />
1550 Luscina Limited Dublin<br />
1551 Maestrale Projects (Holding) S.A. Luxembourg 49.7<br />
1552 Maher 1210 Corbin LLC Wilmington 100.0<br />
1553 Maher Chassis Management LLC Wilmington 100.0<br />
1554 Maher Terminals Holding Corp. Toronto 100.0<br />
1555 Maher Terminals LLC Wilmington 100.0<br />
1556 Maher Terminals Logistics Systems LLC Wilmington 100.0<br />
1557 Maher Terminals USA, LLC Wilmington 100.0<br />
1558 MAN Investments SAC Limited Hamilton<br />
1559 Maritime Indemnity Insurance Co Hamilton 100.0
<strong>Deutsche</strong> <strong>Bank</strong><br />
02 – Consolidated Financial Statements<br />
355<br />
<strong>Deutsche</strong> <strong>Bank</strong> 02 – Consolidated Financial Statements 355<br />
Financial <strong>Report</strong> 2010<br />
Additional Notes<br />
Financial <strong>Report</strong> 2010 Additional Notes<br />
42 – Shareholdings<br />
42 – Shareholdings<br />
Special Purpose Entities<br />
Special Purpose Entities<br />
Serial<br />
Share of<br />
capital<br />
No. Name of company Domicile of company Footnote in %<br />
1560 Mars Investment Trust II New York 100.0<br />
1561 Mars Investment Trust III New York 100.0<br />
1562 Master Aggregation Trust Wilmington<br />
1563 Maxima Alpha Bomaral Limited St. Helier<br />
1564 Mazuma Capital Funds Limited Hamilton 7<br />
1565 MEFIS Beteiligungsgesellschaft mbH Frankfurt 43.0<br />
1566 Merlin I George Town<br />
1567 Merlin II George Town<br />
1568 Merlin XI George Town<br />
1569 Micro-E Finance S.r.l. Rome<br />
1570 Mikrofinanz Beteiligungsgesellschaft ZWEI GmbH i.L. Duesseldorf 50.0<br />
1571 MIRABILIS Grundstücks-Vermietungsgesellschaft mbH & Co. Objekt Berching KG Duesseldorf 7<br />
1572 Montage Funding LLC Dover<br />
1573 Monterey Funding LLC Wilmington<br />
1574 Moon Leasing Limited London 100.0<br />
1575 MortgageIT Capital Trust I Newark 3.0<br />
1576 MortgageIT Capital Trust III Wilmington 3.0<br />
1577 MortgageIT Trust 2004-1 New York<br />
1578 MortgageIT Trust 2005-1 New York<br />
1579 MortgageIT Trust 2005-2 New York<br />
1580 Motion Picture Productions One GmbH & Co. KG Frankfurt 100.0<br />
1581 Mountain Recovery Fund I Y.K. Tokyo 100.0<br />
1582 MPP Beteiligungsgesellschaft mbH Frankfurt 100.0<br />
1583 MRF2 Y.K. Tokyo 100.0<br />
1584 MSN 22952 Delaware Statutory Trust Wilmington<br />
1585 MSN 22953 Delaware Statutory Trust Wilmington<br />
1586 MSN 22955 Delaware Statutory Trust Wilmington<br />
1587 MSN 22957 Delaware Statutory Trust Wilmington<br />
1588 MSN 23316 Delaware Statutory Trust Wilmington<br />
1589 MSN 23317 Delaware Statutory Trust Wilmington<br />
1590 MSN 23318 Delaware Statutory Trust Wilmington<br />
1591 MSN 23319 Delaware Statutory Trust Wilmington<br />
1592 MSTC Y.K. Tokyo 100.0<br />
1593 Muni Structured Products Collapsible TOB Trust New York<br />
1594 Muni Structured Products Credit Enhanced TOB Trust New York<br />
1595 Nanba PJ Tokutei Mokuteki Kaisha Tokyo<br />
1596 Nantucket Funding Corp., LLC Wilmington<br />
1597 Nashville Capital Yugen Kaisha Tokyo<br />
1598 NBG Grundstücks-Vermietungsgesellschaft mbH Duesseldorf 50.0<br />
1599 NC Finance Trust 2003-2 New York<br />
1600 NCW Holding Inc. Vancouver 100.0<br />
1601 NeoAnemos S.r.l. Milan<br />
1602 Netron Investment SRL Bucharest<br />
1603 NEUNTE PAXAS Treuhand- und Beteiligungsgesellschaft mbH Duesseldorf 50.0<br />
1604 NEUNZEHNTE PAXAS Treuhand- und Beteiligungsgesellschaft mbH Duesseldorf 50.0<br />
1605 Nevada Mezz 1 LLC Wilmington 100.0<br />
1606 Nevada Parent 1 LLC Wilmington 100.0<br />
1607 Nevada Property 1 LLC Wilmington 100.0<br />
1608 Nevada Restaurant Venture 1 LLC Wilmington 100.0<br />
1609 Nevada Retail Venture 1 LLC Wilmington 100.0<br />
1610 New Hatsushima Godo Kaisha Tokyo 50.0<br />
1611 NewLands Capital Corp Limited Hamilton<br />
1612 NewLands Financial Limited Hamilton<br />
1613 NewLands Holdings Limited Hamilton<br />
1614 Newport Funding Corp. Charlotte<br />
1615 Nexus Infrastruktur Beteiligungsgesellschaft mbH Duesseldorf 50.0
<strong>Deutsche</strong> <strong>Bank</strong><br />
02 – Consolidated Financial Statements<br />
356<br />
<strong>Deutsche</strong> <strong>Bank</strong> 02 – Consolidated Financial Statements 356<br />
Financial <strong>Report</strong> 2010<br />
Additional Notes<br />
Financial <strong>Report</strong> 2010 Additional Notes<br />
42 – Shareholdings<br />
42 – Shareholdings<br />
Special Purpose Entities<br />
Special Purpose Entities<br />
Serial<br />
Share of<br />
capital<br />
No. Name of company Domicile of company Footnote in %<br />
1616 Nineco Leasing Limited London 100.0<br />
1617 NOFA Grundstücks-Vermietungsgesellschaft mbH Duesseldorf 50.0<br />
1618 North Las Vegas Property LLC Wilmington 100.0<br />
1619 Norvadano Limited Dublin<br />
1620 Novelties Distribution LLC Wilmington 100.0<br />
1621 NYLIMAC 2010-SS-1, LLC Wilmington 100.0<br />
1622 Odin Mortgages Limited London<br />
1623 Okanagan Funding Trust Toronto<br />
1624 Oona Solutions, Fonds Commun de Placement Luxembourg 7<br />
1625 OP Bonds Global Opportunities T Cologne 30.0<br />
1626 OPAL Luxembourg 7<br />
1627 Optima Emerging Markets Fund Limited Hamilton<br />
1628 Option One Mortgage Loan Trust 2002-4 New York<br />
1629 Opus One Private Real Estate Fund Seoul<br />
1630 Oran Limited George Town<br />
1631 Ornegin Investment SRL Bucharest<br />
1632 OTM Capital GK Tokyo 100.0<br />
1633 Owner Trust MSN 199 Salt Lake City<br />
1634 Owner Trust MSN 23336 Salt Lake City<br />
1635 Owner Trust MSN 23337 Salt Lake City<br />
1636 Owner Trust MSN 23338 Salt Lake City<br />
1637 Owner Trust MSN 23344 Salt Lake City<br />
1638 Owner Trust MSN 23887 Salt Lake City<br />
1639 Owner Trust MSN 240 Salt Lake City<br />
1640 Owner Trust MSN 241 Salt Lake City<br />
1641 Owner Trust MSN 24452 Salt Lake City<br />
1642 Owner Trust MSN 24453 Salt Lake City<br />
1643 Owner Trust MSN 24788 Salt Lake City<br />
1644 Owner Trust MSN 25120 Salt Lake City<br />
1645 Owner Trust MSN 25259 Salt Lake City<br />
1646 Owner Trust MSN 25884 Salt Lake City<br />
1647 Owner Trust MSN 264 Salt Lake City<br />
1648 Owner Trust MSN 27833 Salt Lake City<br />
1649 Owner Trust MSN 87 Salt Lake City<br />
1650 Owner Trust MSN 88 Salt Lake City<br />
1651 Oystermouth Holding Limited Nicosia<br />
1652 PADEM Grundstücks-Vermietungsgesellschaft mbH Duesseldorf 50.0<br />
1653 PADOS Grundstücks-Vermietungsgesellschaft mbH Duesseldorf 50.0<br />
1654 PAGUS Beteiligungsgesellschaft mbH Duesseldorf 50.0<br />
1655 PALDO Grundstücks-Vermietungsgesellschaft mbH Duesseldorf 50.0<br />
1656 Palladium Securities 1 S.A. Luxembourg<br />
1657 PALLO Grundstücks-Vermietungsgesellschaft mbH Duesseldorf 50.0<br />
1658 PALLO Grundstücks-Vermietungsgesellschaft mbH & Co. Objekt Seniorenresidenzen KG Duesseldorf<br />
1659 PanAsia Funds Investments Ltd. George Town 7<br />
1660 PANIS Grundstücks-Vermietungsgesellschaft mbH Duesseldorf 50.0<br />
1661 PANTIS Beteiligungsgesellschaft mbH i.L. Duesseldorf 50.0<br />
1662 PANTUR Grundstücks-Vermietungsgesellschaft mbH Duesseldorf 50.0<br />
1663 PARTS Student Loan Trust 2007-CT2 Wilmington 100.0<br />
1664 PAXAS Treuhand- und Beteiligungsgesellschaft mbH Duesseldorf 50.0<br />
1665 PB Consumer 2008-1 GmbH Frankfurt<br />
1666 PB Consumer 2009-1 GmbH Frankfurt<br />
1667 PEDIS Grundstücks-Vermietungsgesellschaft mbH Duesseldorf 50.0<br />
1668 PEDIS Grundstücks-Vermietungsgesellschaft mbH & Co. Objekt Briloner KG Duesseldorf<br />
1669 PEDUM Beteiligungsgesellschaft mbH Duesseldorf 50.0<br />
1670 PEIF II S.C.A. Luxembourg 99.9<br />
1671 PENDIS Grundstücks-Vermietungsgesellschaft mbH Duesseldorf 50.0
<strong>Deutsche</strong> <strong>Bank</strong><br />
02 – Consolidated Financial Statements<br />
357<br />
<strong>Deutsche</strong> <strong>Bank</strong> 02 – Consolidated Financial Statements 357<br />
Financial <strong>Report</strong> 2010<br />
Additional Notes<br />
Financial <strong>Report</strong> 2010 Additional Notes<br />
42 – Shareholdings<br />
42 – Shareholdings<br />
Special Purpose Entities<br />
Special Purpose Entities<br />
Serial<br />
Share of<br />
capital<br />
No. Name of company Domicile of company Footnote in %<br />
1672 PENTOS Grundstücks-Vermietungsgesellschaft mbH Duesseldorf 50.0<br />
1673 PENTUM Beteiligungsgesellschaft mbH Duesseldorf 50.0<br />
1674 PERGOS Beteiligungsgesellschaft mbH Duesseldorf 50.0<br />
1675 PERGUM Grundstücks-Vermietungsgesellschaft mbH Duesseldorf 50.0<br />
1676 PERLIT Mobilien-Vermietungsgesellschaft mbH Duesseldorf 50.0<br />
1677 PERLU Grundstücks-Vermietungsgesellschaft mbH Duesseldorf 50.0<br />
1678 PERNIO Grundstücks-Vermietungsgesellschaft mbH Duesseldorf 50.0<br />
1679 Pertwee Leasing Limited Partnership London 100.0<br />
1680 Peruda Leasing Limited London 100.0<br />
1681 Perus 1 S.à r.l. Luxembourg<br />
1682 Perus 2 S.à r.l. Luxembourg<br />
1683 Perus Investments S.à r.l. Luxembourg<br />
1684 PERXIS Beteiligungsgesellschaft mbH Duesseldorf 50.0<br />
1685 PETA Grundstücks-Vermietungsgesellschaft mbH Duesseldorf 50.0<br />
1686 Picture Financial Funding (No.2) Limited Newport<br />
1687 Picture Financial Jersey (No.2) Limited St. Helier<br />
1688 Picture Home Loans (No.2) Limited London<br />
1689 PONTUS Grundstücks-Vermietungsgesellschaft mbH Duesseldorf 50.0<br />
1690 Port Elizabeth Holdings LLC Wilmington 100.0<br />
1691 PRADUM Beteiligungsgesellschaft mbH Duesseldorf 50.0<br />
1692 PRASEM Beteiligungsgesellschaft mbH Duesseldorf 50.0<br />
1693 PRATES Grundstücks-Vermietungsgesellschaft mbH Schoenefeld 50.0<br />
1694 Prince Rupert Luxembourg S.à r.l. Senningerberg 100.0<br />
1695 PRISON Grundstücks-Vermietungsgesellschaft mbH Schoenefeld 50.0<br />
1696 Private Equity Invest Beteiligungs GmbH Duesseldorf 50.0<br />
1697 Private Equity Life Sciences Beteiligungsgesellschaft mbH Duesseldorf 50.0<br />
1698 PROVIDE Domicile 2009-1 GmbH Frankfurt<br />
1699 PUDU Grundstücks-Vermietungsgesellschaft mbH Duesseldorf 50.0<br />
1700 PUKU Grundstücks-Vermietungsgesellschaft mbH Duesseldorf 50.0<br />
1701 PUKU Grundstücks-Vermietungsgesellschaft mbH & Co. Objekt Velbert KG Duesseldorf<br />
1702 PURIM Grundstücks-Vermietungsgesellschaft mbH Duesseldorf 50.0<br />
1703 PURIM Grundstücks-Vermietungsgesellschaft mbH & Co. Objekt Burscheid KG Duesseldorf<br />
1704 QUANTIS Grundstücks-Vermietungsgesellschaft mbH Schoenefeld 50.0<br />
1705 Quartz No. 1 S.A. Luxembourg 5 0.0<br />
1706 QUELLUM Grundstücks-Vermietungsgesellschaft mbH Duesseldorf 50.0<br />
1707 QUOTAS Grundstücks-Vermietungsgesellschaft mbH Duesseldorf 50.0<br />
1708 R/H Hawthorne Plaza Associates, LLC Wilmington<br />
1709 Reference Capital Investments Limited London 100.0<br />
1710 Regal Limited George Town 7<br />
1711 Residential Mortgage Funding Trust Toronto<br />
1712 Rhein - Main Securitisation Limited St. Helier<br />
1713 Rhein Main Sussex Ltd Dublin<br />
1714 Rhein-Main No. 12 Limited St. Helier<br />
1715 Rhein-Main No. 14 Limited St. Helier<br />
1716 Rhein-Main No. 5 Mortgage Purchase Limited St. Helier<br />
1717 Rheingold No.1 Limited St. Helier<br />
1718 Rheingold No.10 Limited St. Helier<br />
1719 Rheingold No.14 (Jersey) Limited St. Helier<br />
1720 Rheingold No.9 Limited St. Helier<br />
1721 Rheingold Securitisation Limited St. Helier<br />
1722 RHOEN 2008-1 GmbH Frankfurt<br />
1723 Riverside Funding LLC Dover<br />
1724 RM Ayr Delaware LLC Dover<br />
1725 RM Ayr Limited Dublin<br />
1726 RM Cheshire Delaware LLC Dover<br />
1727 RM Cheshire Limited Dublin
<strong>Deutsche</strong> <strong>Bank</strong><br />
02 – Consolidated Financial Statements<br />
358<br />
<strong>Deutsche</strong> <strong>Bank</strong> 02 – Consolidated Financial Statements 358<br />
Financial <strong>Report</strong> 2010<br />
Additional Notes<br />
Financial <strong>Report</strong> 2010 Additional Notes<br />
42 – Shareholdings<br />
42 – Shareholdings<br />
Special Purpose Entities<br />
Special Purpose Entities<br />
Serial<br />
Share of<br />
capital<br />
No. Name of company Domicile of company Footnote in %<br />
1728 RM Chestnut Delaware LLC Dover<br />
1729 RM Chestnut Limited Dublin<br />
1730 RM Delaware Multi-Asset LLC Wilmington<br />
1731 RM Delaware Triple-A LLC Dover<br />
1732 RM Fife Delaware LLC Dover<br />
1733 RM Fife Limited Dublin<br />
1734 RM Multi-Asset Limited Dublin<br />
1735 RM Sussex Delaware LLC Dover<br />
1736 RM Triple-A Limited Dublin<br />
1737 RREEF G.O. III Luxembourg One S.à r.l. Luxembourg<br />
1738 RREEF G.O. III Malta Limited Valletta<br />
1739 RREEF Global Opportunities Fund III, LLC Wilmington<br />
1740 RREEF GO III Mauritius One Limited Port Louis<br />
1741 RREEF GO III Mauritius Two Limited Port Louis<br />
1742 RREEF North American Infrastructure Fund A, L.P. Wilmington 99.9<br />
1743 RREEF North American Infrastructure Fund B, L.P. Wilmington 99.9<br />
1744 SABIS Grundstücks-Vermietungsgesellschaft mbH Duesseldorf 50.0<br />
1745 SABRE Securitisation Limited Sydney<br />
1746 SAITA Grundstücks-Vermietungsgesellschaft mbH i.L. Duesseldorf 60.0<br />
1747 Sajima Godo Kaisha Tokyo<br />
1748 SALIX Grundstücks-Vermietungsgesellschaft mbH Duesseldorf 50.0<br />
1749 SALUS Grundstücks-Vermietungsgesellschaft mbH Duesseldorf 50.0<br />
1750 SALUS Grundstücks-Vermietungsgesellschaft mbH & Co. Objekt Brandenburg KG Duesseldorf<br />
1751 SALUS Grundstücks-Vermietungsgesellschaft mbH & Co. Objekt Dresden KG Duesseldorf 58.5<br />
1752 SALUS Grundstücks-Vermietungsgesellschaft mbH & Co. Objekt Schwarzheide KG Duesseldorf<br />
1753 SANCTOR Grundstücks-Vermietungsgesellschaft mbH Duesseldorf 50.0<br />
1754 SANCTOR Grundstücks-Vermietungsgesellschaft mbH & Co. Objekt Nürnberg KG Duesseldorf<br />
1755 SANDIX Grundstücks-Vermietungsgesellschaft mbH Duesseldorf 50.0<br />
1756 SANDIX Grundstücks-Vermietungsgesellschaft mbH & Co. Objekt Hafen KG Duesseldorf<br />
1757 SANO Grundstücks-Vermietungsgesellschaft mbH Duesseldorf 50.0<br />
1758 Saratoga Funding Corp., LLC Wilmington<br />
1759 SARIO Grundstücks-Vermietungsgesellschaft mbH Duesseldorf 50.0<br />
1760 SATINA Mobilien-Vermietungsgesellschaft mbH Duesseldorf 50.0<br />
1761 SCANDO Grundstücks-Vermietungsgesellschaft mbH Duesseldorf 50.0<br />
1762 SCANDO Grundstücks-Vermietungsgesellschaft mbH & Co. Objekt Datteln KG Duesseldorf<br />
1763 SCANDO Grundstücks-Vermietungsgesellschaft mbH & Co. Objekt Eisenach KG Duesseldorf 7<br />
1764 SCANDO Grundstücks-Vermietungsgesellschaft mbH & Co. Objekt Iserlohn KG Duesseldorf<br />
1765 SCANDO Grundstücks-Vermietungsgesellschaft mbH & Co. Objekt Osnabrück KG Duesseldorf<br />
1766 SCANDO Grundstücks-Vermietungsgesellschaft mbH & Co. Objekt Siekmann KG Duesseldorf<br />
1767 SCHEDA Grundstücks-Vermietungsgesellschaft mbH Duesseldorf 50.0<br />
1768 Schiffsbetriebsgesellschaft FINNA mbH Hamburg 100.0<br />
1769 Schiffsbetriebsgesellschaft GRIMA mbH Hamburg 100.0<br />
1770 SCITOR Grundstücks-Vermietungsgesellschaft mbH Duesseldorf 50.0<br />
1771 SCLF Godo Kaisha Tokyo<br />
1772 Scottish Widows Investment Partnership Investment Funds ICVC - European Fund London 61.5<br />
1773 Scottish Widows Investment Partnership Investment Funds ICVC - Global Fund London 50.7<br />
1774 Scottish Widows Investment Partnership Investment Funds ICVC - Japanese Fund London 53.0<br />
1775 Scottish Widows Tracker and Specialist Investment Funds ICVC - American Smaller Cos<br />
Fund<br />
London 88.5<br />
1776 SCUDO Grundstücks-Vermietungsgesellschaft mbH Duesseldorf 100.0<br />
1777 SCUDO Grundstücks-Vermietungsgesellschaft mbH & Co. Objekt Kleine Alexanderstraße KG Duesseldorf 95.0<br />
1778 SECHSTE Fonds-Beteiligungsgesellschaft mbH Duesseldorf 50.0<br />
1779 SECHSTE PAXAS Treuhand- und Beteiligungsgesellschaft mbH Duesseldorf 50.0<br />
1780 SECHSUNDZWANZIGSTE PAXAS Treuhand- und Beteiligungsgesellschaft mbH Duesseldorf<br />
1781 SECHZEHNTE PAXAS Treuhand- und Beteiligungsgesellschaft mbH Duesseldorf 50.0<br />
1782 SEDO Grundstücks-Vermietungsgesellschaft mbH Duesseldorf 100.0
<strong>Deutsche</strong> <strong>Bank</strong><br />
02 – Consolidated Financial Statements<br />
359<br />
<strong>Deutsche</strong> <strong>Bank</strong> 02 – Consolidated Financial Statements 359<br />
Financial <strong>Report</strong> 2010<br />
Additional Notes<br />
Financial <strong>Report</strong> 2010 Additional Notes<br />
42 – Shareholdings<br />
42 – Shareholdings<br />
Special Purpose Entities<br />
Special Purpose Entities<br />
Serial<br />
Share of<br />
capital<br />
No. Name of company Domicile of company Footnote in %<br />
1783 Sedona Capital Funding Corp., LLC Charlotte<br />
1784 SEGES Grundstücks-Vermietungsgesellschaft mbH Duesseldorf 50.0<br />
1785 SEGU Grundstücks-Vermietungsgesellschaft mbH Duesseldorf 50.0<br />
1786 SELEKTA Grundstücksverwaltungsgesellschaft mbH Duesseldorf 50.0<br />
1787 SENA Grundstücks-Vermietungsgesellschaft mbH Duesseldorf 50.0<br />
1788 SERICA Grundstücks-Vermietungsgesellschaft mbH Duesseldorf 50.0<br />
1789 SERICA Grundstücks-Vermietungsgesellschaft mbH & Co. Objekt Frankfurt KG Duesseldorf<br />
1790 SGP Capital YK Tokyo 50.0<br />
1791 Sharps CDO II Limited New York<br />
1792 SIDA Grundstücks-Vermietungsgesellschaft mbH Duesseldorf 50.0<br />
1793 SIEBENUNDZWANZIGSTE PAXAS Treuhand- und Beteiligungsgesellschaft mbH Duesseldorf<br />
1794 SIEBTE PAXAS Treuhand- und Beteiligungsgesellschaft mbH Duesseldorf 50.0<br />
1795 SIEBZEHNTE PAXAS Treuhand- und Beteiligungsgesellschaft mbH Duesseldorf 50.0<br />
1796 SIFA Grundstücks-Vermietungsgesellschaft mbH Duesseldorf 100.0<br />
1797 SILANUS Grundstücks-Vermietungsgesellschaft mbH Duesseldorf 50.0<br />
1798 SILANUS Grundstücks-Vermietungsgesellschaft mbH & Co. Objekt Bonn KG Duesseldorf<br />
1799 SILEX Grundstücks-Vermietungsgesellschaft mbH Duesseldorf 50.0<br />
1800 SILEX Grundstücks-Vermietungsgesellschaft mbH & Co. Objekt Rostock und Leipzig KG Duesseldorf<br />
1801 SILEX Grundstücks-Vermietungsgesellschaft mbH Objekt Eduard Dyckerhoff OHG Duesseldorf<br />
1802 SILIGO Mobilien-Vermietungsgesellschaft mbH Duesseldorf 50.0<br />
1803 SILUR Grundstücks-Vermietungsgesellschaft mbH Duesseldorf 50.0<br />
1804 SILUR Grundstücks-Vermietungsgesellschaft mbH & Co. Objekt Markdorf KG Duesseldorf<br />
1805 SILUR Grundstücks-Vermietungsgesellschaft mbH & Co. Objekt Tübingen KG Duesseldorf<br />
1806 SILUR Grundstücks-Vermietungsgesellschaft mbH & Co. Objekt Uhingen KG Duesseldorf<br />
1807 SIMILA Grundstücks-Vermietungsgesellschaft mbH Duesseldorf 50.0<br />
1808 Singer Island Tower Suite LLC Wilmington 100.0<br />
1809 SIRES-STAR Limited George Town 7<br />
1810 Sixco Leasing Limited London 100.0<br />
1811 SMART SME CLO 2006-1 Ltd George Town<br />
1812 SOLATOR Grundstücks-Vermietungsgesellschaft mbH Duesseldorf 50.0<br />
1813 SOLIDO Grundstücks-Vermietungsgesellschaft mbH Duesseldorf 100.0<br />
1814 SOLON Grundstücks-Vermietungsgesellschaft mbH Schoenefeld 50.0<br />
1815 SOLUM Grundstücks-Vermietungsgesellschaft mbH Duesseldorf 50.0<br />
1816 SOMA Grundstücks-Vermietungsgesellschaft mbH Duesseldorf 50.0<br />
1817 SOMA Grundstücks-Vermietungsgesellschaft mbH & Co. Objekt Heidelberg KG Duesseldorf<br />
1818 Sonata Securities S.A. Luxembourg 7<br />
1819 SOREX Grundstücks-Vermietungsgesellschaft mbH Duesseldorf 50.0<br />
1820 SOREX Grundstücks-Vermietungsgesellschaft mbH & Co. Objekt Hutschenreuther KG Duesseldorf<br />
1821 SOREX Grundstücks-Vermietungsgesellschaft mbH & Co. Objekt Lüdenscheid KG Duesseldorf<br />
1822 SOREX Grundstücks-Vermietungsgesellschaft mbH & Co. Objekt Mainz KG Duesseldorf<br />
1823 SOSPITA Grundstücks-Vermietungsgesellschaft mbH Duesseldorf 50.0<br />
1824 SOSPITA Grundstücks-Vermietungsgesellschaft mbH & Co. Objekte Prima KG Duesseldorf 7<br />
1825 SOSPITA Grundstücks-Vermietungsgesellschaft mbH & Co. Objekte Sekunda KG Duesseldorf 7<br />
1826 SPAN No.5 Pty Limited Sydney<br />
1827 SPESSART 2009-1 GmbH Frankfurt<br />
1828 SPhinX Limited George Town 50.2<br />
1829 SPINO Grundstücks-Vermietungsgesellschaft mbH Duesseldorf 100.0<br />
1830 SPLENDOR Grundstücks-Vermietungsgesellschaft mbH Schoenefeld 50.0<br />
1831 Spring Asset Funding LLC Wilmington<br />
1832 Spring Asset Funding Ltd George Town<br />
1833 SS Aggregation Trust Wilmington<br />
1834 STABLON Grundstücks-Vermietungsgesellschaft mbH Duesseldorf 100.0<br />
1835 STAGIRA Grundstücks-Vermietungsgesellschaft mbH Duesseldorf 50.0<br />
1836 STATOR Heizkraftwerk Frankfurt (Oder) Beteiligungsgesellschaft mbH Schoenefeld 100.0<br />
1837 Stewart-Denny Holdings, LLC Wilmington<br />
1838 Stichting Perus Investments Amsterdam
<strong>Deutsche</strong> <strong>Bank</strong><br />
02 – Consolidated Financial Statements<br />
360<br />
<strong>Deutsche</strong> <strong>Bank</strong> 02 – Consolidated Financial Statements 360<br />
Financial <strong>Report</strong> 2010<br />
Additional Notes<br />
Financial <strong>Report</strong> 2010 Additional Notes<br />
42 – Shareholdings<br />
42 – Shareholdings<br />
Special Purpose Entities<br />
Special Purpose Entities<br />
Serial<br />
Share of<br />
capital<br />
No. Name of company Domicile of company Footnote in %<br />
1839 STUPA Heizwerk Frankfurt (Oder) Nord Beteiligungsgesellschaft mbH Schoenefeld 100.0<br />
1840 SUBLICA Grundstücks-Vermietungsgesellschaft mbH Duesseldorf 50.0<br />
1841 SUBU Mobilien-Vermietungsgesellschaft mbH Duesseldorf 50.0<br />
1842 SULPUR Grundstücks-Vermietungsgesellschaft mbH Schoenefeld 50.0<br />
1843 Sunflower Fund Luxembourg<br />
1844 Sunrise Beteiligungsgesellschaft mbH Frankfurt 100.0<br />
1845 SUPERA Grundstücks-Vermietungsgesellschaft mbH Duesseldorf 50.0<br />
1846 SUPERA Grundstücks-Vermietungsgesellschaft mbH & Co. Objekt Speyer KG Duesseldorf<br />
1847 SUPLION Beteiligungsgesellschaft mbH Duesseldorf 50.0<br />
1848 Survey Solutions B.V. Amsterdam<br />
1849 Survey Trust Wilmington<br />
1850 SUSA Mobilien-Vermietungsgesellschaft mbH Duesseldorf 50.0<br />
1851 SUSIK Grundstücks-Vermietungsgesellschaft mbH Duesseldorf 50.0<br />
1852 SUSIK Grundstücks-Vermietungsgesellschaft mbH & Co. Objekt Cottbus KG Duesseldorf<br />
1853 Swabia 1 Limited Dublin<br />
1854 Swabia 1. Vermögensbesitz-GmbH Frankfurt 100.0<br />
1855 SWIP Capital Trust London 100.0<br />
1856 Sylvester (2001) Limited George Town 100.0<br />
1857 TABA Grundstücks-Vermietungsgesellschaft mbH Schoenefeld 50.0<br />
1858 TACET Grundstücks-Vermietungsgesellschaft mbH Duesseldorf 50.0<br />
1859 TACET Grundstücks-Vermietungsgesellschaft mbH & Co. Objekt Hameln KG Duesseldorf<br />
1860 TACET Grundstücks-Vermietungsgesellschaft mbH & Co. Objekt Nordsternpark KG Duesseldorf<br />
1861 TACET Grundstücks-Vermietungsgesellschaft mbH & Co. Objekt Osnabrück KG Duesseldorf<br />
1862 TACET Grundstücks-Vermietungsgesellschaft mbH & Co. Objekt Ulm KG Duesseldorf<br />
1863 TACET Grundstücks-Vermietungsgesellschaft mbH & Co. Objekt Wendelstein KG Duesseldorf<br />
1864 TAF 2 Y.K. Tokyo 100.0<br />
1865 TAGO Grundstücks-Vermietungsgesellschaft mbH Duesseldorf 50.0<br />
1866 Tagus - Sociedade de Titularização de Creditos, S.A. Lisbon 100.0<br />
1867 TAGUS Beteiligungsgesellschaft mbH Duesseldorf 50.0<br />
1868 Tahoe Funding Corp., LLC Melville<br />
1869 TAKIR Grundstücks-Vermietungsgesellschaft mbH Duesseldorf 100.0<br />
1870 TARES Beteiligungsgesellschaft mbH Duesseldorf 100.0<br />
1871 Taunus 2008-1 GmbH Frankfurt<br />
1872 Taunus 2009-1 GmbH Frankfurt<br />
1873 TEBA Beteiligungsgesellschaft mbH Schoenefeld 100.0<br />
1874 TEBOR Grundstücks-Vermietungsgesellschaft mbH Duesseldorf 50.0<br />
1875 TEMATIS Grundstücks-Vermietungsgesellschaft mbH Duesseldorf 100.0<br />
1876 Tennessee Capital Godo Kaisha Tokyo 50.0<br />
1877 TERGO Grundstücks-Vermietungsgesellschaft mbH Duesseldorf 100.0<br />
1878 TERRUS Grundstücks-Vermietungsgesellschaft mbH Duesseldorf 100.0<br />
1879 TERRUS Grundstücks-Vermietungsgesellschaft mbH & Co. Objekt Bernbach KG Duesseldorf 0.0<br />
1880 TESATUR Beteiligungsgesellschaft mbH Duesseldorf 50.0<br />
1881 Thaumat Holdings Limited Nicosia<br />
1882 The Admiral Charitable Trust St. Peter Port<br />
1883 The CAP Accumulation Trust Wilmington<br />
1884 The CIG Trust St. Helier<br />
1885 The GIII Accumulation Trust Wilmington<br />
1886 The Glanmore Property Euro Fund Limited St. Peter Port<br />
1887 The GPR Accumulation Trust Wilmington<br />
1888 The Life Accumulation Trust Wilmington<br />
1889 The Life Accumulation Trust II Wilmington<br />
1890 The Life Accumulation Trust III Wilmington<br />
1891 The Life Accumulation Trust IV Wilmington<br />
1892 The Life Accumulation Trust IX Wilmington<br />
1893 The Life Accumulation Trust V Wilmington<br />
1894 The Life Accumulation Trust VIII Wilmington
<strong>Deutsche</strong> <strong>Bank</strong><br />
02 – Consolidated Financial Statements<br />
361<br />
<strong>Deutsche</strong> <strong>Bank</strong> 02 – Consolidated Financial Statements 361<br />
Financial <strong>Report</strong> 2010<br />
Additional Notes<br />
Financial <strong>Report</strong> 2010 Additional Notes<br />
42 – Shareholdings<br />
42 – Shareholdings<br />
Special Purpose Entities<br />
Special Purpose Entities<br />
Serial<br />
Share of<br />
capital<br />
No. Name of company Domicile of company Footnote in %<br />
1895 The Life Accumulation Trust X Wilmington<br />
1896 The Life Accumulation Trust XI Wilmington<br />
1897 The Life Accumulation Trust XII Wilmington<br />
1898 The PEB Accumulation Trust Wilmington<br />
1899 The SLA Accumulation Trust Wilmington<br />
1900 THRENI Grundstücks-Vermietungsgesellschaft mbH i.L. Duesseldorf 50.0<br />
1901 Tilney Group Limited Employee Incentive Trust St. Peter Port<br />
1902 Tintin II SPC George Town<br />
1903 Tintin III SPC George Town<br />
1904 TONGA Grundstücks-Vermietungsgesellschaft mbH Duesseldorf 50.0<br />
1905 TOREUT Grundstücks-Vermietungsgesellschaft mbH i.L. Duesseldorf 50.0<br />
1906 TOSSA Grundstücks-Vermietungsgesellschaft mbH Duesseldorf 100.0<br />
1907 TRAGO Grundstücks-Vermietungsgesellschaft mbH Duesseldorf 50.0<br />
1908 TREMA Grundstücks-Vermietungsgesellschaft mbH Berlin 50.0<br />
1909 TRENTO Grundstücks-Vermietungsgesellschaft mbH Duesseldorf 50.0<br />
1910 TRINTO Beteiligungsgesellschaft mbH Schoenefeld 50.0<br />
1911 TRIPLA Grundstücks-Vermietungsgesellschaft mbH Duesseldorf 100.0<br />
1912 Triplepoint Special Opportunities Financing Trust Wilmington 7<br />
1913 TRS 1 LLC Wilmington 100.0<br />
1914 TRS Aria LLC Wilmington 100.0<br />
1915 TRS Babson I LLC Wilmington 100.0<br />
1916 TRS Bluebay LLC Wilmington 100.0<br />
1917 TRS Bruin LLC Wilmington 100.0<br />
1918 TRS Callisto LLC Wilmington 100.0<br />
1919 TRS Camulos LLC Wilmington 100.0<br />
1920 TRS Cypress LLC Wilmington 100.0<br />
1921 TRS DB OH CC Fund Financing LLC Wilmington 100.0<br />
1922 TRS Eclipse LLC Wilmington 100.0<br />
1923 TRS Elara LLC Wilmington 100.0<br />
1924 TRS Elgin LLC Wilmington 100.0<br />
1925 TRS Elm LLC Wilmington 100.0<br />
1926 TRS Feingold O'Keeffe LLC Wilmington 100.0<br />
1927 TRS Fore LLC Wilmington 100.0<br />
1928 TRS Ganymede LLC Wilmington 100.0<br />
1929 TRS GSC Credit Strategies LLC Wilmington 100.0<br />
1930 TRS Haka LLC Wilmington 100.0<br />
1931 TRS HY FNDS LLC Wilmington 100.0<br />
1932 TRS Io LLC Wilmington 100.0<br />
1933 TRS Landsbanki Islands LLC Wilmington 100.0<br />
1934 TRS Leda LLC Wilmington 100.0<br />
1935 TRS Metis LLC Wilmington 100.0<br />
1936 TRS Plainfield LLC Wilmington 100.0<br />
1937 TRS Poplar LLC Wilmington 100.0<br />
1938 TRS Quogue LLC Wilmington 100.0<br />
1939 TRS Scorpio LLC Wilmington 100.0<br />
1940 TRS SeaCliff LLC Wilmington 100.0<br />
1941 TRS Stag LLC Wilmington 100.0<br />
1942 TRS Stark LLC Wilmington 100.0<br />
1943 TRS SVCO LLC Wilmington 100.0<br />
1944 TRS Sycamore LLC Wilmington 100.0<br />
1945 TRS Thebe LLC Wilmington 100.0<br />
1946 TRS Tupelo LLC Wilmington 100.0<br />
1947 TRS Venor LLC Wilmington 100.0<br />
1948 TRS Watermill LLC Wilmington 100.0<br />
1949 Tsubasa Angel Fund Y.K. Tokyo 100.0<br />
1950 Tucson Funding LLC Dover
<strong>Deutsche</strong> <strong>Bank</strong><br />
02 – Consolidated Financial Statements<br />
362<br />
<strong>Deutsche</strong> <strong>Bank</strong> 02 – Consolidated Financial Statements 362<br />
Financial <strong>Report</strong> 2010<br />
Additional Notes<br />
Financial <strong>Report</strong> 2010 Additional Notes<br />
42 – Shareholdings<br />
42 – Shareholdings<br />
Special Purpose Entities<br />
Special Purpose Entities<br />
Serial<br />
Share of<br />
capital<br />
No. Name of company Domicile of company Footnote in %<br />
1951 TUDO Grundstücks-Vermietungsgesellschaft mbH Duesseldorf 50.0<br />
1952 TUGA Grundstücks-Vermietungsgesellschaft mbH Duesseldorf 50.0<br />
1953 TXH Trust Wilmington<br />
1954 TYRAS Beteiligungsgesellschaft mbH Duesseldorf 50.0<br />
1955 UDS Capital Y.K. Tokyo 100.0<br />
1956 Varapradha Real Estates Private Limited Hyderabad<br />
1957 VARIS Beteiligungsgesellschaft mbH Duesseldorf 50.0<br />
1958 Varta Aktiengesellschaft Hanover<br />
1959 VIERTE Fonds-Beteiligungsgesellschaft mbH Duesseldorf 50.0<br />
1960 VIERTE PAXAS Treuhand- und Beteiligungsgesellschaft mbH Duesseldorf 50.0<br />
1961 VIERUNDZWANZIGSTE PAXAS Treuhand- und Beteiligungsgesellschaft mbH Duesseldorf 50.0<br />
1962 VIERZEHNTE PAXAS Treuhand- und Beteiligungsgesellschaft mbH Duesseldorf 50.0<br />
1963 Village Hospitality LLC Wilmington 100.0<br />
1964 Volga Investments Limited Dublin<br />
1965 Warwick Lane Investments B.V. London 25.0<br />
1966 Wheatfield GmbH & Co. KG Frankfurt 100.0<br />
1967 Winchester House Master Trust Hamilton 7 100.0<br />
1968 Wohnungs-Verwaltungsgesellschaft Moers mbH Duesseldorf 50.0<br />
1969 Wohnungsgesellschaft HEGEMAG GmbH Duesseldorf 50.0<br />
1970 XARUS Grundstücks-Vermietungsgesellschaft mbH Schoenefeld 50.0<br />
1971 XELLUM Grundstücks-Vermietungsgesellschaft mbH Duesseldorf 50.0<br />
1972 XENTIS Grundstücks-Vermietungsgesellschaft mbH Duesseldorf 50.0<br />
1973 XERA Grundstücks-Vermietungsgesellschaft mbH Duesseldorf 50.0<br />
1974 XERIS Grundstücks-Vermietungsgesellschaft mbH Duesseldorf 50.0<br />
1975 Y.K. Agura Partners Tokyo 50.0<br />
1976 ZABATUS Grundstücks-Vermietungsgesellschaft mbH Duesseldorf 50.0<br />
1977 ZAKATUR Grundstücks-Vermietungsgesellschaft mbH Duesseldorf 50.0<br />
1978 ZALLUS Beteiligungsgesellschaft mbH Duesseldorf 50.0<br />
1979 Zamalik Limited Dublin<br />
1980 ZANTOS Grundstücks-Vermietungsgesellschaft mbH Duesseldorf 50.0<br />
1981 ZARAT Beteiligungsgesellschaft mbH Duesseldorf 50.0<br />
1982 ZARAT Beteiligungsgesellschaft mbH & Co. Objekt Leben II KG Duesseldorf 93.2<br />
1983 ZARGUS Grundstücks-Vermietungsgesellschaft mbH Duesseldorf 50.0<br />
1984 ZEA Beteiligungsgesellschaft mbH Schoenefeld 25.0<br />
1985 ZEDORA 3 GmbH & Co. KG Munich<br />
1986 ZEDORA 36 GmbH & Co. KG Munich<br />
1987 ZEHNTE PAXAS Treuhand- und Beteiligungsgesellschaft mbH Duesseldorf 50.0<br />
1988 ZELAS Beteiligungsgesellschaft mbH Duesseldorf 50.0<br />
1989 ZELAS Beteiligungsgesellschaft mbH & Co. Leben I KG Duesseldorf 93.0<br />
1990 ZENO Grundstücks-Vermietungsgesellschaft mbH Duesseldorf 50.0<br />
1991 ZEPTOS Grundstücks-Vermietungsgesellschaft mbH Duesseldorf 50.0<br />
1992 ZEREVIS Grundstücks-Vermietungsgesellschaft mbH Duesseldorf 50.0<br />
1993 ZERGUM Grundstücks-Vermietungsgesellschaft mbH Duesseldorf 50.0<br />
1994 ZIBE Grundstücks-Vermietungsgesellschaft mbH Duesseldorf 50.0<br />
1995 ZIDES Grundstücks-Vermietungsgesellschaft mbH Schoenefeld 50.0<br />
1996 ZIMBEL Grundstücks-Vermietungsgesellschaft mbH Schoenefeld 50.0<br />
1997 ZINUS Grundstücks-Vermietungsgesellschaft mbH Schoenefeld 50.0<br />
1998 ZIRAS Grundstücks-Vermietungsgesellschaft mbH Schoenefeld 50.0<br />
1999 ZITON Grundstücks-Vermietungsgesellschaft mbH Duesseldorf 50.0<br />
2000 ZITRAL Beteiligungsgesellschaft mbH Duesseldorf 50.0<br />
2001 ZITUS Grundstücks-Vermietungsgesellschaft mbH Schoenefeld 50.0<br />
2002 ZONTUM Grundstücks-Vermietungsgesellschaft mbH Duesseldorf 50.0<br />
2003 ZORUS Grundstücks-Vermietungsgesellschaft mbH Duesseldorf 50.0<br />
2004 Zugspitze 2008-1 GmbH Frankfurt<br />
2005 Zumirez Drive LLC Wilmington 100.0<br />
2006 ZURET Beteiligungsgesellschaft mbH Duesseldorf 50.0
<strong>Deutsche</strong> <strong>Bank</strong><br />
02 – Consolidated Financial Statements<br />
363<br />
<strong>Deutsche</strong> <strong>Bank</strong> 02 – Consolidated Financial Statements 363<br />
Financial <strong>Report</strong> 2010<br />
Additional Notes<br />
Financial <strong>Report</strong> 2010 Additional Notes<br />
42 – Shareholdings<br />
42 – Shareholdings<br />
Special Purpose Entities<br />
Special Purpose Entities<br />
Serial<br />
Share of<br />
capital<br />
No. Name of company Domicile of company Footnote in %<br />
2007 ZWANZIGSTE PAXAS Treuhand- und Beteiligungsgesellschaft mbH Duesseldorf 50.0<br />
2008 ZWEITE Fonds-Beteiligungsgesellschaft mbH Duesseldorf 50.0<br />
2009 ZWEITE PAXAS Treuhand- und Beteiligungsgesellschaft mbH Duesseldorf 50.0<br />
2010 ZWEIUNDZWANZIGSTE PAXAS Treuhand- und Beteiligungsgesellschaft mbH Duesseldorf 50.0<br />
2011 ZWÖLFTE PAXAS Treuhand- und Beteiligungsgesellschaft mbH Duesseldorf 50.0<br />
<strong>2012</strong> ZYLUM Beteiligungsgesellschaft mbH Schoenefeld 25.0
<strong>Deutsche</strong> <strong>Bank</strong><br />
02 – Consolidated Financial Statements<br />
364<br />
<strong>Deutsche</strong> <strong>Bank</strong> 02 – Consolidated Financial Statements 364<br />
Financial <strong>Report</strong> 2010<br />
Additional Notes<br />
Financial <strong>Report</strong> 2010 Additional Notes<br />
42 – Shareholdings<br />
42 – Shareholdings<br />
Companies accounted for at equity<br />
Companies accounted for at equity<br />
Serial<br />
Share of<br />
capital<br />
No. Name of company Domicile of company Footnote in %<br />
2013 AcadiaSoft, Inc. Wilmington 8.8<br />
2014 Actavis New S.à r.l. Luxembourg 9, 10 0.0<br />
2015 Admiral Private Equity SL Madrid 45.0<br />
2016 Advent Chestnut VII GmbH & Co. KG Munich 36.7<br />
2017 Afinia Capital Group Limited Hamilton 40.0<br />
2018 AKA Ausfuhrkredit-Gesellschaft mit beschränkter Haftung Frankfurt 28.8<br />
2019 Alpha Trains (Malta) Holdco 1 Limited Valletta 15.0<br />
2020 Alternative Investment Strategies Mauritius Ltd. Grand Bay 31.2<br />
2021 Aqueduct Capital (UK) Limited Redhill 10.0<br />
2022 Argantis GmbH Cologne 50.0<br />
2023 Argantis Private Equity GmbH & Co. KG Cologne 25.1<br />
2024 Argantis Private Equity Gründer GmbH & Co. KG Cologne 27.8<br />
2025 Arvoredo Investments Limited George Town 47.1<br />
2026 Asia Retail Group Limited Douglas 9.4<br />
2027 Atriax Holdings Limited (in member's voluntary liquidation) Southend-on-Sea 25.0<br />
2028 Baigo Capital Partners Fund 1 Parallel 1 GmbH & Co. KG Frankfurt 49.8<br />
2029 BANKPOWER GmbH Personaldienstleistungen Frankfurt 30.0<br />
2030 BATS Global Markets, Inc. Wilmington 8.5<br />
2031 Bestra Gesellschaft für Vermögensverwaltung mit beschränkter Haftung Duesseldorf 49.0<br />
2032 BHS tabletop AG Selb 28.9<br />
2033 Bocaina L.P. George Town 11 53.3<br />
2034 BrisConnections Holding Trust Kedron 35.6<br />
2035 BrisConnections Investment Trust Kedron 35.6<br />
2036 BVT-CAM Private Equity Beteiligungs GmbH Gruenwald 50.0<br />
2037 BVT-CAM Private Equity Management & Beteiligungs GmbH Gruenwald 50.0<br />
2038 Caherciveen Partners, LLC Chicago 20.0<br />
2039 Challenger Infrastructure Fund Sydney 20.2<br />
2040 Cipio Partners Fund V GmbH & Co. KG Munich 21.1<br />
2041 Cipio Partners Fund Va GmbH & Co. KG Munich 21.1<br />
2042 CKI RREEF JV Holdings Pty Limited Sydney 50.0<br />
2043 Coalition Development Limited London 9.7<br />
2044 Comfund Consulting Limited Bangalore 30.0<br />
2045 Compañía Logística de Hidrocarburos CLH, S.A. Madrid 5.0<br />
2046 Craigs Investment Partners Limited Tauranga 49.9<br />
2047 Crescent Gold Limited Subiaco 35.2<br />
2048 Danube Properties S.à r.l. Luxembourg 25.0<br />
2049 DB Alpha Discovery Fund Limited George Town 9 0.0<br />
2050 DB Development Holdings Limited Larnaca 49.0<br />
2051 DB Funding (Gibraltar) Limited Gibraltar 12 100.0<br />
2052 DB Real Estate Global Opportunities IB (Offshore), L.P. Camana Bay 34.5<br />
2053 DB Secondary Opportunities Fund II, LP George Town 50.0<br />
2054 DBG Eastern Europe II Limited Partnership St. Helier 25.9<br />
2055 DBG Osteuropa-Holding GmbH i.L. Frankfurt 50.0<br />
2056 DD Konut Finansman A.S. Istanbul 49.0<br />
2057 <strong>Deutsche</strong> Börse Commodities GmbH Eschborn 16.2<br />
2058 <strong>Deutsche</strong> Financial Capital I Corp. Greensboro 50.0<br />
2059 <strong>Deutsche</strong> Financial Capital Limited Liability Company Greensboro 50.0<br />
2060 <strong>Deutsche</strong> Grundbesitz-Beteiligungsgesellschaft Dr. Rühl & Co. -Anlagefonds<br />
2/Verwaltungsgebäude Stuttgart-Möhringen-KG i.L.<br />
Frankfurt 23.7<br />
2061 <strong>Deutsche</strong> Private Equity Fund Sydney 8.0<br />
2062 <strong>Deutsche</strong> Regis Partners Inc Makati City 49.0<br />
2063 <strong>Deutsche</strong> Zurich Pensiones Entidad Gestora de Fondos de Pensiones, S.A. Barcelona 50.0<br />
2064 <strong>Deutsche</strong>r Pensionsfonds Aktiengesellschaft Bonn 25.1<br />
2065 DFM <strong>Deutsche</strong> Fonds Management GmbH Gruenwald 40.0<br />
2066 DIL Czech Baumanagement Koncernová s.r.o. i.L. Prague 49.0<br />
2067 DIL Czech Contract Koncernova s.r.o. Prague 49.0
<strong>Deutsche</strong> <strong>Bank</strong><br />
02 – Consolidated Financial Statements<br />
365<br />
<strong>Deutsche</strong> <strong>Bank</strong> 02 – Consolidated Financial Statements 365<br />
Financial <strong>Report</strong> 2010<br />
Additional Notes<br />
Financial <strong>Report</strong> 2010 Additional Notes<br />
42 – Shareholdings<br />
42 – Shareholdings<br />
Companies accounted for at equity<br />
Companies accounted for at equity<br />
Serial<br />
Share of<br />
capital<br />
No. Name of company Domicile of company Footnote in %<br />
2068 DIL Internationale Leasinggesellschaft mbH Duesseldorf 50.0<br />
2069 DMG & Partners Securities Pte Ltd Singapore 49.0<br />
2070 Domus Beteiligungsgesellschaft der Privaten Bausparkassen mbH Berlin 21.1<br />
2071 DPG <strong>Deutsche</strong> Performancemessungs-Gesellschaft für Wertpapierportfolios mbH Frankfurt 20.0<br />
2072 Duxton Asset Management Pte. Ltd. Singapore 20.0<br />
2073 DWS Global Agricultural Land & Opportunities Fund Limited George Town 8.5<br />
2074 Edmonton Holding Limited George Town 9 0.0<br />
2075 Elbe Properties S.à r.l. Luxembourg 25.0<br />
2076 EOL2 Holding B.V. Amsterdam 45.0<br />
2077 eolec Issy-les-Moulineaux 33.3<br />
2078 equiNotes Management GmbH Duesseldorf 50.0<br />
2079 Erica Società a Responsabilità Limitata Milan 40.0<br />
2080 EVROENERGIAKI S.A. Alexandroupolis 40.0<br />
2081 Exchange Place Holdings, L.P. Wilmington 21.2<br />
2082 Fondo Immobiliare Chiuso Piramide Globale Milan 4 42.5<br />
2083 FREUNDE DER EINTRACHT FRANKFURT Aktiengesellschaft Frankfurt 30.8<br />
2084 Fünfte SAB Treuhand und Verwaltung GmbH & Co. >>Leipzig-Magdeburg>Louisenstraße
<strong>Deutsche</strong> <strong>Bank</strong><br />
02 – Consolidated Financial Statements<br />
366<br />
<strong>Deutsche</strong> <strong>Bank</strong> 02 – Consolidated Financial Statements 366<br />
Financial <strong>Report</strong> 2010<br />
Additional Notes<br />
Financial <strong>Report</strong> 2010 Additional Notes<br />
42 – Shareholdings<br />
42 – Shareholdings<br />
Companies accounted for at equity<br />
Companies accounted for at equity<br />
Serial<br />
Share of<br />
capital<br />
No. Name of company Domicile of company Footnote in %<br />
2123 Japan Value Added Fund One Limited Tokyo 9 0.0<br />
2124 K & N Kenanga Holdings Bhd Kuala Lumpur 16.6<br />
2125 Kenanga <strong>Deutsche</strong> Futures Sdn Bhd Kuala Lumpur 27.0<br />
2126 Key Capital Private Limited Dublin 50.0<br />
2127 Kinneil Leasing Company London 35.0<br />
2128 KölnArena Beteiligungsgesellschaft mbH Cologne 20.8<br />
2129 Liegenschaft Hainstraße GbR Frankfurt 9 0.0<br />
2130 Lion Indian Real Estate Fund L.P. George Town 9 0.0<br />
2131 Lion Residential Holdings S.à r.l. Luxembourg 17.4<br />
2132 London Dry Bulk Limited London 49.0<br />
2133 Magyar RTL Televízió Zartkoruen Mukodo Reszvenytarsasag Budapest 2.0<br />
2134 Main Properties S.à r.l. Luxembourg 25.0<br />
2135 Manuseamento de Cargas - Manicargas, S.A. Matosinhos 38.3<br />
2136 Marblegate Special Opportunities Master Fund, L.P. George Town 44.6<br />
2137 Markit Group Holdings Limited London 6.4<br />
2138 MFG Flughafen-Grundstücksverwaltungsgesellschaft mbH & Co. BETA KG Gruenwald 29.6<br />
2139 MidOcean (Europe) 2000-A LP St. Helier 19.9<br />
2140 MidOcean (Europe) 2000-B LP St. Helier 19.9<br />
2141 MidOcean (Europe) 2002 LP St. Helier 15.9<br />
2142 MidOcean (Europe) 2003 LP St. Helier 20.0<br />
2143 MidOcean Partners, LP New York 20.0<br />
2144 Millennium Marine Rail, L.L.C. Elizabeth 50.0<br />
2145 Miller Brothers Retail Limited (in member's voluntary liquidation) Doncaster 40.0<br />
2146 Millexim Paris 35.0<br />
2147 Motion Picture Markets Holding GmbH i.L. Gruenwald 33.3<br />
2148 Nexus LLC Wilmington 12.2<br />
2149 North Coast Wind Energy Corp. Vancouver 11 93.4<br />
2150 Novacare Laval-sur-Vologne 23.7<br />
2151 Oder Properties S.à r.l. Luxembourg 25.0<br />
2152 Omnium Leasing Company London 7.1<br />
2153 OPPENHEIM PRIVATE EQUITY Holding GmbH & Co. KG Cologne 0.4<br />
2154 Otto Lilienthal Fünfte GmbH & Co. KG Munich 19.6<br />
2155 P.F.A.B. Passage Frankfurter Allee Betriebsgesellschaft mbH Berlin 22.2<br />
2156 Pago e Transaction Services GmbH Cologne 50.0<br />
2157 Parkhaus an der Börse GbR Cologne 37.7<br />
2158 PERILLA Beteiligungsgesellschaft mbH Duesseldorf 50.0<br />
2159 Pilgrim America High Income Investments Ltd. George Town 14.9<br />
2160 Plenary Group (Canada) Limited Vancouver 20.0<br />
2161 Plenary Group Pty Limited Melbourne 20.9<br />
2162 Private Partners AG Zurich 30.0<br />
2163 PT. <strong>Deutsche</strong> Verdhana Indonesia Jakarta 40.0<br />
2164 PX Holdings Limited Stockton on Tees 43.0<br />
2165 QPL Lux, S.à r.l. Luxembourg 6.0<br />
2166 QW Holdings, LLC Wilmington 12.2<br />
2167 Rama Cylinders Private Limited Mumbai 20.0<br />
2168 Regent's Park Estates (GP) Limited Douglas 50.0<br />
2169 Regent's Park Estates Limited Partnership Douglas 48.8<br />
2170 Relax Holding S.à r.l. Luxembourg 20.0<br />
2171 Relax Wind Park II Sp.z o.o. Warsaw 49.0<br />
2172 Relax Wind Park IV Sp.z o.o. Warsaw 49.0<br />
2173 REON - Park Wiatrowy I Sp. z o.o. Warsaw 50.0<br />
2174 REON-Park Wiatrowy II Sp. z o.o. Warsaw 50.0<br />
2175 REON-Park Wiatrowy IV Sp. z o.o. Warsaw 50.0<br />
2176 Residential Real Estate Partners III, LLC Wilmington 10.0<br />
2177 Rhine Properties S.à r.l. Luxembourg 25.0<br />
2178 Roc Capital Group, LLC Wilmington 8.5
<strong>Deutsche</strong> <strong>Bank</strong><br />
02 – Consolidated Financial Statements<br />
367<br />
<strong>Deutsche</strong> <strong>Bank</strong> 02 – Consolidated Financial Statements 367<br />
Financial <strong>Report</strong> 2010<br />
Additional Notes<br />
Financial <strong>Report</strong> 2010 Additional Notes<br />
42 – Shareholdings<br />
42 – Shareholdings<br />
Companies accounted for at equity<br />
Companies accounted for at equity<br />
Serial<br />
Share of<br />
capital<br />
No. Name of company Domicile of company Footnote in %<br />
2179 Roc Capital Management, L.P. Wilmington 8.5<br />
2180 Rongde Asset Management Company Limited Beijing 40.7<br />
2181 Rosen Consulting Group, LLC Wilmington 40.0<br />
2182 Rosen Real Estate Securities LLC Wilmington 33.3<br />
2183 RPWire LLC Wilmington 33.3<br />
2184 S/D Partnership Johannesburg 9 0.0<br />
2185 Sakaras Holding Limited Birkirkara 9 0.0<br />
2186 Satrix Managers (Pty) Ltd Johannesburg 50.0<br />
2187 Schiffahrtsgesellschaft MS "Simon Braren" GmbH & Co KG Kollmar 25.5<br />
2188 Schumacher Beteiligungsgesellschaft mbH Cologne 33.2<br />
2189 Shunfeng Catering & Hotel Management Co., Ltd. Beijing 6.4<br />
2190 Spark Infrastructure Group Sydney 2.3<br />
2191 Spin Holdco Inc. Wilmington 35.0<br />
2192 SRC Security Research & Consulting GmbH Bonn 22.5<br />
2193 Starpool Finanz GmbH Berlin 50.0<br />
2194 SunAmerica Affordable Housing Partners 47 Los Angeles 10.3<br />
2195 Teesside Gas Processing Plant Limited London 49.0<br />
2196 Teesside Gas Transportation Limited London 45.0<br />
2197 TeraGate AG Storage Optical Network Munich 49.2<br />
2198 The Glanmore Property Fund Limited St. Peter Port 5.3<br />
2199 The Portal Alliance LLC Wilmington 10.0<br />
2200 The Porterbrook Partnership Edinburgh 16.7<br />
2201 The Topiary Fund II Public Limited Company Dublin 3.7<br />
2202 The Topiary Select Equity Trust George Town 11 59.1<br />
2203 THG Beteiligungsverwaltung GmbH Hamburg 50.0<br />
2204 TIP (Guernsey) GP Limited St. Peter Port 9.1<br />
2205 TLDB Partners Limited Tokyo 50.0<br />
2206 Trave Properties S.à r.l. Luxembourg 25.0<br />
2207 Triton Gesellschaft für Beteiligungen mbH Frankfurt 33.1<br />
2208 Turquoise Global Holdings Limited London 7.1<br />
2209 U.F.G.I.S. Advisors Limited Larnaca 40.0<br />
2210 VCG Venture Capital Gesellschaft mbH & Co. Fonds III KG Munich 37.0<br />
2211 VCG Venture Capital Gesellschaft mbH & Co. Fonds III Management KG Munich 26.7<br />
2212 VCM / BHF Initiatoren GmbH & Co. Beteiligungs KG Munich 48.8<br />
2213 VCM Shott Private Equity Advisors, LLC Wilmington 50.0<br />
2214 VCM VII European Mid-Market Buyout GmbH & Co. KG Munich 28.8<br />
2215 Verwaltung ABL Immobilienbeteiligungsgesellschaft mbH Hamburg 50.0<br />
2216 Volbroker.com Limited London 23.8<br />
2217 VR Bavaria GmbH Ingolstadt 1.0<br />
2218 VR Maasmechelen Tourist Outlets Comm. VA Antwerp 25.0<br />
2219 W2001/Fifty-Two B.V. Amsterdam 50.0<br />
2220 Welsh Power Group Limited Cardiff 19.9<br />
2221 WERSE Schiffahrts GmbH & Co. KG MS "DYCKBURG" Muenster 41.5<br />
2222 Weser Properties S.à r.l. Luxembourg 25.0<br />
2223 WestLB Venture Capital Management GmbH & Co. KG Munich 50.0<br />
2224 Wilson HTM Investment Group Ltd Brisbane 19.5<br />
2225 WohnBauEntwicklungsgesellschaft München-Haidhausen mbH & Co. KG i.L. Eschborn 33.3<br />
2226 WohnBauEntwicklungsgesellschaft München-Haidhausen Verwaltungs-mbH i.L. Eschborn 33.3<br />
2227 Xchanging etb GmbH Frankfurt 49.0<br />
2228 Zapf GmbH Bayreuth 24.1<br />
2229 zeitinvest-Service GmbH Frankfurt 25.0<br />
2230 Zhong De Securities Co., Ltd Beijing 33.3<br />
2231 ZINDUS Beteiligungsgesellschaft mbH Duesseldorf 50.0<br />
2232 ZYRUS Beteiligungsgesellschaft mbH Schoenefeld 25.0
<strong>Deutsche</strong> <strong>Bank</strong><br />
02 – Consolidated Financial Statements<br />
368<br />
<strong>Deutsche</strong> <strong>Bank</strong> 02 – Consolidated Financial Statements 368<br />
Financial <strong>Report</strong> 2010<br />
Additional Notes<br />
Financial <strong>Report</strong> 2010 Additional Notes<br />
42 – Shareholdings<br />
42 – Shareholdings<br />
Other Companies, where the holding equals or exceeds 20 %<br />
Other Companies, where the holding equals or exceeds 20%<br />
Serial<br />
Share of<br />
capital<br />
No. Name of company Domicile of company Footnote in %<br />
2233 AFFIRMATUM Beteiligungsgesellschaft mbH Duesseldorf 13 50.0<br />
2234 Alpha DB Lindsell Limited S.C.S. Luxembourg 12 100.0<br />
2235 AV America Grundbesitzverwaltungsgesellschaft mbH i.L. Frankfurt 12 75.0<br />
2236 Avacomm GmbH i.L. Holzkirchen 14 27.5<br />
2237 B.L.E. Laboratory Equipment GmbH i.L. Radolfzell 14 30.5<br />
2238 Belzen Pty. Limited Sydney 12 100.0<br />
2239 Benefit Trust GmbH Soessen-Gostau 12 100.0<br />
2240 Beta DB Lindsell Limited S.C.S. Luxembourg 12 100.0<br />
2241 Beteiligungsgesellschaft für <strong>Deutsche</strong> HandelsImmobilien mbH & Co. Alpha KG Duesseldorf 14 50.0<br />
2242 BLI Internationale Beteiligungsgesellschaft mbH Duesseldorf 13 32.0<br />
2243 Blue Ridge Trust Wilmington 13 26.7<br />
2244 CANDOR Vermietungsgesellschaft mbH & Co. Kommanditgesellschaft i.L. Duesseldorf 13 34.4<br />
2245 DB (Barbados) SRL Christ Church 12 100.0<br />
2246 DB (Gibraltar) Holdings No. 2 Limited Gibraltar 12 100.0<br />
2247 DB Advisors SICAV Luxembourg 12 100.0<br />
2248 DB Funding (Gibraltar) No. 2 Limited Gibraltar 12 100.0<br />
2249 DB Lindsell Limited Gibraltar 12 100.0<br />
2250 DB Petri LLC Wilmington 12 100.0<br />
2251 DBR Investments Co. Limited George Town 12 100.0<br />
2252 3-DD Digital Media AG i.L. Munich 14 27.1<br />
2253 <strong>Deutsche</strong> River Investment Management Company S.à r.l. Luxembourg 13 49.0<br />
2254 Deutz-Mülheim Grundstücksgesellschaft mbH Duesseldorf 13 40.2<br />
2255 Dogan Gazetecilik A.S. Istanbul 15 23.1<br />
2256 EQR-Vantage Pointe B Limited Partnership Wilmington 12 100.0<br />
2257 EQR-Vantage Pointe B, LLC Wilmington 12 100.0<br />
2258 EQR-Vantage Pointe F Limited Partnership Wilmington 12 100.0<br />
2259 EQR-Vantage Pointe F, LLC Wilmington 12 100.0<br />
2260 EQR-Vantage Pointe G Limited Partnership Wilmington 12 100.0<br />
2261 EQR-Vantage Pointe G, LLC Wilmington 12 100.0<br />
2262 EQR-Vantage Pointe H Limited Partnership Wilmington 12 100.0<br />
2263 EQR-Vantage Pointe H, LLC Wilmington 12 100.0<br />
2264 EQR-Vantage Pointe I Limited Partnership Wilmington 12 100.0<br />
2265 EQR-Vantage Pointe I, LLC Wilmington 12 100.0<br />
2266 Euro 7 Investment George Town 14 21.2<br />
2267 European Private Equity Portfolio (PE-EU) GmbH & Co. KG Munich 14 20.4<br />
2268 FRM Levered Diversified Fund LP Wilmington 16 49.2<br />
2269 Gettysburg Investments LP George Town 12 100.0<br />
2270 Goldman Sachs Multi-Strategy Portfolio XI, LLC Wilmington 11 100.0<br />
2271 Gottex ABI Master Fund Limited George Town 13 35.3<br />
2272 Grundstücksvermietungsgesellschaft Wilhelmstr. mbH Duesseldorf 12 100.0<br />
2273 HealthCap 1999 GbR Berlin 14 41.5<br />
2274 Helios AMC California, Inc. Wilmington 17 100.0<br />
2275 HQ Limited Partnership Tokyo 13 37.5<br />
2276 iCON Founder Partner, L.P. St. Peter Port 12 100.0<br />
2277 iCON GP Limited St. Peter Port 12 100.0<br />
2278 iCON Infrastructure Partners, L.P. St. Peter Port 14 83.6<br />
2279 iCON Master Holdings (EUR) S.à r.l Luxembourg 11 100.0<br />
2280 iCON Master Holdings (GBP) S.à r.l Luxembourg 11 100.0<br />
2281 Immobilien-Vermietungsgesellschaft Schumacher GmbH & Co. Objekt Rolandufer KG Berlin 13 20.5<br />
2282 JG Japan Grundbesitzverwaltungsgesellschaft mbH i.L. Eschborn 12 100.0<br />
2283 LEA Grundstücks-Vermietungsgesellschaft mbH & Co. Objekt Esslingen OHG Duesseldorf 13 48.4<br />
2284 Leyou.com Co., Ltd. George Town 14 30.9<br />
2285 Lindsell Finance Limited Valletta 12 100.0<br />
2286 Lindsell Malta Investments Limited Valletta 12 80.7<br />
2287 Lion Global Infrastructure Fund Limited St. Peter Port 13 50.0<br />
2288 M Cap Finance Mittelstandsfonds GmbH & Co. KG Frankfurt 14 99.7
<strong>Deutsche</strong> <strong>Bank</strong><br />
02 – Consolidated Financial Statements<br />
369<br />
<strong>Deutsche</strong> <strong>Bank</strong> 02 – Consolidated Financial Statements 369<br />
Financial <strong>Report</strong> 2010<br />
Additional Notes<br />
Financial <strong>Report</strong> 2010 Additional Notes<br />
42 – Shareholdings<br />
42 – Shareholdings<br />
Other Companies, where the holding equals or exceeds 20 %<br />
Other Companies, where the holding equals or exceeds 20%<br />
Serial<br />
Share of<br />
capital<br />
No. Name of company Domicile of company Footnote in %<br />
2289 Mariscal LLC Wilmington 17 100.0<br />
2290 Memax Pty. Limited Sydney 12 100.0<br />
2291 Merit Capital Advance, LLC Wilmington 14 20.0<br />
2292 Metro plus Grundstücks-Vermietungsgesellschaft mbH Duesseldorf 13 40.0<br />
2293 Midsel Limited London 12 100.0<br />
2294 moderne stadt Gesellschaft zur Förderung des Städtebaues und der Gemeindeentwicklung<br />
mit beschränkter Haftung<br />
Cologne 14 50.0<br />
2295 Mount Hope Community Center Fund, LLC Wilmington 14 50.0<br />
2296 MRF Financing Ippan Shadan Hojin Tokyo 13 50.0<br />
2297 Nortfol Pty. Limited Sydney 12 100.0<br />
2298 OPPENHEIM Buy Out GmbH & Co. KG Cologne 13 27.7<br />
2299 PARTS Funding, LLC Wilmington 12 100.0<br />
2300 Paternoster Limited Douglas 14 40.3<br />
2301 Public Propaganda Music Group AG i.I. Duesseldorf 14 41.2<br />
2302 Safron AMD Partners, LP George Town 14 22.0<br />
2303 Safron NetOne Partners, L.P. George Town 14 21.7<br />
2304 SCITOR Grundstücks-Vermietungsgesellschaft mbH & Co. Objekt Heiligenstadt KG Duesseldorf 12 71.1<br />
2305 SENA Grundstücks-Vermietungsgesellschaft mbH & Co. Objekt Kamenz KG Duesseldorf 12 100.0<br />
2306 SOLON Grundstücks-Vermietungsgesellschaft mbH & Co. Objekt Heizkraftwerk Halle KG i.L. Halle/Saale 13 30.5<br />
2307 STC Financing Ippan Shadan Hojin Tokyo 13 50.0<br />
2308 SUBLICA Grundstücks-Vermietungsgesellschaft mbH & Co. Objekt Promohypermarkt<br />
Gelsenkirchen KG<br />
Duesseldorf 13 48.7<br />
2309 Sundial Beteiligungsgesellschaft mbH Frankfurt 12 100.0<br />
2310 TIEDO Grundstücks-Vermietungsgesellschaft mbH Duesseldorf 13 50.0<br />
2311 TIEDO Grundstücks-Vermietungsgesellschaft mbH & Co. Objekt Lager Nord KG Duesseldorf 13 25.0<br />
2312 Twirlix Internet Technologies GmbH Frankfurt 14 32.7<br />
2313 Unibanco Participacoes Societárias S.A. Sao Paulo 13 49.0<br />
2314 Value Retail Barcelona, S.L. Barcelona 14 23.4<br />
2315 Value Retail Madrid, S.L. Las Rozas de Madrid 14 26.9<br />
2316 Zenwix Pty. Limited Sydney 12 100.0
<strong>Deutsche</strong> <strong>Bank</strong><br />
02 – Consolidated Financial Statements<br />
370<br />
<strong>Deutsche</strong> <strong>Bank</strong> 02 – Consolidated Financial Statements 370<br />
Financial <strong>Report</strong> 2010<br />
Additional Notes<br />
Financial <strong>Report</strong> 2010 Additional Notes<br />
42 – Shareholdings<br />
42 – Shareholdings<br />
Holdings in large corporations, where the holding exceeds 5 % of voting rights<br />
Holdings in large corporations, where the holding exceeds 5% of voting rights<br />
Serial<br />
Share of<br />
capital<br />
No. Name of company Domicile of company Footnote in %<br />
2317 Abode Mortgage Holdings Corporation Vancouver 8.5<br />
2318 Abraaj Capital Holdings Limited George Town 8.8<br />
2319 BBB Bürgschaftsbank zu Berlin-Brandenburg GmbH Berlin 5.6<br />
2320 Bürgschaftsbank Brandenburg GmbH Potsdam 8.5<br />
2321 Bürgschaftsbank Mecklenburg-Vorpommern GmbH Schwerin 8.4<br />
2322 Bürgschaftsbank Sachsen GmbH Dresden 6.3<br />
2323 Bürgschaftsbank Sachsen-Anhalt GmbH Magdeburg 8.2<br />
2324 Bürgschaftsbank Schleswig-Holstein Gesellschaft mit beschränkter Haftung Kiel 5.7<br />
2325 Bürgschaftsbank Thüringen GmbH Erfurt 8.7<br />
2326 Bürgschaftsgemeinschaft Hamburg GmbH Hamburg 8.7<br />
2327 ConCardis Gesellschaft mit beschränkter Haftung Frankfurt 16.8<br />
2328 EFG Eurobank Properties S.A. Athens 5.8<br />
2329 EURO Kartensysteme Gesellschaft mit beschränkter Haftung Frankfurt 16.8<br />
2330 Hayes Lemmerz International, Inc. Wilmington 10.1<br />
2331 Hua Xia <strong>Bank</strong> Company Limited Beijing 17.1<br />
2332 HumanOptics AG Erlangen 11.2<br />
2333 HYPOPORT AG Berlin 9.7<br />
2334 Ingenious Media Active Capital Limited St. Peter Port 13.9<br />
2335 IVG Institutional Funds GmbH Wiesbaden 6.0<br />
2336 Liquiditäts-Konsortialbank Gesellschaft mit beschränkter Haftung Frankfurt 8.5<br />
2337 Net Sol Holdings LLC Dover 6.5<br />
2338 NexPak Corporation Wilmington 6.5<br />
2339 NÜRNBERGER Beteiligungs-Aktiengesellschaft Nuremberg 6.6<br />
2340 Philipp Holzmann Aktiengesellschaft i.I. Frankfurt 19.5<br />
2341 Prader <strong>Bank</strong> S.p.A. Bolzano 10.0<br />
2342 Private Export Funding Corporation Wilmington 7.5<br />
2343 Reorganized RFS Corporation Wilmington 6.2<br />
2344 Saarländische Investitionskreditbank Aktiengesellschaft Saarbruecken 11.8<br />
2345 SearchMedia Holdings Limited George Town 10.3<br />
2346 Società per il Mercato dei Titoli di Stato - Borsa Obbligazionaria Europea S.p.A. Rome 5.0<br />
2347 The Clearing House Association L.L.C. Wilmington 9.1<br />
2348 United Information Technology Co. Ltd George Town 12.2<br />
2349 3W Power Holdings S.A. Luxembourg 9.2<br />
2350 W.E.T. Automotive Systems Aktiengesellschaft Odelzhausen 9.2
Confirmations<br />
Independent Auditors’ <strong>Report</strong> – 372<br />
Responsibility Statement by the Management Board – 374
<strong>Deutsche</strong> <strong>Bank</strong> 03 – Confirmations 372<br />
Financial <strong>Report</strong> 2010 Independent Auditors’ <strong>Report</strong><br />
Independent Auditors’ <strong>Report</strong><br />
To <strong>Deutsche</strong> <strong>Bank</strong> Aktiengesellschaft, Frankfurt am Main<br />
<strong>Report</strong> on the consolidated financial statements<br />
We have audited the accompanying consolidated financial statements of <strong>Deutsche</strong> <strong>Bank</strong> Aktiengesellschaft<br />
and its subsidiaries, which comprise the consolidated statement of income, the consolidated statement of<br />
comprehensive income, the consolidated balance sheet, the consolidated statement of changes in equity, the<br />
consolidated statement of cash flows, and notes to the consolidated financial statements for the business year<br />
from January 1 to December 31, 2010.<br />
Management’s Responsibility for the Consolidated Financial Statements<br />
The management of <strong>Deutsche</strong> <strong>Bank</strong> Aktiengesellschaft is responsible for the preparation of these consolidated<br />
financial statements. This responsibility includes preparing these consolidated financial statements in accordance<br />
with International Financial <strong>Report</strong>ing Standards as adopted by the EU, the supplementary requirements<br />
of German law pursuant to § [Article] 315a Abs. [paragraph] 1 HGB [Handelsgesetzbuch: German Commercial<br />
Code], and full IFRS to give a true and fair view of the net assets, financial position and results of operations of<br />
the group in accordance with these requirements. The company’s management is also responsible for the<br />
internal controls that management determines are necessary to enable the preparation of consolidated financial<br />
statements that are free from material misstatement, whether due to fraud or error.<br />
Auditor’s Responsibility<br />
Our responsibility is to express an opinion on these consolidated financial statements based on our audit. We<br />
conducted our audit in accordance with § 317 HGB and German generally accepted standards for the audit of<br />
financial statements promulgated by the Institut der Wirtschaftsprüfer [Institute of Public Auditors in Germany]<br />
(IDW) as well as in supplementary compliance with the standards of the Public Company Accounting Oversight<br />
Board (United States). Accordingly, we are required to comply with ethical requirements and plan and perform<br />
the audit to obtain reasonable assurance about whether the consolidated financial statements are free from<br />
material misstatement.<br />
An audit involves performing audit procedures to obtain audit evidence about the amounts and disclosures in<br />
the consolidated financial statements. The selection of audit procedures depends on the auditor’s professional<br />
judgment. This includes the assessment of the risks of material misstatement of the consolidated financial<br />
statements, whether due to fraud or error. In assessing those risks, the auditor considers the internal control<br />
system relevant to the entity’s preparation of the consolidated financial statements that give a true and fair view.<br />
The aim of this is to plan and perform audit procedures that are appropriate in the given circumstances, but not<br />
for the purpose of expressing an opinion on the effectiveness of the group’s internal control system. An audit<br />
also includes evaluating the appropriateness of accounting policies used and the reasonableness of accounting<br />
estimates made by management, as well as evaluating the overall presentation of the consolidated financial<br />
statements.<br />
We believe that the audit evidence we have obtained is sufficient and appropriate to provide a basis for our<br />
audit opinion.
<strong>Deutsche</strong> <strong>Bank</strong> 03 – Confirmations 373<br />
Financial <strong>Report</strong> 2010 Independent Auditors’ <strong>Report</strong><br />
Audit Opinion<br />
Pursuant to § 322 Abs.3 Satz 1 HGB, we state that our audit of the consolidated financial statements has not<br />
led to any reservations.<br />
In our opinion, based on the findings of our audit, the consolidated financial statements comply in all material<br />
respects with IFRSs as adopted by the EU, the supplementary requirements of German commercial law pursuant<br />
to § 315a Abs. 1 HGB, and full IFRS and give a true and fair view of the net assets and financial position<br />
of the Group as at December 31, 2010 as well as the results of operations for the business year then ended, in<br />
accordance with these requirements.<br />
<strong>Report</strong> on the Group Management <strong>Report</strong><br />
We have audited the accompanying group management report of <strong>Deutsche</strong> <strong>Bank</strong> Aktiengesellschaft for the<br />
business year from January 1 to December 31, 2010. The management of <strong>Deutsche</strong> <strong>Bank</strong> Aktiengesellschaft<br />
is responsible for the preparation of the group management report in compliance with the applicable requirements<br />
of German commercial law pursuant to § [Article] 315a Abs. [paragraph] 1 HGB [Handelsgesetzbuch:<br />
German Commercial Code]. We are required to conduct our audit in accordance with § 317 Abs. 2 HGB and<br />
German generally accepted standards for the audit of the group management report promulgated by the Institut<br />
der Wirtschaftsprüfer [Institute of Public Auditors in Germany] (IDW). Accordingly, we are required to plan<br />
and perform the audit of the group management report to obtain reasonable assurance about whether the<br />
group management report is consistent with the consolidated financial statements and the audit findings, and<br />
as a whole provides a suitable view of the Group’s position and suitably presents the opportunities and risks of<br />
future development.<br />
Pursuant to § 322 Abs. 3 Satz 1 HGB, we state that our audit of the group management report has not led to<br />
any reservations.<br />
In our opinion, based on the findings of our audit of the consolidated financial statements and group management<br />
report, the group management report is consistent with the consolidated financial statements, and as a<br />
whole provides a suitable view of the Group’s position and suitably presents the opportunities and risks of<br />
future development.<br />
Frankfurt am Main, March 4, 2011<br />
KPMG AG<br />
Wirtschaftsprüfungsgesellschaft<br />
Dielehner<br />
Wirtschaftsprüfer<br />
Bose<br />
Wirtschaftsprüfer
<strong>Deutsche</strong> <strong>Bank</strong> 03 – Confirmations 374<br />
Financial <strong>Report</strong> 2010 Responsibility Statement by the Management Board<br />
Responsibility Statement by the Management Board<br />
To the best of our knowledge, and in accordance with the applicable reporting principles, the consolidated<br />
financial statements give a true and fair view of the assets, liabilities, financial position and profit or loss of the<br />
Group, and the Group management report includes a fair review of the development and performance of the<br />
business and the position of the Group, together with a description of the principal opportunities and risks associated<br />
with the expected development of the Group.<br />
Frankfurt am Main, March 1, 2011<br />
Josef Ackermann Hugo Bänziger Jürgen Fitschen<br />
Anshuman Jain Stefan Krause Hermann-Josef Lamberti<br />
Rainer Neske
Corporate Governance Statement /<br />
Corporate Governance <strong>Report</strong><br />
Management Board and Supervisory Board – 376<br />
<strong>Report</strong>ing and Transparency – 386<br />
Related Party Transactions – 387<br />
Auditing and Controlling – 387<br />
Compliance with the German Corporate Governance Code – 389
<strong>Deutsche</strong> <strong>Bank</strong> 04 – Corporate Governance Statement/Corporate Governance <strong>Report</strong> 376<br />
Financial <strong>Report</strong> 2010 Management Board and Supervisory Board<br />
Corporate Governance Statement /<br />
Corporate Governance <strong>Report</strong><br />
All information presented in this Corporate Governance Statement/Corporate Governance <strong>Report</strong> is shown as<br />
of February 18, 2011.<br />
Management Board and Supervisory Board<br />
Management Board<br />
The Management Board is responsible for managing the company. Its members are jointly accountable for the<br />
management of the company. The duties, responsibilities and procedures of our Management Board and the<br />
committees installed by it are specified in its Terms of Reference, which are available in the respectively current<br />
version on our Internet website (www.deutsche-bank.com/corporate-governance).<br />
Michael Cohrs retired from the Management Board on September 30, 2010. His functional responsibilities were<br />
assumed by Mr. Jain in addition to his existing tasks. The following paragraphs show information on the current<br />
members of the Management Board. The information includes their ages, the year in which they were appointed<br />
and the year in which their term expires, their current positions and area of responsibility and their principal<br />
business activities outside our company. The members of our Management Board have generally undertaken<br />
not to assume chairmanships of supervisory boards of companies outside our consolidated group.<br />
Dr. Josef Ackermann<br />
Age: 63<br />
First appointed: 1996<br />
Term expires: 2013<br />
Dr. Josef Ackermann joined <strong>Deutsche</strong> <strong>Bank</strong> as a member of our Management Board in 1996, where he was<br />
responsible for the investment banking division. On May 22, 2002, Dr. Ackermann was appointed Spokesman<br />
of the Management Board. On February 1, 2006, he was appointed Chairman of the Management Board.<br />
After studying Economics and Social Sciences at the University of St. Gallen, he worked at the University’s<br />
Institute of Economics as research assistant and received a doctorate in Economics. Dr. Ackermann started his<br />
professional career in 1977 at Schweizerische Kreditanstalt (SKA) where he held a variety of positions in Corporate<br />
<strong>Bank</strong>ing, Foreign Exchange/Money Markets and Treasury, Investment <strong>Bank</strong>ing and Multinational Services.<br />
He worked in London and New York, as well as at several locations in Switzerland. Between 1993 and<br />
1996, he served as President of SKA’s Executive Board, following his appointment to that board in 1990.<br />
Dr. Ackermann is a member of the Supervisory Board of Siemens AG (Second Deputy Chairman), Vice-Chairman<br />
of the Board of Directors of Belenos Clean Power Holding Ltd., non-executive member of the Board of Directors<br />
of Royal Dutch Shell Plc and Vice-Chairman of the Board of Directors of Zurich Financial Services Ltd.
<strong>Deutsche</strong> <strong>Bank</strong> 04 – Corporate Governance Statement/Corporate Governance <strong>Report</strong> 377<br />
Financial <strong>Report</strong> 2010 Management Board and Supervisory Board<br />
Dr. Hugo Bänziger<br />
Age: 55<br />
First appointed: 2006<br />
Term expires: 2014<br />
Dr. Hugo Bänziger became a member of our Management Board on May 4, 2006. He is our Chief Risk Officer.<br />
He joined <strong>Deutsche</strong> <strong>Bank</strong> in London in 1996 as Head of Global Markets Credit. He was appointed Chief Credit<br />
Officer in 2000 and became Chief Risk Officer for Credit and Operational Risk in 2004.<br />
Dr. Bänziger began his career in 1983 at the Swiss Federal <strong>Bank</strong>ing Commission in Berne. From 1985 to 1996,<br />
he worked at Schweizerische Kreditanstalt (SKA) in Zurich and London, first in Retail <strong>Bank</strong>ing and subsequently<br />
as Relationship Manager in Corporate Finance. In 1990 he was appointed Global Head of Credit for CS Financial<br />
Products.<br />
He studied Modern History, Law and Economics at the University of Berne, where he subsequently earned a<br />
doctorate in Economic History.<br />
Dr. Bänziger is a member of the Supervisory Board of EUREX Clearing AG, member of the Supervisory Board<br />
of EUREX Frankfurt AG and a member of the Supervisory Board of EUREX Zürich AG.<br />
Jürgen Fitschen<br />
Age: 62<br />
Appointed: 2009<br />
Term expires: <strong>2012</strong><br />
Jürgen Fitschen became a member of our Management Board on April 1, 2009. Mr. Fitschen has been with<br />
<strong>Deutsche</strong> <strong>Bank</strong> since 1987, was already a member of the Management Board from 2001 to the beginning of<br />
2002 and has been a member of the Group Executive Committee since 2002 and Head of Regional Management<br />
since 2005. As member of our Management Board, he is responsible for Regional Management.<br />
Mr. Fitschen studied Economics and Business Administration at the University of Hamburg and graduated in<br />
1975 with a master’s degree in Business Administration.<br />
From 1975 to 1987, he worked at Citibank in Hamburg and Frankfurt am Main in various positions. In 1983 he<br />
was appointed member of the Executive Committee Germany of Citibank.<br />
Mr. Fitschen is a member of the Board of Directors of Kühne + Nagel International AG, member of the Supervisory<br />
Board of METRO AG and member of the Supervisory Board of Schott AG.
<strong>Deutsche</strong> <strong>Bank</strong> 04 – Corporate Governance Statement/Corporate Governance <strong>Report</strong> 378<br />
Financial <strong>Report</strong> 2010 Management Board and Supervisory Board<br />
Anshuman Jain<br />
Age: 48<br />
First Appointed: 2009<br />
Term expires: <strong>2012</strong><br />
Anshuman Jain became a member of our Management Board on April 1, 2009. Mr. Jain joined <strong>Deutsche</strong> <strong>Bank</strong><br />
in 1995 and became Head of Global Markets in 2001 as well as a member of the Group Executive Committee<br />
in 2002. As member of our Management Board, he is responsible for the Corporate & Investment <strong>Bank</strong> Group<br />
Division.<br />
Mr. Jain studied Economics at Shri Ram College (Delhi University) and graduated in 1983, receiving a BA, and<br />
studied Business Administration at the University of Massachusetts and graduated in 1985 with a MBA Finance.<br />
After his academic studies Mr. Jain worked until 1988 for Kidder Peabody, New York in Derivatives Research;<br />
from 1988 to 1995 he set up and ran the global hedge fund coverage group for Merrill Lynch, New York.<br />
Mr. Jain was a non-executive Director of Sasol Ltd. until November 2010.<br />
Stefan Krause<br />
Age: 48<br />
First appointed: 2008<br />
Term expires: 2013<br />
Stefan Krause became a member of our Management Board on April 1, 2008. He is our Chief Financial Officer.<br />
Previously, Mr. Krause spent over 20 years in the automotive industry, holding various senior management<br />
positions with a strong focus on Finance and Financial Services. Starting in 1987 at BMW’s Controlling department<br />
in Munich, he transferred to the U.S. in 1993, building up and ultimately heading BMW’s Financial<br />
Services Division in the Americas. Relocating to Munich in 2001, he became Head of Sales Western Europe<br />
(excluding Germany). He was appointed member of the Management Board of BMW Group in May 2002,<br />
serving as Chief Financial Officer until September 2007 and subsequently as Chief of Sales & Marketing.<br />
Mr. Krause studied Business Administration in Würzburg and graduated in 1986 with a master’s degree in<br />
Business Administration.<br />
Mr. Krause does not have any external directorships subject to disclosure.
<strong>Deutsche</strong> <strong>Bank</strong> 04 – Corporate Governance Statement/Corporate Governance <strong>Report</strong> 379<br />
Financial <strong>Report</strong> 2010 Management Board and Supervisory Board<br />
Hermann-Josef Lamberti<br />
Age: 55<br />
First appointed: 1999<br />
Term expires: 2014<br />
Hermann-Josef Lamberti became a member of our Management Board in 1999. He is our Chief Operating<br />
Officer. He joined <strong>Deutsche</strong> <strong>Bank</strong> in 1998 as an Executive Vice President, based in Frankfurt.<br />
Mr. Lamberti began his professional career in 1982 with Touche Ross in Toronto and subsequently joined Chemical<br />
<strong>Bank</strong> in Frankfurt. From 1985 to 1998 he worked for IBM, initially in Germany in the areas Controlling, Internal<br />
Application Development and Sales <strong>Bank</strong>s/Insurance Companies. In 1993, he was appointed General Manager<br />
of the Personal Software Division for Europe, the Middle East and Africa at IBM Europe in Paris. In 1995, he<br />
moved to IBM in the U.S., where he was Vice President for Marketing and Brand Management. He returned to<br />
Germany in 1997 to take up the position of Chairman of the Management of IBM Germany in Stuttgart.<br />
Mr. Lamberti studied Business Administration at the Universities of Cologne and Dublin and graduated in 1982<br />
with a master’s degree in Business Administration.<br />
Mr. Lamberti is a member of the Supervisory Boards of BVV Versicherungsverein des <strong>Bank</strong>gewerbes a.G.,<br />
BVV Versorgungskasse des <strong>Bank</strong>gewerbes e.V., BVV Pensionsfonds des <strong>Bank</strong>gewerbes AG, <strong>Deutsche</strong> Börse<br />
AG, member of the Board of Directors of European Aeronautic Defence and Space Company EADS N.V. and<br />
member of the Supervisory Board of Carl Zeiss AG.<br />
Rainer Neske<br />
Age: 46<br />
First Appointed: 2009<br />
Term expires: <strong>2012</strong><br />
Rainer Neske became a member of our Management Board on April 1, 2009. He joined <strong>Deutsche</strong> <strong>Bank</strong> in<br />
1990 and in 2000 was appointed member of the Management Board of <strong>Deutsche</strong> <strong>Bank</strong> Privat- und Geschäftskunden<br />
AG. Since 2003 he has been a member of the Group Executive Committee and Spokesman of the<br />
Management Board of <strong>Deutsche</strong> <strong>Bank</strong> Privat- und Geschäftskunden AG. On our Management Board, he is<br />
responsible for our Private & Business Clients Corporate Division.<br />
Mr. Neske studied Computer Science and Business Administration at the University of Karlsruhe and graduated<br />
in 1990 with a master’s degree in Information Technology.<br />
Mr. Neske does not have any external directorships subject to disclosure.
<strong>Deutsche</strong> <strong>Bank</strong> 04 – Corporate Governance Statement/Corporate Governance <strong>Report</strong> 380<br />
Financial <strong>Report</strong> 2010 Management Board and Supervisory Board<br />
Group Executive Committee<br />
The Group Executive Committee was established in 2002. It comprises the members of the Management Board<br />
and senior representatives from the business divisions within our client-facing group divisions and from the<br />
management of our regions appointed by the Management Board. Dr. Josef Ackermann, Chairman of the<br />
Management Board, is also the Chairman of the Group Executive Committee.<br />
The Group Executive Committee serves as a tool to coordinate our businesses and regions through the following<br />
tasks and responsibilities:<br />
— Provision of ongoing information to the Management Board on business developments and particular transactions;<br />
— Regular review of our business segments;<br />
— Consultation with and furnishing advice to the Management Board on strategic decisions;<br />
— Preparation of decisions to be made by the Management Board.<br />
Supervisory Board<br />
The Supervisory Board appoints, supervises and advises the Management Board and is directly involved in<br />
decisions of fundamental importance to the bank. The Management Board regularly informs the Supervisory<br />
Board of the intended business policies and other fundamental matters relating to the assets, liabilities, financial<br />
and profit situation as well as its risk situation, risk management and risk controlling. A report is made to the<br />
Supervisory Board on corporate planning at least once a year. At the proposal of the Chairperson’s Committee,<br />
the Supervisory Board determines the compensation of the individual members of the Management Board<br />
including the main contract elements and reviews it regularly. The Chairman of the Supervisory Board coordinates<br />
work within the Supervisory Board. He maintains regular contact with the Management Board, especially<br />
with the Chairman of the Management Board, and consults with him on strategy, the development of business<br />
and risk management. The Supervisory Board Chairman is informed by the Chairman of the Management<br />
Board without delay of important events of substantial significance for the situation and development as well as<br />
for the management of <strong>Deutsche</strong> <strong>Bank</strong> Group. The types of business that require the approval of the Supervisory<br />
Board to be transacted are specified in Section 13 of our Articles of Association. The Supervisory Board<br />
meets if required without the Management Board. For the performance of its duties, the Supervisory Board<br />
may, at its professional discretion, use the services of auditors, legal advisors and other internal and external<br />
consultants.<br />
The duties, procedures and committees of the Supervisory Board are specified in its Terms of Reference,<br />
which are available in the respectively current version on the <strong>Deutsche</strong> <strong>Bank</strong> Internet website (www.deutschebank.com/corporate-governance).<br />
The following table shows information on the current members of our Supervisory Board. The members representing<br />
our shareholders were elected at the <strong>Annual</strong> General Meeting on May 29, 2008, except for Dr. Siegert,<br />
who was elected at the <strong>Annual</strong> General Meeting 2007 until the end of the <strong>Annual</strong> General Meeting <strong>2012</strong>. The<br />
members elected by employees in Germany were elected on May 8, 2008. The information includes the members’<br />
age, the years in which they were first elected or appointed, the years when their terms expire, their principal<br />
occupation and their membership on other companies’ supervisory boards, other nonexecutive directorships<br />
and other positions.
<strong>Deutsche</strong> <strong>Bank</strong> 04 – Corporate Governance Statement/Corporate Governance <strong>Report</strong> 381<br />
Financial <strong>Report</strong> 2010 Management Board and Supervisory Board<br />
Member Principal occupation Supervisory board memberships and other directorships<br />
Wolfgang Böhr*<br />
Chairman of the Combined Staff Council Dusseldorf of No memberships or directorships subject to disclosure<br />
Age: 48<br />
<strong>Deutsche</strong> <strong>Bank</strong>; Member of the General Staff Council of<br />
First elected: 2008<br />
<strong>Deutsche</strong> <strong>Bank</strong>; Member of the Group Staff Council of<br />
Term expires: 2013<br />
<strong>Deutsche</strong> <strong>Bank</strong> (since June 2010)<br />
Dr. Clemens Börsig<br />
Chairman of the Supervisory Board of <strong>Deutsche</strong> <strong>Bank</strong> AG, Linde AG; Bayer AG; Daimler AG; Emerson Electric<br />
Age: 62<br />
Appointed by the court: 2006<br />
Term expires: 2013<br />
Frankfurt<br />
Company<br />
Dr. Karl-Gerhard Eick<br />
Management consultant, KGE Asset Management<br />
CORPUS SIREO Holding GmbH & Co. KG (Chairman)<br />
Age: 57<br />
Appointed by the court: 2004<br />
Term expires: 2013<br />
Consulting Ltd., London<br />
Alfred Herling*<br />
Chairman of the Combined Staff Council<br />
No memberships or directorships subject to disclosure<br />
Age: 58<br />
Wuppertal/Sauerland of <strong>Deutsche</strong> <strong>Bank</strong>; Deputy Chairman<br />
First elected: 2008<br />
of the General Staff Council; Chairman of the European Staff<br />
Term expires: 2013<br />
Council (until March 2010); Chairman of the Group Staff<br />
Council of <strong>Deutsche</strong> <strong>Bank</strong> (since June 2010)<br />
Gerd Herzberg*<br />
Deputy Chairman of ver.di Vereinte<br />
Franz Haniel & Cie GmbH (Deputy Chairman); BGAG –<br />
Age: 60<br />
Dienstleistungsgewerkschaft, Berlin<br />
Beteiligungsgesellschaft der Gewerkschaften AG; Vattenfall<br />
Appointed by the court: 2006<br />
Term expires: 2013<br />
Europe AG (Deputy Chairman)<br />
Sir Peter Job<br />
Schroders Plc (until July 2010); Tibco Software Inc.; Royal<br />
Age: 69<br />
Appointed by the court: 2001<br />
Term expires: 2011<br />
Dutch Shell Plc (until May 2010)<br />
Prof. Dr. Henning Kagermann President of acatech – German Academy of Science and Münchener Rückversicherungs-Gesellschaft<br />
Age: 63<br />
Engineering, Munich<br />
Aktiengesellschaft; Nokia Corporation; <strong>Deutsche</strong> Post AG;<br />
First elected: 2000<br />
Wipro Technologies; BMW Bayerische Motoren Werke AG<br />
Term expires: 2013<br />
(since May 2010)<br />
Peter Kazmierczak*<br />
Age: 53<br />
First elected: 2002<br />
Term expires: 2013<br />
Employee of <strong>Deutsche</strong> <strong>Bank</strong> AG, Essen No memberships of directorships subject to disclosure<br />
Martina Klee*<br />
Chairperson of the Staff Council GTO Eschborn/Frankfurt of Sterbekasse für die Angestellten der <strong>Deutsche</strong>n <strong>Bank</strong> VV a.G.<br />
Age: 48<br />
<strong>Deutsche</strong> <strong>Bank</strong>;<br />
First elected: 2008<br />
Member of the General Staff Council of <strong>Deutsche</strong> <strong>Bank</strong>;<br />
Term expires: 2013<br />
Member of the Group Staff Council of <strong>Deutsche</strong> <strong>Bank</strong><br />
(since June 2010)<br />
Suzanne Labarge<br />
Age: 64<br />
First elected: 2008<br />
Term expires: 2013<br />
Coca-Cola Enterprises Inc.<br />
Maurice Lévy<br />
Chairman and Chief Executive Officer, Publicis Groupe S.A., Publicis Conseil S.A. (Chairman); Medias et Régies Europe<br />
Age: 69<br />
Paris<br />
S.A.; MMS USA Holdings, Inc.; Zenith Optimedia Group Ltd.<br />
First elected: 2006<br />
(U.K.); Publicis Groupe U.S. Investments LLC; MMS USA<br />
Term expires: <strong>2012</strong><br />
Investments, Inc.; MMS USA LLC Investments, Inc.<br />
Henriette Mark*<br />
Chairperson of the Combined Staff Council Munich and No memberships or directorships subject to disclosure<br />
Age: 53<br />
Southern Bavaria of <strong>Deutsche</strong> <strong>Bank</strong>; Member of the Group<br />
First elected: 2003<br />
and General Staff Councils of <strong>Deutsche</strong> <strong>Bank</strong>; Chairperson<br />
Term expires: 2013<br />
of the European Staff Council<br />
* Elected by the employees in Germany.
<strong>Deutsche</strong> <strong>Bank</strong> 04 – Corporate Governance Statement/Corporate Governance <strong>Report</strong> 382<br />
Financial <strong>Report</strong> 2010 Management Board and Supervisory Board<br />
Member Principal occupation Supervisory board memberships and other directorships<br />
Gabriele Platscher*<br />
Age: 53<br />
First elected: 2003<br />
Term expires: 2013<br />
Karin Ruck*<br />
Age: 45<br />
First elected: 2003<br />
Term expires: 2013<br />
Dr. Theo Siegert<br />
Age: 63<br />
First elected: 2006<br />
Term expires <strong>2012</strong><br />
Dr. Johannes Teyssen<br />
Age: 51<br />
First elected: 2008<br />
Term expires: 2013<br />
Marlehn Thieme*<br />
Age: 53<br />
First elected: 2008<br />
Term expires: 2013<br />
Tilman Todenhöfer<br />
Age: 67<br />
Appointed by the court: 2001<br />
Term expires: 2013<br />
Stefan Viertel*<br />
Age. 46<br />
First elected: 2008<br />
Term expires: 2013<br />
Werner Wenning<br />
Age: 64<br />
First elected: 2008<br />
Term expires: 2013<br />
* Elected by the employees in Germany.<br />
Chairperson of the Combined Staff Council<br />
Braunschweig/Hildesheim of <strong>Deutsche</strong> <strong>Bank</strong>; Member of<br />
the Group and General Staff Councils of <strong>Deutsche</strong> <strong>Bank</strong><br />
(until April 2010)<br />
Deputy Chairperson of the Supervisory Board of<br />
<strong>Deutsche</strong> <strong>Bank</strong> AG; Senior Sales Coach in the Region<br />
Frankfurt/Hesse-East; Member of the Combined Staff<br />
Council Frankfurt branch of <strong>Deutsche</strong> <strong>Bank</strong><br />
Managing Partner of de Haen Carstanjen & Söhne,<br />
Dusseldorf<br />
Chairman of the Management Board of E.ON AG,<br />
Dusseldorf (since May 2010)<br />
Director Infrastructure/Regional Management<br />
Communications Corporate Citizenship <strong>Deutsche</strong> <strong>Bank</strong> AG,<br />
Frankfurt<br />
Managing Partner of Robert Bosch Industrietreuhand KG,<br />
Stuttgart<br />
Senior Sales Manager CIB/GTB Cash Management<br />
Financial Institutions, Head of CMFI Austria and Hungary<br />
<strong>Deutsche</strong> <strong>Bank</strong> AG, Frankfurt<br />
Chairman of the Management Board of Bayer AG,<br />
Leverkusen (until September 2010)<br />
BVV Versicherungsverein des <strong>Bank</strong>gewerbes a.G. (Deputy<br />
Chairperson); BVV Versorgungskasse des <strong>Bank</strong>gewerbes e.V.<br />
(Deputy Chairperson); BVV Pensionsfonds des<br />
<strong>Bank</strong>gewerbes AG (Deputy Chairperson)<br />
<strong>Deutsche</strong> <strong>Bank</strong> Privat- und Geschäftskunden AG<br />
(until December 2010);<br />
BVV Versicherungsverein des <strong>Bank</strong>gewerbes a.G.;<br />
BVV Versorgungskasse des <strong>Bank</strong>gewerbes e.V.;<br />
BVV Pensionsfonds des <strong>Bank</strong>gewerbes AG<br />
E.ON AG; ERGO AG (until May 2010); Merck KGaA;<br />
E. Merck OHG (Member of the Shareholders’ Committee);<br />
DKSH Holding Ltd. (Member of the Board of Administration);<br />
Henkel AG & Co. KGaA<br />
E.ON Energie AG; E.ON Ruhrgas AG; E.ON Energy Trading<br />
SE (Chairman) (until June 2010); Salzgitter AG; E.ON Nordic<br />
AB (until June 2010); E.ON Sverige AB (until August 2010);<br />
E.ON Italia S.p.A. (formerly E.ON Italia Holding s.r.l.) (until<br />
August 2010); E.ON US Investments Corp. (Chairman)<br />
(since May 2010)<br />
No memberships or directorships subject to disclosure<br />
Robert Bosch GmbH; Robert Bosch Internationale<br />
Beteiligungen AG (President of the Board of Administration);<br />
HOCHTIEF AG<br />
No memberships of directorships subject to disclosure<br />
E.ON AG; Henkel AG & Co. KGaA (Member of the<br />
Shareholders’ Committee); HDI VVa.G.; Talanx AG<br />
Leo Wunderlich was an employee representative member of the Supervisory Board until June 30, 2010. After<br />
his retirement from the <strong>Bank</strong>, he was replaced by Peter Kazmierczak, his elected substitute, for the remainder<br />
of the term of office. Mr. Kazmierczak was first elected to the Supervisory Board in 2002 and his first mandate<br />
ended in 2003. He was again a member of the Supervisory Board from 2006 to 2008.<br />
Heidrun Förster was a member of the Supervisory Board until July 31, 2010. Stefan Viertel followed her as her<br />
elected substitute for the remainder of the term of office.<br />
Dr. Clemens Börsig was a member of the Management Board of <strong>Deutsche</strong> <strong>Bank</strong> AG until May 3, 2006. Dr. Börsig<br />
has declared that he would abstain from voting in his function as member of the Supervisory Board and its<br />
committees on all questions that relate to his former membership of the Management Board and could create<br />
a conflict of interest.
<strong>Deutsche</strong> <strong>Bank</strong> 04 – Corporate Governance Statement/Corporate Governance <strong>Report</strong> 383<br />
Financial <strong>Report</strong> 2010 Management Board and Supervisory Board<br />
In accordance with the German <strong>Bank</strong>ing Act, members of the Supervisory Board must be reliable and have<br />
the expertise required to perform their control function and to assess and supervise the businesses the company<br />
operates. While taking these requirements into account in accordance with Section 5.4.1 of the German<br />
Corporate Governance Code, the Supervisory Board established the following objectives for its composition,<br />
which have also been specified in Section 4 of the Terms of Reference for the Supervisory Board (see:<br />
http://www.deutsche-bank.de/ir/en/content/terms_of_references.htm).<br />
The Supervisory Board of <strong>Deutsche</strong> <strong>Bank</strong> AG must be composed in such a way that its members as a group<br />
possess the knowledge, ability and expert experience to properly complete its tasks. The composition of the<br />
Supervisory Board should ensure the Supervisory Board’s qualified control of and advice for the Management<br />
Board of an internationally operating, broadly positioned bank and should preserve the reputation of <strong>Deutsche</strong><br />
<strong>Bank</strong> Group among the public. In this regard, in particular, attention should be placed on the integrity, personality,<br />
willingness to perform, professionalism and independence of the individuals proposed for election. The<br />
objective is for the Supervisory Board as a group to have all of the knowledge and experience considered to be<br />
essential in consideration of the activities of <strong>Deutsche</strong> <strong>Bank</strong> Group.<br />
Furthermore, the Supervisory Board shall have an adequate number of independent members and shall not<br />
have more than two former members of the Management Board of <strong>Deutsche</strong> <strong>Bank</strong> AG. In particular, the Supervisory<br />
Board members should have sufficient time to perform their mandates. The members of the Supervisory<br />
Board may not exercise functions on a management body of or perform advisory duties at major competitors.<br />
Important and not just temporary conflicts of interests shall be avoided. Any member of the Supervisory Board<br />
who is a member of the management board of a listed stock corporation shall have no more than three supervisory<br />
board mandates outside the group of companies controlled by such stock corporation’s dependent companies<br />
or mandates in supervisory bodies of companies with similar requirements.<br />
There is a regular maximum age limit of 70. In well-founded, individual cases, a Supervisory Board member<br />
may be elected or appointed for a period that extends at the latest until the end of the third Ordinary General<br />
Meeting that takes place after he or she has reached the age of 70. This age limit was taken into account in the<br />
election proposals to the recent General Meetings and shall also be taken into account for the next Supervisory<br />
Board elections or subsequent appointments for Supervisory Board positions that become vacant.<br />
The Supervisory Board respects diversity when proposing members for appointment to the Supervisory Board.<br />
In light of the international operations of <strong>Deutsche</strong> <strong>Bank</strong>, care should be taken that the Supervisory Board has<br />
an appropriate number of members with international experience. Currently, the professional careers and private<br />
lives of five members of the Supervisory Board are centered outside Germany. Furthermore, all of the<br />
shareholder representatives on the Supervisory Board have several years of international experience from<br />
their current or former activities as management board members or CEOs of corporations with international<br />
operations. In these two ways, the Supervisory Board believes the international activities of the company are<br />
sufficiently taken into account. The objective is to retain the currently existing international profile.<br />
For the election proposals to the General Meeting, the Supervisory Board takes care that there is an appropriate<br />
consideration of women. Special importance was already attached to this in the selection process for the<br />
last Supervisory Board elections in 2008. In reviewing potential candidates for a new election or subsequent<br />
appointments to Supervisory Board positions that have become vacant, qualified women shall be included in<br />
the selection process and shall be appropriately considered in the election proposals. Since the Supervisory<br />
Board elections in 2003, between 25 % and 35 % of the Supervisory Board members have been women. Six<br />
women are currently members of the Supervisory Board, which corresponds to 30 %. We shall strive to at least<br />
maintain this number and if possible to increase the number of women among the shareholder representatives.
<strong>Deutsche</strong> <strong>Bank</strong> 04 – Corporate Governance Statement/Corporate Governance <strong>Report</strong> 384<br />
Financial <strong>Report</strong> 2010 Management Board and Supervisory Board<br />
It should be taken into account that the Supervisory Board can only influence the composition of the Supervisory<br />
Board through its election proposals to the General Meeting (for information on <strong>Deutsche</strong> <strong>Bank</strong>’s various<br />
diversity initiatives, please see page 55 of the <strong>Annual</strong> Review 2010, which is available from http://www.deutsche-<br />
bank.de/ir/en/content/reports_2010.htm, http://www.banking-on-green.com/en/content/acting_sustainably/<br />
diversity_management.html and <strong>Deutsche</strong> <strong>Bank</strong>’s Career Portal on the Internet at http://www.deutschebank.de/careers/content/en/to_diversity.html).<br />
According to Section 5.4.2 of the German Corporate Governance Code, the Supervisory Board determined<br />
that it has what it considers to be an adequate number of independent members.<br />
Standing Committees<br />
The Supervisory Board has established the following five standing committees. The <strong>Report</strong> of the Supervisory<br />
Board provides information on the concrete work to the committees over the preceding year (see <strong>Report</strong> of the<br />
Supervisory Board on pages 43 – 49 of the Financial <strong>Report</strong> 2010).<br />
Chairman’s Committee: The Chairman’s Committee is responsible for all Management Board and Supervisory<br />
Board matters. It prepares the decisions for the Supervisory Board on the appointment and dismissal of members<br />
of the Management Board, including long-term succession planning. It also submits a proposal to the<br />
Supervisory Board for the remuneration of the members of the Management Board. It is responsible for entering<br />
into, amending and terminating the service contracts and other agreements in consideration of the Supervisory<br />
Board’s sole authority to decide on the remuneration of the members of the Management Board and<br />
provides its approval for ancillary activities, honorary offices or special tasks outside of <strong>Deutsche</strong> <strong>Bank</strong> Group<br />
of Management Board members pursuant to Section 112 of the German Stock Corporation Act and for certain<br />
contracts with Supervisory Board members pursuant to Section 114 of the German Stock Corporation Act.<br />
Furthermore, it prepares the decisions of the Supervisory Board in the field of corporate governance. The<br />
Chairman’s Committee held ten meetings as well as two telephone conferences in 2010.<br />
The current members of the Chairman’s Committee are Dr. Clemens Börsig (Chairman), Alfred Herling (since<br />
August 2010), Karin Ruck and Tilman Todenhöfer.<br />
Nomination Committee: The Nomination Committee prepares the Supervisory Board’s proposals for the election<br />
or appointment of new shareholder representatives to the Supervisory Board. In this context, it orients itself<br />
on the criteria specified by the Supervisory Board for its composition. The Nomination Committee held no<br />
meetings in 2010.<br />
The current members of the Nomination Committee are Dr. Clemens Börsig (Chairman), Tilman Todenhöfer<br />
and Werner Wenning.<br />
Audit Committee: The Audit Committee handles in particular the monitoring of financial accounting, including<br />
the accounting process and the effectiveness of the system of internal controls, issues of risk management and<br />
especially the effectiveness of the risk management system, as well as the effectiveness of the internal audit<br />
system, compliance and the auditing of annual financial statements. It reviews the documentation relating to<br />
the annual and consolidated financial statements and discusses the audit reports with the auditor. It prepares<br />
the decisions of the Supervisory Board on the annual financial statements and the approval of the consolidated<br />
financial statements and discusses important changes to the audit and accounting methods. The Audit Committee<br />
also discusses the quarterly financial statements and the report on the limited review of the quarterly<br />
financial statements with the Management Board and the auditor prior to their publication. In addition, the Audit<br />
Committee issues the audit mandate to the auditor elected by the General Meeting. It resolves on the compen-
<strong>Deutsche</strong> <strong>Bank</strong> 04 – Corporate Governance Statement/Corporate Governance <strong>Report</strong> 385<br />
Financial <strong>Report</strong> 2010 Management Board and Supervisory Board<br />
sation paid to the auditor and monitors the auditor’s independence, qualifications and efficiency. The Chairman<br />
of the Audit Committee, as well as the Chairman of the Supervisory Board, is entitled to obtain information<br />
directly from the Head of Compliance. The Audit Committee is responsible for acknowledging communications<br />
about significant reductions in the compliance budget and for taking receipt of and handling the report by the<br />
Head of Compliance on the appropriateness and effectiveness of the principles, methods and procedures in<br />
accordance with § 33 (1) sentence 2 No. 5 of the German Securities Trading Act (WpHG) (Compliance <strong>Report</strong>).<br />
The Compliance <strong>Report</strong> is issued at least once a year. The Head of Internal Audit regularly reports to the Audit<br />
Committee on the work done. The Audit Committee is informed about special audits, substantial complaints<br />
and other exceptional measures on the part of bank regulatory authorities. It has functional responsibility for<br />
taking receipt of and dealing with complaints concerning accounting, internal accounting controls and issues<br />
relating to the audit. Subject to its review, the Audit Committee grants its approval for mandates engaging the<br />
auditor for non-audit-related services. The Audit Committee held six meetings in 2010.<br />
The current members of the Audit Committee are Dr. Karl-Gerhard Eick (Chairman), Dr. Clemens Börsig,<br />
Sir Peter Job, Henriette Mark, Karin Ruck and Marlehn Thieme.<br />
Risk Committee: The Risk Committee handles loans which require a resolution by the Supervisory Board pursuant<br />
to law or our Articles of Association. Subject to its review, it grants its approval for the acquisition of<br />
shareholdings in other companies that amount to between 2 % and 3 % of our regulatory banking capital if it is<br />
likely that the shareholding will not remain in our full or partial possession for more than twelve months. At the<br />
meetings of the Risk Committee, the Management Board reports on credit, market, liquidity, operational, litigation<br />
and reputational risks. The Management Board also reports on risk strategy, credit portfolios, loans requiring<br />
a Supervisory Board approval pursuant to law or our Articles of Association, questions of capital resources<br />
and matters of special importance due to the risks they entail. The Risk Committee held six meetings in 2010.<br />
The current members of the Risk Committee are Dr. Clemens Börsig (Chairman), Professor Dr. Henning Kagermann<br />
and Sir Peter Job. Suzanne Labarge and Dr. Theo Siegert are substitute members of the Risk Committee.<br />
They are invited to all meetings and regularly attend them.<br />
In addition to these four committees, the Mediation Committee, which is required by German law, makes proposals<br />
to the Supervisory Board on the appointment or dismissal of members of the Management Board in those<br />
cases where the Supervisory Board is unable to reach a two-thirds majority decision with respect to the appointment<br />
or dismissal. The Mediation Committee only meets if necessary and did not hold any meetings in 2010.<br />
The current members of the Mediation Committee are Dr. Clemens Börsig (Chairman), Wolfgang Böhr, Karin<br />
Ruck, and Tilman Todenhöfer.<br />
Further details regarding the Chairman’s Committee, the Risk Committee, the Audit Committee and the<br />
Nomination Committee are regulated in separate Terms of Reference, which are available in the respectively<br />
current version on our Internet website, along with the Terms of Reference of our Supervisory Board (see:<br />
http://www.deutsche-bank.de/ir/en/content/terms_of_references.htm).<br />
Compensation<br />
For a description of the compensation for the Management Board and the Supervisory Board in 2010, please<br />
refer to our detailed Compensation <strong>Report</strong> on pages 128 – 137 of the Management <strong>Report</strong>, published in<br />
accordance with the provisions of the German Act on Disclosure of Management Board Compensation.
<strong>Deutsche</strong> <strong>Bank</strong> 04 – Corporate Governance Statement/Corporate Governance <strong>Report</strong> 386<br />
Financial <strong>Report</strong> 2010 <strong>Report</strong>ing and Transparency<br />
Share Plans<br />
For information on our employee share programs, please refer to Note 32 “Share-Based Compensation Plans”<br />
to the consolidated financial statements.<br />
<strong>Report</strong>ing and Transparency<br />
Directors’ Share Ownership<br />
Management Board. For the Directors’ Share Ownership of the Management Board, please refer to our detailed<br />
Compensation <strong>Report</strong> in the Management <strong>Report</strong>.<br />
Supervisory Board The current members of our Supervisory Board held the following numbers of our shares<br />
and share awards under our employee share plans.<br />
Members of the Supervisory Board<br />
Number of<br />
shares<br />
Number of share<br />
awards<br />
Wolfgang Böhr 30 –<br />
Dr. Clemens Börsig 1 137,919 –<br />
Dr. Karl-Gerhard Eick – –<br />
Alfred Herling 996 10<br />
Gerd Herzberg – –<br />
Sir Peter Job 4,000 –<br />
Prof. Dr. Henning Kagermann – –<br />
Peter Kazmierczak 122 10<br />
Martina Klee 615 10<br />
Suzanne Labarge – –<br />
Maurice Lévy –<br />
Henriette Mark 525 10<br />
Gabriele Platscher 827 4<br />
Karin Ruck 165 –<br />
Dr. Theo Siegert – –<br />
Dr. Johannes Teyssen – –<br />
Marlehn Thieme 190 10<br />
Tilman Todenhöfer 1,541 –<br />
Stefan Viertel 54 –<br />
Werner Wenning – –<br />
Total 146,984 54<br />
1 This does not include 270 <strong>Deutsche</strong> <strong>Bank</strong> shares held by a family-owned partnership, a community of heirs respectively, in which Dr. Clemens Börsig has a 25 %<br />
interest as well as 16,018 <strong>Deutsche</strong> <strong>Bank</strong> shares attributable to a charitable foundation with separate legal capacity, the “Gerhild und Clemens Börsig Jugend- und<br />
Sozialstiftung”.<br />
The members of the Supervisory Board held 146,984 shares, amounting to less than 0.02 % of our shares as<br />
of February 18, 2011.<br />
As listed in the “Number of share awards” column in the table, the members who are employees of <strong>Deutsche</strong><br />
<strong>Bank</strong> hold matching awards granted under the Global Share Purchase Plan, which are scheduled to be delivered<br />
them on November 1, 2011.
<strong>Deutsche</strong> <strong>Bank</strong> 04 – Corporate Governance Statement/Corporate Governance <strong>Report</strong> 387<br />
Financial <strong>Report</strong> 2010 Auditing and Controlling<br />
Related Party Transactions<br />
For information on related party transactions please refer to Note 37 “Related Party Transactions”.<br />
Auditing and Controlling<br />
Audit Committee Financial Expert<br />
Our Supervisory Board has determined that Dr. Clemens Börsig and Dr. Karl-Gerhard Eick, who are members<br />
of its Audit Committee, are “audit committee financial experts”, as such term is defined by the regulations of the<br />
Securities and Exchange Commission issued pursuant to Section 407 of the Sarbanes-Oxley Act of 2002. The<br />
audit committee financial experts mentioned above are “independent” of us, as defined in Rule 10A-3 under<br />
the U.S. Securities Exchange Act of 1934 and Section 100 (5) of the Stock Corporation Act (AktG). According<br />
to Sections 107 (4), 100 (5) of the Stock Corporation Act they both are well grounded in the fields of accounting<br />
and auditing.<br />
Code of Business Conduct and Ethics<br />
The Code of Business Conduct and Ethics applies to all of the employees of <strong>Deutsche</strong> <strong>Bank</strong> and contains a<br />
voluntary commitment from the Management Board and the Supervisory Board. Competing to be the leading<br />
global provider of financial solutions for demanding clients, creating exceptional value for our shareholders and<br />
people, is our objective and part of our corporate identity. The Code of Business Conduct and Ethics sets out<br />
the basic standards for the conduct of each individual. It also constitutes the compulsory framework for all of<br />
the organizational units that issue specific policies and guidelines.<br />
In accordance with Section 406 of the Sarbanes-Oxley Act of 2002, our Code of Business Conduct and Ethics<br />
also sets out special obligations for our Senior Financial Officers. Currently at <strong>Deutsche</strong> <strong>Bank</strong> these are the<br />
Chairman of the Management Board, the Chief Financial Officer, the Head of Group Accounting as well as<br />
members of the Group Finance Committee. A copy of the Code of Business Conduct and Ethics is available<br />
on our Internet website at http://www.deutsche-bank.com/corporate-governance. In 2010 no complaints were<br />
reported to the Corporate Governance Officer regarding the Code of Ethics.<br />
Principal Accountant Fees and Services<br />
In accordance with German law, our principal accountant is appointed at our <strong>Annual</strong> General Meeting based<br />
on a recommendation of our Supervisory Board. The Audit Committee of our Supervisory Board prepares such<br />
a recommendation. Subsequent to the principal accountant’s appointment, the Audit Committee awards the<br />
contract and in its sole authority approves the terms and scope of the audit and all audit engagement fees as<br />
well as monitors the principal accountant’s independence. At our 2009 and 2010 <strong>Annual</strong> General Meetings, our<br />
shareholders appointed KPMG AG Wirtschaftsprüfungsgesellschaft as our principal accountant for a number of<br />
years, as our principal accountants for the 2009 and 2010 fiscal years, respectively.<br />
The table set forth below contains the aggregate fees billed for each of the last two fiscal years by our principal<br />
accountant in each of the following categories: (1) Audit Fees, which are fees for professional services for the<br />
audit of our annual financial statements or services that are normally provided by the accountant in connection<br />
with statutory and regulatory filings or engagements for those fiscal years, (2) Audit-Related Fees, which are<br />
fees for assurance and related services that are reasonably related to the performance of the audit or review<br />
of our financial statements and are not reported as Audit Fees, and (3) Tax-Related Fees, which are fees for<br />
professional services rendered for tax compliance, tax consulting and tax planning, and (4) All Other Fees,
<strong>Deutsche</strong> <strong>Bank</strong> 04 – Corporate Governance Statement/Corporate Governance <strong>Report</strong> 388<br />
Financial <strong>Report</strong> 2010 Auditing and Controlling<br />
which are fees for products and services other than Audit Fees, Audit-Related Fees and Tax-Related Fees.<br />
These amounts include expenses and exclude Value Added Tax (VAT).<br />
Fee category in € m. 2010 2009<br />
Audit fees 53 45<br />
Audit-related fees 9 6<br />
Tax-related fees 7 5<br />
All other fees 2 –<br />
Total fees 71 56<br />
The total fee increase of € 15 million is mainly driven by our 2010 acquisitions. Our Audit-Related Fees included<br />
fees for accounting advisory, due diligence relating to actual or contemplated acquisitions and dispositions,<br />
attestation engagements and other agreed-upon procedure engagements. Our Tax-Related Fees included<br />
fees for services relating to the preparation and review of tax returns and related compliance assistance and<br />
advice, tax consultation and advice relating to Group tax planning strategies and initiatives and assistance with<br />
assessing compliance with tax regulations. Our Other Fees were incurred for project-related advisory services.<br />
United States law and regulations, and our own policies, generally require all engagements of our principal<br />
accountant be pre-approved by our Audit Committee or pursuant to policies and procedures adopted by it. Our<br />
Audit Committee has adopted the following policies and procedures for consideration and approval of requests<br />
to engage our principal accountant to perform non-audit services. Engagement requests must in the first<br />
instance be submitted to the Accounting Engagement Team established and supervised by our Group Finance<br />
Committee, whose members consist of our Chief Financial Officer and senior members of our Finance and Tax<br />
departments. If the request relates to services that would impair the independence of our principal accountant,<br />
the request must be rejected. Our Audit Committee has given its pre-approval for specified assurance, financial<br />
advisory and tax services, provided the expected fees for any such service do not exceed € 1 million. If the<br />
engagement request relates to such specified pre-approved services, it may be approved by the Group Finance<br />
Committee, which must thereafter report such approval to the Audit Committee. If the engagement request<br />
relates neither to prohibited non-audit services nor to pre-approved non-audit services, it must be forwarded by<br />
the Group Finance Committee to the Audit Committee for consideration. In addition, to facilitate the consideration<br />
of engagement requests between its meetings, the Audit Committee has delegated approval authority to<br />
several of its members who are “independent” as defined by the Securities and Exchange Commission and the<br />
New York Stock Exchange. Such members are required to report any approvals made by them to the Audit<br />
Committee at its next meeting.
<strong>Deutsche</strong> <strong>Bank</strong> 04 – Corporate Governance Statement/Corporate Governance <strong>Report</strong> 389<br />
Financial <strong>Report</strong> 2010 Compliance with the German Corporate Governance Code<br />
Additionally, United States law and regulations permit the pre-approval requirement to be waived with respect<br />
to engagements for non-audit services aggregating no more than five percent of the total amount of revenues<br />
we paid to our principal accountant, if such engagements were not recognized by us at the time of engagement<br />
and were promptly brought to the attention of our Audit Committee or a designated member thereof and approved<br />
prior to the completion of the audit. In each of 2009 and 2010, the percentage of the total amount of revenue<br />
we paid to our principal accountant represented by non-audit services in each category that were subject to<br />
such a waiver was less than 5 %.<br />
Compliance with the German Corporate Governance Code<br />
Declaration pursuant to § 161 German Stock Corporation Act (AktG)<br />
(Declaration of Conformity 2010)<br />
The Management Board and Supervisory Board issued a new Declaration of Conformity in accordance with<br />
§ 161 German Stock Corporation Act (AktG) on October 27, 2010. <strong>Deutsche</strong> <strong>Bank</strong> AG acted in conformity with<br />
the recommendations of the “Government Commission’s German Corporate Governance Code” as follows:<br />
“The last Declaration of Conformity was issued on October 28, 2009. It was adjusted as per January 1,<br />
2010. After this date, <strong>Deutsche</strong> <strong>Bank</strong> AG complied with all the recommendations of the “Government<br />
Commission’s German Corporate Governance Code” in the Code version dated June 18, 2009, published<br />
in the Electronic Federal Gazette (Elektronischer Bundesanzeiger) on August 5, 2009, without any exceptions<br />
until the new version of the Code became effective on July 2, 2010. Prior to January 1, 2010, <strong>Deutsche</strong><br />
<strong>Bank</strong> AG complied with the recommendations with the following exception:<br />
For the members of the Supervisory Board, there was traditionally a directors’ and officers’ liability insurance<br />
policy without a deductible (Code No. 3.8). This directors’ and officers’ liability insurance policy held by the<br />
bank is a group insurance policy for a large number of individuals in Germany and abroad. Internationally,<br />
a deductible is unusual. In light of the requirement to agree on a deductible for the Management Board,<br />
such a deductible for the Supervisory Board was discussed and finally introduced within the framework of<br />
the renewal of the existing directors’ and officers’ liability policy with effect from January 1, 2010.<br />
On May 26, 2010, the “Government Commission’s German Corporate Governance Code” submitted a new<br />
version of the Code, which was published in the Electronic Federal Gazette on July 2, 2010. <strong>Deutsche</strong> <strong>Bank</strong><br />
also complied with the new version, with the exception of the revised No. 5.4.1:<br />
Based on the new regulation concerning the objectives for the composition of the Supervisory Board, as an<br />
initial step the Terms of Reference for the Supervisory Board, for the Chairman’s Committee and for the<br />
Nomination Committee were amended at the Supervisory Board meeting on July 27, 2010. Following the<br />
required in-depth discussion of the matter, the specific objectives were approved at the Supervisory Board<br />
meeting on October 27, 2010.<br />
As of today’s date, <strong>Deutsche</strong> <strong>Bank</strong> AG acts in conformity with the recommendations of the “Government<br />
Commission’s German Corporate Governance Code” in the Code version dated May 26, 2010, without any<br />
exceptions.”<br />
The Declaration of Conformity 2010 and all of the previous versions of the Declaration of Conformity are published<br />
on <strong>Deutsche</strong> <strong>Bank</strong>’s website at http://www.deutsche-bank.de/ir/en/content/declaration_of_conformity.htm,<br />
where a copy of the German Corporate Governance Code is also available.
<strong>Deutsche</strong> <strong>Bank</strong> 04 – Corporate Governance Statement/Corporate Governance <strong>Report</strong> 390<br />
Financial <strong>Report</strong> 2010 Compliance with the German Corporate Governance Code<br />
Statement on the Suggestions of the German Corporate Governance Code<br />
<strong>Deutsche</strong> <strong>Bank</strong> voluntarily complies with the suggestions of the Code in the version dated May 26, 2010 with<br />
the following exceptions:<br />
— The representatives appointed by <strong>Deutsche</strong> <strong>Bank</strong> to exercise shareholders’ voting rights can be reached by<br />
those attending the General Meeting until just before voting commences. The representatives are reachable<br />
by those not attending until 12 noon on the day of the General Meeting using the instruction tool in the Internet<br />
(Code No. 2.3.3). In this manner, the risk of any technical disruptions directly before voting takes place<br />
can basically be excluded. The broadcast through the Internet also ends at the latest at this time, which<br />
means information useful for non-participants in forming an opinion can no longer be expected thereafter.<br />
— Our broadcast of the General Meeting through the Internet (Code No. 2.3.4) covers the opening of the General<br />
Meeting by the Chairman and the report of the Management Board. The shareholders are thus free to hold<br />
their discussions with management unencumbered by a public broadcast to a wide audience.
Supplementary Information<br />
Management Board – 392<br />
Supervisory Board – 393<br />
Advisory Boards – 395<br />
Group Five-Year Record – 400<br />
Declaration of Backing – 401<br />
Glossary – 402<br />
Impressum – Publications – 408
<strong>Deutsche</strong> <strong>Bank</strong> 05 – Supplementary Information 392<br />
Financial <strong>Report</strong> 2010 Management Board<br />
Management Board<br />
Dr. Josef Ackermann<br />
Chairman<br />
Dr. Hugo Bänziger<br />
Michael Cohrs<br />
until September 30, 2010<br />
Jürgen Fitschen<br />
Anshuman Jain<br />
Stefan Krause<br />
Hermann-Josef Lamberti<br />
Rainer Neske
<strong>Deutsche</strong> <strong>Bank</strong> 05 – Supplementary Information 393<br />
Financial <strong>Report</strong> 2010 Supervisory Board<br />
Supervisory Board<br />
Dr. Clemens Börsig<br />
– Chairman,<br />
Frankfurt am Main<br />
Karin Ruck*<br />
– Deputy Chairperson<br />
<strong>Deutsche</strong> <strong>Bank</strong> AG,<br />
Bad Soden am Taunus<br />
Wolfgang Böhr*<br />
<strong>Deutsche</strong> <strong>Bank</strong> AG,<br />
Dusseldorf<br />
Dr. Karl-Gerhard Eick<br />
Management consultant, KGE Asset<br />
Management Consulting Ltd.,<br />
London<br />
Heidrun Förster*<br />
until July 31, 2010,<br />
<strong>Deutsche</strong> <strong>Bank</strong> Privat- und<br />
Geschäftskunden AG,<br />
Berlin<br />
Alfred Herling*<br />
<strong>Deutsche</strong> <strong>Bank</strong> AG,<br />
Wuppertal<br />
Gerd Herzberg*<br />
Deputy Chairman of ver.di<br />
Vereinte Dienstleistungsgewerkschaft,<br />
Hamburg<br />
Sir Peter Job<br />
London<br />
Prof. Dr. Henning Kagermann<br />
President of acatech – German<br />
Academy of Science and Engineering,<br />
Königs Wusterhausen<br />
Peter Kazmierczak*<br />
from July 1, 2010,<br />
<strong>Deutsche</strong> <strong>Bank</strong> AG,<br />
Herne<br />
Martina Klee*<br />
<strong>Deutsche</strong> <strong>Bank</strong> AG,<br />
Frankfurt am Main<br />
* Elected by our employees in Germany.<br />
Suzanne Labarge<br />
Toronto<br />
Maurice Lévy<br />
Chairman and Chief Executive<br />
Officer of Publicis Groupe S.A.,<br />
Paris<br />
Henriette Mark*<br />
<strong>Deutsche</strong> <strong>Bank</strong> AG,<br />
Munich<br />
Gabriele Platscher*<br />
<strong>Deutsche</strong> <strong>Bank</strong> Privat- und<br />
Geschäftskunden AG,<br />
Braunschweig<br />
Dr. Theo Siegert<br />
Managing Partner of<br />
de Haen Carstanjen & Söhne,<br />
Dusseldorf<br />
Dr. Johannes Teyssen<br />
Chairman of the<br />
Management Board of E.ON AG<br />
from May 1, 2010,<br />
Oberding<br />
Marlehn Thieme*<br />
<strong>Deutsche</strong> <strong>Bank</strong> AG,<br />
Bad Soden am Taunus<br />
Tilman Todenhöfer<br />
Managing Partner of Robert Bosch<br />
Industrietreuhand KG,<br />
Madrid<br />
Stefan Viertel*<br />
from August 1, 2010,<br />
<strong>Deutsche</strong> <strong>Bank</strong> AG,<br />
Bad Soden am Taunus<br />
Werner Wenning<br />
Chairman of the Management Board<br />
of Bayer AG until September 30, 2010,<br />
Leverkusen<br />
Leo Wunderlich*<br />
until June 30, 2010,<br />
<strong>Deutsche</strong> <strong>Bank</strong> AG,<br />
Mannheim
<strong>Deutsche</strong> <strong>Bank</strong> 05 – Supplementary Information 394<br />
Financial <strong>Report</strong> 2010 Supervisory Board<br />
Committees<br />
Chairman’s Committee<br />
Dr. Clemens Börsig<br />
– Chairman<br />
Heidrun Förster*<br />
until July 31, 2010<br />
Alfred Herling*<br />
from August 1, 2010<br />
Karin Ruck*<br />
Tilman Todenhöfer<br />
Mediation Committee<br />
Dr. Clemens Börsig<br />
– Chairman<br />
Wolfgang Böhr*<br />
Karin Ruck*<br />
Tilman Todenhöfer<br />
Audit Committee<br />
Dr. Karl-Gerhard Eick<br />
– Chairman<br />
Dr. Clemens Börsig<br />
Sir Peter Job<br />
Henriette Mark*<br />
Karin Ruck*<br />
Marlehn Thieme*<br />
* Elected by our employees in Germany.<br />
Risk Committee<br />
Dr. Clemens Börsig<br />
– Chairman<br />
Sir Peter Job<br />
Prof. Dr. Henning Kagermann<br />
Suzanne Labarge<br />
– Substitute Member<br />
Dr. Theo Siegert<br />
– Substitute Member<br />
Nomination Committee<br />
Dr. Clemens Börsig<br />
– Chairman<br />
Tilman Todenhöfer<br />
Werner Wenning
<strong>Deutsche</strong> <strong>Bank</strong> 05 – Supplementary Information 395<br />
Financial <strong>Report</strong> 2010 Advisory Boards<br />
Advisory Boards<br />
European Advisory Board<br />
Professor Dr.-Ing.<br />
Wolfgang Reitzle<br />
– Chairman<br />
Chairman of the Management Board<br />
of Linde AG, Munich<br />
Professor Dr. h.c.<br />
Roland Berger<br />
Roland Berger Strategy<br />
Consultants GmbH, Munich<br />
Dr. Kurt Bock<br />
Member of the Management<br />
Board of BASF SE,<br />
Ludwigshafen<br />
Lord John Browne of Madingley<br />
Managing Director and Managing<br />
Partner (Europe) of<br />
Riverstone Holdings LLC;<br />
former Chief Executive Officer of BP,<br />
London<br />
Michael Cohrs<br />
from October 1, 2010<br />
Former Member of the Management<br />
Board of <strong>Deutsche</strong> <strong>Bank</strong> AG,<br />
London<br />
Dr. Karl-Ludwig Kley<br />
Chairman of the Executive Board and<br />
General Partner of Merck KGaA,<br />
Darmstadt<br />
Peter Löscher<br />
Chairman of the Management Board<br />
of Siemens Aktiengesellschaft,<br />
Munich<br />
Francis Mer<br />
Former French Minister of<br />
Economy, Finance and Industry,<br />
Bourg-la-Reine<br />
Alexey A. Mordashov<br />
Chairman of the Board of<br />
Directors of Severstal;<br />
Director General of Severstal-Group,<br />
Cherepovets<br />
Dr. h.c. August Oetker<br />
General Partner of<br />
Dr. August Oetker KG,<br />
Bielefeld<br />
Eckhard Pfeiffer<br />
Former President and<br />
Chief Executive Officer<br />
of Compaq Computer Corporation,<br />
Kitzbühel<br />
Dr. Bernd Pischetsrieder<br />
Urfahrn<br />
Antonio Puri Purini<br />
from September 1, 2010<br />
Former Ambassador of Italy to the<br />
Republik of Germany,<br />
Rome<br />
Dr. rer. pol. Michael Rogowski<br />
Chairman of the Supervisory Board of<br />
J. M. Voith AG,<br />
until March 5, 2010,<br />
Heidenheim<br />
Håkan Samuelsson<br />
until April 29, 2010,<br />
Munich<br />
Maria-Elisabeth Schaeffler<br />
Partner and Chairperson of the<br />
Supervisory Board of<br />
INA-Holding Schaeffler KG,<br />
Herzogenaurach<br />
Jürgen R. Thumann<br />
Chairman of the Shareholders’ Committee<br />
of Heitkamp & Thumann KG,<br />
Dusseldorf<br />
Dr. Dieter Zetsche<br />
Chairman of the Management<br />
Board of Daimler AG and<br />
Head of Mercedes-Benz Cars,<br />
Stuttgart
<strong>Deutsche</strong> <strong>Bank</strong> 05 – Supplementary Information 396<br />
Financial <strong>Report</strong> 2010 Advisory Boards<br />
Americas Advisory Board<br />
Norman Augustine<br />
Former Chief Executive Officer &<br />
Chairman, Lockheed Martin<br />
John E. Bryson<br />
Chairman, BrightSource Energy;<br />
former Chairman &<br />
Chief Executive Officer,<br />
Edison International<br />
Michael D. Capellas<br />
Chief Executive Officer, Acadia;<br />
former Chairman & Chief Executive<br />
Officer, First Data Corp.<br />
James Ireland Cash, Jr., Ph. D.<br />
Emeritus Professor and<br />
Senior Associate<br />
Dean, Harvard Business School<br />
Anthony W. Deering<br />
Chairman, Exeter Capital LLC;<br />
former Chairman & Chief Executive<br />
Officer, The Rouse Co.<br />
Archie W. Dunham<br />
Former Chairman,<br />
ConocoPhillips<br />
Benjamin H. Griswold<br />
Chairman, Brown Advisory;<br />
former Senior Chairman,<br />
<strong>Deutsche</strong> Banc Alex. Brown<br />
The Honorable Chuck Hagel<br />
Distinguished Professor, Georgetown<br />
University and the University of<br />
Nebraska at Omaha;<br />
former U.S. Senator, (R-NE)<br />
William R. Howell<br />
Former Chairman &<br />
Chief Executive Officer,<br />
J. C. Penney, Inc.<br />
Robert L. Johnson<br />
Founder & Chairman,<br />
The RLJ Cos.; Founder and former<br />
Chairman, Black Entertainment<br />
Television (BET)<br />
Edward A. Kangas<br />
Former Chairman & Chief<br />
Executive Officer, Deloitte<br />
Ellen R. Marram<br />
President, The Barnegat Group LLC;<br />
former President & Chief Executive<br />
Officer, Tropicana and Nabisco<br />
Biscuit Cos.<br />
The Honorable Lynn M. Martin<br />
President, Martin Hall Group LLC;<br />
former U.S. Secretary of Labor<br />
Robert P. May<br />
Former Chief Executive Officer, Calpine<br />
Corp.; former Chairman & Chief<br />
Executive Officer, HealthSouth Corp.<br />
Michael E. J. Phelps<br />
until September 30, 2010<br />
Chairman, Dornoch Capital Inc.<br />
The Honorable John W. Snow<br />
Chairman, Cerberus Capital<br />
Management LP;<br />
former U.S. Secretary of the<br />
Treasury
<strong>Deutsche</strong> <strong>Bank</strong> 05 – Supplementary Information 397<br />
Financial <strong>Report</strong> 2010 Advisory Boards<br />
Latin American Advisory Board<br />
Mauricio Novis Botelho<br />
until March 15, 2010<br />
Chairman and former President and<br />
Chief Executive Officer,<br />
Embraer<br />
Fernando Henrique Cardoso<br />
Former President of the<br />
Federative Republic of Brazil<br />
Armando Garza Sada<br />
Chairman, Alfa<br />
Enrique Iglesias<br />
Ibero-American Secretary-General;<br />
former Minister of Foreign<br />
Relations of Uruguay<br />
Pedro Pablo Kuczynski<br />
Partner & Senior Advisor,<br />
The Rohatyn Group;<br />
former Prime Minister of Peru<br />
The Honorable Lynn M. Martin<br />
President, Martin Hall Group LLC;<br />
former U.S. Secretary of Labor<br />
Luis Alejandro Pagani<br />
President, Arcor Group<br />
Horst Paulmann<br />
Founder & President,<br />
Cencosud S.A.<br />
Jesús Reyes-Heroles<br />
from June 1, 2010<br />
Former Chairman & Chief Executive<br />
Officer, Petroleos Mexicanos (Pemex);<br />
former Ambassador of Mexico to the<br />
United States of America<br />
Miguel Urrutia Montoya<br />
Professor, Universidad<br />
de los Andes;<br />
former Governor of the<br />
Central <strong>Bank</strong> of Colombia
<strong>Deutsche</strong> <strong>Bank</strong> 05 – Supplementary Information 398<br />
Financial <strong>Report</strong> 2010 Advisory Boards<br />
Asia Pacific Advisory Board<br />
Pham Thanh Binh<br />
until December 31, 2010<br />
Former Chairman and Chief Executive<br />
Officer, Vinashin Group,<br />
Vietnam<br />
Robert E. Fallon<br />
Adjunct Professor, Finance and<br />
Economics, Columbia Business<br />
School, International<br />
Toru Hashimoto<br />
Former President & Chief<br />
Executive Officer and former<br />
Chairman, The Fuji <strong>Bank</strong> Ltd.;<br />
former Chairman, <strong>Deutsche</strong><br />
Securities Inc., Japan<br />
Nobuyuki Idei<br />
Founder & Chief Executive Officer,<br />
Quantum Leaps Corporation;<br />
Chairman of the Advisory Board,<br />
Sony Corporation, Japan<br />
Gang-Yon Lee<br />
Chairman, Korea Gas Corporation,<br />
Korea<br />
Dr. David K.P. Li<br />
Chairman and Chief Executive Officer,<br />
The <strong>Bank</strong> of East Asia,<br />
Hong Kong<br />
Dr. Li Qingyuan<br />
Director-General, Office of Strategy<br />
and Development Committee,<br />
China Securities Regulatory<br />
Commission, China<br />
Subramanian Ramadorai<br />
Vice Chairman, Tata Consultancy<br />
Services Limited, India<br />
Dr. Tony Tan Keng Yam<br />
Deputy Chairman and Executive<br />
Director, The Government of<br />
Singapore Investment Corp. Pte. Ltd.,<br />
Singapore<br />
Sofjan Wanandi<br />
Chairman, Santini Group;<br />
Chairman of Employers Association of<br />
Indonesia (APINDO),<br />
Indonesia<br />
Professor Zhang Yunling<br />
Professor of International<br />
Economics and Academy Member,<br />
Chinese Academy of Social Science,<br />
China
<strong>Deutsche</strong> <strong>Bank</strong> 05 – Supplementary Information 399<br />
Financial <strong>Report</strong> 2010 Advisory Boards<br />
Climate Change Advisory Board<br />
Lord John Browne of Madingley<br />
Managing Director and Managing<br />
Partner (Europe),<br />
Riverstone Holdings LLC;<br />
former Chief Executive Officer, BP<br />
John Coomber<br />
Member of the Board of Directors,<br />
Swiss Re;<br />
Chairman, The Climate Group<br />
Fabio Feldmann<br />
Chief Executive Officer,<br />
Fabio Feldmann Consultores;<br />
former Executive Secretary,<br />
Brazilian Forum on Climate Change<br />
Amory B. Lovins<br />
Chairman & Chief Scientist,<br />
Rocky Mountain Institute<br />
Lord Oxburgh<br />
Member of the Advisory Board,<br />
Climate Change Capital;<br />
former Chairman, Shell<br />
Dr. R. K. Pachauri<br />
Chairman, Intergovernment Panel on<br />
Climate Change<br />
Professor Hans Joachim Schellnhuber<br />
Founding Director, Potsdam<br />
Institute for Climate Impact<br />
Research (PIK)<br />
Professor Robert Socolow<br />
Co-Director, The Carbon<br />
Mitigation Initiative;<br />
Professor, Princeton University<br />
Professor Dr. Dr. h.c. mult. Klaus Töpfer<br />
Former Federal Minister for the<br />
Environment, Nature Conservation<br />
and Nuclear Safety as well as for<br />
Regional Planning, Construction and<br />
Urban Development; former Executive<br />
Director of the United Nations<br />
Environment Programme (UNEP)<br />
Professor Hongren Zhang<br />
Former President, International<br />
Union of Geological Science;<br />
former Chinese Vice Minister of<br />
Geology and Mineral Resources
<strong>Deutsche</strong> <strong>Bank</strong> 05 – Supplementary Information 400<br />
Financial <strong>Report</strong> 2010 Group Five-Year Record<br />
Group Five-Year Record<br />
Balance Sheet in € m. Dec 31, 2010 Dec 31, 2009 Dec 31, 2008 Dec 31, 2007 Dec 31, 2006<br />
Total assets 1,905,630 1,500,664 2,202,423 1,925,003 1,520,580<br />
Loans 407,729 258,105 269,281 198,892 178,524<br />
Total liabilities 1,855,238 1,462,695 2,170,509 1,885,688 1,486,694<br />
Total shareholders’ equity 48,843 36,647 30,703 37,893 33,169<br />
Noncontrolling interests 1,549 1,322 1,211 1,422 717<br />
Tier 1 capital 42,565 34,406 31,094 28,320 23,539<br />
Total regulatory capital 48,688 37,929 37,396 38,049 34,309<br />
Income Statement in € m. 2010 2009 2008 2007 2006<br />
Net interest income 15,583 12,459 12,453 8,849 7,008<br />
Provision for credit losses 1,274 2,630 1,076 612 298<br />
Commissions and fee income 10,669 8,911 9,741 12,282 11,192<br />
Net gains (losses) on financial assets/liabilities<br />
at fair value through profit or loss 3,354 7,109 (9,992) 7,175 8,892<br />
Other noninterest income (loss) (1,039) (527) 1,411 2,523 1,476<br />
Total noninterest income 12,984 15,493 1,160 21,980 21,560<br />
Compensation and benefits 12,671 11,310 9,606 13,122 12,498<br />
General and administrative expenses 10,133 8,402 8,339 8,038 7,143<br />
Policyholder benefits and claims 485 542 (252) 193 67<br />
Impairment of intangible assets 29 (134) 585 128 31<br />
Restructuring activities – – – (13) 192<br />
Total noninterest expenses 23,318 20,120 18,278 21,468 19,931<br />
Income (loss) before income taxes 3,975 5,202 (5,741) 8,749 8,339<br />
Income tax expense (benefit) 1,645 244 (1,845) 2,239 2,260<br />
Net income (loss) 2,330 4,958 (3,896) 6,510 6,079<br />
Net income (loss) attributable to noncontrolling interests 20 (15) (61) 36 9<br />
Net income (loss) attributable to <strong>Deutsche</strong> <strong>Bank</strong> shareholders 2,310 4,973 (3,835) 6,474 6,070<br />
Key figures 2010 2009 2008 2007 2006<br />
Basic earnings per share 1 € 3.07 € 7.21 (€ 6.87) € 12.29 € 11.66<br />
Diluted earnings per share 1 € 2.92 € 6.94 (€ 6.87) € 11.80 € 10.44<br />
Dividends paid per share in period € 0.75 € 0.50 € 4.50 € 4.00 € 2.50<br />
Return on average shareholders’ equity (post-tax) 5.5 % 14.6 % (11.1)% 17.9 % 20.3 %<br />
Pre-tax return on average shareholders’ equity 9.5 % 15.3 % (16.5)% 24.1 % 27.9 %<br />
Cost/income ratio 81.6 % 72.0 % 134.3 % 69.6 % 69.8 %<br />
Core Tier 1 capital ratio 2 8.7 % 8.7 % 7.0 % 6.9 % 6.9 %<br />
Tier 1 capital ratio 2 12.3 % 12.6 % 10.1 % 8.6 % 8.5 %<br />
Total capital ratio 2 14.1 % 13.9 % 12.2 % 11.6 % 12.5 %<br />
Employees (full-time equivalent) 102,062 77,053 80,456 78,291 68,849<br />
1 The number of average basic and diluted shares outstanding has been adjusted for all periods before October 6, 2010 to reflect the effect of the bonus element of the subscription rights issue<br />
in connection with the capital increase.<br />
2 Ratios presented for 2009 and 2008 are pursuant to the revised capital framework presented by the Basel Committee in 2004 (“Basel II”) as adopted into German law by the German <strong>Bank</strong>ing<br />
Act and the Solvency Regulation (“Solvabilitätsverordnung”). Ratios presented for 2007 and 2006 are based on the Basel I framework and thus calculated on a noncomparative basis.<br />
The capital ratios relate the respective capital to risk weighted assets for credit, market and operational risk. Excludes transitional items pursuant to section 64h (3) German <strong>Bank</strong>ing Act.
<strong>Deutsche</strong> <strong>Bank</strong> 05 – Supplementary Information 401<br />
Financial <strong>Report</strong> 2010 Declaration of Backing<br />
Declaration of Backing 1<br />
<strong>Deutsche</strong> <strong>Bank</strong> AG ensures, except in the case of political risk, that the following companies are able to meet<br />
their contractual liabilities:<br />
DB Investments (GB) Limited, London<br />
<strong>Deutsche</strong> Asset Management International GmbH,<br />
Frankfurt am Main<br />
<strong>Deutsche</strong> Asset Management Investmentgesellschaft<br />
mbH, vormals DEGEF <strong>Deutsche</strong> Gesellschaft für<br />
Fondsverwaltung mbH, Frankfurt am Main<br />
<strong>Deutsche</strong> Australia Limited, Sydney<br />
<strong>Deutsche</strong> <strong>Bank</strong> A.Ş., Istanbul<br />
<strong>Deutsche</strong> <strong>Bank</strong> Americas Holding Corp., Wilmington<br />
<strong>Deutsche</strong> <strong>Bank</strong> (China) Co., Ltd., Beijing<br />
<strong>Deutsche</strong> <strong>Bank</strong> Europe GmbH, Frankfurt am Main<br />
<strong>Deutsche</strong> <strong>Bank</strong> Luxembourg S.A., Luxembourg<br />
<strong>Deutsche</strong> <strong>Bank</strong> (Malaysia) Berhad, Kuala Lumpur<br />
<strong>Deutsche</strong> <strong>Bank</strong> Polska S.A., Warsaw<br />
<strong>Deutsche</strong> <strong>Bank</strong> (Portugal), S.A., Lisbon<br />
<strong>Deutsche</strong> <strong>Bank</strong> ZRt., Budapest<br />
<strong>Deutsche</strong> <strong>Bank</strong> S.A., Buenos Aires<br />
<strong>Deutsche</strong> <strong>Bank</strong> S.A. – Banco Alemão, Sao Paulo<br />
1 Companies with which a profit and loss transfer agreement exists are marked in Note 42 “Shareholdings”.<br />
<strong>Deutsche</strong> <strong>Bank</strong> S.A./N.V., Brussels<br />
<strong>Deutsche</strong> <strong>Bank</strong>, Sociedad Anónima Española,<br />
Barcelona<br />
<strong>Deutsche</strong> <strong>Bank</strong> Società per Azioni, Milan<br />
<strong>Deutsche</strong> <strong>Bank</strong> (Suisse) S.A., Geneva<br />
<strong>Deutsche</strong> <strong>Bank</strong> Trust Company Americas, New York<br />
<strong>Deutsche</strong> Futures Singapore Pte Ltd., Singapore<br />
<strong>Deutsche</strong> Holdings (Malta) Ltd., St. Julians<br />
<strong>Deutsche</strong> Morgan Grenfell Group plc, London<br />
<strong>Deutsche</strong> Securities Asia Limited, Hong Kong<br />
<strong>Deutsche</strong> Securities Limited, Hong Kong<br />
DWS Holding & Service GmbH, Frankfurt am Main<br />
DWS Investment GmbH, Frankfurt am Main<br />
DWS Investment S.A., Luxembourg<br />
IFN Finance B.V., Rotterdam<br />
VAT <strong>Deutsche</strong> <strong>Bank</strong> DBU, Kiev<br />
OOO <strong>Deutsche</strong> <strong>Bank</strong>, Moscow
<strong>Deutsche</strong> <strong>Bank</strong> 05 – Supplementary Information 402<br />
Financial <strong>Report</strong> 2010 Glossary<br />
Glossary<br />
A<br />
Alternative A (Alt-A)<br />
Used as a term to categorize U.S. mortgages<br />
representing loans with a higher<br />
expectation of risk than prime but still<br />
lower than subprime. In order to determine<br />
Alt-A industry standards including<br />
FICO scores and loan-to-value ratios<br />
are applied.<br />
Alternative Assets/Investments<br />
Direct investments in private equity,<br />
venture capital, mezzanine capital, real<br />
estate capital investments and investments<br />
in leveraged buyout funds, venture capital<br />
funds and hedge funds.<br />
Asset-backed Securities<br />
Particular type of securitized payment receivables<br />
in the form of tradable securities. These<br />
securities are created by the repackaging of<br />
certain financial assets ( securitization).<br />
Auction Rate Securities<br />
Debt instrument with a long-term nominal<br />
maturity (usually 20 to 30 years) with a<br />
variable interest rate. The interest rate is<br />
regularly reset through an auction.<br />
Average Active Equity<br />
The Group calculates active equity to facilitate<br />
comparison to its peers. The Group<br />
uses average active equity to calculate<br />
several ratios. However, active equity is not<br />
a measure provided for in IFRS and<br />
therefore the Group’s ratios based on average<br />
active equity should not be compared<br />
to other companies’ ratios without considering<br />
the differences in the calculation. The<br />
items for which the average shareholders’<br />
equity is adjusted are average unrealized<br />
net gains on assets available for sale,<br />
average fair value adjustments on<br />
cash flow hedges (both components net of<br />
applicable taxes), as well as average dividends,<br />
for which a proposal is accrued on a<br />
quarterly basis and for which payments<br />
occur once a year following the approval by<br />
the annual general meeting.<br />
B<br />
Backtesting<br />
A procedure used to verify the predictive<br />
power of the value-at-risk calculations<br />
involving the comparison of hypothetical<br />
daily profits and losses under the buy- andhold<br />
assumption with the estimates from the<br />
value-at-risk model.<br />
Basel II<br />
Recommendations for international capital<br />
adequacy standards adopted by the Basel<br />
Committee on <strong>Bank</strong>ing Supervision, widely<br />
referred to as Basel II capital framework,<br />
which aligns capital requirements more<br />
closely with the underlying risks.<br />
Basel III<br />
Revision of the international capital adequacy<br />
standards adopted by the Basel<br />
Committee on <strong>Bank</strong>ing Supervision, which<br />
was endorsed by the G-20 summit in November<br />
2010. Aim of the revision is to<br />
strengthen global capital and liquidity rules<br />
promoting a more resiliant banking sector.<br />
During a transition period until 2019 the<br />
revised standards not only increase the<br />
minimum capital requirements for banks but<br />
also introduce an additional capital conservation<br />
buffer as well as a bank specific<br />
countercyclical capital buffer. Basel III will<br />
also introduce an internationally harmonized<br />
liquidity framework for the first time with<br />
strict short- and long-term ratios. The new<br />
rules will be adopted into German law by<br />
means of the German Solvency Regulation.<br />
Book Value per Basic Share<br />
Outstanding<br />
Book value per basic share outstanding is<br />
defined as shareholders’ equity divided by<br />
the number of basic shares outstanding<br />
(both at period end).<br />
Broker/Brokerage<br />
Brokers accept orders to buy and sell securities<br />
from banks and private investors and<br />
execute them on behalf of the customer. For<br />
this activity, the broker usually receives a<br />
commission.<br />
Business Combination<br />
A transaction in which an acquirer obtains<br />
control of a business. This includes the<br />
acquisition of stocks of a company or its net<br />
assets, and may also involve the expansion<br />
of an existing equity interest ( step acquisitions).<br />
Often present in a business combination<br />
is the recognition of goodwill.<br />
Business Risk<br />
Risk that arises from potential changes in<br />
general business conditions, such as market<br />
environment, client behavior and technological<br />
progress, which can affect the<br />
Group’s earnings if the Group is unable to<br />
adjust quickly to them.<br />
Buy-out<br />
Purchase (in full or in part) of a company or<br />
specific corporate activities.<br />
C<br />
Cash Management<br />
Refers to the management of liquid assets<br />
in dollars, euro and other currencies for<br />
companies and financial institutions to<br />
optimize financial transactions.<br />
Clearing<br />
The process of transmitting, reconciling and,<br />
in some cases, confirming payment orders.<br />
Collateralized Debt Obligations (CDOs)<br />
Asset-backed securities based on a<br />
portfolio of assets that can include bonds,<br />
loans or derivatives.<br />
Commercial Mortgage-backed Securities<br />
(CMBS)<br />
Mortgage-backed securities (MBS), which<br />
are backed by commercial mortgage loans.<br />
Compensation Ratio<br />
Compensation and benefits as a percentage<br />
of total net revenues, which is defined<br />
as net interest income before provision for<br />
credit losses plus noninterest income.
<strong>Deutsche</strong> <strong>Bank</strong> 05 – Supplementary Information 403<br />
Financial <strong>Report</strong> 2010 Glossary<br />
Confidence Level<br />
In the framework of value-at-risk and<br />
economic capital the level of probability<br />
that the actual loss will not exceed the<br />
potential loss estimated by the value-at-risk<br />
or economic capital number.<br />
Cost/Income Ratio<br />
A ratio expressing a company’s cost effectiveness<br />
which sets operating expenses in<br />
relation to operating income.<br />
Country Risk<br />
The risk that the Group may suffer a loss, in<br />
any given country, due to deterioration in<br />
economic conditions, political and social<br />
unrest, nationalization and expropriation of<br />
assets, government repudiation of external<br />
indebtedness, exchange controls and currency<br />
depreciation or devaluation.<br />
Credit Default Swap<br />
A credit derivative which hedges credit<br />
risks related to loans, bonds or other borrower<br />
related securities. The secured party<br />
usually makes a periodic payment of a fixed<br />
coupon over a specified term and only<br />
receives a compensation at the occurence<br />
of a credit event, as defined on the date of<br />
the agreement, e.g. default of repayment<br />
due to insolvency of the creditor.<br />
Credit Derivatives<br />
Financial instruments which transfer<br />
credit risk connected with loans, bonds or<br />
other risk-weighted assets or market risk<br />
positions to parties providing protection.<br />
This does not alter or reestablish the underlying<br />
credit relationship of the original risktakers<br />
(parties selling the credit risks).<br />
Credit Linked Note (CLN)<br />
A structured note that combines a debt<br />
product and an embedded credit derivative,<br />
typically a credit default swap.<br />
Credit Risk<br />
Risk that customers may not be able to<br />
meet their contractual payment obligations.<br />
Credit risk includes default risk, country<br />
risk and settlement risk.<br />
Custody<br />
Custody and administration of securities as<br />
well as additional securities services.<br />
D<br />
Deferred Taxes<br />
Income tax to be paid or received as a<br />
result of temporary differences between the<br />
carrying amounts in the financial accounts<br />
and the relevant tax base or the value of<br />
unused tax losses and unused tax credits.<br />
At the balance sheet date, deferred taxes<br />
do not yet represent actual amounts receivable<br />
or payable from or to tax authorities.<br />
Derivatives<br />
Financial instruments whose value derives<br />
largely from the price, price fluctuations and<br />
price expectations of an underlying instrument<br />
(e.g. share, bond, foreign exchange or<br />
index). Derivatives include swaps,<br />
options and futures.<br />
E<br />
Earnings per Share<br />
Key figure determined according to<br />
IFRS and expressing a company’s net<br />
income attributable to its shareholders in<br />
relation to the average number of common<br />
shares outstanding. Apart from basic earnings<br />
per share, diluted earnings per share<br />
must also be reported if the assumed conversion<br />
and exercise of outstanding share<br />
options, unvested deferred share awards<br />
and convertible debt and certain forward<br />
contracts could increase the number of<br />
shares.<br />
Economic Capital<br />
A figure which states with a high degree of<br />
certainty the amount of equity capital the<br />
Group needs at any given time to absorb<br />
unexpected losses arising from current<br />
exposures.<br />
Equity Method<br />
Valuation method for investments in companies<br />
over which significant influence can<br />
be exercised. The pro-rata share of the<br />
company’s net income (loss) increases<br />
(decreases) the carrying value of the investment<br />
affecting net income. Distributions<br />
decrease the carrying value of the investment<br />
without affecting net income.<br />
Event Risk Scenarios<br />
Scenarios representing important events,<br />
e.g. large movements in interest or exchange<br />
rates.<br />
Expected Loss<br />
Measurement of loss that can be expected<br />
within a one-year period from credit risk<br />
and operational risk based on historical<br />
loss experience.<br />
Exposure<br />
The amount which the bank may lose in<br />
case of losses incurred due to risks taken,<br />
e.g. in case of a borrower’s or counterparty’s<br />
default.<br />
Exposure at Default (EAD)<br />
The expected amount of the credit exposure<br />
to a counterparty at the time of a default.<br />
F<br />
Fair Value<br />
Amount at which assets or liabilities would<br />
be exchanged between knowledgeable,<br />
willing and independent counterparties,<br />
other than in a forced or liquidation sale.
<strong>Deutsche</strong> <strong>Bank</strong> 05 – Supplementary Information 404<br />
Financial <strong>Report</strong> 2010 Glossary<br />
FICO Scores<br />
FICO is an acronym for the Fair Isaac<br />
Corporation, the creators of the FICO score.<br />
Using mathematical models, the FICO<br />
score takes into account various factors in<br />
each of these five areas to determine credit<br />
risk: Payment history, current level of indebtedness,<br />
types of credit used, length of<br />
credit history, and new credit. A FICO score<br />
will range between 300 and 850. In general,<br />
a FICO score above 650 indicates that the<br />
individual has a very good credit history. For<br />
scores below 620 it will often be more difficult<br />
to obtain financing at a favorable rate.<br />
Futures<br />
Forward contracts standardized with respect<br />
to quantity, quality and delivery date,<br />
in which an instrument traded on the money,<br />
capital, precious metal or foreign exchange<br />
markets, is to be delivered or received at an<br />
agreed price at a certain future time. Cash<br />
settlement is often stipulated for such contracts<br />
(e.g. futures based on equity indices)<br />
to meet the obligation (instead of delivery or<br />
receipt of securities).<br />
G<br />
German Solvency Regulation<br />
German regulation governing the capital<br />
adequacy of institutions, groups of institutions<br />
and financial holding groups which,<br />
adopted the revised capital framework of<br />
the Basel Committee from 2004, widely<br />
referred to as Basel II, into German law.<br />
Goodwill<br />
An asset representing the future economic<br />
benefits from assets acquired in a business<br />
combination that are not individually<br />
identifiable. Goodwill is recognized as the<br />
positive excess amount between the fair<br />
values of the consideration transferred by<br />
the acquirer and the identifiable assets and<br />
liabilities of the acquired business.<br />
H<br />
Hedge Accounting<br />
Financial reporting of agreements in a<br />
hedging relationship which is subject to<br />
certain conditions. The relationship between<br />
the agreements is based on opposite terms<br />
which cause financial risks that can be<br />
compensated in whole or part due to the<br />
terms of these agreements. One agreement<br />
is usually referred to as underlying transaction<br />
– i.e. the contract that causes the risk –<br />
the other is referred to as hedging contract,<br />
which mitigates the risk.<br />
Hedge Fund<br />
A fund whose investors are generally institutions<br />
and wealthy individuals. Hedge funds<br />
are part of alternative investments. They<br />
are subject to less stringent or no regulatory<br />
obligations and can therefore employ strategies<br />
which mutual funds are not permitted<br />
to use, e.g. strategies involving short selling,<br />
leveraging and derivatives. Hedge funds<br />
offer chances for high profits but also bear<br />
the risk of losing invested capital, thus their<br />
returns are uncorrelated with traditional<br />
investment returns.<br />
High Yield Debt<br />
Fixed income securities where the issuer<br />
has a low credit rating. They offer a higher<br />
return than investment-grade securities but<br />
also entail greater risks.<br />
I<br />
IFRS (International Financial <strong>Report</strong>ing<br />
Standards)/previously IAS (International<br />
Accounting Standards)<br />
Financial <strong>Report</strong>ing Rules of the International<br />
Accounting Standards Board designed<br />
to ensure globally transparent and<br />
comparable accounting and disclosure.<br />
Main objective is to present information that<br />
is useful in making economic decisions,<br />
mainly for investors.<br />
Investment <strong>Bank</strong>ing<br />
Generic term for capital market-oriented<br />
business. This includes primarily the issuance<br />
and trading of securities and their<br />
derivatives, interest and currency management,<br />
corporate finance, M&A advisory,<br />
structured finance and private equity.<br />
L<br />
Leveraged Financing<br />
Financing of an investment which typically<br />
includes a very high amount of external<br />
debt (leverage) in the purchase price<br />
financing.<br />
Leverage Ratio<br />
The ratio of total assets to equity.<br />
Liquidity Risk<br />
The risk arising from the Group’s potential<br />
inability to meet all payment obligations<br />
when they come due or only being able to<br />
meet these obligations at excessive costs.<br />
Loan-to-value (LTV) Ratios<br />
Ratio of amount of loan to value of property.<br />
Loss Given Default (LGD)<br />
The likely loss intensity in case of a counterparty<br />
default. Its estimation represents,<br />
expressed as a percentage, the part of the<br />
exposure that cannot be recovered in a<br />
default event and therefore captures the<br />
severity of a loss.<br />
M<br />
Market Risk<br />
The risk that arises from the uncertainty<br />
concerning changes in market prices and<br />
rates (including interest rates, equity prices,<br />
foreign exchange rates and commodity<br />
prices), the correlations among them and<br />
their levels of volatility.<br />
Mark-to-market Valuation<br />
Valuation at current market prices. Applies,<br />
for instance, to trading activities.
<strong>Deutsche</strong> <strong>Bank</strong> 05 – Supplementary Information 405<br />
Financial <strong>Report</strong> 2010 Glossary<br />
Mezzanine<br />
Flexible, mixed form of financing comprising<br />
equity and debt capital. Here: long-term<br />
subordinated financing instrument used to<br />
finance growth while at the same time<br />
strengthening the borrower’s economic<br />
equity capital base.<br />
Monoline Insurers<br />
Insurers, which provide credit insurance to<br />
debt issuers and other market participants.<br />
Monte Carlo Simulation<br />
Monte Carlo methods are used to value and<br />
analyze (complex) instruments, portfolios<br />
and investments by simulating the various<br />
sources of uncertainty affecting their value,<br />
and then determining their average value<br />
over the range of resultant outcomes.<br />
Mortgage-backed Securities (MBS)<br />
Asset-backed securities, which are<br />
backed by mortgage loans. Subcategories<br />
are residential mortgage-backed securities<br />
(RMBS) and commercial mortgagebacked<br />
securities (CMBS).<br />
N<br />
Negative Goodwill<br />
Recognized in a business combination as<br />
a credit to the income statement for the<br />
excess of the acquirer’s interest in the net<br />
fair value of the acquiree’s identifiable<br />
assets and liabilities over the consideration<br />
transferred for the acquired interest.<br />
Netting Agreements<br />
Bilateral agreements between the Group<br />
and its counterparties with regard to the<br />
included transactions which ensure that, if<br />
solvency or bankruptcy proceedings are<br />
initiated, only a single net amount is owed<br />
by one party to the other from the netting of<br />
all claims and liabilities.<br />
Non-compensation Ratio<br />
Non-compensation noninterest expenses,<br />
which are defined as total noninterest expenses<br />
less compensation and benefits, as<br />
a percentage of total net revenues, which is<br />
defined as net interest income before provision<br />
for credit losses plus noninterest income.<br />
Noncontrolling Interest<br />
Previously referred to as minority interest,<br />
representing the equity in a subsidiary not<br />
attributable, directly or indirectly, to a parent.<br />
O<br />
Operational Risk<br />
Potential for incurring losses in relation to<br />
employees, contractual specifications and<br />
documentation, technology, infrastructure<br />
failure and disasters, external influences<br />
and customer relationships. This definition<br />
includes legal and regulatory risk, but excludes<br />
business and reputational risk.<br />
Option<br />
Right to purchase (call option) or sell (put<br />
option) a specific underlying (e.g. security or<br />
foreign exchange) from or to a counterparty<br />
(option seller) at a predetermined price on<br />
or before a specific future date.<br />
OTC Derivatives<br />
Nonstandardized financial instruments<br />
( derivatives) not traded on a stock exchange,<br />
but directly between market participants<br />
(over the counter).<br />
P<br />
Portfolio<br />
In general: part or all of one or all categories<br />
of assets (e.g. securities, loans, equity<br />
investments or real estate). Portfolios are<br />
formed primarily to diversify risk. Here:<br />
combination of similar transactions, especially<br />
in securities and/or derivatives,<br />
under price risk considerations.<br />
Pre-tax Return on Average Active Equity<br />
Income before income tax expense attributable<br />
to <strong>Deutsche</strong> <strong>Bank</strong> shareholders (annualized),<br />
which is defined as income before<br />
income taxes less noncontrolling interests,<br />
as a percentage of average active equity.<br />
Prime<br />
Used as a term to categorize U.S. mortgages<br />
representing high quality loans.<br />
Prime Brokerage<br />
Suite of products including clearing and<br />
settlement, custody, reporting, and financing<br />
of positions for institutional investors.<br />
Private <strong>Bank</strong>ing<br />
Business with investment-oriented and high<br />
net worth clients.<br />
Private Equity<br />
Equity investment in non-listed companies.<br />
Examples are venture capital and buyout<br />
funds.<br />
Probability of Default (PD)<br />
The likelihood or probability of default (PD)<br />
of a counterparty is assessed over the next<br />
twelve months time horizon and expressed<br />
as a percentage. The Group does not rate<br />
through the cycle. PD is the primary measure<br />
of creditworthiness of a counterparty.<br />
The numerical probabilities of default are<br />
mapped into a 26-grade rating scale that is<br />
similar to rating scales widely used by<br />
international rating agencies.<br />
Projected Unit Credit Method<br />
The actuarial method, prescribed by IAS 19,<br />
used to determine the actuarial present<br />
value of an entity’s defined benefit obligations<br />
and the related service cost. This<br />
method takes into account benefits accrued<br />
for employee service up to the reporting<br />
date and allows for expected rates of salary<br />
and pension increases.
<strong>Deutsche</strong> <strong>Bank</strong> 05 – Supplementary Information 406<br />
Financial <strong>Report</strong> 2010 Glossary<br />
R<br />
Rating<br />
The result of the objective assessment of<br />
the future economic situation – namely the<br />
default probability – of counterparties based<br />
on present characteristics and assumptions.<br />
The methodology for the rating assignment<br />
strongly depends on the customer type and<br />
the available data. A broad range of methodologies<br />
for the assessment of the credit<br />
risk is applied, such as expert systems and<br />
econometric approaches.<br />
Regulatory Capital<br />
Capital recognized for regulatory purposes<br />
according to the Basel Capital Adequacy<br />
Accord of 2004 for banks. Capital according<br />
to Basel II consists of:<br />
– Tier 1 capital: primarily share capital,<br />
reserves and certain trust preferred securities,<br />
– Tier 2 capital: primarily participatory capital,<br />
cumulative preference shares, longterm<br />
subordinated debt and unrealized<br />
gains on listed securities,<br />
– Tier 3 capital: mainly short-term subordinated<br />
debt and excess Tier 2 capital.<br />
Tier 2 capital is limited to 100 % of Tier 1<br />
capital and the amount of long-term subordinated<br />
debt that can be recognized as<br />
Tier 2 capital is limited to 50 % of Tier 1<br />
capital.<br />
Regulatory Capital Ratio<br />
Key figure for banks expressed as a percentage<br />
ratio of regulatory capital to the<br />
overall regulatory risk position, comprised of<br />
credit, market and operational risks<br />
according to Basel II. The minimum capital<br />
ratio to be complied with is 8 %. At least half<br />
of the regulatory capital principally has to be<br />
Tier 1 capital which leads to a minimum<br />
Tier 1 ratio of 4 %.<br />
Regulatory Trading Book and <strong>Bank</strong>ing Book<br />
The regulatory trading book is defined in<br />
Section 1a of the German <strong>Bank</strong>ing Act. It<br />
consists of financial instruments and commodities<br />
held with trading intent or held for<br />
the purpose of hedging the market risk of<br />
other trading book positions; repurchase<br />
transactions, lending transactions and similar<br />
transactions which relate to trading book<br />
positions; name-to-follow transactions; and<br />
receivables directly related to trading book<br />
positions. Financial instruments and commodities<br />
assigned to the trading book must<br />
be tradable or able to be hedged. The regulatory<br />
banking book comprises all positions<br />
that are not assigned to the trading book.<br />
Repo (Repurchase Agreement)<br />
An agreement to repurchase securities sold<br />
(genuine repurchase agreement where the<br />
asset remains the seller’s property). From<br />
the buyer’s viewpoint, the transaction is a<br />
reverse repo.<br />
Reputational Risk<br />
Risk that publicity concerning a transaction,<br />
counterparty or business practice involving<br />
a client will negatively impact the public’s<br />
trust in the Group.<br />
Residential Mortgage-backed Securities<br />
(RMBS)<br />
Mortgage-backed securities (MBS), which<br />
are backed by residential mortgage loans.<br />
Return on Average<br />
Total Shareholders’ Equity (RoE)<br />
In general: ratio showing the income situation<br />
of a company, setting profit (net income)<br />
in relation to capital employed. Here: net<br />
income as a percentage of average capital<br />
employed over the year.<br />
Risk-weighted Assets (RWA)<br />
Risk-weighted assets are positions that<br />
carry credit, market and/or operational<br />
risk, weighted according to regulatory<br />
requirements. RWAs are regulatory capital<br />
requirements multiplied by 12.5, or in other<br />
words, capital requirements equal 8 % of<br />
RWA.<br />
S<br />
Sarbanes-Oxley Act (SOx)<br />
U.S. capital market law passed in 2002 to<br />
strengthen corporate governance and<br />
restore investor confidence in response to a<br />
number of major corporate and accounting<br />
scandals. Legislation establishes new or<br />
enhanced standards ranging from additional<br />
Corporate Board responsibilities to criminal<br />
penalties for all companies that have listed<br />
their shares on a U.S. stock exchange.<br />
Securitization<br />
Creation of tradable securities from loan<br />
claims, deposit positions (i.e. future cash<br />
flows) and ownership rights in the wider<br />
sense. Examples of securitized rights are<br />
asset-backed securities and mortgagebacked<br />
securities (MBS). Rights are often<br />
evidenced through so-called SPEs (special<br />
purpose entities), companies whose sole<br />
purpose is to issue these securities and<br />
whose assets are the ownership interests in<br />
the company.<br />
Seed Investments<br />
Money used for initial research and/or<br />
operation of an investment fund.<br />
Segment Information<br />
Disclosure of a company’s assets, income<br />
and other information, broken down by activity<br />
(division) and geographical area (region).<br />
Shareholder Value<br />
Management concept that focuses strategic<br />
and operational decision-making on the<br />
steady growth of a company’s value. The<br />
guiding principle is that only returns above<br />
the cost of capital add value for shareholders.<br />
Step Acquisition<br />
In a step acquisition, an acquirer obtains<br />
control of an acquiree in which it held an<br />
equity interest immediately before the<br />
acquisition date (also known as business<br />
combination achieved in stages). In these<br />
transactions, the acquirer remeasures its<br />
previously held equity interest at fair value<br />
and recognizes the resulting gain or loss, if<br />
any, in the income statement.
<strong>Deutsche</strong> <strong>Bank</strong> 05 – Supplementary Information 407<br />
Financial <strong>Report</strong> 2010 Glossary<br />
Subprime<br />
Used as a term to categorize U.S. mortgages<br />
representing loans with a higher expectation<br />
of risk. In order to determine subprime industry<br />
standards including FICO scores and<br />
loan-to-value ratios are applied.<br />
Swaps<br />
In general: exchange of one payment flow<br />
for another. Interest rate swap: exchange of<br />
interest payment flows in the same currency<br />
with different terms and conditions (e.g.<br />
fixed or floating). Currency swap: exchange<br />
of interest payment flows and principal<br />
amounts in different currencies.<br />
T<br />
Target Definition<br />
Target definition excludes significant gains<br />
(such as gains from the sale of industrial<br />
holdings, businesses or premises) or significant<br />
charges (such as charges from<br />
restructuring, goodwill impairment or litigation)<br />
if they are not indicative of the future<br />
performance of <strong>Deutsche</strong> <strong>Bank</strong> core businesses.<br />
Trust Preferred Securities<br />
Hybrid capital instruments characterized by<br />
profit-related interest payments. Under<br />
banking supervisory regulations they are<br />
part of Tier 1 capital if interest payments are<br />
not accumulated in case of losses (noncumulative<br />
trust preferred securities) and if<br />
the instruments do not have a stated maturity<br />
date or if they are not redeemable at the<br />
option of the holder. Otherwise they are<br />
included in Tier 2 capital (for example cumulative<br />
trust preferred securities).<br />
V<br />
Value-at-risk<br />
For a given portfolio, the value-at-risk is<br />
an estimate of the potential future loss (in<br />
terms of market value) that, under normal<br />
market conditions, will not be exceeded in<br />
a defined period of time and with a defined<br />
confidence level.<br />
W<br />
Wrapped Bond<br />
Term for debt security insured or guaranteed<br />
by a third party.
<strong>Deutsche</strong> <strong>Bank</strong> 05 – Supplementary Information 408<br />
Financial <strong>Report</strong> 2010 Impressum – Publications<br />
Impressum – Publications<br />
<strong>Deutsche</strong> <strong>Bank</strong> Aktiengesellschaft<br />
Taunusanlage 12<br />
60262 Frankfurt am Main<br />
Germany<br />
Telephone: +49 69 9 10 00<br />
deutsche.bank@db.com<br />
Investor Relations:<br />
+49 69 9 10-3 80 80<br />
db.ir@db.com<br />
Publications relating to our financial<br />
reporting<br />
Please note that <strong>Deutsche</strong> <strong>Bank</strong> Group’s<br />
annual report consists of two separate<br />
sections: <strong>Annual</strong> Review 2010 and Financial<br />
<strong>Report</strong> 2010.<br />
— <strong>Annual</strong> Review 2010<br />
(German and English)<br />
— Financial <strong>Report</strong> 2010<br />
(German and English)<br />
— <strong>Annual</strong> <strong>Report</strong> 2010 on Form 20-F<br />
(English)<br />
— <strong>Annual</strong> Financial Statements and<br />
Management <strong>Report</strong> of<br />
<strong>Deutsche</strong> <strong>Bank</strong> AG 2010<br />
(German and English)<br />
— List of Advisory Council Members<br />
(German)<br />
— Corporate Social Responsibility –<br />
<strong>Report</strong> 2010<br />
(from May 2011 in German and English)<br />
How to order:<br />
E-Mail – Internet<br />
service-center@bertelsmann.de<br />
www.deutsche-bank.com/10<br />
Fax<br />
+49 18 05 0 70 808<br />
Phone<br />
+49 18 05 802 200<br />
Mail<br />
arvato logistics services<br />
Bestellservice <strong>Deutsche</strong> <strong>Bank</strong><br />
Gottlieb-Daimler-Straße 1<br />
D-33428 Harsewinkel<br />
Germany<br />
Online<br />
<strong>Annual</strong> Review 2010 and<br />
Financial <strong>Report</strong> 2010 on the Internet:<br />
www.deutsche-bank.com/10<br />
Cautionary statement<br />
regarding forward-looking statements<br />
This report contains forward-looking statements.<br />
Forward-looking statements are statements that are<br />
not historical facts; they include statements about our<br />
beliefs and expectations and the assumptions<br />
underlying them. These statements are based on<br />
plans, estimates and projections as they are currently<br />
available to the management of <strong>Deutsche</strong> <strong>Bank</strong>.<br />
Forward-looking statements therefore speak only as<br />
of the date they are made, and we undertake no<br />
obligation to update publicly any of them in light of<br />
new information or future events.<br />
By their very nature, forward-looking statements<br />
involve risks and uncertainties. A number of important<br />
factors could therefore cause actual results to differ<br />
materially from those contained in any forwardlooking<br />
statement. Such factors include the conditions<br />
in the financial markets in Germany, in Europe,<br />
in the United States and elsewhere from which we<br />
derive a substantial portion of our trading revenues,<br />
potential defaults of borrowers or trading counterparties,<br />
the implementation of our management agenda,<br />
the reliability of our risk management policies,<br />
procedures and methods, and other risks referenced<br />
in our filings with the U.S. Securities and Exchange<br />
Commission. Such factors are described in detail in<br />
our SEC Form 20-F of March 15, 2011 in the section<br />
“Risk Factors”. Copies of this document are available<br />
upon request or can be downloaded from<br />
www.deutsche-bank.com/ir
2011<br />
April 28, 2011<br />
Interim <strong>Report</strong> as of March 31, 2011<br />
May 26, 2011<br />
<strong>Annual</strong> General Meeting in the Festhalle<br />
Frankfurt am Main (Exhibition Center)<br />
May 27, 2011<br />
Dividend payment<br />
July 26, 2011<br />
Interim <strong>Report</strong> as of June 30, 2011<br />
October 25, 2011<br />
Interim <strong>Report</strong> as of September 30, 2011<br />
<strong>2012</strong><br />
February 2, <strong>2012</strong><br />
Preliminary results for the 2011 financial year<br />
March 20, <strong>2012</strong><br />
<strong>Annual</strong> <strong>Report</strong> 2011 and Form 20-F<br />
April 26, <strong>2012</strong><br />
Interim <strong>Report</strong> as of March 31, <strong>2012</strong><br />
May 31, <strong>2012</strong><br />
<strong>Annual</strong> General Meeting in the Festhalle<br />
Frankfurt am Main (Exhibition Center)<br />
June 1, <strong>2012</strong><br />
Dividend payment<br />
July 31, <strong>2012</strong><br />
Interim <strong>Report</strong> as of June 30, <strong>2012</strong><br />
October 30, <strong>2012</strong><br />
Interim <strong>Report</strong> as of September 30, <strong>2012</strong>