WEPA Outlook on Water Environmental Management in Asia 2012
WEPA Outlook on Water Environmental Management in Asia 2012
WEPA Outlook on Water Environmental Management in Asia 2012

Create successful ePaper yourself
Turn your PDF publications into a flip-book with our unique Google optimized e-Paper software.
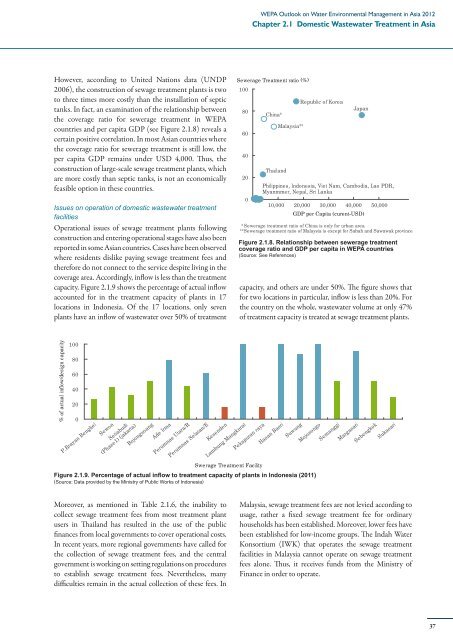
<str<strong>on</strong>g>WEPA</str<strong>on</strong>g> <str<strong>on</strong>g>Outlook</str<strong>on</strong>g> <strong>on</strong> <strong>Water</strong> Envir<strong>on</strong>mental <strong>Management</strong> <strong>in</strong> <strong>Asia</strong> <strong>2012</strong>Chapter 2.1 Domestic Wastewater Treatment <strong>in</strong> <strong>Asia</strong>However, accord<strong>in</strong>g to United Nati<strong>on</strong>s data (UNDP2006), the c<strong>on</strong>structi<strong>on</strong> of sewage treatment plants is twoto three times more costly than the <strong>in</strong>stallati<strong>on</strong> of septictanks. In fact, an exam<strong>in</strong>ati<strong>on</strong> of the relati<strong>on</strong>ship betweenthe coverage ratio for sewerage treatment <strong>in</strong> <str<strong>on</strong>g>WEPA</str<strong>on</strong>g>countries and per capita GDP (see Figure 2.1.8) reveals acerta<strong>in</strong> positive correlati<strong>on</strong>. In most <strong>Asia</strong>n countries wherethe coverage ratio for sewerage treatment is still low, theper capita GDP rema<strong>in</strong>s under USD 4,000. Thus, thec<strong>on</strong>structi<strong>on</strong> of large-scale sewage treatment plants, whichare more costly than septic tanks, is not an ec<strong>on</strong>omicallyfeasible opti<strong>on</strong> <strong>in</strong> these countries.Issues <strong>on</strong> operati<strong>on</strong> of domestic wastewater treatmentfacilitiesOperati<strong>on</strong>al issues of sewage treatment plants follow<strong>in</strong>gc<strong>on</strong>structi<strong>on</strong> and enter<strong>in</strong>g operati<strong>on</strong>al stages have also beenreported <strong>in</strong> some <strong>Asia</strong>n countries. Cases have been observedwhere residents dislike pay<strong>in</strong>g sewage treatment fees andtherefore do not c<strong>on</strong>nect to the service despite liv<strong>in</strong>g <strong>in</strong> thecoverage area. Accord<strong>in</strong>gly, <strong>in</strong>flow is less than the treatmentcapacity. Figure 2.1.9 shows the percentage of actual <strong>in</strong>flowaccounted for <strong>in</strong> the treatment capacity of plants <strong>in</strong> 17locati<strong>on</strong>s <strong>in</strong> Ind<strong>on</strong>esia. Of the 17 locati<strong>on</strong>s, <strong>on</strong>ly sevenplants have an <strong>in</strong>flow of wastewater over 50% of treatmentSewerage Treatment ratio (%)100806040200Ch<strong>in</strong>a*ThailandMalaysia**Republic of KoreaJapanPhilipp<strong>in</strong>es, Ind<strong>on</strong>esia, Viet Nam, Cambodia, Lao PDR,Myanmmer, Nepal, Sri Lanka10,000 20,000 30,000 40,000 50,000GDP per Capita (curent-USD)* Sewerage treatment ratio of Ch<strong>in</strong>a is <strong>on</strong>ly for urban area**Sewerage treatment ratio of Malaysia is except for Sabah and Sawawak prov<strong>in</strong>ceFigure 2.1.8. Relati<strong>on</strong>ship between sewerage treatmentcoverage ratio and GDP per capita <strong>in</strong> <str<strong>on</strong>g>WEPA</str<strong>on</strong>g> countries(Source: See References)capacity, and others are under 50%. The figure shows thatfor two locati<strong>on</strong>s <strong>in</strong> particular, <strong>in</strong>flow is less than 20%. Forthe country <strong>on</strong> the whole, wastewater volume at <strong>on</strong>ly 47%of treatment capacity is treated at sewage treatment plants.% of actual <strong>in</strong>flow/design capacity100806040200P.Brayan BengkelSew<strong>on</strong>Setiabudi(Phase1) (jakarta)Boj<strong>on</strong>gsoangAde IrmaPerumnas Utara/RPerumnas Selatan/EKesendenLambung MangkuratPekapuran rayaHasan BasriSuwungMojos<strong>on</strong>goSemanggiMargasariSebengkokSukasariSwerage Treatment FacilityFigure 2.1.9. Percentage of actual <strong>in</strong>flow to treatment capacity of plants <strong>in</strong> Ind<strong>on</strong>esia (2011)(Source: Data provided by the M<strong>in</strong>istry of Public Works of Ind<strong>on</strong>esia)Moreover, as menti<strong>on</strong>ed <strong>in</strong> Table 2.1.6, the <strong>in</strong>ability tocollect sewage treatment fees from most treatment plantusers <strong>in</strong> Thailand has resulted <strong>in</strong> the use of the publicf<strong>in</strong>ances from local governments to cover operati<strong>on</strong>al costs.In recent years, more regi<strong>on</strong>al governments have called forthe collecti<strong>on</strong> of sewage treatment fees, and the centralgovernment is work<strong>in</strong>g <strong>on</strong> sett<strong>in</strong>g regulati<strong>on</strong>s <strong>on</strong> proceduresto establish sewage treatment fees. Nevertheless, manydifficulties rema<strong>in</strong> <strong>in</strong> the actual collecti<strong>on</strong> of these fees. InMalaysia, sewage treatment fees are not levied accord<strong>in</strong>g tousage, rather a fixed sewage treatment fee for ord<strong>in</strong>aryhouseholds has been established. Moreover, lower fees havebeen established for low-<strong>in</strong>come groups. The Indah <strong>Water</strong>K<strong>on</strong>sortium (IWK) that operates the sewage treatmentfacilities <strong>in</strong> Malaysia cannot operate <strong>on</strong> sewage treatmentfees al<strong>on</strong>e. Thus, it receives funds from the M<strong>in</strong>istry ofF<strong>in</strong>ance <strong>in</strong> order to operate.37