Remittances and Poverty in Mexico: A Propensity Score Matching ...
Remittances and Poverty in Mexico: A Propensity Score Matching ...
Remittances and Poverty in Mexico: A Propensity Score Matching ...

Create successful ePaper yourself
Turn your PDF publications into a flip-book with our unique Google optimized e-Paper software.
<strong>Remittances</strong> <strong>and</strong> <strong>Poverty</strong> <strong>in</strong> <strong>Mexico</strong>:<br />
A <strong>Propensity</strong> <strong>Score</strong> Match<strong>in</strong>g Approach 1<br />
Gerardo Esquivel<br />
El Colegio de México<br />
<strong>and</strong><br />
Alej<strong>and</strong>ra Huerta-P<strong>in</strong>eda<br />
Secretaría de F<strong>in</strong>anzas, GDF.<br />
This version: February, 2006<br />
Abstract: In this paper we <strong>in</strong>vestigate the effect of remittances on poverty<br />
condition among Mexican households. We use three alternative (officiallydef<strong>in</strong>ed)<br />
measures of poverty <strong>in</strong> <strong>Mexico</strong> (food-based, capabilities-based <strong>and</strong><br />
assets-based) <strong>in</strong> order to evaluate the impact of remittances on poverty. We use<br />
a propensity score approach to match remittance receiv<strong>in</strong>g households with<br />
households that have similar characteristics but that do not receive<br />
remittances. We f<strong>in</strong>d that receiv<strong>in</strong>g remittances (regardless of the amount)<br />
reduces a household’s probability of be<strong>in</strong>g <strong>in</strong> food-based <strong>and</strong> <strong>in</strong> capabilitiesbased<br />
poverty <strong>in</strong> 8 <strong>and</strong> 6 percentage po<strong>in</strong>ts, respectively. If the remittance<br />
senders resemble the Mexican population, this effect is equivalent to a<br />
reduction of around 50 <strong>and</strong> 30% <strong>in</strong> the correspond<strong>in</strong>g poverty rates for<br />
remittance receiv<strong>in</strong>g households vis á vis non remittance receiv<strong>in</strong>g households.<br />
However, receiv<strong>in</strong>g remittances does not seem to affect the p robability of be<strong>in</strong>g<br />
<strong>in</strong> assets-based poverty. In that sense, remittances help to reduce the level <strong>and</strong><br />
depth of poverty, but only up to a certa<strong>in</strong> po<strong>in</strong>t.<br />
JEL Codes: 015, F22, I32<br />
Key Words: Migration, <strong>Remittances</strong>, <strong>Poverty</strong>, <strong>Mexico</strong>.<br />
1 This paper was written under the auspices of the Inter-American Development Bank (IADB). We<br />
gratefully acknowledged additional f<strong>in</strong>ancial support from Conacyt (#48175-S). We are grateful to<br />
Ernesto López-Cordova, Richard Adams <strong>and</strong> sem<strong>in</strong>ar participants at the IADB, IMF, LACEA<br />
meet<strong>in</strong>g <strong>in</strong> Paris, <strong>and</strong> the Federal Reserve Bank of Dallas, Houston Branch for helpful comments<br />
<strong>and</strong> suggestions. E-mail: gesquive@colmex.mx.
1. Introduction<br />
<strong>Remittances</strong> to develop<strong>in</strong>g countries have been grow<strong>in</strong>g at a relatively fast pace <strong>in</strong><br />
recent years. Indeed, <strong>in</strong> many countries they are now the most important source of<br />
external f<strong>in</strong>anc<strong>in</strong>g. Moreover, remittances from abroad seem to be more stable than<br />
other types of external <strong>in</strong>flows <strong>and</strong> they even seem to be countercyclical. 2<br />
Notwithst<strong>and</strong><strong>in</strong>g the grow<strong>in</strong>g importance of remittances for the develop<strong>in</strong>g<br />
world, their effects on the recipient economies are relatively unknown. Indeed,<br />
there are relatively few studies that <strong>in</strong>vestigate the effects of remittances on these<br />
economies. 3<br />
One of the areas that has received less attention <strong>in</strong> the research agenda is the<br />
relationship that may exist between remittances <strong>and</strong> poverty. It is somehow<br />
unclear why this is so. It seems that this is partially the result of strong priors on<br />
this matter. For some authors, the existence of a positive relation between these<br />
two variables is somehow obvious <strong>and</strong> may not deserve further discussion. For<br />
other authors, the relationship between remittances <strong>and</strong> poverty is affected by the<br />
characteristics of the migration process. That is, s<strong>in</strong>ce there is plenty of evidence<br />
show<strong>in</strong>g that migration is costly, migrants (<strong>and</strong> therefore potential senders of<br />
remittances) should not belong to the poorest people <strong>in</strong> the send<strong>in</strong>g economies. For<br />
that reason, remittances might not have an immediate <strong>and</strong> direct effect on poverty.<br />
This position is well represented by Kapur (2004): “The fact that migrants are not<br />
drawn from the poorest households <strong>in</strong> their country of orig<strong>in</strong> means that while<br />
remittances are poor-friendly, their direct effects on the poorest groups may be<br />
limited. Instead, the effects on structural poverty are likely to occur through<br />
substantial <strong>in</strong>direct effects … ” Similarly, Adams <strong>and</strong> Page (2003) conclude that<br />
“because of the considerable travel costs associated with <strong>in</strong>ternational migration,<br />
<strong>in</strong>ternational migrants come from those <strong>in</strong>come groups which are just above the<br />
2 See, among others, Ratha (2003) <strong>and</strong> Kapur (2004).<br />
3 Kapur (2004) <strong>and</strong> López-Cordova (2005) review some of the exist<strong>in</strong>g literature. López -Cordova<br />
<strong>and</strong> Olmedo (2006) present a survey on remittances <strong>and</strong> development <strong>in</strong>dicators.
poverty l<strong>in</strong>e <strong>in</strong> middle-<strong>in</strong>come develop<strong>in</strong>g countries”. 4 Other authors have also<br />
suggested that the poorest people may lack the appropriate skills to benefit from<br />
<strong>in</strong>ternational migration, <strong>and</strong> therefore they tend to have lower emigration rates.<br />
This argument also implies that remittances may not have a direct impact on<br />
poverty.<br />
In the economic literature there are relatively few papers explicitly<br />
address<strong>in</strong>g the likely relationship between remittances <strong>and</strong> poverty. In the most<br />
extensive study on this topic, Adams <strong>and</strong> Page (2003) analyze the relationship<br />
between poverty <strong>and</strong> remittances <strong>in</strong> a sample of seventy-four develop<strong>in</strong>g<br />
countries. They f<strong>in</strong>d that <strong>in</strong>ternational remittances have a strongly statistical<br />
negative impact on poverty. Specifically, they f<strong>in</strong>d that a 10 percent <strong>in</strong>crease <strong>in</strong> the<br />
share of remittances <strong>in</strong> a country’s GDP, leads to a reduction of 1.6 percent <strong>in</strong> the<br />
share of people liv<strong>in</strong>g <strong>in</strong> poverty. On the other h<strong>and</strong>, Adams (1991), Adams (2004)<br />
<strong>and</strong> López-Cordova (2005) analyze the relation between remittances <strong>and</strong> poverty<br />
<strong>in</strong>dicators at a country level, <strong>in</strong> Egypt, Guatemala, <strong>and</strong> <strong>Mexico</strong>, respectively.<br />
Adams (1991) f<strong>in</strong>ds that <strong>in</strong> Egypt the number of rural households <strong>in</strong> poverty drops<br />
<strong>in</strong> 9.8 percent when household’s <strong>in</strong>come <strong>in</strong>cludes <strong>in</strong>ternational remittances. Adams<br />
(2004) f<strong>in</strong>ds that the squared poverty gap measure <strong>in</strong> Guatemala decl<strong>in</strong>es by 19.8<br />
percent when <strong>in</strong>ternational remittances are <strong>in</strong>cluded as part of total household<br />
<strong>in</strong>come. This occurs, accord<strong>in</strong>g to the author, because the <strong>in</strong>come status of<br />
households at the lowest decile changes dramatically when they receive<br />
remittances. López-Cordova (2005), on the other h<strong>and</strong>, f<strong>in</strong>ds that remittances have<br />
a statistically <strong>and</strong> economically significant impact <strong>in</strong> reduc<strong>in</strong>g poverty <strong>in</strong> <strong>Mexico</strong> at<br />
the municipal level. He estimates that a one percentage po<strong>in</strong>t <strong>in</strong>crease <strong>in</strong> the<br />
fraction of remittance-receiv<strong>in</strong>g households <strong>in</strong> a municipality significantly reduces<br />
the fraction of the population earn<strong>in</strong>g relatively low <strong>in</strong>come.<br />
4 The two positions just described correspond to what Taylor, Mora <strong>and</strong> Adams (2005) refer as the<br />
“optimistic” <strong>and</strong> the “pesimistic” views, respectively.
In this paper we address, <strong>in</strong> a purely empirical manner, the issue of<br />
remittances <strong>and</strong> poverty for the Mexican case. We plan to do so by tak<strong>in</strong>g <strong>in</strong>to<br />
account that current exist<strong>in</strong>g data do not allows us to follow a household before<br />
<strong>and</strong> after receiv<strong>in</strong>g remittances. In that sense, we cannot actually identify with a<br />
st<strong>and</strong>ard methodology the effect that migrat<strong>in</strong>g <strong>and</strong> send<strong>in</strong>g remittances back<br />
home may have on poverty. We plan to get around this problem by us<strong>in</strong>g a<br />
match<strong>in</strong>g approach. This means that we will match, us<strong>in</strong>g a propensity score<br />
approach, remittance-receiv<strong>in</strong>g households with similar households that do not<br />
receive remittances. Once we have matched households <strong>in</strong> this manner we are able<br />
to compute the effect of remittances on the probability of be<strong>in</strong>g <strong>in</strong> a situation of<br />
poverty. This effect takes the form of an “average treatment on the treated” effect,<br />
where the treatment is taken as whether a household receives remittances or not.<br />
For robustness purposes, we will use four alternative methods of estimation of the<br />
average treatment effect.<br />
The Mexican case is particularly well suited to shed light on the discussion<br />
of whether remittances help the poorest people or not, s<strong>in</strong>ce we have nationally<br />
representative microdata on total <strong>in</strong>come, household characteristics, <strong>in</strong>come from<br />
remittances, <strong>and</strong> household <strong>in</strong>formation on three officially-def<strong>in</strong>ed alternative<br />
measures of poverty: food-based poverty, capabilities-based poverty <strong>and</strong> assets-<br />
based poverty (which are equivalent to extreme poverty, poverty <strong>and</strong> moderate<br />
poverty). As a result, we will then be able to analyze whether remittances may<br />
help households to get out of each type of poverty.<br />
From a purely Mexican perspective, there are at least two other good<br />
reasons to undertake this study: first, because remittances are becom<strong>in</strong>g an<br />
extraord<strong>in</strong>arily important source of external resources for the Mexican economy.<br />
Moreover, the recent trend <strong>in</strong> remittances, as well as current migration patterns,<br />
suggests that they will cont<strong>in</strong>ue to be important at least for several years ahead.<br />
Therefore, underst<strong>and</strong><strong>in</strong>g the impact of remittances on different aspects of the<br />
Mexican economy is critical to foresee future trends on some of these aspects.
Second, it is also <strong>in</strong>terest<strong>in</strong>g to pursue this question from a public policy<br />
perspective. This is particularly <strong>in</strong>terest<strong>in</strong>g s<strong>in</strong>ce there is an ongo<strong>in</strong>g debate <strong>in</strong><br />
<strong>Mexico</strong> regard<strong>in</strong>g the role of remittances <strong>in</strong> the fight aga<strong>in</strong>st poverty. For example,<br />
<strong>in</strong> 2005 the Mexican government announced that a reduction <strong>in</strong> poverty levels had<br />
occurred between 2000 <strong>and</strong> 2004. This result came partially as a surprise because<br />
dur<strong>in</strong>g those years the Mexican economy had grown at very low rates. Then, the<br />
source of the reduction <strong>in</strong> poverty was attributed by some to the <strong>in</strong>creased volume<br />
of remittances, whereas the Mexican government claimed that this result was due<br />
to its successful social policy. In fact, the Mexican government downplayed the<br />
role of remittances on poverty, by claim<strong>in</strong>g that most migrants were not among the<br />
poorest people <strong>in</strong> <strong>Mexico</strong>. We expect that the results of our research may help to<br />
shed light on this debate.<br />
F<strong>in</strong>ally, it is important to mention some differences of our approach with<br />
respect to those followed by previous studies. First, unlike Adams <strong>and</strong> Page (2003)<br />
<strong>and</strong> López-Córdova (2005), who analyze the impact of remittances on poverty at<br />
an aggregate level, we focus on the role of remittances on poverty at a micro level.<br />
In that sense, Adams (2004) is the only other paper that we are aware of that also<br />
uses microdata to analyze the role of remittances on the poverty status of the<br />
receivers. 5 On the other h<strong>and</strong>, unlike Adams (2004), we do not estimate a<br />
counterfactual earn<strong>in</strong>gs function for the migrants. Although this would have been<br />
desirable, it cannot be done with the available data.<br />
Besides this <strong>in</strong>troduction, the rest of the paper is as follows: secion 2<br />
describes the relevance of remittances <strong>in</strong> <strong>Mexico</strong> <strong>and</strong> presents a brief <strong>in</strong>troduction<br />
<strong>and</strong> description of the data; section 3 describes the methodology that we follow;<br />
section 4 presents the empirical results, <strong>and</strong> Section 5 concludes.<br />
5 More recently, Taylor, Mora <strong>and</strong> Adams (2005) have also studied the role of remittances on<br />
poverty <strong>in</strong> rural <strong>Mexico</strong> us<strong>in</strong>g <strong>in</strong>dividual level data. They f<strong>in</strong>d that remittances reduce poverty <strong>in</strong><br />
rural households. However, they obta<strong>in</strong> this result just add<strong>in</strong>g remittances to local earn<strong>in</strong>gs which,<br />
almost by def<strong>in</strong>ition, reduces poverty.
2. <strong>Remittances</strong> <strong>in</strong> <strong>Mexico</strong><br />
International remittances have traditionally been an important source of foreign<br />
exchange resources for the Mexican economy. In recent years, however,<br />
remittances have become a grow<strong>in</strong>g source of external funds. The amount of<br />
remittances flow<strong>in</strong>g <strong>in</strong>to <strong>Mexico</strong> has <strong>in</strong>creased monotonically s<strong>in</strong>ce 1991 <strong>and</strong> they<br />
are now more than twice the <strong>in</strong>flows from tourism-related activities. Indeed, <strong>in</strong><br />
recent years, remittances have even been as large as foreign direct <strong>in</strong>vestment<br />
<strong>in</strong>flows to <strong>Mexico</strong> (see Figure 1). In terms of the importance of remittances relative<br />
to the size of the economy, Figure 2 shows that remittances <strong>in</strong> <strong>Mexico</strong> are now<br />
close to 3 percent of GDP <strong>and</strong> that they have become particularly important s<strong>in</strong>ce<br />
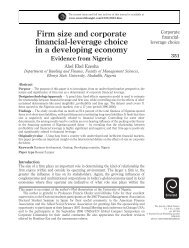
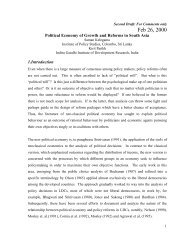
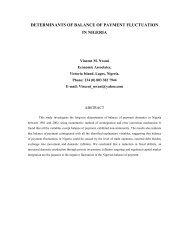
2000. Moreover, <strong>Mexico</strong> is already the country that receives the second largest<br />
amount of remittances around the world (see Figure 3).
20<br />
16<br />
12<br />
8<br />
4<br />
0<br />
India<br />
<strong>Mexico</strong><br />
Figure 3. <strong>Remittances</strong> Receipts Around the World, 2004<br />
(billion dollars)<br />
Spa<strong>in</strong><br />
Serbia<br />
Ch<strong>in</strong>a<br />
<strong>Remittances</strong> data at the household level <strong>and</strong> poverty def<strong>in</strong>itions<br />
Pakistan<br />
The data that we use <strong>in</strong> this paper comes from the Encuesta Nacional de Ingreso y<br />
Gasto de los Hogares (ENIGH or Household’s Income-Expenditure National Survey)<br />
conducted by the National Institute of Statistics (INEGI) <strong>in</strong> 2002. This survey<br />
Morocco<br />
Bangladesh<br />
Colombia<br />
Portugal<br />
Egypt<br />
El Salvador<br />
Brazil
covers 17,167 households <strong>and</strong> 72,602 <strong>in</strong>dividuals. It conta<strong>in</strong>s <strong>in</strong>formation about the<br />
characteristics of households, <strong>in</strong>dividuals, <strong>in</strong>come <strong>and</strong> expenses. With this<br />
<strong>in</strong>formation we compute the household’s net per capita <strong>in</strong>come <strong>in</strong> pesos of August<br />
2002. This measure is constructed as the monthly average of the monetary <strong>and</strong><br />
non-monetary <strong>in</strong>come of all members of the household plus (m<strong>in</strong>us) the monetary<br />
or <strong>in</strong>-species transferences received (made) by the household divided by the total<br />
number of household members. <strong>Remittances</strong> are measured as the monthly average<br />
<strong>in</strong>come that is received by the household as transference from abroad.<br />
A household is considered to be poor (accord<strong>in</strong>g to the food-based poverty<br />
def<strong>in</strong>ition) 6 if the net per capita <strong>in</strong>come of the household is less than or equal to<br />
672.25 pesos of 2002 if it belongs to an urban zone <strong>and</strong> less than or equal to 494.77<br />
pesos if it belongs to a rural zone. This amount of money is considered as the<br />
lowest <strong>in</strong>come necessary to afford a m<strong>in</strong>imum basket of food. In 2002, 15.8% of<br />
households <strong>and</strong> 20.3% of the population <strong>in</strong> <strong>Mexico</strong> were liv<strong>in</strong>g <strong>in</strong> this type of<br />
poverty condition.<br />
A household is considered to be <strong>in</strong> capabilities-based poverty if its members<br />
cannot afford to cover their basic expenses on food, health <strong>and</strong> education,<br />
accord<strong>in</strong>g to an officially def<strong>in</strong>ed basket. This variable takes the value 1 if the<br />
household’s net per capita <strong>in</strong>come is less than or equal to $792.58 pesos if it<br />
belongs ton urban zone <strong>and</strong> less than or equal to $587.29 pesos if it belongs to a<br />
rural zone. In 2002, 21.1% of households <strong>and</strong> 26.5% of the population <strong>in</strong> <strong>Mexico</strong><br />
were under this condition.<br />
F<strong>in</strong>ally, a household is considered to be <strong>in</strong> assets-based poverty if its<br />
members cannot cover their expenses of food, health, education, dress<strong>in</strong>g, home<br />
<strong>and</strong> public transportation. This variable takes the value 1 if the household’s net per<br />
capita <strong>in</strong>come is less than or equal to $1,367.35 pesos if it belongs to an urban zone<br />
<strong>and</strong> less than or equal to $946.49 pesos if it belongs to a rural zone. In 2002, 44.1%<br />
of households <strong>and</strong> 51.7% of the population <strong>in</strong> <strong>Mexico</strong> were under this condition.<br />
6 See Sedesol (2003) for more details on the measurement of poverty <strong>in</strong> <strong>Mexico</strong>.
Who receives remittances <strong>in</strong> <strong>Mexico</strong>?<br />
Accord<strong>in</strong>g to our data, 5.7 percent of total Mexican households received<br />
remittances <strong>in</strong> 2002. However, <strong>in</strong> this case there is a clear rural-urban divide: while<br />
only 3.1%of urban households received remittances <strong>in</strong> 2002, more than 10 percent<br />
of rural households did. In fact, whereas almost two-thirds of total households are<br />
urban <strong>and</strong> one-third is rural, the distribution of households receiv<strong>in</strong>g remittances<br />
is exactly the opposite (see Table 1).<br />
Table 1. Distribution of Households by <strong>Remittances</strong>-Receiv<strong>in</strong>g Status<br />
All Households (%) Urban HH (%) Rural HH (%)<br />
Do not receive remittances 94.3 96.9 89.9<br />
Receive remittances 5.7 3.1 10.2<br />
Total 100.0 100.0 100.0<br />
All Households (%) Urban (%) Rural (%)<br />
HH Not Receiv<strong>in</strong>g <strong>Remittances</strong> 100.0 65.0 35.0<br />
HH Receiv<strong>in</strong>g <strong>Remittances</strong> 100.0 35.0 65.0<br />
All Households 100.0 64.0 36.0<br />
Source: ENIGH, 2002.<br />
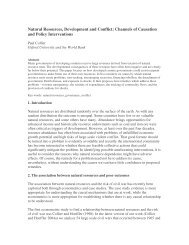
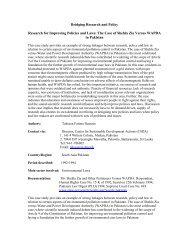
In terms of their regional distribution, remittances-receiv<strong>in</strong>g households <strong>in</strong><br />
<strong>Mexico</strong> are not uniformly distributed across the country. Maps 1 <strong>and</strong> 2 show the<br />
regional distribution of remittance-receiv<strong>in</strong>g households as well as the share of<br />
state households that receive remittances, respectively. These maps show that<br />
remittance-receiv<strong>in</strong>g households are concentrated <strong>in</strong> a few Mexican states <strong>and</strong> that<br />
they tend to be located <strong>in</strong> the center-north part of the country. Indeed, more than<br />
one third of all remittances-receiv<strong>in</strong>g households <strong>in</strong> <strong>Mexico</strong> are concentrated <strong>in</strong><br />
only four states (Michoacan, Durango, Guanajuato y Zacatecas, see the Appendix<br />
for more detail on Mexican states). Similarly, <strong>in</strong> seven Mexican states 10 percent or<br />
more of their total households receive remittances from abroad (Michoacan,<br />
Durango, Guanajuato, Zacatecas, San Luis Potosí, Jalisco <strong>and</strong> Aguascalientes). It is
<strong>in</strong>terest<strong>in</strong>g to note that the poorest Mexican states, such as Chiapas, Guerrero,<br />
Oaxaca, Puebla or Veracruz, do not belong to this list, although the recent pattern<br />
of migration may change this distribution <strong>in</strong> the future.<br />
Map 1. Distribution of Households Receiv<strong>in</strong>g <strong>Remittances</strong> by State<br />
(as a percentage of total HRR)<br />
Map 2. Households Receiv<strong>in</strong>g <strong>Remittances</strong><br />
(as a percentage of total households <strong>in</strong> the State)
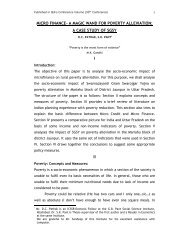
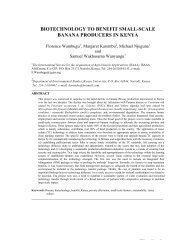
In order to verify the consistency of our state data on remittance-receiv<strong>in</strong>g<br />
households from the ENIGH 2002, we compared our remittances <strong>in</strong>dicators at the<br />
state level with two related <strong>in</strong>dicators that were derived by López-Cordova (2005)<br />
us<strong>in</strong>g <strong>in</strong>formation from the 10 percent public sample of the 2000 Population <strong>and</strong><br />
Hous<strong>in</strong>g Census. The result of this comparison is shown <strong>in</strong> Figure 4: although<br />
there are some differences, the three <strong>in</strong>dicators are highly correlated, suggest<strong>in</strong>g<br />
that our data are consistent with alternative sources of <strong>in</strong>formation.<br />
15<br />
10<br />
5<br />
0<br />
Figure 4. Percentage of Households by State<br />
Receiv<strong>in</strong>g <strong>Remittances</strong><br />
(ENIGH 2002)<br />
0 5 10<br />
0 5 10 15<br />
Receiv<strong>in</strong>g <strong>Remittances</strong><br />
(CENSO 2001)<br />
Households Characteristics <strong>and</strong> <strong>Remittances</strong><br />
With Migrants <strong>in</strong> the<br />
US (CENSO 2001)<br />
0 5 10 15<br />
Table 2 shows a summary of household characteristics by remittance-receiv<strong>in</strong>g<br />
status. Although the figures are not statistically different between types of<br />
households, it is <strong>in</strong>terest<strong>in</strong>g to note that remittance-receiv<strong>in</strong>g households tend to<br />
have less male members, have lower earn<strong>in</strong>gs (even after tak<strong>in</strong>g <strong>in</strong>to account<br />
remittances), <strong>and</strong> tend to have lower levels of education. In terms of household<br />
<strong>in</strong>come, household receiv<strong>in</strong>g remittances have an <strong>in</strong>come which is only 66% (40%)<br />
that of a non-receiv<strong>in</strong>g remittances household when we <strong>in</strong>clude (exclude)<br />
remittances <strong>in</strong>come.<br />
10<br />
5<br />
0<br />
15<br />
10<br />
5<br />
0
Table 2. Household Characteristics by <strong>Remittances</strong>-Receiv<strong>in</strong>g Status<br />
Variable Not Receiv<strong>in</strong>g <strong>Remittances</strong> Receiv<strong>in</strong>g remittances<br />
Number of members <strong>in</strong> the house<br />
Number of Men<br />
Number of Women<br />
Monthly net <strong>in</strong>come<br />
Monthly net <strong>in</strong>come exclud<strong>in</strong>g remittances<br />
Members younger than 5<br />
Members younger than 10<br />
Members older than 15<br />
Members older than 15 without primary<br />
education<br />
Members older than 15 with at least primary<br />
education<br />
Members older than 15 with at least<br />
secondary education<br />
Members older than 15 with at least high<br />
school education<br />
Members older than 15 with at least<br />
bachelor's degree<br />
Note: St<strong>and</strong>ard errors <strong>in</strong> parentheses.<br />
<strong>Remittances</strong> <strong>and</strong> poverty condition<br />
Table 3 shows the distribution of households by poverty condition <strong>and</strong> remittance-<br />
receiv<strong>in</strong>g status. This table shows that there is no clear pattern associat<strong>in</strong>g poverty<br />
condition <strong>and</strong> remittance receiv<strong>in</strong>g status. Overall, both poor <strong>and</strong> non-poor<br />
households tend to have a similar fraction of remittance-receiv<strong>in</strong>g households<br />
(which ranges between 5.3 <strong>and</strong> 6.2% of each type of household), <strong>and</strong> this does not<br />
depend at all on the measure of poverty be<strong>in</strong>g used. A similar pattern emerges<br />
when we only look at urban households which, as mentioned above, tend to have<br />
a smaller fraction of remittance receiv<strong>in</strong>g households.<br />
Type of Household<br />
4.12 3.98<br />
(1.99) (2.16)<br />
2.02 1.71<br />
(1.27) (1.33)<br />
2.10 2.27<br />
(1.25) (1.43)<br />
7,998.68 5,149.69<br />
(10283.96) (3883.95)<br />
7,998.68 3,053.75<br />
(10283.96) (3344.89)<br />
0.39 0.40<br />
(0.67) (0.65)<br />
1.14 1.31<br />
(1.22) (1.25)<br />
2.77 2.63<br />
(1.32) (1.22)<br />
0.74 1.04<br />
(0.99) (0.97)<br />
1.97 1.29<br />
(1.35) (1.22)<br />
1.36 0.64<br />
(1.29) (0.93)<br />
0.59 0.17<br />
(0.95) (0.46)<br />
0.17 0.03<br />
(0.5) (0.19)
However, when we look at rural households, we do f<strong>in</strong>d a pattern. In this<br />
case it becomes clear that the share of non-poor households receiv<strong>in</strong>g remittances<br />
is larger than the share of poor remittance-receiv<strong>in</strong>g households. This is true<br />
regardless of which measure of poverty we use.<br />
How should we <strong>in</strong>terpret this pattern? The answer is not obvious. The real<br />
question is whether people from non-poor rural households have better access to<br />
the necessary f<strong>in</strong>ancial resources to migrate <strong>and</strong> to send remittances back home, or<br />
whether people who migrated was orig<strong>in</strong>ally from poor households <strong>and</strong> then,<br />
thanks to their higher earn<strong>in</strong>gs abroad <strong>and</strong> to the remittances they send, their<br />
families have been able to escape out of poverty. This question takes us back to the<br />
fundamental question of who migrates, the poor or the non poor? While we are not<br />
attempt<strong>in</strong>g to answer this question, our analysis of remittances <strong>and</strong> household<br />
<strong>in</strong>come may help to shed some light on this question.<br />
Table 3. Household Distribution by <strong>Poverty</strong> Condition <strong>and</strong> <strong>Remittances</strong>-Receiv<strong>in</strong>g Status<br />
<strong>Poverty</strong> Measure: Food-Based<br />
Total HH Rural Urban<br />
Non poor Poor Non poor Poor Non poor Poor<br />
HH Not Receiv<strong>in</strong>g <strong>Remittances</strong> 94.3 94.6 88.5 93.2 96.9 97.1<br />
HH Receiv<strong>in</strong>g <strong>Remittances</strong> 5.7 5.5 11.5 6.8 3.1 2.9<br />
<strong>Poverty</strong> Measure: Capabilities-Based<br />
Total HH Rural Urban<br />
Non poor Poor Non poor Poor Non poor Poor<br />
HH Not Receiv<strong>in</strong>g <strong>Remittances</strong> 94.5 93.8 88.5 92.1 97.0 96.7<br />
HH Receiv<strong>in</strong>g <strong>Remittances</strong> 5.5 6.2 11.5 7.9 3.1 3.3<br />
<strong>Poverty</strong> Measure: Assets-Based<br />
Total HH Rural Urban<br />
Non poor Poor Non poor Poor Non poor Poor<br />
HH Not Receiv<strong>in</strong>g <strong>Remittances</strong> 94.7 93.9 87.8 91.2 97.2 96.4<br />
HH Receiv<strong>in</strong>g <strong>Remittances</strong> 5.3 6.1 12.2 8.8 2.8 3.6
<strong>Remittances</strong> <strong>and</strong> household <strong>in</strong>come <strong>in</strong> <strong>Mexico</strong><br />
Figure 5 shows the distribution of Mexican remittance-receiv<strong>in</strong>g households<br />
accord<strong>in</strong>g to the <strong>in</strong>come deciles that are obta<strong>in</strong>ed us<strong>in</strong>g <strong>in</strong>formation of all Mexican<br />
households. We use two alternative <strong>in</strong>come <strong>in</strong>dicators for the remittance-receiv<strong>in</strong>g<br />
households: per capita total <strong>in</strong>come (<strong>in</strong>clud<strong>in</strong>g remittances) <strong>and</strong> per capita <strong>in</strong>come<br />
exclud<strong>in</strong>g remittances. The graph shows a remarkably different distribution<br />
depend<strong>in</strong>g on whether we <strong>in</strong>clude <strong>in</strong>come proceed<strong>in</strong>g from remittances or not.<br />
For example, if we exclude <strong>in</strong>come from remittances, more than 45 percent of all<br />
remittance-receiv<strong>in</strong>g households would lie <strong>in</strong> the bottom decile of the <strong>in</strong>come<br />
distribution. Once remittances are <strong>in</strong>cluded, only 12 percent of these households<br />
still belong to the lowest decile. Indeed, the <strong>in</strong>come distribution of remittance-<br />
receiv<strong>in</strong>g households after we <strong>in</strong>clude this source of <strong>in</strong>come is relatively uniform,<br />
with a slight concentration on the bottom three deciles of the <strong>in</strong>come distribution.<br />
This result should not come as a surprise. Indeed, the <strong>in</strong>come distribution of<br />
remittance-receiv<strong>in</strong>g households <strong>in</strong> <strong>Mexico</strong> is similar to those of other countries for<br />
which comparable <strong>in</strong>formation exists. For example, <strong>in</strong> the case of El Salvador, Cox-<br />
Edwards <strong>and</strong> Ureta (2003) have shown that around 30 percent of total remittance-
eceiv<strong>in</strong>g Salvadorean households would lie <strong>in</strong> the first decile of the local <strong>in</strong>come<br />
distribution if we do not <strong>in</strong>clude <strong>in</strong>come from remittances.<br />
It is important to mention that some of the preconceptions (<strong>and</strong><br />
misunderst<strong>and</strong><strong>in</strong>gs) about the impact of remittances on poverty depend precisely<br />
on an image similar to Figure 5. This figure seems to show, <strong>in</strong> an apparently<br />
unequivocal manner, that remittance-receiv<strong>in</strong>g households would be poor <strong>in</strong> the<br />
absence of the remittances. However, this graph should not be mis<strong>in</strong>terpreted. It<br />
does not mean by itself that most remittance-receiv<strong>in</strong>g households would be poor<br />
had not been for the remittances. We should note that the <strong>in</strong>come-generat<strong>in</strong>g<br />
capacity of this type of households is limited precisely because at least one of its<br />
economically active members is work<strong>in</strong>g abroad.<br />
In this context, the relevant question then is, how would the <strong>in</strong>come<br />
distribution of remittance-receiv<strong>in</strong>g households be if the contribut<strong>in</strong>g member of<br />
the households had not migrated? And here it lays the empirical problem, because<br />
we do not observe that situation. At a given po<strong>in</strong>t <strong>in</strong> time, we either observe a<br />
household without remittances or a household with remittances but without the<br />
local <strong>in</strong>come that could have been generated by the sender. This problem requires<br />
construct<strong>in</strong>g an appropriate counterfactual. 7 While we do not do that, we will be<br />
very careful <strong>in</strong> mak<strong>in</strong>g as appropriate comparisons as possible given the available<br />
<strong>in</strong>formation. F<strong>in</strong>ally, an element that we would like to emphasize from Figure 5 is<br />
that, even after tak<strong>in</strong>g <strong>in</strong>to account the amount of remittances, there is an<br />
important share of remittance-receiv<strong>in</strong>g households that belong to the first two<br />
deciles. This means that there are migrants even among the poorest households <strong>in</strong><br />
the country. Moreover, Figure 5 shows that the <strong>in</strong>come distribution of remittance-<br />
receiv<strong>in</strong>g households after <strong>in</strong>clud<strong>in</strong>g remittances is even more biased than the total<br />
<strong>in</strong>come distribution <strong>in</strong> <strong>Mexico</strong>. These means that most remittance-receiv<strong>in</strong>g<br />
households are poor despite of the remittances received.<br />
7 Adams (2004), for example, estimates a per capita household <strong>in</strong>come function to generate an<br />
appropriate counterfactual.
3. Methodology<br />
In this section we describe the methodology that we use <strong>in</strong> order to estimate the<br />
effect of remittances on poverty. The basic idea is to assume that receiv<strong>in</strong>g<br />
remittances is similar to a “treatment”, so that we may estimate an average<br />
treatment effect on the probability of be<strong>in</strong>g <strong>in</strong> poverty. In this way, we want to<br />
compare the probability of be<strong>in</strong>g <strong>in</strong> poverty for remittance-receiv<strong>in</strong>g households<br />
versus that for not remittance receiv<strong>in</strong>g households. The difference will then be<br />
attributed to the existence of remittances. The critical assumption that we are<br />
mak<strong>in</strong>g <strong>in</strong> us<strong>in</strong>g this methodology is that the decision to be treated (i.e. receiv<strong>in</strong>g<br />
remittances), although not r<strong>and</strong>om, ultimately depends upon observable variables.<br />
Notice that this assumption is less strict than assum<strong>in</strong>g than migration depends on<br />
observables. While this may not be true, it could still be the case that receiv<strong>in</strong>g<br />
remittances could still depend on observables.<br />
Estimation of average treatment effects based on the propensity score 8<br />
The estimation of an average treatment effect <strong>in</strong> observational studies can<br />
produced biased results when we use a non experimental estimator. The typical<br />
problem <strong>in</strong> this type of studies is that the assignment of subjects to the treatment<br />
<strong>and</strong> control groups is not r<strong>and</strong>om <strong>and</strong> therefore the estimation of the average<br />
treatment effect is usually biased as a result of the existence of confound<strong>in</strong>g factors.<br />
For that reason, the match<strong>in</strong>g between treated <strong>and</strong> control subjects becomes<br />
difficult when there is an n-dimensional vector of characteristics.<br />
One way to address this problem is by us<strong>in</strong>g the propensity score match<strong>in</strong>g<br />
method which summarizes the pre-treatment characteristics of each subject <strong>in</strong>to a<br />
s<strong>in</strong>gle <strong>in</strong>dex variable, the propensity score, which is then used to generate the<br />
match<strong>in</strong>g. The basic idea beh<strong>in</strong>d the propensity score is that we may reduce the<br />
8 For more details on the methodology se the papers by Dehejia <strong>and</strong> Wahba (1999, 2002) <strong>and</strong><br />
Rosenbaum <strong>and</strong> Rub<strong>in</strong> (1983, 1985).
ias if we compare outcomes of treated <strong>and</strong> control groups which are as similar as<br />
possible.<br />
The propensity score is the probability of assignment to treatment<br />
conditional on pre -treatment variables:<br />
where:<br />
p ( X ) ? Pr[ D ? 1 X ] ? E[<br />
D X ]<br />
( ) ( ( i )) X h F X p ?<br />
F (.) can be the normal or the logistic cumulative distribution.<br />
D ? 1 if the subject was treated <strong>and</strong> 0 otherwise<br />
X is a vector of pre-treatment characteristics.<br />
Rosenbaum <strong>and</strong> Rub<strong>in</strong> (1983) established the follow<strong>in</strong>g conditions <strong>in</strong> order to be<br />
able to estimate the Average Treatment on the Treated (ATT) effect based on the<br />
propensity score:<br />
Condition 1: The Balanc<strong>in</strong>g Hypothesis:<br />
D ?<br />
X | p(<br />
X )<br />
This means that for observations with the same propensity score, the distribution<br />
of pre-treatment characteristics must be the same across control <strong>and</strong> treated<br />
groups. That is, conditional on the propensity score, each <strong>in</strong>dividual has the same<br />
probability of assignment to treatment, as <strong>in</strong> a r<strong>and</strong>omized experiment.<br />
Condition 2: Unconfoundedness given the propensity score.<br />
Y 1 , Y0<br />
? D | X ? Y 1,<br />
Y0<br />
? D | p(<br />
X )<br />
If assignment to treatment is unconfounded conditional on the variables pre-<br />
treatment, then assignment to treatment is unconfounded given the propensity<br />
score.
Once the propensity score has been computed the Average Treatment on the<br />
Treated (ATT) effect (?) can be estimated as follows:<br />
where:<br />
?<br />
?<br />
?<br />
? Y ? Y | D ? 1?<br />
? E 1 i 0i<br />
i<br />
? E 1i<br />
0i<br />
i<br />
? E?<br />
Y ? Y | D ? 1,<br />
p(<br />
X ) ?<br />
? E?<br />
Y D ? 1,<br />
p(<br />
X ) ? ? E?<br />
Y | D ? 0,<br />
p(<br />
X ) ? | D ? 1?<br />
? E 1 i | i<br />
i<br />
0i<br />
i<br />
i i<br />
Y is the potential outcome if the <strong>in</strong>dividual is treated.<br />
1 i<br />
Y0i is the potential outcome if the <strong>in</strong>dividual is not treated.<br />
However, calculat<strong>in</strong>g this effect is not immediately obvious s<strong>in</strong>ce the<br />
propensity score is a cont<strong>in</strong>uous variable. To overcome this problem four different<br />
methods have been proposed <strong>in</strong> the literature: Nearest Neighbor Match<strong>in</strong>g, Radius<br />
Match<strong>in</strong>g, Kernel Match<strong>in</strong>g <strong>and</strong> Stratification Match<strong>in</strong>g (Becker <strong>and</strong> Ich<strong>in</strong>o, 2002).<br />
Nearest Neighbor <strong>and</strong> Radius match<strong>in</strong>g<br />
The first method consists of match<strong>in</strong>g each treated <strong>in</strong>dividual with the control<br />
<strong>in</strong>dividual that has the closest propensity score. This method is usually applied<br />
with replacement <strong>in</strong> the control units. The second step is to compute the difference<br />
of each pair of matched units, <strong>and</strong> f<strong>in</strong>ally the ATT is obta<strong>in</strong>ed as the average of all<br />
these differences. It should be noticed that with this method each treated unit f<strong>in</strong>ds<br />
a match, but this is not necessarily the best match s<strong>in</strong>ce it only needs to be the<br />
closest to the treated <strong>and</strong> this difference is taken <strong>in</strong>to account when comput<strong>in</strong>g the<br />
ATT effect.<br />
A solution to this problem is to def<strong>in</strong>e a neighborhood with<strong>in</strong> which a<br />
control unit can be considered a match; this method is called the Radius Match<strong>in</strong>g.<br />
The election of the radius should be careful s<strong>in</strong>ce a very small radius can discard<br />
treated observations, but the quality of the matches is better. The ATT effect <strong>in</strong><br />
both the nearest neighbor <strong>and</strong> the radius match<strong>in</strong>g methods is computed <strong>in</strong> the<br />
follow<strong>in</strong>g way:
where:<br />
w<br />
w<br />
ij<br />
C<br />
i<br />
?<br />
NN , M<br />
?<br />
1<br />
?<br />
T<br />
? ? Yi<br />
? ?<br />
T<br />
ij<br />
N i? T<br />
j?<br />
C(<br />
i)<br />
?<br />
w Y<br />
C<br />
j<br />
?<br />
?<br />
?<br />
1 ? T<br />
? ? ? Yi<br />
? ? ? wijY<br />
T<br />
N ? i?<br />
T i? T j?<br />
C(<br />
i)<br />
?<br />
1<br />
N<br />
?<br />
T<br />
i?<br />
T<br />
Y<br />
T<br />
i<br />
?<br />
1<br />
N<br />
?<br />
T<br />
j?<br />
C<br />
w Y<br />
j<br />
C<br />
j<br />
C<br />
j<br />
?<br />
?<br />
?<br />
1<br />
? if j ? C(i)<br />
<strong>and</strong> w ij ? 0 otherwise.<br />
N<br />
?<br />
j ? w i ij<br />
<strong>and</strong><br />
C ( i)<br />
? m<strong>in</strong> p ? p for the nearest neighbor match<strong>in</strong>g method.<br />
j<br />
i<br />
? p j pi<br />
? p ? r?<br />
j<br />
C( i)<br />
?<br />
j for the radius match<strong>in</strong>g method.<br />
N C es el número de observaciones de control y<br />
N T es el número de observaciones tratadas.<br />
Kernel Match<strong>in</strong>g<br />
In this method all treated subjects are matched with a weighted average of all<br />
controls us<strong>in</strong>g weights that are <strong>in</strong>versely proportional to the distance between the<br />
propensity scores of treated <strong>and</strong> controls. The ATT is computed as follows:<br />
?<br />
K<br />
? j<br />
?<br />
C p j ? pi<br />
1<br />
?<br />
?<br />
? Y<br />
? C j G(<br />
)<br />
T<br />
hn<br />
?<br />
? ? ? Y ?<br />
T i<br />
p ? p ?<br />
k i<br />
N i?<br />
T<br />
G(<br />
)<br />
?<br />
k?<br />
C hn<br />
?<br />
where G (? ) is a Kernel function <strong>and</strong> h is a b<strong>and</strong>with parameter.<br />
n<br />
Stratification Match<strong>in</strong>g<br />
This method consists of divid<strong>in</strong>g the range of variation of the propensity score <strong>in</strong><br />
<strong>in</strong>tervals such that, with<strong>in</strong> each <strong>in</strong>terval, treated <strong>and</strong> control units have on average
the same propensity score. It is recommended to use the same blocks with<strong>in</strong> which<br />
the balanc<strong>in</strong>g property is tested. With<strong>in</strong> each <strong>in</strong>terval the difference between the<br />
average outcomes of the treated <strong>and</strong> the control observations is computed as<br />
follows:<br />
where:<br />
?<br />
s<br />
q<br />
?<br />
T<br />
? i?<br />
I ( q ) Y i ? j?<br />
I ( q )<br />
? T<br />
C<br />
N q N q<br />
I (q)<br />
is the set of units <strong>in</strong> block q<br />
N , are the numbers of treated an control units <strong>in</strong> block q. The total<br />
T T<br />
q q N<br />
number of blocks is Q.<br />
F<strong>in</strong>ally, the ATT is obta<strong>in</strong>ed as an average of the ATT of each block with the weight<br />
of each block given by the correspond<strong>in</strong>g fraction of treated units.<br />
?<br />
s<br />
?<br />
Q<br />
?<br />
q?<br />
1<br />
?<br />
s<br />
q<br />
? i<br />
?<br />
? I(<br />
q)<br />
? i<br />
D<br />
D<br />
i<br />
i<br />
For the empirical implementation we use the Stata programs developed by Becker<br />
<strong>and</strong> Ich<strong>in</strong>o (2002).<br />
4. <strong>Remittances</strong> <strong>and</strong> <strong>Poverty</strong> Levels <strong>in</strong> <strong>Mexico</strong>: Empirical Evidence.<br />
In this section we apply the methodology just described to identify the role of<br />
remittances on the probability of Mexican households of be<strong>in</strong>g <strong>in</strong> poverty situation<br />
<strong>in</strong> 2002. We apply the four estimators described <strong>in</strong> the previous section.<br />
Y<br />
The first step <strong>in</strong> the empirical exercise is the estimation of the propensity<br />
score, that is, the estimation of the propensity to be treated, where the treatment is<br />
receiv<strong>in</strong>g remittances. Therefore, the dependent variable is 1 if the household<br />
receives <strong>in</strong>ternational remittances <strong>and</strong> 0 otherwise. We proceed with three<br />
alternative specifications. The first specification uses as explanatory variables the<br />
follow<strong>in</strong>g variables of the household head: age (l<strong>in</strong>ear <strong>and</strong> squared), gender (1 if<br />
female), marital status (1 if married), education level (l<strong>in</strong>ear <strong>and</strong> squared). It also<br />
C<br />
i
<strong>in</strong>cludes as explanatory variables the follow<strong>in</strong>g: a rural dummy, the household<br />
size, number of women <strong>in</strong> the household, number of rooms, a dummy for the<br />
presence of children <strong>in</strong> the house <strong>in</strong>teracted with the marital status of the<br />
household head, a bathroom dummy <strong>and</strong> other <strong>in</strong>teraction variables. 9<br />
The first column <strong>in</strong> Table 4 shows that all explanatory variables have<br />
statistically significant coefficients at the 5% level. Most variables have the<br />
expected signs: households that have a married female as a household head, that<br />
are located <strong>in</strong> rural zones, <strong>and</strong> where there are children, are more likely to receive<br />
remittances than other types of households.<br />
With the results described <strong>in</strong> the first column <strong>in</strong> Table 5 we have computed<br />
the propensity score. As mentioned before, this represents the estimated<br />
propensity of a household to receive treatment (i.e. to receive remittances from<br />
abroad). The next step is then to compute the Average Treatment Effect on the<br />
Treated (ATT). In order to make the work<strong>in</strong>g sample even more comparable, we<br />
restrict ourselves to units with probabilities that lie with<strong>in</strong> the region known as the<br />
common support, that is, the area where there are enough of both, control <strong>and</strong><br />
treatment observations, to proceed with the comparisons. 10 This also means that<br />
we exclude treatment or control observations that do not have comparable values<br />
<strong>in</strong> the other group.<br />
The first three columns <strong>in</strong> Table 5 show the results of the estimation of the<br />
ATT effect for the three different measures of poverty mentioned above <strong>and</strong> for the<br />
four alternative methodologies described <strong>in</strong> the previous section. Note that <strong>in</strong><br />
some cases we have two types of st<strong>and</strong>ard errors: analytical <strong>and</strong> bootstrapped.<br />
Statistically significant coefficients are bolded.<br />
Results <strong>in</strong> this table show that the effect of remittances on poverty is always<br />
negative, although not always statistically significant. Moreover, the results <strong>in</strong> this<br />
table are, <strong>in</strong> qualitative terms, quite consistent across the alternatives methods of<br />
9 All the specifications reported satisfy the balanc<strong>in</strong>g condition described <strong>in</strong> the previous section.<br />
10 The importance of proceed<strong>in</strong>g <strong>in</strong> this fashion has been recently emphasized by Dehejia (2005).
estimat<strong>in</strong>g the Average Treatment on the Treated (ATT) effect. In particular, the<br />
ATT effect for both, the food-based <strong>and</strong> the capabilities-based poverty measures,<br />
are statistically significant under the four alternative methodologies of estimat<strong>in</strong>g<br />
it. In the first case, the effect ranges between 3.9 <strong>and</strong> 6.6 percentage po<strong>in</strong>ts, whereas<br />
<strong>in</strong> the second case, it fluctuates between 3.1 <strong>and</strong> 5.8 percentage po<strong>in</strong>ts. On the<br />
other h<strong>and</strong>, <strong>in</strong> the case of the assets-based poverty none of the estimates is<br />
statistically significant. Although these results are already quite strong <strong>and</strong><br />
conclusive from a qualitative perspective, they still are relatively imprecise s<strong>in</strong>ce<br />
the estimates fluctuate with<strong>in</strong> an <strong>in</strong>terval close to two percentage po<strong>in</strong>ts.<br />
In search of more precise estimates of the ATT effect, we estimated a second<br />
<strong>Propensity</strong> <strong>Score</strong> with an alternative specification. In this case, we have added<br />
<strong>in</strong>formation on the states with high-migration rates. This variable enters as a<br />
dummy variable tak<strong>in</strong>g the value of 1 for the 14 Mexican states where at least 6<br />
percent of local households received remittances <strong>in</strong> 2002 (see Appendix for a list of<br />
these high-migration states), <strong>and</strong> 0 otherwise. These 14 states <strong>in</strong>clude 77 percent of<br />
all remittance receiv<strong>in</strong>g households <strong>in</strong> <strong>Mexico</strong> <strong>in</strong> 2002 (see Appendix). The variable<br />
enters <strong>in</strong>to the empirical analysis both alone <strong>and</strong> <strong>in</strong>teracted with the rural dummy.<br />
Results <strong>in</strong> the second column of Table 4 show that the coefficients on the<br />
two added variables were highly significant. The marital status variables were non<br />
significant <strong>and</strong> they were then dropped out of the regression. All the rema<strong>in</strong><strong>in</strong>g<br />
variables have coefficients that are statistically significant at the 5% level.<br />
Interest<strong>in</strong>gly, the pseudo R-squared <strong>in</strong>creased from 0.11 to 0.17 suggest<strong>in</strong>g a better<br />
fit for this specification.<br />
With the new propensity score, we proceeded to estimate a second set of<br />
ATT effects. These estimates are reported <strong>in</strong> Table 5 under the title “second<br />
specification”. The new ATT effects are very similar to the first ones. As before, all<br />
of the coefficients associated to the food-based <strong>and</strong> the capabilities-based measures<br />
of poverty were negative <strong>and</strong> significant (with just one exception), <strong>and</strong> none of the<br />
coefficients associated to the assets-based measure of poverty were significant.
This time however, the po<strong>in</strong>t estimates of the ATT effects were even less precise<br />
across methods (between 3.3 <strong>and</strong> 6.5 percentage po<strong>in</strong>ts <strong>in</strong> one case <strong>and</strong> between 2.5<br />
<strong>and</strong> 5.9 percentage po<strong>in</strong>ts <strong>in</strong> the other). Despite that result, the fact that the high-<br />
migration states variables were quite significant <strong>in</strong> the estimation of the propensity<br />
score, led us to estimate another variant of this specification.<br />
In order to improve the quality of our matches, we then estimated aga<strong>in</strong> the<br />
propensity score by focus<strong>in</strong>g only on those households belong<strong>in</strong>g to the 14 states<br />
with high-migration rates. This avoids the problem of compar<strong>in</strong>g remittance-<br />
receiv<strong>in</strong>g households with relatively similar non-remittance receiv<strong>in</strong>g households<br />
but that are located <strong>in</strong> states where there is no tradition of migrat<strong>in</strong>g to the USA.<br />
By restrict<strong>in</strong>g our sample <strong>in</strong> this way, we expect to compare more homogeneous<br />
households <strong>and</strong> therefore we expect to get better estimates of both the propensity<br />
score <strong>and</strong> the ATT effect.<br />
The last columns <strong>in</strong> Table 4 present the results of our estimated propensity<br />
score when we restrict our data to the high-migration states. All coefficients are<br />
aga<strong>in</strong> statistically significant <strong>and</strong> many coefficients become larger such as those<br />
associated to the gender of the household head, the rural dummy, the marital<br />
status variable <strong>and</strong> the presence of children <strong>in</strong> the household.<br />
With the new propensity score we estimated aga<strong>in</strong> the ATT effects<br />
associated to the last specification. The results that we obta<strong>in</strong>ed are displayed <strong>in</strong><br />
the last columns of Table 5. Our estimates look remarkably stable across<br />
methodologies. In particular, the effect of remittances on the probability of be<strong>in</strong>g <strong>in</strong><br />
food-based poverty ranges only between 7.4 <strong>and</strong> 8 percentage po<strong>in</strong>ts, where as the<br />
effect for the capabilities-based poverty fluctuates only between 5.5 <strong>and</strong> 7<br />
percentage po<strong>in</strong>ts. Moreover, for each methodology the po<strong>in</strong>t estimates for the<br />
effect of remittances on poverty show an <strong>in</strong>terest<strong>in</strong>g pattern: the estimated<br />
coefficients decl<strong>in</strong>e monotonically as we move from extreme poverty to moderate<br />
poverty. This result makes sense, s<strong>in</strong>ce it seems more plausible that the extra<br />
<strong>in</strong>come from <strong>in</strong>ternational remittances helps people to get out of extreme poverty
(although they may still be <strong>in</strong> moderate poverty), but it may not be enough as to<br />
help people to leave a moderate poverty condition.<br />
The results obta<strong>in</strong>ed with this specification are the more precise <strong>and</strong> robust<br />
<strong>and</strong> therefore they are our preferred set of estimates. By simply averag<strong>in</strong>g across<br />
different methodologies, we may conclude that the presence of remittances <strong>in</strong> a<br />
household reduce its probability of be<strong>in</strong>g <strong>in</strong> food -based <strong>and</strong> <strong>in</strong> capabilities-based<br />
poverty <strong>in</strong> 7.7 <strong>and</strong> 6.3 percentage po<strong>in</strong>ts, respectively. Given the observed poverty<br />
rates at the household level us<strong>in</strong>g nationally representative data (15.8% <strong>and</strong> 21.1%,<br />
respectively), this effect, depend<strong>in</strong>g on who actually migrates <strong>and</strong> sends<br />
remittances back home, could be equivalent to a reduction of around 50 <strong>and</strong> 30%<br />
<strong>in</strong> the correspond<strong>in</strong>g poverty rates for remittance receiv<strong>in</strong>g households vis á vis<br />
non-remittance receiv<strong>in</strong>g households. Of course, the estimated reduction <strong>in</strong><br />
poverty rates for remittance receiv<strong>in</strong>g households would be lower (higher) if these<br />
households disproportionately belong to the lower (upper) part of the <strong>in</strong>come<br />
distribution. This issue, however, is still unresolved <strong>and</strong> goes beyond the scope of<br />
this paper.<br />
F<strong>in</strong>ally, it is worth not<strong>in</strong>g that receiv<strong>in</strong>g remittances does not seem to affect<br />
a household’s probability of be<strong>in</strong>g <strong>in</strong> a situation of assets-based poverty. In that<br />
sense, we may conclude that remittances contribute to the reduction <strong>in</strong> the level<br />
<strong>and</strong> depth of poverty, but only up to a certa<strong>in</strong> po<strong>in</strong>t.
Table 4. Probit Estimates<br />
Dependent Variable: Households Receiv<strong>in</strong>g <strong>Remittances</strong> Dummy<br />
dF/dx Std. Err. dF/dx Std. Err. dF/dx Std. Err.<br />
age 0.008 0.001 0.006 0.001 0.016 0.003<br />
age squared 0.000 0.000 0.000 0.000 0.000 0.000<br />
gender 0.082 0.010 0.063 0.008 0.160 0.026<br />
marital status 0.016 0.004 0.030 0.010<br />
rural 0.047 0.004 0.025 0.005 0.089 0.008<br />
edu 0.033 0.007 0.028 0.006 0.071 0.015<br />
edu squared -0.001 0.000 -0.001 0.000 -0.002 0.001<br />
Household size -0.006 0.001 -0.003 0.001 -0.010 0.003<br />
numer of women 0.007 0.002 0.006 0.001 0.012 0.004<br />
edu*age -0.001 0.000 -0.001 0.000 -0.002 0.001<br />
age*gender -0.001 0.000 -0.001 0.000 -0.002 0.000<br />
edu*age squared 8.020 0.000 6.180 0.000 0.000 0.000<br />
marital*children 0.001 0.000 0.007 0.003<br />
bath_type 0.012 0.003 0.011 0.003 0.033 0.007<br />
rooms 0.007 0.001 0.005 0.001 0.014 0.002<br />
high-migration states 0.042 0.004<br />
high-mig states * rural 0.017 0.007<br />
Pseudo R2 0.1122 0.1719 0.1206<br />
Note: Bolded coefficients are statistically significant at the 5% level or less.<br />
Complete Sample<br />
Subsample<br />
(1) (2) (3)
Table 5. Average Treatment Effect under Alternative Specifications <strong>and</strong> Measures of <strong>Poverty</strong><br />
Complete Sample. First Specifitación Complete Sample. Second Specifitación Subsample<br />
Measure of <strong>Poverty</strong><br />
Method Food Based Capabilities Assets Based Food Based Capabilities Assets Based Food Based Capabilities Assets Based<br />
Nearest Neighbor -0.066 -0.057 -0.016 -0.050 -0.048 -0.020 -0.080 -0.055 0.000<br />
N. Treated 755 755 755 755 755 755 588 588 588<br />
N. Control 746 746 746 717 717 717 515 515 515<br />
St<strong>and</strong>ar Error 0.02 0.02 0.027 0.02 0.02 0.027 0.03 0.03 0.032<br />
t -3.23 -2.49 -0.61 -2.49 -2.09 -0.75 -3.21 -2.02 -0.009<br />
St. Error. Bootstrap 0.02 0.03 0.029 0.02 0.02 0.03 0.03 0.03 0.028<br />
t -2.73 -2.08 -0.57 -2.22 -2.08 -0.71 -2.82 -1.81 -0.01<br />
Radius -0.039 -0.031 -0.008 -0.033 -0.025 -0.002 -0.079 -0.070 -0.041<br />
N. Treated 753 753 753 754 754 754 583 583 583<br />
N. Control 15033 15033 15033 14565 14565 14565 5692 5692 5692<br />
St<strong>and</strong>ar Error 0.01 0.02 0.019 0.01 0.02 0.019 0.02 0.02 0.022<br />
t -2.95 -2.05 -0.44 -2.50 -1.62 -0.10 -5.02 -3.86 -1.859<br />
St. Error. Bootstrap 0.01 0.02 0.017 0.01 0.02 0.02 0.02 0.02 0.026<br />
t -2.73 -1.86 -0.5 -2.83 -1.60 -0.10 -5.19 -3.39 -1.54<br />
Kernel -0.049 -0.042 -0.014 -0.053 -0.046 -0.016 -0.074 -0.063 -0.025<br />
N. Treated 755 755 755 755 755 755 588 588 588<br />
N. Control 15040 15040 15040 14565 14565 14565 5693 5693 5693<br />
St. Error. Bootstrap 0.01 0.02 0.02 0.01 0.01 0.02 0.01 0.02 0.023<br />
t -4.06 -2.64 -0.842 -3.80 -3.42 -1.03 -5.34 -3.56 -1.065<br />
Stratification -0.064 -0.058 -0.029 -0.065 -0.059 -0.031 -0.077 -0.064 -0.022<br />
N. Treated 754 754 754 755 755 755 588 588 588<br />
N. Control 51041 51041 51041 14565 14565 14565 5693 5693 5693<br />
St<strong>and</strong>ar Error 0.01 0.02 0.019 0.01 0.02 0.017 0.02 0.02 0.023<br />
t -4.65 -3.68 -1.52 -5.43 -3.67 -1.89 -4.60 -3.37 -0.979<br />
St. Error. Bootstrap 0.015 0.02 0.02 - - - 0.016 0.02 0.021<br />
t -4.34 -3.5 -1.77 - - - -4.708 -3.921 -1.043<br />
Note: Bolded coefficients are statistically significant at the 5 percent level.<br />
Measure of <strong>Poverty</strong> Measure of <strong>Poverty</strong>
5. Conclusions<br />
In this paper we have analyzed the role of <strong>in</strong>ternational remittances on poverty <strong>in</strong><br />
<strong>Mexico</strong>. S<strong>in</strong>ce we cannot observe a Mexican household before <strong>and</strong> after receiv<strong>in</strong>g<br />
remittances, we are then unable to identify the effect of remittances on poverty<br />
us<strong>in</strong>g a st<strong>and</strong>ard methodology. We then follow a propensity score match<strong>in</strong>g<br />
approach that allow us to compare remittance-receiv<strong>in</strong>g households with<br />
households that do not receive remittances but that have observable characteristics<br />
that are similar to those who do.<br />
We then look at the effect of receiv<strong>in</strong>g remittances on the probability of<br />
be<strong>in</strong>g <strong>in</strong> a poverty situation us<strong>in</strong>g three alternative, officially-def<strong>in</strong>ed, measures of<br />
poverty (food-based, capabilities-based <strong>and</strong> assets-based). Our empirical results<br />
show that receiv<strong>in</strong>g remittances from abroad reduces the probability of be<strong>in</strong>g <strong>in</strong><br />
food-based <strong>and</strong> capabilities-based poverty <strong>in</strong> 8 <strong>and</strong> 6 percentage po<strong>in</strong>ts,<br />
respectively. Given the observed poverty rates at the household level us<strong>in</strong>g<br />
nationally representative data (15.8% <strong>and</strong> 21.1%, respectively), this effect,<br />
depend<strong>in</strong>g on who actually migrates, could be equivalent to a reduction of around<br />
50 <strong>and</strong> 30% <strong>in</strong> the correspond<strong>in</strong>g poverty rates for remittance receiv<strong>in</strong>g households<br />
vis á vis non remittance receiv<strong>in</strong>g households. However, receiv<strong>in</strong>g remittances does<br />
not seem to affect a household’s probability of be<strong>in</strong>g <strong>in</strong> assets-based poverty. In<br />
that sense, we may conclude that remittances contribute to the reduction <strong>in</strong> the<br />
level <strong>and</strong> depth of poverty, but only up to a certa<strong>in</strong> po<strong>in</strong>t.
References<br />
Adams, Jr., Richard (1991), “The Effects of International <strong>Remittances</strong> on <strong>Poverty</strong>,<br />
Inequality <strong>and</strong> Development <strong>in</strong> Rural Egypt”, Research report 86, IFPRI.<br />
Adams, Jr., Richard (2004), “<strong>Remittances</strong> <strong>and</strong> <strong>Poverty</strong> <strong>in</strong> Guatemala”, World Bank<br />
Policy Research Work<strong>in</strong>g Paper 3418, September.<br />
Adams, Jr., Richard H. <strong>and</strong> John Page (2003); “International Migration,<br />
<strong>Remittances</strong> <strong>and</strong> <strong>Poverty</strong> <strong>in</strong> Develop<strong>in</strong>g Countries”, World Bank Policy<br />
Research Work<strong>in</strong>g Paper 3179, December.<br />
Banco de México (2004). Remesas Familiares por Componentes. Cuadros Analíticos,<br />
Información Económica y F<strong>in</strong>anciera. www.banxico.org.mx<br />
Becker, S. <strong>and</strong> A. Ich<strong>in</strong>o (2002). “Estimation of Average Treatment Effects Based on<br />
<strong>Propensity</strong> <strong>Score</strong>s” The Stata Journal, 2(4):358-377.<br />
Cox-Edwards, Alej<strong>and</strong>ra y Manuelita Ureta (2003); “International Migration,<br />
<strong>Remittances</strong>, <strong>and</strong> School<strong>in</strong>g: Evidence from El Salvador,” Journal of<br />
Development Economics, 72, 2, December 2003: 429-62.<br />
Dehejia, Rajeev <strong>and</strong> Sadek Wahba (1999). “Causal Effects <strong>in</strong> Nonexperimental<br />
Studies: Reevaluat<strong>in</strong>g the Evaluation of Tra<strong>in</strong><strong>in</strong>g Programs,” Journal of the<br />
American Statistical Association, 94, 1053-1062.<br />
Dehejia, Rajeev <strong>and</strong> Sadek Wahba (2002). “<strong>Propensity</strong> <strong>Score</strong> Match<strong>in</strong>g Methods for<br />
Nonexperimental Causal Studies,” Review of Economics <strong>and</strong> Statistics. Volume<br />
84, Number 1 (February 2002), pp. 151-161.<br />
Dehejia , Rajeev (2005) “Practical <strong>Propensity</strong> <strong>Score</strong> Match<strong>in</strong>g: A reply to Smith <strong>and</strong><br />
Todd”, Journal of Econometrics, Vol. 125, pp. 355-364.<br />
Kapur, Devesh (2004); “<strong>Remittances</strong>: The New Development Mantra?”, G-24<br />
Discussion Paper no. 29, August.<br />
López-Cordova, Ernesto (2005); “Globalization, Migration <strong>and</strong> Development. The<br />
Role of Mexican Migrant <strong>Remittances</strong>”, forthcom<strong>in</strong>g, Economía..<br />
López-Cordova, Ernesto <strong>and</strong> Alex<strong>and</strong>ra Olmedo (2006); “International <strong>Remittances</strong><br />
<strong>and</strong> Development: Exist<strong>in</strong>g Evidence, Policies <strong>and</strong> Recommendations”,<br />
miemo, IADB.
Ratha, Dilip (2003); “Worker´s <strong>Remittances</strong>: An Important <strong>and</strong> Stable Source of<br />
External Development F<strong>in</strong>ance”, <strong>in</strong> Global Development F<strong>in</strong>ance 2003, World<br />
Bank, Wash<strong>in</strong>gton, DC.<br />
Rosenbaum, Paul <strong>and</strong> Don Rub<strong>in</strong> (1983). “The Central Role of the <strong>Propensity</strong> <strong>Score</strong><br />
<strong>in</strong> Observational Studies for Causal Effects,” Biometrika, 70, 41 -55.<br />
Rosenbaum, Paul <strong>and</strong> Don Rub<strong>in</strong> (1985). “Construct<strong>in</strong>g a Control Group Us<strong>in</strong>g<br />
Multivariate Matched Sampl<strong>in</strong>g Methods that Incorporate the <strong>Propensity</strong>,”<br />
American Statistician, 39, 33-38.<br />
SEDESOL (2003), Medición del Desarrollo. México 2000-2002, mimeo.<br />
(http://www.sedesol.gob.mx/subsecretarias/prospectiva/medicion_pobre<br />
za/mediciondesarrollo2002.pdf).<br />
Taylor, Edward J., Jorge Mora <strong>and</strong> Richard Adams (2005), “<strong>Remittances</strong>, Inequality<br />
<strong>and</strong> <strong>Poverty</strong>: Evidence from Rural <strong>Mexico</strong>”, mimeo, UC Davis.
2<br />
3<br />
26<br />
Appendix<br />
Figure A1. Mexican States<br />
1 Aguascalientes<br />
2 Baja California<br />
3 Baja California Sur<br />
4 Campeche<br />
5 Chiapas<br />
6 Chihuahua<br />
7 Coahuila de Zaragoza<br />
8 Colima<br />
9 Distrito Federal<br />
10 Durango<br />
11 Guanajuato<br />
12 Guerrero<br />
13 Hidalgo<br />
14 Jalisco<br />
15 México<br />
16 Michoacán<br />
25<br />
6<br />
10<br />
18<br />
14<br />
8<br />
32<br />
1<br />
7<br />
16<br />
11<br />
24<br />
19<br />
22<br />
13<br />
15<br />
9<br />
17<br />
12<br />
28<br />
29<br />
21<br />
20<br />
30<br />
27<br />
17 Morelos<br />
18 Nayarit<br />
19 Nuevo León<br />
20 Oaxaca<br />
21 Puebla<br />
22 Querétaro<br />
23 Qu<strong>in</strong>tana Roo<br />
24 San Luis Potosí<br />
25 S<strong>in</strong>aloa<br />
26 Sonora<br />
27 Tabasco<br />
28 Tamaulipas<br />
29 Tlaxcala<br />
30 Veracruz<br />
31 Yucatán<br />
32 Zacatecas<br />
5<br />
4<br />
31<br />
23
Table A1. High-migration States<br />
Subsample: States with a relatively large fraction of households receiv<strong>in</strong>g remittances<br />
Percentage of total<br />
households <strong>in</strong> the state<br />
Percentage of Total Households-<br />
Receiv<strong>in</strong>g <strong>Remittances</strong><br />
Michoacan 18.4 11.2<br />
Zacatecas 16.8 7.1<br />
Durango 15.7 8.9<br />
Guanajuato 13.8 8.4<br />
San Luis Potosí 11.7 5.8<br />
Jalisco 11.5 6.1<br />
Aguascalientes 11.1 5.0<br />
Nayarit 8.5 4.1<br />
Guerrero 8.2 4.4<br />
S<strong>in</strong>aloa 8.1 3.4<br />
Colima 8.0 2.7<br />
Morelos 7.9 2.3<br />
Oaxaca 7.2 4.8<br />
Hidalgo 6.1 3.2<br />
Weighted Average 11.4<br />
Subtotal 77.3