Urban Poverty and Social Safety Net in Indonesia - Global ...
Urban Poverty and Social Safety Net in Indonesia - Global ...
Urban Poverty and Social Safety Net in Indonesia - Global ...

You also want an ePaper? Increase the reach of your titles
YUMPU automatically turns print PDFs into web optimized ePapers that Google loves.
Average Per Capita GDP (<strong>in</strong> 1999 PPP$)*- <strong>Indonesia</strong>- East Asia & Pacific- South AsiaInfant Mortality (per 1,000 live births)- <strong>Indonesia</strong>- East Asia & Pacific- South Asia- Low & Middle Income CountriesLife Expectancy at Birth (years)- <strong>Indonesia</strong>- East Asia & Pacific- South Asia- Low & Middle Income CountriesPrimary Gross Enrolment Ratio (%)**- <strong>Indonesia</strong>- East Asia & Pacific- South Asia- Low & Middle Income CountriesSecondary Gross Enrolment Ratio (%)**- <strong>Indonesia</strong>- East Asia & Pacific- South Asia- Low & Middle Income CountriesAdult Illiteracy (% of people aged 15 <strong>and</strong> above)***- <strong>Indonesia</strong>- East Asia & Pacific- South Asia- Low & Middle Income CountriesNotes: * Figures are three-year averages, centered on the year shown.** The most recent data perta<strong>in</strong> to 1997, <strong>in</strong>stead of 1999.*** M=male, F=femaleSource: Balisacan et al. (2002).19709408751,05119809055119865565546010711177962944272213(M), 27(F)13(M), 29(F)41(M), 66(F)22(M),39(F)20002,8824,4132,21619994235745966696364113119100107566949599(M),19(F)8(M),22(F)34(M),58(F)18(M),32(F)Table 2 Inequality <strong>in</strong> Income Distribution <strong>in</strong> Selected Countries/Group of Countries: 1970s to mid-1990sCountry/Group of CountryG<strong>in</strong>i Coefficient (average per year)Newly Industrialized Countries (NICs)-Hong Kong-South Korea-Taiwan-S<strong>in</strong>gapore1970s 1980s 1990s0.410.330.280.410.370.390.280.410.450.340.310.39Ch<strong>in</strong>ana0.320.38ASEAN-<strong>Indonesia</strong>-Malaysia-Thail<strong>and</strong>-Philipp<strong>in</strong>es0.330.500.430.490.330.510.430.460.340.480.520.45South Asia-India-Bangladesh-Pakistan-Sri Lanka0.300.360.300.380.310.390.320.420.300.280.310.30
OECDTransition counties (East Europe)Middle East & North AfricaAfrican Sub-SaharaLat<strong>in</strong> America & Caribbeannanananana0.330.250.410.440.500.340.290.380.470.49Source: BPS (SUSENAS) various issues, <strong>and</strong> De<strong>in</strong><strong>in</strong>ger <strong>and</strong> Squire (1995, 1996).Table 3 G<strong>in</strong>i Coefficient of Consumption Expenditure <strong>in</strong> <strong>Indonesia</strong> by <strong>Urban</strong> <strong>and</strong> Rural: 1965-2002Year <strong>Urban</strong> Rural National1965 0.34 0.35 0.351970 0.33 0.34 0.351976 0.35 0.31 0.351978 0.38 0.34 0.401980 0.36 0.31 0.341981 0.33 0.29 0.331984 0.32 0.28 0.331986 0.32 0.27 0.331987 0.32 0.26 0.321990 0.34 0.25 0.321993 0.33 0.26 0.341994 0.34 0.26 0.341995 0.35 0.27 0.351996 0.35 0.27 0.361997 0.35 0.26 0.371998 0.33 0.26 0.321999 0.34 0.26 0.332002 0.35 0.26 0.34Source: BPS (SUSENAS) various issues.Figure 1 Percentage of Total Population Liv<strong>in</strong>g Under the <strong>Poverty</strong> L<strong>in</strong>e, 1976-200245403530252015105040.133.328.624.221.623.417.417.719 18.4 18.4 17.615.1 13.71976 1978 1980 1981 1984 1987 1990 1993 1996 1998 1999 2000 2001 2002Source: BPSWith the cont<strong>in</strong>ued economic growth <strong>and</strong> hence <strong>in</strong>crease <strong>in</strong> real <strong>in</strong>come per capita, there were correspond<strong>in</strong>gimprovement <strong>in</strong> other social <strong>in</strong>dicators dur<strong>in</strong>g the New Order period. Almost universal entry <strong>in</strong>to primary education wasachieved <strong>in</strong> the early 1980s, <strong>and</strong> the net enrollment rate has been ma<strong>in</strong>ta<strong>in</strong>ed at nearly 95% at the primary level s<strong>in</strong>ce then(Jones et al., 2000). World Bank (2001) reports that life expectancy at birth rose from 55 years <strong>in</strong> 1980 to 65 years <strong>in</strong> 1997,
<strong>and</strong> the estimated proportion of children dy<strong>in</strong>g before reach<strong>in</strong>g their fifth birthday fell from 125 per 1,000 for those born <strong>in</strong>1980 to 52 per 1,000 for those born <strong>in</strong> 1998.When economic crisis occurred <strong>in</strong> 1997/1998, poverty <strong>in</strong> <strong>Indonesia</strong> <strong>in</strong>creased aga<strong>in</strong> sharply. Studies conducted s<strong>in</strong>cethe 1998 economic crisis, such as ADB (2000), Suryahadi et al. (2000) <strong>and</strong> Skoufias (2000), all confirm that. In December1998, BPS has carried out a small survey of household expenditure, <strong>and</strong> its results suggests that the proportion of poorpeople rose from about 17.7% <strong>in</strong> 1996 to 24.2% <strong>in</strong> 1998. However, Daly <strong>and</strong> Fane (2002) argued that much of theapparent rise was due to an <strong>in</strong>crease <strong>in</strong> the poverty l<strong>in</strong>e. Relative to the former poverty l<strong>in</strong>e, the HC rate rose from 11% <strong>in</strong>1996 to 17% <strong>in</strong> 1998. Relative to the new poverty l<strong>in</strong>e, the rate <strong>in</strong>creased from 18% <strong>in</strong> 1996 to 24% <strong>in</strong> 1998 <strong>and</strong> thendecl<strong>in</strong>ed slightly to 23% <strong>in</strong> 1999. 1The significant <strong>in</strong>creased of poverty dur<strong>in</strong>g the crisis period was deemed by Dhanani <strong>and</strong> Islam as crisis-<strong>in</strong>ducedtransient poverty, that is, people mov<strong>in</strong>g <strong>in</strong> <strong>and</strong> out of poverty <strong>in</strong> a relatively short period of time. They argued that it isparticular important to highlight the phenomenon of transient poverty <strong>in</strong> the case of <strong>Indonesia</strong>n crisis which wascharacterized by a deep recession as well as an <strong>in</strong>flation shock. It is the latter that holds the key to underst<strong>and</strong><strong>in</strong>g transientpoverty <strong>in</strong> <strong>Indonesia</strong>.In order to see this phenomenon of transient poverty, Dhanani <strong>and</strong> Islam (2000) argue that there is a need todist<strong>in</strong>guish between the overall <strong>in</strong>cidence of poverty (OP) <strong>and</strong> the severity of poverty (SP). The first one can be capturedby the headcount (HC) ratio, but this ratio is unable to dist<strong>in</strong>guish between those who are hover<strong>in</strong>g just under the povertyl<strong>in</strong>e <strong>and</strong> those who are located well below. The second one (SP) can be measured by estimat<strong>in</strong>g whether <strong>in</strong>equality amongthe poor has worsened. If the latter occurs, then this implies that the very poor have become worse off compared to the lesspoor. 2 Accord<strong>in</strong>g to their estimate, the HC poverty <strong>in</strong>cidence <strong>in</strong>creased from an estimated 30% <strong>in</strong> February 1997 to justunder 45% <strong>in</strong> September 1998. <strong>Poverty</strong> <strong>in</strong>cidence stabilized at around this level until February 1999. Food prices began todecl<strong>in</strong>e thereafter, lead<strong>in</strong>g to a rapid improvement <strong>in</strong> transient poverty, which stood at 36% <strong>in</strong> August of the same year.Nevertheless, as shown <strong>in</strong> the figure, the HC poverty <strong>in</strong>cidence was still higher than before the crisis. Data from BPS also<strong>in</strong>dicate a rapid rise <strong>in</strong> HC poverty <strong>in</strong>cidence, from 19% to 27% between February 1996 <strong>and</strong> February 1999, peak<strong>in</strong>g at37% <strong>in</strong> September 1998, when food prices were at their highest level <strong>and</strong> decl<strong>in</strong>ed to their pre-crisis level by August 1999.The year 1998 also saw the <strong>in</strong>crease of SP, <strong>in</strong>dicat<strong>in</strong>g that economic crisis not only <strong>in</strong>creased the number of peoplefall<strong>in</strong>g below the poverty l<strong>in</strong>e substantially, but also <strong>in</strong>creased extreme poverty. Data compiled by BPS as well asestimates from Dhanani <strong>and</strong> Islam (2000) show that the number of people below 65% or 80% of the total poverty l<strong>in</strong>e, orbelow the food poverty l<strong>in</strong>e, <strong>in</strong>creased faster than the overall number of poor people between February 1996 <strong>and</strong> February1999. As shown <strong>in</strong> Table 4, while extreme poverty rose more rapidly <strong>in</strong> urban areas, due to the low number of poor <strong>in</strong> thepre-crisis period, the number of people below the food poverty l<strong>in</strong>e rose by 8 million <strong>in</strong> rural areas, compared to 4 millionpeople <strong>in</strong> urban areas.1 Daly <strong>and</strong> Fane (2002) argued that measured poverty after the onset of the crisis may have slightly overstated real poverty because the anti-poverty programs thatprovided benefits <strong>in</strong> k<strong>in</strong>d, i.e. subsidized rice, scholarships <strong>and</strong> subsidized health care <strong>and</strong> nutrition, would not have affected the expenditure-based measures of poverty,even though they reduced real poverty, because their benefits were not <strong>in</strong>cluded <strong>in</strong> measured expenditure.2 The need to dist<strong>in</strong>guish between the overall <strong>in</strong>cidence of poverty <strong>and</strong> the severity of poverty <strong>in</strong> assess<strong>in</strong>g changes <strong>in</strong> poverty was emphasized for the first time by Sen(1976). He showed that the two may not behave <strong>in</strong> an identical fashion.
Table 4 Population below selected poverty l<strong>in</strong>e: 1996-1999 (millions of people, HC ratio method)BPS poverty l<strong>in</strong>eDhanani <strong>and</strong> Islam’s poverty l<strong>in</strong>eFeb.’96 Feb.’99 Change Feb.’96 Feb.’99ChangeBelow 65% of poverty l<strong>in</strong>e<strong>Urban</strong>Rural5.631.803.839.363.116.25million. %3.73 661.31 732.42 6316.812.0514.7629.036.2822.76million %12.22 734.23 1077.99 54Below 80% of poverty l<strong>in</strong>e<strong>Urban</strong>Rural17.865.0612.8026.338.9817.358.473.924.5547783634.865.9728.8956.9514.7242.2322.088.7513.336314746Below total poverty l<strong>in</strong>e<strong>Urban</strong>Rural37.6611.0926.57Source: cited from Table 5 <strong>in</strong> Dhanani <strong>and</strong> Islam (2000).55.7819.1236.6518.128.0410.0848733865.1212.6752.4494.8626.6268.2429.7413.9515.794611030Just as the economic contraction <strong>in</strong> 1998 caused a sharp <strong>in</strong>crease <strong>in</strong> poverty rate, the rebound of the country’seconomy <strong>in</strong> the follow<strong>in</strong>g two years, albeit modest, led to a drop aga<strong>in</strong> <strong>in</strong> percentage of the population deemed poor, but itis still higher than its lowest level ever reached, i.e. 15,1% <strong>in</strong> 1990. Data from BPS show that <strong>in</strong>cidence of povertydecl<strong>in</strong>ed from 24.2% <strong>in</strong> 1998 to 23.4% <strong>in</strong> 1999, <strong>and</strong> <strong>in</strong> 2002 the rate was 18.20% (Table 5). Recent <strong>in</strong>formation shows that<strong>in</strong> 2003 the poverty rate is 17.4%. So, the major thrust of the evidence is that the worst is <strong>in</strong>deed over <strong>and</strong> that the<strong>in</strong>cidence of nation-wide poverty is apparently mov<strong>in</strong>g back towards pre-crisis levels, suggest<strong>in</strong>g that a social recoveryfrom the crisis seems to be <strong>in</strong> progress. But, overall, the poverty rate <strong>in</strong> <strong>Indonesia</strong> is still high as compared to its lowestlevel of 15,1% <strong>in</strong> 1990. Even, data from the National Family Plann<strong>in</strong>g Agency (BKKPN) show that <strong>in</strong> 2001 the percentagerate of poor families <strong>in</strong> <strong>Indonesia</strong> reached around 50.07, that was more than half of total families <strong>in</strong> the country.If the post crisis period (1999-2002) is taken as a case study, then it shows that the average rate of growth of poverty<strong>in</strong> urban areas is about 1.15%, while than <strong>in</strong> rural areas as well as total decl<strong>in</strong>ed to respectively 7.28% <strong>and</strong> 6.70% onaverage. This <strong>in</strong>dicates that s<strong>in</strong>ce the crisis, urban poverty has become a serious problem rather than total poverty <strong>in</strong><strong>Indonesia</strong>.With this evidence, Suryahadi et al. (2000) <strong>and</strong> Balisacan, et. al. (2002) argue that poverty <strong>in</strong> <strong>Indonesia</strong> responds quitestrongly <strong>and</strong> relatively quickly to large shocks. Whereas, Dhanani <strong>and</strong> Islam (2000) expla<strong>in</strong> the evidence by argu<strong>in</strong>g thatthe <strong>Indonesia</strong>n crisis was characterized not just by a deep recession, but also by an “<strong>in</strong>flation shock” <strong>in</strong> 1998. In the firstyear of the crisis, <strong>in</strong>flation <strong>in</strong>creased by 100%, while nom<strong>in</strong>al wage went up by less than 20%, so eroded the purchas<strong>in</strong>gpower of the nom<strong>in</strong>al wage to just 60% of its pre-crisis value. Food prices rose faster than the overall <strong>in</strong>flation ratethroughout 1998 follow<strong>in</strong>g the depreciation of the rupiah aga<strong>in</strong>st the US dollar. More importantly there was a substantialrise <strong>in</strong> the price of rice by 180% while non-food items <strong>in</strong>creased by almost 80% between February 1996 <strong>and</strong> February1999 (World Bank, 2000a). Nom<strong>in</strong>al wage <strong>in</strong>creases were unable to keep pace with the ris<strong>in</strong>g cost of food <strong>and</strong> other basicneeds dur<strong>in</strong>g that period. There is evidence that those <strong>in</strong> extreme poverty actually faced a higher <strong>in</strong>flation rate than others.A study made by Lev<strong>in</strong>sohn et al (1999) estimated that the bottom 10% of households actually experienced a higher<strong>in</strong>flation rate than the top 10% of households dur<strong>in</strong>g the crisis period, particularly <strong>in</strong> urban areas. In addition, theunemployment rate went up, as many companies especially <strong>in</strong> the manufactur<strong>in</strong>g <strong>and</strong> construction sectors, as well as bankscollapsed follow<strong>in</strong>g the crisis. The crisis was further compounded by the drought affect<strong>in</strong>g ma<strong>in</strong>ly eastern part of the
country <strong>and</strong> also some parts <strong>in</strong> Java <strong>and</strong> Sumatra, lead<strong>in</strong>g to loss of agricultural <strong>in</strong>comes (ILO/UNDP, 1998 <strong>and</strong> ILO,1999).Source: BPSTable 5 <strong>Poverty</strong> L<strong>in</strong>e, Number <strong>and</strong> Percentage of Population Liv<strong>in</strong>g under the <strong>Poverty</strong> L<strong>in</strong>e: 1976-2001Year <strong>Poverty</strong> L<strong>in</strong>e (Rp/capita/month) Poor People (%) Number of Poor People (million persons)<strong>Urban</strong> Rural <strong>Urban</strong> Rural National <strong>Urban</strong> Rural National197619781980198119841987199019931996199819992000200120024,5224,9696,8319,77713,73117,38120,61427,90542,03296,95992,40991,632100,011na2,8492,9814,4495,8777,74610,29413,29518,24431,36672,78074,27273,64880,382na38.830.829.028.123.120.116.813.413.621 .919.414.69.814.540.433.428.426.521.216.114.313.819.925.726.022.125.021.140.133.328.626.921.617.415.113.717.724.223.419.018.418.210.08.39.59.39.39.79.48.79.617.615.612.18.513.344.238.932.831.325.720.317.817.224.931.932.325.228.625.154.247.242.340.635.030.027.225.934.549. 548.037.337.138.4IV <strong>Urban</strong> <strong>Poverty</strong> <strong>in</strong> <strong>Indonesia</strong>IV.1 Recent Trend<strong>Poverty</strong> has no geographical boundary: it is found <strong>in</strong> rural as well as urban areas. But, for certa<strong>in</strong> aspects the urbanpoor <strong>and</strong> rural poverty are different. The first <strong>and</strong> perhaps most significant dist<strong>in</strong>ction is that the urban poor depend ma<strong>in</strong>lyon a cash <strong>in</strong>come for survival. Security is another serious problem for urban poor. Crime, violence, alcoholism,prostitution, <strong>and</strong> AIDS are all frequent social problems <strong>in</strong> the urban context. Among the urban poor, women <strong>and</strong> childrensuffer more from environmental problems <strong>in</strong> poor settlements. Low <strong>in</strong>come, subst<strong>and</strong>ard shelter<strong>in</strong>g, crowd<strong>in</strong>g airpollution, <strong>in</strong>sufficient or contam<strong>in</strong>ated dr<strong>in</strong>k<strong>in</strong>g water, <strong>in</strong>adequate sanitation <strong>and</strong> solid waste disposal services, vectorbornediseases, <strong>in</strong>dustrial waste, <strong>in</strong>creased motor vehicle traffic, stress associated with unemployment, are all suffered bythe urban poor.Data from SUSENAS show that number of poor people <strong>in</strong> urban areas decl<strong>in</strong>ed by 15% from 10 million people <strong>in</strong>1976 to about 8.5 million people <strong>in</strong> 2001, or from 38.8% to almost 9.8% of total population, but <strong>in</strong>creased aga<strong>in</strong> <strong>in</strong> 2002 to13.3 million people or 14.5% of total population <strong>in</strong> that year (Table 5). Further, as presented <strong>in</strong> Table 6, transient poverty<strong>in</strong>creased <strong>in</strong> both urban <strong>and</strong> rural areas accord<strong>in</strong>g to data from BPS <strong>and</strong> estimates of Dhanani <strong>and</strong> Islam (2000). However,this <strong>in</strong>crease was more marked <strong>in</strong> urban areas, where poverty <strong>in</strong>cidence <strong>in</strong>creased by more than 100%, while <strong>in</strong> rural areasrose by 45%. Both the magnitude of change <strong>in</strong> OP <strong>and</strong> SP <strong>in</strong> urban areas are consistent with the significant <strong>in</strong>crease <strong>in</strong> theshare of household <strong>in</strong>comes devoted to purchas<strong>in</strong>g food. In their study, it is shown that the household food budget share<strong>in</strong>creased from 50% to 56% <strong>in</strong> urban areas, <strong>and</strong> 67% to 73% <strong>in</strong> rural areas.Table 6 Transient <strong>Poverty</strong>: 1996-1999 (% population)
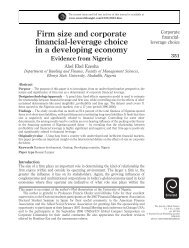
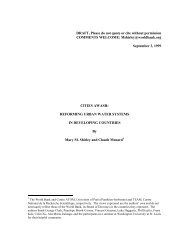
Feb.’96 Feb.’97 Feb.’98 Sep.’98 Dec.’98 Feb.’99 Aug.’99BPS<strong>Urban</strong>RuralNational15.621.319.2------32.440.237.221.925.324.220.024.722.915.120.218.2Dhanani <strong>and</strong> Islam<strong>Urban</strong>RuralNational18.041.933.3Source: BPS <strong>and</strong> Dhanani <strong>and</strong> Islam (2000).16.237.629.723.648.639.330.252.243.629.851.142.833.055.046.325.643.336.3IV.2 <strong>Poverty</strong> <strong>in</strong> Jakarta: Results of the Survey<strong>Poverty</strong> profile <strong>in</strong> Jakarta is presented <strong>in</strong> Table 7 show<strong>in</strong>g some important aspects of poverty such as <strong>in</strong> relation to typeof occupation, employment status, sex, <strong>and</strong> education. Further, the result of poverty mapp<strong>in</strong>g conducted by SMERUResearch Institute is given <strong>in</strong> Figures 2, 3 <strong>and</strong> 4, show<strong>in</strong>g the distribution of poverty <strong>in</strong> the city by district, subdistrict, <strong>and</strong>village 3 .As summarized <strong>in</strong> Table 8, it can be seen that poverty <strong>in</strong> Jakarta is concentrated <strong>in</strong> Western <strong>and</strong> Eastern parts ofthe city as shown by their higher poverty headcount ratios.Table 7 <strong>Poverty</strong> Profile of JakartaDescription 1999 2000 2001 2002<strong>Poverty</strong> as a percentage of total population <strong>in</strong> Jakarta3.99(2.43) 1(19.41) 24.96(3.38)(14.60)2.95(2.88)(9.79)3.42(2.15)(14.46)<strong>Poverty</strong> Gap Index (P1) (%)0.58(4.33) 30.82(3.51)0.43(3.42)0.39(3.01)Distributionally Sensitive Index (P2) (%)0.14(1.23) 30.22(1.02)0.09(0.97)0.07(0.79)<strong>Poverty</strong> by sex as a percentage of total population <strong>in</strong> particularsex category <strong>in</strong> Jakarta:-Male-Female4.15(23.42) 4(0.80) 53.98(23.31)(0.78)0.53(19.07)(1.17)4.70(18.83)(1.06)2.98(18.37)(0.67)2.91(18.42)(0.66)3.52(17.49)(0.82)3.34(17.66)(0.78)<strong>Poverty</strong> by education as a percentage of total poverty n Jakarta:-No formal education/never f<strong>in</strong>ish elementary school-Elementary school graduate-Junior high school graduate-Senior high school graduate31.62(48.11) 645.58(35.69)14.03(8.83)7.55(6.74)21.99(47.38)37.56(35.78)19.27(9.12)19.20(7.12)17.38(48.98)25.98(36.83)17.10(7.96)26.60(5.49)18.47(44.56)46.32(38.8416.50(9.76)17.35(6.24)3 The method used <strong>in</strong> this poverty mapp<strong>in</strong>g basically <strong>in</strong>volves a two-step procedure. First, a model of consumption determ<strong>in</strong>ation is estimated us<strong>in</strong>g the data fromhousehold survey. In the second step, the parameters estimated <strong>in</strong> the first step are then transferred to the data from the population census to stimulate the consumptionlevel of each <strong>and</strong> every household enumerated <strong>in</strong> the population census. The simulated household consumption is then used as the basis for calculat<strong>in</strong>g poverty <strong>and</strong> otherwelfare <strong>in</strong>dicators. For further <strong>in</strong>formation about this model <strong>and</strong> its application, see Suryahadi, et al. (2003).
-Tertiary/college/university graduate1.22(0.63)1.97(0.59)12.94(0.74)1.36(0.60)<strong>Poverty</strong> by occupation/sector as a percentage of total poverty <strong>in</strong>Jakarta:-No work-Agriculture-Industry-Service25.19(8.47) 71.75(54.19)9.54(12.65)63.53(24.68)21.71(9.26)0.32(51.73)22.09(13.84)55.89(25.17)14.21(6.33)0.19(62.99)14.93(11.86)70.68(18.82)18.02(8.61)1.83(57.75)15.10(12.53)65.18(21.22)<strong>Poverty</strong> by employment status as a percentage of total poverty<strong>in</strong> Jakarta:-No work-Self-employed-Employee with family/hired workers-Employer/worker-Family worker25.19(8.37) 843.57(27.19)2.77(36.07)28.48(27.56)0.00(0.81)21.71(9.26)30.09(28.06)11.82(34.78)36.06(27.03)0.32(0.87)14.21(6.28)28.97(18.55)11.01(46.34)45.20(27.89)0.60(0.93)18.02(8.54)30.47(23.26)6.17(37.75)45.47(29.99)0.00(0.57)Notes:1= % of total urban poverty <strong>in</strong> <strong>Indonesia</strong>2 =% of total urban population <strong>in</strong> <strong>Indonesia</strong>3 =at national level (<strong>Indonesia</strong>).4 =% of total population by particular sex category <strong>in</strong> <strong>Indonesia</strong>5 =% of total poverty by particular sex category <strong>in</strong> <strong>Indonesia</strong>6 = % of total poverty by particular education category <strong>in</strong> <strong>Indonesia</strong>7 = % of total poverty by particular occupation category <strong>in</strong> <strong>Indonesia</strong>8 = % of total poverty by particular employment status category <strong>in</strong> <strong>Indonesia</strong>Table 8 <strong>Poverty</strong> Map of Jakarta-District LevelDistrict<strong>Poverty</strong> Headcount Ratio- South, East, <strong>and</strong> CentralJakarta- North Jakarta- West JakartaSource: Suryahadi, et al. (2003).0.0211 to 0.03240.0346 to 0.03670.0367 to 0.0409Figure 2 <strong>Poverty</strong> Mapp<strong>in</strong>g <strong>in</strong> Jakarta by District
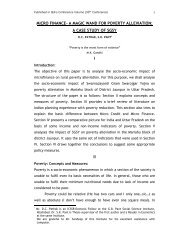
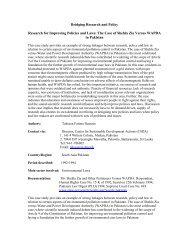
Notes: Jakarta Barat = West districtJakarta Utara = North districtJakarta Pusat = Central districtJakarta Selatan = South districtJakarta Timur = East districtFigure 3 <strong>Poverty</strong> Mapp<strong>in</strong>g <strong>in</strong> Jakarta by Subdistrict
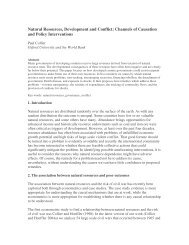
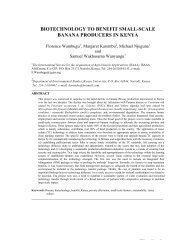
Figure 4 <strong>Poverty</strong> Mapp<strong>in</strong>g <strong>in</strong> Jakarta by Village Level
As expla<strong>in</strong>ed before (see methodology), for this study, one subdistrict of the city have been selected as the surveyareas for this study, i.e. Tambora <strong>in</strong> West Jakarta. The selection of this area was based on the results of field verification <strong>in</strong>relation to the poverty mapp<strong>in</strong>g conducted by Suryahadi et al. (2003), which <strong>in</strong>dicate that West Jakarta is the poorestdistrict <strong>in</strong> the city. Their results show that Tambora has a 7.8% poverty rate.West Jakarta consists of eight subdistricts with 56 villages. Based on the poverty mapp<strong>in</strong>g results, the population ofthis district as of mid 2001 was about 1.5 million people. The population-density was 124 people per hectare, <strong>and</strong> so it isthe second most densely populated part of the city after Central Jakarta. Of the eight subdistricts <strong>in</strong> West Jakarta, Tamborais known as the most densely populated subdistrict with 493 people per hectare.The people of Tambora <strong>in</strong> general are considered middle-or low-<strong>in</strong>come earners. Most people <strong>in</strong> this subdistrictwork<strong>in</strong>g <strong>in</strong> very low <strong>in</strong>come activities such as petty traders <strong>and</strong> ojek (motorcycles or bicycles used as <strong>in</strong>formal publictransport) driver. This latter type of low <strong>in</strong>come activity is common <strong>in</strong> Tambora. In general, poor people do not havepermanent jobs, easily change their jobs <strong>and</strong> found <strong>in</strong> <strong>in</strong>formal low-<strong>in</strong>come economic activities. This phenomenon is veryevident <strong>in</strong> Tambora.Another important characteristic of poverty <strong>in</strong> Tambora is that this subdistrict has no space available for developmentof new houses or estates. Shacks occupied by many people, such that they have to take turn to sleep, are common <strong>in</strong>Tambora. One shack is sometimes occupied by two or three shifts. Due to the limited space, poor households have toarrange the schedule or activities of their family members to determ<strong>in</strong>e who stay <strong>in</strong> the shack.
In Tambora, one kelurahan or kampung (village) was selected, namely Kampung Kal<strong>in</strong>jar for an <strong>in</strong>depth study.Accord<strong>in</strong>g to local government officials, this kampung is the poorest of total of 11 kelurahan <strong>in</strong> Tambora. The area isabout 33 hectares <strong>and</strong> about 29,555 people are liv<strong>in</strong>g there, or almost 90,000 people per km 2 . The majority of <strong>in</strong>habitantswork <strong>in</strong> the <strong>in</strong>formal sector such as garment makers, silk-screeners, small shop owners, food vendors, cigarette vendors,potable water suppliers, workers <strong>in</strong> car or motorcycles repair workshops, ojek <strong>and</strong> taxi drivers.The residents’ houses are crowded together <strong>and</strong> built on state or tenured l<strong>and</strong>. They are not permanent houses, butmost of them are two-story houses so they can shelter more people. In addition to serv<strong>in</strong>g as a place of residence, many ofthese houses are also used for small-scale bus<strong>in</strong>ess activities, such as stalls, workshops, <strong>and</strong> garment <strong>and</strong> silk-screen<strong>in</strong>ghome <strong>in</strong>dustries. The village is divided <strong>in</strong> two by the three-meter wide asphalt road, <strong>and</strong> both sides of the road areclustered with many stalls sell<strong>in</strong>g basic necessities <strong>and</strong> food, cigarette vendors, motorcycles repair workshops, <strong>and</strong> avariety of home <strong>in</strong>dustries. This crowded road as a large market place can also be found <strong>in</strong> many narrow alleyways with<strong>in</strong>this kampung. Most of these alleyways also function as a play<strong>in</strong>g ground for children <strong>and</strong> a place to wash <strong>and</strong> dry laundry<strong>and</strong> even cook.Most of the houses of the families (respondents) were cramped houses, <strong>and</strong> many of them were occupied by more thanone family with a total of more than 10 persons: father, mother, their unmarried children as well as their married childrenwith their own children. Their houses did not meet health <strong>and</strong> safety st<strong>and</strong>ards, <strong>and</strong> this was a general condition of most ofthe houses <strong>in</strong> kelurahan Kalianjar. Only a small number of houses visited have their own bathroom <strong>and</strong> laundry facilities.One family of the sample, whose head of the family works as a security guard of a big company <strong>in</strong> Central Jakarta, <strong>and</strong> hiswife takes care a stall <strong>in</strong> front of their house, sell<strong>in</strong>g some basic needs. From their 5 children, only two of them were still <strong>in</strong>school (primary), while the rema<strong>in</strong><strong>in</strong>g three aged 10 to 12 years old were not anymore. Instead, they are also family<strong>in</strong>come earners by sell<strong>in</strong>g newspapers/magaz<strong>in</strong>es <strong>in</strong> crowded ma<strong>in</strong> roads <strong>in</strong> the city. The married son is a ojek driver, <strong>and</strong>his wife helps her mother <strong>in</strong> law <strong>in</strong> manag<strong>in</strong>g the shop. Their 4 children aged 1 to 6 years old, <strong>and</strong> only the 6 years old girlwas <strong>in</strong> school. But as the mother said, when she f<strong>in</strong>ishes her primary school, she will not cont<strong>in</strong>ue her school, simplybecause no money for that. The mother did not have yet idea what her daughter should do after that.In the sample, there was also a two-story house, occupied by three related families of a total of 9 mature persons <strong>and</strong>three small children Two of them (father <strong>and</strong> his oldest son) work as taxi drivers <strong>in</strong> the same company, <strong>and</strong> other threemarried sons all work as ojek drivers. The other three persons have no permanent work; they just do everyth<strong>in</strong>g that canearn some money, from sell<strong>in</strong>g cigarettes to part-time helpers <strong>in</strong> motorcycle repair workshop owned by their neighbor.Two children were still <strong>in</strong> school, while the oldest one just f<strong>in</strong>ished his primary school last year, but he could not cont<strong>in</strong>uehis school due to lack of money. Instead, he became a cigarette vendor.In general, the f<strong>in</strong>d<strong>in</strong>gs of the survey are given <strong>in</strong> the follow<strong>in</strong>g tables. First, the characteristics of the respondents withrespects to marital status, age, <strong>and</strong> education are presented <strong>in</strong> the follow<strong>in</strong>g three tables. In Table 9, it is shown that 92.9%of the respondents are married. The selection of poor families as respondents for this study with the procedure as expla<strong>in</strong>edbefore <strong>in</strong> the methodology has resulted only three divorced women <strong>in</strong> the group. Table 10 shows that the majority of therespondents are with<strong>in</strong> the age of 26-50 years or constituted 64.3% of the total families <strong>in</strong>terviewed. Therefore, themajority of the respondents are middle-aged people. In Table 11, it reveals that the majority of the respondents are
graduated from high school. Only about 13% of the respondents have no education <strong>and</strong> never f<strong>in</strong>ish their elementaryschool, <strong>and</strong> they are ma<strong>in</strong>ly from the age category of 41 <strong>and</strong> older. So, this may suggest that one ma<strong>in</strong> factor beh<strong>in</strong>d theirpoverty is because of low level of education.MarriedDivorcedTable 9 Marital Status of RespondentsNumber of RespondentsMaleFemale65-23Total %Distribution65592.97.1TotalSource: survey67370100.0Table 10 Age Distribution of RespondentsFrequency% DistributionLess than or equal 2526-4041-5051-60More than 60TotalSource: survey1030151057014.342.921.414.31.1100.0Table 11 Education of respondents by age categoryAge structure≤25 26-40 41-50 51-60 >60No education/never f<strong>in</strong>ish elementary schoolElementary graduateJunior high school graduateSenior high school graduateTertiary-253--31017-5413224-4-2--3-Total %Distribution9131630212.918.622.942.92.8TotalSource: survey10301510570100.0Next two tables show economic condition of the respondents. As can be seen <strong>in</strong> Table 12, half of the respondents havebeen found to have ma<strong>in</strong> sources of <strong>in</strong>come <strong>in</strong> formal sector, while the other half <strong>in</strong> <strong>in</strong>formal economic activities. In theformal sector, the majority of them work <strong>in</strong> low-<strong>in</strong>come generated jobs such as construction daily workers, taxi <strong>and</strong> publicbus drivers <strong>and</strong> security guards. In the <strong>in</strong>formal sector, most of the respondents work on very low <strong>in</strong>come-generated areas,such as petty traders <strong>and</strong> ojek drivers. These k<strong>in</strong>ds of activities do not provide a stable monthly <strong>in</strong>come, it depends onmarket competition <strong>and</strong> how creative are they to f<strong>in</strong>d customers. From total respondents of 70 families, 11 of them havebeen found to have no work (unemployed). Whereas <strong>in</strong> Table 13, it shows that the majority of the respondents fell <strong>in</strong> themonthly <strong>in</strong>come category of 500.000 rupiah or less.Table 12 Distribution of respondents by ma<strong>in</strong> source of <strong>in</strong>come (occupation)Age structure≤25 26-40 41-50 51-60 >60Total %Distribution
Formal- civil servant- construction daily worker- taxi driver- public bus driver- security guard- others12-11--105-521-222-1-----------31273824.317.110.04.311.42.9Informal- petty traders- small shop owner- household <strong>in</strong>dustry- ojek driver2--33--332-1232-----1052714.37.12.910.0Unemployed-22251115.7TotalSource: survey10301510570100.0Table 13 Distribution of respondents by monthly <strong>in</strong>come (head of the family)Frequency% DistributionRupiah0 – 100.000101.000 – 200.000201.000 – 300.000301.000 – 500.000501.000 – 1000.000>1000.000117151522-15.710.021.421.431.40.0Source: survey70100.0F<strong>in</strong>ally, dur<strong>in</strong>g the survey the respondents have been questioned about their survival strategy or what special effortsthey have undertaken <strong>in</strong> copy<strong>in</strong>g with their poverty <strong>and</strong> especially dur<strong>in</strong>g the economic crisis <strong>in</strong> 1997/1998. As generallymight be expected, the f<strong>in</strong>d<strong>in</strong>g presented <strong>in</strong> Table 14 shows that their ma<strong>in</strong> effort as their survival strategy isdiversification of sources of <strong>in</strong>come by family members. Many of them have been found to have sent their children, whowere ma<strong>in</strong>ly still at junior high school, to work, after school hour, such as afternoon newspapers, cigarettes, or m<strong>in</strong>eralwater dr<strong>in</strong>k vendors. In this group, there were some families whose head <strong>in</strong>comes were very low, so they could not affordto keep f<strong>in</strong>anc<strong>in</strong>g further education of their children after graduated from high school. Instead, they sent their high schoolgraduated children to work, such as ojek drivers or construction daily paid workers (son) or help<strong>in</strong>g their mothers <strong>in</strong>manag<strong>in</strong>g their small shops or work<strong>in</strong>g <strong>in</strong> restaurants (girl).Table 14 Family survival strategy of respondentsFrequency% Distribution- Diversification of <strong>in</strong>come sources- Borrow money from e.g. neighbor/relative- Overwork- Sell household items- Reduce monthly expenditure on basic needs- No answerTotalSource: survey404105657057.15.714.37.18.67.1100.0
This evidence seems largely to confirm the luxury axiom which asserts that households send their children to workonly when driven to do so by poverty. In other words, child nonwork (typically school<strong>in</strong>g <strong>and</strong> leisure) is a luxury good forpoor household. Such household whose head <strong>in</strong>comes are very low cannot afford to keep children out of some productiveactivities. Only when head <strong>in</strong>comes beg<strong>in</strong> to rise do household take children out of the labor force. Implicit <strong>in</strong> thisassumption is an altruistic view of the household: parents do not like to make their children work unless compelled bycircumstances (Basu <strong>and</strong> Tzannatos, 2003). In other words, if parents are too poor to meet the necessary expenditures ofthe household <strong>and</strong> cannot borrow aga<strong>in</strong>st the future earn<strong>in</strong>gs of their children, dissav<strong>in</strong>gs <strong>in</strong> the form of child labor may benecessary for survival (Humphries, 2003).The role of poverty has been the cornerstone of much of the th<strong>in</strong>k<strong>in</strong>g about child labor, <strong>and</strong> evidence such as this froma small sample <strong>in</strong> Jakarta is also found <strong>in</strong> many other poor countries, where child labor is widespread. 4 Results of a recentstudy by Nagaraj (2002) of the beedi <strong>in</strong>dustry <strong>in</strong> Tamil Nadu <strong>and</strong> Karnataka, India, show that the number of children aged5-14 attend<strong>in</strong>g school rises as monthly household per capita <strong>in</strong>comes, presented by consumption expenditures, rise.Further, at a more macro level, country case studies from India <strong>and</strong> Ch<strong>in</strong>a (ILO, 1996) <strong>and</strong> Thail<strong>and</strong> (Tzannatos, 2003), for<strong>in</strong>stance, show a clear relationship between household <strong>in</strong>come <strong>and</strong> child labor: as nations become richer, the <strong>in</strong>cidence ofchild labor tends to fall.V Ma<strong>in</strong> Cause of <strong>Poverty</strong>Although many factors may have contributed, no doubt that the most important cause of <strong>in</strong>creas<strong>in</strong>g urban poverty <strong>in</strong><strong>Indonesia</strong> is poverty or economic backwardness <strong>in</strong> rural areas. But, this is not specific <strong>Indonesia</strong>n story; it is a generalphenomenon <strong>in</strong> many other develop<strong>in</strong>g countries. S<strong>in</strong>ce rural economy <strong>in</strong> <strong>Indonesia</strong>, which is much less developed than <strong>in</strong>urban areas, is dom<strong>in</strong>ated by agriculture, so the ma<strong>in</strong> source of rural poverty is <strong>in</strong> the agricultural sector. Official data ondistribution of poor families by occupation <strong>in</strong> <strong>Indonesia</strong> <strong>in</strong>dicate the vast majority of poor families are <strong>in</strong> agricultural work,predom<strong>in</strong>antly on farms (Table 15).Table 15 Distribution of Poor Families by Occupation, 1999-2002 (number of heads of families <strong>in</strong> 000 persons)1999 2000 2001 2002UnemployedAgricultureIndustryServices4.06325.9976.06911.8403.56020.1095.3809.7842.34923.3754.4016.9843.07220.6054.4717.571TotalSource: BPS47.96938.83337.10935.719L<strong>and</strong> is the most important store of wealth <strong>in</strong> agrarian societies, <strong>and</strong> <strong>in</strong> <strong>Indonesia</strong> it is typically distributed veryunequally. This fact challenges the common presumption that the majority of urban poverty emerges from the poorest farmhouseholds. Data from agricultural census which <strong>in</strong>dicates that <strong>Indonesia</strong>n agriculture is dom<strong>in</strong>ated by large <strong>and</strong> <strong>in</strong>creas<strong>in</strong>gnumber of small-scale family farms. As shown <strong>in</strong> Table 16, recent agricultural census <strong>in</strong>dicates that <strong>in</strong> 2003 there were4 See e.g Jayaraj (1993), Ray (2000a,b), Edmonds (2001), Admassie (2002), Nagaraj (2002), Wahba (2002), Grootaert <strong>and</strong> Patr<strong>in</strong>os (1999, 2002).
25.437 million l<strong>and</strong>-us<strong>in</strong>g farmers, 13.663 million or almost 57% of which were marg<strong>in</strong>al farmers with less than 0.5 ha ofl<strong>and</strong> under their control. In 1993 the number of l<strong>and</strong>-us<strong>in</strong>g farm households was 20.518 millions or grown by 1.8% peryear, whereas the number of marg<strong>in</strong>al farmers was 10.804 million or <strong>in</strong>creased by 2.6% per year dur<strong>in</strong>g the 1993-2003period. In Java, the number of l<strong>and</strong>-us<strong>in</strong>g family farms <strong>and</strong> the marg<strong>in</strong>al farmers <strong>in</strong>creased by respectively 1.5% <strong>and</strong> 2.4%per year.Table 16 Number <strong>and</strong> growth rate of l<strong>and</strong>-us<strong>in</strong>g farms <strong>and</strong> marg<strong>in</strong>al farmers <strong>in</strong> <strong>Indonesia</strong>: 1993-2003Category1993 2003Java Outside <strong>Indonesia</strong> Java Outside Java <strong>Indonesia</strong>JavaNumber (million)- Marg<strong>in</strong>al farmers- L<strong>and</strong>-us<strong>in</strong>g farms- Agricultural households8.067(69.8)*11.56411.6712.737(30.6)8.9549.11610.894(52.7)20.51820.7879.989(74.9)13.33613.9643.674(33.9)10.84111.47213.663(56.5)24.17625.437Growth rate per year, 1993-2003 (%)- Marg<strong>in</strong>al farmers- L<strong>and</strong>-us<strong>in</strong>g farms- Agricultural householdsNote: * = % of l<strong>and</strong>-us<strong>in</strong>g farmsSource: BPS2.41.52.03.42.12.62.61.82.2The average l<strong>and</strong> size per farmer will cont<strong>in</strong>ue to decl<strong>in</strong>e <strong>in</strong> the future especially <strong>in</strong> Java where the majority ofpopulation <strong>and</strong> poverty <strong>in</strong> the country are located. The reason is that, while, total agricultural l<strong>and</strong> <strong>in</strong> <strong>Indonesia</strong> stillcont<strong>in</strong>ued <strong>in</strong>creas<strong>in</strong>g, <strong>in</strong> Java it has been decl<strong>in</strong><strong>in</strong>g with an <strong>in</strong>creas<strong>in</strong>g rate s<strong>in</strong>ce early 1990s. This decelerat<strong>in</strong>g trend oftotal agricultural l<strong>and</strong> <strong>in</strong> Java is fairly reasonable. On one h<strong>and</strong>, potential agricultural l<strong>and</strong> for new l<strong>and</strong> expansion rightnow (<strong>and</strong> <strong>in</strong> the future) is only available <strong>in</strong> outside Java, particularly <strong>in</strong> the eastern part of the country. On the other h<strong>and</strong>,agricultural l<strong>and</strong> conversion to other functions will cont<strong>in</strong>ue accelerat<strong>in</strong>g at an <strong>in</strong>creas<strong>in</strong>g rate, as a direct effect of<strong>in</strong>dustrialization, population growth <strong>and</strong> urbanization.This problem has been aggravated s<strong>in</strong>ce the <strong>Indonesia</strong>n government has gradually reduced its supports for agriculturaldevelopment s<strong>in</strong>ce mid 1980s, <strong>and</strong> s<strong>in</strong>ce the economic crisis the government has reduced or stopped its <strong>in</strong>put subsidies(fertilizers, seeds). This policy has resulted <strong>in</strong> <strong>in</strong>creas<strong>in</strong>g production cost, which can bee seen from the decl<strong>in</strong><strong>in</strong>g of paddyfertilizerprice ration as shown <strong>in</strong> Table 17.Table 17 Development of farmers terms of trade <strong>in</strong> Java (1983-100) <strong>and</strong> paddy-fertilizer price ratio, 1974-2002Year Terms of trade <strong>in</strong> JavaPaddy-fertilizer price ratioUreaTSP1974197519761977197819791980198119821983--84.988.287.489.488.785.990.4100.01.010.901.021.101.161.461.681.871.831.821.481.561.601.471.321.471.641.851.821.88
19841985198619871988198919901991199219931994199519961997199819992000101.5100.9105.3107.3110.0104.3105.0104.999.8101.4103.0106.5107.2108.6107.6104.0102.6Source: BPS, quoted from Simatupang, et al. (2004).1.821.811.601.501.731.491.311.391.351.241.311.471.261.181.591.190.911.821.731.461.471.791.461.191.251.181.031.101.020.960.901.210.870.64So, from the above evidence, it is easy to underst<strong>and</strong> why so many people keep com<strong>in</strong>g from rural to urban or bigcities, despite that <strong>in</strong> cities like Jakarta it is also very difficult to f<strong>in</strong>d jobs with reasonable <strong>in</strong>comes especially for thosewho have no education or only primary <strong>and</strong> secondary education.VI <strong>Poverty</strong> Alleviation PoliciesThe importance of good policy <strong>and</strong> <strong>in</strong>itial favorable conditions has been identified as the ma<strong>in</strong> factors contribut<strong>in</strong>g topoverty reduction dur<strong>in</strong>g the pre-crisis period <strong>in</strong> <strong>Indonesia</strong>. There were four ma<strong>in</strong> important policies <strong>and</strong> programs devisedby the new order government (1969-1998). First, the rice policy, which subsequently led to <strong>Indonesia</strong>’s atta<strong>in</strong>ment of “riceself-sufficiency” <strong>in</strong> 1984, was one of the important factors that had a last<strong>in</strong>g impact on alleviat<strong>in</strong>g poverty. Second, dur<strong>in</strong>gthe oil boom <strong>in</strong> the 1970s, the government made substantial allocations to the social <strong>and</strong> human resource developmentsectors, as well as to transport <strong>in</strong>frastructure. It was dur<strong>in</strong>g this period that the government implemented the expansion ofprimary school (SD INPRES) <strong>and</strong> health centers (PUSKESMAS) to ensure wide access to these basic social services. Alsodur<strong>in</strong>g this period the government established the INPRES fund<strong>in</strong>g system, which allows direct grants from the center tothe regions. Third, the government ensured that particular social sectors were protected with<strong>in</strong> the development budget,primarily by utiliz<strong>in</strong>g the INPRES mechanism. Fourth, labor <strong>in</strong>tensive projects, which have long been part of thegovernment’s efforts to stimulate employment <strong>and</strong> <strong>in</strong>come dur<strong>in</strong>g tough economic times.The <strong>Indonesia</strong>n experience with the reversibility of the sharp <strong>in</strong>crease <strong>in</strong> poverty dur<strong>in</strong>g the crisis period <strong>in</strong> 1997-1998aga<strong>in</strong> <strong>in</strong>dicates that government <strong>in</strong>tervention had an important role to play. An anti-<strong>in</strong>flation strategy comb<strong>in</strong>ed withexchange rate stability that brought the ‘<strong>in</strong>flation shock’ of 1998 under control <strong>in</strong> comb<strong>in</strong>ation with the SSN programshave managed to reduce poverty, or at least to keep it from becom<strong>in</strong>g worsened. This two-track policy undertaken by thegovernment, i.e. one focus<strong>in</strong>g on aggregate price stability <strong>and</strong> the other on subsidiz<strong>in</strong>g the price of key goods <strong>and</strong> servicesconsumed by the poor, was deemed as a good strategy, s<strong>in</strong>ce an anti-<strong>in</strong>flation strategy pursued with<strong>in</strong> a macroeconomicframework cannot on its own adequately protect the poor from the ravages of <strong>in</strong>flation. The po<strong>in</strong>t is that poor <strong>and</strong> non-poor
households do not face a uniform <strong>in</strong>flation rate or suffer to the same extent from a surge <strong>in</strong> prices. The success stories withthe implementation of SSN programs as discussed above suggest that a fiscally susta<strong>in</strong>able social protection policy that isable to re<strong>in</strong>force household cop<strong>in</strong>g mechanisms <strong>and</strong> social capital of the poor should become part of <strong>Indonesia</strong>’s mediumtermstrategy for fight<strong>in</strong>g poverty.But, as agreed that <strong>in</strong>flation <strong>in</strong> the <strong>Indonesia</strong>n context was a primary determ<strong>in</strong>ant of short-run <strong>in</strong>crease <strong>in</strong> poverty, itfollows that controll<strong>in</strong>g <strong>in</strong>flation is not a suitable <strong>in</strong>strument for battl<strong>in</strong>g poverty <strong>in</strong> the long term. Similarly, as theyprimarily focus on transient poverty engendered by adverse shocks, the SSN programs cannot be a fitt<strong>in</strong>g long-term policy<strong>in</strong>strument for reduc<strong>in</strong>g poverty. A successful strategy <strong>in</strong> battl<strong>in</strong>g poverty <strong>in</strong> the long run is that focus<strong>in</strong>g on employmentgeneration. As a study of ILO (1999) notes the economy of <strong>Indonesia</strong> will have to grow over 5% per annum simply toabsorb new entrants <strong>in</strong>to the labor market <strong>and</strong> to clear the current shock of the unemployed <strong>and</strong> underemployed.Development of agriculture is also a fitt<strong>in</strong>g long-term strategy of poverty alleviation, as <strong>in</strong> <strong>Indonesia</strong> over 60% of thecountry’s population lives <strong>in</strong> rural areas, <strong>and</strong> the majority of them make a liv<strong>in</strong>g <strong>in</strong> agricultural activities. The mostimportant component of policies towards development of agriculture is policy on the distribution of l<strong>and</strong>. This is central toany assessment of poverty <strong>and</strong> <strong>in</strong>come <strong>in</strong>equality. So, there is also a need to have policies that improve the function<strong>in</strong>g oflabor <strong>and</strong> l<strong>and</strong> markets <strong>in</strong> rural areas. The growth of rural factor markets may generate overall <strong>in</strong>come growth <strong>and</strong> reducerural as well as rural-urban <strong>in</strong>equalities, <strong>and</strong> so it may also reduce urban poverty.It is generally agreed that employment-friendly economic growth is the ma<strong>in</strong> important way for reduc<strong>in</strong>g poverty <strong>in</strong>the long run. However, the success of this strategy depends on the work capability of the poor, which <strong>in</strong> turn depends oneducation <strong>and</strong> health condition of the poor. So, the cont<strong>in</strong>ued commitment of the government to the provision of publicgoods especially basic health <strong>and</strong> education is a must. Such provisions make the poor productive <strong>and</strong> hence <strong>in</strong>crease thereturns of their services. The major current issue <strong>in</strong> <strong>Indonesia</strong> is the government’s capacity to ma<strong>in</strong>ta<strong>in</strong> its pro-poorcommitment towards basic health <strong>and</strong> education, given that s<strong>in</strong>ce the crisis the government has been fac<strong>in</strong>g a huge fiscaldeficit. The government has been us<strong>in</strong>g huge resources for f<strong>in</strong>anc<strong>in</strong>g recapitalization <strong>and</strong> reform of the bank<strong>in</strong>g sector <strong>and</strong>servic<strong>in</strong>g external <strong>in</strong>debtedness.The National socio-economic survey (SUSENAS) data provide <strong>in</strong>formation about health condition <strong>in</strong> <strong>Indonesia</strong>. In1993, about 50 per cent of all persons when they were ill never sought medical help <strong>in</strong> a hospital, cl<strong>in</strong>ic or other formalhealth care services. They relied on traditional healers <strong>and</strong> self-treatment <strong>in</strong>stead. In 1997 the level improved to 37 percent, <strong>and</strong> was expected to stay <strong>in</strong> that level <strong>in</strong> the follow<strong>in</strong>g two years (Dhanani <strong>and</strong> Islam, 2000). Nearly 50 per cent ofhouseholds surveyed did not have a doctor or midwife present dur<strong>in</strong>g childbirth. In 1995, life expectancy at birth stood at63, while the <strong>in</strong>fant mortality rate stood at 45 per thous<strong>and</strong>. In 1999, about 30 per cent of all children under the age of fivewere malnourished, decl<strong>in</strong>ed from 35 per cent dur<strong>in</strong>g the crisis period, or 36 per cent <strong>in</strong> 1993, or 44 per cent <strong>in</strong> 1990.The SUSENAS data also provide <strong>in</strong>formation on educational condition <strong>in</strong> <strong>Indonesia</strong>. In 1999 about 35 per cent of thepopulation aged 10 <strong>and</strong> above have no education or less than primary school, compared to 45 per cent <strong>in</strong> 1993. This levelvaried between rural <strong>and</strong> urban areas; <strong>in</strong> urban areas it stood at 22 per cent <strong>in</strong> 1999 downed from 30 per cent <strong>in</strong> 1993,while <strong>in</strong> rural areas stood at 44 per cent <strong>in</strong> 1999 compared to 54 per cent <strong>in</strong> 1993. At the national level, the proportion ofthe population who was illiterate stood at 10 per cent <strong>in</strong> 1999, decl<strong>in</strong>ed from 14 per cent <strong>in</strong> 1993. In urban areas, it was 7
per cent <strong>in</strong> 1993 <strong>and</strong> improved to 5 per cent <strong>in</strong> 1999, while <strong>in</strong> rural areas 13 per cent <strong>in</strong> 1999 compared to 18 per cent <strong>in</strong>1993.Ultimately, however, as argued by Islam (1999), the long –run battle aga<strong>in</strong>st poverty has to depend on the regenerationof susta<strong>in</strong>able, labor-<strong>in</strong>tensive, <strong>and</strong> hence employment oriented, growth buttressed by pro-poor commitments to publicspend<strong>in</strong>g <strong>in</strong> health <strong>and</strong> education. This is a major policy challenge that the com<strong>in</strong>g new government of <strong>Indonesia</strong> after thepresidential election <strong>in</strong> 2004 will face.VII <strong>Social</strong> <strong>Safety</strong> <strong>Net</strong>VII.1 ObjectivesS<strong>in</strong>ce the new order government led by former President Soeharto, efforts to protect the poor people <strong>in</strong> <strong>Indonesia</strong>have been focused on three areas: (a) exp<strong>and</strong>ed labor-<strong>in</strong>tensive public works programs to provide purchas<strong>in</strong>g power to thepoor; (2) actions to ensure the cont<strong>in</strong>ued availability of key goods with subsidized prices; <strong>and</strong> (3) programs to ma<strong>in</strong>ta<strong>in</strong>access to basic education <strong>and</strong> health.The experience with an extremely high <strong>in</strong>flation rate <strong>and</strong> its severe impact on poverty dur<strong>in</strong>g the economic crisis <strong>in</strong>1998 led the <strong>Indonesia</strong>n government to <strong>in</strong>troduce social protection policy or widely known <strong>in</strong> <strong>Indonesia</strong> as social safety net(SSN) program. This program is aimed at m<strong>in</strong>imiz<strong>in</strong>g the deterioration of social welfare <strong>and</strong> susta<strong>in</strong><strong>in</strong>g key humanresource <strong>in</strong>vestments. It is also aimed at safeguard<strong>in</strong>g, to the extent possible, advances made by <strong>Indonesia</strong> dur<strong>in</strong>g theSoeharto period before the crisis <strong>in</strong> poverty reduction <strong>and</strong> human development. In the context of countries such as<strong>Indonesia</strong> go<strong>in</strong>g through adjustment programs after hit by the crisis, SSN schemes take an even more important role, s<strong>in</strong>cethey also become a political buffer for the government that has to implement the reform measures (UNSFIR, 1999).VII.2 DevelopmentOne of the features of the SSN program was the Special Market Operation (OPK) that aimed to provide cheap rice topoor households. It was <strong>in</strong>troduced partly <strong>in</strong> response to the economic crisis <strong>and</strong> partly <strong>in</strong> response to the drought thataffected many parts of eastern <strong>Indonesia</strong> <strong>in</strong> 1997-98. It was therefore targeted at poor villages <strong>and</strong> to those <strong>in</strong> droughtaffected areas, which was mounted <strong>in</strong> mid-1998 <strong>in</strong> the wake of food riots <strong>and</strong> <strong>in</strong>creas<strong>in</strong>g food prices. In early 1999, thistargeted rice subsidy program reached approximately 50 million people, almost equivalent to the entire populationofficially recorded as poor by the end of 1998 (Dhanani <strong>and</strong> Islam, 2000). 5The government orig<strong>in</strong>ally <strong>in</strong>tended that each of the 8 million households <strong>in</strong> the poorest group, as <strong>in</strong>dicated by datafrom BKKPN, should receive 20 kg of medium quality rice per month at substantially subsidized process of Rp1,000/kg,when the market price was Rp2,500-3000/kg (Sumarto, et al., 2001). The benefit per household was therefore aboutRp15,000-20,000 per month, or about 15% of the total consumption expenditure of a household of four persons at theofficial poverty l<strong>in</strong>e. 6 The target allocation per household was later doubled to 20 kg per month <strong>and</strong> the entitlement was5 Accord<strong>in</strong>g to Sumarto et al (2001), the size of ‘potentially eligible’ group for subsidized rice is all 50.4 million <strong>Indonesia</strong>n households.6 Separate official poverty l<strong>in</strong>e are used for urban <strong>and</strong> rural areas <strong>in</strong> each prov<strong>in</strong>ce. In 2000, the average for urban areas was Rp92,000 per person per month. In ruralareas, the average was Rp74,000 per person per month. The average size of all <strong>Indonesia</strong>n households <strong>in</strong> 2000 was 4.0 people (Daly <strong>and</strong> Fane, 2002).
extended to <strong>in</strong>clude the 9.4 million households <strong>in</strong> the second poorest group, as <strong>in</strong>dicated by the BKKPN data. In April2000 the allocation was changed aga<strong>in</strong>, to between 10 <strong>and</strong> 20 kg per household per month (Daly <strong>and</strong> Fane, 2002).In terms of central government expenditure, data from National Plann<strong>in</strong>g Agency (BAPPENAS) <strong>in</strong>dicate that the OPKprogram is the most important <strong>Indonesia</strong>’s targeted schemes provid<strong>in</strong>g rationed benefits <strong>in</strong> k<strong>in</strong>d. In the first year, theexpenditure on this program was 3.70% of total central government expenditure, <strong>and</strong> decl<strong>in</strong>ed to 3.14% <strong>and</strong> 1.22%respectively <strong>in</strong> the follow<strong>in</strong>g two years. As a percentage of total anti-poverty spend<strong>in</strong>g, the share of the OPK programstood at 41.5% dur<strong>in</strong>g the fiscal year 1998/1999-1999/2000, <strong>and</strong> decl<strong>in</strong>ed to 21.6% <strong>in</strong> 2000.Other programs are <strong>in</strong>terventions <strong>in</strong> education, health <strong>and</strong> nutrition, <strong>and</strong> employment. The pr<strong>in</strong>ciple goal of the SNNscholarship program was to protect students from poor households from dropp<strong>in</strong>g out as a result of the negative effects ofthe economic crisis 1997/98. 7 Other scholarship programs existed before this program started, such as Gerakan NasionalOrang Tua Asuh (National Movement of Foster Parents), smaller government programs <strong>and</strong> other, ma<strong>in</strong>ly private<strong>in</strong>itiatives, but none of these was comparable <strong>in</strong> size with the SSN scholarship program (Sparrow, 2003).The SSN scholarship program provided scholarships or school grants to children thought to be most at risk of dropp<strong>in</strong>gout, while schools <strong>in</strong> poor areas received budgetary support <strong>in</strong> the form of block grants to help them ma<strong>in</strong>ta<strong>in</strong> quality ofeducation. The distribution was planned as follows: 6% of pupils <strong>in</strong> the senior three grades of primary school, 17% ofthose <strong>in</strong> lower secondary (junior high) school <strong>and</strong> for 10% of those <strong>in</strong> upper secondary (senior high) school. 8 The monthlyvalue of the scholarships was Rp10,000 for primary students, Rp20,000 for lower secondary students <strong>and</strong> Rp25,000 forupper secondary students.To put the number <strong>in</strong> respective, accord<strong>in</strong>g to Sparrow (2003), monthly household expenditures on education perstudent dur<strong>in</strong>g the crisis period (1997/98) were Rp9,562 for primary school, Rp27,682 for junior high school, <strong>and</strong>Rp53,242 for senior high school. In 1998, monthly educational expenditures from the poorest 20% of the population wereRp4,826, Rp15,725 <strong>and</strong> Rp31,549 per student for primary, junior <strong>and</strong> senior high schools, respectively. So, this<strong>in</strong>formation <strong>in</strong>dicate that the scholarships of this SSN educational program was quite significant contribution to monthly<strong>in</strong>come of the poorest households <strong>and</strong> covered a large part 9 if not all) of their monthly education expenses.Although the program followed a design whereby allocation of scholarships was decentralised to district <strong>and</strong> schoolcommittees, the grants themselves were given <strong>in</strong> cash directly to the selected students through the post office, <strong>and</strong> theywere freely to decide by themselves how to spend the funds. An important characteristic of this program was that thosewho were selected as the targeted students were to keep the scholarships for the whole learn<strong>in</strong>g period of their stay <strong>in</strong> aspecific school. So, if a first grade junior high school student was selected to get the scholarship, he/she would cont<strong>in</strong>ue toreceive the fund until his/her graduation from third grade.The program was to span 5 years, from 1998/1999 to 2002/2003, after which the crisis was expected to be over. Forthe first year, almost 4 million scholarships were available per year to 1,800,000 primary school students, 1,650,000 juniorhigh school students, <strong>and</strong> 500,000 senior high school students. In 2001/2002 the number who received grants from this7 The economic recession <strong>in</strong> the late 1980s had been associated with a decl<strong>in</strong>e <strong>in</strong> school enrollments <strong>and</strong> there was official concern dur<strong>in</strong>g the 1998 crisis that this shouldnot be repeated. Therefore, before the beg<strong>in</strong>n<strong>in</strong>g of the school year <strong>in</strong> late August 1998, the government together with the World Bank <strong>and</strong> the Asian Development Bank(ADB), assisted by other external donors <strong>in</strong>clud<strong>in</strong>g the Australian Agency for International Development (AusAID), hastily assembled the Scholarships <strong>and</strong> SchoolGrants Program, which was designed to prevent a fall <strong>in</strong> school enrollment.
program started to decl<strong>in</strong>e <strong>and</strong> the last scholarships were disbursed <strong>in</strong> March <strong>and</strong> April 2002. In 2001, a new scholarshipprogram of similar design (but different <strong>in</strong> its fund<strong>in</strong>g <strong>and</strong> objectives), the Special Assistance for Students (BantuanKhusus Murid – BKM) started. This program was meant to complement <strong>and</strong> later on to replace the SSN Scholarshipprogram (Sparrow, 2003).As with the OPK program, <strong>in</strong> terms of expenditure the scholarship program is also a very important <strong>Indonesia</strong>’stargeted scheme provid<strong>in</strong>g rationed benefits <strong>in</strong> k<strong>in</strong>d. In the fiscal year 1998/99, the expenditure on this program was 1.06%of total central government expenditure, <strong>and</strong> decl<strong>in</strong>ed to 0.84% <strong>in</strong> the next fiscal year, <strong>and</strong> further to 0.75% <strong>in</strong> 2000. As apercentage of total anti-poverty spend<strong>in</strong>g, the share of the scholarship program recorded at 11.4% <strong>in</strong> 1998/1999-1999/2000, <strong>and</strong> <strong>in</strong>creased to 13.2% <strong>in</strong> 2000.The health care <strong>and</strong> nutrition program that was <strong>in</strong>troduced as part of the social safety net <strong>in</strong> 1998 <strong>in</strong>cluded a mix ofdirect fund<strong>in</strong>g to <strong>in</strong>dividual households <strong>and</strong> block grants to service providers, such as hospitals, cl<strong>in</strong>ics <strong>and</strong> familyplann<strong>in</strong>g services (World Bank, 2000b). Health care cards that entitled holders to free health care from designatedproviders were allocated to districts on the basis of the BKKPN estimates of the number of very poor or poor households<strong>in</strong> the district. A separate nutrition program, which operated from 1998 until 2000, provided supplementary food <strong>and</strong>vitam<strong>in</strong>s for <strong>in</strong>fants <strong>and</strong> pregnant women (Daly <strong>and</strong> Fane, 2002). 9In terms of expenditure, data from BAPPENAS show that <strong>in</strong> the fiscal year 1998/99, the spend<strong>in</strong>g on this program wasnearly 1.0% of total central government expenditure, <strong>and</strong> rose to 1.16% <strong>in</strong> the next fiscal year, <strong>and</strong> then went down toalmost 1.0% <strong>in</strong> 2000. As a percentage of total anti-poverty spend<strong>in</strong>g, the share of the scholarship program recorded at13.3% <strong>in</strong> 1998/1999-1999/2000, <strong>and</strong> <strong>in</strong>creased to 17.6% <strong>in</strong> 2000.The employment program related to the SSN program was <strong>in</strong>troduced dur<strong>in</strong>g the f<strong>in</strong>ancial year 1998/99, known as theKecamatan Development Program (KDP) <strong>and</strong> f<strong>in</strong>anced by a World Bank loan. This scheme aimed to create jobs forunskilled workers, <strong>and</strong> it has two components: the first provides grants for the development of <strong>in</strong>frastructure; the secondprovides loans for bus<strong>in</strong>ess activities. 10 Each village can submit maximum two proposals, <strong>and</strong> the choice of good proposalsis made at the subdistrict level. The loans for bus<strong>in</strong>ess activities are made to groups at market rates <strong>and</strong> are supposed to berepaid with<strong>in</strong> 18 months (NMC, 2000).Additional job creation <strong>and</strong> <strong>in</strong>frastructure development schemes were developed <strong>in</strong> response to the crisis. In somecases, known as padat karya (labour-<strong>in</strong>tensive) programs, low-skilled workers, <strong>in</strong>clud<strong>in</strong>g those who were laid off from<strong>in</strong>dustry manufactur<strong>in</strong>g, construction <strong>and</strong> bank<strong>in</strong>g as many companies <strong>in</strong> these three sectors were bankrupted caused by thecrisis, were employed to build or repair public <strong>in</strong>frastructure. In other cases, the government provided grants to localcommunities to f<strong>in</strong>ance loans to community groups, or to small <strong>and</strong> medium enterprises, to fund labour-<strong>in</strong>tensive projects.Daly <strong>and</strong> Fane (2002) refer to all these schemes not just the padat karya programs, but as ‘job creation schemes’.8 In Sumarto et al (2001), it is estimated that the size of ‘potentially eligible’ group for this program is the follow<strong>in</strong>g: 29.7 million children enrolled <strong>in</strong> primary school;10.4 million <strong>in</strong> lower secondary school; <strong>and</strong> 6.4 millions <strong>in</strong> upper secondary school.9 Sumarto et al (2001) estimated that the size of ‘potentially eligible’ group for the health care program is 27.6 million <strong>in</strong>dividuals <strong>and</strong> for the nutrition program is 20.0million <strong>in</strong>dividuals <strong>in</strong> the group ‘pregnant women <strong>and</strong> children under 3 years old.10 This scheme has some similarities to the IDT program (Inpres Desa Tert<strong>in</strong>ggal, Presidential Instruction for Underdeveloped Villages), <strong>Indonesia</strong>’s first anti-povertyprogram, which commenced <strong>in</strong> the f<strong>in</strong>ancial year 1994/95 <strong>and</strong> ended at the close of 1997/98
VII.3 EffectivenessAs po<strong>in</strong>ted out <strong>in</strong> Daly <strong>and</strong> Fane (2002), there have been three phases <strong>in</strong> the development of <strong>Indonesia</strong>’s anti-povertyprograms: the pre-crisis period, the crisis, <strong>and</strong> the subsequent period of slow recovery. In the pre-crisis period, <strong>Indonesia</strong>spent very little on anti-poverty programs, although their importance gradually <strong>in</strong>creased s<strong>in</strong>ce the fiscal year 1994/95. Theimportance of these programs <strong>in</strong>creased significantly <strong>in</strong> 1998, when the SSN program was <strong>in</strong>troduced <strong>in</strong> response to fearsthat the economic crisis might cause poverty to climb back to the levels of the 1980s, or even the 1970s. 11 In terms ofexpenditure, as shown <strong>in</strong> Table 18, total spend<strong>in</strong>g on anti-poverty programs was <strong>in</strong>creased significantly from Rp1.98trillion <strong>in</strong> 1997/98 to Rp14.24 trillion, or <strong>in</strong> terms of GDP from 0.29% to 1.39%, <strong>and</strong> then reduced subsequently, althoughit still far exceeds the pre-crisis level.Table 18 Expenditure on Anti-poverty Programs as a Percentage of Total Central Government Expenditure:1994-200094/95 95/96 96/97 97/98 98/99 99/00 2000Cash transfers0.11Benefits <strong>in</strong> k<strong>in</strong>dSubsidized rice (OPK)Health care <strong>and</strong> nutritionEducation0.490.160.330.690.340.365.733.700.971.065.143.141.160.842.961.220.990.75Job creation (<strong>in</strong>clud<strong>in</strong>g <strong>in</strong>frastructure <strong>and</strong> loans)0.611.371.211.273.941.872.58Total0.611.371.701.969.677.015.65Total anti-poverty programsRp trillion% of GDP0.430.111.070.231.540.281.980.2914.241.3913.951.2310.351.05Source: quoted from Table 1 <strong>in</strong> Daly <strong>and</strong> Fane (2002).World Bank provides an <strong>in</strong>terest<strong>in</strong>g fact on costs <strong>and</strong> benefits comparison between fuel subsidies, bank restructur<strong>in</strong>gprogram, <strong>and</strong> the SSN program for 1999/2000. As can be seen <strong>in</strong> Figure 5, the cost share of authorized budget allocationwas much higher for fuel subsidies <strong>and</strong> bank restructur<strong>in</strong>g than the part of it for the SSN program. While, with respect tobenefits, as shown <strong>in</strong> Figure 6, fraction of benefits of the SSN program that went directly to the bottom 20% of thepopulation was significantly higher than of these subsidies <strong>and</strong> bank restructur<strong>in</strong>g.Figure 5 Authorized Budget Allocation for Fuel Subsidies, Bank Restructur<strong>in</strong>g <strong>and</strong> the SSN Program,1999/2000 (Rp trillions)3025201510511 Evans (1998) made predictions that about 50% of the country’s population would be <strong>in</strong> poverty by the end of 1998.0F. subsidies B. restruc. SSN
Source: World Bank (2001).Figure 6 Benefit Incidence Comparison of Fuel Subsidies, Bank Restructur<strong>in</strong>g <strong>and</strong> the SSN Program, 1999/20000.30.250.20.150.10.050F. subsidies B. restruc. SSNSource: World Bank (2001).Further, Table 19shows that the relative importance of three broad types of anti-poverty programs varied <strong>in</strong> the threephases. Job creation, <strong>in</strong>frastructure <strong>and</strong> loans schemes accounted for more than 75% of all spend<strong>in</strong>g on anti-povertyprograms <strong>in</strong> the pre-crisis period. In response to the crisis, each broad types of anti-poverty program received an <strong>in</strong>creasedshare of total central government budget allocation, <strong>and</strong> the relative importance of job creation, <strong>in</strong>frastructure <strong>and</strong> loanschemes decl<strong>in</strong>ed to that of benefits <strong>in</strong> k<strong>in</strong>d schemes, especially to the OPK program.Table 19Share of Individual Broad Types of Programs <strong>in</strong> Total Anti-<strong>Poverty</strong> Spend<strong>in</strong>g (%):1994/95-200094/95-97/98 98/99-99/00 2000 94/95-2000Cash transfers0.00.01.90.5Benefits <strong>in</strong> k<strong>in</strong>dSubsidized rice (OPK)Health care <strong>and</strong> nutritionEducation22.80.09.713.266.241.513.311.452.421.617.613.257.932.013.912.1Job creation (<strong>in</strong>clud<strong>in</strong>g <strong>in</strong>frastructure <strong>and</strong> loans)77.233.845.641.6TotalSource: BAPPENAS100.0100.0100.0100.0Admittedly, the SSN program has been much criticized both for its poor design <strong>and</strong> for be<strong>in</strong>g a source of waste <strong>and</strong>downright corruption. Evaluations conducted by various studies show that effectiveness of the program is very uneven <strong>and</strong>varies enormously from location to location <strong>and</strong> from program to program. However, a comprehensive evaluation of theOPK shows that it was generally effective <strong>in</strong> achiev<strong>in</strong>g its goals. Such as Islam (1999), Rachman et al. (1999), <strong>and</strong> Tabor<strong>and</strong> Sawit (1999) arrive at the follow<strong>in</strong>g conclusions:• The OPK program reached 44.2 million people <strong>in</strong> 1998 <strong>and</strong> peaked at approximately 50 million people <strong>in</strong> early1999 (virtually the entire population recorded as poor <strong>in</strong> December 1998).• It is highly cost-effective
• In its absence, the poor would have suffered an 11% <strong>in</strong>come reduction <strong>and</strong> the very poor a 22% decl<strong>in</strong>e <strong>in</strong> <strong>in</strong>come.The poor would have reduced their calorie consumption by about 8% <strong>and</strong> prote<strong>in</strong> consumption by about 15%• The OPK program has made an important contribution to price stability of rice• S<strong>in</strong>ce the <strong>in</strong>troduction of the OPK program, there has been a pronounced absence of food riots.• The OPK program should be part of <strong>Indonesia</strong>’s long-term toolkit of social protection measures.In addition, a comprehensive study has been undertaken by Sumarto et al. (2001) from SMERU, <strong>and</strong> the summary ofsome of their pr<strong>in</strong>cipal f<strong>in</strong>d<strong>in</strong>gs is shown <strong>in</strong> Table 20Two <strong>in</strong>dicators to measure ‘target<strong>in</strong>g’ are presented <strong>in</strong> this table.First, the ratio of a program’s coverage of the poorest 20% of the population, as measured by household expendituresurvey, to its coverage of the rema<strong>in</strong><strong>in</strong>g 80% of the population. Second, the ratio of its coverage of the poorest 20% of thepopulation to its coverage of the richest 20%. 12 Their estimates <strong>in</strong> Table 20ndicate that only about 53% of those <strong>in</strong> thebottom 20% of the expenditure distribution received subsidized OPK rice, <strong>and</strong> only 40% of those <strong>in</strong> the poorest 20% morelikely to benefit from the scheme than the rest of the population. Nevertheless, as shown <strong>in</strong> column 5 of Table 20 thescheme was relatively accurately targeted away from households <strong>in</strong> the richest 20% of the population.Table 20 Coverage <strong>and</strong> Target<strong>in</strong>g of the SNN Programs: August-February 1999*)ProgramSubsidized ricePrimary scholarshipsLower secondary scholarshipsUpper secondary scholarshipsHealth careNutritionJob creationCoverage of target group by program (%)Poorest 20%(1)52.65.812.25.410.616.58.3Poorest 40%(2)49.45.311.25.28.916.67.6Whole 100%(3)40.14.08.53.86.415.95.6Poorest 20%/80%(4)1.41.61.61.62.01.01.7Target<strong>in</strong>g ratiosNotes: *) Column (4) = [4 x column (1)]/[5 x column (3) – column (1)]. Coverage of the richest 20% = column (1)/column (5).Source: Sumarto et al (2001). 13Poorest 20%/richest20% (5)Kusumastuti et al (1998), also from SMERU, conducted a field study <strong>in</strong> 21 urban areas <strong>and</strong> 19 rural areas <strong>in</strong> fiveprov<strong>in</strong>ces, <strong>and</strong> they concluded that the OPK program is reach<strong>in</strong>g needy people, but not all needy people received OPK,<strong>and</strong> <strong>in</strong>formation was covered concern<strong>in</strong>g wastage, resale, corruption or malfeasance. They stated that one reason why thetarget household typically received less than their full monthly allocation of subsidized rice was that many villagecommunities <strong>in</strong>sisted on allocat<strong>in</strong>g some rice to every household, rather than provid<strong>in</strong>g all the benefits to those that metthe official criteria. Another reason for not sell<strong>in</strong>g all the subsidized rice just to those who met the official criteria is that itwas often difficult for poor households to accumulate the Rp20,000 needed to purchase their monthly allocation It wasfound that many rice rema<strong>in</strong>ed unsold, <strong>and</strong> some was sold to households who were outside the orig<strong>in</strong>al target group.Accord<strong>in</strong>g to Sumarto et al (2001), another problem encountered <strong>in</strong> the distribution process of this scheme was relatedto delays <strong>in</strong> distribution to remote areas. In 1999, another survey was conducted by Hardjono (1999), also from SMERU,targeted at around 450 poor households <strong>in</strong> North Java <strong>and</strong> said that: there is no doubt that the OPK rice programme has2.22.82.52.83.41.23.312 Coverage <strong>in</strong> Table 20 is number covered/size of potentially eligible group. The def<strong>in</strong>ition of the number covered <strong>and</strong> the size of the potentially eligible group varyfrom scheme to scheme <strong>and</strong> are given below for the national coverage estimates <strong>in</strong> column (3). The def<strong>in</strong>itions for the other expenditure qu<strong>in</strong>tiles are exactly analogous.13 Their estimates are derived from the special module on the SSN programs that was <strong>in</strong>cluded <strong>in</strong> the SUSENAS conducted by BPS <strong>in</strong> February 1999 <strong>and</strong> that coveredthe preced<strong>in</strong>g 6 months.
assisted the poorer members of the community <strong>in</strong> hamlets where 10 kg of rice was provided three or four times (p.28). But,he also po<strong>in</strong>ted out that coverage of the program has been <strong>in</strong>sufficient or <strong>in</strong>adequate due to remoteness <strong>and</strong> presumablylimited resources. Nevertheless, they both agree that this program has lessened burden of the poor.Dhanani <strong>and</strong> Islam (2000) have counted that the direct <strong>in</strong>come transfer due to the subsidized rice program <strong>and</strong> thescholarship program may have made a difference of up to 15 per cent <strong>in</strong> the total <strong>in</strong>come of a poor household. A familyable to purchase 20 kg of subsidized rice per month at Rp 1,000 per kg, compared with the prevail<strong>in</strong>g market price ofRp2,500 per kg <strong>in</strong> 1998, could save Rp30,000 per month. Add to this the value of a primary school scholarship ofRp20,000 per month, <strong>and</strong> a family of four members liv<strong>in</strong>g <strong>in</strong> the neighborhood of the BPS poverty l<strong>in</strong>e <strong>in</strong> rural areas ofRp76,000 per capita or Rp304,000 per household per month <strong>in</strong> early 1999, could have <strong>in</strong>creased its <strong>in</strong>come by 16 per centif registered <strong>in</strong> both these programs. Further, their calculation shows that the OPK program alone could have added around10 per cent to the <strong>in</strong>come of a poor rural household, compared to the estimation of 9 per cent by Tabor <strong>and</strong> Sawit (1999).As po<strong>in</strong>ted out <strong>in</strong> Dhanani <strong>and</strong> Islam (2000), depend<strong>in</strong>g on their participation <strong>in</strong> either or both programs, this added 10 percent is equivalent to prevent<strong>in</strong>g around 7 to 12 per cent from fall<strong>in</strong>g below the poverty l<strong>in</strong>eWith respect to education program, as shown <strong>in</strong> Table 21, the 1998 <strong>and</strong> 1999 SUSENAS survey data from BPS<strong>in</strong>dicate that school attendance rates at all three levels were ma<strong>in</strong>ta<strong>in</strong>ed dur<strong>in</strong>g the crisis. This suggests that the scholarshipprogram may have prevented large number of poor school children from dropp<strong>in</strong>g out of school. Based on his survey <strong>in</strong>Northern Java, Hardjono (1999) states that …..the children who were granted scholarships very largely come fromgenu<strong>in</strong>ely poor families; unlike most government programmes, the scholarship programme received almost universalpraise from respondents, with only two compla<strong>in</strong><strong>in</strong>g that their child was passed over <strong>in</strong> favour of better-off neighbours(p.31), <strong>and</strong> he also notes that The scholarship programme…displays a positive bias towards poor households <strong>and</strong> at thesame time has given very tangible assistance to a relatively large number of beneficiaries (p.32).Table 21 Educational Atta<strong>in</strong>ment, Literacy Levels <strong>and</strong> School Attendance: 1996-1998(% of total population aged 10 <strong>and</strong> more)<strong>Urban</strong> Rural NationalPrep-crisis Crisis Pre-crisis Crisis Pre-crisis CrisisEducational atta<strong>in</strong>ment-less than primary school-primary school-junior-senior school & above93 96 97 98 99 93 96 97 98 99 93 96 97 98 9930281725252816312328183123281831222719315432864935974536118453611844361194531111340321315373314163733141635331517% illiterate7665518161414131413111110Still attend<strong>in</strong>g school (%)-aged 7-12 (primary)-aged 13-15 (jun. school)-aged 16-18 (sen. school)Source: BPS968453978766988867988968968869916130936934947236947136947438936943947648957849957749957951But, the implementation of the program was not without some critical notes, especially with respect to the actualcoverage achieved <strong>in</strong> 1998/99, which was found much lower than the targets. Accord<strong>in</strong>g to the estimates prepared by
Sumarto et. al. (2001) as shown <strong>in</strong> column (3) of Table 20, the coverage was 4.0% at the primary school, 8.5% at the lowersecondary level <strong>and</strong> 3.8% at the upper secondary level.In paper, the program was well designed, whereby allocation of the funds was decentralized to district <strong>and</strong> schoolcommittees. Poor districts <strong>and</strong> school received more scholarships. Allocation to districts was based on geographicaldifferences <strong>in</strong> poverty <strong>and</strong> the estimated impact of the crisis, while allocation to schools <strong>and</strong> students relied heavily onlocal knowledge <strong>and</strong> community participation on the premise that local authorities are more capable of identify<strong>in</strong>g thepoorest. School committees were supposed to select children based on socio-economic background (such as families liv<strong>in</strong>g<strong>in</strong> poverty, s<strong>in</strong>gle parents <strong>and</strong> large households, <strong>and</strong> BKKBN prosperity status), travel distance from schools, <strong>and</strong> childrenwith a history of dropp<strong>in</strong>g out (Sparrow, 2003). But, <strong>in</strong> practice dur<strong>in</strong>g the implementation there were many problems thatmake the effectiveness of the program <strong>in</strong> question.For this study, a visit has been conducted to some villages (kampung) <strong>in</strong> West Jakarta which were also targeted for theSSN scholarships. Dur<strong>in</strong>g the visit many poor families have been found to have not received the grants, though they meetthe socio-economic characteristics as adopted by the program. These families compla<strong>in</strong>ed that many grants have gone tomore wealthy households. This compla<strong>in</strong> was also supported by ma<strong>in</strong> conclusion from a forum discussion organized forthis study with some non-government organizations (NGOs) <strong>and</strong> <strong>in</strong>dividual researchers who have been assess<strong>in</strong>g theeffectiveness of the SNN scholarship program. Also f<strong>in</strong>d<strong>in</strong>gs from several studies 14 suggest that there is considerableleakage of the grants to the more wealthy households, with the extent of this leakage vary<strong>in</strong>g greatly across districts.To some extent, this leakage was caused by “corruption practices” <strong>in</strong> the process of identify<strong>in</strong>g the poor families byschool committees <strong>and</strong> local authorities by apply<strong>in</strong>g their own criteria, so that scholarships have gone either to their ownfamilies <strong>and</strong> relatives or to the benefit of schools <strong>and</strong> not necessarily students. This problematic of accountability of schoolis also stressed by Sparrow (2003): While school committees appear to have followed the guidel<strong>in</strong>es to a large extent,there is some evidence that they have applied their own criteria, or at least to place priority on some of the criteria (page19).Usefulness of the BKKBN criteria as the ma<strong>in</strong> allocation criteria of the program’s guidel<strong>in</strong>e was also an importantreason for the leakage. The criteria had very little <strong>in</strong>fluence on the allocation process, because many other factors, whichare important for allocation, such as basic liv<strong>in</strong>g conditions <strong>and</strong> the ma<strong>in</strong> source of the family’s <strong>in</strong>come, were notmentioned <strong>in</strong> the guidel<strong>in</strong>es. Basic liv<strong>in</strong>g conditions are not always the same as families liv<strong>in</strong>g <strong>in</strong> poverty, s<strong>in</strong>gle parents orlarge households do not always mean they are poor. Even those who were categorized as poor families but the heads(fathers) have permanent jobs as a low-rank civil servant or a public bus driver <strong>in</strong> pr<strong>in</strong>ciple were less vulnerable thanfamilies with the fathers as a ojek driver.A lack of reliable data or poor <strong>in</strong>formation used <strong>in</strong> identify<strong>in</strong>g poorest districts was also a factor caus<strong>in</strong>g the leakage.Many studies argued that the program failed to identify the poorest districts or the areas hit hardest by the economic crisis<strong>in</strong> 1997/98 due to a lack of reliable data on regional poverty profiles. 1514See, amongst others, Jones <strong>and</strong> Hagul (2001), Cameron (2002), Dhanani <strong>and</strong> Islam (2002), <strong>and</strong> Sparrow (2003).15 See, among others, Lanjouw <strong>and</strong> Ravallion (1999), Suryahadi et al (1999), Pradhan <strong>and</strong> Sparrow (2000), Cameron (2002), Pritchet et al (2002), <strong>and</strong> Sparrow (2003).
Suryahadi et al (1999) found that target<strong>in</strong>g of primary <strong>and</strong> junior high students was more effective than senior highschool students. For the latter, the bulk of the funds ended up with the middle qu<strong>in</strong>tiles. They also found that to reach themost chronically poor families was not easy, because only children actually <strong>in</strong> school were eligible, while children not <strong>in</strong>school are most likely to come from the poorest families. They also found that some school (often small private <strong>and</strong>Islamic schools <strong>in</strong> poor districts) were not eligible for the program due to limited school size or poor adm<strong>in</strong>istration.Cameron (2002) identified another problem, namely the transition phase from primary to junior high school is not<strong>in</strong>cluded <strong>in</strong> the program design. When students supported by the scholarships move on to a higher school level, their grantsended, while <strong>in</strong> practice this transition phase is where most drop-outs occur.Despite problems mentioned above, there is however some evidence that the allocation of the SSN scholarships hasimproved overtime. The allocation <strong>in</strong> 2002 is much better than that <strong>in</strong> 1999. In 1999, about 60% of the grants have gone tohouseholds <strong>in</strong> the two poorest family per capita consumption expenditure qu<strong>in</strong>tiles. In 2002, this share <strong>in</strong>creased to justover 70%, while, the share of scholarships went to the richest qu<strong>in</strong>tile decl<strong>in</strong>ed from 6% to 3% dur<strong>in</strong>g the same period.Sparrow (2003) gives some reasons for this improvement. One reason is that the regional target<strong>in</strong>g has also beenimproved. As the available data on the geographic variation on poverty improved, the regional allocation measures wereadjusted. Another possible reason is the improved performance of allocation committees. Initial compla<strong>in</strong>ts concern<strong>in</strong>g thefunction<strong>in</strong>g of school committees <strong>in</strong> allocat<strong>in</strong>g the funds have led to some changes <strong>in</strong> guidel<strong>in</strong>e <strong>and</strong> the composition ofthese committees <strong>in</strong> the second year of the program.Overall, the evidence presented so far suggests that some social protection measures taken by the <strong>Indonesia</strong>ngovernment to protect the poor from adversely effect from the crisis have been relatively effective. However, as argued byDhanani <strong>and</strong> Islam (2000), it is necessary to take on board the views of those who have criticized the SNN programs fortheir poor design <strong>and</strong> for be<strong>in</strong>g a source of waste <strong>and</strong> corruption. An evaluation by SMERU (Suryahadi et al., 1999) foundthat the effectiveness of the OPK <strong>and</strong> other SSN programs had been very uneven <strong>and</strong> varied enormously from location tolocation <strong>and</strong> from program to program.The discussion of the effectiveness of the SNN programs or other government <strong>in</strong>tervention <strong>in</strong> protect<strong>in</strong>g the poor willbe <strong>in</strong>complete unless the relative importance of other explanatory variables <strong>in</strong> underst<strong>and</strong><strong>in</strong>g the transient nature of thecrisis-<strong>in</strong>duced <strong>in</strong>crease <strong>in</strong> poverty is also taken <strong>in</strong>to consideration. As quoted from Dhanani <strong>and</strong> Islam, It is possible toargue that the reason why the social impact of the crisis was muted, <strong>and</strong> apparently short-lived, is rooted <strong>in</strong> the cop<strong>in</strong>gmechanism of households. Certa<strong>in</strong>ly, both the ‘old’ poor (those who were poor pre-crisis) <strong>and</strong> the ‘new’ poor (those whodescended <strong>in</strong>to poverty as a result of the crisis) have tried to cope with the pressures of a recession-cum-<strong>in</strong>flation shock <strong>in</strong>1998 <strong>in</strong> a number of ways. Thus they sold assets, reduced consumption of micro nutrient-rich food, cut down on ‘nonessentialexpenditure’, sought refuge <strong>in</strong> the agricultural sector <strong>and</strong> the <strong>in</strong>formal sector <strong>and</strong> migrated overseas (p.18).VIII Some Conclud<strong>in</strong>g Remarks
This paper began with an exam<strong>in</strong><strong>in</strong>g of the evidence on poverty trend <strong>in</strong> <strong>Indonesia</strong> s<strong>in</strong>ce the new order government orthe pre-economic crisis period <strong>and</strong> period after that. The evidence shows that susta<strong>in</strong>ed rapid economic growth s<strong>in</strong>ce the1970s up to mid-1990s led the poverty <strong>in</strong>cidence to drop significantly. When economic crisis occurred <strong>in</strong> 1997/1998,poverty <strong>in</strong> <strong>Indonesia</strong> <strong>in</strong>creased aga<strong>in</strong> sharply, <strong>and</strong> when the country’s economy rebounded <strong>in</strong> the follow<strong>in</strong>g two years, thepercentage of the population deemed poor decl<strong>in</strong>ed, but it is still higher than its lowest level ever reached, i.e. 15,1% <strong>in</strong>1990. But, the evidence also shows that s<strong>in</strong>ce the crisis, urban poverty has become a serious problem, <strong>and</strong> this problem isnot only a result of the crisis but also as an accumulation effect of <strong>in</strong>creas<strong>in</strong>g rural-urban <strong>in</strong>equality <strong>and</strong> stillunderdevelopment of agriculture <strong>in</strong> the country.This paper also gave some important evidence obta<strong>in</strong>ed from a survey of poor families <strong>in</strong> Jakarta which shows thatsend<strong>in</strong>g children to work <strong>in</strong> the <strong>in</strong>formal sector is an important way of diversify<strong>in</strong>g their sources of <strong>in</strong>come. This evidenceseems largely to confirm the luxury axiom which asserts that households send their children to work only when driven todo so by poverty.Another important implication of this evidence is that, although many families <strong>in</strong> the sample depend on formal sectoras their ma<strong>in</strong> source of <strong>in</strong>come, no doubt that the <strong>in</strong>formal sector is very important for them, at least as a secondary or acomplementary source of <strong>in</strong>come.This paper also tried to exam<strong>in</strong>e ma<strong>in</strong> causes of urban poverty <strong>in</strong> <strong>Indonesia</strong>. It can be concluded that the mostimportant cause of <strong>in</strong>creas<strong>in</strong>g urban poverty <strong>in</strong> the country is poverty or economic backwardness <strong>in</strong> rural areas. S<strong>in</strong>ce ruraleconomy <strong>in</strong> <strong>Indonesia</strong> is dom<strong>in</strong>ated by agriculture, so the ma<strong>in</strong> source of rural poverty is <strong>in</strong> the agricultural sector, as thevast majority of poor families are <strong>in</strong> agricultural work, predom<strong>in</strong>antly on farms, <strong>and</strong> most of them are marg<strong>in</strong>al farmers.This problem has been aggravated s<strong>in</strong>ce the <strong>Indonesia</strong>n government has gradually reduced its supports for agriculturaldevelopment s<strong>in</strong>ce mid 1980s, <strong>and</strong> s<strong>in</strong>ce the economic crisis the government has reduced or stopped its <strong>in</strong>put subsidies(fertilizers, seeds).So, the above evidence provides some important policy implications for poverty alleviation <strong>in</strong> <strong>Indonesia</strong>. First, SSNprograms must not be adopted as a long-term poverty alleviation policy. Instead, improvement of labor productivity <strong>and</strong>distribution of agricultural assets, <strong>in</strong>clud<strong>in</strong>g l<strong>and</strong>, development of physical as well as social <strong>in</strong>frastructure <strong>in</strong> rural areas,<strong>and</strong> more access for the poor to better education <strong>and</strong> health facilities must be given as the first priority <strong>in</strong> long-termpoverty alleviation policies. Second, these policies should be comb<strong>in</strong>ed with employment-friendly economic growthpolicies. No doubt, the poor are better off when the government gives more focus on these long-term development aspects.ReferenceADB (2000), “Assessment of <strong>Poverty</strong> <strong>in</strong> <strong>Indonesia</strong>”, paper, Manila: Asian Development Bank.Admassie, A. (2002), “Explor<strong>in</strong>g the High Incidence of Child Labor <strong>in</strong> Sub-Saharan Africa”, African DevelopmentReview, 14, p.251-75.Balisacan, Arsenio M., Ernesto M. Pernia <strong>and</strong> Abuzar Asra (2002), “ Revisit<strong>in</strong>g Growth <strong>and</strong> <strong>Poverty</strong> Reduction <strong>in</strong><strong>Indonesia</strong>: What do Subnational Data Show?”, ERD Work<strong>in</strong>g Paper No.25, October, Manila: Asian Development Bank.
Basu, Kaushik, <strong>and</strong> P.H. Van (1998), “The Economics of Child Labor”, American Economic Review, 88(3), p.412-27.Basu, Kaushik <strong>and</strong> Zafiris Tzannatos (2003), “The <strong>Global</strong> Child Labor Problem: What Do We Know <strong>and</strong> What Can WeDo”, The World Bank Economic Review, 17(2), p.147-173.Booth, Anne (1993), “Count<strong>in</strong>g the Poor <strong>in</strong> <strong>Indonesia</strong>”, Bullet<strong>in</strong> of <strong>Indonesia</strong>n Economic Studies, 29(1), p.53-83.Cameron, L. (2002), “Did <strong>Social</strong> <strong>Safety</strong> <strong>Net</strong> Scholarships Reduce Drop-Out Rates Dur<strong>in</strong>g the <strong>Indonesia</strong>n EconomicCrisis?”, World Bank Policy Work<strong>in</strong>g Paper No.2800, Wash<strong>in</strong>gton, D.C.: The World Bank.CBS/UNDP (1999), “Crisis, <strong>Poverty</strong> <strong>and</strong> Human Development <strong>in</strong> <strong>Indonesia</strong>, 1998”, Jakarta: Central Bureau of Statistics<strong>and</strong> United Nations Development Programme.Chowdhury, Anis (2002), “<strong>Indonesia</strong> 2020 Long-term Issues & Priorities”, BAPPENAS/UNSFIR Discussion Paper, July,Jakarta: BAPPENAS/UNSFIR.Daly, Anne <strong>and</strong> George Fane (2002), “Anti-<strong>Poverty</strong> Programs <strong>in</strong> <strong>Indonesia</strong>”, Bullet<strong>in</strong> of <strong>Indonesia</strong>n Economic Studies,38(3), p.309-329.De<strong>in</strong><strong>in</strong>ger, Klaus <strong>and</strong> Lyn Squire (1995a), "Measur<strong>in</strong>g Income Inequality: A New Data-Base", (mimeo), Wash<strong>in</strong>gton,D.C.: The World Bank.De<strong>in</strong><strong>in</strong>ger, K. dan L. Squire (1995b), "Inequality <strong>and</strong> Growth: Results from a New Data-Base", (mimeo), Wash<strong>in</strong>gton,D.C.: The World Bank.De<strong>in</strong><strong>in</strong>ger, K. dan L.Squire (1996), "A New Data Set for Measur<strong>in</strong>g Income Inequality", World Bank Economic Review,No.10.Dhanani, Shafig (1994), “A Review of Alternative National <strong>and</strong> Regional <strong>Poverty</strong> Measures <strong>and</strong> Trends <strong>in</strong> <strong>Indonesia</strong>”,<strong>in</strong>terim technical report No.22, Regional Manpower Plann<strong>in</strong>g <strong>and</strong> Tra<strong>in</strong><strong>in</strong>g Project, Bappenas, Jakarta.Dhanani, Shafig <strong>and</strong> Iyanatul Islam (2000), “<strong>Poverty</strong>, Inequality <strong>and</strong> <strong>Social</strong> Protection”, Work<strong>in</strong>g Paper: 00/01, April,Jakarta: UNSFIRDhanani, Shafig <strong>and</strong> Iyanatul Islam (2002), “<strong>Poverty</strong>, Vulnerability <strong>and</strong> <strong>Social</strong> Protection <strong>in</strong> a Period of Crisis: The Caseof <strong>Indonesia</strong>”, World Development, 37(2).Edmonds, E. (2001), “Will Child Labor Decl<strong>in</strong>e with Improvements <strong>in</strong> Liv<strong>in</strong>g St<strong>and</strong>ards?”, Work<strong>in</strong>g Paper 01-09,Dartmouth College, Department of Economics, Hanover, N.H.Evans. Kev<strong>in</strong> (1998), “Survey of Recent Developments”, Bullet<strong>in</strong> of <strong>Indonesia</strong>n Economic Studies, 34(3), p.5-36.Foster, J., J. Greer <strong>and</strong> E. Thorbecke (1984), “A Class of Decomposable <strong>Poverty</strong> Measures”, Econometrica, 52, p.761-766.Grootaert, C., <strong>and</strong> H. Patr<strong>in</strong>os (ed.)(1999), The Policy Analysis of Child Labor, New York: St. Mart<strong>in</strong>’s Press.Hardjono, J. (1999), “The Micro Data Picture: Results of a SMERU <strong>Social</strong> Impact Survey <strong>in</strong> the Purwakarta-CirebonCorridor, special report of the <strong>Social</strong> Monitor<strong>in</strong>g <strong>and</strong> Early Response UNIT (SMERU), WorldBank/AusAID/ASEM/USAID project, Jakarta.Humphries, Jane (2003), “Child Labor: Lessons from the Historical Experience of Today’s Industrial Economies”, TheWorld Bank Economic Review, 17(2), p.175-196.
IHS (2000), Prov<strong>in</strong>cial <strong>Poverty</strong> <strong>and</strong> <strong>Social</strong> Indicators, Susenas 1993-1999, Report for Asian Development Bank, Jakarta:Insan Hitawasana Sejahtera.ILO (1996), Economically Active Populations: Estimates <strong>and</strong> Projections, 1950-2010, Geneva: International Labour Office.ILO/UNDP(1998), “Employment Challenge of the <strong>Indonesia</strong>n Economic Crisis”, June, Jakarta: International LabourOrganization.ILO (1999), “<strong>Indonesia</strong>: Strategies for Employment-Led Recovery <strong>and</strong> Reconstruction”, Report of the EmploymentStrategy Mission to <strong>Indonesia</strong>, 26 April-7 May, October, Geneva: International Labour Organization.Irawan, P.B. <strong>and</strong> H. Romdiati (1999), “Impact of the Economic Crisis on the number of <strong>Poverty</strong> <strong>and</strong> its Implications forDevelopment Strategies”, paper presented at the National Workshop on Food <strong>and</strong> Nutrition VII, LIPI, 23-25 November,Jakarta.Islam, Iyanatul <strong>and</strong> H. Khan (1986), “Spatial Patterns of Inequality <strong>and</strong> <strong>Poverty</strong> <strong>in</strong> <strong>Indonesia</strong>”, Bullet<strong>in</strong> of <strong>Indonesia</strong>nEconomic Studies, 22(2).Islam, Iyanatul (1999), “<strong>Poverty</strong>, Inequality <strong>and</strong> the <strong>Indonesia</strong>n Crisis: Revisit<strong>in</strong>g the Issues”, paper presented at “Forumon Strategy for Employment-Led Recovery <strong>and</strong> Reconstruction”, 23-25 November, ILO/Depnaker/Bappenas, Jakarta.Jayaraj, D. (1993), “Labor Force Participation of Children <strong>in</strong> Rural India”, Work<strong>in</strong>g Paper 116, Madras Institute ofDevelopment Studies, G<strong>and</strong>h<strong>in</strong>agar.Johnson, Col<strong>in</strong> (2000), “The <strong>Indonesia</strong>n Economy <strong>in</strong> 1999: Some Comments”, <strong>in</strong> Mann<strong>in</strong>g, Chris <strong>and</strong> Peter van Dierman(eds.), <strong>Indonesia</strong> <strong>in</strong> Transition. <strong>Social</strong> Aspects of Reformasi <strong>and</strong> Crisis, S<strong>in</strong>gapore: Institute of Southeast Asian Studies(ISEAS).Jones, G., <strong>and</strong> P. Hagul (2001), “School<strong>in</strong>g <strong>in</strong> <strong>Indonesia</strong>: Crisis-related <strong>and</strong> Longer-term Issues”, Bullet<strong>in</strong> of <strong>Indonesia</strong>nEconomic Studies, 37(2).Jones, G., P. Hagul <strong>and</strong> Damayanti (2000), “A Study of the Impact of the Scholarships <strong>and</strong> Grants Program”, mimeo,World Bank, Jakarta.Kusumastuti, Sri R., H. Akhmadi, P. Wibowo, S. Budiati, M. Nabiu, S. Usman, L. Bailey <strong>and</strong> J. Maxwell (1998),“Implementation of Special Market Operation (OPK) Program: Results of a SMERU Rapid Appraisal Mission <strong>in</strong> FiveProv<strong>in</strong>ces”, special report of the <strong>Social</strong> Monitor<strong>in</strong>g <strong>and</strong> Early Response UNIT, Jakarta.Lanjouw, P. <strong>and</strong> M. Ravallion (1999), “Benefits Incidence, Public Spend<strong>in</strong>g Reforms, <strong>and</strong> the Tim<strong>in</strong>g of ProgramCapture”, The World Bank Economic Review, 13(2).Lev<strong>in</strong>sohn, J., S. Berry <strong>and</strong> J. Friedman (1999), “Impacts of the <strong>Indonesia</strong>n Crisis: Price Changes <strong>and</strong> the Poor”, work<strong>in</strong>gpaper No.7194, Cambridge, MA: National Bureau of Economic Research.Nagaraj, K. (2002), “Female <strong>and</strong> Child Workers <strong>in</strong> a Household Industry: A Case Study of Beedi Industry <strong>in</strong> Karnataka<strong>and</strong> Tamil Nadu”, Work<strong>in</strong>g Paper, Madras Institute of Development Studies, G<strong>and</strong>h<strong>in</strong>agar.Mishra, Satish C. (2000), “Systemic Transition <strong>in</strong> <strong>Indonesia</strong>. Implications for Investor Confidence <strong>and</strong> Susta<strong>in</strong>edEconomic Recovery”, Work<strong>in</strong>g Paper: 00/03, Jakarta: UNSFIR.Mishra, Satish C. (2001), “History <strong>in</strong> the Mak<strong>in</strong>g. A Systemic Transition <strong>in</strong> <strong>Indonesia</strong>”, Work<strong>in</strong>g Paper: 01/02,Jakarta: UNSFIR.
NMC (2000), “Kecamatan Development Program, Second Annual Report, 1999/2000”, Jakarta: National ManagementConsultant.Os<strong>in</strong>ubi, T.S. (2003), “<strong>Urban</strong> <strong>Poverty</strong> <strong>in</strong> Nigeria: A Case Study of Agege Area of Lagos State, Nigeria”, August, GDNnet.Pradhan, M. <strong>and</strong> R. Sparrow (2000), “Basic Education Outcomes Dur<strong>in</strong>g Crisis-An Analysis Us<strong>in</strong>g the 1995, 1997, 1998<strong>and</strong> 1999 Susenas”, Amsterdam: ESI-VU.Pritchet, L., S. Sumarto, A. Suryahadi (2002), “Targeted Programs <strong>in</strong> an Economic Crisis: Empirical F<strong>in</strong>d<strong>in</strong>gs from theExperience of <strong>Indonesia</strong>”, SMERU Work<strong>in</strong>g Paper, Jakarta: SMERU Research Institute.Rachman, L., U. Pujihastuti, S. Sabannah <strong>and</strong> D. Suk<strong>and</strong>ar (1999), “Deskripsi Hasil Evaluasi Pelaksanaan Operasi PasarKhusus Beras” (Description of the evaluation result of the implementation of rice special market operation), the StateM<strong>in</strong>istry for Food <strong>and</strong> Horticulture, Economic Management Services International, September, Jakarta.Ray, R. (2000a), “Analysis of Child Labor <strong>in</strong> Peru <strong>and</strong> Pakistan: A Comparative Study”, Journal of PopulationEconomics, 13(1), p.3-19.Ray, R. (2000b), “Child Labor, Child School<strong>in</strong>g, <strong>and</strong> Their Interaction with Adult Labor: Empirical Evidence for Peru <strong>and</strong>Pakistan”, World Bank Economic Review, 14(2), 347-67.Sen, A.K. (1976), “<strong>Poverty</strong>: An Ord<strong>in</strong>al Approach to Measurement”, Econometrica, 44(2), p.219-231.Simatupang, Pantjar, I Wayan Rusastra <strong>and</strong> Muh. Maulana (2004), “How to solve supply bottleneck <strong>in</strong> agricultural sector”,paper presented at the Thematic Workshop on Agriculture, “Agriculture Policy for the Future”, 12-13 February,BAPPENAS, FAO, UNDP, <strong>and</strong> UNSFIR, Jakarta.Skoufias, E. (2000), “Changes <strong>in</strong> Household Welfare, <strong>Poverty</strong> <strong>and</strong> Inequality dur<strong>in</strong>g the Crisis”, Bullet<strong>in</strong> of <strong>Indonesia</strong>nEconomic Studies, 36 (August), p.97-114.Sparrow, Robert (2003), “The JPS Scholarship Program”, SMERU News, No.6, April-Juni, Jakarta: SMERU.Sumarto, Sudarno, Asep Suryahadi <strong>and</strong> W<strong>in</strong>efrida Widyanti (2001), “Designs <strong>and</strong> Implementation of the <strong>Indonesia</strong>n<strong>Social</strong> <strong>Safety</strong> <strong>Net</strong> Programs: Evidence from the JPS Module <strong>in</strong> the 1999 Susenas”, Work<strong>in</strong>g Paper, <strong>Social</strong> Monitor<strong>in</strong>g <strong>and</strong>Early Response Unit (SMERU), Jakarta.Suryahadi, Asep., Y. Suharso, <strong>and</strong> Sumarto Sudarno (1999), “Coverage <strong>and</strong> Target<strong>in</strong>g <strong>in</strong> the <strong>Social</strong> <strong>Safety</strong> <strong>Net</strong> Programs:Evidence from 100 Village Survey”, research work<strong>in</strong>g paper, <strong>Social</strong> Monitor<strong>in</strong>g <strong>and</strong> Early Response Unit (SMERU),World Bank/AusAID/ASEM/USAID project, Jakarta.Suryahadi, Asep., Sumarto. Sumarto, Y. Suharso, <strong>and</strong> L. Pritchett (2000), “The Evolution of <strong>Poverty</strong> dur<strong>in</strong>g the Crisis <strong>in</strong><strong>Indonesia</strong>, 1996 to 1999”, report, <strong>Social</strong> Monitor<strong>in</strong>g <strong>and</strong> Early Response Unit (SMERU), Jakarta.Suryahadi, Asep, Wenefrida Widyanti, Daniel Perwira, Sudarno Sumarto, dan Chris Elbers (2003a), “Develop<strong>in</strong>g a<strong>Poverty</strong> Map for <strong>Indonesia</strong>: An Initiatory Work <strong>in</strong> Three Prov<strong>in</strong>ces”, Part I: Technical Report, SMERU Research Report,May, Jakarta: <strong>Social</strong> Monitor<strong>in</strong>g <strong>and</strong> Early Response Unit (SMERU).Suryahadi, Asep, et al (2003), “Develop<strong>in</strong>g a <strong>Poverty</strong> Map for <strong>Indonesia</strong>: An Initiatory Work <strong>in</strong> Three Prov<strong>in</strong>ces”, Part III:Field Verification, May, Jakarta: <strong>Social</strong> Monitor<strong>in</strong>g <strong>and</strong> Early Response Unit (SMERU).Tabor, S.R. <strong>and</strong> M.H. Sawit (1999), “The OPK Program: Economy-wide Impacts”, report for the State M<strong>in</strong>istry for Food<strong>and</strong> Horticulture, Economic Management Services International, September, Jakarta.
Tambunan, Tulus (2002), “Pertumbuhan dan Perubahan Struktur Ekonomi <strong>Indonesia</strong> (Growth <strong>and</strong> Structural Change of<strong>Indonesia</strong>n Economy), Paper, February, Jakarta: LP3E-Kad<strong>in</strong> <strong>Indonesia</strong>.Townsend, P. (1962), “The Mean<strong>in</strong>g of <strong>Poverty</strong>”, The British Journal of Sociology, XII (1).Tzannatos, Z. (2003), “Child Labor <strong>and</strong> School Enrollment <strong>in</strong> Thail<strong>and</strong> <strong>in</strong> the 1990s”, Economics of Education Review, 22,p.523-36.UNSFIR (1999), “The <strong>Social</strong> Implications of the <strong>Indonesia</strong>n Economic Crisis: Perceptions <strong>and</strong> Policy”, April, Jakarta.Wahba, J. (2002), “The Influence of Market Wages <strong>and</strong> Parental History on Child Labor <strong>and</strong> School<strong>in</strong>g <strong>in</strong> Egypt”,Work<strong>in</strong>g Paper, Department of Economics, University of Southhampton.Woo, W.T., B. Glassburner <strong>and</strong> A. Nasution (1994), “Macroeconomic Policies, Crises, <strong>and</strong> Long-Term Growth <strong>in</strong><strong>Indonesia</strong>, 1965-90”, A World Bank Comparative Macroeconomic Studies, Wash<strong>in</strong>gton, D.C.: World Bank.World Bank (1980), “<strong>Poverty</strong> <strong>and</strong> Basic Needs”, Development Policy Staff Paper, Wash<strong>in</strong>gton, D.C.World Bank (1990), World Development Report: <strong>Poverty</strong>, Oxford University PressWorld Bank (1991), <strong>Poverty</strong> Reduction. <strong>Poverty</strong> Reduction H<strong>and</strong>book <strong>and</strong> Operational Directive, Oxford University Press.World Bank (1993) The East Asian Miracle: Economic Growth <strong>and</strong> Public Policy, New York: Oxford University Press.World Bank (2000a), “<strong>Indonesia</strong>: A Macroeconomic Update”, January, Jakarta.World Bank (2000b), “Health Strategy <strong>in</strong> a Post-Crisis, Decentraliz<strong>in</strong>g <strong>Indonesia</strong>”, Report No.21319-IND, HumanDevelopment Sector Unit, East Asia <strong>and</strong> Pacific Region, Wash<strong>in</strong>gton, D.C.: World Bank.World Bank (2001a), World Development Report 2000/2001, Oxford: Oxford University Press.World Bank (2001b), “<strong>Poverty</strong> Reduction <strong>in</strong> <strong>Indonesia</strong>: Construct<strong>in</strong>g a New Strategy”, Jakarta. .