Explaining Growth Country Report: Romania (1990-2000) - Global ...
Explaining Growth Country Report: Romania (1990-2000) - Global ...
Explaining Growth Country Report: Romania (1990-2000) - Global ...

You also want an ePaper? Increase the reach of your titles
YUMPU automatically turns print PDFs into web optimized ePapers that Google loves.
GLOBAL RESEARCH PROJECT<strong>Explaining</strong> <strong>Growth</strong><strong>Country</strong> <strong>Report</strong>: <strong>Romania</strong> (<strong>1990</strong>-<strong>2000</strong>)Mircea T. Maniu, Ella Kallai, Dana PopaABSTRACTThe objective of this paper is to explain the development and growth of the <strong>Romania</strong>neconomy both during the transitional period following the fall of the communist regimein 1989 and within a broader historical context. We try to accomplish this by linkinggrowth to three main historical sequences. Section 1 and Section 2 analyze the post-warperiod and the extensive phase of socialist growth (1945-1975) followed by the intensivedevelopment of the later communist period (1976-1989). We do this in order to identifythe main inherited features that had to be taken into account as initial conditions anddeterminants of the transition process. Section 3 provides a comprehensive view of thetransition decade (<strong>1990</strong>-<strong>2000</strong>) in terms of political background, economic policy andeconomic performance. Section 4 identifies and quantifies the trigger factors behindgrowth. Using methods of growth accounting, we point to the sectors and industriescapable of being the driving forces of sustainable economic growth in the short andmedium term. Within this analysis we will also quantify the impact of domestic policiesthat have been applied over the last decade to different sectors of the economy. Finally,Section 5 presents the main conclusions that we see as relevant for the current outlookand prospects of the <strong>Romania</strong>n economy.JEL Classification: O11, O17, O47, O52, P21, P26, and P27Key Words: <strong>Growth</strong>, Transition, Sectors, and TFP1
ContentsINTRODUCTION............................................................................................................. 41. EXTENSIVE DEVELOPMENT PHASE (1945-1975).............................................. 52. INITIAL CONDITIONS (1976-1989)...................................................................... 122.1 POLITICAL AND POLITICALLY GENERATED FACTORS ................................................ 142.2 DEMOGRAPHY AND SOCIAL ISSUES........................................................................... 152.3 OUTPUT AND INVESTMENT....................................................................................... 172.4 FOREIGN DEBT ......................................................................................................... 193. ROMANIA IN TRANSITION (<strong>1990</strong>-<strong>2000</strong>).............................................................. 203.1 POLITICAL BACKGROUND................................................................................ 203.2 COUNTRY SPECIFIC FACTORS ................................................................................... 243.2.1 Natural resources........................................................................................... 243.2.2 Population and labour market...................................................................... 253.2.3 Regional issues................................................................................................ 353.2.4 Legislation and judicial statistics.................................................................. 363.3 ECONOMIC POLICY DURING TRANSITION ................................................................. 393.3.1 Political economy ........................................................................................... 403.3.2 Structure of the economy .............................................................................. 443.2.3 Capital flows and foreign debt...................................................................... 463.3.4 Foreign reserves and the exchange rate....................................................... 473.4 ECONOMIC PERFORMANCE....................................................................................... 503.5 SECTORAL DEVELOPMENT........................................................................................ 593.5.1 Agriculture...................................................................................................... 603.5.2 Manufacturing................................................................................................ 613.5.3 Transport and telecommunications.............................................................. 633.5.4 Financial services ........................................................................................... 653.5.5 Trade and the external sector ....................................................................... 684. ROMANIA <strong>2000</strong>: GROWTH AND DEVELOPMENT PERSPECTIVES ........... 734.1 INCOME AND GROWTH ATTAINMENTS ...................................................................... 744.2 THE ACCURACY OF THE AVAILABLE DATA ............................................................... 774.2.1. Is the output loss as deep as the figures show it? ....................................... 772
4.2.2. The effects of the unregistered economy on output growth path ............. 794.3 RESOURCE REALLOCATION VERSUS INPUT ACCUMULATION..................................... 804.3.1 Structural changes ......................................................................................... 814.3.1.1 Production structure............................................................................... 814.3.1.2 Ownership Structure .............................................................................. 824.3.2 Are structural changes favourable to growth? ........................................... 864.4 THE ACCUMULATION PROCESS ................................................................................. 884.5 GROWTH ACCOUNTING............................................................................................. 924.6. INPUT ACCUMULATION V PRODUCTIVITY GROWTH - SUMMARY OF RESULTS........... 934.7 CAPITAL EFFICIENCY VERSUS INVESTMENT RATE..................................................... 985. CONCLUDING REMARKS ................................................................................... 101REFERENCES ................................................................................................................ 103APPENDIX 1: NATIONAL INCOME EVOLUTION IN CENTRAL AND EASTERN EUROPE ANDUSSR) ......................................................................................................................... 108APPENDIX 2: OUTPUT, INVESTMENT AND FOREIGN TRADE IN CENTRAL AND EASTERNEUROPE AND USSR ..................................................................................................... 109APPENDIX 3: THE CONCEPTUAL FRAMEWORK OF GROWTH ACCOUNTING..................... 110ASSUMPTIONS............................................................................................................ 110APPENDIX 4: DATABASE DESCRIPTION......................................................................... 115APPENDIX 5: CAPITAL, LABOUR AND TFP SHARES IN OUTPUT GROWTH..................... 1163
INTRODUCTIONIn the first pages of his 1937 book Prosperity and Depression 1 ,Gottfried von Haberlercontrasted the idea of less developed countries as opposed to the developed WesternEuropean model through an illustration. He used two countries that were comparable, interms of economic performance at that time, <strong>Romania</strong> and New Zealand. Evidently, theworld has changed a lot since those days. Both countries have evolved according tocompletely different patterns, developed specifically and eventually evolving into clearexamples of the assets and liabilities that characterised the two major political andeconomic systems that confronted each other during most of the 20th century: capitalismand socialism.Most observers of the contemporary <strong>Romania</strong>n situation since 1989 agree on the fact thatthe country has peculiarities setting it apart from the other Central and Eastern Europeancountries. This fact has shaped <strong>Romania</strong>’s evolution both positively and negatively, andthough the country is not a transition ‘case’ of its own, a decent impression can only besketched by combining within a coherent analysis several broader assumptions andcontexts. Such essential issues to be accounted for are <strong>Romania</strong>’s modern history, thespecificity of domestic communism during the 70’s and 80’s, particular strategiesadopted for modernisation prior to 1989, and the puzzling transition course followed bythe country during the democratisation process and establishment of a free market in the<strong>1990</strong>s.However difficult such an approach might be, it should nonetheless be undertakenbecause beyond the observable “institutional mimesis” currently dragging all Europeancountries in transition towards the European Union’s structures 2 , in the case of <strong>Romania</strong>1 See Gottfried von Habereler, Prosperity and Depression; a theoretical analysis of cyclical movements,League of Nations, Geneva, 1937.2 Interesting enough to notice that recent polls, both domestic and EU based, place <strong>Romania</strong> as the mostenthusiastic country among the accession group as opposed to those countries with much better prospectsfor early joining. The latest available, TNS Factum Poll conducted in 11 countries in September 2001indicates a 81% pro EU rate in <strong>Romania</strong>, compared to 63% in Slovenia, 60% in Hungary, 49% in Poland oronly 38% in Estonia. This outcome could be assessed from a dual perspective: the emotional one, specific4
we are dealing with a large country by regional standards. It is second only to Polandamong the former communist satellites, generously endowed with natural resources 3 ,possessing a large stock of skilled labour and having a reasonably large market potential.1. EXTENSIVE DEVELOPMENT PHASE (1945-1975)Modern <strong>Romania</strong> was created in 1918 when several provinces inhabited by a <strong>Romania</strong>nmajority, notably Transylvania, Bessarabia and Bukovina, joined the Old Kingdom of<strong>Romania</strong>. Since the latter's independence in 1877, the country undertook a rapid programof “Europeanisation” and development, both in terms of the economy and socialstructure. During the 1920s and 1930s the <strong>Romania</strong> saw an accelerated process ofindustrialisation (with a leading oil industry) and modernisation of its infrastructure. Withan increased territorial, demographic and economic potential (more than doubled), thecountry gradually transformed itself into a capitalist economy essentially similar to thecountries of Central Europe. 4The Constitution of 1923 created the basis for almost two decades of interwar democracy,and facilitated economic growth to the extent that by 1938, the peak pre-World War Twoyear, income per capita amounted to USD 76 (comparable to Greece – USD 80, or nearbyPoland – USD 104). This was still only one third of the USD 222 European average and afraction of the USD 521 income I the United States (Dobre, 1996:138). The inter-warprogress made by <strong>Romania</strong> has been seen in Western Europe as an “interestingevolution” (Saizu, Tacu, 1997: 87-89) especially when compared with neighbouringcountries that remained to a larger extent agricultural. In 1934 the English historian R. W.Seton-Watson wrote that “two generations of peace and clean government might make ofto a Latin country on the one hand, the factual one, derived from the lack of information about specificnegative consequences of joining, on the other hand.3 IMF’s World Economic Outlook <strong>2000</strong>, Focus on Transition Economies considers that only Poland and<strong>Romania</strong> are moderately (!) endowed with natural resources, all the rest of the transition countries beingpoor in this respect; this is only one of the seven factors to be considered as “initial conditions”, the othersix being: share of industry, liberalization index, repressed inflation, black market premium, PPP computedGDP and CMEA participation (IMF World Economic Outlook <strong>2000</strong>, Washington DC, <strong>2000</strong>, p. 115).4 A comprehensive description of the issue of the 20s and 30s as seen from a <strong>Romania</strong>n economicprospective, in Nicolae Paun, Stat si economie, <strong>Romania</strong> in perioada interbelica (State and Economy,<strong>Romania</strong> in the Inter-War Period), Editura Interferente, Cluj-Napoca, 1992.5
<strong>Romania</strong> an earthy paradise.” 5 Unfortunately neither peace nor clean governmentfollowed. All the progress of the inter-war years’ came to a halt during the Second WorldWar and the early years of the communist regime.When dealing with the issue of growth during the 1920s, 1930s and even later, oneshould also account for the different levels of development inherited in the regions of<strong>Romania</strong>. If the South (Wallachia) primarily owed its progress to oil and extensiveagriculture, North-western <strong>Romania</strong> (Transylvania) was the most industrialised and,accordingly compatible to a greater extent with Western European production andmanagerial frameworks. 6 This was a heavily debated topic during the communist regime,and even more so after the regime’s collapse, due to several kinds of affirmative actionsin economic policy that favoured eastern <strong>Romania</strong> (Moldavia).***The burden of war was particularly heavy on <strong>Romania</strong>, this being paradoxically due to itsnatural gifts, oil and agricultural potential, that were needed by both warring sides. At theend of the war, though being the fourth contributor among the Allied Nations in terms ofhuman and material effort (Muresan, 1995:10-16), <strong>Romania</strong> was to a large extentmaterially and structurally destroyed. The oil output in 1944 (3.3 million tons) was onlyhalf its pre-war total, railroad infrastructure represented only 30% of the previousnetwork, agricultural output amounted to about half the average pre-war output andsumming up, the income per capita halved during the period 1939 to 1945 (Manescu,1984: 254).During the war almost 1 million people lost their lives, became Prisoners of War inUSSR or simply disappeared. The material burden for <strong>Romania</strong> was estimated to amountto a heavy USD 3.7 billion (at 1938 currency rates). The toll taken by the war was5 R. W. Seton-Watson, A History of the <strong>Romania</strong>ns, Cambridge University Press, 1934, p. 554.6 A regional view of the assets brought to <strong>Romania</strong> when Transylvania joined it, in Industria si bogatiilenaturale din Ardeal si Banat (Industry and Natural Wealth in Transylvania and Banat), Tipografia CarteaRomaneasca, Cluj, 1927.6
compounded by huge war reparations imposed by the Peace Treaty 7 and significantterritorial losses. In addition to this, and beyond the human and material cost, the politicaldisaster that resulted from the inclusion of <strong>Romania</strong> in the Soviet sphere of influence,with the same, if not worse, consequences for almost half century as seen in Central andEastern Europe as a whole.Communism had practically no domestic political support apart from the Soviet tanks, ifone might say so, present in early post war <strong>Romania</strong>. Thus, in order to create a socialistform of society, several crucial anti-capitalist laws were enforced: land reform in 1945,the monetary law of 1947 and, especially, the switch towards national ownership of thecapital means of production (1948). This last measure ensured that at the end of 1948three quarters of <strong>Romania</strong>n industry and 100% of the transport and telecommunicationsystems were owned by the State. Foreign trade became a state monopoly in 1949 andwas soon followed by the nationalisation of small and medium enterprises. Thedestruction of <strong>Romania</strong>’s interwar economy was accomplished when a Soviet-modelplanning body was empowered to regulate all the aspects of economic life.The story of the <strong>Romania</strong>n five-year plans 8 (cincinale) is similar to that of the five-yearplans imposed in all the countries of the region that came under Soviet influence. It isabout forced, artificial industrialisation for the sake of industrialisation as such, that is,the creation of an industry able to manufacture the means of production. The sacrificedindustrial area was the sector responsible for the production of consumer goods to theextent that it had developed during the period of industrial growth between the two worldwars. If we add the fact that socialist industry was conceived in terms of manpower at theexpense of agriculture we can account for the imposition of a decreasing standard ofliving for most citizens. Actually this was a deliberate political tool, more evident duringthe first years, when the memories of pre-war capitalism had to be destroyed and less7 The total of compensations, which went exclusively to USSR, totaled over USD 300 million (1938currency) and were scheduled for 6 years delivery; at that time <strong>Romania</strong>’s GDP was estimated to beslightly in excess of USD 500 million.8 The first Soviet type five-year plan was 1951- 1955; when the communism collapsed in 1989, it wasduring the eighth five years plan, 1986 – <strong>1990</strong>.7
evident during the last decades of communism when prestige considerations becameimportant in the face of an ever more opulent West.<strong>Romania</strong>n socialism evolved in two distinct sequences. From the early post-war perioduntil the early and mid 1970s it evolved as naturally as was feasible due to politicalcircumstances. Under Ceausescu it then switched to the most unnatural approachpossible; it became more and more alienated from both available reference systems,European socialism (including the Soviet model seen during glasnost and perestroika)and European and world capitalism. The only possible benchmark for <strong>Romania</strong>’sevolution from the mid 70s to the late 80s could be, in our opinion, the perverted byfanaticism communism seen in East Asia.The first years of communism could be branded as typical Stalinist years. The onlyEuropean socialist country not to have any borders with capitalist countries, <strong>Romania</strong>was still an occupied country. Soviet troops were not stationed for the purpose of facingexternal enemies, but rather to secure the stability for an extremely unpopular regime andto stand guard during the looting of the country under the name of war reparations.Special joint ventures, the so-called Sovroms, once established, were responsible for theshipment of as many valuables as possible to USSR. Formally it was a barter trade, butthe overvalued price of Soviet goods compared to <strong>Romania</strong>n commodities ensured thatthe system was essentially a rip-off. Moreover, the USSR badly wanted and tried toimpose during mid and late 50s some sort of international division of labour thatrepresented the internationalisation of the regional development frame applied within theSoviet Union from the early 30s.This attempt to segregate socialist countries into industrial and agricultural ones, whichsuited Soviet interests while going against the very communist principle of selfdetermination,was the triggering element for <strong>Romania</strong>’s first moves towards relativeindependence in the early 60s. 99 The so called Valev plan assigned industry as main economic sector for European communist countriesNorth of Hungary and agriculture for those South of it; <strong>Romania</strong> falling within the Southern tier, was8
The second factor in this process is very specific and consists in the accession to power in1965 of Nicolae Ceausescu as First Secretary of the <strong>Romania</strong>n Communist Party (RCP).He was a less educated communist activist, though quite intelligent in an overallassessment and evidently bore anti-Soviet resentments and consequently pursued a policythat was first branded as “national communism”. However, due to its main feature ofanti-Sovietism, this kind of specificity was highly popular during mid 60s for a numberof reasons. When <strong>Romania</strong> refused to join the invasion of reformist Czechoslovakia,along with the rest of the Warsaw Pact countries in the summer of 1968, <strong>Romania</strong>nnational communism double was demonstrated for the first time (and as it was soon to beproven, for the last) in its history. The regime received popular support for this policyand, even more importantly, was henceforth perceived internationally as the maverick inthe Soviet camp, worthy of support as a means to weaken the system as a whole.1968 inaugurated almost a decade of erratic practice in terms of economic policy in<strong>Romania</strong>. The regime's perceived independence 10 triggered an inflow of foreign money.Since the domestic laws, deeply rooted in the communist doctrine, did not favour foreigndirect investment, money was lent to the <strong>Romania</strong>n government in order to buy Westerntechnology in order to escape a Soviet monopoly in several critical areas. 11 The schemecontinued for almost a decade.obviously supposed to abandon its industrialization plans and concentrate on agriculture; another issue thatallowed a more independent position towards USSR was the fact that Soviet occupation troops were pulledout of <strong>Romania</strong> in 1958.10 <strong>Romania</strong> was the first communist country to establish diplomatic links with the Federal Republic ofGermany in 1967; it was also the only communist country that did not break diplomatic ties with Israelfollowing the Six Days War; it was also host for the first American presidential visit behind the IronCurtain, when Richard Nixon came in 1969; this country was the first Warsaw Pact state to enter GATT(1971), the World Bank and International Monetary Fund (1972); it was granted European CommunityTrading preferences (1973) and US Most Favored Nation status (1975); <strong>Romania</strong> maintained very goodpolitical and trade relations with China, a country ostracized at the time by most communist countries; nonalignedcountries, such as Yugoslavia, were considered natural allies of <strong>Romania</strong>, all these being assesseddomestically and abroad as anti-Soviet actions above all.11 For instance, Western equipment allowed <strong>Romania</strong> to develop a competitive weapon industry. During the80s the country became one of the most important suppliers of conventional weaponry for the developingcountries, this against the evident displeasure of USSR. Top industries such as airplane enginesmanufacturing (along with Rolls-Royce) or military jet aircraft building (a <strong>Romania</strong>n - Yugoslav jointventure) were established. <strong>Romania</strong> was the only communist country to escape Soviet monopoly inproducing nuclear energy; the Canadian designed, financed and built reactors (including heavy waterfacilities) are now the only safe installations by Western standards in all over the former communist9
<strong>Romania</strong>n industry benefited most from these funds, though agriculture was also helped.In the early and mid 70s the outlook of the economy was reasonably optimistic. Ties withthe developed countries were stronger than ever and the markets of the developingcountries also seemed fully open to <strong>Romania</strong>n industrial commodities. This wasimportant given the search for hard currency to pay for raw materials and compensate thealready increasing foreign debt generated by the import of Western technology. Morethan 50% of the working force was in the industrial sector and the same figure for theagricultural sector decreased to less than 30%.Two factors undermined this positive trend after from mid 70s. The first was exogenousand relates to the impact of the oil crisis. Being a traditional oil producer, but withdrastically reduced domestic outputs, <strong>Romania</strong> acted offensively towards the MiddleEastern producers (especially in doing business with Iran and Iraq) during the early 70s,and created an extensive domestic refining capacity. In total this was three times thedomestic oil output level (at that time of approximately 10 million tons), the capacitydesigned for processing and re-exporting oil products all over the world. The oil crisis hit<strong>Romania</strong> exclusively among the communist countries as the others were insulated bypreferential CMEA-type subsidised prices. These were not available for <strong>Romania</strong> due tothe evident political constraints.The second factor, the endogenous one, became more and more evident with time and hiteven harder. It was a purely political factor but with huge and eventually disastrouseconomic consequences. This can be described as a return to a Stalinist approach to themanagement of the economy and society due to the progressive alienation of the topleadership of the <strong>Romania</strong>n Communist Party. The cult of the personality of NicolaeCeausescu started soon after several visits to China and North Korea and was rooted onfertile soil. Soon the basics of business and economics were replaced by self-imposedwill, rationality by voluntarism, and common sense by impulsive decisions. No othersystem. Automobile companies such as Renault, Citroen and MAN also started manufacturing cars andtrucks in <strong>Romania</strong>.10
European country experienced this kind of nightmare. In conjunction with thesedevelopments the Western World acknowledged its strategic political mistake towards<strong>Romania</strong> and took steps accordingly. A political blockade emerged and all sorts ofeconomic liabilities followed.These two factors were the most important in terms of the exogenous and endogenouscauses that underlay <strong>Romania</strong>'s idiosyncratic course after the mid 70s, though not theonly ones. The aggregate effect of these developments had a devastating effect on the<strong>Romania</strong>n economy (and society as a whole) during the 80s. Another new feature,uncommon to any rationally managed economy during peacetime, was the extent ofautarchic economic policy. A secondary feature of <strong>Romania</strong>’s alienated economics mightbe described as the propensities to start enormous projects and pyramid likemonuments. 12 These infra-structural investments 13 deprived the country of its very lastresources.During a time when other economies became more and more integrated, regardless of theideology they reflected, <strong>Romania</strong> became insulated from both the socialist and capitalistsides. The attempt to disguise the absence of partnership with foreign countries by anattempt at manufacturing all the necessities of a fairly big market resulted in huge costs, amajor misallocation of resources and a general pattern of industry first, agriculturesecond 14 followed lastly by trade and other sectors of activity.12 Well known all over the world are the People’s Palace in Bucharest, the largest building in Europe andsecond largest only to the Pentagon on Earth – this building could hold 500.000 people; the Danube-BlackSea Channel, the re-modeling of Bucharest, huge heavy equipment plants in all major cities, someenormous oil refineries, an extremely costly nuclear program, etc. The planned (fortunately notaccomplished) “systematization” of about half of the 13.000 villages in <strong>Romania</strong> into 558 agro-towns wasconcocted in order to destroy what was left of peasantry traditions.13 If back in 1986 32% of the national income was accumulated, the vicious circle the <strong>Romania</strong>n economyentered through infra-structural madness reduced the same the figure for 1989 to 18.7, only half of it beingactually net investment (Statistical Yearbook of <strong>Romania</strong>, <strong>1990</strong>, Bucharest, <strong>1990</strong>, p. 240).14 Between the mid and late 80’s <strong>Romania</strong>n agriculture was an export driven one: the huge cereal (mostlywheat) output deficit in USSR allowed an important barter trade, reminding the war compensations of thelate 40s and early 50s; though CMEA did not play an important trading role, USSR was the largest partner,absorbing 22.6 of the <strong>Romania</strong>n exports.11
Though statistics indicate that in 1989 <strong>Romania</strong> had foreign trade with 59 internationalpartners, the bulk of it went to less competitive, technologically backward markets. The<strong>Romania</strong>n economy by this time was on course for self-sufficiency, regardless of thecosts and the overall lack of efficiency. This absurd economic approach, along with thepursuit of large-scale projects and the ultimate self inflicted pain, the forced repayment ofthe foreign debt, caused extreme economic strain on the population and paved the groundfor the overthrow of the regime in December 1989.2. INITIAL CONDITIONS (1976-1989)When analysing the initial conditions for economic growth after 1989, or the socialistintensive development phase, at least two methodological aspects should be clarified. Thefirst concerns the time scale required for a balanced analysis. The second concerns theaccuracy of statistical data, both before 1989 and after.Many foreign sources in the area (Blanchard 1997; Diamond 1995; OECD 1998) arguethat explanations should start with the distinguishing features of Ceauşescu’s regimeduring late 80s. <strong>Romania</strong>n sources (Daianu 1997; Daianu <strong>2000</strong>a; Negucioiu 1999)underline the necessity of going back at least a decade and point to the fact that in thecase of <strong>Romania</strong> the relevant processes occurred in the late seventies and early 80s. Inthis sense the alienated economy and society of the late 80s was only the visible peak ofthe iceberg as seen from the West. Within this paper we evidently favour this lastopinion.The falseness of <strong>Romania</strong>n communist statistics has been depicted both as humorous andtragic. After 1989 Western statistical methodology 15 was adopted and much of thecommunist era data was re-interpreted. Studying the available figures, it is simply thebest option to take into consideration the pre-1989 data as it becomes available, becauseno relevant mechanism of computing the presumed intentional error has been devised.Therefore, taking into consideration the fact that both <strong>Romania</strong>n and international sources15 The Western National Accounts System replaced the CMEA wide used Material Production System.12
point to a descent of the traditionally ascending, communist style, indicators (Maniu,1998:193; OECD, 1993:10-13), we simply must assume the presumed errors asacceptable. (Appendix 1) Actually, by comparing sources of data published before 1989(Manescu, 1984; Negucioiu, 1987) with sources published after 1989 (Constantinescu,1992; Iliescu 1997) we cannot sustain a substantial rejection of the pre-1989 data.It must be also stressed that the initial constraints, including the distortions induced bydeliberately falsified statistics, had a significant impact on the accuracy of forecastingduring the early stage of transition. 16 This consequently triggered a change within theforecasting horizons: no relevant Cartesian-like statement was to be issued during theearly and mid 90s. <strong>Romania</strong>n economic assessments became much more descriptiveduring this decade. The reign of the 'figure' was once again present front-stage a coupleof years later along with EU accession benchmarks.***The extensive growth that fuelled the economy of the 60s and early 70s came to a haltafter the oil crisis. All over Central and Eastern Europe the problems of stagnatingindustries, declining output and accumulating foreign debt were highly visible. Many, ifnot all, of these countries responded with more or less partial liberalisation: economicincentives were introduced, rigid planning was dropped and de-centralisation occurred inseveral fields. Only <strong>Romania</strong> experienced a rather peculiar, erratic progression (Appendix1). The following section tries to investigate the most important issues of the communistheritage that shaped, through their cumulative impact effect, the outlook of the transitionprocess during the 90s.In our opinion there are four sets of issues concerning the initial conditions that properlyhighlight <strong>Romania</strong>’s transition towards a market economy. These would be: political and16 Until 1991-1992 an optimist view concerning transition was obvious all over CEE; the massiveliberalization undertaken during the first years, when the general outlook was still that of plannedeconomies, induced major macroeconomic disturbances. For instance <strong>Romania</strong>’s <strong>1990</strong> GDP was estimated13
politically generated factors; demographic and social factors; output and investmentfactors; the foreign debt issue.2.1 Political and politically generated factorsCeausescu’s regime managed to generate most of the bad publicity that was associatedwith <strong>Romania</strong>'s history in recent times. The myth of <strong>Romania</strong> as Dracula’s country wasapparent throughout the world media in the mid 80s. Tough domestic policy, therepression of basic human rights, and the explicit rupture with millennia old traditionswere the features of the last European Stalinist regime. Obviously enough, some issueswere exaggerated abroad in order to paint a blacker picture of Ceausescu. The bloodyRevolution of December 1989 also damaged the public image of a country badly in needof investment and growth. Immediately after the fall of communism the new regime wasagain perceived both internally and abroad as a softened extension of the formerdictatorship, a product of the country's relative poverty and collective social mentality.The cumulative effect of all these factors was a heavy burden faced by the entire societyduring the late 80s and in the early transition years. The international perception of<strong>Romania</strong>n realities, a vital factor for development, was heavily distorted. Not a singlecountry out of the Central and Eastern European transition group could have madesuccessful progress on its own without at least a reasonable level of foreign aid, and<strong>Romania</strong> also lost the opportunity to project a convincing image on the internationalcapital markets.A very important <strong>Romania</strong>n feature that generated the lack of interest and investmentincentives derived from the extensive state ownership of essentially all the relevantproductive capacity. Property and wealth that theoretically belonged to the whole nationin fact practically belonged to nobody. It was taken care of accordingly. This, amongother things, created a huge deficit within the specific institutions. The institutionalfragility was to be replaced by more and more rigid planning. The lack of property andanywhere between USD 30 and 42 bn – See: Statistical Yearbook <strong>Romania</strong> 1991, Bucharest, 1991; TheEIU <strong>Country</strong> <strong>Report</strong>, <strong>Romania</strong>, London, 1992; Coopers and Lybrands, LaRoumanie, oui!, Bucuresti, 1995.14
elated institutional structures induced a strong sentiment of alienation of a workforcethat was to be manifested more clearly in the future.Even more important was the fact that the legacy of the most orthodox communist regimein Europe consisted, among other things, of a deliberately induced lack of experienceamong the population concerning the basics of market economy. Despite the fact thatliberal measures were undertaken all over the communist world in the early 70s 17 , quitethe opposite happened in <strong>Romania</strong>. Though not rooted in the country's history, the evil ofover-powerful state control of the economy and the whole society induced unnaturalbehaviour (Schopflin, 1993: 16-34). State controlled media channels promotedpropaganda about the adoption of market reforms and related incentives as a source ofinflation, unemployment and unfair social polarisation for most citizens.What could be described as the major liability in this area, is the complete lack ofmarkets of many sorts, with the unfortunate exception of the unavoidable black market 18 .Rigid planning completely failed to provide an adequate tool for producing even the verybasics in <strong>Romania</strong>. During the late 80s, only 14% of the currency available in the markethad an equivalent in corresponding goods and services (Serbanescu, <strong>2000</strong>), and thisscarcity of goods and services induced a profound individual and social crisis. The maindamage that communism could (intentionally) do was to pervert human minds. Itsucceeded to a large extent.2.2 Demography and social issuesProbably the most significant self-induced benchmark for <strong>Romania</strong>n hyper-centralisationwas demographic policy. In 1980 <strong>Romania</strong> had a population of 22.2 million that had17 Reforms introducing the so called “goulash communism” started in Hungary in 1968; Yugoslavia alreadyexperimented self-management, Poland was also a rather liberal economy by communist standards. Though<strong>Romania</strong> formally adopted a so-called “New Economic Mechanism” in 1978, allegedly giving moredecision power to lower levels of the economy. This was by far a propaganda tool and did not manage butto fortify bureaucracy and central planning. The exclusion from the economic reform debate all over CEEtook later a heavy toll and resulted in a particularly deep transition shock.18 See footnote 3 - to notice “Black market premium” as an initial condition of transition; <strong>Romania</strong>’s indexis 728 while Poland’s is only 277.15
increased by one million ten years later to be followed by a decline immediately after. 19The amplitude of the increase can only be judged in connection with the halving 20 ofoutput and implicitly the standard of living: from USD 2446 per capita in 1980 GDP fellto USD 1257 in <strong>1990</strong> (OECD, 1993). Under these draconian conditions demographiclaws (comparable from a reversed perspective only to present day China) were enforced.Abortion was outlawed in 1966 and meagre incentives were provided for motherhood.The marriage age for women was legally reduced to 15 along with compulsory monthlymedical examinations of women of childbearing age. The real infant mortality rate rosedramatically. As a consequence births were only registered only after four weeks.The cynical, industrially patterned approach to demographics in a society deeply attachedto Christian values and traditions induced an unbridgeable gap between the elitecommunist leadership and common citizens. The increased number of the studentpopulation also generated a lowering of standards within an educational system that wastraditionally of reasonable quality. Vocational education was given priority during thisperiod.It is also a reality that notwithstanding the medieval demographic policy the healthsystem was overall better and the mortality index smaller than any previous time.Unfortunately, the country had its worse ever environmental record. Extensiveindustrialisation induced pollution levels that were particularly high by Europeanstandards.Some specialists emphasise the fact that the extent of the decline in standards of livingduring the 80s, if observed through an empirical rather than scientific lens, was not as bad19 The baby boom of the decade following the Decree on abortion were called, somehow pejoratively,Decretzei (the Decrees). As a fatality of history, the <strong>Romania</strong>n Revolution was mostly carried out byteenagers born in the late 60s and early 70s as consequence of the draconian demographic policy enforcedin <strong>Romania</strong>.20 World Bank estimates 1980 <strong>Romania</strong>’s GNP as USD 57,6 bn while the foreign trade reached 25.4 bn; adecade later these figures roughly halved.16
as appearances suggest: a fair PPP computation 21 would show a more than doubling ofGDP (see also Weidenfeld, 1997). Our assessment is that, when grounded exclusively onempirical domestic research, one could draw such a conclusion. But it should be addedthat a pertinent PPP investigation (as well as CPI basic research) was not conducted priorto early 90s.Though international travel was dramatically restricted some emigration 22 still occurredand, more importantly, the <strong>Romania</strong>n Diaspora started to play an offensive andcomprehensive political role in overthrowing the regime. Unfortunately, this involvementwas not replicated in terms of doing business and investing in <strong>Romania</strong> after the fall ofcommunism.2.3 Output and investmentOutput dramatically decreased during the 80s (Appendix 2) as a consequence of thediminishing share of the international market held by <strong>Romania</strong>. From a rate of growth of12.9% during early 70s to 9.5% during late 70s and to an average of 3.3% during the 80s,the industry shrank constantly along with exports. This led to a search for alternativesbeyond the domestic market as the issue of the balance of payment became critical. Theonly affordable solution emerging from the communist planners’ desks was the dramaticcompression of imports: virtually all the imports except raw materials were eliminated.<strong>Romania</strong>n exports were rapidly reduced with the exception of agricultural products toUSSR and 'dumping' types of exports (consumer goods and steel being the most notable<strong>Romania</strong>n exports at the time) traded for the sake of acquiring hard currency at any cost.The industrially manufactured goods of the 70s were no longer selling abroad. The touristtrade that flourished in the 70s also collapsed. By the late 1980s <strong>Romania</strong> had entered avirtually self-sustainable, semi-autarchic economic system.21 It is worth mentioning there is a not so grim view of the situation: IMF computed in terms of PPP percapita 1989 GDP as 5798, this generating a 1989 per capita income of 3470 (Poland 5150 – source as innote 3, p. 89 and 115).17
We should add that <strong>Romania</strong>n industry consisted of two distinct tiers: one grounded ondomestic and CMEA 23 technology and another grounded on Western technology, thislatter factor being the one that actually generated most of the foreign debt. These tierswere designed from scratch as respectively domestic and export bound. When technologyfrom the second tier became older 24 imports had already been reduced. In addition eventhe second tier soon lost competitiveness, including within the developing countriesmarket. All through the 80s a huge domestic potential for production and export was lost,in many cases due to the lack of some cheap imported replacements. Import policy wasso tight that it often offended common sense. Also, at that time, giant infra-structuralprojects guzzled most of the <strong>Romania</strong>n investment funds.Because zero unemployment was an untouchable dogma of the system, soft budgetconstraints were the norm rather than the exception. Production had to be sustained in theface of declining productivity by inputs into obsolete areas, such as manpower hungryfields such as metal and heavy industry, thermal energy and other related sectors.Applying this policy at a time when most of these sectors entered recession throughoutthe world eventually deepened the overall inefficiency of the <strong>Romania</strong>n economy,affecting even that sector where competitive advantage has been unchallenged for long,agriculture. Added to the above-mentioned factors, the propensity to export whateveragricultural output was exportable led to the near starvation of the <strong>Romania</strong>n people.Evident, irrational resource misallocation (Daianu, <strong>2000</strong>b) could be detected, not tomention the exclusively politically grounded regional and departmental allocations.22 It is common knowledge, though never properly documented, that the regime engineered a profitablebusiness: selling emigration permits to the country of destination, first to Israel in the 70s and then to WestGermany in the 80s.23 Only 3.7% of <strong>Romania</strong>’s GDP was CMEA related in 1989 (the figure is 8.4 for Poland) but since theshare of the industry within GDP was 59% it was mostly the Third World where <strong>Romania</strong>n industrialoutput was heading.24 During the 80s the <strong>Romania</strong>n stock of machinery was on average 20 to 30 years old (averageamortization period 21 years); for comparison the same stock was 13 years old in USSR and 6 years old inUSA; See in this respect Maria Muresan, Evolutii economice 1945 – <strong>1990</strong>, Editura Economica, Bucuresti,1995, pp. 94-95.18
2.4 Foreign debtSome economists would argue that despite everything, a major positive event of the late80s places <strong>Romania</strong> in a major league compared to its Central and East Europeancountries: the full reimbursement of the foreign debt (USD 10.2 billion in 1980 – zero in1988) within a decade. Actually <strong>Romania</strong> was the only example of this kind within anarea where massive borrowers (Poland, Hungary) did their best to postpone repayments.The country entered into democracy and the free market in January <strong>1990</strong> debtless andeven in the position of being an international borrower, 25 apparently a major asset.We share the view of those economists assessing the repayment of foreign debt as one ofthe major initial setbacks of transition in <strong>Romania</strong>. All the neighbouring countries(Hungary being the most notable case) obtained favourable terms for repayment and,moreover, trade incentives. These countries managed to channel the available investmentfor boosting the economy exactly to those export sensitive areas that took off after <strong>1990</strong>.Poland performed even better in convincing the Western lenders, through the Paris andLondon clubs, to act quickly.Obviously <strong>Romania</strong>, more exactly Ceausescu, committed a huge mistake in repaying (inadvance!) the country’s foreign debt. At the time this occurred, the country was squeezedby massively inefficient, dumping types of exports and nearing the bottom in terms ofimports (trade surpluses of USD 2.5 billion were the rule during late 80s, with an almostdouble figure peaking in 1988). Actually, from the mid 70s onwards negative tradebalances were the norm until the tendency was reversed in 1981. From then until 1989only positive trade balances occurred.In addition to the perception that <strong>Romania</strong> has gradually lost the geo-economicadvantages derived from being strategically placed at the trading crossroads of East (theMiddle East countries, Turkey, oil producers) and West (European Union), we have a25 <strong>Romania</strong>’s debtors were (and unfortunately still are) several developing countries; though diversereimbursement schemes were aggregated, the bulk of the credits (lowest estimation: USD 3bn.) were neverreturned into the country. Truly enough, Iraq owes the lion’s share and the internationally imposedembargo deprived <strong>Romania</strong> of the possibility to retrieve the fruit of its investment.19
more comprehensive view of the opportunities lost. The absence of foreign debt, a ratherunexpected situation for a country in this range and a situation that would appear to be anasset from a microeconomic perspective, in fact turns out to be a liability when judged, inthe context of early 90s, from a comparative macroeconomic standpoint.3. ROMANIA IN TRANSITION (<strong>1990</strong>-<strong>2000</strong>)This section intends to provide an overview of the developments in the <strong>Romania</strong>neconomy during the transition period (<strong>1990</strong>-<strong>2000</strong>). However, a mere descriptive analysisof the economic policies and results would undoubtedly be an oversimplification of theissue. The economic transition cannot be fully understood without linking it to severallinked factors. Thus, the political economy of transition was heavily influenced by thepolitical cycle, and the economic performance cannot be judged without a priorassessment of the country’s specific features (in terms of resources, population andlabour market, regional differences and developments in legislation). We approach thesecomplementary aspects (political background and country-specific factors) in turn andthus aim to provide additional explanatory value to the developments in economic policyand the trends in economic performance.3.1 Political background 26<strong>Romania</strong>n politics after 1989 presented a peculiar pattern of dislocation fromcommunism that proved to be considerably slower than in the neighbouring countries ofthe region. The explanations for this sluggishness can be traced to the distinguishingfeatures of Ceausescu’s regime in the late 80s as discussed in Section 2. The existence ofa highly developed and highly repressive state police (Securitate) hindered thedevelopment of a robust “underground” opposition that could have come out into thelight in the 90s with a coherent strategy for political and economic transformation.Instead, those who took power in December 1989 represented a mixture of “reformist”26 The material in Section 3 draws mainly on data provided by the <strong>Romania</strong>n National Institute of Statisticsand Economic Studies and Economic Studies (<strong>Romania</strong>n Statistical Yearbook: <strong>2000</strong>), the EconomistIntelligence Unit (<strong>Country</strong> <strong>Report</strong>/Profile-<strong>Romania</strong>: 1994-2001), IMF (International Financial Statistics<strong>2000</strong>) and EBRD (Transition <strong>Report</strong> <strong>2000</strong>)20
elites of the <strong>Romania</strong>n Communist Party and idealistic dissidents with little say ineconomic policy. Moreover, at the outset of transition, the country had no previousexperience whatsoever of democratic or economic reform during the socialist regime.The first democratic government, representing the National Salvation Front (NSF),dominated <strong>Romania</strong>n politics until 1992. During this interval the government followed analleged “social democrat” program that was addressed to a traumatised public lackingdemocratic experience and circumspect with regard to steep economic changes. TheNSF’s political and economic program relied heavily on populist promises of stabilityand gradual economic change. This message mostly appealed to industrial workers, statebureaucrats and managers of state owned enterprises most likely to be affected byeconomic reform and systematic restructuring. Moreover, some agricultural reforms(restitution of the land resulting from the dismantling of the Agricultural Production Cooperatives)secured support for the NSF in rural areas.By September 1992 the political scene had already become more animated. The numberof competing parties was booming (amounting to more than 250), as a backlash againstthe lack of previous democratic experience. Within this context of dissipated opposition,ideological confusion and fear of change that was still deeply rooted in the minds of<strong>Romania</strong>ns, it was not difficult for the Democratic National Salvation Front (formerNSF) to win the general elections for a second time. However, the centre-left governmentdepended on the parliamentary support of ultra-nationalist and neo-communist parties,which resulted in a further slowing down of the pace of reform internally and a damaginginternational image for <strong>Romania</strong>.Privatisation and restructuring were delayed, and their limited results have beenunconvincing. The government’s goals seemed to be oriented rather to ensure furtherelectoral support from the working class (the most likely to bear the social costs ofrestructuring) than towards medium and long-term macroeconomic stabilisation andgrowth of the <strong>Romania</strong>n economy. Cautious and in many respects contradictoryeconomic measures gave way to more serious attempts at macroeconomic stabilisationonly after 1994, a change mostly due to the contractual pressures induced by the21
international financial organisations. However, the positive results of these policies werelargely reversed by permissive economic policies adopted prior to the general elections ofNovember 1996.Following the electoral defeat of 1992, the opposition underwent a process of increasedaggregation. Two of the “historical” parties 27 , the National Liberal Party (NLP) and theNational Peasant Christian Democratic Party (NPCDP), collaborated with the HungarianDemocratic Union in <strong>Romania</strong> (HDUR)- the party representing the interests of<strong>Romania</strong>’s largest ethnic minority- and some smaller parties in an alliance named theDemocratic Convention (DC). The Convention, with its centre-right ideology, becamethe major political opposition force.In November 1996, for the first time in transitional <strong>Romania</strong>, the electorate transferredpolitical power from the hands of social democrats (mostly neo-communists) to centreright(mostly radical) reformists. Emil Constantinescu (an academic with no priorcommunist record) replaced President Ion Iliescu (a former communist with allegedradical views) in office. Arguably, the general elections of 1996 marked <strong>Romania</strong>’scomplete political break from communism and the conclusion of a democratisationprocess that had lasted longer than in its neighbouring countries.The new government followed a program of radical reforms aimed at the rapiddevelopment of a sustainable market economy. The governmental measures (again, tosome extent propelled by the need for international financing) included full liberalisationof prices, tightened monetary and fiscal policies and a partial liberalisation of theexchange regime. However, only limited results were achieved in the privatisation oflarge-scale enterprises and state owned banks. Moreover, this government also postponedthe drastic restructuring of many loss-making large enterprises.Partly due to the economic conditions inherited from the previous government and partlydue to the Convention’s own contradictory measures, output contracted and the27 Historical in the sense of continuing their pre-war tradition22
population did not experience the improvements in living standards promised in theelectoral campaign. As a result, the government’s popularity had decreased significantlyby the end of 1999. In November <strong>2000</strong>, in spite of macroeconomic improvements in aslowing down of inflation and output growth after three years of continuous contraction,population’s discontent with the government’s policies resulted in the dismissal of theDemocratic Convention in the general elections. The Party of Social Democracy in<strong>Romania</strong> (PSDR- the former NSDF), still ruled by Ion Iliescu, returned to power andmoved the political balance once again towards centre-left ideologies.The elections of <strong>2000</strong> brought about two extremely disturbing outcomes. Firstly, in thevoters’ preferences, the previous leading party, the Democratic Convention, was not ableto gather even the 10% minimum threshold needed for entering the Parliament. The onlycentre-right parties surviving the electoral process were the National Liberal Party(whose leaders decided to split from the Convention and run alone) and the HDUR.Secondly, the ultra-nationalistic Greater <strong>Romania</strong> Party (PRM), pleading for revisionistterritorial measures, armed war against corruption, public executions of “those guilty forthe country’s disaster” and the re-nationalisation of assets and companies, managed tobecome the second largest party in the Parliament with 28% of the votes.When analysing <strong>Romania</strong>n politics after 1989, one conclusion is obvious. During theentire decade the political arena has displayed the chronic inability of its main forces(President, government, opposition, trade unions and minorities) to agree on the timingand sequencing of economic and institutional reforms.As it will be shown in Section 3.3, economic policy has been largely influenced bypolitical constraints. The succession to power of social democrats that were arguablyformer communists (<strong>1990</strong>-1996), a centre-right coalition (1996-<strong>2000</strong>), and followedagain by social democrats (since <strong>2000</strong>) has also induced a succession of conflictingeconomic policies. This could be interpreted as a political cycle which has undoubtedlyinfluenced the economic performance of the country. A note of caution is in order,nevertheless. As was the case in every transitional country, each government coming to23
power had to set its own policy and make adjustments in accordance with the legacyinduced by the previous one and the “path dependency” generated by communistdevelopment. Therefore, the link between the political cycle and the economicperformance has displayed an obvious and systematic time lag.3.2 <strong>Country</strong> specific factorsWe analyse the country specific factors in terms of natural resources, population andlabour market, regional issues and legislation and judicial statistics 28 .3.2.1 Natural resources<strong>Romania</strong> is a medium sized country, with relief equally comprising plains, hills andmountains. Forests account for about 25% of the area, while farmland represents 40% ofthe surface. The temperate continental climate is suitable for growing cereals, vegetables,industrial plants, vines and orchards. Natural resources consist of oil (recently, newsources have been discovered in the Black Sea), coal, copper, zinc, bauxite, and variousother minerals.The resources of primary energy (both produced and imported) are decreasing (theyamounted to 40,360 thousand tonnes of oil equivalent in <strong>2000</strong>, as opposed to 51,275 in1997). Production decreased from 31,401 thousand tonnes in 1997 to 28,107 in <strong>2000</strong>,while the imports decreased more significantly from 17,928 in 1997 to 10,925 in 1999.1996, the year that registered the highest real GDP in the transition decade, alsoregistered the highest level of energy production (35,135 thousand tonnes) andconsumption (50,365 thousand tonnes). In per capita terms, energy consumption was1,628 tonnes oil equivalent, as opposed to 2,018 tonnes equivalent registered at the peaklevel of consumption in 1996.28 At this point, it is worth mentioning that the main source of data has been the National Institute ofStatistics and Economic Studies. However, at the time this article has been sent for printing, the data foryear <strong>2000</strong> were only estimates. In spite of some doubts related to the accuracy and the availability ofnational data, we considered it to reflect the economic reality of the country. Moreover, in the “<strong>Romania</strong>Staff <strong>Country</strong> <strong>Report</strong> – <strong>2000</strong>”, IMF’s representatives stated that “the quality and timeliness of statisticalreporting by <strong>Romania</strong> are generally good quality for surveillance and program monitoring” .24
3.2.2 Population and labour marketIn terms of its population, <strong>Romania</strong> is the second largest country in Central and EasternEurope, following Poland. However, the population has declined systematically since<strong>1990</strong> due to decreasing birth rates, increasing mortality and emigration (Table 1).Table 1: Population Statistics1989 <strong>1990</strong> 1991 1992 1993 1994 1995 1996 1997 1998 1999 <strong>2000</strong>Population(millions) 23.15 23.21 23.19 22.79 22.76 22.73 22.68 22.61 22.55 22.50 22.46 22.43Annualgrowth - 0.25 -0.09 -1.72 -0.13 -0.13 -0.22 -0.31 -0.27 -0.22 -0.18 -0.1(%)*Source: National Institute of Statistics and Economic Studies, *own calculationsThe regression of the demographic indicators is perceived as a result of growingeconomic uncertainty and hardship and massive emigration, particularly of the mainnational minorities (Hungarians – accounting for 7.1% of population and Germans –0.5%) and skilled labour. Moreover, one has to keep in mind that prior to 1989 fertility in<strong>Romania</strong> has been exaggerated by Ceausescu’s demographic policy, which bannedcontraception and abortion. The increased availability of contraception after 1989 haspermitted <strong>Romania</strong> to return to ‘natural’ rates of fertility which follow the decreasingtrend existing in the majority of European countries.In 1992, the natural increase of population (the difference between the live births anddeaths per thousand inhabitants) became for the first time negative 29 , reaching -0.2, andcontinued to decline every year, reaching an all-time low in 1996 (-2.5%).A comparative study of the age-specific fertility rates in 1994 and 1999 shows, onceagain, compliance with the European trends. Thus, in addition to the overall fertility ratedecreasing women also tend to postpone pregnancy. Live births for 1000 women between29 The available (and reliable) data in the Statistical Yearbook <strong>2000</strong> go back to 193025
15-24 years have diminished (from 164.3 in 1994 to 133.3 in 1999), while live births for1000 women between 25-34 years old have increased (from 104.4 to 114.9).According to the official statistics 30 of the years between 1994-1999, 114,422 <strong>Romania</strong>nsemigrated (surprisingly enough, women accounting for 53.5% of the emigrants, morethan the <strong>Romania</strong>n gender ratio). A total of 45,262 citizens returned to <strong>Romania</strong> duringthe same period (55.4% of these being men). The majority of the repatriated came fromthe Republic of Moldova. However, these statistics are questionable since reports ofillegal emigration would multiply the emigration figures at least two-fold 31 . Moreover,many of the “repatriated” Moldovans do not actually live in <strong>Romania</strong> (neither do theyintend to do so), but have requested “repatriation” (i.e <strong>Romania</strong>n citizenship) onlybecause visa requirements are less restrictive for <strong>Romania</strong>n citizens than they are forMoldovans 32 .A recent study of the “brain drain” in Eastern Europe between 1980 and <strong>2000</strong>(Georgescu, 2001) suggests that <strong>Romania</strong>n statistics clearly underestimate the actualnumber of emigrants 33 . The study assumes emigration to Germany between <strong>1990</strong>-1997 asconsisting of 260,000 citizens, this trend being eventually restrained by immigrationpolicies. The same source documents a number of 13,841 <strong>Romania</strong>n emigrants to Canada(in comparison to 7,858 recorded by the National Institute of Statistics and EconomicStudies for the same period). Similarly, for 1993, <strong>Romania</strong>n sources mention 1,078emigrants to the US, while the US Emigration Bureau recorded 2,932.The share of university graduates in the group of emigrants increased in the <strong>1990</strong>s(particularly after the general elections of 1992) and amounted to 11% according tonational data. Georgescu mentions the intense targeting of <strong>Romania</strong>n IT experts and30 <strong>Romania</strong>n Statistical Yearbook <strong>2000</strong>, own calculations31 Unofficial statistics in the media even mentioned 1,000,000 emigrants between <strong>1990</strong>-<strong>2000</strong>. However,these figures, not being supported by verifiable data, are at least as unreliable as the official statistics.32 Starting on 1 st of January 2002, the Visa restrictions for <strong>Romania</strong>ns have been lifted by the countriesbelonging to the Schengen agreement.33 Underestimation of labour migration is a feature shared to a large extent by other transitional countries aswell. However, this should not be considered as an inherent sign of unreliability of all statistical datacollected and reported by these countries.26
engineers, mainly by Germany and Canada. An unexplained significant loss in thenumber of medical graduates over the 90s could also be related to emigration. The authordocuments the active role played by transnational companies in recruiting <strong>Romania</strong>nexperts (Andersen Consulting announced in August 1997 that it intended to intensify itsrecruiting efforts in <strong>Romania</strong>), with dramatic effects for the <strong>Romania</strong>n economy. InOctober <strong>2000</strong>, Xinhua, a Chinese news service, reported that <strong>Romania</strong> will face a seriousshortage of information technology professionals in the coming decade due to its externalbrain drain.It is of course difficult to assess the ratio of skilled labour in the total of emigrants to alldestinations. However, for Canada and the US, where sufficient data on immigrants’education is available, the author estimated the ratio of university degree holders in thetotal of emigrants as amounting to one third in Canada (in 1996) and one fifth in the US(in the 90’s). These results are above average when compared with other countries of theregion and indicate that the “brain drain” in <strong>Romania</strong> is more than a peripheral concern, itis a significant social phenomenon which should be taken more into consideration bygovernmental strategic policies 34 .The <strong>Romania</strong>n population in urban areas accounted for 54.6% of the total in <strong>2000</strong> 35 . Thisoutcome resulted from a dual form of migration. During the first half of the decade thenet migration was towards urban areas (Table 2) and mainly due to the liberalisation ofinternal migration previously heavily restricted during the last decade of communistregime. Since 1995 we observe a reversed tendency that has been induced by theshrinkage of the industrial sector located mostly in urban areas. During the second half ofthis transition decade rural areas acted as an absorber of the excess industrial labour forceand thus serving as a buffer in synchronising the unbalanced speed of the decliningindustry versus the increasing service sector.34 In fact, in 2001, the <strong>Romania</strong>n Government has passed through the Parliament an Emergency Ordinancewhich stipulates the exemption from income taxes of <strong>Romania</strong>n IT specialists, precisely with the purposeof encouraging their stay and work within the country35 Source: National Institute of Statistics and Economic Studies, Statistical Yearbook <strong>2000</strong>27
Table 2: Structure of Urban and Rural Internal Migration Flows due to permanentresidence change (rates per 1000 inhabitants)1991 1992 1993 1994 1995 1996 1997 1998 1999 <strong>2000</strong>From rural to 10.7 9.4 6.9 6.6 5.9 5.9 5.6 4.9 4.7 3.9urbanFrom urban to 2.5 3.8 3.4 4.7 5.8 6.7 7.9 7.7 8.3 8.1ruralSource: <strong>Romania</strong>n Statistical Yearbook, <strong>2000</strong>In spite of having a relatively young population by European standards, (the median agebeing equal to 34.6 in <strong>2000</strong>), declining birth rates are inducing systematic changes in thepopulation’s profile. As is the case in most of Europe, the dependency of retired people toworking-age individuals is rising in <strong>Romania</strong> also. This anticipates future imbalances andstrains in the social security and health systems. Figure 1a shows the age structure of thepopulation in 1999 36 and Figure 1b shows the changes in the rate of dependency ofwelfare recipients on workers who pay social security contributions.In order to rectify the problem raised by the increase in the dependency ratio,complicated by the erosion of the pension quantities by inflation, the <strong>Romania</strong>ngovernment will have to find ways to reform its pension system by combining the “fullyfunded” system with “pay-as-you-go” pension schemes. The Governmental Pre-accessionEconomic Program stated that a multi-pillar pension system is more likely to insure thewelfare of the pensioners in the long-term. Therefore, three pillars have been designed:• Pillar 1 consists of compulsory, publicly administrated pensions and social insuranceschemes (regulated by the Law on Public Pensions and Social Insurance). This pillarrequires a better correlation of the amounts of pensions paid over time, theelimination of the inequities between different generations of pensioners, improvedcalculation schemes, and the setting of a minimal amount guaranteed by the state;• Pillar 2 is based on compulsory pensions privately administered by companies (thelegal framework will be set by a Law on the organisation and administration of28
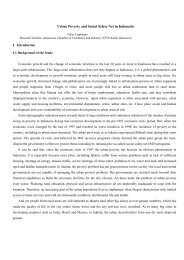
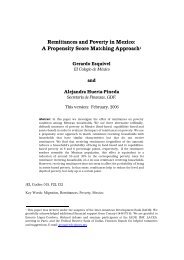
universal pension schemes). The operation of this pillar requires the creation of asupervisory board able to identify sources of revenues and to follow them up in orderto avoid the migration of employers towards the underground economy• Pillar 3 refers to optional pensions, based on capitalised non-compulsorycontributions of individuals, either in private or on public pension funds (the legalframework for this pillar will be provided by a Law of Supplementary Funds). Thecredibility of the third pillar is dependent on the creation of a credible supervisionorganism, able to consolidate the population’s confidence in the private pensionschemes.Figure 1: Structure of the population byage groups in 1999 (% of total)23%13%13%27%24%0-19 years20-35 years35-44 years45-64 yearsover 65 yearsSource: National Institute of Statistics and Economic StudiesSource: National Institute of Statistics and Economic Studies12,00010,0008,0006,000Figure 1b: Dependency of retired people and welfarerecipients on workers (thousand persons)4,00036 Source : National Institute of Statistics and Economic Studies, Number Statistical of Yearbook, workers <strong>2000</strong>2,00001980<strong>1990</strong>199219941996199829Number of retired people,welfare recipients
Table 3: Structure of labour force and unemployment rates<strong>1990</strong> 1991 1992 1993 1994 1995 1996 1997 1998 1999 <strong>2000</strong>Structure of labour force (% of total)Agriculture andforestry 29 29.7 32.9 35.9 35.6 33.6 34.6 36.8 37.4 40.6 41.4Industry 36.9 31.5 31.5 30.1 28.8 28.6 29.2 27.1 26.3 24.4 23.2Construction 6.5 5.5 5.5 5.7 5.6 5.0 5.1 4.9 4.4 4.0 4.1Services 27.6 33.3 30.1 28.2 30.0 32.8 31.1 31.2 31.9 31.0 31.3Unemployment rate% of total laborforce - 3.0 8.4 10.4 10.9 9.5 6.6 8.9 10.4 11.8 10.5For women - 4.0 10.7 12.9 12.9 11.4 7.5 9.3 10.4 11.6 10.1Source: National Institute of Statistics and Economic StudiesAs it was expected, the collapse of communism resulted in major changes in the structureof the labour force. Total employment fell by over 2 million, from 10,840,000 in <strong>1990</strong> to8,629,000 in <strong>2000</strong>. The rate of unemployment rose from 3% in 1991 to 11.8 in 1999, todecrease slightly to 10.5% in <strong>2000</strong> 37 . The labour force participation rate was 63.2% in<strong>2000</strong>, compared with a reported 80% in 1989. Several factors could explain this declinein the labour force statistics: the inaccuracy of labour statistics previous to 1989(<strong>Romania</strong> being a country proud to systematically report a 0% unemployment rate), thewithdrawal of population from the “official” labour force and migration towards theunderground economy, emigration, and longer time spans out of the labour force (mainlydue to prolonged time spent in education).The largest amount of job losses can be seen in industry as a result of privatisation andrestructuring, and the return of many workers (rather forcefully urbanised during37 Estimation of the <strong>Romania</strong>n Government (2001)30
communism) to family owned agricultural properties in the countryside 38 . <strong>Romania</strong>npopulation statistics show a significant increase in the number of migrants from urban torural areas (from 26,571 individuals in 1991 to 82,631 in <strong>2000</strong>), paralleling a monotonicdecrease in the number of migrants from rural to urban areas (132,360 migrants in 1991,in comparison to 47,693 in <strong>2000</strong>). This return to the rural areas was mainly due to therestitution of land, an on-going process initiated in <strong>1990</strong>.The rate of unemployment has been higher for women in the first years of transition, butthe gap between the two rates of unemployment closed in 1998 at 10.4%. Moresurprising, in <strong>2000</strong> the unemployment rate among women (10.1%) was lower than theoverall rate of unemployment (10.5%). Further results will show whether the statistics for1998-1999 were just an accidental result or part of a systematic trend in the genderstructure of unemployment.Earle and Pauna (1996) and Pauna and Pauna (1999) make several empirical observationsregarding unemployment in <strong>Romania</strong>. Firstly, they provide evidence that part of theunemployment in <strong>Romania</strong> was not due to layoffs resulting from restructuring, but to newentrants, since previous work experience was not a condition for receiving unemploymentbenefits. Secondly, despite unemployment benefits and severance payments(“compensations”) that seemed rather generous (around 60% of the salary being grantedfor 6 to 9 months), which could suggest that they created incentives for perpetuatingunemployment, this was not in fact the case as the benefits were quickly eroded byinflation. Thus, the authors suggest that the appropriate governmental policy should be toencourage the growth of jobs in the private sector and restrain the hiring of labour in thedeclining firms in the state sector through a system of selective support for firms.Another recommendation made was to lift or restrain the ‘exemption’ from payment ofsocial security benefits applied to temporary jobs, since these exemptions create strongincentives for tax evasion by firms ‘rolling over’ the temporary jobs every 6 months.38 There are a number of papers discussing unemployment, restructuring and labour reallocation in<strong>Romania</strong>. Among others, Earle and Pauna (1996), Earle (1997, Earle and Pauna (1998), Pauna and Pauna31
According to the 1999 data (Figure 2), the largest proportion of the labour force (over40%) is working in agriculture and forestry. The cumulated industry and constructionworkers as well as the services each account for around 30% of the labour force. The31% share of services in the labour force is extremely low even by East Europeanstandards. In comparison, Poland in 1999 had a share of services (trade, transport andcommunications, others) in total employment equal to 44.6% 39 .The trends in the transformation of the <strong>Romania</strong>n economy shown by sectors, asdisplayed in Table 2, bring about several troubling results. Inasmuch as a reduction in theshare of industry was not only predictable, but also economically desirable at thebeginning of transition, the privatisation and restructuring of <strong>Romania</strong>n industry did notsucceed in bringing about the expected increase in the efficiency of resource allocation.The services sector has not been able to develop at a fast enough pace to absorb theexcess labour force disbursed by the industry. This resulted in a heavy migration ofpopulation towards the agricultural sector, whose share in the total labour force increasedby over 11.6% between <strong>1990</strong> and1999.Pauna and Pauna (1999), by studying a selection of Western and Eastern countriesbetween 1989 and 1997 remark on the fact that <strong>Romania</strong> was the only country whereemployment in agriculture increased over that time. While the role of agriculture associo-economic “buffer” was to some extent predictable for the initial phase of transition,it becomes extremely dangerous to have an economy relying to such a large extent onagriculture as an absorber of the excess labour force. This is a clear sign of highlyfragmented agricultural properties, where economies of scale are not functional andwhere the inefficiency of resource allocation is perpetuated. Since the onset of landrestitution, more than 90% of people working in agriculture are self-employed or nonsalariedfamily workers.(1999)39 EIU <strong>Country</strong> Profile Poland <strong>2000</strong>32
It is highly unlikely that this form low productivity subsistence agriculture could survivein the competitive environment of the European Union and the CEFTA countries. Thepotential collapse of this form of agriculture in the face of its competitors could create ahigh number of unemployed people and induce further strain and social unrest within the<strong>Romania</strong>n population. It is highly unlikely that a large percentage of ‘agricultors’ withextremely specific labour skills would be able to migrate towards other sectors of theeconomy.Arguably, in the long run, individuals belonging to rural areas would have difficulties inadjusting to the skills and education required by the more productive sectors with theirlow adaptability eventually likely to introduce a form of persistent unemployment.However, this problem will not persist over time, since more than 50% of the agriculturallabour force belongs to the age group over 50 years old, and this ratio has been steadyover time. Therefore, in case of agricultural reform, these people are more likely to retirethan relocate.The services sector has shown a disappointingly slow adjustment, in view of the fact thatthe tertiary element ought to be the main driving force of growth in a modern, developedeconomy. The fact that the construction sector has shrunk by more than one third withrespect to its value at the beginning of the 90s is a symptom of another alarming fact, theinsufficient investment in infrastructure and, consequently, its deterioration.33
Figure 2: Structure of employment bysector in 1999 (% of total)31%41%Agriculture andforestryIndustry4%24%ConstructionServicesSource: National Institute of Statistics and Economic StudiesThe <strong>Romania</strong>n educational system has made efforts to accommodate the social changesthat followed the collapse of communism. Public expenditure on education reached 4%of GDP in <strong>2000</strong>, which is a low level even when compared to other East Europeancountries. That is why private schooling has emerged (from kindergartens to universities)as a competitor to state-funded education. However, the actual quality of these privateeducational institutions is subject to debate and an ongoing evaluation process issupposed to decide how many of them comply with the required standards. The mostsignificant change related to education during the 90s has been the increase by over 50%in the number of students in university education (from 192,810 students enrolled in<strong>1990</strong>/1991 to 452,621 enrolled in the academic year 1999/<strong>2000</strong>). This result is theimmediate consequence of rising unemployment among young people, the increasedavailability of private higher education and higher demand for advanced degrees in thelabour market.Women represented 48.4% of the registered labour force in <strong>2000</strong>, which closely parallelsthe gender structure of the population (women representing 51.1% of the total). In termsof education, women account for 52.4 % of the employees with high school studiescertificates, and for 43.5% of the employees with higher education (Figure 3).34
Figure 3: Employment structure by training level andgender in 1999 (% of total)3530252015105Higher educationSpeciality post high school ortechnical foremen educationHigh schoolVocational, complementary orapprenticeshipSecondary schoolPrimary or without graduatedschool0TotalWomenSource: National Institute of Statistics and Economic Studies3.2.3 Regional issuesAlthough the Constitution states that <strong>Romania</strong> is a centralised state, several politicalvoices in the 90’s have raised the issue of creating “autonomous” regions in view of thehistorical development of the country 40 . These voices originated mainly fromTransylvania as it was seen by many as a wealthier and social-economically moreadvanced part of the country. The regional development of Transylvania has to take intoaccount the political interests of the Hungarian minority, largely concentrated in this area,and the unequal distribution of GDP per capita over the country as a whole 41 .40 The formation of modern <strong>Romania</strong> has been accomplished in two steps. In 1859, Wallachia and Moldovaunified under the name <strong>Romania</strong>, which gained independence in 1877, suite of a war against the TurkishEmpire. Transylvania joined the Kingdom of <strong>Romania</strong> in 1918, after the defeat of the Austro-HungarianEmpire in the First World War and its ensuing break-up.41 According to the census of 1992, the <strong>Romania</strong>n population comprises 89.47% <strong>Romania</strong>ns, 7.12%Hungarians, 1.76% Roma and 1.65% other nationalities.35
Table 4: Gross Domestic product per inhabitant by regions (share in country GDPper inhabitant)North East South East South South West North Centre BucharestWestWest1994 75.9 94.9 97.4 98.3 106.9 91.7 103.3 149.11995 79.5 98.6 94.7 95.5 108.6 93.7 107 137.61996 80 100.9 91.7 89.5 105.7 92.8 112.3 142.61997 77.4 101.1 89.7 94.2 112.7 91.8 112.3 140.51998 76.2 100.4 86.1 89.7 104.8 94.7 107.7 163Source: <strong>Romania</strong>n Statistical Yearbook, <strong>2000</strong>Table 4 presents the distribution of GDP per capita by regions (Transylvania accounts forthe West, Northwest and Centre of the country). Development inequalities, inherited asmentioned in Section 1, although diminished, could be detected even after the fall ofcommunism. The regional increase of GDP per capita varies across the country. Thedevelopment pattern is largely the same as during inter-war years.3.2.4 Legislation and judicial statisticsThe <strong>Romania</strong>n Constitution, adopted by public referendum on December 8 th , 1991,statutes a multiparty system, a free-market economy and respect for human rights. TheParliament is endowed with legislative power and the President (elected by majorityvoting) is endowed with the power to appoint the Prime Minister.Since <strong>1990</strong>, the most sensitive issue in <strong>Romania</strong>n legislation has been property. After 10years of transition, the creation of property rights, property protection, and propertyrestitution are still subject to political debate and social discontent.Article 41 of the Constitution mentions that the property right is guaranteed. However,according to Article 135, property is only protected by the State. This differentiatedtreatment applied to ‘property’ and to the ‘property right’ has generated manycontroversies, and was one of the main reasons why many people (though not themajority, however) voted against the Constitution at the Referendum organised in 1991.36
The two main Laws of Privatisation (Law 15/<strong>1990</strong> and 31/1991) created several millionsof 'owners' in industry and in agriculture through a system of coupon privatisation ofstate owned enterprises (SOE’s). Also, the two Laws created the legal framework for theemergence of brand new private enterprises. However, at this level of diffusion, propertylegislation suffered from some important shortcomings. Mainly, it did not transform the<strong>Romania</strong>n economy from a state monopoly into a competitive market. Not being able toeffectively influence economic decisions, the millions of 'owners' of SOE’s could not beregarded as significant economic agents. Eventually, they delegated their right ofdecision to a superior level, thus maintaining the power of certain organisations (e.g.unions, privatisation funds, investment funds) which tended to be more or less obedientto governmental and political influences and thus affecting the efficiency of the economicprocess. This pattern did not allow for the development of an advanced economicbehaviour within the <strong>Romania</strong>n population. Owning and trading stocks and bonds doesnot yet represent an attractive way of saving and investing for the <strong>Romania</strong>n population.On January 2001 the Senate passed a Law on Restitution of Properties that had beenconfiscated under communism. Many analysts judged that this law came extremely lateand allegedly under the pressure of EU negotiations. Moreover, its formulation appears tocontain several unclear clauses that could ultimately harm the interests of the formerowners and protect the state. A case of this nature has already been taken for hearings tothe Human Rights Court in Strasbourg, the Court subsequently ruling in favour of thedispossessed owner. All these unclear issues and the tardiness in the removal ofuncertainties related to property rights continue to represent a discouraging factor forforeign investment and for the expansion of domestic private enterprises.The number of legal infringements(civil and penal cases) has been increasing over thetransition decade, from 589,660 in <strong>1990</strong> to 1,369,976 in 1999. In the same time, thenumber of judges ruling the cases has doubled, from 1,513 in <strong>1990</strong> to 3,479 in 1999. Outof the cases that judges had to give decisions upon, the vast majority were civil actions.37
The criminality index (number of final convictions per 100,000 inhabitants) has beenincreasing from 160 in <strong>1990</strong> to 390 in 1999 (with a record value of 496 in 1997).Inasmuch as criminality and the infringements of the law have undoubtedly increasedover the decade, the judicial statistics also present a clear indication of enhanced accessto justice in <strong>Romania</strong>. People bring to courts many more cases than at the outset oftransition. Figure 4 compares the evolution of civil and penal cases over the decade, theratio of civil to penal cases showing an increasing trend. Figure 5 displays the structure ofcivil litigations in 1999 (with actions on patrimony law being predominant). Figure 6presents the absolute increase in the number of civil actions on patrimony rights (propertyrights, successions, evacuation, and illicit facts), as a proxy indicator for the manyunsettled and controversial issues related to property rights in <strong>Romania</strong>.1,200,0001,000,000800,000600,000400,000200,0000Figure 4: Number of penal and civilactions entered in the Courts ofJustice<strong>1990</strong>199119921993199419951996199719981999Source: National Institute of Statistics and Economic StudiesPenalCivil38
Figure 5: Structure of civil litigations in19997%2%9%10%30%CommerciallitigationsActions on personsand family lawActions on patrimonylawAdm inis trativecontentiousLabour litigations42%Other litigationsSource: National Institute of Statistics and Economic StudiesFigure 6: Actions on patrimony law250,000200,000150,000100,00050,0000<strong>1990</strong> 1992 1994 1996 1998Number of casesSource: National Institute of Statistics and Economic Studies3.3 Economic Policy during TransitionThis section commences with the developments that took place in <strong>Romania</strong>n politicaleconomy, followed by a presentation of its results, in terms of economic structure, capitalflows and foreign debt, foreign reserves and exchange rate.39
3.3.1 Political economyThe economy in 1989 was almost entirely state-owned (only 12.8% of GDP came fromprivate enterprises). The over-centralised planning system was extremely remote fromrationality criteria and instead created a very rigid economic structure. Economicinefficiency has been accentuated by the concentration of production in giant plants,mostly energy-intensive and lagging behind international technological progress. Thealleged “fully employed” labour force lacked motivation for on-the-job training andincreased productivity given the complete absence of credible links between productivityand compensation packages and the non-existence of true property rights. The socialistconception of property, understood at the same time as nobody’s and everybody’sproperty, has induced over time a clear case of free riding (in terms of labour input) anddepletion (in terms of repartition of output).At the outset of transition, the country also presented features that could have constituteda comparative advantage with respect to other countries in the region. <strong>Romania</strong>demonstrated the least dependence on the COMECON Treaty, and the absence ofprevious hesitant reforming measures prevented the emergence of obscure 'quasiproperty' rights. Moreover, an obedient population, disciplined by the experience of apolice state and the severe recession previous to 1989 could have shown an increasedresistance to the difficulties of the reforming process.However, as the economic policies unfolded during the first years of transition, it becameclear that <strong>Romania</strong> had suffered from what has eventually been called a “loss ofmomentum”. The initial advantage of having no foreign debt has subsequently become aburden since resources that could have been allocated for investment (particularly inupdating technology) have not been put to their best use. Consequently, other countrieswhich had their debts written off have initiated the transition with a better allocation ofresources. Moreover, the trade independence from CMEA has been rapidly counteractedby external shocks such as the Gulf War and especially the imposition of trade sanctionsagainst the former Yugoslavia (1991-1992) and during the conflict in Kosovo (1998-40
1999). Additionally, the psychological advantage of a fairly obedient population, whichcould have been straightforwardly subjected to a “shock therapy” has been offset by theuse of slow changes and a hesitating and in many instances inconsistent “gradual reform”process.Moreover, the dismantling of the command economy after 1989 and the creation of asustainable economy in the long run had to accommodate more than inheritedmacroeconomic disequilibria. While the sluggishness of economic reform can be largelyattributed to unfavourable economic initial conditions, it cannot be denied that theinsufficient competence of the political leaders and economic management, as well as apopulation lacking democratic experience, also represented delaying factors or evenresistance forces to reform 42 .Economic policy in <strong>Romania</strong> during the first years of transition strove to simultaneouslyaccommodate the internal desire for populist measures – a reluctance to change anddesire to preserve the old structures and minimised social costs – and pressure frominternational financial organisations urging the country to adopt macroeconomic reforms.Progress in economic reform has been significantly slower in <strong>Romania</strong> than in othercountries in the region. No significant restructuring and institutional change were realiseduntil 1993. The first democratic governments, consisting mainly of former communists,adopted a gradual macroeconomic program of stabilisation and price liberalisation.Failure to sequentially implement the needed structural changes of the economy, (due tothe resistance of the state bureaucracy, managers of large state owned enterprises andlabour unions) gradually led to fundamental macroeconomic imbalances. State subsidiesto loss-making industries resulted in fiscal deficits and a low external competitiveness ofgoods. This gave way rapidly to inflationary pressures and current account deficits.42 Daianu (1999) singles out 4 distinct periods in the choice of macroeconomic policies in <strong>Romania</strong> duringtransition: the first ‘transformational recession’ (output decline and high inflation) between <strong>1990</strong>-1993, the‘interest rate shock’ (1993-1994), fragile growth and relapse into inflation (1995-1996) and the second‘transformational recession’ (or ‘the policy shock’ of 1997 and after)41
In 1994, as a result of the IMF condition, <strong>Romania</strong> introduced more drastic economicmeasures in the form of tightened monetary and fiscal policy and acceleratedprivatisation. Nevertheless, these measures came later than in other countries, reinforcingthe idea of a “loss of momentum” both with respect to the <strong>Romania</strong>n population (alreadyimpatient for a long awaited improvement in its quality of life), and the internationalfinancial institutions (with <strong>Romania</strong> starting to lack credibility in internationalenvironments).The next steps of the reform were taken in 1994, when the <strong>Romania</strong>n governmentregistered limited success in stabilising the currency (the Leu) and bringing downinflation. New legislation has been introduced regarding the liberalisation of the foreignexchange market and foreign investment.In spite of growing political instability between 1992-1995 the economic indicatorsshowed a gradual improvement. GDP growth became positive after a significantcontraction between <strong>1990</strong>-1992. Inflation diminished from over 250% in 1993 to 32% in1995 (Table 14). More noticeable results could be traced in the privatisation of the largestate owned enterprises due to the Mass Privatisation Program between 1995 and1996.The introduction of bankruptcy law, the opening of the stock exchange (in Bucharest) in1995 and the commodity exchange market (in Sibiu) induced further legislative andinstitutional progress. <strong>Romania</strong> succeeded in re-entering the international capital markets,as well as in lending foreign capital, despite the fact that the level of foreign directinvestment remained low with respect to <strong>Romania</strong>’s size and population. In April 2002,<strong>Romania</strong> successfully launched Eurobonds worth 700 million with a maturity of 10 yearsand annual interest rate of 8.5%, 2% below its previous issue, which indicates theincreased confidence of the international environment in <strong>Romania</strong>’s financial markets.The progress towards stabilisation was largely negated by the expansionarymacroeconomic policies pursued in the run-up to the general elections in 1996 43 . The43 The economic policy during 1995-1996 provide the most obvious example of the link between politicaland economic cycles in <strong>Romania</strong> during transition42
economy in 1996 was once again characterised by inflationary pressures and currentaccount deficits. In response to these pressures, the government resorted to controls overexchange rates and prices.After the elections in 1996, the new government formed by the Democratic Conventionattempted to introduce more market-oriented measures in the form of acceleratedprivatisation, restructuring of large industries and public utilities and partial privatisationof the major banks. Price controls and subsidies on the public services have beenremoved, the exchange rate has been unified and full convertibility of the <strong>Romania</strong>n Leuwas achieved. Despite their role in curing an ill economy, these measures resulted in aresurgence of inflation, nominal and real currency depreciation and a fall in real wages.Real GDP fell by 12 between 1997-1999 (Table 10), to recover only slightly by 1.6 % in<strong>2000</strong> 44 .Analysts have attributed many of these economic problems to the failures and hesitationsseen in attempts to develop a credible financial system able to attract the population’ssavings and to channel them into productive investment. State banks never ceased toprovide soft credits to loss making firms. Moreover, public confidence has beenundermined by the bankruptcy in 1999 of a major state bank (BANCOREX) followed bythe downfall of some smaller banks. Also, suspension of payments by several investmentfunds (the most recent being the FNI in May <strong>2000</strong>) and the collapse of large pyramidschemes (out of which “Caritas” has been a famous case in 1991 and 1992) added to thepublic distrust in the financial system. Only in <strong>2000</strong> has legislation regarding the banks’supervision and control been truly tightened 45 .Just as in the early years of transition, the government elected in November <strong>2000</strong> isexpected to accommodate the conflicting demands of the financial institutions (on which<strong>Romania</strong> depends heavily for credits) and of its impoverished and impatient population.44 Estimation (<strong>Romania</strong>n National Bank)45 As a result, the Solvency Index computed by the <strong>Romania</strong>n National Bank has jumped to 23.8% in <strong>2000</strong>,after a 10% in 1998 (when BANCOREX and Banca Agricola were already declaring bankruptcy) and 17.9% in 1999.43
The former require accelerated macroeconomic stabilisation and structural andinstitutional reform, while the latter voted for this government due to its promises of asofter, more welfare-oriented policy than the one endorsed by the previousadministration.The government in office has stated its intention to pursue an economic policy that wouldprioritise the needs of the electorate “in consultation, but not in subordination to theIMF”. The economic programme stipulates, among other measures, an annual averagegrowth rate of 4.5-6% during 2001-2004, an inflation target of 22-25% in 2001 (withpotential reduction to single digits by 2004), falling budget deficits (expected to be 4% in2001), a reduction of VAT for several basic goods, exemptions from custom duties forimported technology, and the attraction of USD 1 billion of FDI annually.It remains to be seen to what extent this programme will be able to respond and alleviatethe criticisms raised by the EU and IMF in their recent reports on <strong>Romania</strong>. In aSummary of the Article IV consultations (November <strong>2000</strong>), the IMF criticised <strong>Romania</strong>for failing to meet the agreed targets for inflation and budget deficits. IMF also judgedthat failure to reform the pensions system and the state sector (in terms of personnel andwages) and the postponement of complete removal of state subsidies induced upwardpressures on the budget.The European Commission’s <strong>Report</strong> on <strong>Romania</strong> (November <strong>2000</strong>) also criticised<strong>Romania</strong>’s economy on several grounds: delayed and incomplete privatisation, politicaland economic uncertainty, relaxed fiscal policy, distorted prices due to subsidies, thelarge share made up by the informal economy (30-40%), uncertain property rights, a lackof hard budget constraints, and the lack of a sound financial system able to support andaugment long-term investment.3.3.2 Structure of the economy44
Both industry and agriculture have contracted (as percentages of GDP) during thetransition years. The share of industry in GDP has almost halved from 46.2% of GDP in1989 to 25.2% in <strong>2000</strong>. Agriculture and forestry also declined to 11.1% of GDP in <strong>2000</strong>,after a slight increase of its share in the mid-nineties (Table 5). However, the share ofagriculture in GDP remains significantly high, indicating a strong resistance to changeand a slow adjustment to market mechanisms. In comparison, Poland’s share ofagriculture and forestry in GDP is only 3.3%, constructions amount to 7.7%, the industryaccounts for 24%, while the overwhelming share in GDP is held by the services sectorwith 65%.Table 5: GDP by sectors (% of GDP, current prices)1989 <strong>1990</strong> 1991 1992 1993 1994 1995 1996 1997 1998 1999 <strong>2000</strong>*Industry 46.2 40.5 37.9 38.3 34.4 36.3 35.7 34.2 35.6 27.5 27.8 27.6Agriculture andforestry 14.4 21.9 18.8 19.1 21.1 19.6 19.7 19.1 18.1 14.6 13.9 11.4Construction 5.5 5.4 4.3 4.8 4.7 5.3 6.5 6.9 5.3 5.3 4.8 4.8Transport andcommunications6.7 5.8 6.7 8.5 6.7 5.8 7.6 8 10.2 9.3 10.246.6Trade 5.8 6.2 13.5 14.3 12.5 12.2 10.5 11.7 11.4 13.7 13.5Other 21.4 20.2 18.8 15.0 20.6 20.8 20.3 20.1 19.4 29.6 29.8 9.6Weight of privatesector in GDP 12.8 16.4 23.6 26.4 32.0 38.9 45.3 54.9 60.6 62.0 63.3 -Source: National Institute of Statistics and Economic Studies; *estimationsThe growth of the service sector (excluding constructions) to 58.7% in <strong>2000</strong> could beslightly misleading, however. Since the shares of the different sectors in GDP aremeasured at current prices, one could argue that the increase in the services sector partlyreflects the faster rate of inflation in this sector where prices had to rapidly align to worldlevels. However, the services sector is expected to grow in real terms in the medium and45
long run, since its share in GDP is still low even when compared to other transitionalcountries.The comments we made on the structure of employment by sectors (Table 3) applyalmost identically to the structure of GDP by sectors. The notable exception isagriculture, where employment increased dramatically, while the agricultural contributionto GDP significantly decreased. This is an obvious sign of low productivity inagriculture, which will be discussed in more depth in Section 4 of the paper.Moreover, the dominance of extensive, rather than intensive, agriculture is alsodetrimental to the expansion of the services sector, in particular trade. Development oftrade, as a principal component of the services sector, is hindered by the fact that withouta competitive agricultural sector (which certainly is the case given a fragmentedagricultural property) there are no opportunities to export agricultural and food products,therefore holding trade back.3.2.3 Capital flows and foreign debtIn the beginning of the 90s, almost all of <strong>Romania</strong>’s external debts had been repaid, apotentially excellent starting point of transition. However, as explained in Section 2.4, thelack of foreign debt was a huge liability from the standpoint of the initial conditions.Moreover, the need to finance increasing balance of payments deficits soon built upincreasing foreign debt and thus negated this initial potential comparative advantage.<strong>Romania</strong> still depends heavily on credits from the international financial institutions aswell as on the international capital markets, which it re-entered in 1995 with satisfactorycredit ratings. However, as a result of economic and political instability and because ofthe successive governments’ loss of external credibility, the ratings have beenconsistently low and the flow of Foreign Direct Investment has diminished in recentyears (Table 6).46
Table 6: <strong>Country</strong> risk ratings 46 – historyMoody’s Standard&Poors FitchIBCABa3 (4 Jun 97) BB- (6 Mar 96) BB- (3 Dec 97)B3 (7 Aug 98) B+ (20 May 98) B (23 Dec 98)B1 (14 Sep 98) B- (19 Oct 98) B- (24 Mar 99)B3 (6 Nov 98) B- (4 Aug 00) B (16 Nov 00)B2 (Dec 2001) B(7 Jun 00) B+(Nov 2001)Source: BradyNet Inc.Although it represented 27.8% of GDP (9.4 bn US$) at the end of 1999, <strong>Romania</strong>’scumulated external debt in absolute value is still low when compared to Poland (42.8 bnUS$), Hungary (24.1 bn US$) or Czech Republic (22.5 bn US$) 47 . This represents afavourable factor, since this level of indebtedness allows the country to re-enter theexternal markets in order to attract additional loans (Table 7).Table 7: External Debt ($ m, year end stocks)1991 1992 1993 1994 1995 1996 1997 1998 1999 <strong>2000</strong>Total long andmedium termExternal debt asratio of GDP1,143 2,479 3,357 4,597 5,482 7,209 8,584 9,322 8,771 10,2402,96 7,03 9,38 12,36 13,76 17,41 22,08 25,02 23,98 27,76Source: National Institute for Statistic and Economic Studies3.3.4 Foreign reserves and the exchange rateAlthough the first attempt to unify the exchange rate occurred in November 1991, theinter-bank market remained tightly controlled, and the rates of the private exchangeoffices and on the black market differed significantly from the official rates. This forcedthe National Bank to ration foreign exchange.Widening current-account deficits between 1993 and 1996 determined the depletion offoreign-exchange reserves, which plunged to US$ 1.6 billion in 1995. The governmentwas forced to introduce foreign exchange controls in 1996, although this conflicted with46 For long-term foreign currency bonds47
the requirements of the international organisations and the interests of <strong>Romania</strong>n andforeign companies involved in trade. The latter chose to react to this measure byoperating in the “grey” economy (inter-enterprise trade of foreign currency, whereexchange rates were closer to the real value of the Leu), or, even more dangerously,moving to the underground economy. The exchange rate was reunified in January 1997,and full internal convertibility of the <strong>Romania</strong>n Leu was finally achieved in January1998.Once the liberalisation of foreign exchange was accomplished, the National Bankfollowed a more prudent policy regarding the foreign reserves in spite of recurringcurrent account deficits, pressure on the currency and outstanding debt repayments. Thereserves have shown an increasing upward trend (Table 8), even though they have stillbeen used on several occasions to finance the current account deficits (for instance, in1998) or to repay some international bonds (for instance, in mid 1999).Table 8: Foreign reserves ($ m)1991 1992 1993 1994 1995 1996 1997 1998 1999 <strong>2000</strong>Internationalreservesexcluding goldGold (nationalvaluation)Gross reserves(in months ofimports ofgoods andservices)*695 826 995 2,086 1,579 2,103 3,803 2,867 2,687 3.949795 800 914 1,006 1,046 1,042 868 924 967 920- - - - 2.8 3 4.4 4 3.5 -Source: National Bank of <strong>Romania</strong>, *IMFThe exchange rate of the <strong>Romania</strong>n currency has fluctuated due to both internal factors(paralleling inflation) and external circumstances (depreciation of the Euro, the maincurrency of exports, against the Dollar, the main currency for imports). On severaloccasions, the National Bank has allowed the Leu to temporarily depreciate in real terms47 Source: Economist Intelligence Unit48
in order to increase the competitiveness of the economy or to balance the trade deficits.However, the long-term policy of the National Bank is to allow the Leu to depreciate inline with internal inflation (thus avoiding a depreciation of the exchange rate in realterms).Table 9 presents the historical evolution of the exchange rates of the Leu with respect tothe US Dollar, the Deutsche Mark and the Ecu/EURO. However, particularly for theperiod <strong>1990</strong> to 1996, the official values significantly underscore the ‘real’ exchange rates(by which we mean the exchange rate that would have indeed reflected the intersectionbetween the demand and supply of foreign currency).Table 9: Exchange rates (annual averages)1991 1992 1993 1994 1995 1996 1997 1998 1999 <strong>2000</strong>USD 76 307 760 1,655 2,033 3,084 7,168 8,876 15,333 21,693DM 46 185 459 1,019 1,418 2,050 4,134 5,044 8,352 -ECU/Euro 88 400 885 1,967 2,629 3,863 8,091 9,989 16,296 19,956Source: National Bank of <strong>Romania</strong>Borc (<strong>2000</strong>) links the persistent inflation in <strong>Romania</strong> to the governmental strategy ofusing the exchange rate as a nominal anchor 48 . Following an argument developed byCalvo and Vegh (1997), Borc states that there are some stylised facts observable incountries experiencing chronic inflation if they attempt to use exchange rate basedstabilisation programs (as was the case of <strong>Romania</strong>). These regularities are a slowconvergence of the inflation rate to the rate of devaluation, an initial increase in real GDPfollowed by a contraction, real appreciation of the domestic currency, deterioration of thetrade balance and current account balance and an ambiguous impact on real interest rates.Except for the pattern of GDP growth followed by contraction (which was not the casebetween 1997 and 1999 as <strong>Romania</strong>’s GDP contracted continuously), Borc argues, all48 The Memorandum on Economic Policies signed with IMF on July 26, 1999 specified that: “Keyobjectives of the monetary policy will be to reduce inflation so as to preserve the gains in competitivenessbrought about by the recent depreciation, and gradually to stabilize the exchange rate of the leu, owing toits importance as a nominal anchor”49
these features were noticeable in the <strong>Romania</strong>n economy. The explanations provided byBorc for these elements relate to inflation inertia and the lack of credibility of the banks.Thus, the author suggests that in order to fight persistent inflation with the means ofexchange rates as a nominal anchor, the Central Bank ought to express a strongcommitment to fight inflation and to meet every target that it sets together with itsinternational counterparts (particularly the IMF and the World Bank). In fact, this goal ofestablishing credibility in monetary and exchange rate policy has been exactly the maingoal that the National Bank of <strong>Romania</strong> has attempted to pursue in the last year. In themedium run (2001-2004), the Government and the <strong>Romania</strong>n National Bank have statedtheir intention to move from a “managed floating” of the exchange rate towards an“inflation targeting” policy.3.4 Economic PerformanceAfter an initial GDP contraction of 20.6% between <strong>1990</strong>-1992, four years of positivegrowth followed until 1996. However, this fast recovery (a cumulated 14% GDP growthbetween 1993-1996) proved to be unsustainable. GDP fell each year between 1997and1999, only to recover slightly by 1.6% in <strong>2000</strong> 49 . Thus, GDP in <strong>2000</strong> reached about80% of its level in <strong>1990</strong> (Table 10 and Figure 7). In 1999, <strong>Romania</strong>’s GDP per capita (inPurchasing Power Parity terms) ranked the 13th among the 27 transitional countries(Central and Eastern Europe and CIS), with less than 1,567 USD per capita (PurchasingPower Parity). Poland, on the other hand, ranked the 5 th , with slightly over 4000USD/head.Table 10: Gross Domestic Product (market prices)<strong>1990</strong> 1991 1992 1993 1994 1995 1996 1997 1998 1999 <strong>2000</strong>Total ( bn USD)At current 44,42 38,67 35,27 35,79 37,19 39,84 41,40 38,87 37.26 36,58 36,89prices<strong>1990</strong>=100 100 87.1 79.4 80.6 83.7 89.7 93.1 87.4 83.2 81.3 82.6Annual49 Estimation (<strong>Romania</strong>n National Bank)50
change (%) -5.6 -12.9 -8.8 1.5 3.9 7.1 3.9 -6.1 -4.8 -2.3 1.6Per head (USD)At current 1914.3 1,668.0 1,547.5 1,573.0 1,636.1 1,756.4 1,831.1 1,724.1 1,655.6 1,628.7 1,644.4pricesAt constant 94.2 82.1 76.13 77.39 80.49 876.41 90.08 84.82 81.45 80.13 80.9(1989) pricesAnnualchange (%)-5.83 -12.87 -7.23 1.65 4.01 7.35 4.26 -5.84 -3.97 -1.62 0.96Source: own computations, based on National Institute of Statistics and Economic StudiesFigure 7: Evolution of real GDP(<strong>1990</strong>=100)120100806040200Real GDP<strong>1990</strong>1992199419961998<strong>2000</strong>Source: National Institute of Statistics and Economic StudiesA more in-depth analysis of the growth phase between 1993 and 1996 shows that theoutput expansion was largely achieved by credit financing of heavy industry. The softbudget constraints raised the production of the loss making firms, but the increasedoutput was not matched by demand in either the internal or external markets. This has ledto a growth in stocks (continuing a trend set between <strong>1990</strong> and 1992) statisticallyrecorded as a growth of GDP, trade deficits and inflationary pressures. Following therequirements of international organisations, the government subsequently had to51
implement tighter fiscal and monetary policies (including the hardening of budgetconstraints that were conducive to a decrease of stocks). These factors, as well as moregovernmental focus on the restructuring of loss making enterprises, explain thecontraction of demand and output between 1997 and 1999.Figure 8a shows the percentage of stocks in GDP over the decade, while Figure 8b andTable 11 presents the structure of GDP in terms of its uses. The growth of stocks in theearly transition period (<strong>1990</strong>-1993) is an unquestionable consequence of the enterprises’inability to re-allocate their resources and efficiently adjust their production to thechanging requirements of the market, which resulted in the ‘first’ recession. However, theintervals 1993-1996 and 1997-1999 tell another story: in this case, initial growth in GDPwas matched by a growth in stocks, which leads to the conclusion that the economicexpansion was largely an artificial statistical phenomenon. The economy after 1996 hasbeen characterised by a systematic reduction of stocks, but also by an economiccontraction. Therefore, it can be argued that the second slump in GDP (after 1996) hasnot been so much a sign of recurrent recession, but rather a return to the natural trend ineconomic growth after an interval in which ‘growth’ was artificially induced by stockbuilding over time. Reduction of the stocks’ value was undoubtedly a sign of a healthiereconomy, even if this was reflected immediately in a reduction of GDP (this meaning thatthe reduction in stocks has not been accompanied by an equivalent increase inconsumption, investment and net exports). However, the contraction of GDP during thesecond slump after 1996 has never reached the startling levels of the first slump, which isan indication of some improvement in the allocation of resources in the economy.52
Figure 8a: Stockbuilding as ratio ofGDP<strong>2000</strong>1998199619941992<strong>1990</strong>-20% 0% 20% 40% 60% 80% 100%GDPStockbuildingSource: National Institute of Statistics and Economic StudiesTable 11: Gross Domestic Product by category of uses (Lei bn, current prices;figures in parentheses indicate percentages of total)<strong>1990</strong> 1991 1992 1993 1994 1995 1996 1997 1998 1999 <strong>2000</strong>*Private557.81,323.73,750.812,670.331,44248,545.175,288.8186,238.2278,626.2(7388,984.5557,561.9consumption(65)(60.1)(62.2)(63.2)(63.2)(67.3)(69.1)(73.6)(75.1)(72.1)(70)Government114.3333.9861.12,473.26,851.89,87714,273.930,999.852,740.968,687.399,634.6consumption(13.3)(15.2)(14.3)(12.3)(13.8)(13.7)(13.1)(12.3)(14.2)(12.7)(12.5)Consumption of7.514.930.692.3158.6240.3376.71381.83305.312,492.230,741.7private non-(0.9)(0.7)(0.5)(0.5)(0.3)(0.3)(0.3)(0.5)(0.9)(2.3)(3.9)profitinstitutionsGross fixed169.83171,156.93,583.710,095.715,425.924,998.553,540.168,111.697,169.8147,209.6investment(19.8)(14.4)(19.2)(17.9)(20.3)(21.4)(23)(21.2)(18.3)(18)(18.5)Stockbuilding89.7301.1736.72,227.52,252.62,085.13,161.4-1,368.7-1,586.4-4,5467,680.6(Change in(10.5)(13.7)(12.2)(11)(4.5)(2.9)(2.9)(-0.5)(-0.4)(-0.8)(1)stocks)Net exports -81.1-86.7-506.9-996.0-1,027.5-4,036.9-9,179.7-17,865.5-30,003.8-23,430.9-46,294.7(-9.5)(-3.9)(-8.4)(-5)(-2.1)(-5.6)(-8.4)(-7.1)(-8.1)(-4.3)(-5.8)Total GDP 857.9(100)2,203.9(100)6,029.2(100)20,051(100)49,773.2(100)72,135.5(100)108,919.6(100)252,925.7(100)371,193.8(100)539,356.9(100)796,533.7(100)Annual GDPdeflator113.6 295.1 300 327.4 239.1 135.3 145.3 247.3 154.2 148.7 145.4Source: National Institute of Statistics and Economic Studies; *provisional data53
Figure 8b: Composition of GDP by uses<strong>2000</strong>1998199619941992<strong>1990</strong>-20% 0% 20% 40% 60% 80% 100%Private consumptionConsumption of private non-profit institutionsStockbuildingTotal GDPGovernment consumptionGross fixed investmentNet exportsSource: National Institute of Statistics and Economic StudiesAn additional factor explaining the contraction of output between 1997 and 1999 was therelentless reduction of investment from 23% of GDP in 1996 to 18% in 1999, and thepersistence of a negative current account balance. (The average negative current accountbalance during the period of expansion 1992 to 1996, -5.9% of GDP, has been smallerthan the average negative current account balance during 1997 to 1999, -6.7 of GDP).Section 4 of the paper aims to present in more detail the factors explaining the evolutionof GDP in <strong>Romania</strong> and the factors underlying this pattern of recession, expansion andsecond contraction.Inflation in <strong>Romania</strong> has constantly been higher than the average of the region, reflectingthe government’s eagerness to finance its persistent budgetary deficit through monetary54
emission (Table 12,13) 50 . In <strong>2000</strong>, the budget deficit was estimated by the Government at4% of GDP, and the forecasted budget deficit will not go below 3% in 2005.In what regards medium-term (2001-2004) budgetary policy, the Government forecastscollecting incomes representing 31-33% of GDP in parallel with projected expendituresof 35-36% of GDP. The fiscal strategy involves calibrating the expenses as a function ofthe certain revenues and an increased transparency in the fiscal process. An improvedmethodology in the collection of taxes and the subsequently increased tax base, achievedby reducing the share of the informal economy, will compensate for the loss in revenuesdue to the cancelling the taxes corresponding to several ‘special funds’ in the budget 51 .The governmental Pre-accession Economic Program also acknowledges that the level offiscal resources allocated to education, health, infrastructure and environmentalprotection are low when compared to other candidate countries, thus it has stated itsintent to increase these expenses based on the additional revenues incoming from theincreased tax base. However, this strategy (relying on an increased tax base, not onincreased tax rates) appears to be highly questionable, given the past performance of the<strong>Romania</strong>n fiscal system.Table 12: Governmental budget deficit<strong>1990</strong> 1991 1992 1993 1994 1995 1996 1997 1998 1999 <strong>2000</strong>% of GDP +0.3 -1.9 -4.4 -2.6 -4.2 -4.1 -4.9 -3.6 -2.8 -2.5 -3.6Source: National Institute of Statistics and Economic Studies, own computationsTable 13: Money Supply (% annual change)1991 1992 1993 1994 1995 1996 1997 1998 1999 <strong>2000</strong>Narrow 193.2 40.7 117.0 103.1 56.2 57.7 67.6 17.7 34.6 56.150 Cukierman et al (2001) assesses <strong>Romania</strong>n Central Bank’s legal independence equal to 0.34 (on a scalefrom 0-totally dependent to 1-totally independent). This coefficient ranks below the average coefficient forall transition economies (which is 0.34 for countries with only one law on Central Bank reform, and 0.63for countries where two laws on Central Banking have been promulgated by the Parliament). Incomparison, Poland’s coefficient is 0.89. The authors provide evidence of the fact that legal independenceand inflation are negatively related. <strong>Romania</strong>’s low coefficient of Central Bank Independence provides thusat least a partial explanation for its high and persistent inflation.51 The Government’s Pre-accession Economic Program does not mention what is meant precisely by these‘special’ funds55
oadmoneyQuasi- 14.4 173.9 170.7 172.8 83.0 71.5 126.6 62.1 48.3 32.8moneyTotal 101.2 79.6 140.9 138.1 71.64 65.9 104.8 48.9 44.9 37.9Source: National Institute of Statistics and Economic Studies, own computationsIn spite of sustained effort directed in recent years towards the control and reduction ofinflation, the expected increase in prices in 2001 is 25%. After the inflationary shocksinduced by the price liberalisation occurring between 1991-1994, the rate of growth inconsumer prices slowed down to 32% in 1995. However, in 1996, a relaxation ofmacroeconomic policies has lead to a further increase in consumer prices, these peakingat 155% in 1997 (unsurprisingly, this year also being characterised by the largest fall inreal wages after the initial contraction of the period <strong>1990</strong> to 1991, – 16.4%., Table 14). In<strong>2000</strong>, the government was not able to meet IMF’s inflation target on 27%, arguing that a46% level of inflation was due to unforeseeable factors (drought, the depreciation of theEuro, the main trading currency in <strong>Romania</strong>, against the dollar and the increase in worldoil prices).Table 14: Prices, earnings and inflation1991 1992 1993 1994 1995 1996 1997 1998 1999 <strong>2000</strong>Consumer prices 270 839 2,987 7,702 9,353 12,983 33,077 52,624 76,728 111,792(<strong>1990</strong>=100)Inflation rate 170 210 256 137 32 39 155 59 46 45(yearly average)Net nominal wages 7,460 20,140 59,717 141,951 211,373 321,169 632,086 1,042,274 1,522,878 2,173,478(lei/employee)Real wages 81.7 71.3 59.4 59.4 66.5 72.7 56.3 58.2 56.0 53,8(<strong>1990</strong>=100)Annual change inreal wages-18.3 -10.4 -11.9 0 7.1 6.2 -16.4 1.9 -2.2 2.4Source: National Institute of Statistics and Economic StudiesThe data on real wages shows that the living standard of the population has worsened.Although data on early transition years is scarce, opinion polls provide evidencesuggesting that the majority of people consider themselves worse off economically than56
at the beginning of transition 52 . Much as optimist researchers could attribute this to amere psychological reaction losing patience with respect to the promised but too longawaited benefits of transition to the market. It cannot, however, be denied that real wageswere in <strong>2000</strong> 21% below their level in 1996. World Bank reports estimated in 1994 that21.5% of the <strong>Romania</strong>n population lives below the international poverty line (with 27%below the poverty line in the rural areas), and the average monthly wage fluctuatedaround 100 US dollars in <strong>2000</strong>.Figure 9 presents in comparison the evolution of GDP and real wages in the 90s. It isclear that real wages have followed the pattern of recession-recovery-second recessionshown by the real GDP. The fall in real wages, however, has been significantly largerthan the fall in GDP. Moreover, inasmuch as the recovery of GDP (in 1993-1994) hasbeen followed by a recovery in real wages, the latter has nevertheless occurred with asignificant time lag (1995). One could use this fact as evidence for a “sticky wages”theory suggesting that the GDP expansion in 1993-1994 might have occurred at leastpartly because of the production output taking advantage of this ‘sluggish’ adjustment ofreal wages, which reduced the cost of labour in real terms. On the other hand, the secondslump of GDP in 1997 has been accompanied by a simultaneous fall in real wages. In thiscase, a theory of sticky wages does not apply.52 In a survey of public opinion (Public Opinion Barometer) conducted in May 1999, 66% of therespondents considered that the country is moving into the wrong direction. In comparison, in March 1995,only 46% of the population thought the country is moving into the wrong direction. In a similar survey afterthe electoral change taking place in 1996 (March 1997), 52% of the population thought “the direction isright”, 35% thought “the direction is wrong”, while 13% were undecided.57
Figure 9: Evolution of real GDP and ofreal wages120100806040200<strong>1990</strong>199119921993199419951996199719981999Real GDPReal wagesSource: National Institute of Statistics and Economic StudiesRegarding the quality of life, there is evidence that wage differentials have increasedsharply: in 1999, the highest paid sectors were the financial services, followed by postand telecommunications and public administration, while the worst paid sectors werehotels and catering, trade, agriculture, education and public health. There is little chanceof narrowing the wage differential for the latter two sectors, given the high importanceplaced by the international financial institutions on respecting the austerity of the budget.Table 15: Average interest rates (%, yearly averages)1996 1997 1998 1999 <strong>2000</strong>Average short- to long-term lending rate 51.3 67.5 55.1 61.2 46.2Average deposit rate 41.5 57.2 44.5 49.1 33.0Source: National Bank of <strong>Romania</strong> –Statistical <strong>Report</strong> <strong>2000</strong>When comparing the interest rates in recent years (Table 15) with the evolution of theconsumer price index and inflation (Table 14), it is clear that the economic policy of thefinancial institutions has discouraged saving and, consequently, investment. Individualswere dissuaded from depositing their savings into banks since the offered interest rates ondeposits barely compensated for inflation (if at all) without offering any significant58
premium. Moreover, in 1997, the average interest rate offered by banks represented onlyabout one third of the inflation rate. 1998 has also been a year of negative real interestrates for bank deposits. The situation recovered slightly in 1999 only to return to negativereal interest rates for deposits in <strong>2000</strong>. Figure 10 shows the relationship between theinterest rates and inflation over the second half of the 90s.Figure 10: Deposit and lending interestrates in relation to inflation (%)<strong>2000</strong> Average deposit1999rate1998199719960 50 100 150 200Average short- tolong-term lendingrateYearly inflation(%)Source: <strong>Romania</strong>n National BankOn the contrary, the high level of inflation could have encouraged borrowing for thepurpose of investment, since the real interest rate on loans was extremely favourable atthe beginning of transition as well as during 1997-1998 (when it has been negative).However, this was not the case. The economy was lacking bank liquidity as the excesscurrency has rapidly been absorbed by a thriving underground economy much moreadaptive than the official one. Investment, both domestic and foreign, has thus beendepressed not only because of political and economic uncertainties, but also due to thelack of a robust transmission mechanism channelling savings into investment.3.5 Sectoral developmentWe study the developments in the <strong>Romania</strong>n economy by following its structure bysectors: agriculture, manufacturing, transport and telecommunications, financial servicesand trade.59
3.5.1 AgriculturePrior to the Second World War <strong>Romania</strong> was a major agricultural producer in Europe.The forced industrialisation during communist times has led to a loss of competitiveadvantage. During the transition, many workers have chosen to leave the industrial plantsand return to the countryside. However, land privatisation and the restitution of land havebeen stalled by many costly conflicts which involved not merely the individual ownersbut also the state.Many farmers experienced considerable hardship during the transition, due to wagedifferentials. Incomes in agriculture are significantly lower than the average, and theliberalisation of input prices in agriculture, as well as the competition induced byimported agricultural products, caused major problems within the agricultural reformprocess. State subsidies for agriculture (mainly in the form of coupon vouchers) havebeen scarce and mostly ineffective due to the deterioration of their value induced by thejoint effect of inflation and the bureaucratic (institutional and legal) delays in transferringthem from state to the farmers.Although in 1999 93.4% of livestock and 78% of agricultural land were already in privatehands, the <strong>Romania</strong>n agriculture still suffers from a fragmentation of land and lack ofsystematic investment. As such, most agriculture remains labour intensive andtechnologically backward. Crop yields are low by European standards and the livestocknumbers have fallen to pre-war levels.Table 16 shows that agricultural output was for most of the transition decade lower thanthe initial level of the 90s. Even though 1999 saw a year of increased output, theincrements are extremely low, which indicates a very low level of productivity in farmsdue precisely to the fragmentation of agricultural properties into very small holdings.Section 4 gives a more in-depth analysis of the role played by agriculture in the growth(or rather delaying) of the <strong>Romania</strong>n economy.60
Table 16: Gross Agricultural Output (<strong>1990</strong>=100)1991 1992 1993 1994 1995 1996 1997 1998 1999 <strong>2000</strong>Indices 100.8 87.4 98.6 96.5 100.8 102.1 105.6 97.7 102.8 88.2% Annualchange0.8 -13.4 11.2 -2.1 4.3 1.3 3.5 -7.9 5.1 -14.2Source: National Institute of Statistics and Economic StudiesGiven the high potential of agriculture, which remains under-utilised, the government isexpected to speed up agricultural reform in the context of the negotiations on EUaccession. The governmental policies are supposed to encourage the aggregation ofagricultural properties into larger, more productive, farms where economies of scalecould be made. Also, governmental policies should target the modernisation ofinfrastructure (agricultural machinery) and the reduction of wage differentials inagriculture.3.5.2 ManufacturingAccelerated industrialisation during communism has succeeded into creating <strong>Romania</strong>nheavy industrial sector, though with a background of limited or no comparativeadvantage at all. Moreover, the forced debt repayment has prevented capital from beingreinvested in updated industrial technology.As a result, <strong>Romania</strong>n industry at the outset of transition has been using equipment thatwas significantly outdated. This situation has perpetuated during the decade of the 90s,due to a mix of output collapse, falling purchasing power, industrial price increases, andfinancial institutions offering inadequate investment opportunities. The innovativepotential of <strong>Romania</strong>n research and development has also been dissipated due to a lack ofresources and significant brain drain.The main problem of <strong>Romania</strong>n industry has been and remains its lack of synchronisationwith the world markets. Besides being slow-paced, the restructuring of industry in the61
first years of transition has failed to meet the structure and the requirements of thedomestic and foreign markets. More significant attempts at restructuring were recorded in1997, when the government in power (less oriented towards social democracy but alsoconstrained by the international financial organisations) took steps to reduce the excesscapacity and employment in the petrochemical, metallurgical and other heavy industries.On the other hand, the industries that have more potential for growth in the long run, suchas consumer goods and consumer durables, have been the ones most hit by recession andlack of technological progress. As the experience of contracting (outward processingarrangements) has showed, <strong>Romania</strong> has the potential to exert a competitive advantage inthese industries. Statistics show that industrial recovery is led mainly by these sectors.Major parts of the industrial exports in <strong>2000</strong> have been based on clothing, footwear andfood and drinks. Thus, the governments ought to focus on supporting and encouragingthe small and medium size enterprises acting in these fields of industry rather thanendlessly protecting the giant loss-making firms for populist reasons. Section 4 providesa more in-depth analysis of the industries that represented the main triggers for growthduring the 90s, and that could be the driving force for sustainable growth in the mediumand long term.Foreign investment in industry has been equally discouraged by legal features (a ban onforeigners purchasing property in <strong>Romania</strong>), vested political interests (many enterprisesare overstaffed and the social democrat governments have avoided dealing with the socialand political costs of unemployment), corruption (scandals related to the privatisation ofmany enterprises have many times made the front page of newspapers) and, last but notleast, economic reasons (the low productivity of many industries).Table 17: Industrial Production Indices (<strong>1990</strong>=100)1991 1992 1993 1994 1995 1996 1997 1998 1999 <strong>2000</strong>Total 77.2 60.3 61.1 63.1 73.4 78 72.3 62.4 61 65.2Annualchange-22.8 -16.9 0.8 2 10.3 4.6 -5.7 -9.9 -1.4 6.8Source: National Institute of Statistics and Economic Studies; own calculations62
By <strong>2000</strong>, after three years of contraction, industrial output fell to 65% of its level in <strong>1990</strong>(Table 17). Figure 11 presents the evolution of real GDP, of agricultural output and of theindustrial output over time. From the graph it is clear that, in general, agriculture andindustrial production followed the trend of recession-expansion-second recession that thereal GDP displayed. However, agricultural output had some deviations from the trend (in1991, 1994 and 1997). A more detailed analysis of the contribution of different sectorsand productive factors to GDP and growth follows in Section 4 of the paper.120100806040200Figure 11: Evolution of real GDP, agricultural output andindustrial output over time (<strong>1990</strong>=100)<strong>1990</strong>199119921993199419951996199719981999Real GDP Agricultural output Industrial outputSource: National Institute of Statistics and Economic Studies3.5.3 Transport and telecommunicationsThe <strong>Romania</strong>n transportation system is seen as lagging behind other Central and EasternEuropean countries, this being acknowledged as a clear hindrance to economicdevelopment and integration with the rest of Europe. In recent years governmentalinterest has focused on the modernisation and reconstruction of road and rail networks.The total number of kilometres of railway lines in operation grew from 11,348 in <strong>1990</strong> to11,385 in 1996 and decreased again to 11,015 in <strong>2000</strong>. Out of the total railway lines, only63
35,9% are electrified. The density of public roads per 100 square kilometre territoryincreased very slowly, from 30.5 in <strong>1990</strong> to 32.9 in <strong>2000</strong>. Modernisation of the transportinfrastructure continues to represent a high priority of the government’s programme for2001-2004, this being also necessary for the requirements of the accession negotiationswith the EU.The level of investment required by the modernisation of infrastructure increases thepressure on an already unbalanced <strong>Romania</strong>n budget. For this reason distinct resourceshave been sought from both the <strong>Romania</strong>n private sector (through toll roads and a “roadtax” as a cap to the petrol price) and the international financial institutions (World Bankloans have been sought for this particular objective of infrastructure modernisation).Moreover, railway tariffs have been deliberately increased at a faster rate than inflation inorder to provide additional resources for investment in infrastructure.The communication network also required investment in the 90s given the fact that thenumber of telephone lines at the beginning of transition was significantly below theEuropean average. The number of telephone subscriptions has increased from 2,288,000in 1989 to 5,832,000 in <strong>2000</strong>, this being partly due to an increase in the provision of fixedtelephone lines and also to the emergence of mobile telephone companies 53 .The significantly outdated telephone network has hindered the development ofinformation technology (Internet and cable communications) at the beginning of thetransition period. This situation has been gradually changing, as in the case of theprivatisation of Romtelecom, the national monopoly supplier of fixed-line telephones, in1998. Moreover, competition in the field of mobile telephones and cable communicationhas resulted in improvements of services, choices of tariff packages and increased growthof Internet accounts (currently estimated at 0.25 accounts/100 inhabitants) 54 .53 The mobile subscriptions represent 35% of total telephone subscriptions (in <strong>2000</strong>)54 Source: EIU <strong>Country</strong> <strong>Report</strong> <strong>Romania</strong> <strong>2000</strong>64
3.5.4 Financial servicesSince <strong>1990</strong>, <strong>Romania</strong> has had a two-tier banking system based on a Central Bank andcommercial banks. Despite the overtly expressed discontent of the international financialinstitutions, the privatisation of financial institutions evolved very slowly. At the end of1998, state owned banks still controlled 70% of banking activity, their portfoliosconsisting of many non-performing loans as by-products of soft budget constraints.Privatisation of <strong>Romania</strong>n banking system commenced in December 1998 when themajority stake of the <strong>Romania</strong>n Development Bank was sold to Société Générale ofFrance. Banc Post, Bancorex (the second largest state bank) and Banca Agricola havealso been privatised. The Asset Recovery Agency has been created to absorb andliquidate the banks’ non-performing loans. The <strong>Romania</strong>n National Bank has taken overBancorex’s liabilities abroad. Several banks have been put under surveillance by theCentral Bank, some have already declared bankruptcy, while others have had theirlicenses revoked. Tighter regulations regarding the reserves and the required liquidity areexpected to create further problems in the banking sector.Besides the National Bank, four commercial banks are still entirely owned by the state,being prepared for their privatisation. 32 other commercial banks have private capital, outof which 21 are at least partly foreign owned 55 .The <strong>Romania</strong>n stock exchange started its operations in Bucharest in 1995. In 1996RASDAQ, the electronic market for over the counter transactions was created andenabling citizens to trade the shares they received through the Mass PrivatisationProgramme. The operations of both the Bucharest Stock Exchange and RASDAQ havebeen negatively influenced by the financial crises in Asia in 1997 and in Russia in 1998.Foreign investors withdrew their portfolio investments and caused a significant fall in theBucharest composite index (BET) and the RASDAQ index. Although the BET composite55 Source: National Bank of <strong>Romania</strong>-<strong>Report</strong> <strong>2000</strong>65
index 56 recovered by 32% in 1999 and by 21% in <strong>2000</strong>, its value in <strong>2000</strong> was only halfthe value it had at the end of 1998 (Figure 12).The number of listed companies on the Bucharest Stock Exchange increased from 9 in1995 to 126 in 1999, to decrease to 115 in <strong>2000</strong> and 65 in 2001. The number of tradedshares increased from 42,761 in 1995 to 1,828,468,521 in <strong>2000</strong>. The capitalization of thestock exchange (in USD) grew from 100,369,698 in 1995 to 1,228,524,029 in 2001 57 .Figure 12: Evolution of RASDAQ and BETcomposite indices (July 1998-December<strong>2000</strong>)12001000800600400<strong>2000</strong>1 3 5 7 9 11 13 15 17 19 21 23 25 27 29RASDAQBET CompositeSource: National Bank of <strong>Romania</strong>The insurance market is acknowledged to lag behind the other countries in the region(and significantly below the European Union’s standards). A clear sign of backwardnessresides in the fact that various forms of insurance in <strong>Romania</strong> are bought mainly as aresult of their compulsory character (for instance, legislation requires that car drivers buyinsurance as a civil responsibility). Individuals are not highly motivated to buy their own,private insurance policies, this being perhaps due to their low salaries as well as to theunclear legal status of the private insurance companies 58 . Except for some of the56 BET composite index reflects the overall trend in all stocks transacted on the Bucharest Stock Exchange57 Source: Bucharest Stock Exchange58 For instance, it is usually not clear to the insured how his insurance deposits are protected from inflationand/or from a potential bankruptcy of the insurer. A law of Private Insurance is expected to be passed intothe Parliament, in order to clarify these issues.66
transnational companies, very few <strong>Romania</strong>n companies offer private life or healthinsurance schemes to their employees. At the same time, the vigorous competitionemerging in the last few years on the insurance market between both international andlocal insurance companies has recently increased the availability of and the public'sinterest in private insurance schemes.On average, <strong>Romania</strong>ns spent 16 USD per year on insurance in 2001 (14.12USD I <strong>2000</strong>),an increase against 3USD per year in 1993. In Hungary, Poland and the Czech Republicinsurance spending per head is roughly 10 times higher than in <strong>Romania</strong>. Oneexplanation of this is that in <strong>Romania</strong> regular payments are not tax deductible as in theother countries (Table 18).Table 18: Evolutions on insurance market (1993-2001)TotalLife insurance Annual change of non-life Annual change of lifeinsurance (mill USD) insuranceinsurance(mill USD)1993 60 5.7 - -1994 99 9.8 64.2 71.91995 142 15.5 41.8 58.71996 178 17.4 26.9 12.31997 182 11.3 6.2 -321998 272 22.5 46.1 99.51999 279 32.9 -0.01 46.8<strong>2000</strong> 311 49.2 6.3 49.12001 358 64 12.2 30Note: for the conversion in USD the average annual exchange rate was usedSource: Insurance survey commissionThe promulgation of the Law on Insurance in <strong>2000</strong> is expected to change this situation asa result of the increased transparency and credibility that should result, including thecreation of a Commission of Supervision of Insurance. Moreover, the emergence andrapid growth since 1995 of several competitor private companies (national and67
international) on the insurance market proves beyond doubt that this particular financialsector has strong potential within the <strong>Romania</strong>n economy.3.5.5 Trade and the external sectorDue to Ceausescu’s autarchic policies, <strong>Romania</strong> was a relatively closed economy at theend of the 80s. However, trade was characterised by surpluses, since food and energywere exported in order to speed up the payment of foreign debt. At the beginning of the90s, food and consumer goods were redirected towards satisfying the excess demand onthe internal market. As a result, the exports decreased in the beginning of transition andrecovered gradually during the second half of the 90s. The growth of exports was due notonly to an improvement in the competitiveness of products since the beginning oftransition, but also to the depreciation of the <strong>Romania</strong>n currency in real terms.Table 19: Exports (% of total; US$ m FOB)1991 1992 1993 1994 1995 1996 1997 1998 1999 <strong>2000</strong>Agriculture, foodandbeveragesMineralsand fuelsChemicalproductsTextilesandproductsBasicmetals andproductsMachineryandequipment6.0 6.5 5.5 5.7 5.6 7.9 5.6 4.4 5.6 2.712.5 11.3 10.0 11.6 9.6 7.4 6.1 4.7 5.9 7.96.7 9.6 7.0 7.9 9.4 8.5 6.6 4.0 3.9 5.89.5 10.4 16.0 18.8 19.7 21.4 23.0 26.0 25.8 24.214.9 16.8 19.6 17.3 18.5 15.7 18.4 19.1 15.4 1627.8 22.5 17.2 14.8 13.5 13.8 14.0 14.6 16.9 14Total (%)In US$ m1004,2661004,3631004,8921006,1511007,5201008,0811008,4351008,3001008,50510010,366Source: National Institute of Statistics and Economic Studies68
Nevertheless, the current structure of exports will not be able to generate long termsustainable growth. A large share of exports consists of processing arrangements(particularly with Italy and Germany, countries which take advantage of <strong>Romania</strong>’scheaper labour force), as well as low-value added, labour intensive products (clothing,footwear, furniture). Metallurgical products and electric appliances constitute other major<strong>Romania</strong>n exports, but their competitiveness on the external markets is rather limited.Agriculture, on the other hand, makes a very low contribution to exports, an implicitcomment on the low competitiveness of <strong>Romania</strong>n agricultural products (Table 19).A rather alarming fact is that between 1995 and 1999, the openness of the <strong>Romania</strong>neconomy did not increase significantly. As shown in Table 22, exports as a percentage ofGDP only increased slightly during this period from 23% to 25%. This shows that there isstill a long way to go regarding the comparative advantage of <strong>Romania</strong>n products on theexternal markets and economic growth based on a positive trade balance.Imports consist mainly of machinery and equipment from OECD countries (needed inorder to catch up with technological levels in Western Europe), energy and raw materials(from former USSR countries), textiles and raw materials for processing and reexporting,and food market and consumer goods. The increase in the oil and energyprices abruptly raised the value of imports in <strong>2000</strong> and affected the overall balance ofpayments (Table 20 and Figure 13).Table 20: Imports (% of total; US $ m CIF)1991 1992 1993 1994 1995 1996 1997 1998 1999 <strong>2000</strong>Agriculture,food andbeveragesMineralsand fuelsChemicalproductsTextiles andproducts13.3 15.3 14.5 8.9 8.4 7.4 5.9 8.1 7.7 6.645.3 32.4 28.7 26.8 25.3 20.9 18.9 12.0 12.0 14.57.1 6.6 7.8 7.9 8.8 8.6 8.3 8.7 9.4 8.34.2 9.0 10.1 11.4 12.1 11.7 13.9 15.4 18.6 16.3Basic 4.2 4.3 4.3 5.0 5.3 6.3 5.9 6.7 6.6 6.869
metals andproductsMachineryandequipmentTotal (%)In US$ m16.9 19.3 22.0 25.1 23.4 25.5 26.4 27.1 26.5 24.6100 100 100 1005,793 6,260 6,522 7,109Source: National Institute of Statistics and Economic Studies100 100 100 100 1009,410 11,435 11,280 11,821 10,39210013,054Figure 13: Trade in the 90's14,00012,00010,0008,0006,0004,0002,0000199119921993199419951996199719981999Exports (US$ m) Imports (US$ m)Source: National Institute of Statistics and Economic Studies<strong>Romania</strong>’s main trading partner is the European Union. The Association Agreementsigned in 1995 liberalised trade asymmetrically. EU lifted all ceilings and trade duties in1997 while <strong>Romania</strong> could still maintain some restrictions (until 2001). This asymmetryhas led to a systematic trade surplus with the EU.Other major trading partners for <strong>Romania</strong> are the members of the Central European FreeTrade Agreement (CEFTA )59 and the countries of the Black Sea region (particularlyTurkey). Exports to CEFTA grew by 25% in 1999 and by 46% in <strong>2000</strong>. Trade with59 Hungary, Poland, Czech Republic, Slovakia, Slovenia, Bulgaria70
Russia consists mostly of imports of energy and raw materials, while exports havediminished in the recent years due largely to the financial crisis of 1998. Trade withYugoslavia, a traditional partner, has been negatively influenced by UN sanctions and theKosovo war.<strong>Romania</strong> has encountered major problems in balancing its current account deficits, andincurred deficits in the trade of invisibles every year between 1992 and 1999. The largestcurrent account deficit was reached in 1998 (7.5% of GDP), but reduced in 1999 andreversed into a surplus in <strong>2000</strong> when transfers from abroad countervailed the tradedeficit. Because the flows of foreign direct investment were insufficient, <strong>Romania</strong> had torely frequently on foreign debt in order to cover its trade deficits.Table 21: <strong>Romania</strong>’s main trading partners (% of total)1991 1992 1993 1994 1995 1996 1997 1998 1999ExportsRussia 22.7 9.5 4.5 3.4 1.9 2.0 2.9 0.9 0.5Germany 10.9 11.0 14.3 16.1 18.1 17.1 16.7 19.1 18.2Italy 6.1 6.1 8.3 12.9 15.8 15.9 19.6 21.8 23.4France 4.0 3.9 4.5 5.1 5.8 5.3 5.4 5.7 6.2Netherlands 5.3 2.5 4.3 3.5 3.0 4.0 3.1 3.7 3.5UK 3.7 3.6 3.8 3.3 3.0 2.8 3.5 3.6 4.5Turkey 3.6 5.0 5.7 4.1 4.4 4.7 4.2 3.8 5.0China 3.3 4.6 8.6 4.5 2.4 1.1 0.5 0.2 0.4USA 2.9 1.9 1.4 3.1 2.5 2.2 3.7 3.7 4.0Hungary 1.9 1.9 2.4 2.6 2.2 2.0 2.2 2.6 2.9EU 33.7 32.1 39.3 48.2 54.1 56.5 56.5 64.5 65.5ImportsRussia 24.2 18.3 15.6 16.0 11.8 10.8 11.8 8.8 5.7Germany 13.9 18.9 21.1 20.8 17.3 14.7 15.9 16.9 18.6Italy 4.9 11.2 12.6 13.7 13.1 13.4 15.5 17.0 19.6France 5.2 10.9 10.4 5.9 5.1 4.3 5.6 6.7 7.2Netherlands 2.3 3.5 3.2 2.9 2.6 2.0 2.0 2.3 2.6UK 3.5 4.3 3.5 3.6 2.9 2.4 3.3 3.3 4.1Turkey 3.1 4.0 3.0 2.5 2.4 1.9 1.8 2.2 2.271
China 3.6 1.7 1.9 1.0 0.8 1.0 1.0 1.5 1.3USA 4.3 5.1 7.6 7.6 4.0 3.2 3.8 4.0 3.0Hungary 2.9 4.1 3.4 2.7 3.0 2.1 3.0 4.5 4.2EU 34.1 53.4 56.1 51.4 49.6 52.3 52.5 57.6 60.6South Korea N/a N/a N/a N/a 3.1 3.3 5.0 2.1 2.9Source: National Institute of Statistics and Economic StudiesForeign trade exposure (the share of foreign trade with various countries in total foreigntrade) against various countries are shown in table below. While at the beginning of theperiod 36% of the total foreign trade was oriented toward Russia and Germany, in <strong>2000</strong>the same percentage of the total foreign trade was oriented toward Germany and Italy.The orientation towards the EU market increased from almost 34% in 2001 to almost60% in <strong>2000</strong> (Table 22).Table 22: Foreign trade exposure (%)1991 1992 1993 1994 1995 1996 1997 1998 1999 <strong>2000</strong>Russia 23.56 14.69 10.84 10.16 7.40 7.16 7.99 5.54 3.36 5.15Germany 12.63 15.66 18.19 18.62 17.66 15.69 16.24 17.81 18.42 15.14Italy 5.41 9.11 10.76 13.33 14.30 14.44 17.25 18.98 21.31 20.34France 4.69 8.03 7.87 5.53 5.41 4.71 5.51 6.29 6.75 6.50Netherlands 3.57 3.09 3.67 3.18 2.78 2.83 2.47 2.88 3.01 2.64UK 3.58 4.01 3.63 3.46 2.94 2.57 3.39 3.42 4.28 4.63Turkey 3.31 4.41 4.16 3.24 3.29 3.06 2.83 2.86 3.46 3.87China 3.47 2.89 4.77 2.62 1.51 1.04 0.79 0.96 0.89 1.08USA 3.71 3.79 4.94 5.51 3.33 2.79 3.76 3.88 3.45 3.31Hungary 2.48 3.20 2.97 2.65 2.64 2.06 2.66 3.72 3.61 3.68EU 33.93 44.65 48.90 49.92 51.60 54.04 54.21 60.45 62.81 59.79Source: own computationCumulated Foreign Direct Investment in <strong>Romania</strong> (Table 23) 1991-1997 amounted toUSD 4.5 billion, with a sharp increase between 1996 and 1997. It further increased byUSD 2 billion in 1998 (mainly because of the privatisation of Romtelecom, <strong>Romania</strong>’stelephone company), but it decreased to USD 1 billion in 1999 and to USD 666 million in<strong>2000</strong>. The level of FDI per capita in <strong>Romania</strong> remains extremely low (in 1999, it72
amounted to 240 Euro in comparison to 1518 in Czech Republic and 1900 in Hungary) 60as a consequence of years of economic, legislative and institutional instability.The leading investors are France (due to Renault’s acquisition of <strong>Romania</strong>’s mainautomobile factory), Germany, South Korea (Daewoo has built its main European plantin <strong>Romania</strong>), the Netherlands and the US (Coca-Cola).Table 23: Balance of payments – selected items (US$ m)1991 1992 1993 1994 1995 1996 1997 1998 1999 <strong>2000</strong>Trade balance -1,106 -1,194 -1,128 -411 -1,577 -2,470 -1,980 -2,625 -1,092 -1,684Current-accountbalanceDirectinvestmentIn <strong>Romania</strong>-1,012 -1,506 -1,170 -428 -1,780 -2,579 -2,137 -2,918 -1,296 -1,35937* 73* 87* 341* 419 263 1,215 2,031 1,041 1,154Overall balance -152 -94 -458 -357 -1,097 -245 -888 -130As percentage of GDPCurrent-accountbalance-2.62 -4.43 -3.28 -1.15 -4.45 -6.21 -5.5 -8.00 -4.00 -3.68Exports 11.03 12.37 13.67 16.54 19.86 19.53 21.69 22.2 23.2 28.1Exports+Imports (FOB)24.9 28.7 30.5 34.2 43.7 45 48.5 51.6 49.8 60.8* net of <strong>Romania</strong>n direct investment abroadSource: National Institute of Statistics and Economic Studies, IMF, own calculations4. <strong>Romania</strong> <strong>2000</strong>: <strong>Growth</strong> and Development PerspectivesDoes the special blend of a troubled legacy and the implemented transformations duringthe last decade translate into economic performance? The standard measures of growthand income would indicate an overall negative situation. However, the structural analysiswould show the existence of a growth potential and that the track the economy is engagedupon could, under certain conditions, lead to a more promising economic performance.60 Source: EIU <strong>Country</strong> Profile <strong>Romania</strong> <strong>2000</strong>73
The transformation of a hyper centralised economy into market economy assumed achange from the socialist monopoly type of institutional framework. Such a framework isstable and did not have to improve to survive. Soft budget policy extended economy wideis quite appropriate for such a situation. Changes can occur only when competitionappears (in terms of more organisations in the polity and in the economy). Since theinstitutional matrix defines the set of opportunities making income redistribution orproductive activity the highest pay-off in the economy, the speed and the direction ofchange of the above mentioned institutions is critical for growth.If the highest rate of return comes from rent seeking, we can expect that the organisationswill invest in skills and knowledge that will make them more efficient in rent seeking.Similarly if there are high returns to productive activities we will expect organisations tospend resources that will increase productivity. Our goal is to underline the fact that onlya productive activities pattern as opposed to a rent seeking pattern is the condition tosustainable growth.In the following sections, after showing examples of the standard measures for growth,we try to identify the productive sectors with the highest pay-off and the potential enginesfor future growth.4.1 Income and growth attainmentsThe economics of growth within the process of EU accession is based on the assumptionthat incomes and living standards should converge towards EU standards. The task for<strong>Romania</strong> is tremendous. The GDP per capita in PPP is 6 times lower than in EU, 4 timeslower than in Greece and 2.5 times lower than in Poland, the country with the lowestGDP per capita among the first wave of accession countries (Table 25).Not only the income per capita is low, but also the distribution of income amongindividuals is uneven. While half of employees with the lowest income belong to theseventh deciles of income (up to 60 USD monthly average income in 1999), half of theunemployed and peasants with the lowest income belong to the second decile (up to 3074
USD monthly average income in 1999) 61 . The income is the most evenly distributedamong pensioners and employees.Fig. 14 Income distribution by deciles in 1999%10090807060504030201001 2 3 4 5 6 7 8 9 10employees employers peasantspensionersunemployedSource: National Institute of Statistics and Economic StudiesThe GINI coefficient (Table 24) computed for these five social categories fluctuatesduring the last decade registering the highest values in 1995-1996. In <strong>2000</strong> it reached thelowest value of 19.6% indicating a decline of income inequalities among the five socialcategories.Table 24: Gini Coefficient1989 1992 1994 1995 1996 1997 1998 1999 <strong>2000</strong>23.38 25.46 28.66 44.4 31.7 24.6 26 28.7 19.6Source: World Bank Deininger and Squire Data Set for 1989-1994, own computation for 1995-<strong>2000</strong> basedonnn∑∑i= 1 j=1x − xi_22nxj, where x i represents the income level of various social categories, n the number ofsocial categories and_x the average income levelClosing the income gap with the EU will require that <strong>Romania</strong> raise its real GDP growthto rates that it has never attained before. Assuming an average real growth of 5% per year61 The figures are not PPP adjusted; beyond this they reflect only the surveyed income. Our estimation is75
and an EU average growth rate of 2% per annum, it would take 45 years to close the gap.<strong>Romania</strong> would need to grow annually by 7% to catch up with the EU in 2025 62 . Theforecasted growth rates for the period 2001-2004 in “<strong>Romania</strong>’s medium term nationalstrategy of economic development” are more modest, around 4.75%, while the variousforecasts for 2001 of the international agencies are even lower (1-2%) given the globalrecession.However, there are a few elements that justify the belief in the beginning of convergence.Firstly, the positive growth trend started in <strong>2000</strong> (1.8%) and continued in 2001 (5.3%).Secondly, in the past <strong>Romania</strong> proved to be rather insulated from the ups and downs ofthe world markets, therefore it is likely that external influence will be limited. Thirdly,the economy finally resolved some of the domestic problems which made the economicstabilisation vulnerable, such as the creation of a sound banking system and a reformedfinancial system based on a more equilibrated tax system where indirect taxes tend toreplace excessive direct taxes. Fourthly, the economy escaped from the constraining lackof foreign reserves.Table 25: Total GDP and per capita GDP in <strong>2000</strong>GDP at current market price GDP per capitaPPP Current PPP Currentexchange rateexchange rate(bill USD) (bill USD) (USD) (USD)Eurozone 9006.6 7849.9 23500 20500Greece 169.3 111.8 16000 10600Czech Republic 143.6 49.6 14000 4800Hungary 122.3 46.1 12200 4600Poland 358.9 163.8 9300 4200Slovak61.5 19 11400 3500Republic<strong>Romania</strong> 87.4 * 36.7 3900 * 1639Notes: * 1999Source: National Accounts of OECD Countries, OECD, Paris, 2001that real figures are about the double.62 IMF <strong>Country</strong> <strong>Report</strong>, <strong>2000</strong>76
4.2 The accuracy of the available data<strong>Romania</strong> is a transitional country, where, after an initial recession growth recovered, felland recovered again during the last decade. Over the decade the annual average GDP was80% of GDP level registered in 1989.4.2.1. Is the output loss as deep as the figures show it?There are arguments in favour of a negative answer that hinge upon the degree ofstatistical data accuracy. The upward bias in the price indices and the unregisteredeconomy (grey or black economy) might attenuate the measured output loss. The amountof real output might be underestimated due to the inability of official statistical servicesto capture the expansion of private sector activities (Rosati, 1994) or due to the upwardbias of price indices 63 (Filer and Hanousek, <strong>2000</strong>). While the first source of bias could beacute during the beginning of the period when the reorganisation of the statistical servicesoccurred 64 , the second source of bias had effects over the whole period taking intoaccount that annual inflation was never brought down below 50%.Over the last decade the cumulative increase in reported consumer prices was114,617.4% and the weights used for averaging the increases in individual prices wereupdated in 1993 and 1995. Under these conditions one might legitimately believe that theeffects of consumer substitution, outlet substitution, quality improvement and theintroduction of new goods (Filer and Hanousek, <strong>2000</strong>) were poorly measured and upwardbiased the computed price indices. Since the individual prices increased at different ratesduring the period it is reasonable to expect the presence of consumer substitution bias due63 According to IMF mission (<strong>2000</strong>) that analyzed the soundness of <strong>Romania</strong>n statistics, CPI and PPIfollow sound methodological practices and exhibit good conventional coverage of their topical areas. Theprincipal issue regarding the CPI is the relevance of the index weights for measuring current pricedevelopments. Annual re-weighting would enhance the relevance of the CPI as a current indicator of prices.As far as PPI is concerned, IMF mission noticed the abrupt reduction of the coverage of the PPI from thevalue of all shipments of the covered industries to shipments for domestic uses only beginning with 1998data. In addition to reintroducing the coverage of exported production into the PPI, the speed of structuralchange in <strong>Romania</strong> indicates annual updating rather than re-weighting the index every five years wouldimprove its relevance.64 According to IMF mission (<strong>2000</strong>), the real sector statistics has solid methodology and there is a high andeffective level of coordination across governmental agencies and institutions in the production of real,financial and external sector data. The national accounts estimates for both quarterly and annual series ongross domestic production are methodological sound and well executed.77
to the fact that consumers revise their consumption patterns, substituting commoditieswith relatively low price increases for those whose prices rose faster. Qualityimprovement bias occurs when statistical agencies attribute to inflation part of a priceincrease due to improved quality instead. Outlet substitution bias occurs when new, lessexpensive distribution channels are excluded by re-sampling from the same outlets as inthe base period. Similarly, due to price evolution during the lifetime of a product theintroduction in the consumer basket of a new good early tends to upward bias the overallprices. New goods bias occurs because of the time laps between the moment that the newgood enters a market and the moment the goods are included in the measured inflation.For an annual 6.6% upward bias in the price deflator rate, the GDP in 1999 is the same asthat in 1989, while for an annual of 8.2% upward bias in the price deflator rate theaverage annual GDP over the last decade is the same as at the outset of reforms in 1989.If inflation measures were upward biased by more than 8.2% annually, eliminating thebias would show that <strong>Romania</strong> grew during the 90s 65 . Moreover, the output growth pathwould have been characterised by milder fall during the recessions and a stronger outputrecovery in between. Thus, the elimination of the price bias would have smoothed theoutput growth path (Table 26).Table 26: Output losses or gains: statistical artefactsOfficial outputrateOutput rate for annual6.6% upward bias in pricedeflatorOutput rate for annual8.2% upward bias in pricedeflator<strong>1990</strong> -5.6 -4.56 -4.731991 -12.9 -7.37 -8.331992 -8.8 -2.92 -3.931993 1.5 8.34 7.171994 3.9 9.70 8.721995 7.1 9.71 9.291996 3.9 6.94 6.451997 -6.9 -1.57 -2.4765 The probability that the measured transition recession appears more severe that the actual economicdecline is high. The upward bias in inflation measure for which the output would grow is relative smallcompared to the upward bias found in a more stable environment like US, where the upward bias in CPIwas found to be one third during <strong>1990</strong>s.78
1998 -5.4 -2.22 -2.751999 -3.2 -0.35 -0.83<strong>2000</strong> 1.6 4.79 4.26Source: own computation, based on data from the National Bank of <strong>Romania</strong> <strong>Report</strong> <strong>2000</strong>4.2.2. The effects of the unregistered economy on output growth pathThe existing estimates for the size of the shadow 66 economy in the transition countriesfrom Central and Eastern Europe show an increasing shadow economy in <strong>Romania</strong> as inHungary, but unlike the situation in Poland and the Czech Republic (Table 27). The sizeof the shadow economy depends on the measurement approach applied. It is smaller(around 18% of GDP) when the difference between the growth of official GDP and thegrowth of electricity consumption is attributed to the growth of the shadow economy(Johnson et al, 1997). It is larger (around 30% of the GDP) when an estimate ofhousehold electricity consumption is used (Lacko, 1999).Table 27. Shadow economy (as % of GDP) in <strong>Romania</strong> and Visegrad countriesAverage 1989-<strong>1990</strong> Average <strong>1990</strong>-1993 Average 1994-1995Johnson Lackó Johnson Lackó Johnson LackóCzech Republic 6.4 23 13.4 28.7 14.5 23.2Hungary 27.5 25.1 30.7 30.9 28.4 30.5Poland 17.7 27.2 20.3 30.8 13.9 25.9Slovak Republic 6.9 23 14.2 30.6 10.2 30.2<strong>Romania</strong> 18 20.9 16 29 18.3 31.3Sources: from Table 5 from Shneider and Enste (<strong>2000</strong>)Under the assumption that the size of the shadow economy remained the same size untilthe end of the decade as it was estimated to be in 1994-1995, the annual average GDPover the decade represents 80% of the GDP in 1989 under Johnson’s estimation and 86%of GDP in 1989 under Lacko’s estimation 67 . Consequently, even taking into account the66 A good survey on issues related to the shadow economies is that of Schneider and Enste (<strong>2000</strong>).67 Johnson’s estimations for 1994-1995 were confirmed by a pilot survey we conducted on 1500 individualsand 450 private enterprises in the spring of <strong>2000</strong>.79
shadow economy, this neither attenuates the deepness of recession during the last decadenor the fluctuations in the output growth path.Table 28: The Output growth path with registered shadow economy<strong>1990</strong> 1991 1992 1993 1994 1995 1996 1997 1998 1999 <strong>2000</strong>Lacko -5.6 -7.06 -8.8 1.5 5.75 7.1 3.9 -6.9 -5.4 -3.2 1.6estimatesJohnson -5.6 -14.3 -8.8 1.5 5.96 7.1 3.9 -6.9 -5.4 -3.2 1.6estimatesOfficial -5.6 -12.9 -8.8 1.5 3.9 7.10 3.9 -6.9 -5.4 -3.2 1.6growthratesSource: own computations based on Lacko’s and Johnson’s estimatesThe joint effect of shadow economy and the elimination of the upward bias in prices arepresented in the following graph.Fig. 15 Official and adjusted output growth path15105%0-5-10-15<strong>1990</strong> 1991 1992 1993 1994 1995 1996 1997 1998 1999 <strong>2000</strong>Lacko Johnson officialSource: National Institute of Statistics and Economic Studies; own computationsAlthough the output growth path appears to be smoother by taking into account theshadow economy and by eliminating the upward bias, the overall shape remains.4.3 Resource reallocation versus input accumulationThe ultimate goal of the transition from a planned to a market economy is theimplementation of a framework promoting growth. <strong>Growth</strong> is therefore the measure of theeffectiveness of reforms during transition. Fischer et al. (1996a) state that80
“a useful way to think about the current growth prospects of the transitioneconomies is to consider them subject to two sets of forces: those arising from thetransition and transformation process, and the basic neo-classical determinants ofgrowth. The further along a country is in the transition process, the less weight onthe factors that determine the transitional growth rate, and the greater the weighton the standard determinants of growth.”We adopt this view to structure the discussion on the current growth achievements andthe prospects of further growth. The analysis is carried on in two steps. The first stepanalyses the set of forces arising from the transition and transformation process byidentifying the structural changes occurred during the last decade and assessing theireffects on growth. The second step analyses the basic neo-classical determinants ofgrowth and their contribution to growth.4.3.1 Structural changesAlthough the transition process has not been able to build a framework for promotinggrowth, it has brought considerable changes to the economic structure overall, inparticular adjustments in line with emerging market needs.4.3.1.1 Production structureAccording to the theory, with the phasing out of subsidisation, the relative prices change.The sector whose relative price decreases contracts and the sector whose relative priceincreases expands. According to <strong>Romania</strong>n data, the sector whose share in total GDPdecreased was industry (including construction). The share of industry in GDP declinedfrom 51.5% in 1989 to 32.6% in 1998 (Table 29). The share of industrial work forcedeclined from 38 to 30.7%.Agriculture expanded over the period, although it employed the largest share of labourforce (28% in 1989) and produced the largest share of GDP (14.4% in 1989) compared tothe Visegrad countries at the outset of reforms. In 1998, agriculture employed 38% of thetotal employment and produced 13.9% of GDP. Agriculture absorbed a large part of the81
layoffs from industry. This unusual expansion was due to the restitution of land to theformer owners.The share of the labour force employed in services increased by 7%. Nevertheless, thissector employed a smaller share of the labour force (41.3%) in 1998 than the same sectordid in the Visegrad countries. Despite the slow employment absorption, the share in GDPof services increased quickly over the period from 34.1% to 52.5% in 1999. This suggeststhat services are a high productivity sector which might be an important potential sourceof future growth.Table 29. GDP and labour force distribution across sectors (%)Agriculture Industry Services1989 <strong>2000</strong> 1989 <strong>2000</strong> 1989 <strong>2000</strong>Value addedGreece 7.9 11.6 23.6 27.1 68.5 61.7Czech Republic 8.4 1 3.9 48.8 1 39.9 42.8 1 56.2Hungary 8.5 2 4.8 35.4 2 32.4 55.9 2 62.8Poland 7 3 3.3 43.6 3 36.2 49.4 3 60.5Slovakia 5 4 4.5 39.1 4 34.1 55.9 4 61.3<strong>Romania</strong> 14.4 11.1 51.5 35.8 34.1 51.5Labour forceGreece 25.3 17 27.5 22.9 47.1 60.1Czech Republic 11.9 5.1 47.1 39.5 41 55.4Hungary - 6.5 - 33.8 - 59.7Poland - 18.8 - 30.8 - 50.4Slovakia - 6.7 - 37.3 - 56.1<strong>Romania</strong> 28 38 5 38 30.7 5 34 41.3 5Notes: 1 <strong>1990</strong>, 2 1991, 3 1992, 4 1993, 5 1998.Source: National Accounts of OECD countries, OECD, Paris 2001; National Accounts 1985-1997, OECD,Paris, 1999; Labour Force Statistics 1979-1999, OECD, Paris 20014.3.1.2 Ownership StructureEmpirical evidence for market economies seems to indicate that private enterprises aregenerally more efficient then those which are state owned (Gylfason and Zoega, 1998).82
The determinants of the efficiency differential are mainly related to a differently bindingbudget constraint. While the private sector finds it difficult to get public assistance andtherefore the penalty for failing to maximise profits is harsher (i.e. bankruptcy), stateowned enterprises always can use interest group pressure to extricate themselves frominsolvency. The differently binding budget constraint leads to a difference in objectivesand time horizon. Private firms maximise profits, while state owned enterprises maximisesurvival. Due to the difference in objectives, state owned enterprises are generally lessinnovative (Aghion, Dewatripont and Rey, 1995) and less efficient. By delaying updatingtheir technology, state owned enterprises weaken the innovation incentives of the wholeproduction system and become a source of negative externalities for the more innovativeprivate firms.In a concentrated market structure, the viable firms can find themselves stuck to theirproduction links with unviable state owned enterprises. Therefore, viable enterprises caneasily become prisoners of the market structure. The development and persistence oftrade arrears during 1991, nowhere more explosively than in <strong>Romania</strong>, showed how theunviable firms transmitted their own inefficiencies to viable firms and were sufficientlydamaging to cause a financial collapse.The growth prospects of transition countries with an overwhelming state owned sectorand a monopolistic production structure strongly depend on the fulfilment of twoobjectives of the reform package: privatisation and competition. The deeper the reformprocess, the larger the private sector share and the more competitive the market.<strong>Romania</strong> started the transition period with an inherited private sector producing 12.8% ofits GDP in 1989 and employing 5.9% of the labour force (Table 30). At the end of thedecade, the private sector was producing 65.5% of the total GDP with 75% of the totallabour force. Although the endowment of the private sector with fixed assets increasedduring the period, it did not exceed 26% of total fixed assets in <strong>2000</strong>. The data clearlyindicates that the private sector is a labour-intensive sector (in both the areas ofagriculture and trade). The most privatised sector as of <strong>2000</strong> was agriculture with 97% of83
all agricultural workers employed in the private sector. Industry was one of the leastprivatised sectors with 66% of industrial workers employed in the private sector (Table31).Table 30: The Weight of the Private Sector in the Economy (%)Tangible GDP Investment Labor forceFixed Assets1989 <strong>2000</strong> 1989 <strong>2000</strong> 1989 <strong>2000</strong> 1989 <strong>2000</strong><strong>Romania</strong> - 25.7 12.8 65.5 - 58.3 5.9 75Poland 44 1 57.8 3 51 2 70.8 3Notes: 1 1992, 2 <strong>1990</strong>, 3 1998Source: Statistical Yearbook of <strong>Romania</strong> and Poland, 1999Table 31. Employment distribution by Type of Ownership and Sectors in <strong>2000</strong>(%)State majority Private majorityTotal 24.96 75.04Agriculture 1 2.49 97.51Industry 2 33.48 66.52Construction 15.01 84.99Trade 3 5.29 94.71Transport 4 63.96 36.04Services 5 77.67 30.86Notes: 1 including forestry, 2 including mining, manufacturing and electric and thermal energy, gas andwater, 3 including hotels and restaurants, 4 including post and communication, 5 including financial banking,real estate, public administration, education, health and other.Source: own computation based on Statistical Yearbook of <strong>Romania</strong>, 2001Another important indicator of change in structure is the increasing number of small andmedium size enterprises (SMEs). While the planned economy was characterised by arelatively small number of large firms in order to simplify the task of centralmanagement, in transition SMEs (firms with less than 250 employees) gain an importantrole (Table 32). There is a clear positive correlation between the degree of privatisationand the number of SMEs. The share of private SMEs in total private turnover, grossinvestment, direct exports and value added is higher than the share of all SMEs in totalturnover.84
Table 32: The share of active SMEs in total turnover, gross investment, directexports and value added by sectors and ownership in <strong>2000</strong>Turnover Gross investment Direct exports Value addedAllSMEsPrivatemajorityAllSMEsPrivatemajorityAllSMEsPrivatemajorityAllSMEsPrivatemajoritySMEsSMEsSMEsSMEsTotal 56.06 71.92 27.24 58.80 20.53 27.10 39.53 58.22Industry 27.10 44.49 12.76 38.15 21.03 27.83 24.51 38.79Construction 57.84 62.60 23.53 64.50 35.40 38.65 57.81 62.04Sale, maintenance andrepair of motorcycles,retail of fuels formotor vehicles91.02 91.03 94.03 94.04 100.0 100.0 88.93 89.14Retail, repair of 95.36 96.03 90.59 90.65 100.0 100.0 93.52 94.84personal andhousehold articlesWholesale 86.51 86.60 86.49 86.51 6.20 5.97 88.08 88.35Market service for 71.63 49.99 75.72 79.40 100.0 100.0 56.30 70.80populationMarket service for 42.48 72.86 39.98 64.02 31.48 92.26 27.17 59.24enterprisesSource: own computation based on data from Statistical Yearbook of <strong>Romania</strong>, 2001The SMEs increased their share in total turnover from 31% in 1992 to 54% in <strong>2000</strong>. Theemployment share of SMEs increased as well from 20% in 1992 to almost 47% in <strong>2000</strong>.These firms were distributed mainly in trade and construction sectors where theyachieved 90% respectively 55% of turnover and 93% and respectively 56% ofemployment in <strong>2000</strong> (Table 33). In manufacturing SMEs produced almost 35% of totalturnover and employed almost 35% of total manufacturing employment in <strong>2000</strong>.Table 33: Active SMEs share in total turnover and employment by branches1992 <strong>2000</strong>Turnover (%) Employment (%) Turnover (%) Employment(%)Total 30.9 12.3 54 46.9Mining 0.2 0.4 1.8 4Manufacturing 11.2 5 34.6 35.3Energy 1.7 3.9 2.2 9.6Construction 20.7 14.1 55.4 55.7Trade 62.3 36.1 90.2 93.2Transport 12.7 10.2 38.6 31.5Post 4.3 0.9 12 9.6Source: Statistical Yearbook of <strong>Romania</strong>, 1998-200185
4.3.2 Are structural changes favourable to growth?<strong>Growth</strong> depends on employment redistribution across sectors. Labour migrates betweensectors in seeking high returns. Migration takes place when the present discounted valueof the new job is higher than that of the status quo (employment or unemployment).Assuming that higher returns are possible where productivity is higher, one can expectthe expansion of high productivity sectors. If this is really so, the percentage change inproductivity (the first column in Table 34) should be higher than the percentage change inproductivity due exclusively to change in sectoral productivity (the second column inTable 34). The difference between these two measures represents the change inproductivity due exclusively to changes in the sectoral employment distribution (the thirdcolumn in Table 34).Table 34: Impact of structural shift in employment on the economyChange in Productivity Of which:<strong>Growth</strong>(1)=(2)+(3)Change due to sectoralproductivity(2) 1 Change due to sectoralemployment distribution(3) 11991 -9.9 -10 0.11992 -3.5 -3.1 -0.41993 8.7 8.6 0.11994 4.8 6 -1.21995 12.4 12.3 0.11996 5.4 5.5 -0.11997 -3.5 -1 -2.51998 -2.3 -2.5 0.2n∑sit −1 ( wit− wit−1)1 i=1( 2 ); ()=n∑i=1wit−1sit −1n∑w itsit− s it−1 3 =i=1n;w s∑i=1it−1it −1w it is the gross value added per employed in sector i, year t; s it is the share of employed in sector i, year t intotal employment; n=8 the number of sectors into which the economy was broken.Source: own results, based on data from Statistical Yearbook of <strong>Romania</strong>, 1991-199786
The computations show that over the period the change in productivity was mainly due tochanges in sectoral productivity rather than changes in sectoral employment distribution.The effect on overall productivity change of the changes in sectoral employmentdistribution was erratic and small. The change in productivity is procyclical, while thechange in sectoral distribution of employment is random.Table 35: Impact of structural shift in employment in industryChange due toChange in Of which:Productivity <strong>Growth</strong> Change due to(1)=(2)+(3)sectoral productivity(2) 1 sectoralemploymentdistribution(3) 11991 -10.3 -10.4 0.11992 -4.1 -4.2 0.11993 -1.7 -1.6 0.11994 10.1 10.1 01995 18.3 18.3 01996 15.1 15.3 -0.21997 -0.4 -0.4 01998 -7.6 -7.6 0n∑sit −1 ( wit− wit−1)1 i=1( 2 ); ()=n∑i=1wit−1sit −1n∑w itsit− s it−1 3 =i=1n;w s∑i=1it−1it −1w it is the gross value added per employed in sector I, year t; s it is the share of employed insector i, year t in total employment; n=22 the number of sectors into which the industrywas broken.Source: own results, based on data from Statistical Yearbook of <strong>Romania</strong>, 1991-<strong>2000</strong>In industry the contributions of changes in sectoral employment to productivity growthalthough positive, excepting 1995-1996, were weak (Table 35). However, in industry,unlike in the economy, there seems to be a positive effect of employment redistribution,showing that the labour flowed into more productive sectors. The labour that flowed out87
from industry was redundant and the downsizing was a necessary step for productivityimprovement. The exception years were 1995 and 1996, the pre-election years in whichthe restructuring process presumably was reduced.Overall, the evidence shows that although important structural changes occurred duringthe last decade their effect on growth was weak, due possibly to the stop and go nature ofrestructuring.4.4 The accumulation processAll theoretical approaches to growth emphasise the fundamental role of capital (humanand physical) for growth. The larger the amount of savings and the more capable acountry is in redirecting them toward efficient uses, the faster the physical capitalaccumulation and the higher the growth rate 68 . The prospects for growth are augmentedwhen a country is able to attract and absorb productively foreign savings.The saving and investment ratios in <strong>Romania</strong> reflect the serious difficulties the countryhad in the process of economic transformation. The prevailing trend throughout thewhole decade has been a decline in savings and investment, a reflection and a cause ofthe prolonged transformation recession.68 Earlier (pre-neo-classical) growth models such as the Harrod-Domar model implied a direct link betweenthe short run rate of economic growth and the level of current investment. Consequently an economy has tohave a positive and sufficiently large marginal saving rate in order to embark on a self-sustained growth.Some endogenous neo-classical growth models (Lucas, 1988) hinge on the introduction of “human capital “variable which is an input in the production function and whose present value depends on past savings andinvestment decisions. Other endogenous growth models (Romer, <strong>1990</strong>) assume a relation betweeninvestment and the level of productive efficiency, which provides a link between savings/investment andthe rate of growth. In Keynesian models where output is demand determined and suppliers produce what isdemanded at a given price level, the investment affects growth as long as it affects demand. In theframework of an open economy (Mundell-Fleming model) the relationship between demand and growthbecomes more complex due to the effect of exchange rate regime.88
Fig. 16 Saving and investment ratios*3025201510* ratio of GDP93 94 95 96 97 98 99gross % savinggross investmentSource: National Institute of Statistics and Economic Studies, own computationsAlthough savings started recovering in 1999, investment continued to decline. Between1994 and 1996 the steep fall in savings did not generate a similarly steep fall ininvestment. On the contrary in 1996 the investment ratio slightly increased. Theexplanation is that the country succeeded in attracting more foreign savings (slightlyabove 1% of GDP) invested in more new assets than before. The figures on the amount offoreign direct investment (Table 36) show a cyclical path similar to the political cycle.The amount of FDI boomed during the period under the reign of pro-reform governments(1997-<strong>2000</strong>). However the boom of investments did not reflect this large flow of FDI.This period was characterised by the boost of the privatisation process; FDI representingmainly acquisitions of existing plants and equipment which implied just a transfer ofassets rather than the creation of new ones. Most of the inflow of foreign resources wasabsorbed by the state budget since a large majority of the acquisitions involved thepurchase of state assets.Table 36: Foreign direct investment in <strong>Romania</strong> and Visegrad countries (m USD)1991 1992 1993 1994 1995 1996 1997 1998 1999 <strong>2000</strong><strong>Romania</strong> 40 77 94 341 419 263 1215 2031 1041 998% of GDP 1.39 0.04 0.36 1.13 1.18 0.74 3.48 4.89 3.06 2.89Czech R. 513 1004 654 869 2562 1428 1300 3718 6324 4595Hungary 1459 1471 2339 1146 4453 2275 2173 2036 1970 1957Poland 117 284 580 542 1132 2768 3077 5129 6471 9461Slovakia 82 100 168 250 202 330 161 508 330 2075Source: from UNECE Table B.1789
The human capital stock employed declined quantitatively and qualitatively. Employmentin <strong>1990</strong> amounted to almost 11 million persons, while in <strong>2000</strong> it declined to only 8.6million. Both the age structure and the education structure of employment changedduring the last decade. The age structure of employment in <strong>2000</strong> compared to that from1995 shows an ageing work force. The share of employees aged above 65 increased from6.8% in 1995 to 9.9% in <strong>2000</strong>, while the share of employees in the age group 35-49declined from 37.5% to 33%. Consequently the education level of employment declined,since the older generations have lower school attainment. While the share of employeeswith higher education and vocational schooling did not change since 1995, the share ofemployees with only secondary and primary school increased from 19.6% to 21.5%respectively from 13.4% to 14.3%.Table 37: Employment structure by age group and training level in <strong>2000</strong> (1996)Total 15-24 25-34 years 35-49 years 50-64 years 65 years andyearsaboveTotal 100 11.78 26.35 33.04 18.94 9.89(100) (13.1) (24.5) (37.5) (18.1) (6.8)Higher education 9.06 0.32 2.85 4.00 1.80 0.10<strong>2000</strong>1996 (9) (0.2) (2.5) (4.6) (1.6) (0.08)Speciality post 4.39 0.31 1.11 1.85 1.08 0.05high school ortechnicalforemeneducation, <strong>2000</strong>1996 (4.9) (0.3) (0.8) (2.85) (1) (0.02)High school 29.17 3.78 12.65 10.77 1.82 0.151996 (31) (6.3) (12.8) (10.2) (1.6) (0.14)Vocational, 21.57 2.82 6.67 9.32 2.58 0.20complementaryor apprenticeship1996 (22) (3.3) (6.2) (10.5) (1.8) (0.12)Secondary 21.55 3.85 2.63 6.01 6.23 2.82school1996 (19.6) (2.5) (2) (7.5) (5.6) (2)Primary or 14.26 0.71 0.45 1.09 5.43 6.58withoutgraduated school1996 (13.4) (0.5) (0.3) (1.8) (6.4) (4.4)Source: Statistical Yearbook of <strong>Romania</strong>, 1996-2001Table 38: <strong>Growth</strong> of GDP, employment and GDP employment ratio (annual averagerates)90
GDP <strong>Growth</strong> rate (%) Employment growth rate (%) Employment productivitygrowth rate (%)EconomyEconomy Industry Economy Economy(excluding(excludingAgriculture)Agriculture)Industry Economy Economy(excludingAgriculture)Industry<strong>1990</strong>-<strong>2000</strong> -2.07 -2.23 -3.2 -2.11 -3.03 -6.24 0.03 0.8 3<strong>1990</strong> -5.6 -13.7 -5.5 -0.9 -2.3 -3.5 -4.7 -11.4 -21991 -12.9 -9.6 -16.7 -0.5 -0.3 -5.1 -12.4 -9.3 -11.61992 -8.8 -9 -12.8 -3 -7.4 -13.2 -5.8 -4.6 0.41993 1.5 -0.9 -13.7 -3.8 -8 -8.2 5.3 7.1 -5.51994 3.9 5.3 1 -0.5 -1.1 -4.8 4.4 6.4 5.81995 7.1 7.2 3.4 -5.1 -2.2 -5.8 12.2 9.4 9.21996 3.9 4.8 5.6 -1.2 -2.8 1 5.1 7.6 4.61997 -6.9 -6.7 6.8 -3.8 -6.9 -10.6 -3.1 0.2 17.41998 -5.4 -3.6 -8 -2.3 -3.1 -5.4 -3.1 -0.5 -2.61999 -1.2 -1.7 -1.5 -2.9 1.2 -9 1.7 -2.9 7.5<strong>2000</strong> 1.6 3.4 6.2 0.8 -0.5 -4.1 0.8 3.9 10.3Source: own computation based on data from National Commission of StatisticsOverall, transition has meant a decline in employment, in the participation rate, and inoutput (Table 38). The annual average growth rate over the period in the economy is –2%or –2.2%, excluding agriculture. A peculiarity of <strong>Romania</strong>n transition is that althoughagriculture in some years reduced the intensity of recession, on average it deepened therecession. According to the measure of output per worker, declining employment adds onan average 2% per year to the per capita growth rate. The flows of the labour force intoagriculture have been significant. Removing agriculture from the analysis the decline ofemployment is even higher by an additional 1% per annum, reflecting the expansion ofthe agricultural employment. The most sharply declining sector during the decade wasindustry. On average employment declined by more than 6% per year. This unusualprocess of de-industrialisation accompanied by the development of agriculture is a sign oftechnological regress according to Earle (1997). The main reason for the massiveemployment flow into agriculture was land reform, which re-established the propertyrights of the former owners. However, the land was not allowed to be sold and the formerowners, most of them workers in towns, had to return to the countryside. For many ofthem, this was a better alternative than unemployment.Weak processes of capital accumulation and wastes of valuable human capital reflectedby the deceiving output performance that characterised the last decade of transition. The91
next section quantifies the effects of the accumulation process on growth both ateconomy and manufacturing levels using the method of growth accounting.4.5 <strong>Growth</strong> accounting<strong>Growth</strong> accounting, which was pioneered by Abramovitz (1956) and Solow (1957), stillremains after forty years a dominant approach for distributing growth acceleration ordeceleration between factor accumulation and productivity growth. It shows whether thegrowth process is intensive (i.e., when it is based on productivity growth) or extensive (i.e.,when it is based on input factor growth). <strong>Growth</strong> accounting is “especially useful if thedeterminants of factor growth rates are substantially independent from those that matter fortechnological change.” (Barro, 1998) In the early stages of transition, the determinants offactor accumulation were the relative price changes during the implementation of priceliberalisation. Therefore, it can be argued that factor accumulation has a certain degree ofindependence from the determinants of technological changes.There are two ways to obtain TFP or Solow residuals: the econometric approach and thenational account approach (non-parametric procedure). Both approaches have advantagesand disadvantages. The regression approach has the advantage of not restricting the socialmarginal product of inputs (labour and capital) to their costs (wage and rental rates). Thedisadvantages (Hulten, <strong>2000</strong>; Barro, 1998; Roldos, 1997; Sarel, 1997; Burnside et al, 1996)are the following: first, growth rates of inputs are considered exogenous and output rates areendogenous, although factor growth rates may be correlated to unobservable technicalchange and there is the danger of simultaneous equations bias; second, factor shares areusually estimated to be similar across countries (sectors) or over time due to a limitednumber of data observations; third, the estimation of factor shares needs to rely on thecorrect measurements of growth rates of the factors of production; fourth, in many cases thestock of input is unlikely to be the same as the stock of input currently used in productionwhich would lead to low estimates of input accumulation to economic growth.The non-parametric procedure computes factor shares by measuring the share of income thatis distributed to each factor. This procedure relies on several simplifying assumptions, which92
might not necessarily meet in practice and therefore might generate the weakness of theprocedure. The first assumption is that the production process can be represented by aproduction or transformation function at various level of the economy. The secondassumption is that producers behave efficiently, that is they minimise costs and/or maximiseprofits. The third assumption is that input and output markets are competitive and marketparticipants are price takers who can only adjust quantities but not individually act onmarket prices. The advantage of the procedure is that it allows for flexible factor shares overtime and across sectors, which the econometric procedure would not allow for the availablelength of the time series. The flexibility of factor share in measuring accurate TFP growthduring transition is a necessity because, due to price and trade liberalisation, significantfactor share adjustments occurred. Moreover, the procedure is appealing since the datarequirement on price and quantity observations are available from the national accountsconsistent with the System of National Accounts 1993, an essential condition for thecomparability of results across countries. The later two advantages persuaded us to choosethe non-parametric procedure for the measurement of TFP growth.4.6. Input accumulation v productivity growth - Summary of resultsThe methodology of the decomposition of growth into the contribution of inputs on theone hand and the contribution of TFP on the other hand as well as the underliningassumptions are described in Appendix 3. The source of the data set is the NationalCommission of Statistics. The time series used and their description are presented inAppendix 4.The various factors comprising the TFP are not measured directly, but lumped together as aresidual. They cannot be sorted out within the pure TFP framework and this is the source ofthe famous epithet “measure of our ignorance”, as Abramovitz (1956) put it. This ignorancecomes from the failure to distinguish among various growth components due to thelimitations of the methodology or the available data. For the purpose of this project, theinability to sort out the various growth components covered by TFP is not a problem. Thepurpose of this project is to separate, as accurately as the data allows it, the effects of inputaccumulation from the various effects embodied in the residual productivity growth, which93
shifts the production function. Consequently, the residual captures any effects of theimplemented reforms during transition on output growth other than the direct effects on theaccumulation of capital (human and physical). Problems might arise from the fact that TFPcaptures unwanted components as well, like measurement error and aggregation bias.However, it can be argued that these unwanted parts of the residual might cancel throughaveraging if they were randomly distributed errors, leaving the systematic part of theresidual unbiased.Consequently, a positive measured TFP growth is more likely to be associated with acompetitive output market, to increasing returns to scale production function to positivestructural changes and positive spillovers besides technical progress (Table 39). Since acompetitive output market is more likely to be associated with a constant returns to scaleeconomy, a positive measured TFP growth in a given sector indicates pro growth reformsin that sector. Conversely, a negative TFP growth in a given sector indicates the failure ofreforms to enhance growth in that sector.Table 39: The effects of violations of assumptions on measured TFPNot competitiveoutput marketIncreasingreturns to scalePositive sectoralchangesIncreasingreturns withspillovers↓ TFP ↑ TFP ↑ TFP ↑ TFP ↑ TFPQualityimprovementThe results are shown in Table 40. During the period 1991-1998, on average, the datasuggests that capital, labour and TFP negatively contributed to growth. The negativecontribution of labour was the largest, indicating a chronic shortage of jobs in theeconomy. The shrinkage of the capital stock over the analysed period indicates that theaverage annual investment rate was below the average annual replacement rate. Inmanufacturing, although capital positively contributed to growth, the contribution wasnot strong enough to offset the negative contributions of labour and TFP. For the wholeeconomy the capital stock declined at an average rate of 1.7% and labour declined at anaverage rate of 2.5%. TFP growth rate declined yearly by a half percent in the economyand by more than 3% in manufacturing (Appendix 5).94
Table 40: Annual decomposition of average output growth in economy andmanufacturing (%)Average growth ratesContribution to GDP <strong>Growth</strong>GDP Labour Capital Labour Capital TFPOverall Economy91-99 -1.87 -2.74 -1.62 -1.2 -0.38 -0.391 -11.4 -0.5 -2.4 -0.5 -1 -9.992 -7.7 -3 -2.5 -1.3 -1 -5.593 3 -3.8 -2.4 -1.7 -0.7 5.594 3.6 -0.5 -1.7 -0.4 -0.2 4.195 6 -5.2 -1.1 -2.1 -0.08 8.196 4 -1.2 -1 -0.5 0.3 4.297 -7.8 -3.8 -1.1 -1.8 0.02 -6.198 -4.9 -2.3 -1.3 -0.9 -0.3 -3.799 -1.6 -4.4 -1.1 -1.7 -0.5 0.6Manufacturing91-99 -4.57 -11.3 0.72 -3.63 1.26 -2.2191 -16.1 -5.6 -2 -2.8 0.5 -13.892 -25.6 -19.9 2.2 -9.5 0.7 -16.893 -5.3 -3.9 -0.4 -2.6 -0.2 -2.594 3.1 -9.7 -1.3 -1.7 -0.5 5.495 6.7 -14.1 -0.7 -3.6 1.9 8.496 11.2 2.3 3 -1 2.8 9.497 -6.7 -13.6 2.3 -2.1 1.7 -6.398 -10.1 -8.9 1.3 -3.4 2.3 -9.199 1.6 -28.5 2.14 -6 2.2 5.4Source: own computationsAlthough the overall contribution to growth of TFP was negative the sectoral distributionof TFP contribution to growth was even. There are two sectors in which output expanded:trade and financial services. In all the other sectors, excepting business services anddespite a TFP gain, the output declined. The sectors where employment expanded wereagriculture, trade and financial services. The sectors where capital expanded wereconstruction, trade and financial services.The sectors with TFP above average are destroying jobs, while the sectors with TFPbelow average are creating jobs.95
Table 41: Annual average TFP, employment and capital contribution to outputgrowth by sectorsAgriculture Industry Construction Trade Transport Financial Business Otherservices servicesGDP growth -2.3 -2.6 2.09 -2.88 -2.2 0.5 6.7 0TFP-2.32 0.64 3.25 -6.34 1.88 -282.99 10.19 1.41contributionEmployment 0.57 -2.53 -2.8 1.77 -2.38 1.12 -2.08 0.07contributionCapital -0.57 -0.71 1.65 1.68 -1.71 282.4 -1.4 -1.48contributionSource: own computationTable 42: Decomposition of annual average output growth in manufacturing bybranches for period 1991-1999GDP growth TFP growth EmploymentcontributionCapitalcontributionFood and Beverages 2.06 -0.98 -0.55 3.59Tobacco -11.86 -22.08 -0.45 10.67Textiles and Textile Products -3.55 3.76 -6.78 -0.53Textile. Fur and Leather Apparel 1.25 -2.58 0.00 3.83Leather Goods and Footwear -5.39 -2.78 -2.74 0.13Wood Processing (Excluding0.97 1.50 -0.66 0.13Furniture)Pulp. Paper -9.03 -4.33 -3.21 -1.49Publishing Houses 8.29 2.77 1.39 4.13Crude Petroleum Processing. Coal 10.75 13.81 -1.91 -1.15Coke. Nuclear Fuel TreatmentChemistry and Synthetic and Man-8.59 -3.47 -3.97 -1.15Made FibresRubber and Plastics Processing -10.60 -6.45 -3.18 -0.96Other Non-metallic Products -8.96 -5.86 -2.30 -0.80Metallurgy -3.82 -0.49 -2.01 -1.32Metallic construction and metal-10.96 -6.55 -2.99 -1.42productsMachinery and Equipment -15.95 -6.09 -8.70 -1.16Computing Technique and Office9.61 9.10 -1.39 1.90MeansElectric Machinery and-0.08 6.55 -5.55 -1.07AppliancesRadio. TV. Communication-0.25 -1.31 -1.87 2.92EquipmentMedical. Precision. Optical. Watch -23.28 -20.68 -2.82 0.22Making InstrumentsMeans of Road Transportation 7.16 10.60 -4.73 1.29Other Means of Transportation -6.00 1.49 -6.93 -0.56Other Industrial Activities -1.83 -0.73 -3.04 1.93Source: own computation96
The changes in sectoral specialisation in manufacturing were the effect of theimplementation of a peculiar policy. The investment intensive sector with TFP belowaverage expanded relative to the less investment intensive sectors with TFP below theaverage. This strategy, due to the increasing openness of the country, was certainlyinfluenced by attempts at identifying the comparative advantage vis-à-vis the tradingpartners. The perspectives of the future integration in EU certainly contributed to theprocess; especially that EU was the main foreign partner and the main foreign investorduring the last decade. Free trade with EU or the prospect of free trade in the near futureleads us to conclude that the changes in sectoral specialisation are changes toward thesectors which represent the country’s comparative advantage in relation with EU.The five manufacturing branches, which registered the highest positive TFP growth onaverage during the analysed period, were:• textile and textile products• crude petroleum processing,• computing technique and office means• means of road transportation and• electrical machinery and equipment.This performance for the textile industry is a transitory benefit, since it is based mostly onloan production attracted by the currently low local wages (0.16 USD/hour as opposed to0.30 USD in Poland). Once the salaries will rise, keeping pace with TFP, the EU-basedtextile industries will move to “cheaper” countries.All the other identified industries with high TFP growth have good potential forsustainable growth, because they can jointly exploit the human capital and the alreadyexistent productive capacities.These branches can be considered as engines for further growth, worth developing andtherefore potential investment targets for the coming years. The argument for thisrecommendation could be the neoclassical theory of growth, according to which a growth97
ased on TFP growth is preferable to a growth based on capital (human or physical)accumulation, since the latter is not sustainable under diminishing marginal returns. Butthis argument is only valid for the long run. A more suitable argument for the short andmedium run is that based on the “assimilation view” (Hulten and Srinivasan, 1999),according to which TFP is the costless part of innovation and, in developing countries(like <strong>Romania</strong>), it reflects opportunities to assimilate technology from abroad, as well asgains from reducing inefficiencies at home. If some sectors take advantage of theassimilation possibilities, one might expect them to converge to a target rate of TFPdefined by the best practice economies. Since the assimilation process in <strong>Romania</strong> hasjust started, moving up to the convergence is a long journey with a lot of potential gains.4.7 Capital efficiency versus investment rateAlthough growth accounting is useful for quantifying the contribution of variouselements to growth, it does not provide extensive explanations for growth. By applyingGylfason’s method (1999) we are able to highlight the mechanics of the growth cyclefrom the last decade (Table 43).Table 43: Efficiency versus investment rateEfficiency(A)EconomyInvestmentratio (s)Depreciation(δ)<strong>Growth</strong>(g)Efficiency(A)ManufacturingInvestment Depreciratio (s) ation (δ)<strong>Growth</strong>(g)90 1.18 0.08 0.15 -0.056 0.276 0.11 0.16 -0.12991 2.42 0.05 0.25 -0.114 0.47 0.11 0.21 -0.16192 1.06 0.06 0.13 -0.077 0.213 0.12 0.28 -0.25693 0.73 0.14 0.07 0.03 0.55 0.13 0.12 -0.05394 1.41 0.16 0.19 0.036 1.22 0.09 0.08 0.03195 0.40 0.18 0.01 0.064 0.37 0.15 -0.01 0.06796 0.57 0.2 0.07 0.042 0.54 0.18 -0.01 0.11297 0.96 0.19 0.26 -0.078 0.87 0.2 0.24 -0.06898 0.79 0.18 0.19 -0.049 0.83 0.18 0.25 -0.10199 0.69 0.17 0.14 -0.016 0.47 0.25 0.10 0.016Notes: Calculations are made assuming a linear relationship between GDP, Y and the capital stock, K,Y=AK and replacing the efficiency level A in the equation describing growth g=sA-δ, where g is the rate ofeconomic growth, s is investment rateSource: own computation98
The main methodological observation when using the above-mentioned technique is thatit heavily relies on the current evaluation of the fixed assets. The evaluation is mainly dueto the fact that with privatisation being in full gear, the social perception of the underevaluatingfixed assets induces upward biases in the overall measurements. Thus wemight suspect a higher efficiency than the computed one. In addition, while interpretingthese results, it should be taken into account that the efficiency in the use of capital notonly depends on the effects of investment in physical capital but also on macroeconomicstability, removal of distortions, support for education and research, provision ofinfrastructures, transparency and efficiency of laws and the development of institutions.The data shows there is no obvious link between growth and capital efficiency.Therefore, the growth cycle was mainly produced by an enhanced deterioration of thequality of capital measured by both its lower productivity and higher economicdepreciation beginning with 1997. It is evident that 1996 (electoral year) divides the timeseries. While until 1996 investment rate is increasing, the opposed is evident followingthis year. Though we agree that electoral cycles are important and relevant in transitioncountries, we consider that the length of series is too short in order to draw a clearmedium and long term pattern.Applying the same procedure by sectors, we find that over the period 1993-1999 financialservices have the highest efficiency of capital and the highest depreciation andinvestment rate too (Table 44). Agriculture and trade belong to the sectors with thelowest investment rate. Industry, still the largest sector in the economy, has largerinvestment rates than in the other sectors and the depreciation rate is the lowest, thuspointing out the difficult path from extensive industrialisation towards a modernindustrial frame (Section 2.3).Table 44: Efficiency versus investment rates by sectors (1993-1999)Agriculture Industry Construction Trade Transport Financial OtherservicesGDP growth 0.02 0.01 0.06 0.04 -0.003 0.73 0.06Efficiency 1.80 0.45 1.69 1.49 0.50 4.78 2.45Investment rate 0.10 0.23 0.18 0.15 0.23 0.28 0.27Depreciation 0.17 0.09 0.24 0.18 0.12 0.61 0.6199
Source: own computationThe results for the manufacturing sector are presented in Table 45.Table 45: Decomposition of annual output growth in manufacturing by branches(1993-1999)GDP growth Efficiency Investment rate DepreciationFood and Beverages 0.09 1.42 0.14 0.10Tobacco 0.08 3.71 0.10 0.30Textiles and Textile Products -0.02 0.64 0.18 0.14Textile. Fur and Leather Apparel 0.04 2.30 0.12 0.23Leather Goods and Footwear 0.00 1.46 0.12 0.18Wood Processing (ExcludingFurniture)0.03 1.29 0.15 0.16Pulp. Paper 0.00 0.38 0.25 0.10Publishing Houses 0.06 1.73 0.24 0.36Crude Petroleum Processing. CoalCoke. Nuclear Fuel Treatment0.14 0.81 0.14 -0.02Chemistry and Synthetic and ManMade Fibres-0.12 0.38 0.32 0.24Rubber and Plastics Processing -0.06 0.65 0.20 0.19Other Non-metallic Products -0.09 0.71 0.19 0.23Metallurgy 0.03 0.25 0.24 0.03Metallic construction and metalproducts-0.10 0.89 0.13 0.22Machinery and Equipment -0.13 0.44 0.11 0.18Computing Technique and OfficeMeans0.24 2.23 0.09 -0.04Electric Machinery andAppliances0.06 0.79 0.12 0.03Radio. TV. CommunicationEquipment0.20 2.42 0.24 0.39Medical. Precision. Optical. WatchMaking Instruments-0.02 1.08 0.17 0.21Means of Road Transportation 0.10 0.47 0.52 0.14Other Means of Transportation -0.02 0.43 0.09 0.06Other Industrial Activities 0.02 1.11 0.12 0.12Source: own computationTaking into account capital efficiency and growth it emerges that the sectors wedesignated previously (Section 4.6) as the engines of growth of the economy as a wholeare indeed those with the highest figures. Though this is not the case for textile and thetextile product sector, the fact that this sector is a labour intensive area and it is exportbound it makes it a suitable tool for the pattern of growth of this moment. We are awarethat once the wages will be high enough compared to other competitors, this asset willvanish.100
5. CONCLUDING REMARKSThe following main conclusions can be drawn from this report:• Historical data show that during the interwar period, until capitalism was replacedby socialism, <strong>Romania</strong> enjoyed comparative advantage in several fields. Wewould argue that presently the country is again starting the capitalist 'race' fromthe same position.• Transition as a whole has been a 'stop and go' process. Though several patterns oftransition already existed in Central and Eastern Europe, the peculiarities ofsocialism in <strong>Romania</strong> led the country to take a path of its own. This resulted in acontraction of output, waste of labour, shrinkage of both domestic and exportmarkets and a declining in living standards.• The economic policy pursued by all the <strong>Romania</strong>n governments wasundifferentiated towards sectors. The outcome was a loss of competitiveness evenin those sectors that could conceivably fare better under the circumstances(agriculture, tourism, education, etc).• Due to the influence of mostly foreign constraints such as the need for FDI, therequirements of accession towards EU structures induced, though unfortunatelyonly in the last years of the transition decade, a more pragmatic approach toeconomic policy that propelled the country towards a genuine, internationallycompatible, market economy.• Restructuring the economy was initially accomplished by shrinking the oversizedsocialist industrial sector. No alternative framework was developed for theredundant industrial workforce and this led to a counterproductive expansion ofthe agricultural sector that played the role of a buffer. The fear of social unrest ledto a policy focused on limiting unemployment beyond the natural requirements ofsuch a transformation period.• Privatisation and property ownership reform was carried on at such a slow pacethat real entrepreneurship effects could not be observed during the first decade.On the other hand proper mechanisms (legal ones) to attract foreign investorswere slowly put in pace, so that <strong>Romania</strong> lost ground to its neighbouringcompetitors (mainly Visegrad countries).101
• The <strong>2000</strong> and 2001 growth was generated by export sectors. On the one hand thisshows the economy is starting to exploit its competitive advantages, on the otherhand it shows the liability of a weak domestic market and therefore questions thepotential for sustainable growth in the coming years.• Macroeconomic analysis shows that the most promising areas for an economicexpansion in the coming years would be the textile industry, oil processing, ITsector, transport sector and electrical machinery and equipment.• The critical mass of investment, both domestic and foreign, has not been yet beenreached. The fact that <strong>Romania</strong> is the second biggest market of Central andEastern Europe leads to the conclusion that once the legal methods are settledinvestment will pour in according to the same pattern as they did in the Visegradcountries and trigger important sectoral reallocation.• We believe that there is a strong case for reinforcing the main institutions ofmarket economy in order to enhance the role played by government as a managerof transition. This is the only option to legitimise a still important sector ofeconomy, namely the black and grey one.102
REFERENCESAbramovitz M. (1956), “Resource and Output Trends in the US since 1870” AmericanEconomic Review, 46 (May), 5-23Aghion P., Dewatripont and Rey (1995), “Competition, Financial Discipline and<strong>Growth</strong>,” mimeoBarro R. J. (1998), “Notes on <strong>Growth</strong> Accounting,” NBER Working Paper 6654Basu S. (1996), “Procyclical Productivity Increasing Returns or Cyclical Utilisation?”Quarterly Journal of Economics 111(3), 719-751Benhabib J. and Jovanovic B.(1991), “Externalities and <strong>Growth</strong> Accounting” AmericanEconomic Review, 81(1),82-113Blanchard, O., Kremer, M., eds. (1997), The Economics of Post-communist Transition,Clarendon Press, OxfordBorc, C (1999) “Why are Domestic Interest Rates so High?” in <strong>Romania</strong> <strong>2000</strong> – 10 yearsof Transition; Past, Present, Future, a World Bank Conference, Bucharest.Burnside C., Eichenbaum M. and Rebelo S. (1995),“Capital Utilisation and Returns toScale,” in NBER Macroeconomics Annual. J.J. Rotenberg and B.S. Bernanke, eds..Cambridge, MA:MIT PressBurnside C., Eichenbaum M. and Rebelo S. (1996),“Sectoral Solow Residuals” EuropeanEconomic Review 40.861-869Caballero R.J. and Lyons R.K. (1992), “External Effects in US Procyclical Productivity”Journal of Monetary Economics 29. 209-226Calvo, G. and Vegh, C (1997) “Inflation Stabilization and BOP Crises in Developingcountries”, mimeo, University of MarylandConstantinescu, N.N. (1992) Dileme ale tranzitiei la economia de piata (Puzzles ofTransition to Market Economy), Editura Economica, BucurestiCoopers and Lybrands (1995), La Roumanie, oui!, BucurestiCukierman, A., Miller G.P. and Neyapti B. (2001) – Central Bank Reform, Liberalizationand Inflation in transition Economies – An International Perspective (available athttp://www.tau.ac.il/~alexcuk/w_p.html)Daianu, Daniel (1997), Vitalitate si viabilitate economica (Economic Vitality andViability), Clavis, Bucuresti103
Daianu, Daniel (1999), “Structure, Strain and Macroeconomic Dynamics in <strong>Romania</strong>” in<strong>Romania</strong> <strong>2000</strong> – 10 years of Transition; Past, Present, Future, a World BankConference, Bucharest.Daianu, Daniel (<strong>2000</strong>), Incotro se indreapta tarile postcomuniste? (Whereto are HeadingPost-communist Countries?), Polirom, IasiDaianu, Daniel (<strong>2000</strong>), “Structure, Strain and Macroeconomic Dynamic in <strong>Romania</strong>”, in<strong>Romania</strong> <strong>2000</strong> – 10 years of Transition; Past, Present, Future, a World BankConference, Bucharest.Diamond, Larry, Plattner, Mark F., eds (1995) Economic Reform and Democracy, TheJohn Hopkins University Press, BaltimoreDobre, Gheorghe, ed. (1996) Economia Romaniei in context European - 1938 (<strong>Romania</strong>nEconomy within a European Context - 1938), Editura Fundatiei Stiintifice “MemoriaOeconomica” , BucurestiEarle J. S. (1997), “Industrial Decline and Labour Reallocation in <strong>Romania</strong>,” SITEWorking Paper 125Earle J and Pauna C. (1996) “Incidence and Duration of Unemployment in <strong>Romania</strong>”,European Economic Review no 49, pp 829-837Earle J and Pauna C. (1998) “Long-term Unemployment, Social Assistance and LabourMarket Policies in <strong>Romania</strong>”, Empirical Economics no 23, pp 203-236EBRD (1997-<strong>2000</strong>), "Transition <strong>Report</strong>"The Economist Intelligence Unit "EIU <strong>Country</strong> <strong>Report</strong>. Poland", EIU, London, <strong>2000</strong>The Economist Intelligence Unit "EIU <strong>Country</strong> Profile. <strong>Romania</strong>", EIU, London,Collection 1991-<strong>2000</strong>The Economist Intelligence Unit "EIU <strong>Country</strong> <strong>Report</strong>. <strong>Romania</strong>" EIU, London,Collection 1991 - <strong>2000</strong>Filer R. and Hanousek J. (<strong>2000</strong>), “Output Changes and Inflationary Bias in Transition,”CERGE-EI Working Paper 168Freitas M. L.(<strong>2000</strong>), “Quantity versus Quality: The <strong>Growth</strong> Accounting in Ireland,”Economic Bulletin/ Banco de Portugal104
Georgescu, P., (2001) “Brain drain in Eastern Europe, 1980-<strong>2000</strong>”. Unpublished MAresearch paper written at McGill University, Department of HistoryGriliches Z. (1979), “Issues in Assessing the Contribution of Research and Developmentto Productivity <strong>Growth</strong>” Bell Journal of Economics, 10,1,92-116Gylfason T. and Zoega (2001), “Ownership and <strong>Growth</strong>” World Bank Economic ReviewGylfason T. (1999), Principles of Economic <strong>Growth</strong>, Oxford University Press, OxfordUKHulten C.R. (<strong>2000</strong>), “Total Factor productivity: a Short Biography” NBER WorkingPaper 7471Von Haberler, Gottfried (1958), Prosperity and Depression, Harvard University Press,HarvardHulten C. and Srinivasan S. (1999), “Indian Manufacturing Industry: Elephant orTiger?,” New Evidence on the Asian Miracle” NBER Working Paper 7441Iliescu, Cecilia (1997), Inflatia in <strong>Romania</strong> (Inflation in <strong>Romania</strong>), Editura Mesagerul,Cluj-Napoca*** Industria si bogatiile naturale din Ardeal si Banat (Industry and Natural Wealth inTransylvania and Banat) (1927), Tipografia Cartea Romaneasca, ClujIMF (<strong>2000</strong>), <strong>Romania</strong>: Staff <strong>Report</strong> for Article IV Consultations, November 3,Washington, D.C.IMF (<strong>2000</strong>), International Financial Statistics, Washington, D.C.IMF (2001), <strong>Romania</strong>-Selected Issues and Statistical Appendix, <strong>Country</strong> <strong>Report</strong> 16/2001,Washington, D.C.IMF, World Economic Outlook <strong>2000</strong>, Focus on Transition Economies, Washington DCJohnson S., Kaufman D. and Shleifer A. (1997), “The Unofficial Economy in Transition”Brookings Papers Economic Activity, 0:2, 159-221Lacko M. (1999), “Hidden Economy an Unknown Quantity? Comparative analysis ofHidden Economies in Transition Countries in 1989-1999” Working Paper 9905,Economic Department University of Linz, Austria105
Lucas R. (1988), “On the Mechanics of <strong>Growth</strong>,” Journal of Monetary Economics, Vol.22, 1, 3-42Maniu, Mircea (1998), “Conjunctura economiei mondiale 1970 – <strong>1990</strong> (World EconomicOutlook 1970 – <strong>1990</strong>)”, EFES, Cluj-NapocaManescu, Manea ed, (1984) “Avutia nationala (National Wealth)”, Editura Academiei,BucurestiMuresan, Maria (1995), “Evolutii economice 1945 –<strong>1990</strong> (Economic Evolutions 1945 –<strong>1990</strong>)”, Editura Economica, BucurestiNational Commission of Statistics (<strong>1990</strong>-<strong>2000</strong>),“Statistical Yearbook”Negucioiu, Aurel (1999), “Tranzitia rationala (Rational Transition)”, EdituraEconomica, BucurestiOECD (1993), “<strong>Romania</strong>, an Economic Assessment”, OECD, ParisOECD (1998), “OECD Economic Surveys 1997 – 1998, <strong>Romania</strong>”, OECD, ParisPaun, N. (1992) “Stat si economie, <strong>Romania</strong> in perioada interbelica (State and Economy,<strong>Romania</strong> during the Inter-War Period)”, Editura Interferente, Cluj-NapocaPauna, C. and Pauna, B (1999) “Output Decline and Labour Reallocation in TransitionalEconomies: Where Does <strong>Romania</strong> Stand?” in <strong>Romania</strong> <strong>2000</strong> – 10 years of Transition;Past, Present, Future, a World Bank Conference, Bucharest.The <strong>Romania</strong>n Government (<strong>2000</strong>) – “The National Strategy of Economic Developmenton Medium Term”, March, BucurestiThe <strong>Romania</strong>n Government (2001) –“The Preaccession Economic Program”, Bucuresti<strong>Romania</strong>n Central Bank (<strong>2000</strong>)– “<strong>Report</strong> ”, BucurestiRomer P. (<strong>1990</strong>), “Endogenous technological change” Journal of Political Economy,Vol.98, 5, Part2, 71-102Rosati (1994), “Output Decline during Transition from Plan to Market: aReconsideration” Economics of Transition, 4(1), 159-184Saizu, I, Tacu, Al, (1997), “Europa economica interbelica (Inter-war EconomicEurope)”, Institutul European, IasiSchoepflin, George, Culture and Identity in Post-communist Europe, in White, S., Batt,J., Lewis, P., eds. (1993), Developments in East European Politics, Basingstoke, London106
Schneider F. and Enste D.H. (<strong>2000</strong>), “Shadow Economies: Size, Causes, andConsequences” Journal of Economic Literature, vol 23., 77-114Serbanescu, Ilie (<strong>2000</strong>), “Can the Vicious Circle be Broken?”, in <strong>Romania</strong> <strong>2000</strong> – 10years of Transition; Past, Present, Future, a World Bank Conference, Bucharest.UNECE (2001), Economic Survey of EuropeWeidenfeld, Werner, ed.,(1997.), Central and Eastern Europe on the Way into theEuropean Union, EURISC, BucurestiWorld Bank (<strong>2000</strong>), <strong>Romania</strong>-Diagnostic Surveys on Corruption, <strong>2000</strong>World Bank (<strong>2000</strong>), <strong>Global</strong> Development Finance, Washington D.C.***Bucharest Stock Exchange: http://www.bvb.ro/BradyNet Inc.:http://www.bradynet.com/e873.htmlPublic Opinion Barometer: http://www.sfos.ro/pobThe European Commission: http://europa.eu.int/comm/enlargement/romania<strong>Romania</strong>n National Institute of Statistics and Economic Studies: http://www.insse.roNational Bank of <strong>Romania</strong>: http://www.bnro.ro107
Appendix 1: National income evolution in Central and Eastern Europe and USSR)(Yearly change, in %)1980 1981 198 1983 1984 1985 1986 1987 1988 1989 <strong>1990</strong>2Total, 2.8 1.6 2.8 4.2 3.5 1.8 2.7 1.8 3.7 1.4 -5.9out of which:USSR 3.9 3.3 3.9 4.2 2.9 1.6 2.3 1.6 4.4 2.4 -4.0CEE 0.3 -2.3 0.3 4.3 5.1 2.3 3.7 2.4 2.1 -1.0 -10.6Bulgaria 5.7 5.0 4.2 3.0 4.6 1.8 5.3 5.0 2.4 -0.4 -13.6Czechoslovakia 2.9 -0.1 0.2 2.3 3.5 3.0 2.6 2.1 2.3 1.0 -3.0GDR 4.4 4.8 2.6 4.6 5.5 5.2 4.3 3.3 2.8 2.1 -13.4Hungary -0.9 2.5 2.7 0.3 2.5 -1.4 0.9 4.1 -0.5 -1.1 -5.5Poland -6.0 -12.0 -5.5 6.0 5.6 3.4 4.9 1.9 4.9 -0.2 -13.0<strong>Romania</strong> 4.2 -0.4 4.0 6.0 6.5 -1.1 3.0 0.7 -2.0 -7.9 -10.5Source: United Nations, World economic survey 1991, Current trend and policies in the world economy,UN, New York 1991, p. 210108
Appendix 2: Output, Investment and Foreign Trade in Central and EasternEurope and USSR(Yearly change, in %)1980 1981 1982 1983 1984 1985 1986 1987 1988 1989 <strong>1990</strong>IndustryBulgaria 4.2 5.4 4.6 4.3 4.2 3.2 4.0 4.2 5.1 2.2 -14.1Czechoslovakia 3.5 2.1 1.1 2.8 3.9 3.5 3.2 2.5 2.1 0.8 -3.7GDR 4.6 4.7 3.2 4.2 4.2 4.4 3.7 3.1 3.2 2.3 -28.1Hungary -1.7 2.4 2.5 1.2 3.2 0.7 1.9 3.5 -0.3 -2.5 -5.0Poland - -10.8 -2.1 6.4 5.2 4.5 4.7 3.4 5.3 -0.5 -23.3<strong>Romania</strong> 6.6 2.8 1.0 4.7 6.7 3.9 7.3 2.4 3.1 -2.1 -19.8CEE 3.1 -0.5 1.1 4.4 4.9 3.9 4.5 3.1 3.5 0.1 -19.0USSR 3.6 3.4 2.9 4.2 4.1 3.4 4.4 3.8 3.9 1.7 -1.2Total 3.4 2.3 2.4 4.3 4.3 3.5 4.4 3.6 3.8 1.3 -6.2AgricultureBulgaria 4.6 5.9 5.2 7.2 7.0 -12.3 11.7 -5.1 0.1 0.4 -8.8Czechoslovakia 4.8 -2.5 4.4 4.2 4.4 -1.6 0.6 0.9 2.9 1.8 -3.7GDR 1.3 1.5 -4.1 3.9 6.6 3.9 - -0.3 -2.1 1.6 -30.0Hungary 4.6 2.0 7.3 -2.7 2.9 -5.5 2.4 -2.0 4.3 -1.3 -7.0Poland -10.6 3.8 -2.8 3.3 5.7 0.7 5.0 -2.3 1.2 1.5 -1.4<strong>Romania</strong> -5.0 -0.4 6.9 - 13.3 0.7 -5.5 -8.9 5.7 -5.1 -3.0CEE -3.7 1.9 1.5 1.2 6.8 -0.9 1.8 -2.9 1.9 - -7.9USSR -1.9 -1.0 5.5 6.2 -0.1 0.1 5.3 -0.6 1.7 0.8 -2.3Total -2.5 -0.1 4.1 4.5 2.1 -0.2 4.1 -1.4 1.8 0.5 -4.1Gross investmentBulgaria 7.5 10.5 3.6 0.7 0.3 8.6 8.0 7.2 2.4 -7.7 -13.5Czechoslovakia 1.4 -4.6 -2.3 0.6 -4.2 5.4 1.4 4.4 4.1 1.6 3.0GDR 0.1 2.4 -5.1 -0.3 -4.9 3.4 5.3 8.0 7.3 0.9 -5.7Hungary -5.5 -4.7 -1.6 -3.4 -3.7 -3.0 6.5 9.8 -9.1 0.5 -9.0Poland -12.3 -22.3 -12.1 9.4 11.4 6.0 5.1 4.2 5.4 -2.4 -8.0<strong>Romania</strong> 3.0 -7.1 -3.1 2.4 6.0 1.6 1.1 -1.4 -2.2 -1.6 -35.0CEE -2.2 -7.2 4.4 2.3 2.2 3.9 3.9 4.1 2.1 -1.5 -14.0USSR 2.2 3.7 3.5 5.6 1.9 3.0 8.3 5.7 6.2 4.7 -4.3Total 0.8 0.3 1.2 4.7 2.0 3.2 7.1 5.2 5.2 3.1 --6.7ExportBulgaria 12.2 8.3 11.4 4.5 4.7 7.4 -3.7 1.8 2.4 -3.4 -26.0Czechoslovakia 4.9 0.3 6.1 5.7 9.5 2.6 1.2 3.4 3.2 -2.0 -13.0GDR 3.7 9.8 6.2 12.0 2.3 2.3 -4.5 -0.1 -0.2 0.5 -Hungary 1.0 2.6 7.3 9.4 5.8 -0.3 -2.2 4.0 5.1 - -4.3Poland 4.2 -19.0 8.7 10.3 9.5 1.3 4.9 4.8 9.1 0.2 14.9<strong>Romania</strong> 1.2 11.3 -8.3 3.2 15.9 0.3 0.2 -4.3 7.4 -10.8 -46.0CEE 3.1 2.7 5.3 8.0 7.0 2.5 -1.2 1.4 3.7 -2.1 -9.8USSR 1.6 1.9 4.5 3.3 2.5 4.3 10.0 3.3 4.8 - -12.9Total 2.3 2.3 4.9 5.8 4.9 -0.7 3.8 2.1 4.2 -1.0 -11.4ImportBulgaria 4.1 9.3 3.1 5.2 2.2 10.5 3.9 -1.4 5.3 -6.5 -20.0Czechoslovakia 1.6 -6.9 2.9 2.1 0.3 4.6 2.7 4.3 2.9 2.7 -GDR 5.0 -1.7 -6.2 7.2 4.8 4.1 2.9 9.0 4.7 2.4 15.0Hungary 1.1 0.1 0.1 3.9 0.1 1.1 2.1 3.3 -2.0 1.0 -3.4Poland -1.9 -16.9 13.7 5.2 8.6 7.9 4.9 4.5 9.4 1.5 -15.6<strong>Romania</strong> 2.0 -7.2 -22.4 -3.8 10.5 8.5 18.3 -6.3 -5.8 3.7 4.0CEE 1.3 -4.3 -5.3 4.0 3.9 5.8 4.8 3.4 3.3 0.9 -0.4USSR 7.5 6.4 9.7 4.0 4.4 4.7 -6.0 -1.6 4.0 9.3 -5.0Total 3.9 0.9 2.2 4.2 3.9 5.3 -0.6 1.0 3.7 4.5 -1.0Source: United Nations, World economic survey 1991, Current trend and policies in the world economy,UN, New York 1991, p. 214.109
Appendix 3: The conceptual framework of growth accountingThe non-parametric estimate of total factor productivity is based on the existence of aproduction function Y t =A t F(K t ,L t ) linking the amount of output Y t in each moment t tothe amount of capital K t , labour L t and a Hicks neutral technical progress A t. By totaldifferentiation of this production function, the productivity growth known as total factorproductivity growth or the Solow residual can be written as the difference between thereal output growth rate and the sum of capital and labour growth rates, both weighted bytheir output elasticitydAtdYtF KtdKtF LtdLtg ≡ = − ∂ − ∂ . (1)AtYt∂KtYtKt∂LtYtLtEvaluation of the left hand side of equation (1) results in a measure of TFP, whichexpresses the residual growth rate of output not explained by the growth of inputs. In thecase of a production function with labour (b t ) and capital (a t ) augmenting technicalprogress Yt=F(a t K t ,b t L t )=F(k t ,l t ), where k t is the augmented capital, while l t is theaugmented labour, the TFP growth rate is the weighted average of the two types oftechnical progress. The weights are the elasticity of output with respect to the augmentedinputlt∂Fdatkt∂FdbtdYtF ktdktF ltdltg ≡ + = − ∂ − ∂ . (2)F ∂ltatF ∂ktbtYt∂ktYtkt∂ltYtltA change in the weights can cause TFP growth, even if the underlying rate of technicalchange remains unchanged. In this case, a change in TFP growth is not the same thing astechnical change.AssumptionsThe output elasticities in (1) are not directly observable, but if the inputs and outputmarkets are competitive and each input is paid the value of its marginal product, the labourthe relative wage (w t /p t ) and the capital its relative return (r t /p t )∂Fwt= and ∂ F rt=∂Ltpt∂KtptThen the relative prices can be substituted for the corresponding marginal products.This substitution in turn converts the unobserved output elasticities into observableincome sharesdE dYgs dK s dL t ttt≡ = −k−lEtYtKtLtwhere s L = wL t tis the share of labour income and s k = rK t tis the share of capital income.pYt tpYt tProduction function is defined as a relation between the flow of output and the flow ofcapital and labour services. Determining the flow of output and labour is not a problemsince annual prices and quantity data are available. The problem is with determining theflow of capital since is no obvious way to get the flow of capital services. As economicactivity fluctuates over the business cycle and capital stock are hard to adjust rapidly; theutilisation of the capital stock fluctuates as well. Berndt and Fuss (1986) argued that capitalstock is a quasi-fixed input in the short run, whose income is the residual left over afterpaying the current account inputs. The residual return to capital takes into account the expostcost of using the stock for one period which already accounts for the fluctuation in110
demand, rising or falling relative to the ex-ante user cost on which the original investmentwas based. Thus allowing residual payment to capital, no other adjustments for demandfluctuations are needed.Allowing residual payment to capital implicitly requires constant returns to scaleproduction function. Under constant returns to scale production function, the capitalincome share is exactly 1 minus the labour income share and the TFP growth rate becomesdE dY dKgs s dL t ttt≡ = −( 1 −l) −l. (3)EtYtKtLtConstant returns to scale production function implicitly assumes that the elasticity ofsubstitution between labour and capital is 1.Non-compliance with the assumptionsA key assumption in growth accounting is that factor prices coincide with socialmarginal products. If this assumption does not hold, then the estimated g calculatedfrom equation (3) deviates from the true contribution of technical change dE tcoveringEtvarious other components. The next sections illustrate which are the possiblecomponents taking into account the features of the transition process.1 Market power in output marketWhen the assumption of competitive output market does not hold and the price is a markupover the marginal cost, p t =µ t MC 69 t , under the constant returns to scale assumption forthe production function, the estimated TFP contains a mark-up component in addition tothe pure technological component 70dAt⎛ dLtdKt⎞g ≡ + (µ −⎜ −⎟t1)sl. (4)At⎝ LtKt ⎠Whenever the mark-up is above 1 and the growth rate of labour capital ratio is positive,the market power in output market increases the measured total factor productivity.2 Increasing returns to scale production functionA firm operating at a point of increasing returns must have market power to be viable.Without some monopoly power, the firm cannot generate enough revenue to pay for itsinputs. The relaxation of the assumption about competitiveness in the output market69 There is a strong evidence for the non-competitive markets in different manufacturing sectors in<strong>Romania</strong> during transition. The price mark-up estimates in some sectors are much higher that thecorresponding values obtained for US for 1953-1984 (Roeger, 1995).70 In this case the conditions for cost minimization are ∂ F wt= and ∂ F rt= , where MC is∂LtMCt∂KtMCtthe marginal cost (or the average cost, since the production function has constant returns to scale). Theoutput elasticity with respect to inputs are∂FL= = µ twLt t twLt t=µ sL ∂LY MC Y pYand ∂ F K= = µ trKt t trKt t=µ t( 1 −sL).∂KY MC Y pYtttttttt111tttt
implies the relaxation of constant returns to scale production function. When γ>1 is thereturns to scale index 71 , TFP growth rate has three components: the technologicalcomponent, the market power component and the scale componentdAt⎛ dLtdKt⎞ dKtg ≡ + ( µt−1)sl( 1)A⎜ − + −tLtK⎟ γ . 72⎝t ⎠ Kt(5)The scale component is positive when there are increasing returns (γ>1) and negative whenthere are decreasing returns to scale (γ0, then the positive spillover effect ispresent, while when β
4 Multiple types of factorsTransition economies were usually formalised as two sector economies with one good(private) sector and one bad (state) sector and the process of transition viewed as inputreallocation between these two sectors. It can be imagined that the type of the sectordepends on the quality of inputs possessed. Therefore in such economy both capital andlabour are of two types those employed in the good sector K 1 and L 1 , and thoseemployed in the bad sector K 2 and L 2 . Each capital type has its price, the relative wagew 1 /p and w 2 /p for the two types of labour, and the relative returns for the two types ofcapital r 1 /p and r 2 /p. As the transition process goes through the sectoral composition ofthe economy is changing, a shift from the bad sector to the good sector occurs. Suchshifts cause no problems for the growth accounting if their income shares weight thevarious growth rates of factor quantities. If capital or labour are aggregated acrosssectors and if the growth of these aggregates is weighted by the overall income shares ofcapital or labour than the measured TFP comprises the growth contribution fromstructural changes.When TFP growth is incorrectly measured it equals todYtrK1t 1t + rK2t 2tdKtwL1t 1t + wL2t 2 tdLtg = −−, (7)YtpYtKtpYtLtwhere K t =K 1t +K 2t and L t =L 1t +L 2t . When TFP growth is correctly measureddYtrK1t1tdK1trK2t2tdK2twL1t1tdL1tw2tL2tdL2tgc= − − − −(8)YtpYtK1tpYtK2tpYtL1tpYtL2tThe incorrectly measured TFP contains the growth effects of the changes in structuralcompositionK1 tK2tKtg gK K pY r r dK1tdK2tL1 tL2LtK K L L pY w w dL1tdL2t−c= (1t−2t)( − ) + (1t−2t)( − ) (9)L Lttt1t2twhich increase TFP if r 1t >r 2t and dK 1tdK2t> or if w 1t >w 2t and dL 1tdL2t> , meaningK1tK2tL1tL2tthat TFP incorrectly measured is higher if the composition of factors is shifting overtime toward types of higher quality (higher prices).5 Quality improvementThe trade liberalisation on the one hand and the privatisation of the economy is twofactors, which contributed to the quality improvement of the produced goods. First, thepresence of foreign products in the domestic markets stimulates the competition andforces domestic firms to improve their efficiency. Second, the presence of foreignproducers in the domestic market means adoption of new technology. The foreigncompetition transforms the quality improvement into a necessity for the survival of thedomestic firms. With the domestic markets invaded by high quality foreign goods, thelow quality domestic goods remain without demand. The majority of the foreigninvestors in transition countries are buyers of the former state owned firms, sold in theframework of privatisation process. Presumably they bring the technology from theirhome country and produce the same quality products as in their home country.ttt1t2t113
Barro (1998) showed that the measured TFP growth using the benchmark formulation(3) captures the quality improvement as well. Using a specification for the productionfunction proposed by Barro and Sala-i-Martin (1995, Ch.7) Y = AQ 1 − α F( L, X) whereX ≡Nx jk jj=1∑is the total spending on intermediates the sum of the highest quality (k j )intermediates and Q is an aggregate quality index, given by Q ≡Nq k j −∑ α/(1 α)j=1, where q>1 is the proportionate spacing between rungs on a given quality ladder. The keyelement of this framework is that different quality grades of intermediate inputs within agiven sector are modelled as perfect substitutes and therefore the lower qualityintermediates are driven out of the market in equilibrium. The highest quality of a givenintermediate good is priced at the monopoly level 1/s l in each sector.The TFP growth measure the sum of exogenous technical progress dA Aand the growthrate of the overall quality, dQ Qweighted by the labour share s ldAg s dQ dYs dL dX≡ +l= −l−( 1 −sl). (10)A Q Y L XThe part of the contribution from technological change (1-s l ) dQ Qis embodied in thegrowth of inputs and only the remainder appears in the residual.114
Appendix 4: Database descriptionThe data set comprises six time series for the period <strong>1990</strong>-1998: the gross value addedmeasured in basic price 74 , the employment for the economy and employees for themanufacturing, the capital stock (fixed assets) at the beginning of the period (<strong>1990</strong>), theinvestment, average monthly gross wages.For any given type of assets, there is a flow of productive services from the cumulativestock of past investments. This flow of productive services is called capital services ofan asset type and is the appropriate measure of capital input for production andproductivity analysis. Because flows of the quantity of capital services are not usuallydirectly observable, they have to be approximated by assuming that service flows are inproportion to the stock of assets 75 . The stock of capital is measured using the perpetualinventory method with geometric depreciation 76 starting with the capital stockregistered at the beginning of the analysed period and taking into account the amount ofinvestment in each year. In this way further from the beginning of transition the moreinsensitive the computed capital stock to the level of capital used to initialised theseries. For the implementation of the perpetual inventory method the annual amount ofinvestment expressed in current prices is transformed in the price of the beginning ofperiod (the same price in which the initial capital stock is measured) using the chaininvestment price indices (chain Laspeyres indices). The annual capital stock beingmeasured in prices from the beginning of the period the volume indices of capital stockcan be directly obtained. Since the computations does not incorporate vintage effectsefficiency losses associated with increasing capital obsolescence are reflected in theTFP estimates.74 The basic price is the amount of money received by a producer from a buyer for a unit of product (goodor service) decreased by any tax payable (VAT, taxes and custom duties on imports, excise tax ondomestic products, taxes on selected types of services) and augmented by any subsidy received on thatunit as a consequence of its production.75 The usual method to overcome the measurement errors in capital is to proxy the capital stock by theamount of electricity used. The method is not appropriate for the transition period since the relative priceof electricity increased rapidly after price liberalization. The firms under the constraint of hard budgetmost probably applied different substitution methods to minimize the energy consumption, notoriouslyhigh during socialism. Consequently, the difference in energy consumption among sectors might notreflect the difference in capital stock and the utilization of electricity consumption could bias the residual;in a way which would not be interpretable.76 The depreciation rates applied are considered to be of 5%.115
Appendix 5: Capital, Labour and TFP shares in Output <strong>Growth</strong>99GDP growth rate decomposition in <strong>Romania</strong>9897969594939291-100%-80% -60% -40% -20% 0% 20% 40% 60% 80% 100%capital labour tfpGDP growth rate decomposition in <strong>Romania</strong>nmanufacturing sector999897969594939291-100%-80% -60% -40% -20% 0% 20% 40% 60% 80% 100%capital labour tfp