The Volvo Group Annual Report 2010
The Volvo Group Annual Report 2010
The Volvo Group Annual Report 2010
- No tags were found...

Create successful ePaper yourself
Turn your PDF publications into a flip-book with our unique Google optimized e-Paper software.
Moving<strong>The</strong> <strong>Volvo</strong> <strong>Group</strong>...<strong>2010</strong>
A global group1 CEO comment4 Presence on all continents6 <strong>The</strong> <strong>Volvo</strong> <strong>Group</strong>’s product offering8 Moving the world – New York10 Vision, mission and values11 Overall strategies12 Profitable growth13 Operational Excellence14 Product renewal16 Strength factors17 <strong>Volvo</strong> Financial goals18 World-class services20 Moving the world – London22 Market overviewBoard of Directors’ report24 Significant events26 Organisation28 Trucks32 Buses34 Construction Equipment36 <strong>Volvo</strong> Penta38 <strong>Volvo</strong> Aero40 <strong>Volvo</strong> Financial Services42 Moving the world – Australia44 Sustainable development50 Moving the world – Stockholm52 Financial strategy53 Risks and uncertainties56 <strong>The</strong> share58 Financial performance62 Financial position64 Cash-flow statementFinancial information66 Financial information <strong>2010</strong>67 Consolidated income statement andOther comprehensive income68 Consolidated balance sheet69 Changes in consolidatedShareholders’ equity70 Consolidated cash-flow statement71 Notes to consolidated financialstatements114 Parent Company AB <strong>Volvo</strong>126 Proposed remuneration policy127 Proposed disposition ofunappropriated earnings128 Audit <strong>Report</strong> for AB <strong>Volvo</strong>129 Eleven-year summaryCorporate Governance <strong>Report</strong>138 <strong>Group</strong> Management140 Board of Directors and Auditors142 Corporate Governance <strong>Report</strong>Fold-out Definitions<strong>Annual</strong> General Meeting... theWithout the products and services of the <strong>Volvo</strong> <strong>Group</strong> therecan be no modern society like we know it. Like lifeblood, our trucks, buses,engines, construction equipment and aircraft components are involved in many of thefunctions that most of us rely on every day.For instance, one in seven meals eaten in Europe reaches theconsumers thanks to trucks from the <strong>Volvo</strong> <strong>Group</strong> rolling on the roads of the continent.Buses are the most common type of public transportation in the world,helping many people to reach work, school, vacations, friends and family.And if all the <strong>Volvo</strong> buses in the world were to start at the same time, they would transportmore than 10 million people.Most of us want to be able to fly far away sometime, either at work or to explore a newpart of the world. In 2009, <strong>Volvo</strong> Aero delivered components for over 90% of all largecivilian aircraft engines.Every year, the population on earth produces billions of tons of garbage.In the US alone, the garbage removed by refuse trucks from the <strong>Volvo</strong> <strong>Group</strong> every weekcould form a line of full garbage cans that would reach the moon.<strong>The</strong>se are just a few examples. In this <strong>Annual</strong> <strong>Report</strong>, you can learn more about theimportance of the <strong>Volvo</strong> <strong>Group</strong> in every day life. How we are the lifeblood of modernsociety – Moving the world.This report contains ‘forward-looking statements’. Suchstatements reflect management’s current expectationswith respect to certain future events and potential financialperformance. Although the Company believes that theexpectations reflected in such forward looking statementsare reasonable, no assurance can be given thatsuch expectations will prove correct. Such statements aresubject to risk and uncertainties and such future eventsand financial performance could differ materially fromthose set out in the forward looking statements as a resultof, among other factors, (i) changes in economic, marketand competitive conditions, (ii) success of business andoperating initiatives, (iii) changes in the regulatory environmentand other government actions, (iv) fluctuations inexchange rates and (v) business risk management.This report does not imply that the company has undertakento revise these forward-looking statements, beyondwhat is required under the company’s registration contractwith OMX Nordic Exchange Stockholm if and whencircumstances arise that will lead to changes compared tothe date when these statements were provided.<strong>The</strong> <strong>Volvo</strong> <strong>Group</strong>'s formal financial reports are presentedon pages 24–127 in the printed version and hasbeen audited by the company's auditors.
<strong>Volvo</strong> <strong>Group</strong>Mo<strong>The</strong> <strong>Volvo</strong> <strong>Group</strong> is one of the world’s leading providers of commercialtransport solutions, providing such products as trucks, buses,construction equipment, engines and drive systems for boats andindustrial applications, as well as aircraft engine components. <strong>The</strong><strong>Volvo</strong> <strong>Group</strong> also offers financial solutions and an increasingshare of other services to its customers.<strong>The</strong> <strong>Group</strong> has about 90,000 employees, production facilitiesin 19 countries, and sales activities in some 180 countries.Net sales development over ten years, SEK bn+18% +43%North AmericaEuropeStrategy<strong>The</strong> <strong>Volvo</strong> <strong>Group</strong>’s strategy is based on customers’ requirementsand is focused on profitable growth, product renewal and operationalexcellence. More information. & 1 12000 <strong>2010</strong>40.7 47.92000 <strong>2010</strong>72.1 103.090.000Employees+458%South AmericaOrganization<strong>The</strong> <strong>Volvo</strong> <strong>Group</strong> has product-related business areas that focuson our customers while the supporting business units work tomake efficient use of <strong>Group</strong>-wide resources.More information. & 2 62000 <strong>2010</strong>5.2 29.0TrucksBusesConstructionEquipment <strong>Volvo</strong> Penta <strong>Volvo</strong> Aero<strong>Volvo</strong>FinancialServicessegments<strong>Volvo</strong> 3P<strong>Volvo</strong> PowertrainBusiness units<strong>Volvo</strong> Parts<strong>Volvo</strong> Logistics<strong>Volvo</strong> Business Services<strong>Volvo</strong> Information Technology<strong>Volvo</strong> <strong>Group</strong> Real Estate, <strong>Volvo</strong> Technology, <strong>Volvo</strong> Technology Transfer, <strong>Volvo</strong> <strong>Group</strong> NAP
ving theShare of <strong>Group</strong>’s net sales by geographyEurope, 39%+644%AsiaNorth America, 18%South America, 11%Asia, 25%Rest of the world, 7%2000 <strong>2010</strong>8.8 65.5+471%Rest of the world2000 <strong>2010</strong>3.4 19.4Customers<strong>Volvo</strong> <strong>Group</strong> customers are active in about 180 countries. <strong>Group</strong>sales of products and services are conducted through both whollyowned and independent dealers. <strong>The</strong> global service network handlescustomer demand for spare parts and other services.More information. & 1 8Employees<strong>The</strong> majority of the <strong>Group</strong>’s employees work in Sweden, France, theU.S. , Japan, China, Brazil and Belgium. More information. & 4 7Strong positions• <strong>The</strong> second largest Western manufacturer of trucks.• No. 4 in construction equipment.• One of the world’s largest manufacturers of heavy-dutydiesel engines.• Strong positions also in the other business areas.• Good market presence globally.Share of <strong>Group</strong>’s net salesTrucks 63%Buses 8%Construction Equipment 20%<strong>Volvo</strong> Penta 3%<strong>Volvo</strong> Aero 3%Customer Finance 3%
world<strong>The</strong> <strong>Volvo</strong> <strong>Group</strong>’s vision is to be valued asthe world’s leading provider of commercialtransport solutions.CEO commentRecovery, growthand strengthenedprofitabilityDuring <strong>2010</strong>, the<strong>Volvo</strong> <strong>Group</strong> grew ata good pace withincreased sales in all regions, improved profitabilityand good cash flow. After having reported asubstantial loss in 2009 when the global financialcrisis hit hard and we were forced into considerablerationalizations, it is pleasing to notethat recovery in growth and profitability has beenswift.<strong>The</strong> <strong>Group</strong>’s sales of SEK 265 billion during<strong>2010</strong> represented an increase of 21% comparedwith the preceding year. Demand for the <strong>Group</strong>’sproducts recovered strongly in essentially allmarkets. Demand continued to rise from alreadyhigh levels in emerging markets, while in ourmature markets, with the exception of Japan,there was a significant gain in momentum duringthe second half of the year.Significantly improved earningsOperating income improved to SEK 18 billion,compared with the loss of SEK 17 billion the precedingyear. <strong>The</strong> operating margin was 6.8%. <strong>The</strong>improvement in earnings is of course an effect ofus selling more products and services, but it isalso the result of focused work on rationalizingand streamlining all parts of the <strong>Group</strong>, as well asour tight grip on costs. <strong>The</strong> combination ofincreased profitability with our achievement ofgrowth without tying up any additional operatingcapital resulted in our Industrial Operations generatingan operational cash flow of SEK 19 billion.In spite of our debt increasing when we weregoing through the global financial crisis in 2009,we made the assessment that we could take itupon ourselves to reduce our debt by loweringcost levels and turning around the negative cashflow. Through hard work, we succeeded in whatwe set out to accomplish. Thanks to the improvedprofitability and strong cash flow, we once againstand financially strong, with a net debt in IndustrialOperations that at the close of the year wasdown to 37% of shareholders’ equity – in line withour objective.We have been fortunate to be able to welcomethe return of increasing numbers of our formercolleagues to the <strong>Volvo</strong> <strong>Group</strong> – colleagues whosadly had to leave us in conjunction with thefinancial crisis but who have now been offeredwork again in increasing numbers. It is also pleas-the volvogroup <strong>2010</strong>Net sales increased by 21% to SEK 264.7billionOperating income amounted to SEK 18.0billionOperating cash flow of SEK 19.0 billion inIndustrial OperationsNet debt in Industrial Operations reducedto 37.4% of shareholders’ equityProposed dividend of SEK 2.50 per shareNet sales, SEK bn06 07 08 09259 285 305 21810265Operating income, SEK bn0620.40722.20815.909(17.0)1018.0Key ratios 2009 <strong>2010</strong>Net sales <strong>Volvo</strong> <strong>Group</strong>, SEK M 218,361 264,749Operating income (loss) <strong>Volvo</strong> <strong>Group</strong>, SEK M (17,013) 18,000Operating income (loss) Industrial Operations, SEK M (16,333) 17,834Operating income (loss) Customer Finance, SEK M (680) 167Operating margin <strong>Volvo</strong> <strong>Group</strong>, % (7.8) 6.8Income (Loss) after financial items, SEK M (20,573) 15,514Income(Loss) for the period, SEK M (14,685) 11,212Diluted earnings per share, SEK (7.26) 5.36Dividend per share, SEK 0 2.50 1Return on shareholders' equity, % (19.7) 16.01 According to the Board’s proposal.1
a global group <strong>2010</strong>Continued CEO COMMENTing that we have been able to provision SEK 350M for profit sharing to our employees, sincereturn on shareholders’ equity for <strong>2010</strong> amountedto 16%. <strong>The</strong> past two years have required quickadaptations that we would never have managedwithout the extraordinary efforts undertaken byemployees throughout the <strong>Group</strong>.Based on the much improved profitability andthe significantly reduced debt level, the Boardproposes to resume dividends with a pay-out ofSEK 2.50 per share for the financial year of <strong>2010</strong>.Improvements within all business areas<strong>The</strong> improved demand was clearly visible in ourtruck operations, with order intake rising by 75%while deliveries increased by 41%. Order intakegradually increased from low levels in Europe andNorth America. In many emerging markets suchas Brazil and India, demand remained strong. Onthe other hand, the Japanese market weakenedduring the second half of the year. Net sales inthe truck operations increased 20% to SEK 167billion and the operating margin improved to6.0%. <strong>The</strong> positive trend in order intake led to agradual increase in the pace of manufacturingand delivery in most of our truck plants.<strong>The</strong> growth and profitability development ofConstruction Equipment was strong throughoutthe year with a gradual improvement in Europe andNorth America, and with a very good contributionfrom emerging markets, particularly China. Salesrose 51% to SEK 54 billion and the business arearecorded an operating income of slightly morethan SEK 6 billion. <strong>The</strong> full year operating marginwas 11.5% with a strong finish to the year. We haveincreased our market share in the important Chinesemarket and now rank as its third largestmanufacturer. We are moving our position forwardfurther with the launch of SDLG branded excavatorsfrom Lingong and a large number of <strong>Volvo</strong>products.Buses’ sales increased by 11% and the operatingmargin rose to 3.8%. <strong>The</strong> business area hada positive trend in profitability throughout theyear despite relatively low volumes in the importantmarkets of Europe and North America. <strong>The</strong>improved profitability is partly a result of increasedsales, but primarily the fruit of considerableefforts to raise internal efficiency and lowercosts.<strong>Volvo</strong> Penta turned around with a profit of SEK578 M and a margin of 6.6% despite continuedweak demand for marine engines. With one of theindustry’s broadest product ranges and a globalnetwork of service and distributors, <strong>Volvo</strong> Pentais strategically well-positioned to be an innovativepartner to important boat builders. <strong>The</strong> industrialengine business had a good development andthe aim is to further increase sales of industrialengines by breaking into new segments of themarket.<strong>Volvo</strong> Aero’s operating income rose to SEK286 M despite a loss of SEK 538 M related to thedivestment of the U.S.-based service business.Core operations developed strongly due toincreased volumes, resulting in improved capacityutilization, improved productivity and lower costs.<strong>Volvo</strong> Aero remains well-established with participationin many interesting engine programs thatwill be entering production in coming years.In our Customer Finance Operations profitabilitygradually improved as our customers’ businessactivity increased, which in turn led to a more stablefinancial situation for them. As a consequenceof the <strong>Volvo</strong> <strong>Group</strong>’s increased sales of new products,we also see that our credit portfolio is growingagain.Intensive year of newsWe take a long-term view of our business andwhat needs to be done to create value for ourcustomers and to create sustainable profitability.Accordingly, we maintained our relatively highinvestments in product development during both2009 and <strong>2010</strong>. We also continued to invest inour plants and sales channels. Combined, thismeans that we now stand well-prepared in termsof both products and capacity.As one of the world’s largest manufacturers ofcommercial vehicles, we have a responsibility toreduce the impact on the environment caused byour production as well as the usage of our products– it is a responsibility that we take mostse riously. Engines that use less fuel lower ourcustomers’ operating costs and strengthen theircompetitiveness while reducing environmentalimpact. At the beginning of the year, we introducedon a broad front in the USA, the newengines that meet the latest, extremely stringentrequirements on emission levels that are in factpractically zero for nitrogen oxides and particulates.Trucks fitted with the new engines havebeen well received by both old and new customersand we are capturing market share in NorthAmerica as a consequence. But the truck newsdoesn’t end there. In Europe, <strong>Volvo</strong> Truckslaunched the new construction truck <strong>Volvo</strong> FMXthat strengthens the offering within this importantsegment of the market. In Japan, UD Trucks,in conjunction with the introduction of new emissionregulations, launched a new heavy Quontruck equipped with <strong>Group</strong> engines.Through Eicher, we have a very strong positionin medium-duty trucks in India and a well-performingsales network. We are now further developingEicher to keep pace with the strong growthin the country and for export to other countries.We are developing a new generation of heavydutytrucks and investing in new assembly capacity.We are also building a new engine plant thatwill be the global base for the medium-dutyengine platform to be launched in increasingnumbers of the <strong>Group</strong>’s products in the comingyears.<strong>Volvo</strong> CE launched a number of new <strong>Volvo</strong>products during the year. Manufacturing was alsobegun in China of the new series of excavatorsunder the SDLG brand. In addition, <strong>Volvo</strong> CE’sengines received certification in accordance withthe new environmental rules that are beginning tobe introduced in Europe and North America in2011. During the year, <strong>Volvo</strong> Buses began massproduction of hybrid buses at its plant in Poland.This is but a small selection of news for a yearwhen the pace of renewal remained high for allbusiness areas.2
Positive development in the shortand long termThanks to hard work and the resolute executionof cost-cutting measures, the <strong>Volvo</strong> <strong>Group</strong> hastaken itself through the collapse of the globalfinancial system and emerged as a stronger companyat a time when the economic trend is onceagain pointing in the right direction. I can concludethat both our distributors and our suppliersare doing a great job, and that together we standprepared to meet the expected continuation ofthe rise in volumes that we saw during <strong>2010</strong>. Weare continuously working to trim the industrialsystem in order to improve productivity and capitalefficiency. We are also intensifying our activitieswithin product development in preparationfor several important product launches in thecoming years.Against the background of the <strong>Volvo</strong> <strong>Group</strong>’simproved profitability, good cash flow, reduceddebt and the improved market outlook, as well asthe investments we have made and continue tomake in our plants and in product development, Ilook upon the development of the <strong>Group</strong> withconfidence, both in the short- and the long-termperspective.Finally, I would like to say that it has been apleasure to work for the <strong>Volvo</strong> <strong>Group</strong> for thesepast 14 years and that I wish my successor everysuccess in leading the <strong>Volvo</strong> <strong>Group</strong> into thefuture.Leif JohanssonPresident and CEO
EN A global group koncern <strong>2010</strong> <strong>2010</strong>Presence on all continentsGlobal industrial structure andstrong market channelsBacked by competitive product programs, strong dealers and increasingly more completeofferings including total solutions with spare parts, workshops, service packages, financingand leasing, the <strong>Volvo</strong> <strong>Group</strong>’s companies have established leading positions on a globalmarket.<strong>The</strong> <strong>Volvo</strong> <strong>Group</strong> has an established and strongposition in Europe, North America, and SouthAmerica. Through the acquisitions of UD Trucksand Lingong and the cooperation within trucksand buses with India-based Eicher Motors theposition has been strengthened in many marketsin Asia. Through its acquisitions the <strong>Volvo</strong> <strong>Group</strong>has also established a global industrial structurewith manufacturing as well as sales and distributionchannels on all continents.TrucksProduction facilities North America South America<strong>Volvo</strong> New River Valley (US) Curitiba (BR)Renault TrucksUD TrucksMack Trucks Macungie (US) Las Tejerias (VE)Eicher*Buses St Claire, St Eustache (CA), Mexico City (MX), Plattsburgh (US) Curitiba (BR)Construction Equipment Shippensburg (US) Pederneiras (BR)<strong>Volvo</strong> PentaLexington (US)<strong>Volvo</strong> AeroNewington (US)<strong>Volvo</strong> Powertrain Hagerstown (US) Curitiba (BR)4
Share of <strong>Group</strong>’s net salesTrucks, 63%Buses, 8%Construction Equipment, 20%<strong>Volvo</strong> Penta, 3%<strong>Volvo</strong> Aero, 3%CustomerFinance, 3%Share of <strong>Group</strong>’s net sales by geographyEurope, 39%North America, 18%South America, 11%Asia, 25%Rest of the world, 7%Europe Asia Rest of worldGöteborg, Umeå (SE), Gent (BE), Kaluga (RU) Bangalore (IN) Durban (ZA), Brisbane (AU)Blainville, Bourg-en-Bresse, Limoges (FR), Kaluga (RU)Ageo (JP), Hangzhou* (CN)Pithampur* (IN)Brisbane (AU)Borås, Säffle, Uddevalla (SE), Wroclaw (PL) Bangalore (IN), Shanghai*, Xian* (CN) Durban (ZA)Arvika, Braås, Eskilstuna, Hallsberg (SE), Konz-Könen, Hameln (DE),Belley (FR), Wroclaw (PL)Göteborg, Vara (SE)Trollhättan, Linköping (SE), Kongsberg (NO)Köping, Skövde (SE), Vénissieux (FR)Changwon (KR), Shanghai, Linyi* (CN),Bangalore (IN)Shanghai (CN)Ageo, Kounosu, Hanyu (JP)* Ownership ≥ 50%5
A GLOBAL GROUP <strong>2010</strong><strong>The</strong> <strong>Volvo</strong> <strong>Group</strong> ’s product offeringTrucksAll brands in the <strong>Volvo</strong> <strong>Group</strong>’s truck operations have a unique and distinctbrand-specific character that attracts customers in their market segments.<strong>The</strong> trucks are sold and marketed under the brands <strong>Volvo</strong>, Renault, UD,Mack and Eicher, which all offer customers a broad range of products andservices for efficient and economic transports.Long-haulRegional distributionCity distributionConstructionEicherMackTrucksUDTrucksRenaultTrucks<strong>Volvo</strong>TrucksBuses<strong>Volvo</strong> Buses’ product range includes complete buses and bus chassis forcity, intercity and coach traffic. <strong>The</strong> company has a total offering that, inaddition to buses, includes a global service network, efficient spare partshandling, service and repair contracts, financial services and traffic informationsystems.City buses Intercity buses Coaches ChassisMarine and industrial applications<strong>Volvo</strong> Penta manufactures engines and drive systems for marine applications,for both leisure and commercial craft, with an engine range of 10 to900 hp and has a global service network of approximately 4,000 dealers.<strong>Volvo</strong> Penta also supplies industrial engines ranging from 75 kW to 640 kWfor irrigation pumps, generator units and other industrial applications.Marine enginesIndustrial engines6
Construction equipment<strong>Volvo</strong> Construction Equipment develops, manufactures and markets equipmentfor construction and related industries. Its products are leaders inmany world markets, and include a comprehensive range of wheel loaders,hydraulic wheeled and crawler excavators, articulated haulers, road machineryand a wide range of compact equipment.Compact constructionequipmentHeavy construction equipmentRoad machineryWheel loadersCrawler excavatorsArticulated haulersMotor gradersBackhoe loadersWheeled excavatorsWheel loadersCompaction equipmentCrawler excavatorsCrawler excavators from LingongLingong wheel loadersPaversSkidsteer loadersAsphalt milling machinesAerospace industry<strong>Volvo</strong> Aero develops and manufactures advanced components for aircraftengines and space rockets with light weight in focus. More than 90% of allnew large commercial aircraft are equipped with engine components from<strong>Volvo</strong> Aero. <strong>The</strong> company is also responsible for the engines of the SwedishAir Force’s Gripen fighters. <strong>Volvo</strong> Aero also has an aftermarket businessthat comprises repair and maintenance of select aircraft engines aswell as stationary gas turbines.Engine components Engine overhaul SpaceFinancial servicesFinancial services, such as customer and dealer financing, and other services,such as insurance, contribute to create customer value. Providingattractive financing solutions is essential to retaining existing customersand attracting new ones.Customer and dealer financing7
A GLOBAL GROUP <strong>2010</strong>Moving the worldEvery dayMack Trucks collect garbage formillions around the U.S.Mack is one of the leading producers of heavy-duty trucks in North AmericaEver since the start, Mack Trucks has focused on power and reliability, which has contributed tomaking the company one of the strongest heavy-duty truck brands in the North American market.In the U.S., Mack is the leading producer of trucks in the construction, economic haul and refusesegments. In total, Mack has sales and service in more than 45 countries.8
<strong>The</strong> people on Earth produce more than 2,000 million tons of garbageevery year, and just a few days without refuse collection would becatastrophic for cities and suburban areas. In New York City alone, refusetrucks from the <strong>Volvo</strong> <strong>Group</strong> collect 11,000 tons of garbage each day.Every day, Mack trucks collect tons of refuse all over the U.S. <strong>The</strong>demands imposed on these trucks are rigorous. <strong>The</strong>y have to get throughin every situation and they must not break down. Should the garbagecollection stop, it wouldn’t take long for the cities and suburban areas tobecome inundated by waste.Mack refuse trucks collect 2 million tons of garbage every week in theU.S. Is the number hard to grasp? Try this: With the garbage that MackTrucks refuse trucks transport every week in the U.S., it would be possibleto build a column of filled garbage cans that reaches all the way to themoon.Mack has been leading the U.S. market for refuse collection for morethan 30 years. <strong>The</strong> company’s operations are most extensive on the eastcoast, with huge cities like New York, Boston and Philadelphia. In all,Mack has almost 50% of the refuse vehicle market in the U.S. and itssuccess is continuing.Customers range from private family-owned companies with just onerefuse truck to local authorities and large cities, such as New York City,operating around 2,500 Mack refuse trucks that haul more than 11,000tons of trash every day.Mack collaborates closely with customers to customise trucks thatmatch their specific requirements. In New York, for example, a number ofrefuse trucks are also able to help with snow clearance using a speciallydesigned plow.All Mack trucks are built at the plant in Macungie, Pennsylvania. <strong>The</strong>Mack TerraPro model is primarily used as a refuse truck. At the plant,the trucks are also adapted to match customer requirements. <strong>The</strong> nextstep in the development process involves alternative fuels. Both hybridsand natural gas driven vehicles are important, and many customers indifferent parts of the U.S. are interested in extending their fleets to includemore energy efficient and environmentally sound vehicles.9
EN A GLOBAL global GROUP koncern <strong>2010</strong> <strong>2010</strong>Vision, mission and valuesVision<strong>The</strong> <strong>Volvo</strong> <strong>Group</strong>’s vision is to be valued asthe world’s leading provider of commercialtransport solutions.MissionBy creating value for our customers, we create value for our shareholders.We use our expertise to create transport-related hard and soft products ofsuperior quality, safety and environmental care for demanding customers in selected segments.We work with energy, passion and respect for the individual.Values<strong>The</strong> <strong>Volvo</strong> <strong>Group</strong> views its corporate culture as a unique asset,since it is difficult for competitors to copy. By applying andstrengthening the expertise and culture we have built up over theyears, we can achieve our vision.Quality, safety and environmental care are the values that form the<strong>Volvo</strong> <strong>Group</strong>’s common base and are important components of ourcorporate culture. <strong>The</strong> values have a long tradition and permeate ourorganization, our products and our way of working. Our goal is tomaintain a leading position in these areas.QualityQuality is an expression of our goal tooffer reliable products and services. Inall aspects of our operations, from productdevelopment and production to deliveryand customer support, the focusshall be on customers’ needs and expectations.Our goal is to meet or exceedtheir expectations. With a customerfocus based on everyone’s commitmentand participation, our aim is to benumber one in customer satisfaction.This is based on a culture in which allemployees are responsive and aware ofwhat must be accomplished to be thebest business partner.SafetySafety pertains to how our products areused in society. We have had a leadingposition in issues regarding safety for along time; our goal is to maintain thisposition. A focus on safety is an integralpart of our product development work.Our employees are highly aware ofsafety issues, and the knowledge gainedfrom our internal crash investigations isapplied in product development. Ourgoal is to reduce the risk of accidentsand mitigate the consequences of anyaccidents that may occur as well as toimprove the personal safety and thework environment of the drivers of ourvehicles and equipment. Our long-termvision is zero accidents.Environmental careWe believe that it is self-evident that ourproducts and our operations shall havethe lowest possible adverse impact onthe environment. We are working tofurther improve energy efficiency and toreduce emissions in all aspects of ourbusiness, with particular focus on theuse of our products. Our goal is for the<strong>Volvo</strong> <strong>Group</strong> to be ranked as a leader inenvironmental care within our industry.To achieve this goal, we strive for a holisticview, continuous improvement, technicaldevelopment and efficient resourceutilization.10
Over all str ategies<strong>The</strong> majority of the <strong>Volvo</strong> <strong>Group</strong>’scustomers are involved in commercialtransport-related operations. <strong>The</strong>y placehigh demand on both products andservices.ProfitableGrowth<strong>The</strong> <strong>Volvo</strong> <strong>Group</strong>’s aim is to continue to grow withincreased focus on profitability. <strong>The</strong> goal is to grow by10% a year over a business cycle with a higher pace innew markets. Part of the growth may, over time, comefrom acquisitions and then mainly in growth marketsand in strategic product segments.<strong>The</strong> market is characterized by intense competitionwhere customer satisfaction is a key factoras it lays a foundation for future sales and futureprofitability. <strong>The</strong> <strong>Volvo</strong> <strong>Group</strong>’s strategy is basedon customers’ requirements and is focused onprofitable growth, product renewal and internalefficiency.Customer requirements<strong>The</strong> <strong>Volvo</strong> <strong>Group</strong>’s products and services offerhigh performance characteristics, quality, safety,flexibility and a favorable total economy. Customersare offered solutions adapted to their operationsregardless of whether they involve a singleproduct or a complete solution.Products, services and complete solutions aredeveloped in close cooperation with customerswith the goal of contributing to improving thecustomers’ productivity and profitability, and thuscreating value for the customer. <strong>Volvo</strong> strives toincrease the penetration and proportion of salescoming from services and soft products, with anoffer consisting of financing, insurance, variousforms of service contracts and spare parts,superstructures and attachments.In the past few years, the <strong>Volvo</strong> <strong>Group</strong> hasintensified its relationships with key customers.<strong>The</strong> advantages are many. <strong>The</strong> <strong>Group</strong> can supportcustomers’ development in an even betterway than previously, and intensified relationshipsresult in increased penetration of both the productand the service range. <strong>The</strong> extended offeringcreates advantages for both the <strong>Volvo</strong> <strong>Group</strong> andits customers.ProductRenewalOperationalExcellence<strong>The</strong> ongoing renewal of the <strong>Group</strong>’s product range andcreation of new and better products and services is achallenge, but a matter of survival. Intense competition,new environmental standards and safety and qualityrequirements put significant demands on the entireproduct development process. <strong>The</strong> <strong>Group</strong> utilizes commonarchitecture and shared technology to create synergiesand reduce costs.<strong>The</strong> <strong>Volvo</strong> <strong>Group</strong> strives to optimize cost-efficiency andproductivity in all parts of its operations by reducingmanufacturing costs and sales and administrative costsand by speeding up product development and otherprocesses. <strong>The</strong> work also comprises competencedevelopment and organizational development.11
EN A GLOBAL global GROUP koncern <strong>2010</strong> <strong>2010</strong>Str ategYProfitable GrowthIn an industry characterized by economies of scale and which is undergoing consolidation,profitable growth is a necessary condition in order to continue to strengthen competitivenessand to develop as a close partner to customers with high demands. <strong>The</strong>re is particularlystrong growth potential in supplemental business relating to service and to services inwhich significant effort is invested to give the customer a more complete offering.Profitability is essential to ensure investments inthe development of new products and servicesand a favorable return to the shareholders. <strong>The</strong><strong>Group</strong>’s brands shall increase customer satisfactionby offering environmentally and cost-efficientproducts and services.Required scale achievedDuring the past ten years, the <strong>Volvo</strong> <strong>Group</strong> hasgrown on average 7.4% per year, both organicallyand through acquisitions. <strong>The</strong> acquisitions havebeen carried out in order to establish the <strong>Group</strong>in new markets and in new product segments, aswell as to achieve economies of scale throughsize. <strong>The</strong> average operating margin during theperiod has been 3.9%.Through its growth, the <strong>Group</strong> has achievedsufficient size in mature markets with satisfactorymarket shares. <strong>The</strong> size facilitates good economiesof scale in most product segments.Strong positions<strong>The</strong> <strong>Volvo</strong> <strong>Group</strong> has strong positions from whichfurther to develop:• No. 2 among Western manufacturers of heavydutytrucks• No. 4 in construction equipment• One of the world’s largest manufacturers ofheavy-duty diesel engines• Strong positions also in the other businessareas• Good market presence globally.Future directionWithin the strategic area Profitable Growth thefuture direction is:• Continued organic growth in mature markets.• Focus on increased sales of services and aftermarketproducts.• Products in market segments that open up possibilitiesto capture the rapid growth in Asia andother growth markets.• Realizing further synergies from acquired companies.• Increased cooperation with business partners.Net salesSEK bn4003002001000Net sales01 02 03 04 05 06 07 08 09 10<strong>The</strong> <strong>Volvo</strong> <strong>Group</strong>’s acquisitions and divestments2008 Joint venture with Eicher Motors of India within trucks and buses.2007 Acquisition of Igersoll Rand’s road development division.2007 Acquisition of Ingersoll Rand’s road development division.2006 Acquisition of Japanese Nissan Diesel (Now UD Trucks). Completed in 2007.2005 Sale of the service company Celero Support.2004 Acquisition of remaining 50% of the Canadian bus manufacturer Prévost.2004 Sale of axle-manufacturing operations to ArvinMeritor.2003 Acquisition of the truck and construction equipment dealers from Bilia.2001 Acquisition of the truck manufacturers Mack and Renault VI.1999 Sale of <strong>Volvo</strong> Cars to Ford.1998 Acquisition of the excavator operations of Samsung Heavy industries.12
Str ategYOperationalExcellenceOperational excellence is an important factor for securinga sustainable profitability for the <strong>Group</strong>. <strong>The</strong> work withoperational excellence includes lowering the manufacturingcosts and the cost of sales and administration as wellas making product development and other processes moreefficient.<strong>Volvo</strong> Production System (VPS) is an importanttool in the effort to increase operational excellence.It contains methods to make operationsmore efficient and reduce productivity losses.Competence development is a key part of VPS.Great effort is placed on developing employees innew, future technological competencies.Substantial cost savingsIn 2009 as well as <strong>2010</strong>, substantial measureswere implemented to lower the <strong>Group</strong>’s costs ona permanent basis. Short-term, they have beenfocused on quickly changing over the <strong>Group</strong> to anew, lower cost base while at the same timesecuring the <strong>Group</strong>’s long-term competitiveness.All parts of the <strong>Group</strong> have been subject to costsavings in a number of areas. <strong>The</strong> measures haveproduced results and substantially lowered thetotal costs for, among others, sales and adminstrationas well as for research and development.As the <strong>Group</strong> now grows again, it is of vital importancethat costs increase at a slower pacethrough increased efficiency and productivity andthus assist in raising profitability.Future directionWithin the strategic area of Operational Excellencethe future direction is:• Lowering the product cost.• Utilizing the global production capacity withregional support.• Productivity increase in the industrial system tostrengthen competitiveness.• Focus on closer and more long-term cooperationwith well-performing suppliers and takefurther advantage of large purchasing volumes.• Reduce administration by fully utilizing the businessunits.• Increase productivity in product development.• Increase flexibility to be able to rapidly adapt thecost structure to changes in demand.• Increase competency and diversity with strongemployee commitment.Improved profitability through cost controlIndustrial Operations8060+25%4020009Q4 10Q1 10Q2 10Q3 10Q4Net salesSelling, administrative, reserach and development expenses+3%13
EN A GLOBAL global GROUP koncern <strong>2010</strong> <strong>2010</strong>Str ategYProduct Renewal<strong>The</strong> development of new, innovative technology is key to the success of future productgenerations and to maintaining market-leading positions.Efforts are constantly under way within the <strong>Group</strong>to refine and improve the performance of productsand with swiftness strengthen current competitiveness.At the same time, research lookingfurther into the future is conducted to achievenew technical breakthroughs that will contributeto reduced environmental impact and meet futurerequirements.Cleaner enginesAfter implementing comprehensive productrenewal in recent years, the <strong>Volvo</strong> <strong>Group</strong> decidedto maintain relatively high investments in researchand development during 2009 and <strong>2010</strong>. This wasdone to secure a competitive range of productsand services in both the short and the long term.<strong>The</strong> pace of product renewal has been high, forexample in conjunction with the implementationof new emissions regulations in Europe, NorthAmerica and Japan. <strong>The</strong> <strong>Group</strong> also started serialproduction of hybrid buses and launched a largenumber of new construction machines, includingexcavators under the brand name SDLG in China.<strong>The</strong> <strong>Volvo</strong> <strong>Group</strong> has also developed its owncaptive <strong>Group</strong>-wide engine platform for mediumdutydiesel engines. <strong>The</strong> first models of the newmedium-duty engines started to be launched in<strong>2010</strong>.<strong>The</strong> <strong>Group</strong> has its most competitive productrange ever, but the customer offering will be furtherstrengthened in the next few years by focusingintensely on the development of future generationsof products and services that createvalue for customers.Focus on the driveline<strong>The</strong> <strong>Volvo</strong> <strong>Group</strong> is one of the world’s largestmanufacturers of heavy diesel engines for commercialuse. <strong>The</strong> <strong>Group</strong> has production andresearch and development facilities for drivelineson three continents. <strong>The</strong> products are sold tocustomers in some 180 markets worldwide.A large number of product launches<strong>Volvo</strong> TrucksIn April <strong>2010</strong>, <strong>Volvo</strong> Trucks launched thenew <strong>Volvo</strong> FMX truck, specially designedfor heavy construction duties. With thenew <strong>Volvo</strong> FMX and a strong serviceoffering for the construction industry,the company has strengthened its positionin this segment. During the year,<strong>Volvo</strong> Trucks also focused on the developmentof hybrid trucks and engines foralternative fuels.Renault TrucksRenault Trucks launched the Optitracksystem on Renault Premium Lander. <strong>The</strong>system is useful when driving on difficultterrain in quarries or worksites. With theaid of separate hydraulic motors integratedin the wheel hubs, the truck canautomatically be driven in all-wheeldrive. In addition Renault Trucks starteddelivery of an all-electric version ofRenault Maxity.UD TrucksIn April, UD Trucks launched versions ofits Quon heavy-duty truck with enginesbased on the <strong>Group</strong>’s common heavyengine platform that comply with newemission regulations introduced inJapan. In addition to environmentalperformance, the latest Quon lineuphas been developed to meet growingdemand for high levels of both fueleconomy and driving performance.Mack TrucksMack introduced its new mDRIVE automatedmanual transmission, based onwell-accepted <strong>Group</strong> architecture engineeredto work exclusively with MACKMP series engines and deliveringimproved fuel efficiency, driveability andsafety. A natural gas-powered version ofthe versatile MACK TerraPro Cabovermodel was brought to market for refuseand construction customers.14
Continued focus on product developmentResearch and development costs, SEK billion01 02 03 04 05 06 07 08 09 105.4 5.9 6.8 7.6 7.6 8.4 11.1 14.3 13.2 13.0<strong>The</strong> drivelines are designed so they can beadapted to a large number of applications in mostof the <strong>Group</strong>’s products. <strong>The</strong> diesel engines areused in trucks, buses and construction equipment,as well as in boats and industrial applications,such as generator units.<strong>The</strong> strongest driver of the development ofdrivelines is customer requirements and preferencesas well as new legislation with stricteremissions requirements. Products with reliability,sustainability, good drivability, favorable fueleconomy and high environmental parametershelp boost customers’ productivity and profitability.<strong>The</strong> environmental aspect is of great signifi-cance in all product development. Alternativedrivelines and fuels, and the lower fuel consumptionwhen using traditional drivelines, provide fortwice the benefit – less impact on the environmentand lower costs for customers. <strong>The</strong> <strong>Volvo</strong><strong>Group</strong> is a driving force in the areas of environmentaladaptation and energy efficiency. <strong>The</strong>undertaking involves a gradual transition fromfossil fuels, such as oil and natural gas, to fuelsfrom renewable sources and to hybrids.<strong>The</strong> <strong>Group</strong> continuously strengthens thedevelopment of aftermarket products and serviceswith the aim of meeting customer needsthrough the entire product life cycle.Future directionWithin the strategic area of Product Renewal thefuture direction is:• Meet future emission standards with competitiveproducts – capitalize on converging technologies.• Start production in India of medium-duty engineplatform developed by the <strong>Group</strong>.• Develop new products adapted for growth markets.• Further enhance the <strong>Group</strong>’s market-leading positionwithin diesel engines and automatic gearboxes.• Commercialize the <strong>Group</strong>’s shared technology fordiesel-electric hybrids.• Focus on fully utilizing common architecture andshared technology.<strong>Volvo</strong> BusesIn the summer of <strong>2010</strong> serial productionstarted of <strong>Volvo</strong>’s hybrid buses, bothsingle deckers and double deckers.Hybrid buses reduce fuel consumptionand emissions of CO 2by as much as35%. <strong>The</strong> company has redeived ordersfor some 200 hybrid buses in Europeand has carried out positive tests atoperators in Brazil and Mexico.<strong>Volvo</strong> Construction Equipment<strong>Volvo</strong> CE is highlighting its commitmentto improving fuel efficiency with a rangeof solutions that encompasses engines,hydraulic systems, operator behavior andhybrid technology. <strong>The</strong> company is rampingup its investments in new technologyto maintain its leadership in fuelefficiency and thereby environmentalprotection.<strong>Volvo</strong> PentaWith new and specially designed controlsfrom <strong>Volvo</strong> Penta, boat drivers canquickly choose between a number offeatures, for example cruise control,powertrim assistant and tow mode. <strong>The</strong>electronics development makes it possiblefor <strong>Volvo</strong> Penta to offer its customerssoft products of this kind. Alsoamong these is the appreciated joystick,which makes maneuvering a boat easierand safer.<strong>Volvo</strong> Aero<strong>The</strong> main challenge for the airline industryis to reduce the engines’ fuel consumptionand thus also the emissions. <strong>Volvo</strong>Aero’s lightweight technologies aretherefore in increasing demand from thelarge, international engine manufacturers,while the technologies also get newapplications in the aerospace industry15
A global GROUP <strong>2010</strong>Strength factors<strong>Volvo</strong>profitabilityBasedStrategically important for futureMackBy selling products with different brands, theStrong brands<strong>Volvo</strong> <strong>Group</strong> can penetrate many different customerand market segments in mature marketsas well as growth markets.<strong>The</strong> <strong>Volvo</strong> brand, which has been built up overdecades, is one of the world’s best known andrespected names within trucks, buses, constructionequipment, marine engines, industrialengines and in the aviation industry.Mack is one of the most well-known truckbrands in North America, while Renault Trucksholds a special position in Southern Europe. <strong>The</strong>UD brand is one of the biggest in the Japanesetruck market.Prevost sells coaches and Nova Bus city busesLingongin North America.<strong>The</strong> <strong>Volvo</strong> <strong>Group</strong> also sells construction equipmentunder the SDLG brand mainly in China, andthrough joint-venture companies, trucks andbuses under the Eicher brand mainly in India andbuses under the Sunwin and Silver brands inChina.Sunwinmachines. All in all, the <strong>Volvo</strong> <strong>Group</strong> in <strong>2010</strong> wasSilverintended to provide for improved competitiveness.PrevostNova BusRenaultUD TrucksEicher1998Successful inroads into new marketsShare of Industrial Operations’ net sales16Western Europe 52%North America 31%Eastern Europe 3%South America 6%Asia 5%Other markets 3%on its strategies and by utilizing its strength factors, the <strong>Volvo</strong><strong>Group</strong>’s ambition is to further increase its competitiveness and improveits profitability.A customer offering at the forefront<strong>The</strong> <strong>Volvo</strong> <strong>Group</strong> offers customers complete, efficienttransport solutions. Products with reliability,durability, good driveability, favorable fuelefficiency and high environmental performanceare combined with services such as financing,insurance, various service contracts, accessoriesand spare parts that support the core products.<strong>The</strong> <strong>Volvo</strong> <strong>Group</strong>’s increasingly broad offeringof these services and aftermarket products isStrong dealersThrough the years, the <strong>Volvo</strong> <strong>Group</strong> has investedconsiderable resources in building a very strongdealer network with overall well-developed salesand service channels. <strong>The</strong> network consists ofwholly-owned as well as independent dealers.Thanks to large populations of <strong>Group</strong> products inmost markets, the dealers have a stable base ofrevenues from the important aftermarket withservice and repair.Strong market positions<strong>The</strong> <strong>Volvo</strong> <strong>Group</strong> has leading positions globally ineach of its business areas. <strong>The</strong> <strong>Volvo</strong> <strong>Group</strong> isEurope’s largest and one of the world’s largest<strong>2010</strong>Western Europe 34%North America 18%Eastern Europe 5%South America 11%Asia 25%Other markets 7%17% 48%manufacturers of heavy-duty trucks and one ofthe largest manufacturers of buses in Europe andNorth America. Within construction equipment,the <strong>Volvo</strong> <strong>Group</strong> is the world’s largest manufacturerof articulated haulers as well as one of theworld’s largest manufacturers of wheel loaders,excavators equipment and road developmentone of the world’s largest producers of heavydutydiesel engines.Strengthened presence in Asia andSouth AmericaIn recent years, the <strong>Volvo</strong> <strong>Group</strong> has strengthenedits position in important growth markets inAsia and South America through a combinationof organic growth and acquisitions. Among theacquired companies are UD Trucks in Japan, Lingong(70% ownership) in China and VE CommercialVehicles (50% ownership) with its Eicherbrand in India. During <strong>2010</strong>, 19% of the IndustrialOperations’ net sales were generated in the BRICcountries (Brazil, Russia, India and China). Altogether,the markets outside Western Europe andNorth America accounted for 48% of net sales inthe Industrial Operations during <strong>2010</strong>.Organic growth• Strong brand and distribution in Eastern Europe• Product portfolio expansion and distribution inSouth America and Asia• Development of acquired businessesAcquisitions and JVs• Lingong, China• UD Trucks, Japan• VECV (Eicher), India
Financial goalsMeasured over a business cycle<strong>The</strong> <strong>Volvo</strong> <strong>Group</strong>’s financial goals were established by the Boardin September 2006. <strong>The</strong> Board focuses on three goals comprisinggrowth, operating margin and capital structure for the <strong>Group</strong>’sIndustrial Operations.Financial goals for Industrial OperationsGrowth<strong>The</strong> growth target is that net sales should increaseby a minimum of 10% annually. During 2000–<strong>2010</strong>, the average growth rate was 7.4% annually.Operating margin<strong>The</strong> <strong>Volvo</strong> <strong>Group</strong>’s profitability target is that operatingmargin for the Industrial operations is toexceed an average of 7% annually over a businesscycle. <strong>The</strong> average annual operating margin for the<strong>Volvo</strong> <strong>Group</strong>’s Industrial Operations was 3.9%from 2000 to <strong>2010</strong>.Capital structure<strong>The</strong> capital structure target is set to a net debtincluding provisions for post-employment benefitsfor the Industrial operations of a maximum of40% of shareholders’ equity under normal conditions.As of December 31, <strong>2010</strong>, the <strong>Volvo</strong><strong>Group</strong>’s Industrial operations had a net financialdebt position corresponding to 37.4% of shareholders’equity.Net sales growth, % Operating margin, % Net financial debt as percentage ofshareholders’ equity, %100(30)Target: above 10%100(10)Target: above 7%806040200(20)(40)Target: below 40%Net cash Net debt067071008609(28)1021067.907 087.8 5.209(7.8)106.906(29.2)075.70839.70970.91037.4Financial goals for Customer Finance Operations<strong>The</strong> target for Customer Finance is a return on shareholders’ equity of 12–15% and an equity ratioabove 8.0%. At year end the equity ratio was 9.0%. <strong>The</strong> average annual return on shareholders’ equityfor 2006–<strong>2010</strong> amounted to 7.2%.Return on shareholders’ equity, %Target: 12–15%151050(5)(10)0613.207 0815.9 12.609(6.2)100.417
A Global <strong>Group</strong> <strong>2010</strong>World-cl ass servicesStrengthens customerrelationshipsMany customers want long-term cooperation around total solutionsto execute their work as efficiently as possible with maximumprofitability and reliability.When customers choose supplier of vehicles ormachinery, the offering of supplementary servicescombined with excellent products is a crucialfactor.Accordingly, the <strong>Volvo</strong> <strong>Group</strong> offers such servicesas financing and insurance, various forms ofservice agreements, accessories and spareparts. <strong>The</strong> <strong>Volvo</strong> <strong>Group</strong>’s increasingly broad rangeof these services and aftermarket products, socalled soft products, is of ever-increasing importanceto the <strong>Group</strong>’s competitiveness.Growing aftermarket business<strong>The</strong> <strong>Volvo</strong> <strong>Group</strong>’s offering includes various typesof financing solutions, insurance, rental services,used vehicles, spare parts, preventive maintenance,service agreements, assistance servicesand IT services. <strong>The</strong> range and flexibility of theoffering means that the solutions can be customizedfor each customer.Since a large part of the accessories, spareparts and services in the aftermarket business isrequested as long as products are being used,they contribute to balancing the fluctuations inServices and aftermarket products (so called soft products)Aftermarket products Extended product offering Services offeringSparepartsSoftwareAccessoriesServiceProductsExtendedproductofferingUptimeservicesFleet/TransportServicesSupportServicesFinancialServicesNew partsUsed andremanufacturedpartsExtendedpartsVehiclesoftwareAccessoriesNon-<strong>Volvo</strong>accessoriesMerchandiseproductsServicelitteratureService /dealertoolsPartsServicesUsedvehiclesTrailersand superstructuresAttachmentsand optionsServiceplanningMaintance andrepairUpdates andupgradesTransportmanagementDriver timemanagementVehiclemanagementCompetencedevelopmentFleet and assetmanagementCall centreservicesDealerfinancingCustomerfinancingRentalSpecialvehiclesServicecontractsExtendedcoverageSecurity, safety& environmentDriver infoand supportConsultancyservicesInformationservicesInsuranceCard andpaymentsolutions18
Soft product share of Industrial Operations’ net sales <strong>2010</strong>Sales of hardproducts, 65%Sales of services andaftermarket products(soft products), 35%the business cycle for the <strong>Volvo</strong> <strong>Group</strong>. By strengtheningthe aftermarket offering, profitability and revenuesustainability can improve for the <strong>Group</strong>throughout the business cycle.<strong>The</strong> strategy to increase sales of services andaftermarket products is an important element inthe <strong>Volvo</strong> <strong>Group</strong>’s effort to achieve targets forprofitability and growth, both in mature marketsand in the <strong>Group</strong>’s new markets. During <strong>2010</strong>, theservices and aftermarket products business representedapproximately 35% of net sales in theIndustrial Operations, of which roughly half wasattributable to spare parts and workshop services.Develop and increase interface withcustomers<strong>The</strong> majority of <strong>Volvo</strong> <strong>Group</strong>’s customers arecompanies within the transportation or constructionindustries. <strong>The</strong> reliability and productivity ofthe products are important and in many casescrucial to the customers’ success and profitability.<strong>The</strong> goal is that <strong>Volvo</strong> <strong>Group</strong> companies shallbe regarded as number one in customer satisfaction,in terms of both products and services. <strong>The</strong><strong>Volvo</strong> <strong>Group</strong> shall also be number one when thedealers’ customers assess customer satisfaction.A competent and professional dealer and servicenetwork is of vital importance to the <strong>Volvo</strong> <strong>Group</strong>and contributes to strengthening the <strong>Group</strong>’svarious brands.A missed deliveryis a missed saleLast year, the bread producer, Pågen AB, placed an orderfor 61 <strong>Volvo</strong> FL trucks.“We are in the fresh produce business. Distribution isthe one part of our chain that must be completely faultless,”says Johan Blixt, Purchasing Manager at the Pågen<strong>Group</strong>.<strong>The</strong> first <strong>Volvo</strong> trucksFor 20 years, the drivers at Pågen AB have driven another brandof trucks, so the decision to change supplier and make an investmentof this size requires serious consideration.“Our procurement processes are very thorough. Suppliers arecompared in great detail. <strong>Volvo</strong> came out well and won this contract.But <strong>Volvo</strong> will still have to work hard for several years to come.”<strong>The</strong> service organization was decisivePrice was not the main reason the Pågen <strong>Group</strong> made its choice.“I would say the decisive factor was <strong>Volvo</strong>’s service organization.We have been very well received, they have listened to what we hadto say and we feel well looked after. <strong>The</strong>se things are important forme as Purchasing Manager when taking such large decisions andfor our employees that leave the vehicles at the workshop.”Pågen AB has chosen to invest in <strong>Volvo</strong>’s Gold Service Contractfor the new trucks.“When a driver hands in a truck for service, whatever work hasbeen ordered must be completed in the appointed time. If welose time, we miss deliveries and a missed delivery is a lost sale.It just has to work!”Fits Pågen’s environmental profile<strong>Volvo</strong> trucks’ environmental qualities are highly valued by Pågen.“We strive to minimize our environmental impact throughout ourchain and invest in premium environmental technology, and thetransports are no exception.Pågen ABPågen is Sweden’s largest bread producer. Netsales amounted to SEK 2.7 billion.Freshly baked bread is distributed acrossSweden from bakeries in Malmö and Gothenburg,seven days a week, all year long.Of the approximately 1,400 employees, 430work as sales staff and drive bread trucks aroundtheir own district of stores. In total, Pågen’s salesstaff visit 5,000 stores every day.<strong>The</strong> order: 61 trucks of the <strong>Volvo</strong> FL model.19
A global group <strong>2010</strong>Moving the worldRed hybridbus of the future forthe streets of LondonUp to 35% lower fuel consumption<strong>The</strong> <strong>Volvo</strong> B5L Hybrid Double Decker is equipped with a diesel engine with smaller cylinder volume than usual,since it is combined with an electric motor. It is the electric motor that is running the bus when it accelerates toa speed of 15–20 km/h. When the bus is underway, the parallel hybrid system combines diesel and electricpower to maintain speed. At higher speeds, the bus uses diesel power alone. Regenerative braking energycharges the battery via the generator. Several of the <strong>Volvo</strong> hybrid auxiliary systems are powered by independentelectric motors. <strong>The</strong>se measures all contribute to high fuel savings on routes with frequent braking andacceleration, like city bus traffic. <strong>The</strong> parallel hybrid technology reduces fuel consumption and CO 2emissionsby up to 35% compared to conventional diesel buses. In the hybrid configuration, the emissions ofnitrogen oxide and particulates are reduced by up to 50%.20
When mega city London makes a commitment to reduce emissions,tradition and new technology are combined: A classic red double-deckerbus using <strong>Volvo</strong>’s latest hybrid technology carries London’s citizens just asit always has – but with up to 35% less fuel consumption.Of all passengers using public transportation in the world, 80% go by bus.Buses are easy to use in almost all types of traffic and are in many parts of theworld the only public transportation. In London, buses are one out of manymeans of transportation, and play an important role as the city aims toreduce traffic.North London’s Green Lanes is a chaotic experience during rush hour. Atthe bus stop outside the popular pub <strong>The</strong> Fox, commuters get on and off anever-ending stream of red doubledeckers. Noise pollution from cars anddiesel buses fills the street with an aggressive roar.All this makes the contrast with <strong>Volvo</strong>’s new hybrid double-deckers all themore evident. When it arrives at the bus stop, the diesel engine shuts downcompletely. You are left with a comforting silence that remains even as thehybrid bus leaves the stop, only using its electric motor to accelerate.“It’s fantastic how quiet it is when the diesel engine is turned off and it onlyruns on electricity,” says Daniel Clarke, one of the commuters standing in lineat the bus stop. “I can’t even imagine what the difference would be if all buseswere hybrids.”Arriva’s Wood Green bus garage in North London is a pioneer of hybridbuses for London. In the summer of 2009, six brand new <strong>Volvo</strong> B5L HybridDouble Decker buses arrived at the garage that has had previous experienceof hybrid technology.“We received the first hybrid buses in 2007 and now have a total of 11hybrid double-deckers at Wood Green. Our experience of hybrid technologyhas been positive and all our staff, from mechanics to drivers, are pleased tobe involved,”says Ian Tarran, engineering director at Arriva London.Transport for London, the body responsible for London’s transport system,has made the hybrid buses a key part of their strategy for public transportwith less environmental impact. To really put the <strong>Volvo</strong> Hybrid DoubleDecker to the test, bus route 141, was selected. <strong>The</strong> route starts at PalmersGreen and ends at London Bridge, with a total length of nine kilometers anda tour frequency of 6–12 minutes.“<strong>The</strong> field tests have shown that the fuel consumption of the <strong>Volvo</strong> HybridDouble Decker is within our goals. On route 141, the buses have the toughestcycle possible and still their fuel consumption has been reduced by over 30%compared to the regular diesel buses on route 141,” says Niklas Deras at<strong>Volvo</strong> Buses.21
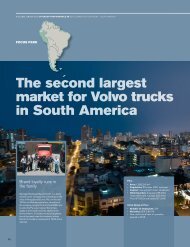
EN A global group koncern <strong>2010</strong> <strong>2010</strong>Market overviewLong-term increase in demand forthe <strong>Group</strong>’s products and servicesDuring 2009, the <strong>Group</strong>’s mature markets showed a sharp decline in demand and during <strong>2010</strong> agradual recovery from historically low levels. Demand in the <strong>Group</strong>’s growth markets were affectedto a much lesser extent by the financial crisis. After a brief downturn at the beginning of 2009,these markets returned to growth, and they showed a continued good growth in <strong>2010</strong>.Long-term growthIn the long-term, demand for freight capacity, andthus many of the <strong>Group</strong>’s products, is closelylinked to the GDP trend. <strong>The</strong> extent of investmentin infrastructure, which drives demand for buildingand construction equipment, is also, closelylinked to the GDP trend. In the short-term,demand is affected by a number of factors includingfuel prices, the implementation of new emissionregulations, interest rates, etc.From a historical perspective, despite therecovery in the truck and construction equipmentmarkets in <strong>2010</strong>, demand was below the longtermtrend in Europe, North America and Japan.<strong>The</strong> <strong>Volvo</strong> <strong>Group</strong> sees no development that wouldimply that the connection between GDP trendsand the sales of vehicles and machines wouldhave changed and, accordingly, the view is that intime, demand will recover and return to levels correspondingwith the long-term trend.North AmericaIn North America, sales of heavy-duty trucks rose 20%to 142,096 vehicles (117,983), primarily driven by risingdemand for trucks for long distance haulage andregional distribution. <strong>The</strong> market for construction trucksremained weak. <strong>The</strong> market for construction equipmentrose 20% after a three-year decline. However, the marketstill remained at a low level.Despite the uncertain macroeconomic trend, the needto replace old trucks and upgrade the truck fleets is substantial,which is expected to drive an improvement indemand. <strong>The</strong> total market for heavy-duty trucks in NorthAmerica is expected to amount to approximately220,000 trucks in 2011. <strong>The</strong> market for constructionequipment is expected to grow by 20–30% in 2011.Heavy-duty truck market, North AmericaVehicles, thousands40032024016080019901995 2000 2005 <strong>2010</strong>South AmericaIn South America, the key Brazilian marketremained strong, primarily due to a healthy economywith strong growth in GDP, but also due tosupport measures including advantageousfinancing. <strong>The</strong> Brazilian market for heavy-dutytrucks rose 64% to 109,760 vehicles (66,950). InSouth America as a whole, the market rose 61%to 138,763 heavy trucks (86,398). In Brazil, themarket for construction equipment rose 68%.<strong>The</strong> pace of growth in the South Americantruck market is expected to plane out during2011 after an extremely strong <strong>2010</strong>, but despitethis, demand is expected to remain at a healthylevel. <strong>The</strong> Brazilian market for construction equipmentis expected to grow by 5–15% in 2011.Heavy-duty truck market, BrazilVehicles, thousands120906030019901995 2000 2005 <strong>2010</strong>22
Economic growth in the U.S., EU and Brazil<strong>Annual</strong> GDP-growth, %Source: ConsensusEconomicsEconomic growth in Asia<strong>Annual</strong> GDP-growth, %Source: ConsensusEconomicsAccording to Consensus Economics, global GDP grewby 4.0% during <strong>2010</strong> compared with a decline of 1.8%in 2009. GDP in the EU grew by 1.8% (–4.1%), in theUS by 2.9% (–2.6%) and in Japan by 4.3% (–6.3%).Growth in countries such as Brazil, India and China wasvery strong. For 2011, global GDP is expected to growby 3.4% with continued high growth rates in, amongothers, Brazil, India and China.06 07 08 09 104.0 6.1 5.2 (0.6) 7.5 Brazil3.4 3.1 0.6 (4.1) 1.8 Europe2.7 1.9 0.0 (2.6) 2.9 USA0611.60713.0089.0099.11010.1 China9.7 9.0 6.7 7.4 8.7 India6.5 7.2 3.8 1.9 6.9 Asia/Pacific*2.0 2.3 (1.2) (6.3) 4.3 Japan* China, Hong Kong, South Korea, Taiwan, Indonesia,Malaysia, Singapore, Thailand, Phillippines, Vietnam,Australia, New Zealand, India, Japan, Sri LankaEuropeIn Europe 29, (the 27 EU member states and Norway andSwitzerland) registrations of heavy-duty trucks rose 8% to179,185 vehicles in <strong>2010</strong>, compared with 165,269 vehiclesin 2009, driven by a recovery in Central and NorthernEurope, while Southern Europe remained weak. <strong>The</strong> marketfor construction equipment rose by 15% in <strong>2010</strong>.It is difficult to gauge the effects European austeritypackages will have on the economy in 2011, but <strong>Volvo</strong> currentlyestimates the truck market will amount to approximately220,000 heavy-duty trucks. <strong>The</strong> market for constructionequipment is expected to grow by 5–15% in 2011.Heavy-duty truck market, EuropeVehicles, thousands40032024016080Asia<strong>The</strong> <strong>Group</strong>’s most substantial truck market in Asia is Japan,where demand weakened in the second half of the yearafter government scrapping premiums ceased and newtougher emission regulations were introduced. However, thetotal market amounted to 24,453 heavy-duty trucks, whichwas an increase of 29% compared with 18,889 trucks in2009. In other Asian markets, demand rose compared withthe preceding year. <strong>The</strong> Indian market for heavy-duty trucksrose by 69% to 211,543 vehicles (125,173). <strong>The</strong> market forconstruction equipment in Asia rose by a total of 60%, primarilydriven by continued strong growth in China and India.After a weak second half in <strong>2010</strong>, demand for heavydutytrucks is expected to recover gradually in Japan in2011. <strong>The</strong> Japanese market for heavy-duty trucks isexpected to grow by 10%. <strong>The</strong> market for constructionequipment in both China and India is expected to grow by5–15% in 2011.Construction equipment market, ChinaMachines, thousands400019901995 2000 2005 <strong>2010</strong>32024016080019901995 2000 2005 <strong>2010</strong>Other marketsFor trucks, Other markets comprises Africa andAustralia. <strong>The</strong> <strong>Volvo</strong> <strong>Group</strong>’s deliveries of trucksto Other markets rose 10% to 14,888 with apositive trend shown especially in North Africaand Australia. <strong>The</strong> market for constructionequipment grew by 42%.23
Board of directors’ report <strong>2010</strong>Significant e ventsRecovery, growth and productlaunches<strong>2010</strong> was characterized by a recovery in the <strong>Group</strong>’s mature markets anda continued strong development in most of the growth markets. <strong>The</strong> <strong>Volvo</strong><strong>Group</strong>’s intensive product renewal continued in all business areas.<strong>The</strong> first quarter<strong>Annual</strong> General Meeting<strong>The</strong> <strong>Annual</strong> General Meeting of AB <strong>Volvo</strong> held onApril 14, <strong>2010</strong> approved the proposal from theBoard of Directors and the President not to pay adividend to the shareholders and that all of thefunds at the disposal of the <strong>Annual</strong> GeneralMeeting would be carried forward to the followingyear.Peter Bijur, Jean-Baptiste Duzan, Leif Johansson,Anders Nyrén, Louis Schweitzer, RaviVenkatesan, Lars Westerberg and Ying Yeh werereelected as members of the Board of AB <strong>Volvo</strong>,and Hanne de Mora was newly elected. LouisSchweitzer was elected Chairman of the Board.Thierry Moulonguet, representing RenaultS.A.S., Carl-Olof By, representing AB Industrivärden,Håkan Sandberg, representing SvenskaHandelsbanken, SHB Pension Fund, SHBEmployee Fund, SHB Pensionskassa andOktogonen, Lars Förberg, representing VioletPartners LP and the Chairman of the Board, wereelected members of the Election Committee.<strong>The</strong> registered public accounting firm PricewaterhouseCoopersAB was elected as the company’sauditor for a period of four years.New trucks launchedOn April 20, <strong>2010</strong>, UD Trucks presented a newrange of Quon heavy-duty trucks. <strong>The</strong> latestQuon lineup has been developed to meet highlevels of demand for both fuel economy and drivingperformance. It features newly developedengines and automated manual transmissionsbased on <strong>Group</strong> architecture. UD Trucks has alsoadded a new model equipped with a new mediumdutyengine to its Condor truck lineup.On April 19, <strong>Volvo</strong> Trucks launched its new<strong>Volvo</strong> FMX construction truck at the Bauma internationalmachinery trade fair in Munich, Germany.With the new truck, <strong>Volvo</strong> Trucks aims to increaseits presence in the construction segment. Salesof the new <strong>Volvo</strong> FMX will begin in Europe inSeptember, <strong>2010</strong>.Detailed information about the events is availableat www.volvogroup.com<strong>The</strong> second quarterInvestment in Indian facility for productionof excavatorsAs part of <strong>Volvo</strong> Construction Equipment’s (<strong>Volvo</strong>CE) objective of supporting customers in thegrowing BRIC (Brazil, Russia, India and China)markets, <strong>Volvo</strong> CE has announced a strategicinvestment in its existing facility in Bangalore,India. <strong>The</strong> investment, which totals around SEK144 M, will allow <strong>Volvo</strong> CE to produce mediumsizedexcavators at the plant. <strong>The</strong>se machines willprimarily be models for use in the Indian market.Production of the first machines is expected tostart by the end of 2011.Production of new medium-duty enginein India<strong>The</strong> <strong>Volvo</strong> <strong>Group</strong>’s Indian joint venture company,VE Commercial Vehicles (VECV) is to invest atotal of SEK 480 M in the production of the<strong>Group</strong>’s new global medium-duty engine in India.<strong>The</strong> investment gives the <strong>Volvo</strong> <strong>Group</strong> a completefacility in India for machining and assembling thenew medium-duty engine, which will be introducedin the <strong>Group</strong>’s trucks and buses worldwidein the next few years. Through this investment, itwill be possible for the <strong>Volvo</strong> <strong>Group</strong> to locatemost of its production of medium-duty engines toVECV’s plant in Pithampur, India.Sale of <strong>Volvo</strong> Aero’s US service businessIn July it was announced that <strong>Volvo</strong> Aero hadsigned an agreement to sell its US subsidiary<strong>Volvo</strong> Aero Services. <strong>The</strong> sale had a negative24
impact of SEK 538 M on <strong>Volvo</strong> Aero’s operatingincome in <strong>2010</strong>. <strong>The</strong> sale of <strong>Volvo</strong> Aero Servicesis due to <strong>Volvo</strong> Aero’s strategy of focusing on itscore operations of developing and manufacturingcomponents for aircraft engines, combined withthe goal of reducing the company’s tied-up capital.<strong>The</strong> third quarterUD Trucks and Nissan Motor end collaborationon contract manufacturing of light-dutytrucks<strong>The</strong> collaboration between <strong>Volvo</strong> <strong>Group</strong>’s Japanesesubsidiary UD Trucks and Nissan Motor onthe contract manufacturing of light-duty truckswill expire and the production will end in January2011. <strong>The</strong> decision enables UD Trucks to focusmore on medium and heavy-duty trucks. UDTrucks will continue to have its own manufacturingoperation for light-duty trucks for the exportmarket. During 2009, UD Trucks produced 6,150light-duty trucks within the collaboration frameworkand up to August <strong>2010</strong>, 4,800 vehicles hadbeen produced and sold to Nissan Motor. <strong>The</strong>end of contract manufacturing for Nissan Motorwill not result in any restructuring costs or haveany significant impact on the <strong>Volvo</strong> <strong>Group</strong>’s earningsor financial position.<strong>The</strong> fourth quarter<strong>Volvo</strong> <strong>Group</strong> President and CEO LeifJohansson to resign in the summer of 2011After almost 14 years as President and CEO of<strong>Volvo</strong>, Leif Johansson in December informed theBoard of AB <strong>Volvo</strong> of his intention to resign inconjunction with his 60th birthday in the summerof 2011. At the same time Leif Johansson willalso leave the Board of AB <strong>Volvo</strong>.<strong>The</strong> <strong>Volvo</strong> <strong>Group</strong> enters partnership withWWF to reduce CO 2-emissions<strong>The</strong> <strong>Volvo</strong> <strong>Group</strong> will be the world’s first vehiclemanufacturer to join the World Wide Fund forNature’s (WWF) Climate Savers Program. As aWWF partner, the <strong>Volvo</strong> <strong>Group</strong>’s truck companiesundertake to reduce the CO 2-emissions fromvehicles manufactured between 2009 and 2014by 13 million tons. Independent technical expertswill oversee the results.Events after balance-sheet date<strong>Volvo</strong> part of investigation by EuropeanCommissionIn January 2011, <strong>Volvo</strong> <strong>Group</strong> and a number ofother companies in the truck industry havebecome part of an investigation by the EuropeanCommission regarding a possible violation of EUantitrust rules.Proposal for voluntary conversion ofseries A sharesIn a letter to AB <strong>Volvo</strong>’s Board of Directors aheadof the <strong>Annual</strong> General Meeting (AGM) on April 6this year, AB <strong>Volvo</strong>’s two largest shareholders –Renault S.A. and Industrivärden – have proposedan addendum to AB <strong>Volvo</strong>’s articles of associationthat would permit voluntary conversion ofseries A to series B shares.Corporate Governance <strong>Report</strong> <strong>Volvo</strong> has issueda corporate governance report which is separatefrom the annual report. <strong>The</strong> corporate governancereport is included in this document, after theannual report as such, on the pages 138–147.25
Board of directors’ report <strong>2010</strong>Organiz ationOrganized to be close tocustomers and drive economiesof scale<strong>The</strong> <strong>Volvo</strong> <strong>Group</strong>’s product-related companies in the different segments work closelytogether with customers while <strong>Group</strong>-wide resources in the business units work to createeconomies of scale. Approximately 70% of the <strong>Group</strong>’s 90,000 employees work in theproduct-related companies and 30% work in the business units.Net sales asBusiness units PERCENTAGE of<strong>Volvo</strong> <strong>Group</strong>’ssegmentsalesTrucks<strong>The</strong> truck operations product portfolio is sold and marketed under five different brands:<strong>Volvo</strong>, Renault, UD and Mack and also Eicher from VE Commercial Vehicles (50% ownership)in India. <strong>The</strong> product offer stretches from heavy-duty trucks for long-haulage andconstruction work to light-duty trucks for distribution.Number of employees: 38,533 (37,575).Number of delivered trucks: 179,989 (127,681).63% (63)<strong>Volvo</strong> 3P<strong>Volvo</strong> 3P is responsible for product planning, product development and purchasing for the <strong>Group</strong>’s truck companies. Product planninginvolves having the right products over the longer term. Product development focuses on chassis, cabins and electrical systems. Inpurchasing, <strong>Volvo</strong> 3P offers significant size and negotiating strength. Number of employees: 3,748 (4,022).<strong>Volvo</strong> Powertrain<strong>Volvo</strong> Powertrain coordinates the <strong>Volvo</strong> <strong>Group</strong>’s driveline operations and is responsible for the development and manufacturing of medium-duty and heavydutydiesel engines, gearbox and driveshafts. <strong>Volvo</strong> Powertrain also manufactures light-duty engines for external customers and is responsible for ensuringthat the <strong>Volvo</strong> <strong>Group</strong> is supplied with drivelines for medium-duty applications from external manufacturers. Number of employees: 8,305 (8,143).<strong>Volvo</strong> Parts<strong>Volvo</strong> Parts provides services and tools for the aftermarket. <strong>The</strong> services start with the suppliers and proceed via the dealers all the way tothe end-customers. This entails planning, purchasing, shipping and storing parts, as well as inventory management, order management, andtools for workshop maintenance and other services for the aftermarket. Number of employees: 4,063 (4,133).<strong>Volvo</strong> Logistics<strong>Volvo</strong> Logistics develops and provides transport and logistics solutions to the automotive and aerospace industries worldwide. Its customers come partly fromoutside the <strong>Volvo</strong> <strong>Group</strong>. <strong>Volvo</strong> Logistics provides customeradapted services throughout the logistics chain – everything from the design of complex logisticssystems to packaging, insurance and distribution solutions for finished products. Number of employees: 1,194 (1,157).<strong>Volvo</strong> Business Services<strong>Volvo</strong> Business Services provides administrative services to <strong>Volvo</strong> <strong>Group</strong> companies. Its operations include accounts payable, accountsreceivable, accounting and human resources administration. Number of employees: 902 (910).<strong>Volvo</strong> Information Technology<strong>Volvo</strong> IT’s business concept is to manage complex IT systems. <strong>Volvo</strong> IT delivers solutions for all segments of the industrial processand provides unique expertise in product lifecycle management, SAP solutions and IT operation. Its customers include, forexample, the <strong>Volvo</strong> <strong>Group</strong>, <strong>Volvo</strong> Cars and other large industrial companies. Number of employees: 4,952 (4,984).<strong>Volvo</strong> <strong>Group</strong> Real Estate, <strong>Volvo</strong> Technology, <strong>Volvo</strong> Technology Transfer, <strong>Volvo</strong> <strong>Group</strong> NAP26
Business Units<strong>The</strong> business units are organized globally andcombine expertise in key areas. <strong>The</strong>y have theoverall responsibility for product planning andpurchasing and for developing and deliveringcomponents, subsystems, services, and serviceand support to the <strong>Group</strong>’s business areas. <strong>The</strong>structure creates economies of scale in productdevelopment, production, parts supply, logistics,administration and support functions.In addition to the business units in the overviewbelow, there is <strong>Volvo</strong> Technology thatde velops new technology and new concepts forproducts and services in the transportation andautomotive industries. <strong>Volvo</strong> <strong>Group</strong> Real Estateconducts property management and development.<strong>Volvo</strong> Technology Transfer invests in companieswith projects of technical and commercialinterest. <strong>Volvo</strong> <strong>Group</strong> NAP (Non-Automotive Purchasing)is a global procurement organizationsourcing the goods and services that arenot used in the manufacturing of the <strong>Group</strong>’sproducts.Buseshas a product range comprisingcity and intercity buses, coachesand chassis.Number of employees: 7,665(8,095).Number of deliveredbuses: 10,229 (9,857).Construction Equipmentmanufactures equipment forconstruction applications andrelated industries.Number of employees: 13,599(13,456).Number of machines sold:66,000 (38,800).<strong>Volvo</strong> Pentaoffers engines and drive systemsfor leisure and commercial boatsand for industrial applications suchas gensets and materials handling.Number of employees: 1,211(1,358).Delivered marine and industrialengines: 51,588 (44,983).<strong>Volvo</strong> Aerooffers advanced components foraircraft engines and space applicationswith a focus on lightweighttechnology for reducedfuel consumption.Number of employees: 2,863(2,991).<strong>Volvo</strong> Financial ServicesConducts operations in customerand dealer financing.Number of employees: 1,235(1,234).Total assets: SEK 89 billion (99).8% (8) 20% (16)3% (4) 3% (4)3% (5)27
Board of directors’ report <strong>2010</strong>TrucksStrong earnings improvement<strong>2010</strong> was characterized by a recovery in demand in the <strong>Group</strong>’s mature marketsand continued strong growth in the emerging markets.During the year, order intake in Europe and NorthAmerica increased successively from low initiallevels. <strong>The</strong> Japanese market grew during the firsthalf of the year and then stumbled after the governmentincentive program for investments innew trucks ceased. Throughout the year, demandremained strong in many emerging markets,including Brazil and India.Total market<strong>The</strong> total market for heavy-duty trucks in <strong>2010</strong> inthe 27 EU countries, plus Norway and Switzerland,amounted to 179,185 vehicles, an increase of 8%compared with 165,269 vehicles in the precedingyear. <strong>The</strong> recovery of the European truck marketwas divided between North and South andbetween fleets and smaller customers, with theformer categories recording stronger growth. In2011, the European market is estimated to amountto approximately 220,000 heavy-duty trucks.In North America, the total market for heavydutytrucks (Class 8) increased 20% to 142,096vehicles, compared with 117,983 in the precedingyear. Viewed as a whole, higher levels of activityamong customers in the long-haulage industryoffset a continued weak market for trucks in thebuilding and construction industry. In 2011, thetotal market in North America is estimated toamount to approximately 220,000 heavy-dutytrucks.<strong>The</strong> total market for heavy-duty trucks inJapan rose 29% to 24,453 vehicles (18,889).<strong>The</strong> Japanese market is expected to grow 10% in2011. <strong>The</strong> market for heavy-duty trucks in Indiaamounted to 211,543 vehicles (125,173), in <strong>2010</strong>.In Brazil, the total market rose 64% to 109,760heavy-duty trucks (66,950), primarily driven bythe country’s strong economy, but also by advantageousloan terms for investments in new trucks.EarningsIn <strong>2010</strong>, net sales in the truck operationsincreased by 20% to SEK 167,305 M (138,940).<strong>The</strong> operating income improved to SEK 10,112 M(loss: 10,805), while the operating margin was6.0% (neg: 7.8).<strong>The</strong> improvement in operating income is principallydue to improved sales and the considerablecost savings implemented in 2009. Highercapacity utilization as a side effect of increasedproduction levels in most plants contributed toimproved operating income.<strong>Volvo</strong> Trucks<strong>Volvo</strong> Trucks can look back ona successful <strong>2010</strong> despitedifficult market conditions.Following the financial crisisin 2009, the employees’ fullcommitment assisted in the rapid adaptation tosubstantially lower demand in parallel with thecompletion of long-term investments in thefuture. As a result, <strong>Volvo</strong> Trucks has exited thecrisis a much stronger company.Consistent implementationCost savings and measures to improve cash flowwere implemented consistently. Breakeven levelswere reduced considerably and maintained at thenew levels through consistent cost discipline.Non-European markets recovered strongly led bySouth America, where Brazil proved extremelysuccessful and profitable due to the company’sstrong position and presence. Combined withimproved demand in parts of Europe, this resultedin the company being able to rehire personnel. InNorth America, demand for trucks for long-haulagetransports increased successively throughoutthe year.In <strong>2010</strong>, the challenge comprised respondingand adapting delivery capacity to rapidly risingdemand. This was achieved through beneficialcollaboration between employees and suppliers,which resulted in significantly increased deliveriesand growing market shares. Also, deliverytimes were kept relatively short.<strong>The</strong> truck operations consistof <strong>Volvo</strong> Trucks, RenaultTrucks, UD Trucks, MackTrucks and VECV in India(50% direct and indirectownership). <strong>The</strong> productoffer stretches from heavydutytrucks for long-haulageand construction work tolight-duty trucks for distribution.Number of employees38,533Position on world marketIn total, the <strong>Volvo</strong> <strong>Group</strong> is Europe’slargest and the world’s second largestWestern manufacturer of heavytrucks.Brands<strong>Volvo</strong>, Renault, UD, Mack and Eicher.Staffan JuforsPresident of <strong>Volvo</strong>Trucks.Dennis SlaglePresident and CEO ofNorth American Trucks.Stefano ChmielewskiPresident of Renault Trucks.Pär ÖstbergPresident of Trucks Asia.Ambitions <strong>2010</strong>• Capture growth in emerging markets.• Increase industrial productivity in up-turn.• Control costs.• Successful introduction of new engine generationsin the US and Japan.28
Net sales as percentageof <strong>Volvo</strong><strong>Group</strong>’s sales63% (63)Net salesSEK bn06 07 08 09 10171.3 187.9 203.6 138.9 167.3Operating income (loss)and operating margin167.3 10,1120613,1167.707 08 09 1015,193 12,167 (10,805) 10,1128.1 6.0 (7.8) 6.6SEK M%Deliveries by marketTrucks 2009 <strong>2010</strong>Europe 49,145 65,503North America 17,574 24,282South America 12,587 21,483Asia 34,800 53,833Other markets 13,575 14,888Total 127,681 179,989Net sales by marketTrucks, SEK M 2009 <strong>2010</strong>Europe 65,874 69,606North America 21,563 26,901South America 12,490 21,680Asia 26,943 35,231Other markets 12,069 13,888Total 138,940 167,305Consistent product developmentThroughout the crisis, <strong>Volvo</strong> Trucks maintained itsinvestments in the dealer network, productionsystem and product development. Two newtrucks were launched in <strong>2010</strong> in line with longtermplans. <strong>The</strong> company consolidated its positionin the building and construction segmentthrough the launch of a new truck specialized forthe segment, the <strong>Volvo</strong> FMX. Additionally, a newversion of the <strong>Volvo</strong> FM distribution truck waslaunched. Both trucks were well-received by customersthroughout the world.In North America, customers responded verypositively to <strong>Volvo</strong>’s new trucks equipped withengines that meet the EPA <strong>2010</strong> emission requirement,which entered force on January 1, <strong>2010</strong>,thus strengthening the market position.<strong>The</strong> year has seen the company make significantprogress in the environmental area throughpresentation of new solutions and field testingwith key customers of alternative fuels, includingbio-DME, methane-diesel and hybrid technology.Market shares in Europe,heavy-duty trucksMarket shares in Europe,medium-duty trucksMarket shares in North America,heavy-duty trucksMarket shares in Japan,heavy-duty trucks09 1013.2% 14.2%<strong>Volvo</strong>09 1010.6% 10.2%Renault09 105.4% 5.2%<strong>Volvo</strong>09 1011.6% 10.9%Renault09 107.4% 8.8%<strong>Volvo</strong>09 107.4% 7.4%Mack09 1023.3% 22.2%UDOutcome <strong>2010</strong>• Strong increase in deliveries in Asia (+55%) and South America (+71%).• Turned loss into profit of SEK 10 billion.• <strong>The</strong> trucks with new engines captured market shares in the U.S.• <strong>The</strong> new Quon truck with <strong>Group</strong> engine well-received by customers in Japan.Ambitions 2011• Manage to ramp up production in line with demand.• Increase productivity in all parts of the business.• Continued cost control.• Secure delivery of product development projects according to plan.29
Board of directors’ report <strong>2010</strong>Renault TrucksFor Renault Trucks, <strong>2010</strong> wasa year in which the companyproved its ability to make acomeback. After an extremelytrying 2009, with many challenges,<strong>2010</strong> was about initiating the recovery,aided by the strong commitment of all employees.Deliveries by market<strong>Volvo</strong> Trucks 2009 <strong>2010</strong>Europe 19,749 29,635North America 8,028 12,749South America 10,349 18,639Asia 5,573 10,071Other markets 3,712 4,135Total 47,411 75,229Renault Trucks 2009 <strong>2010</strong>Europe 29,396 35,867North America 458 54South America 574 656Asia 1,794 3,448Other markets 5,263 5,563Total 37,485 45,588UD Trucks 2009 <strong>2010</strong>Europe – –North America 853 1,010South America 445 300Asia 16,753 23,908Other markets 3,458 4,130Total 21,509 29,348Mack Trucks 2009 <strong>2010</strong>Europe 0 1North America 8,235 10,469South America 1,219 1,888Asia 505 47Other markets 1,142 1,060Total 11,101 13,465Eicher 1 2009 <strong>2010</strong>Europe – –North America – –South America – –Asia 10,175 16,359Other markets – –Total 10,175 16,3591 <strong>The</strong> joint venture together with Eicher Motor Limited is to50% consolidated into the <strong>Volvo</strong> <strong>Group</strong>. <strong>The</strong> deliveries in thetable pertain to the <strong>Volvo</strong> <strong>Group</strong>’s share of Eicher’s deliveries.RecoveryAfter the first half of <strong>2010</strong> with a reduced workingweek for blue and white collar workers, thesecond half of the year brought a dramaticchange. A gradual, steady increase in the orderintake meant that by the summer, Renault Truckswas back in full production; however, the recoverywas modest, slow and fragile. In view of the weakdemand, focus was placed on the continuedreduction of costs.Renault Trucks retained its permanent employeeswith the assistance of government measuresthat permitted a reduced working week with layoffpay. <strong>The</strong>se measures enabled the company toretain its workforce pending the expected upturn,and were ended during the summer of <strong>2010</strong>.PresenceRenault Trucks maintained its presence at theforefront of key social issues, including the reductionin carbon emissions through the use of thehybrid and electric trucks delivered to customers.<strong>The</strong> Renault Premium long-haulage truckproved best in respect of fuel consumption andoperating costs in an independent test of apan-European truck fleet at a German freightcompany.Renault Trucks continues to invest in productdevelopment to be able to launch new, competitivetrucks in the next few years.During the year, production of trucks started atthe plant in Kaluga, Russia.UD Trucks<strong>2010</strong> was a significant yearfor Nissan Diesel. On February1, Nissan Diesel changedits name to UD Trucks withthe aim of building UD into aglobal truck brand. UD Trucks has a wide range oflight, medium-duty and heavy-duty trucks, as wellas buses and bus chassis.Market sharesIn the first half of <strong>2010</strong>, the Japanese market waspositively affected by the scrapping premiums forold trucks if owners concurrently invested in new,greener products. Since UD Trucks had a substantialpercentage of trucks that met the newenvironmental requirements, the company capturedmarket shares. When the scrapping premiumsceased in August, demand weakened. <strong>The</strong>total market for heavy-duty trucks rose 29% to24,453 vehicles (18,889). During the year, UDTrucks had 22.2% of the Japanese market forheavy-duty trucks compared with 23.3% in 2009.UD – Ultimate DependabilityUD, which stands for Ultimate Dependability,became the new brand since the abbreviationwas already recognized by customers, who callthe vehicles UD products. <strong>The</strong> UD name is widelyknown since the letters are engraved in theemblem, which since the 1950s, has beenlocated on both sides of the vehicles. In conjunctionwith this change, the name of the companywas changed from Nissan Diesel Motor Co. Ltd toUD Trucks Corporation.New trucks launched<strong>The</strong> new generation of heavy-duty trucks in theQuon range was launched in the Japanese marketin April and the first version of the new Condorrange in August. Sales of the new Condortruck have also started in the US. <strong>The</strong>se newtruck models are equipped with SCR enginesbased on the <strong>Group</strong>’s joint engine platforms. <strong>The</strong>ymeet with the latest emission legislation in Japanand the USA and have improved fuel efficiency.Additionally, UD Trucks launched the UD GenuineAfter Market program to provide customers withaccess to original service and original spares,which will help customers reduce their operatingexpenses.30
Mack TrucksIn North America, the overalleconomic environment, alongwith demand for heavy-dutyhighway trucks, gradually improvedmoving through the year.As large competitor inventories of pre-EPA<strong>2010</strong> engines were finally drawn down and amore level playing field was established, bothMack and <strong>Volvo</strong> capitalized on their more extensivelytested, highly fuel efficient, fully certifiedEPA<strong>2010</strong> products that comply with the newemission standards introduced in North Americain January <strong>2010</strong>.Positive response from customersFeedback regarding both Mack and <strong>Volvo</strong>EPA<strong>2010</strong> trucks, particularly on fuel economyand engine performance, grew ever more positivethroughout the year, as more and more customersgained experience with the products. To meetincreasing demand, production was graduallyramped up in all manufacturing facilities duringthe second half of the year.Many new products launchedFor Mack, the ongoing weakness in the constructionsegment remained a significant challenge.Despite essentially no market for the dump andmixer trucks that are core to its business, thebrand finished the year with a U.S. retail shareequal to 2009, reflecting a determined effort toincrease volumes in other segments.Mack maintained its longtime leadership positionin low cabover straight trucks used primarilyin refuse applications. <strong>The</strong> brand also moved fromthe number four to the number two position in theday cab and small sleeper segment of the highwaymarket. Both Chrysler <strong>Group</strong> Transport andglobal logistics leader UPS placed significantorders for Mack EPA<strong>2010</strong>-certified Pinnacle daycabs (325 and 475 respectively).In line with the <strong>Group</strong>’s commitment to ongoinginvestment despite difficult market conditions,Mack introduced the mDRIVE automated manualtransmission based on highly regarded <strong>Group</strong>architecture. <strong>The</strong> mDRIVE is developed to workwith Mack’s MP engines to deliver better fueleconomy, driveability and safety. Mack alsoexpanded its line-up of natural gas (NG) trucks,introducing an NG-powered version of its Terra-Pro cabover model for refuse and constructioncustomers.EicherVE Commercial Vehicles(VECV), which is a joint-venturecompany opened by the<strong>Volvo</strong> <strong>Group</strong> and EicherMotors, designs, develops, manufactures andmarkets trucks and buses under the Eicherbrand. 50% of VECV is consolidated in the <strong>Volvo</strong><strong>Group</strong>.Eicher’s product range comprises light,medium-heavy and heavy-duty trucks and busesin the weight classes 5–40 tons and completebus chassis in the 5–15 ton range. <strong>The</strong> companyhas an extensive dealer and service network principallylocated in India.Eicher’s industrial operations comprise themanufacture of cabs, axles, gearboxes andengines as well as assembly of trucks and buses.Key investments are currently being made in painting,expansion of capacity, a new engine plant, inthe wholly-owned distribution network and in aproduct development center for developing thenext generation of trucks and buses.Increased market sharesIn <strong>2010</strong>, the total market for medium-duty trucks(7–16 tons) rose by 50% in India while deliveriesof Eicher trucks in the medium-duty segmentincreased by 51%.In India, demand for heavy-duty trucks over 16tons showed solid growth of 69% in <strong>2010</strong>. Deliveriesof Eicher trucks in the heavy-duty segmentrose by 105%, significantly outperforming themarket and leading to increased market shares.Deliveries by segment<strong>Volvo</strong> Trucks 2009 <strong>2010</strong>Light trucks (under 7 tons) – –Medium trucks (7–16 tons) 1,556 1,758Heavy trucks (over 16 tons) 45,855 73,471Total 47,411 75,229Renault Trucks 2009 <strong>2010</strong>Light trucks (under 7 tons) 13,993 14,140Medium trucks (7–16 tons) 5,556 7,385Heavy trucks (over 16 tons) 17,936 24,063Total 37,485 45,588UD Trucks 2009 <strong>2010</strong>Light trucks (under 7 tons) 8,248 9,657Medium trucks (7–16 tons) 6,651 9,572Heavy trucks (over 16 tons) 6,610 10,119Total 21,509 29,348Mack Trucks 2009 <strong>2010</strong>Light trucks (under 7 tons) – –Medium trucks (7–16 tons) 1 2Heavy trucks (over 16 tons) 11,100 13,463Total 11,101 13,465Eicher 1 2009 <strong>2010</strong>Light trucks (under 7 tons) 1,113 2,014Medium trucks (7–16 tons) 7,889 11,940Heavy trucks (over 16 tons) 1,174 2,406Total 10,175 16,3591 <strong>The</strong> joint venture together with Eicher Motor Limited is to50% consolidated into the <strong>Volvo</strong> <strong>Group</strong>. <strong>The</strong> deliveries in thetable pertain to the <strong>Volvo</strong> <strong>Group</strong>’s share of Eicher’s deliveries.31
Board of directors’ report <strong>2010</strong>BusesIncreased sales and improvedprofitabilityDuring<strong>2010</strong>, <strong>Volvo</strong> Buses strongly improved its income due to acustomized product range, higher sales and a strong focus on costreductions.<strong>Volvo</strong> Buses is one of the world’s largest manufacturersof heavy buses. <strong>The</strong> range comprisescomplete buses, chassis, transport solutions,telematic systems, financial solutions, as well asservice and maintenance contracts. <strong>The</strong> companyoffers global products adapted to local conditions,with manufacturing in Europe, Asia, NorthAmerica, South America and Africa.<strong>Volvo</strong> Buses has sales in about 85 countriesand one of the bus industry’s strongest servicenetworks, with more than 1,500 retailers andservice workshops globally.Focus on cost-efficient solutionsIn the bus industry, focus remains on developingcost-efficient transport solutions and reducingenergy consumption and the impact on the environment.It is about lower fuel consumption, alternativefuels and alternative energy sources.During the year, <strong>Volvo</strong> Buses began deliveringbuses that comply with the tough Euro V emissionrequirements in Europe and EPA<strong>2010</strong> inNorth America, including buses with the new13-liter engine. <strong>The</strong> response from customershas been very positive, both in terms of improvedperformance and reduced fuel consumption.Serial production of hybrid busesDuring the year, the company also took an importantstep toward significantly reducing energyconsumption in terms of city buses. In May, serialproduction commenced on the <strong>Volvo</strong> 7700 Hybridbuses and <strong>Volvo</strong> B5L Hybrid double-deckerbuses. By recycling the brake energy, the buseswill be able to operate partly on electricity, whichwill contribute to a reduction in fuel consumptionof up to 35% and, accordingly emissions of thegreenhouse gas, carbon dioxide. <strong>Volvo</strong>’s hybridbuses currently operate in several cities aroundEurope. Interest is high worldwide and during theyear, the hybrid buses were test-driven in Brazil,Colombia and Mexico.Developing aftermarketHowever, high-quality buses are not sufficient.Customers need a strong support in the aftermarket.This applies to telematics, which assistscustomers in controlling traffic, conducting follow-upsof fuel consumption, for example, and inplanning service. <strong>Volvo</strong> Buses’ telematic system,ITS4mobility, is one of the world’s best and a thirdstep, Vehicle Management, was introduced duringthe year. This means that customers are ableto remotely read all signals from the buses’ controlsystem and thus plan future service measures,resulting in reduced costs.Increased deliveriesDespite the weak trend reported during the yearfor the total market for <strong>Volvo</strong> Buses’ key marketsin Europe and the coach market in North America,<strong>Volvo</strong> succeeded in increasing deliveriescompared with 2009. During the year, 10,229buses and bus chassis (9,857) were delivered.Sales increased in several locations in Asia, forexample, in India and Australia, as well as inSouth America and in the Nordic region. Duringthe year, <strong>Volvo</strong> Buses was able to strengthen itsmarket shares in several markets.Increased sales and improved profitsNet sales rose in <strong>2010</strong> to SEK 20,516 M (18.465).Operating income rose from a negative SEK 350Buses has a product rangecomprising city and intercitybuses, coaches and chassis.Number of employees7,665Position on world market<strong>The</strong> business area is one of theworld’s largest producers of buses.Brands<strong>Volvo</strong>, Prevost, Nova, Sunwin andSilver.Håkan KarlssonPresident of <strong>Volvo</strong>Buses.Ambitions <strong>2010</strong>• Profitable growth in all regions.• Continued focus on cost-cutting and lower inventory levels.• Increased sales of services and aftermarket products.• Secure successful introductions of Euro V, EPA <strong>2010</strong> and hybrids.32
Net sales as percentageof <strong>Volvo</strong><strong>Group</strong> sales8% (8)Net salesSEK bnOperating income (loss) andoperating margin20.5 780Deliveries by marketBuses 2009 <strong>2010</strong>Europe 3,164 2,395North America 1,539 2,092South America 690 1,174Asia 3,839 3,477Other markets 625 1,091Total 9,857 10,229Net sales by marketBuses, SEK M 2009 <strong>2010</strong>Europe 7,707 6,242North America 5,673 7,200South America 1,235 1,737Asia 2,749 3,299Other markets 1,101 2,038Total 18,465 20,51606 07 08 09 10 06 07 08 09 1017.3 16.6 17.3 18.5 20.5 745 231 (76) (350) 780 SEK M4.3 1.4 (0.4) (1.9) 3.8 %M to a positive SEK 780 and the operating marginwas 3.8% (neg: 1.9). An important explanationfor the strong income improvement is highersales. Another explanation is the effort from thecompany to reduce costs and streamline theproduct offering and production.New bus generates rational productionDuring the year, <strong>Volvo</strong> Buses launched a newintercity bus in Europe, the <strong>Volvo</strong> 8900. It islighter and more fuel-efficient and will replacetwo similar bus models. <strong>The</strong> new bus is built ina module system and can be manufactured in<strong>Volvo</strong>’s plants in Sweden and Poland. This willgenerate a more rational and flexible production.Outcome <strong>2010</strong>• Increased sales in all regions and the company reported positive results.• Costs decreased and inventories levels were lower.• Higher sales and income in the aftermarket operations.• <strong>The</strong> new products were introduced and were received very well by customers.Ambitions 2011• Profitable growth in all regions.• Increased aftermarket operations.• Increased utilization of global production presence.• Focus on cost and capital efficiency.33
Board of directors’ report <strong>2010</strong>Construction EquipmentGood growth in salesand profit<strong>Volvo</strong> CE is one of the world’s leading manufacturers of articulatedhaulers and one of the leading manufacturers of wheel loaders, excavators,road construction equipment and compact machines.<strong>Volvo</strong> CE’s products, spare parts and services areavailable in more than 125 countries. <strong>The</strong> productsare mainly used in such segments as generalconstruction, road construction and maintenance,as well as in the refuse, mining andforestry industries.RecoveryMeasured in units sold, the total world market forheavy, compact and road machinery equipmentincreased by 44%, compared to 2009. During<strong>2010</strong>, the European markets rose 15%, whileNorth America rose 20%. Both Asia and Othermarkets rose 60%. <strong>The</strong> strong growth in theBRIC countries, Brazil, Russia, India and China,propelled development to a large extent.Increase in delivery and salesDuring <strong>2010</strong>, <strong>Volvo</strong> CE sold 66,000 machines,compared with 38,800 machines in 2009. Netsales amounted to SEK 53,810 M, an increase of51%, compared with SEK 35,658 M in 2009.Operating profit totaled SEK 6,180 M (loss:4,005). <strong>The</strong> operating margin improved significantlyand amounted to 11.5%, compared with anegative 11.2% in 2009. <strong>The</strong> improved operatingprofit was attributable to increased sales, internalcost-reduction measures, improved cost coveragein the production system and higher productivity.Secure development in the BRIC countriesDuring the year, several initiatives were implementedto support development in the BRICcountries (Brazil, Russia, India and China).Investments to expand excavator manufacturingwere made in India and decided upon in Brazil.<strong>The</strong> investments include assembly and manufactureof components for the models in thedomestic markets. In China, excavator capacitywas also increased by a decision to commencemanufacturing four new models of the SDLGexcavators.In March, a decision was made to build a newtechnology center in Jinan, China. <strong>The</strong> technologycenter will focus on the development of productsand components for equipment for the BRICcountries and includes the <strong>Volvo</strong> and Lingongbrands.Presence in the Russian market was strengthenedfurther by an agreement with Ferronordic,which is planning to expand its distribution networkwith more affiliates to increase sales andservice.Joint product planAs the Chinese economy is growing, so is demandfor excavators. Supported by <strong>Volvo</strong> CE, Lingonghas now launched its own excavators. <strong>The</strong>co operation between <strong>Volvo</strong> and Lingong has alsobeen strengthened by a joint product plan.Key aftermarketService and aftermarket products play a key rolefor <strong>Volvo</strong> CE as a supplier of turnkey solutions.Service and aftermarket products accounted for23% of the total earnings in <strong>2010</strong>. For instance,the sale of attachments increased from SEK540 M to SEK 1,270 M.Increased usage of telematicsThrough continuous equipment monitoring, <strong>Volvo</strong>CE’s telematic system, CareTrack, is able to facilitateadditional productivity and accessibility. Byusing GPS or satellite technology, informationabout the machines may be forwarded to anypossible location. Through error reports andwarnings, the system offers diagnostic assistance,which, in turn, facilitates identifying andrepairing problems more rapidly. During <strong>2010</strong>, adecision was made that all newly produced largemachines (wheel loaders in excess of 10 tons,haulers and excavators in excess of 12 tons, aswell as graders) will include a three-year Care-Track service agreement as a standard feature.Focus on efficiency in productionand developmentTo additionally streamline the industrial system,three North American plants were reduced to one.<strong>The</strong> plants in Asheville and Goderich were closedand production relocated to the plant in Shippens-Construction Equipmentmanufactures equipment forconstruction applicationsand related industries.34Number of employees13,599Position on world market<strong>Volvo</strong> CE is the world’s largest manufacturerof articulated haulers andone of the world’s largest manufacturersof wheel loaders, excavators,road development machines andcompact construction equipment.Brands<strong>Volvo</strong> and SDLG (Lingong).Olof PerssonPresident of <strong>Volvo</strong>Construction Equipment.Ambitions <strong>2010</strong>• Secure market penetration and product adaptation in BRIC countries.• Integrate Lingong with a joint business plan for a broader offer inemerging markets.• Prioritize hard and soft products for new markets and customersegments.• Increase the use of telematics in products.• Optimize the industrial footprint to become more efficient in productionand development.
Net sales as percentageof <strong>Volvo</strong><strong>Group</strong> sales20% (16)Net salesSEK bn0642.10753.60856.30935.71053.8Operating income (loss) andoperating margin53.8 6,180064,0729.7074,2187.9081,8083.209(4,005)(11.2)106,18011.5SEK M%Net sales by marketConstruction Equipment, SEK M 2009 <strong>2010</strong>Europe 12,987 16,138North America 5,475 6,267South America 2,578 4,130Asia 12,957 24,352Other markets 1,661 2,923Total 35,658 53,810burg. USD 30 M was invested to expand the plantto improve production flow and increase capacity.At the same time, the plant meets all requirementsto be classified as a sustainable facility in accordancewith the U.S. Green Building Council.Product launches<strong>Volvo</strong> CE is moving ahead with its plans to deliverturnkey solutions adapted for various customergroups. At the same time, the investment in softproducts continues and <strong>Volvo</strong> CE will continue tolaunch new value-adding products and servicesfor customers.Product launches in <strong>2010</strong> include compactexcavators EC15, EC17, EC21 and EC23, as wellas compact wheel loaders L20F and L25F. Inaddition to these, large wheel loaders L150, 180and L220 also included OptiShift as a standardfeature.An additional key event in <strong>2010</strong> was that <strong>Volvo</strong>CE was awarded the Tier 4i certificate from theU.S. Environmental Protection Agency, EPA,which certifies low emissions from heavy equipmentequipped with the D11, D13 and D16engines. This occurred after a similar certificatewas received from the EU earlier in the year certifyingthat the engines complied with requirementsin Europe’s Stage IIIB legislation.Outcome <strong>2010</strong>• Expansion of excavator production in India and Brazil. Decision to establish a technology centerin China.• Increased cooperation and synergies between <strong>Volvo</strong> and Lingong, with, among others, a jointproduct plan.• Equipment and service optimized for prioritized markets.• Telematic system, CareTrack, introduced as standard in all major machines.• Production in North America consolidated from three plants to one.Ambitions 2011• Further strengthen the position in the BRIC countries.• Continue to reduce the break-even level by cost reductions– material, as well as variable and fixed costs.• Successful launch of Tier4i and Stage IIIB engines in North Americaand Europe.• Continued development and launch of new products and services.35
Board of directors’ report <strong>2010</strong>volvo pentaImproved profitability despiteweak leisure boat market<strong>Volvo</strong> Penta conducts its operations in two overall business segments: Marine and Industrial. For a broader general public,<strong>Volvo</strong> Penta is mostly known for its marine engines and world-leading innovations, such as the Aquamatic drive and thecounter-rotating propellers, Duoprop. Boat owners worldwide associate <strong>Volvo</strong> Penta’s products with fuel-efficiency, environmentalconsideration, comfort, performance and operating safety.Market-leading boat builders French Beneteau/Jeanneau, German Bavaria, British Sunseeker,Italian Sessa Marine, US Tiara, Brazilian Intermarine,Swedish Hallberg-Rassy and AustralianRiviera choose <strong>Volvo</strong> Penta because of one of themarine industry’s broadest product programs andto have access to the world’s most global serviceand retail network.However, the most rapidly growing operationfor <strong>Volvo</strong> Penta in the past decade has beensales of industrial engines, which currently representabout 40% of <strong>Volvo</strong> Penta’s total salesvalue.<strong>The</strong> basis for the industrial engine business isthe strength in the <strong>Volvo</strong> <strong>Group</strong>’s total productand service offering. Assisted by these, <strong>Volvo</strong>Penta is able to offer high-technological products,as well as global support for such industrialapplications as diesel-operated gensets, cranesand container handlers.Customers include such world-leading industrialcompanies as Finnish Cargotec, French-American SDMO, Turkish Genpower and SwedishSandvik.<strong>The</strong> ambition is to expand industrial enginesales through increased market shares in anincreasing number of segments, for example, miningand construction equipment, and in emergingmarkets in, for example, Asia and Africa.Through sales of marine and industrial engines,<strong>Volvo</strong> Penta will contribute significant synergiesand economies of scale to the <strong>Volvo</strong> <strong>Group</strong>’smanufacture of engines and transmissions.Approximately 10% of the <strong>Group</strong>’s total dieselvolume represents engines sold by <strong>Volvo</strong> Penta.With respect to the <strong>Volvo</strong> <strong>Group</strong>’s most efficientengine, the D16, <strong>Volvo</strong> Penta accounts forapproximately two thirds of the <strong>Group</strong>’s totalsales and consequently, delivers a crucial volumecontribution to this engine series.Total market<strong>The</strong> strong decline in the total market in themarine industry in the wake of the global recessionslowed down in <strong>2010</strong>. Global demand formarine engines remained largely unchanged,compared with the preceding year. <strong>The</strong> marineindustry was characterized during the year by acontinued cautious attitude among end consumers.On average, boat builders reported a continuedlow production rate in their plants, comparedwith the boom years.However, the total market for industrial enginesstrengthened due to increased demand in essentiallyall regions. During the year, leading industrialengine customers gradually raised salesforecasts and capacity utilization to increasinglyhigher levels.Product renewal<strong>Volvo</strong> Penta reported a continued high rate ofproduct renewal. During the year, the introductionof the IPS drive system was completed with newand stronger drive units to match the <strong>Volvo</strong><strong>Group</strong>’s 11 and 13 liter engines. With these systems,<strong>Volvo</strong> Penta will be able to deliver propulsionengines in boats up to 100 feet.On the industrial side, future emission requirementsentail that <strong>Volvo</strong> Penta, with its strongproduct program and low emission engines, willbe able to capture new market shares with industrialcustomers in Europe, but also in the rest ofthe world where the environmental requirementsare successively being intensified.Financial performanceNet sales amounted to SEK 8,716 M, comparedwith SEK 8,159 M in the preceding year. Operat-<strong>Volvo</strong> Penta providesengines and power systemsfor leisure and commercialcraft, as well as for industrialapplications such as dieselpoweredgensets, cranesand container handlers.Number of employees1,211Position on world market<strong>Volvo</strong> Penta is the world’s largestproducer of diesel engines for leisureboats and a leading, independentproducer of industrial engines.Göran GummesonPresident of <strong>Volvo</strong>Penta.Ambitions <strong>2010</strong>• Manage risks towards suppliers and customers.• Secure positive cash flow and favorable profitability in new marketconditions.• Strengthen positions within mobile applications for industrial engines.36
Net sales as percentageof <strong>Volvo</strong><strong>Group</strong> sales3% (4)Net salesSEK bn0610.80711.70811.5098.2108.7Operating income (loss)and oprating margin8.7 578061,10610.3071,17310.0089288.109(230)(2.8)105786.6SEK M%Engine volumes<strong>Volvo</strong> Penta,No. of units 2009 <strong>2010</strong>Marine engines 25,755 28,965Industrial engines 19,228 22,623Total 44,983 51,588Net sales by market<strong>Volvo</strong> Penta, SEK M 2009 <strong>2010</strong>Europe 4,390 4,507North America 1,100 1,500South America 284 335Asia 2,054 2,008Other markets 331 366Total 8,159 8,716ing income amounted to SEK 578 M, comparedwith an operating loss of SEK 230 M in the precedingyear. <strong>The</strong> operating margin was 6.6%(neg: 2.8). Income was positively impacted by primarilythe effects of cost-reduction measures,but also to a certain extent by increased salesand higher capacity utilization.Production and investmentsIn recent years, <strong>Volvo</strong> Penta made significantinvestments in a new global logistics system. <strong>The</strong>new system, which was launched in <strong>2010</strong>, willfacilitate streamlining the entire chain from orderto delivery.Production in the plants in Vara, Sweden andLexington, USA had low capacity utilizationresulting from continued weak demand formarine engines globally.As a result of the increasingly strong demandfor industrial engines, <strong>Volvo</strong> Penta was able tocontribute to higher capacity utilization in the<strong>Volvo</strong> <strong>Group</strong>’s joint diesel engine plants inSkövde, Sweden and Lyon, France.Outcome <strong>2010</strong>• Customer credit losses and deliveries from subsuppliers under control.• Continued favorable growth in the industrial engine segment.Ambitions 2011• Increased growth rate and improved profitability in both Marineand Industrial.• Secure complete customer offers for fully-integrated drive systemsand instruments.• Secure product and geographic balance in terms of sales andprofitability.37
Board of directors’ report <strong>2010</strong>volvo AeroImproved profitability inthe core business<strong>Volvo</strong>Aero is playing an increasingly major role in theaircraft-engine industry. <strong>The</strong> business area is specializedin sophisticated structures, engine cases and rotating partsof aircraft engines.In recent years, <strong>Volvo</strong> Aero has taken more designresponsibility and currently develops componentsfor both aircraft and rocket engines, which arebased on a proprietary design system and proprietarymanufacturing technologies. <strong>The</strong> businessarea’s engine components are found in more than90% of all new major civil aircraft worldwide.Focus on core operations<strong>The</strong> aim of most of the technological developmentis to reduce the weight of proprietary componentsin various manners, since weight ishighly significant in fuel consumption and emissionsof carbon dioxide. This is an area that isbecoming increasingly important to the aviationindustry, both in terms of the climate and economy.Naturally, quality and safety are also in focusin the effort to reduce weight.In recent years, <strong>Volvo</strong> Aero has focusedincreasingly on its core operations: maintenanceof a few selected engines and developing andmanufacturing sophisticated components for aircraftand rocket engines. As a result of this strategy,certain other operations have been divestedor discontinued.Major engine programsDuring <strong>2010</strong>, <strong>Volvo</strong> Aero was highly involved in allfour new major engine projects that are occupyingthe aircraft-engine industry and will be highly significantto the development of the aircraft of thefuture. During the year, a number of key milestoneswere achieved in the development of these engines:<strong>The</strong>se include the starting of the new Rolls-Royce engine, Trent XWB, in a test cell for thefirst time in June. <strong>Volvo</strong> Aero is a joint-venturepartner in the XWB engine, responsible fordesign, development and manufacture of theintermediate case, the first in titanium to bedeveloped and manufactured entirely within<strong>Volvo</strong> Aero’s new design system. <strong>The</strong> Trent XWBwill be used in the Airbus A350 XWB, which isscheduled to enter service in 2013.Pratt & Whitney completed the assembly ofthe first PW1000G engine, “PurePower”, for theBombardier C series aircraft and Mitsubishi’sMRJ aircraft. <strong>Volvo</strong> Aero is a joint-venture partnerin the engine, responsible for the design, developmentand manufacture of a couple of components.Following the final assembly, a comprehensiveevaluation and certification programcommenced, which will continue for the next 24months, with engine certification and the firstflight with the aircraft scheduled for 2012. <strong>The</strong>aircraft is scheduled for commercial use in 2013.<strong>The</strong> first flight of Boeing’s upgraded 747-8 aircraftwas successfully executed in the spring,using four GEnx-2B General Electric engines.<strong>Volvo</strong> Aero is joint-venture partner in the GEnxengine, with responsibility for design and developmentof three components, and will manufacture atotal of five different components for the engine.In 2007, <strong>Volvo</strong> Aero was contacted by Pratt &Whitney about redesigning the intermediary casefor the GP7000 engine for the Airbus A380. Oneof several requirements specified was that theweight should be reduced by at least 10%. At theend of the year, <strong>Volvo</strong> Aero was able to present asolution that met these requirements.Key agreements<strong>The</strong> Defence Materiel Administration (FMV) and<strong>Volvo</strong> Aero signed an agreement entailing that<strong>Volvo</strong> Aero will be responsible for engine maintenance,spare parts supply and technical productsupport for the Gripen aircraft engine in Sweden,Hungary and the Czech Republic. <strong>The</strong> agreement,which is valid for two years, with an optionfor an additional three years, is estimated to beworth approximately SEK 1.2 billion for <strong>Volvo</strong>Aero if the option is exercised.In terms of maintenance, a key partnershipagreement was signed with Lufthansa Technik(LTH), whereby <strong>Volvo</strong> Aero has already providedthe first repairs to an engine in service. <strong>The</strong>repairs were approved by General Electric.Lufthansa and <strong>Volvo</strong> Aero now has exclusiverights to implementation.<strong>Volvo</strong> Aero made a strategic decision to focus onits core operations and as a result, the US subsidiary<strong>Volvo</strong> Aero offers advancedcomponents for aircraftengines and space applicationswith a focus on lightweighttechnology forreduced fuel consumption.Services for the aerospaceindustry and for stationarygas turbines are alsooffered.Number of employees2,863Position on world market<strong>Volvo</strong> Aero holds a leading position asan independent producer, with enginecomponents in about 90% of all largecommercial aircraft delivered in <strong>2010</strong>.Staffan ZackrissonPresident of <strong>Volvo</strong>Aero.Ambitions <strong>2010</strong>• Manage the continued development responsibility and supply test hardwarefor the new engine programs Trent XWB and PWG1000G.• Increase productivity in carried-out investments, shorten lead times andreduce costs.• Continue to gain market share within engine services.• Conduct a strategic overhaul of the American aftermarket business.38
Net sales as percentageof <strong>Volvo</strong><strong>Group</strong> sales3% (4)Net salesSEK bnOperating income (loss)and operating margin7.7 286Net sales by market<strong>Volvo</strong> Aero, SEK M 2009 <strong>2010</strong>Europe 3,942 3,768North America 3,508 3,599South America 34 27Asia 205 233Other markets 114 81Total 7,803 7,708068.2077.6087.6097.8107.7063594.4075296.9083594.709500.6102863.7SEK M%<strong>Volvo</strong> Aero Services was divested at the beginningof October to investment company H.I.G. Capital.Increased air trafficDuring the year, international passenger traffic rose8.2% following the deep recession in 2009. <strong>The</strong>load factor rose to 78.4%. <strong>The</strong> international cargotraffic rose 20.6% in <strong>2010</strong> compared with 2009.Aircraft manufacturers Airbus and Boeingdelivered 972 aircraft during <strong>2010</strong>, which was 1%less than 2009. <strong>The</strong> total order intake was 1,269aircraft, 121% more than in 2009. <strong>The</strong> manufacturers’total order intake rose 2% to 6,995 aircraftat the end of <strong>2010</strong>.Improved profitabilityNet sales decreased 1% during the year to SEK7,708 M, compared with SEK 7,803 M in 2009, primarilydue to the lower USD and the divestment of<strong>Volvo</strong> Aero Services. Adjusted for exchange-ratefluctuations and the sale of <strong>Volvo</strong> Aero Services,sales rose 9%.<strong>The</strong> divestment of <strong>Volvo</strong> Aero Services, whichwas implemented at the beginning of October, hada negative impact of SEK 538 M on operatingincome. Consequently, the operating profitamounted to SEK 286 M (50). <strong>The</strong> operating marginwas 3.7% (0.6). Factors behind the improvementwere primarily lower costs, higher productivityand increased sales in the core operations.Outcome <strong>2010</strong>• <strong>Volvo</strong> Aero has implemented development and delivery in the main according to plan.• Successful work with higher productivity, shorter lead times and reduced costs.• Increased market shares during <strong>2010</strong>.• Review implemented, resulting in the divestment of <strong>Volvo</strong> Aero Services.Ambitions 2011• Deliver design, hardware and serial manufacture of enginecomponents according to commitments.• Increase productivity, shorten lead times and reduce costs.• Increase volumes in engine maintenance.39
Board of directors’ report <strong>2010</strong><strong>Volvo</strong> Financial ServicesPositioned for growth<strong>Volvo</strong> Financial Services (VFS) supports the <strong>Volvo</strong> <strong>Group</strong> productrange with integrated financing solutions to help customersacquire the products they need to build their business.Stabilization of portfolioAs the world began to emerge from the globaleconomic and financial crisis, <strong>2010</strong> was a year ofstabilization for VFS. While the first half of theyear continued to be plagued by a challengingeconomic environment, the second half began todemonstrate more positive trends, characterizedby a reduction in overall levels of customer delinquencies,inventories of repossessed vehiclesand default activity.Throughout this period, VFS executed onenhanced portfolio management and collectiontechniques while strengthening and standardizingits operations. As VFS stabilized its portfolio,it did so in close alignment with the other <strong>Volvo</strong><strong>Group</strong> business areas and distributors, with afocus on building and maintaining customer relationships.Market developmentVFS is a stronger and more agile organizationtoday than before the downturn and is well positionedfor growth. Continuing to develop scalableand efficient business platforms will provide thecapacity for VFS to grow its global portfolio.In mature markets such as North America andEurope, operational leverage is essential to futuredevelopment. In Asia Pacific, VFS is making furtherinvestment in support of prudent growth. <strong>The</strong>development of the BRIC markets remains infocus while maintaining stable and standardizedoperations and systems.Developing integrated offers with the other<strong>Volvo</strong> <strong>Group</strong> business areas will also continue, asVFS supports the <strong>Volvo</strong> <strong>Group</strong> in developingsales opportunities and building close customerrelationships.Financial performanceTotal new financing volume in <strong>2010</strong> amounted toSEK 35 billion (29). Adjusted for changes inexchange rates, new business volume increasedby 26% compared to 2009 as a result ofincreased sales volumes of the <strong>Volvo</strong> <strong>Group</strong> productsand good penetration levels. In total, 34,522new vehicles and machines (25,782) werefinanced during the year. In the markets wherefinancing is offered, the average penetration ratewas 25% (25).At December 31, <strong>2010</strong> total assets amountedto SEK 89 billion (99). During <strong>2010</strong> the creditportfolio decreased by 4.4% (decrease: 15.6),adjusted for exchange-rate movements, to grosscredit portfolio SEK 84,550 M (94,988). <strong>The</strong>funding of the credit portfolio is matched in termsof maturity, interest rates and currencies inaccordance with <strong>Volvo</strong> <strong>Group</strong> policy. For furtherinformation, see note 36.<strong>The</strong> operating income for the year amounted toSEK 167 M compared to operating loss of SEK680 M in the previous year. Return on shareholders’equity was 0.4% (neg: 6.2). <strong>The</strong> equity ratioat the end of the year was 9.0% (8.7). <strong>The</strong>income is driven mainly by lower credit provisions.During the year, credit provision expensesamounted to SEK 1,438 M (2,327), while writeoffsof SEK 1,460 M (2,223) were recorded. <strong>The</strong>write-off ratio for <strong>2010</strong> was 1.65% (2.09). AtDecember 31, <strong>2010</strong>, credit reserves were 1.69%(1.67%) of the credit portfolio.As a consequence of the strong volume growthin Brazil, it was decided to syndicate approximatelySEK 4 billion of the Brazilian credit portfolioas a risk mitigation measure and to free upcapital for reinvestment in the country. <strong>The</strong> transactiongenerated a positive impact on operatingincome of SEK 38 M.In May, VFS successfully completed its firstasset-backed securitization in many years. Underthe terms of the transaction, USD 616 M of securitiestied to U.S.-based loans on trucking andconstruction equipment assets were issued.Conducts operations in customerand dealer financing.Number of employees1,235Position on world market<strong>Volvo</strong> Financial Services operatesexclusively to support the sales andleasing of vehicles and machineswhich are produced by the otherBusiness Areas, enhancing theircompetitiveness.Martin WeissburgPresident of <strong>Volvo</strong>Financial Services.Ambitions <strong>2010</strong>• Support customer and dealer downturn activities while mitigating thefrequency and severity of credit losses.• Adapt commercial strategy to lessons learned from the downturn to achievesustainable profitability.• Operational improvement and efficiency.• Secure diversification of funding channels in cooperation with <strong>Volvo</strong>Treasury.40
Net sales as percentageof <strong>Volvo</strong><strong>Group</strong> sales3% (5)Operating income (loss)16706 07 08 09 101,686 1,649 1,397 (680) 167 SEK MPenetration 130 29 20 17 14 20 16 11 34 35<strong>Volvo</strong> Renault Mack Buses <strong>Volvo</strong>Trucks Trucks TrucksCE4 12UDTrucks%1009Distribution of credit portfolio<strong>Volvo</strong> Trucks 46%<strong>Volvo</strong> CE 24%Renault Trucks 13%Mack Trucks 8%Buses 5%UD Trucks 3%Other 1%1 Share of business financed by <strong>Volvo</strong> Financial Services inmarkets where financial services are offered.Outcome <strong>2010</strong>• Re-established positive portfolio trends and maintained strong customer and dealer relationships.• Improved segmentation analysis and institutionalized best practices across all regions.• Aligned regional resources and operations to market conditions and rationalized cost structure.• Executed on capital strategies including asset-backed securitization, syndication and private labelfinance programs.Ambitions 2011• Achieve profitable growth in all markets.• Continue to improve operational leverage and efficiency.• Increase standardization of processes and systems.• Continue to develop BRIC markets.41
Board of directors’ report <strong>2010</strong>Moving the world<strong>Volvo</strong> trucks are the backbonein the long-haul transports that deliver mailto an entire continentFrom the earth to the moon and back – 32 times overDistances in Australia are huge. From Sydney on the east coast to Perth on the west coast, the route covers4,110 kilometers. That’s the same distance as the crow flies between Madrid and Moscow. Australia Post’sline haul vehicles cover a total of 25 million kilometers every year, the distance from the earth to the moonand back – 32 times over.42
All over the world, people are waiting for the mailman. Distributing mailis a complex and challenging logistical task, especially in Australia. 21million letters and parcels reach their destination every day, despite vastdistances and some of the toughest road conditions in the world. Withoutreliable trucks, it wouldn’t be possible.Twin beams of light cut through the darkness and driver Rick Hoyne is on thealert as he pilots his <strong>Volvo</strong> FH through the Australian night. Based in Melbourne,Rick is a 22 year veteran with Australia Post. This particular nighthe is heading for Dubbo, a route covering more than 700 kilometers. <strong>The</strong>re,another driver takes over, continuing the long journey to Brisbane.Rick is driving on a long straight stretch of the Newell Highway near theisolated town of Jerilderie in Western New South Wales. <strong>The</strong> region is in thegrip of drought and kangaroos flock to the roadside where the grass growingalong the verge is moist from dew. Rick stares intently through the windscreen,ready to take evasive action should the need arise.Australia is known for having among the world’s toughest road conditionsfor trucks. <strong>The</strong> weather in Australia varies from tropical storms with temperaturesapproaching 40 degrees Celsius in the far north, to snow and ice inthe Australian Alps in the south.“Australia is a big country. <strong>The</strong> distances are vast so it is important that allaspects are taken into consideration to ensure on-time delivery,” says ChrisPearce, Manager Surface Transport, Network Distribution Transport at AustraliaPost.<strong>The</strong> company handles postal distribution to all cities and towns in thecountry. Its fleet consists of vehicles ranging from motorcycles to tractors withdouble semi-trailers. Delivering mail in Australia is a huge logistical task.Australia Post handles 21 million postal items daily, of which two millionparcels, and the figure rises to more than double that around the Christmaspeak period.125 <strong>Volvo</strong> FH trucks make up the core of the line haul transports. 65 of thetrucks pull double semi trailers, so called B-doubles. By using larger rigs,many smaller trucks can be replaced. This means more fuel-efficient transportation,lower emissions, less congestion and less road wear. With theinstallation of front underrun protection and high cab safety as standard,<strong>Volvo</strong> was one of the first truck makers to meet the legislation for 26-meterB-Double rigs in the country.All the trucks are fitted with <strong>Volvo</strong>’s transport information and driver alertsystems. <strong>The</strong> strong and safe cab also plays a role in the operation as Australiahas an ongoing problem with kangaroos crossing highways, as well asloose livestock in unfenced regions.Rick Hoyne remains on the lookout for kangaroos on his night route.“You need to be comfortable to be safe. On long-distance routes, fatigue isreduced when the truck you are driving is comfortable”, he says.43
Board of directors’ report <strong>2010</strong>Sustainable de velopmentA responsibility that is thecontinuous focus of the <strong>Group</strong>To be a responsible company with the ability to adapt to changes in the surroundingworld is becoming increasingly important to the success of the <strong>Volvo</strong> <strong>Group</strong>. <strong>The</strong><strong>Group</strong> is responsible for developing transport solutions that convey cargo and passengersas efficiently as possible, while contributing to the economic development of customersand society as a whole.<strong>The</strong> world is facing major challenges. <strong>The</strong> needfor transport will increase due to higher financialprosperity, increased urbanization and higherpopulation. Through active dialog with the<strong>Group</strong>’s stakeholders and by weighing theirexpectations against internal strategies, the<strong>Volvo</strong> <strong>Group</strong> endeavors to create solutions for thefuture that are adapted to a sustainable society.We have identified four key areas within sustainabledevelopment:1 Products’ environmental impact2 Responsible sourcing3 High-performing organization4 Company culture44
1 Products’ environmental impactFuel costs represent approximately one third of costs for a transport company.More than 95% of the energy consumption in the transport sector is oil-based.<strong>The</strong> supply of easily accessible and cheap crude oil is diminishing, which will leadto higher fuel prices. In 2013, the Euro VI emission legislation will come intoforce, entailing that emission of NO xand particles will decrease to very low levels.In several parts of the world, carbon-dioxide legislation for heavy vehicles isbeing prepared. <strong>The</strong> <strong>Volvo</strong> <strong>Group</strong> continued to invest in the development of environmentallyadapted, efficient products, even during the financial crisis fromwhich we are now exiting.Road transport emissions in the EU1<strong>2010</strong>08060402001995 2000 2005 <strong>2010</strong> 2015 2020Carbon monoxide (CO)Nitrogen oxides (NO X)Solvents (VOCs)BenzeneParticulate matter (PM)from dieselsCarbon dioxide (CO 2)Sulphur dioxide SO 2Source: ACEA – EuropeanAutomobile Manufacturers'Association.Within the EU all road transport emissions except for CO 2are expectedto decrease in the future. This is the result of stringent emission regulations.2 Responsible sourcing<strong>The</strong> <strong>Volvo</strong> <strong>Group</strong> has a significant impact on the societies in which we operate. <strong>The</strong>companies in the <strong>Group</strong> are major employers and also generate employment opportunitiesfor many suppliers. <strong>The</strong> <strong>Volvo</strong> <strong>Group</strong> endeavors to conduct responsibleenterprise based on the <strong>Group</strong>’s Code of Conduct, its core values and other establishedguidelines. In terms of the environment, responsibility for social and businessethics is integrated in the operations and the <strong>Group</strong> aims to apply these policies withits business partners. This is a part of the risk management process and a way forthe <strong>Group</strong> to reduce the impact on the environment, while contributing to a positivesocial development.Number ofsuppliers, totalNumber of repliesTotal CSRapproved6,868 1,519 899<strong>Volvo</strong> <strong>Group</strong> expect its suppliers to becompliant with the <strong>Group</strong>'s CSRrequirements. <strong>The</strong> requirements are anintegrated part of the <strong>Group</strong>'s sourcingprocess. Potential and existing suppliersare monitored from a CSR perspectiveto increase the awareness and to followup on compliance. 15 months after thelaunch of the program almost everyfourth supplier has been monitored andof these 59% are compliant with <strong>Group</strong>requirements. <strong>The</strong> most common reasonfor non-compliance is that suppliers didnot pass the requirements further on inthe supply chain.3 A high-performing organizationIncreased global presence, new products, introduction of new technology, demographicchanges and more rapid fluctuations in the global economy will lead tochallenges in the supply of expertise and resources, as well as increased focuson the organization’s ability to adapt to changing market conditions. It will alsoplace high demand on the <strong>Group</strong> to generate commitment and motivate employeesto develop and propel the implementation of the <strong>Group</strong>’s strategy. <strong>The</strong>sefactors entail risks as well as opportunities.4 Company culture<strong>The</strong> company’s culture is a critical prerequisite for sustainable growth. Unliketechnologies, strategies, business concepts or organizational structures, cultureis a unique asset. In the document <strong>Volvo</strong> Way we described our corporate culturefor the first time in 1999. <strong>Volvo</strong> Way describes our values and how the employeesmay contribute to generating added value for customers and shareholders.Active work with company cultureInformedDiscussed95% of responding leaders have informedtheir team about updated content in <strong>The</strong><strong>Volvo</strong> Way (2004: 68%)86% of respondents has discussed how <strong>The</strong><strong>Volvo</strong> Way principles should influence theteam’s daily work (2004: 55%)04 1068% 95%04 1055% 86%45
Board of directors’ report <strong>2010</strong>1Products’ environmentalimpactCost for, access to and availability of fuel, as wellas legislation in the environmental area impactsthe <strong>Volvo</strong> <strong>Group</strong>. Problems with air pollution andclimate change entail more stringent legislations.<strong>The</strong>se are some of the factors which <strong>Volvo</strong> musthandle and its work has focused on the developmentof energy-efficient engines, hybrid enginesand vehicles that can operate on alternative fuels.Since 1975, fuel consumption in <strong>Volvo</strong>’s truckshas decreased by approximately 40%. Over thepast 30 years, diesel engines have seen analmost hundredfold reduction of regulated emissionsof nitrogen oxide (NO x) and particles (PM).When Euro VI gains legal force in the EU in 2013,emissions of NO xand PM will be at very low levels,but CO 2emissions will remain.Hybrids<strong>The</strong> <strong>Volvo</strong> <strong>Group</strong> has a number of environmentallyadapted products in its customer offering andfuture solutions that are now being tested in thefield in cooperation with customers.Emissions regulations for trucks and busesParticles, g/kWh0,160,140,120,100,080,060,040,02EPA 2002Euro III, 2002Euro VI, 2013Euro V, 2009Euro IV, 2006Euro II, 19960,000 1 2 3 4 5 6 7 8EPA 2007 NO x, g/kWhEPA <strong>2010</strong><strong>The</strong> <strong>Volvo</strong> <strong>Group</strong>’s unique diesel-electric hybridconcept, I-SAM, has made the <strong>Group</strong> the leaderin hybrid heavy vehicles. Because the <strong>Group</strong>develops and manufactures solutions, this facilitatescoordination and optimization of productsand components to produce the most efficientdriveline. <strong>The</strong> <strong>Volvo</strong> <strong>Group</strong>’s development programcomprises city buses and distribution trucks, aswell as construction equipment. Measurementson customers’ hybrid buses show significantlylower fuel consumption of up to 35%, correspondingto the same reduction of CO 2emissions,strongly reduced emissions of PM, which generatecleaner air, and also lower noise levels since dieselengines switch off at bus stops.Alternative fuelsThree years ago, the <strong>Volvo</strong> <strong>Group</strong> presentedseven different demonstration vehicles that canall be driven without net emissions of climateimpactingcarbon dioxide. This resulted in adevelopment project pertaining to two of thealternatives: methane diesel and DME (dimethylether).<strong>The</strong> benefit of methane diesel technolgoyis that methane fuel already today is available asa fuel for vehicles. Trucks, buses, constructionequipment and industrial engines are being fieldtested and sales of trucks with methanedieselenginesis planned to begin in 2011. BioDME iscurrently available only on a small scale in themarket. Since the <strong>Volvo</strong> <strong>Group</strong> believes that thisfuel is the most energy-efficient from a lifecycleperspective, <strong>Volvo</strong> plays an active role in theBioDME project. <strong>The</strong> aim of the project is toinvolve the entire chain from the production anddistribution of BioDME, to it being used as fuel invehicles. <strong>The</strong> project is financed by the EU andthe Swedish Energy Agency. <strong>Volvo</strong>’s portion ofthe project is to be project coordinator and tobuild vehicles for field testing.Cooperation with WWF<strong>The</strong> <strong>Volvo</strong> <strong>Group</strong> has a vision that future transportwill be CO 2neutral. As part of this, the <strong>Volvo</strong><strong>Group</strong> was the first manufacturer in the automotiveindustry to be affiliated with WWF’s ClimateSavers. As a participant in WWF’s program, the<strong>Volvo</strong> <strong>Group</strong>’s truck company undertakes toreduce CO 2emissions from vehicles producedbetween 2009 and 2014 by 13 million tons,which corresponds to Sweden’s total emissionsfor three months. Independent technical expertswill review the results.In September 2009, Euro V was implemented inEurope and in January <strong>2010</strong>, EPA <strong>2010</strong> wasimplemented in North America. Euro V entails a50% reduction of NO xemissions compared to EuroIV. With the implementation of EPA <strong>2010</strong>, emissionlevels for particulates and NO xare close to zero.46
2ResponsiblesourcingIt is becoming increasingly important for the<strong>Group</strong>’s stakeholders that the <strong>Volvo</strong> <strong>Group</strong> conductsresponsible business operations. In dialogwith investors, representatives of affiliated organizations,financiers, customers, employees, etc.,expectations of <strong>Volvo</strong> are expressed. Severalrequested that the <strong>Group</strong> must assume responsibilitynot only for its own operations but also forissues pertaining to suppliers’ efforts concerningsocial, environmental and business ethics. <strong>The</strong><strong>Volvo</strong> <strong>Group</strong> endeavors to assume responsibilityby placing demands on its suppliers.<strong>The</strong> <strong>Volvo</strong> <strong>Group</strong>’s CSR program (CorporateSocial Responsibility) for suppliers aims atde veloping working conditions and environmentalperformance with suppliers that do not alreadycomply with the <strong>Group</strong>’s demands, by monitoring,communicating and training them. Since 1996,<strong>Volvo</strong> has placed demands on suppliers’ environmentalperformance and in 2006, social andbusiness ethics requirements were introduced. In2008, the <strong>Volvo</strong> <strong>Group</strong> introduced a paragraph inagreements with new suppliers, which pledgesthem to comply with the policies in the <strong>Group</strong>’sCode of Conduct. In October 2009, the new<strong>Group</strong>wide CSR program for suppliers waslaunched. This means that there is now a jointprocess for the evaluation of potential suppliers,as well as to monitor current suppliers. During<strong>2010</strong>, <strong>Volvo</strong> worked on evaluating the processes’efficiency and this will be used as the basis forthe way in which the CSR program will develop inthe future.Approximately 35,000 companies deliverproducts and services to the <strong>Volvo</strong> <strong>Group</strong>. Ofthese, about 6,000 deliver direct material, i.e.material that is used in the products. Currently,the control group for responsible purchasing isfocusing on existing suppliers in countries thathave challenges in terms of non-compliance withlegislation within work environment, human rightsand business ethics.We monitor suppliers’ CSR performance byevaluation. During the 15 months of the program,approximately 1,500 suppliers of direct materialwere audited and of these, 59% complied withthe requirements. <strong>The</strong> absolutely most commonreason for non-compliance with the requirementsis that the suppliers did not pass on the requirementsof the <strong>Volvo</strong> <strong>Group</strong> to their own suppliers.<strong>The</strong> Global Compact<strong>The</strong> <strong>Volvo</strong> <strong>Group</strong> supports the UN’sGlobal Compact, which was designed topromote responsible business enterpriseworldwide, and commits itself to implementingand integrating ten principles regardinghuman rights, working conditions, business ethicsand the environment in its operations.3High-performingorganizationA crucial factor for the implementation of the<strong>Group</strong>’s strategy is the contribution from employees,their expertise and commitment. To secureand develop strategic expertise and resources inthe long-term is fundamental in order to maintainan efficient and adaptable organization.Employee engagementA positive and challenging work environment is aprerequisite for high-performing and committedemployees. To create the conditions for this, the<strong>Group</strong> focuses on a number of different areas, forexample competency and leadership development,work environment and preventive healthcare.<strong>The</strong> <strong>Group</strong>’s employees are annually requestedto respond to the <strong>Volvo</strong> <strong>Group</strong> Attitude Survey(VGAS), which will focus on employee engagementstarting in 2011. <strong>The</strong> response frequencyfor the most recent survey was 94%. <strong>The</strong>responses from the survey are discussed inwork groups and result in activity plans. VGASalso facilitates comparisons with other globalorganizations.Secure strategic competence<strong>The</strong> <strong>Volvo</strong> <strong>Group</strong> works proactively with threeyearrolling competency plans, where strategiccompetency needs are identified, gaps analyzedand action plans established. This is followed upin the annually recurring processes, President’sreview and Talent Review, where successionplanning is also secured.To prepare leaders of today and the future forupcoming assignments, work is in progress todevelop a strategy for leader development,including training programs, tools and methods,for leaders at all levels within the organization,according to the <strong>Group</strong>’s “Leadership Pipeline”concept. This is a structured method that isbased on global research and that different competenciesare required at various decision levels47
Board of directors’ report <strong>2010</strong>in the organization. <strong>The</strong> concept is connected to<strong>Volvo</strong> Way, the company culture, and strategicgoals.Internal mobility between companies, acrossnational borders and between functions isanother way in which to secure competency andsuccession planning. This also contributes to amore efficient organization by increased experienceexchange and diversity. A strategic initiativeaimed at increasing internal mobility is in progress.Leverage diversity through inclusiveleadershipDiversity and an inclusive leadership approachhave a positive impact on innovation and productivity.<strong>The</strong> <strong>Volvo</strong> <strong>Group</strong> works actively on fosteringa corporate culture aimed at capitalizing on thestrength in the organization’s diversity, includingthrough leadership training courses.New numerical values were introduced in<strong>2010</strong>: Balanced Team Indicator that measuresthe quantitative aspect of diversity (nationality,gender, age and experience from the <strong>Group</strong>’svarious companies), and the Inclusiveness Index,which measures the qualitative diversity, meaninghow diversity work is perceived by the employees.<strong>The</strong> results are followed up annually in the President’sReview.An adaptable organization<strong>The</strong> sudden decline in the global market in 2009resulted in an increased focus on the organization’sability to adapt. A strategic goal is to secureoptimal structure and staffing levels to cope withchanging market conditions, but to also supportthe launch of new technology and be able to executedecisions and implement changes rapidlyand efficiently. A <strong>Group</strong>-wide follow-up processpertaining to flexibility was introduced in <strong>2010</strong>.Key figures 2009 <strong>2010</strong>Number of employees at year-end 90,208 90,409Share of women, % 17 16Share of women, Board Members, % 11 12Share of women, Presidents and other senior executives, % 19 15Absence due to illness in the <strong>Group</strong>'s Swedish companiesTotal absence due to illness of regular working hours, % 3.6 3.3of which continuous sick leave for 60 days or more, % 35.8 38.0Absence due to illness (as percentage of regular working hours) by genderMen, % 3.5 3.2Women, % 3.9 3.6Absence due to illness (as percentage of regular working hours) by age29 years or younger, % 2.7 2.330–49 years, % 3.6 3.150 years and older, % 3.7 3.8Geographic distribution of employeesSweden 26%Europe, excl. Sweden 32%North America 14%South America 5%Asia 21%Other countries 2%4Company culture<strong>The</strong> company culture is a critical prerequisite forsustainable growth. Unlike technologies, strategies,business models or organizational structure,the company culture is hard to copy.<strong>Volvo</strong> Way shows what we stand for and aspireto be in the future. It expresses the culture,behaviors and values shared across the <strong>Volvo</strong><strong>Group</strong>.It expresses the cohesive culture, behavior andvalues shared across the <strong>Volvo</strong> <strong>Group</strong>. <strong>Volvo</strong> Waywas first introduced in October 1999. Severalnew businesses with different brands have sincebeen acquired. <strong>The</strong> industrial systems have beenintegrated, and concerted efforts were underwayto enhance performance.“Managing the global financial downturn in2008 and 2009, <strong>Volvo</strong> <strong>Group</strong> learned someimportant lessons. We need to be lean. We needempowered employees. We need to be accountable,aligned, agile and able to execute decisions.We need to turn outward, add customer value anddrive change,” wrote CEO Leif Johansson in a letterto all managers introducing the new <strong>Volvo</strong>Way in October 2009.<strong>The</strong> new <strong>Volvo</strong> Way reflects an ambitiousendeavor of creating a cohesive culture throughoutthe whole <strong>Volvo</strong> <strong>Group</strong>. This is a culture ofenablement, based on global principles andshared values:Our culture is how we work together withenergy, passion and respect for the individual. It isabout involvement, open dialogue and feedback.It is about diversity, teamwork and leadership. It ishow we build trust, focus on customers and drivechange. Our culture embodies individual responsibilityand accountability for results. This meansa clear orientation towards common goals andsolutions, and a strong determination to grow,develop and improve. It is how we conduct ourbusiness around the world.<strong>The</strong> new <strong>Volvo</strong> Way supports the strategy fordelivering added value to demanding customersin selected segments. In this customer centric48
culture, there is a strong focus on responsiveness,agility and the ability to execute with speed.Truly making the organization more efficient,demands further developing employee engagementand commitment to the company’s strategicobjectives for future business success.To be involved means that we take individualresponsibility for decisions. This employeeengagement results in a strong driving force tomeet agreed objectives and goals. All of us feelaccountable for driving improvements and buildingthe future. Only engaged employees candeliver the highest quality and efficiency.During the first half of <strong>2010</strong>, the new <strong>Volvo</strong>Way was disseminated to all employees by theirimmediate manager. Nearly two out of threeteams have identified local improvement actions.To build a high commitment and high performanceworking culture will require continuousattention and support by management. <strong>The</strong> resultis a more resilient organization.We are convinced that a cohesive culturebased on global values strengthens our brandsand makes <strong>Volvo</strong> <strong>Group</strong> a more attractiveemployer, business partner and industry leader.Production<strong>The</strong> environmental effort is and has long beenone of the cornerstones in the <strong>Group</strong>’s work. <strong>The</strong>joint environmental policy is one of the mostimportant documents for control. <strong>The</strong> policy is thefoundation of the <strong>Group</strong>’s environmental managementsystem, strategies and targets, auditsand measures.Already in 1995, the first environmental managementsystem was certified. At the end of<strong>2010</strong>, 96% of the employees in production unitswere working in accordance with the certifiedenvironmental management system, primarilyISO 14001:2008. At each production unit, thereis an environmental coordinator.<strong>The</strong> <strong>Group</strong>’s environmental goals are used tocontrol, develop and monitor the environmentaleffort. Strategies to achieve the goals areincluded in the business plan. During the 2004–2008 period, the <strong>Volvo</strong> <strong>Group</strong> focused on energyreduction in its own production process. Energyconsumption decreased during the period by43% per produced unit.<strong>The</strong> energy-saving goal for <strong>2010</strong>–2012 isdivided into two parts:• Continue the work with investigating the possibilityof making the <strong>Group</strong>’s facilities carbonneutral.• Standby loss, i.e. energy consumption duringnon-production hours, must decrease by 50%and an additional 15% energy-saving per producedunit by 2012, compared with 2008.Focusing on energy-savings measures is goodfor both the environment and the <strong>Group</strong>’s financialresults. A couple of years ago, when the <strong>Volvo</strong><strong>Group</strong> launched the world’s first carbon-neutralplant, the primary reason was to reduce the environmentalload, but it soon became quite clearthat it was also a solid financial investment, whichwill generate significant cost savings in the longterm.All production plants must comply with thecommon minimum requirements pertaining tochemicals, energy consumption, emissions to airand water, waste management, environmentalorganization and improvement work. Since 1989,environmental audits have been conducted toensure compliance with the environmental policyand in the event of acquisitions, a review is conductedof the company and properties to observeenvironmental factors and risks.In <strong>2010</strong>, there were 17 facilities in Sweden thatrequired permits. All have the necessary environmentalpermits and no permits needs to berenewed in 2011. <strong>The</strong> existence of contaminatedland in our properties is documented annually.During <strong>2010</strong>, the after-treatment of contaminatedland was in progress on one property.<strong>The</strong>se have historical origins. During <strong>2010</strong>, nospills were reported, no major environmental incidentsoccurred and no environmental disputesare ongoing.<strong>Volvo</strong> <strong>Group</strong> Sustainable <strong>Report</strong> willbe available on www.volvogroup.com inmid-April.<strong>Volvo</strong> <strong>Group</strong>’s environmentalperformance For information on the<strong>Volvo</strong> <strong>Group</strong>’s environmental performancesee the Eleven-year summary.49
Board of directors’ report <strong>2010</strong>Moving the worldFourteen centimeters ofnewly-fallen snow and ready for take-offin ten minutesAbout the snow-clearing operations at Arlanda AirportTwo centimeters of snow means 1,200 truck-loads to be transported to thesnow dump. One centimeter of snow means four days of work, round-theclock.All told, snow from an area covering 700 hectares is cleared between10 and 50 times daily during a typical winter’s day. Arlanda has among theworld’s largest snow blowers, and they are powered by <strong>Volvo</strong>. <strong>The</strong>re are 17<strong>Volvo</strong> A25D articulated haulers, nine wheel loaders of various <strong>Volvo</strong> modelsand a number of <strong>Volvo</strong> trucks.50
Each year, 2 billion people fly all over the world. This means high demands onthe maintenance of the airports, especially when the snow falls. In less thanten minutes, <strong>Volvo</strong>’s specially-built articulated haulers clear the runways atStockholm’s Arlanda Airport, which has never had to close because of the snow.When the snow and cold temperatures take a steady grip the affect onour airports is obvious. During early <strong>2010</strong> Frankfurt Airport, the thirdlargest in Europe, was forced to cancel more than 200 flights in one single day.At Arlanda Airport just north of Stockholm, aircraft take off and landalmost every second minute round the clock. More than 18 million peopletravelled to or from Arlanda in 2008 and more than 200,000 tons ofcargo was handled by the airport. During the winter months, heavysnowfall is not unusual and even if flights are occasionally delayedowing to particularly heavy snowfall, the airport has never once beenshut down by snow since its opening back in 1962.To keep the airport moving, a team of 130 people work with tacklingsnow and ice in the high season. <strong>The</strong>y are aided by a wide-ranging fleetof <strong>Volvo</strong> products featuring specially built accessories. <strong>The</strong> most advancedvehicles are the PSB machines. PSB stands for Plow, Sweep and Blow,and they are based on <strong>Volvo</strong> Construction Equipment articulated hauler.At the front of the vehicle is a 7.3 meter wide plow that shovels most ofthe snow off the tarmac. It is followed by a brush that sweeps away snowand ice, and the job is rounded off by a blower which with an extractionspeed of 130 m/s blows away the rest. <strong>The</strong> system is also in operation at,among others, Brussel’s airport Zaventem.By driving nine such machines alongside each other, it is possible toclear a 3.3 kilometer long and 45 meter wide runway in less than tenminutes.“This makes us the world’s fastest airport snow-plow team,” says StefanSundkvist, field coordinator at Arlanda Airport.In the fleet, there is also a number of <strong>Volvo</strong> wheel loaders that areequipped with snow-plows, sweepers and snow blowers in the winter. Atan airport, safety is absolutely everything. That is why the snow “sweepers”as they are called in the language of international aviation are anintegrated part of traffic planning and are in constant contact with thecontrol tower. Just as an aircraft gets its take-off and landing times, so toodo the sweepers get a slot to clear the snow and ice off the tarmac.“We have a total of 250,000 square meters to clear from snow and ice,at the same time as the aircraft have to continue taking off and landing.<strong>The</strong>re’s absolutely no room for driving around haphazardly – all the traffichas to be controlled and planned down to the most minute detail,” saysStefan Sundkvist.51
Board of directors’ report <strong>2010</strong>Financial str ategyBalancing return and security<strong>The</strong> purpose of <strong>Volvo</strong>’s long-term financial strategy is to ensurethe best use of <strong>Group</strong> resources in providing shareholders with afavorable return and offering creditors reliable security.<strong>Volvo</strong>’s goals are strong and stable creditratingsA long-term competitive market position requiresavailability of capital to implement investments.<strong>The</strong> financial strategy ensures that the <strong>Group</strong>’scapital is used in the best possible manner by:• balancing shareholders’ expectations on returnswith creditors’ demands for reliable security• strong and stable credit ratings• diversified access to financing from the capitalmarkets• margin in the balance sheet to cope with astrong decline in the economy• customer financing at competitive conditions toour customers• favorable return to shareholders.<strong>The</strong> goal concerning capital structure is definedas the financial net debt for the Industrial Operationsand it shall under normal circumstances bebelow 40% of shareholders’ equity.<strong>Volvo</strong> carefully monitors the trend of financialkey ratios to confirm that the financial position is inline with the <strong>Group</strong>’s policy. <strong>The</strong> financial key ratiosinclude order intake, operational development andfinancial development.Measures to improve the financial position<strong>The</strong> strong upswing in demand for the <strong>Group</strong>’sproducts in <strong>2010</strong> improved the <strong>Volvo</strong> <strong>Group</strong>’sfinancial position. <strong>The</strong> financial net debt in IndustrialOperations declined during the year from70.9% of shareholders’ equity to 37.4%. <strong>The</strong><strong>Group</strong> implemented comprehensive measuresduring the year to improve its financial position.During the global financial crisis, the <strong>Volvo</strong><strong>Group</strong> increased the ratio of liquidity relative tosales. As a consequence of the financial marketsstabilizing, the ratio was lowered during <strong>2010</strong>. Tofurther support the goal of improving the financialposition, the <strong>2010</strong> <strong>Annual</strong> General Meetingresolved not to pay any dividend for the 2009fiscal year.<strong>Volvo</strong> strives for strong, stable creditratings<strong>The</strong> <strong>Volvo</strong> <strong>Group</strong> has continual meetings with thecredit rating agencies Moody’s and Standard &Poor’s (S&P) to update them on the company’sdevelopment. <strong>The</strong>se meetings contribute to thecredit rating agencies’ ability to assess the<strong>Group</strong>’s future ability to repay loans. A high longtermcredit rating provides access to additionalsources of financing and improved access to thefinancial market.On November 15, S&P changed <strong>Volvo</strong>’s creditrating from BBB-/Baa3 with negative outlook toBBB-/Baa3 with stable outlook. <strong>The</strong> change wasattributable to a change in <strong>Volvo</strong>’s credit measurement.S&P also changed <strong>Volvo</strong>’s financial risk profileto “Medium” from earlier “Significant”.Moody’s corporate rating of <strong>Volvo</strong> is BBB/Baa2with stable outlook since July 24, 2009.Funding<strong>Volvo</strong> works actively for good balance betweenshort and long-term loans, as well as loan preparednessin the form of credit facilities, to satisfythe <strong>Volvo</strong> <strong>Group</strong>’s long-term financing needs.During the year, the <strong>Group</strong> diversified its loansby issuing an Asset Backed Security loan in theUS for the first time.At the end of <strong>2010</strong>, the <strong>Group</strong> had the equivalentof SEK 32.7 billion in cash and cash equivalentsand short-term investments. In addition, the<strong>Group</strong> had SEK 35.3 billion in granted but unutilizedcredit facilities.Credit rating at February 15, 2011Short-term Long-termMoody’s P-2 Baa2 stableStandard & Poor's A-3 BBB- stableDBRS R-2 (high) –R&I (Japan) a-1 A- positive52
Risks and uncertaintiesManaged risk-takingAll business operations involve risk – managed risk-taking is acondition of maintaining a sustained favorable profitability.Risk may be due to events in the world and canaffect a given industry or market. Risk can be specificto a single company. At <strong>Volvo</strong> work is carriedout daily to identify, measure and manage risk – insome cases the <strong>Group</strong> can influence the likelihoodthat a risk-related event will occur. In cases inwhich such events are beyond the <strong>Group</strong>’s control,the <strong>Group</strong> strives to minimize the consequences.<strong>The</strong> risks to which the <strong>Volvo</strong> <strong>Group</strong> are exposedare classified into three main categories:• External-related risks – such as the cyclicalnature of the commercial vehicles business,intense competition, changes in prices forcommercial vehicles and government regulations.• Financial risks – such as currency fluctuations,interest levels fluctuations, valuations ofshares or similar instruments, credit risk andliquidity risk.• Operational risks – such as market receptionof new products, reliance on suppliers, protectionand maintenance of intangible assets, complaintsand legal actions by customers and otherthird parties and risk related to human capital.External-related risk<strong>The</strong> commercial vehicles industry is cyclical<strong>The</strong> <strong>Volvo</strong> <strong>Group</strong>’s markets undergoes significantchanges in demand as the general economicenvironment fluctuates. Investments in infrastructure,major industrial projects, mining andhousing construction all impact the <strong>Group</strong>’s operationsas its products are central to these sectors.Adverse changes in the economic conditionsfor the <strong>Volvo</strong> <strong>Group</strong>’s customers may alsoimpact existing order books through cancellationsof previously placed orders. <strong>The</strong> cyclicaldemand for the <strong>Group</strong>’s products makes thefinancial result of the operations dependable onthe <strong>Group</strong>’s ability to react to changes in demand,in particular to the ability to adapt production levelsand production and operating expenses.Intense competitionContinued consolidation in the industry isexpected to create fewer but stronger competitors.Our major competitors are Daimler, Paccar,Navistar, MAN, Scania, Caterpillar, Komatsu,Cummins and Brunswick. In recent years, newcompetitors have emerged in Asia, particularly inChina. <strong>The</strong>se new competitors are mainly activein their domestic markets, but are expected toincrease their presence in other parts of theworld.Prices may change<strong>The</strong> prices of commercial vehicles have, at times,changed considerably in certain markets over ashort period. This instability is caused by severalfactors, such as short-term variations in demand,shortages of certain component products, uncertaintyregarding underlying economic conditions,changes in import regulations, excess inventoryand increased competition. Overcapacity withinthe industry can occur if there is a lack of demand,potentially leading to increased price pressure.Extensive government regulationRegulations regarding exhaust emission levels,noise, safety and levels of pollutants from productionplants are extensive within the industry.Most of the regulatory challenges regardingproducts relate to reduced engine emissions. <strong>The</strong><strong>Volvo</strong> <strong>Group</strong> is a significant player in the commercialvehicle industry and one of the world’s largestproducers of heavy-duty diesel engines. <strong>The</strong>product development capacity within the <strong>Volvo</strong><strong>Group</strong> is well consolidated to be able to focusresources for research and development to meettougher emission regulations. Future productregulations are well known, and the productdevelopment strategy is well tuned to the introductionof new regulations.Financial riskIn its operations, the <strong>Volvo</strong> <strong>Group</strong> is exposed tovarious types of financial risks. <strong>Group</strong>-wide policies,which are updated and decided upon annually, formthe basis of each <strong>Group</strong> company’s management ofthese risks. <strong>The</strong> objectives of the <strong>Group</strong>’s policiesfor management of financial risks are to optimizethe <strong>Group</strong>’s capital costs by utilizing economies ofscale, to minimize negative effects on income as aresult of changes in currency or interest rates, tooptimize risk exposure and to clarify areas ofresponsibility. Monitoring and control that establishedpolicies are adhered to is continuously conducted.Information about key aspects of the<strong>Group</strong>’s system for internal constrols and risk managementin conjunction with the financial reportingis provided in the Corporate Governance <strong>Report</strong> onpages 146 –147. Most of the <strong>Volvo</strong> <strong>Group</strong>’s financialtransactions are carried out through <strong>Volvo</strong>’s inhousebank, <strong>Volvo</strong> Treasury, that conducts its operationswithin established risk mandates and limits.Credit risks are mainly managed by the differentbusiness areas.<strong>The</strong> nature of the various financial risks andobjectives and the policies for the managementof these risks are described in detail in notes 36and 37. Various aspects of financial risk aredescribed briefly in the following paragraphs. <strong>Volvo</strong>’sac counting policies for financial instrumentsare described in note 1. <strong>The</strong> overall impact on acompany’s competitiveness is also affected howeverby how various macro-economic factors interact.53
Board of directors’ report <strong>2010</strong>Currency-related riskMore than 90% of the net sales of the <strong>Volvo</strong><strong>Group</strong> are generated in countries other thanSweden. Changes in exchange rates have adirect impact on the <strong>Volvo</strong> <strong>Group</strong>’s operatingincome, balance sheet and cash flow, as well asan indirect impact on <strong>Volvo</strong>’s competitiveness,which over time affects the <strong>Group</strong>’s earnings.Interest-related riskInterest-related risk includes risks that changesin interest rates will impact the <strong>Group</strong>’s incomeand cash flow (cash-flow risks) or the fair value offinancial assets and liabilities (price risks).Market risk from investments in shares orsimilar instruments<strong>The</strong> <strong>Volvo</strong> <strong>Group</strong> is indirectly exposed to marketrisks from shares and other similar instruments,as a result of managed capital transferred toindependent pension plans being partly investedin instruments of these types.Credit-related riskAn important part of the <strong>Group</strong>’s credit risk isrelated to how the financial assets of the <strong>Group</strong>have been placed. <strong>The</strong> majority are placed inSwedish Government bonds and interest-bearingbonds issued by Swedish real estate financinginstitutions.Liquidity risk<strong>Volvo</strong> ensures its financial preparedness byalways maintaining a certain portion of revenuesin liquid assets.Operational risk<strong>The</strong> profitability depends on successfulnew products<strong>The</strong> <strong>Volvo</strong> <strong>Group</strong>’s long-term profitability dependson the Company’s ability to successfully launchand market its new products. Product life cyclescontinue to shorten, putting increased focus onthe success of the <strong>Group</strong>’s product development.Reliance on suppliers<strong>Volvo</strong> purchases raw materials, parts and componentsfrom numerous external suppliers. A significantpart of the <strong>Group</strong>’s requirements for rawmaterials and supplies is filled by single-sourcesuppliers. <strong>The</strong> effects of delivery interruptionsvary depending on the item or component. Certainitems and components are standard throughoutthe industry, whereas others are internallydeveloped and require unique tools that are timeconsumingto replace.<strong>The</strong> <strong>Volvo</strong> <strong>Group</strong>’s costs for raw materials andcomponents can vary significantly over a businesscycle. Cost variations may be caused bychanges in world market prices for raw materialsor by an inability of our suppliers to deliver.Intangible assetsAB <strong>Volvo</strong> owns or otherwise has rights to patentsand brands that refer to the products the Companymanufactures and markets. <strong>The</strong>se havebeen acquired over a number of years and arevaluable to the operations of the <strong>Volvo</strong> <strong>Group</strong>.<strong>Volvo</strong> does not consider that any of the <strong>Group</strong>’soperations are heavily dependent on any singlepatent or group of patents.Through <strong>Volvo</strong> Trademark Holding AB, AB<strong>Volvo</strong> and <strong>Volvo</strong> Car Corporation jointly own the<strong>Volvo</strong> brand. AB <strong>Volvo</strong> has the exclusive right touse the <strong>Volvo</strong> name and trademark for its productsand services. Similarly, <strong>Volvo</strong> Car Corporationhas the exclusive right to use the <strong>Volvo</strong> nameand trademark for its products and services.CurrenciesInterest rates in Sweden, Europe and the U.S.SwedenEurope<strong>The</strong> U.S.009.28.48.20110.39.27.9029.79.17.3038.09.16.7047.39.1057.59.2067.49.3076.89.3087.810.96.5 6.7 5.8 5.8 8.6097.210.47.7106.79.08.3Source: ReutersSEK/USDSEK/EURSEK/100 JPY005.45.36.0015.14.85.0025.34.84.5034.64.14.0044.44.04.2053.43.44.3063.73.84.8074.34.34.0082.42.92.2093.43.43.8103.33.03.3Source: ReutersGovernment bonds, 10 year benchmarks%%%54
<strong>The</strong> <strong>Volvo</strong> <strong>Group</strong>’s rights to use the Renaultbrand are restricted to the truck operations onlyand are regulated by a license from Renault s.a.s.,which owns the Renault brand.Complaints and legal actions<strong>The</strong> <strong>Volvo</strong> <strong>Group</strong> could be the target of complaintsand legal actions initiated by customers,employees and other third parties alleging health,environmental, safety or business related issues,or failure to comply with applicable legislationand regulations. Even if such disputes were to beresolved successfully, without having adversefinancial consequences, they could negativelyimpact the <strong>Group</strong>’s reputation and take upresources that could be used for other purposes.Risk related to human capitalA decisive factor for the realization of the <strong>Volvo</strong><strong>Group</strong>’s vision is our employees and their knowledgeand competence. Future development depends onthe company’s ability to maintain its position asan attractive employer. To this end, the <strong>Volvo</strong><strong>Group</strong> strives for a work environment in whichenergy, passion and respect for the individual areguiding principles. Every year a <strong>Group</strong>-wide surveyis conducted, and according to the survey theshare of satisfied employees has been on a highlevel in recent years.Short-term risk factorsAn increase in demand could potentially result indelivery disturbances due to suppliers’ financialinstability or shortage of resources.Uncertainty regarding customers’ access tothe financing of products in emerging marketsmight have a negative impact on demand.<strong>Volvo</strong> verifies annually, or more frequently ifnecessary, the goodwill value of its businessareas and other intangible assets for possibleimpairment. <strong>The</strong> size of the overvalue differsbetween the business areas and they are, to avarying degree, sensitive to changes in the businessenvironment. Instability in the businessrecovery and volatility in interest and currencyrates may lead to indications of impairment.<strong>The</strong> reported amounts for contingent liabilitiesreflect a part of <strong>Volvo</strong>’s risk exposure, see note29 for contingent liabilities.Contractual conditions related totake over bidsSome of AB <strong>Volvo</strong>’s long term loan agreementscontain conditions stipulating the right for abondholder to request repayment in advanceunder certain conditions following a change ofthe control of the company. In <strong>Volvo</strong>’s opinion ithas been necessary to accept those conditions inorder to receive financing on otherwise acceptableterms. Provisions stipulating that an agreementcan be changed or terminated if the controlof the company is changed are also included insome of the agreements whereby Renault Trucks’has been given the right to sell Renault s.a.s.’ andNissan Motor Co. Ltd’s light-duty trucks as wellas in some of the <strong>Group</strong>’s purchasing agreements.Further informationNote 34 Personnel contains informationconcerning rules on severance paymentsapplicable for the <strong>Group</strong> Executive Committeeand certain other senior executives.Note 36 and 37 contain informationregarding financial risks as well as goalsand policies in financial risk management.Further risk information is provided innote 2 and note 29.55
Board of directors’ report <strong>2010</strong><strong>The</strong> shareRose by 93% during <strong>2010</strong>After the recovery that began in 2009, the trend continued to be positive forboth the <strong>Volvo</strong> share and the world’s leading stock markets in <strong>2010</strong>.<strong>The</strong> <strong>Volvo</strong> share is listed on the Nasdaq OMXNordic Exchange in Sweden. One A share entitlesthe holder to one vote at <strong>Annual</strong> GeneralMeetings and one B share entitles the holder toone tenth of a vote. Dividends are the same forboth classes of shares.<strong>The</strong> <strong>Volvo</strong> share is included in a large numberof indexes that are compiled by Dow Jones,FTSE, S&P and Nasdaq OMX Nordic.Positive development on the stock marketIn general, the development on the world’s leadingstock exchanges was positive after the recoverythat began in 2009. On Nasdaq OMX Nordic,the OMXSPI index rose by 23% during the year.Trading in <strong>Volvo</strong> A shares on Nasdaq OMX Nordicincreased by 38% compared to 2009 and theshare price increased by 89%. At year-end the pricefor the <strong>Volvo</strong> A share was SEK 115. <strong>The</strong> highestprice paid was SEK 115.70 on December 30, <strong>2010</strong>.Trading in <strong>Volvo</strong> B shares on Nasdaq OMXNordic decreased by 16% compared to 2009.<strong>The</strong> share price increased by 93% and was SEK118.50 per share at year-end. <strong>The</strong> highest pricepaid was SEK 118.80 on December 30, <strong>2010</strong>.In <strong>2010</strong>, a total of 2.5 billion (2.9) <strong>Volvo</strong> shareswere traded in Stockholm, corresponding to adaily average of 9.8 million (11.4). At year-end<strong>2010</strong>, <strong>Volvo</strong>’s market capitalization totaled SEK238 billion (124).An increasing portion of the trading in <strong>Volvo</strong>shares is carried out on alternative exchangessuch as Bats Europe, Burgundy and Chi-X.Ownership changesIn October <strong>2010</strong>, AB <strong>Volvo</strong>’s main shareholder,Renault, sold its entire holding of 302,915,940 Bshares. Buyers of the shares were a large number ofinstitutions from around the world. Through the sale,Renault’s holding in AB <strong>Volvo</strong> decreased from21.8% of the capital and 21.3% votes to 6.8% ofthe capital and 17.5% of the votes. Even after thesale, Renault continues to be AB <strong>Volvo</strong>’s largestowner based both on capital and on voting rights.DividendBased on the much improved profitability and asignificantly reduced debt level, the Board proposesto resume dividends with a pay-out of SEK2.50 per share for the financial year of <strong>2010</strong>,which means a total of SEK 5,069 M is beingtransferred to AB <strong>Volvo</strong>’s shareholders. No dividendwas paid for the preceding year.Communication with the shareholdersDialog with the shareholders is important for<strong>Volvo</strong>. In addition to the <strong>Annual</strong> General Meetingand a number of larger activities aimed at professionalinvestors, private shareholders and stockmarket analysts, the relationship between <strong>Volvo</strong>and the stock market is maintained through suchevents as press and telephone conferences inconjunction with the publication of interimreports, meetings with retail shareholders’ associations,investor meetings and visits, as well asroad shows in Europe, the U.S. and Asia.During <strong>2010</strong> a number of large events were held:• An investor day in Shanghai in May in cooperationwith five other Swedish capital goodscompanies. On the agenda was a visit to <strong>Volvo</strong>Construction Equipment’s production facilitiesamong other topics.• In June, the annual capital markets day was heldin Skövde, Sweden with a tour of the <strong>Group</strong>’sfoundry and engine manufacturing.• An investor day in Curitiba, Brazil was held in September.It included a factory tour and presentationsof the business and strategy in South America.• An investor day in New York City in Novembercontained a presentation of the <strong>Group</strong> strategyand in-depth information on the North Americanmarket.On the website www.volvogroup.com it is po ssibleto access financial reports, search for informationconcerning the share, insider trading in <strong>Volvo</strong> andstatistics for truck deliveries. It is also possible toaccess information concerning the <strong>Group</strong>’s governance,including information about the <strong>Annual</strong>General Meeting, the Board of Directors, <strong>Group</strong>Management and other areas that are regulatedin the “Swedish Code of Corporate Governance.”<strong>The</strong> website also offers the possibility to subscribeto information from <strong>Volvo</strong>.Earnings and dividend per shareTotal return, <strong>Volvo</strong> B06 078.03 7.375.00 5.505.0056084.902.0009(7.26)0.00105.362.50 1Earnings per shareDividend per shareExtraordinary payment1 Proposed by the Board of Directors1801601401<strong>2010</strong>080604006 07 08 09 10B Share(incl. re-invested dividends)SIX Return IndexSource: NASDAQ OMX
Price trend, <strong>Volvo</strong> Series B shares, 2006–<strong>2010</strong>, SEK1601401<strong>2010</strong>08060<strong>The</strong> largest shareholders in AB <strong>Volvo</strong>,December 31 1 Voting rights, %2009 <strong>2010</strong>Renault s.a.s. 21.3 17.5Industrivärden 8.8 11.1Violet Partners LP 5.5 5.5SHB 2 6.2 4.8AMF Insurance & Funds 3.9 3.91 AB <strong>Volvo</strong> held 20,728,135 class A shares and 80,265,060 classB shares comprising in total 4.7% of the number of registeredshares on December 31, <strong>2010</strong>.2 Comprises shares held by SHB, SHB Pension Fund, SHBEmployee Fund, SHB Pensionskassa and Oktogonen.Share capital, December 31, <strong>2010</strong>402006 07 08 09 10<strong>Volvo</strong> BOMX Stockholm PISource: NASDAQ OMXOMX Stockholm Machinery PIRegistered number of shares 1 2,128,420,220of which, Series A shares 2 677,601,630of which, Series B shares 3 1,450,818,590Quota value, SEK 1.20Share capital, SEK M 2,554Number of shareholders 240,043Private persons 223,600Legal entities 16,443Price trend, <strong>Volvo</strong> Series B shares, <strong>2010</strong>, SEK1201107&8100611 12&13 14909101516&1718 1920More details on the <strong>Volvo</strong> share, see note 23.1 <strong>The</strong> number of outstanding shares was 2,027,427,025 atDecember 31, <strong>2010</strong>.2 Series A shares carry one vote each.3 Series B shares carry one tenth of a vote each.804 5701&2360Q1 Q2 Q3 Q4<strong>Volvo</strong> BOMX Stockholm PIOMX Stockholm Machinery PISource: NASDAQ OMXEvents1 Truck deliveries for December 2009,February 52 Year-end report 2009, February 53 Truck deliveries for January, February 244 <strong>Annual</strong> report 2009, March 175 Truck deliveries for February, March 246 <strong>Annual</strong> General Meeting, April 147 Truck deliveries for March, April 238 First quarter report, April 239 Truck deliveries for April, May 510 Investor day in Shanghai, China, May 1211 Capital markets day in Skövde,sweden, June 2212 Truck deliveries for June, July 2213 Second quarter report, July 2214 Truck deliveries for July, August 2515 Truck deliveries for August,september 1516 Truck deliveries for September, October 2217 Third quarter report, October 2218 Investor day in New York, November 219 Truck deliveries for October, November 1720 Truck deliveries for November,December 15Ownership by country 1 Ownership categories 1Sweden, 57%Great Britain, 14%USA, 13%France, 7%Luxenbourg, 2%Switzerland, 2%Norway, 1%Others, 4%Non-Swedish owners, 43%Private shareholders, 11%Pension funds and insurancecompanies, 10%Savings funds, 14%Others, 22%More details on the <strong>Volvo</strong> share areprovided in note 23 to the financialstatements and in the Eleven-yearsummary.1 Share of capital, registered shares.1 Share of capital, registered shares.<strong>The</strong> employees' ownership of shares in <strong>Volvo</strong> through pension foundations is remote.57
Board of directors’ report <strong>2010</strong>Financial performanceStrong earnings improvement<strong>The</strong> <strong>Volvo</strong> <strong>Group</strong> made a turnaround in profitability and recorded operatingincome of SEK 18 billion thanks to higher sales volumes, strict cost control,increased capacity utilization and a good productivity trend in the industrial system.Net sales by business areaSEK M 2009 <strong>2010</strong> %Trucks 138,940 167,305 20Constructionequipment 35,658 53,810 51Buses 18,465 20,516 11<strong>Volvo</strong> Penta 8,159 8,716 7<strong>Volvo</strong> Aero 7,803 7,708 (1)Eliminations andother (538) (680) –IndustrialOperations 1 208,487 257,375 23Customer Finance 11,712 9,031 (23)Reclassificationsand eliminations (1,838) (1,658) –<strong>Volvo</strong> <strong>Group</strong> 218,361 264,749 211 Adjusted for acquired and divested units and changes incurrency rates, net sales for Industrial operationsincreased by 29%.Net sales by market areaSEK M 2009 <strong>2010</strong> %Western Europe 84,452 87,241 3Eastern Europe 9,632 12,570 31North America 37,291 45,409 22South America 16,610 27,876 68Asia 44,842 65,072 45Other markets 15,660 19,207 23Total IndustrialOperations 208,487 257,375 23Operating income (loss) by business areaSEK M 2009 <strong>2010</strong>Trucks (10,805) 10,112Construction Equipment (4,005) 6,180Buses (350) 780<strong>Volvo</strong> Penta (230) 578<strong>Volvo</strong> Aero 50 286Eliminations and other (994) (102)Industrial Operations (16,333) 17,834Customer Finance (680) 167<strong>Volvo</strong> <strong>Group</strong> (17,013) 18,000Operating margin% 2009 <strong>2010</strong>Trucks (7.8) 6.0Construction Equipment (11.2) 11.5Buses (1.9) 3.8<strong>Volvo</strong> Penta (2.8) 6.6<strong>Volvo</strong> Aero 0.6 3.7Industrial Operations (7.8) 6.9<strong>Volvo</strong> <strong>Group</strong> (7.8) 6.8<strong>The</strong> <strong>Volvo</strong> <strong>Group</strong>Net salesNet sales for the <strong>Volvo</strong> <strong>Group</strong> increased by21% to SEK 264,749 M in <strong>2010</strong>, comparedwith SEK 218,361 M in 2009.Operating income<strong>Volvo</strong> <strong>Group</strong> operating income amounted toSEK 18,000 M (loss: 17,013).Operating income for the Industrial Operationsincreased to SEK 17,834 M comparedwith an operating loss of SEK 16,333 M inthe preceding year. <strong>The</strong> Customer Financeoperations’ operating income rose to SEK167 M (loss: 680).Net financial itemsNet interest expense was SEK 2,700 M, comparedwith SEK 3,169 M in 2009. <strong>The</strong> improvementis mainly attributable to lower expensefor post-employment benefits.During the year, market valuation of derivatives,mainly used for the customer financingportfolio, had a positive effect on Other financialincome and expenses in an amount ofSEK 871 M (neg: 90).<strong>The</strong> currency in Venezuela was devaluedtwice during <strong>2010</strong>, which negatively impactedOther financial income and expenses by SEK116 M during the first quarter and an additionalSEK 158 M during the fourth quarter.Income taxes<strong>The</strong> tax expense for the year amounted toSEK 4,302 M corresponding to a tax rate of28%. In 2009 the tax income amounted to SEK5,889 M and a tax rate of 29%.Income for the period and earningsper share<strong>The</strong> income for the period amounted to SEK11,212 M (loss: 14,685), corresponding to basicand diluted earnings per share of SEK 5.36 (neg:7.26). <strong>The</strong> return on shareholders’ equity was16.0% (neg: 19.7).Industrial OperationsIn <strong>2010</strong>, net sales for the <strong>Volvo</strong> <strong>Group</strong>’s IndustrialOperations increased by 23% to SEK 257,375 M(208,487). Hard products accounted for SEK166,945 M and soft products (services andaftermarket products) for SEK 90,430 M of netsales.Compared with 2009, sales increased in all ofthe <strong>Group</strong>’s market areas. Demand in Europe andNorth America recovered gradually during theyear at the same time as the emerging economiesin South America and Asia continued tohave strong growth. However, development inJapan continued to be weak.Considerable earnings improvementIn <strong>2010</strong>, the operating income for the <strong>Volvo</strong><strong>Group</strong>’s Industrial Operations amounted to SEK17,834 M, compared with an operating loss ofSEK 16,333 M in 2009. <strong>The</strong> operating margin forthe Industrial Operations amounted to 6.9%(neg: 7.8).<strong>The</strong> earnings improvement is the result ofincreased sales, improved cost coverage in the58
industrial system, as an effect of increased productionlevels, and continued cost control.During <strong>2010</strong>, operating profit was negativelyimpacted by higher costs for raw material andcomponents amounting to approximately SEK300 M compared to the preceding year.In <strong>2010</strong>, research and development expensesamounted to SEK 12,970 M (13,193). Eventhough costs decreased compared with 2009,they remained at a relatively high level primarily aconsequence of projects relating to new emissionregulations in Europe, USA and Japan.Selling expenses decreased by 5% and administrationexpenses by 3% compared to 2009,depsite net sales increasing by 23%.Since return on equity was 16%, SEK 350 Mwas provisioned for profit-sharing to employeesImpact of exchange rates on operatingincome<strong>The</strong> combined effect of changed exchange rateshad a positive effect on operating income ofapproximately SEK 3.2 billion in <strong>2010</strong>, comparedwith 2009. This is mainly attributable to positiveeffects from forward exchange rate contracts in<strong>2010</strong> compared to major negative effects in2009.Research and development costs068.43.40711.13.90814.34.90913.26.31013.05.0Research anddevelopmentcosts, SEK bnResearch anddevelopmentcosts, % ofnet salesIncome Statement <strong>Volvo</strong> <strong>Group</strong>SEK M 2009 <strong>2010</strong>Net sales <strong>Volvo</strong> <strong>Group</strong> 218,361 264,749Operating Income (loss) <strong>Volvo</strong> <strong>Group</strong> (17,013) 18,000Operating income (loss) Industrial Operations (16,333) 17,834Operating income (loss) Customer Finance (680) 167Interest income and similar credits 390 442Interest expense and similar credits (3,559) (3,142)Other financial income and costs (392) 213Income after financial items (20,573) 15,514Income taxes 5,889 (4,302)Income for the period (14,685) 11,212Income Statement Industrial OperationsSEK M 2009 <strong>2010</strong>Net sales 208,487 257,375Cost of sales (179,578) (197,480)Gross income 28,909 59,895Gross margin, % 13.9 23.3Research and development expenses (13,193) (12,970)Selling expenses (23,752) (22,649)Administrative expenses (5,838) (5,640)Other operating income and expenses (2,432) (659)Income from investments in associated companies (15) (86)Income from other investments (13) (57)Operating income (loss) Industrial Operations (16,333) 17,834Operating margin, % (7.8) 6.9Change in operating incomeSEK bnOperating income 2009 (17.0)Gross income 27.2Provisions for healthcare benefitsaccording to agreement with United AutoWorkers, UAW 0.9Additional provisions forresidual value commitments 1.0Changes in currency exchange rates 3.2Higher capitalization ofdevelopment costs 0.7Higher research and developmentexpenditures (0.7)Lower selling andadministrative expenses 0.4Lower credit losses 1.7Other 0.6Operating income <strong>2010</strong> 18.0Impact of exchange rates on operatingincomeCompared with preceding year, SEK bnNet sales 1 (10.5)Cost of sales 12.3Research and development expenses 0.3Selling and administrative expenses 1.1Total effect of changes in exchangerates on operating income 3.21 <strong>Group</strong> sales are reported at monthly spot rates and theeffects of currency hedges are reported among Cost ofsales.Operating net flow per currencyLocal currency, million 2009 <strong>2010</strong>USD 1,803 2,410EUR 595 373GBP 315 405CAD 192 241JPY(x100) (83) (103)59
Board of directors’ report <strong>2010</strong>Customer Finance OperationsTotal new financing volume in <strong>2010</strong> amounted toSEK 35 billion (29). Adjusted for changes inexchange rates, new business volume increasedby 26% compared to 2009 as a result ofincreased sales volumes of the <strong>Volvo</strong> <strong>Group</strong> productsand good penetration levels. In total, 34,522new vehicles and machines (25,782) werefinanced during the year. In the markets wherefinancing is offered, the average penetration ratewas 25% (25).At December 31, <strong>2010</strong>, total assets amountedto SEK 89 billion (99). During <strong>2010</strong> the creditportfolio decreased by 4.4% (decrease: 15.6),adjusted for exchange-rate movements, to grosscredit portfolio SEK 84,550 M (94,988). <strong>The</strong>funding of the credit portfolio is matched in termsof maturity, interest rates and currencies inaccordance with <strong>Volvo</strong> <strong>Group</strong> policy. For furtherinformation see note 36.<strong>The</strong> operating income for the year amounted toSEK 167 M compared to operating loss of SEK680 M in the previous year. Return on shareholders’equity was 0.4% (neg: 6.2). <strong>The</strong> equity ratioat the end of the year was 9.0% (8.7). <strong>The</strong>income is driven mainly by lower credit provisions.During the year, credit provision expensesamounted to SEK 1,438 M (2,327) while writeoffsof SEK 1,460 M (2,223) were recorded. <strong>The</strong>write-off ratio for <strong>2010</strong> was 1.65% (2.09). At theend of December 31, <strong>2010</strong>, credit reserves were1.69% (1.67%) of the credit portfolio.Income Statement Customer FinanceSEK M 2009 <strong>2010</strong>Finance and lease income 11,712 9,031Finance and lease expenses (8,427) (5,974)Gross income 3,285 3,057Selling and administrative expenses (1,608) (1,526)Credit provision expenses (2,327) (1,438)Other operating income and expenses (30) 73Operating income (loss) (680) 167Income taxes 114 (134)Income (Loss) for the period (566) 32Return on Equity (6.2) 0.4Key ratiosCustomer Finance 1 2009 <strong>2010</strong>Credit portfolio net, SEK bn 93.5 83.1Operating income, SEK M (680) 167Return on shareholders' equity, % (6.2) 0.4Total penetration rate, % 24.8 24.5Penetration by business area, %<strong>Volvo</strong> CE 34 35<strong>Volvo</strong> Trucks 30 29Renualt Trucks 20 17Mack Trucks 14 20Buses 16 11UD Trucks 4 121 Share of business financed by <strong>Volvo</strong> Financial Services inmarkets where financial services are offered.60
Board of directors’ report <strong>2010</strong>Financial positionImproved during the yearNet debt in the <strong>Volvo</strong> <strong>Group</strong>’s Industrial Operations amounted to SEK 24.7 billion at December 31, <strong>2010</strong>, equal to 37.4%of shareholders’ equity. Excluding provisions for post-employment benefits the <strong>Volvo</strong> <strong>Group</strong>’s net debt amounted to SEK18.8 billion, which was equal to 28.5% of shareholders’ equity.<strong>Volvo</strong> <strong>Group</strong>’s liquid funds, cash and cash equivalentsand marketable securities combined,amounted to SEK 32.7 billion on December 31,<strong>2010</strong>. Of this, SEK 0.7 billion was restricted foruse by the <strong>Volvo</strong> <strong>Group</strong> and SEK 7.4 billion consistedof liquid funds in countries where exchangecontrols or other legal restrictions apply. In additionto this, granted but unutilized credit facilitiesamounted to SEK 35.3 billion.Total assets in the <strong>Group</strong> amounted to SEK 318,0billion on December 31, <strong>2010</strong>, a decrease of SEK14.3 billion compared to year-end 2009. Fluctuationsin currency decreased the total assets by SEK12.9 billion during <strong>2010</strong>. Other changes are mainly aresult of higher working capital due to increasedinventories, accounts receivable and account payableoffset by decreased customer financing receivablesdue to lower levels of financial leasing, installmentcredits and dealer financing as well asfluctuations in currency.<strong>The</strong> <strong>Group</strong>’s intangible assets amounted to SEK40.7 billion on December 31, <strong>2010</strong>. Investments inresearch and development amounted to SEK 3.2 billionin <strong>2010</strong>, resulting in a net value of developmentcosts of SEK 11.6 billion at the end of the year. <strong>The</strong><strong>Group</strong>’s total goodwill amounted to SEK 22.9 billionon December 31, <strong>2010</strong>, a decrease by SEK 0.9 billioncompared to year-end 2009. <strong>The</strong> decrease is aresult of fluctuations in currency. <strong>The</strong> tangible assetsdecreased by SEK 1.8 billion during <strong>2010</strong>, mainly asa result of divesture of subsidiaries.<strong>The</strong> value of the inventories increased by SEK 2.1billion during <strong>2010</strong>. <strong>The</strong> increase is mainly related tofinished products within the truck operations andconstruction equipment. Currency fluctuationsdecreased the value of inventories by SEK 1.8 billionat the end of <strong>2010</strong>.<strong>The</strong> net value of assets and liabilities related topensions and similar obligations amounted to SEK5.9 billion on December 31, <strong>2010</strong>, a decrease ofNet financial positionIndustrial Operations<strong>Volvo</strong> <strong>Group</strong>SEK MDec 312009Dec 31<strong>2010</strong>Dec 312009Dec 31<strong>2010</strong>Non-current interest-bearing assetsNon-current customer-financing receivables – – 39,713 36,025Non-current interest-bearing receivables 1,095 941 585 766Current interest-bearing assetsCustomer-financing receivables – – 42,264 36,663Interest-bearing receivables 1,215 1,071 410 342Internal funding 3,662 7,505 – –Interest-bearing assets held for sale 8 0 8 0Marketable securities 16,655 9,735 16,676 9,767Cash and bank 20,749 21,756 21,234 22,966Total financial assets 43,384 41,008 120,890 106,529Non-current interest-bearing liabilitiesBond loans 49,191 38,767 49,191 38,767Other loans 48,684 37,180 56,035 45,327Internal funding (30,908) (26,971) – –Current interest-bearing liabilitiesLoans 44,196 32,101 51,626 39,601Internal funding (32,273) (21,220) – –Total financial liabilities 78,890 59,857 156,852 123,695Net financial position excl.post employment benefits (35,506) (18,849) (35,962) (17,166)Provision for post employment benefits, net 5,983 5,842 6,002 5,862Net financial position incl.post employment benefits (41,489) (24,691) (41,964) (23,028)Change in net financial position, Industrial OperationsSEK bn 2009 <strong>2010</strong>Beginning of period (29.8) (41.5)Cash flow from operating activities (1.6) 28.8Investments in fixed assets (to)/from (10.5) (10.6)Disposals 0.7 0.8Operating cash-flow (11.4) 19.0Investments and divestments of shares 0.0 (0.1)Acquired and divested operations, net 0.2 0.2Capital injections (to)/from Customer Finance Operations 0.4 (0.5)Currency effect 3.0 (1.6)Payment to AB <strong>Volvo</strong> shareholders (4.1) –Revaluation of loans 0.9 –Provision UAW agreement (0.9) –Dividend paid to minority shareholders 0.0 (0.1)Other 0.2 (0.1)Total change (11.7) 16.8Net financial position at end of period (41.5) (24.7)62
Balance Sheets <strong>Volvo</strong> <strong>Group</strong>SEK MAssetsIndustrial Operations Customer Finance Eliminations <strong>Volvo</strong> <strong>Group</strong>Dec 312009Dec 31<strong>2010</strong>Non-current assetsIntangible assets 41,532 40,613 96 101 0 0 41,628 40,714Tangible assetsProperty, plant and equipment 55,208 54,169 72 72 0 0 55,280 54,242Assets under operating leases 13,539 13,217 10,955 10,055 (4,106) (3,625) 20,388 19,647Financial assetsShares and participation 2,025 2,080 19 18 0 0 2,044 2,098Non-current customer-financing receivables 531 598 39,720 36,270 (538) (843) 39,713 36,025Deferred tax assets 12,277 12,019 318 291 0 0 12,595 12,310Prepaid pensions 2,038 1,636 10 12 0 0 2,049 1,648Non-current interest-bearing receivables 1,095 941 0 204 (510) (379) 585 766Other non-current receivables 3,033 3,401 42 41 (36) (24) 3,038 3,418Total non-current assets 131,278 128,674 51,232 47,064 (5,190) (4,871) 177,320 170,868Current assetsInventories 35,765 38,956 1,962 882 0 0 37,727 39,837Current receivablesCustomer-financing receivables 836 830 42,443 36,897 (1,015) (1,064) 42,264 36,663Tax assets 1,362 1,045 161 90 0 0 1,523 1,135Interest-bearing receivables 1,215 1,071 66 1,283 (872) (2,012) 410 342Internal funding 3,662 7,505 0 0 (3,662) (7,505) – –Accounts receivable 20,877 24,332 460 101 0 0 21,337 24,433Other receivables 11,459 11,561 1,701 1,352 (1,077) (1,056) 12,082 11,857Non interest-bearing assets held for sale 1,684 136 – – – – 1,684 136Interest-bearing assets held for sale 8 0 – – – – 8 0Marketable securities 16,655 9,735 21 32 0 0 16,676 9,767Cash and cash equivalents 20,749 21,756 726 1,545 (241) (335) 21,234 22,966Total current assets 114,272 116,928 47,540 42,182 (6,867) (11,970) 154,945 147,139Total assets 245,550 245,602 98,772 89,246 (12,057) (16,841) 332,265 318,007Shareholders’ equity and liabilitiesEquity attributable to the equity holders of the Parent Company 57,856 65,090 8,549 8,020 0 0 66,405 73,110Minority interests 629 1,011 0 0 0 0 629 1,011Total shareholders’ equity 58,485 66,101 8,549 8,020 0 0 67,034 74,121Non-current provisionsProvisions for post-employment benefits 8,021 7,478 30 32 0 0 8,051 7,510Provisions for deferred taxes 1,858 3,026 1,780 1,496 0 0 3,638 4,522Other provisions 6,277 5,785 80 150 2 1 6,360 5,936Non-current liabilitiesBond loans 49,191 38,767 0 0 0 0 49,191 38,767Other loans 48,684 37,180 7,458 8,225 (107) (78) 56,035 45,327Internal funding (30,908) (26,971) 32,758 25,927 (1,849) 1,044 – –Other liabilities 11,762 11,172 479 389 (2,353) (2,330) 9,888 9,231Current provisions 9,321 8,429 164 105 2 1 9,487 8,534Current liabilitiesLoans 44,196 32,101 8,305 8,299 (876) (799) 51,626 39,601Internal funding (32,273) (21,220) 36,457 33,643 (4,184) (12,423) – –Non interest-bearing liabilities held for sale 272 135 – – – – 272 135Trade payables 35,754 47,111 201 139 0 0 35,955 47,250Tax liabilities 369 1,571 254 161 0 0 623 1,732Other liabilities 34,541 34,937 2,257 2,660 (2,692) (2,257) 34,105 35,341Total shareholders’ equity and liabilities 245,550 245,602 98,772 89,246 (12,057) (16,841) 332,265 318,007Contingent liabilities 9,607 11,003Dec 312009Dec 31<strong>2010</strong>Dec 312009Dec 31<strong>2010</strong>Dec 312009Dec 31<strong>2010</strong>SEK 0.1 billion compared to year-end 2009. Postemploymentbenefits valued at SEK 7.3 billion werereported outside the <strong>Volvo</strong> <strong>Group</strong>’s balance sheet.For further information see Note 24.At year-end, the equity ratio in the IndustrialOperations was 26.9% and in the <strong>Volvo</strong> <strong>Group</strong>23.3%. Shareholder’s equity in the <strong>Volvo</strong> <strong>Group</strong>amounted to SEK 74.1 billion at December 31, <strong>2010</strong>.63
Board of directors’ report <strong>2010</strong>Cash-flow statementStrong operating cash-flowOperating cash flow in the Industrial Operations amounted to SEK 19.0 billion(neg: SEK 11.4 billion).<strong>The</strong> strong cash flow was generated through theoperating income and a reduction of workingcapital.Financial items and paid income taxes had aSEK 5.1 billion negative effect on cash flowwithin Industrial Operations, mainly through paymentsof interests and income tax.Operating cash flow within Customer Financewas a positive SEK 1.4 billion in <strong>2010</strong> (15.1).Investments<strong>The</strong> Industrial Operations’ investments in fixedassets and capitalized R&D during <strong>2010</strong>amounted to SEK 10.3 billion (10.3).Capital expenditures in Trucks amounted toSEK 7.2 billion (7.4). <strong>The</strong> capital expenditureswithin Trucks consist to a large extent of investmentsrelated to product renewals in our productprogram, within product development and adaptationsin the plants. Examples of product renewalsare the new <strong>Volvo</strong> FMX construction truckand UD Trucks’ launches of a new version of theQuon heavy truck and a new Condor mediumduty truck equipped with a new medium-dutyengine. <strong>The</strong> ongoing investments aiming forincreased capacity and flexibility have more orless been finalized during the year. Those relateto the cab plant in Umeå, Sweden, and the engineplants with the new foundry but also investmentsin machining and assembly processes in Skövde,Sweden, and the assembly line in Ageo, Japan.During <strong>2010</strong>, Trucks invested in the dealer networkand workshops, mainly in Europe, howeveron a lower level than previous year.Capital investments for Construction Equipmentincreased to SEK 1.4 billion from SEK 1.0billion previous year. A majority of the investmentsrefer to expansion of the excavator businessin the BRIC countries, during <strong>2010</strong> especiallyin China. It includes product offerings as thenew EC200B <strong>Volvo</strong> excavator for the Chinesemarket, and increased manufacturing capacity inChina, Lingong with SDLG, and also in Korea,Changwon, for components and assembly. Productrelated investments during the year also referto the emission regulations with Tier4i and StageIIIB engines.<strong>The</strong> investments within <strong>Volvo</strong> Aero during<strong>2010</strong> were SEK 0.8 billion (0.6). <strong>The</strong> majority ofthe investments refer to the involvement in thenew engine programs, PW1000G with Pratt &Whitney, and Trent XWB with Rolls-Royce. <strong>The</strong>investments also refer to finalization of a numberof investments in Aero’s production facilities inorder to secure the capacity required for theGEnx program, carried out in cooperation withGeneral Electrics, and capacity investments inthe Low Pressure Turbine shop.<strong>The</strong> investments in Buses were SEK 0.2 billion(0.4). <strong>The</strong>y were mainly related to maintenanceand efficiency-enhancing investments in the factories.Product related investments during theyear relate mainly to emission standards andproduct renewals.<strong>The</strong> level of investments in <strong>Volvo</strong> Penta wereSEK 0.2 billion (0.3) and consist mainly of product-relatedinvestments in the new D13 engineand IPS3, the finalization phase of investments inthe new logistics system as well as tooling andother development activities.Investments in leasing assets amounted toSEK 0.3 billion (0.2).For 2011, the <strong>Volvo</strong> <strong>Group</strong> estimates thatinvestments in property, plant and equipment willbe around SEK 10 billion. This is higher than in<strong>2010</strong> as investments in future product programswill increase, as well as the expansion of the businessin the BRIC countries. <strong>The</strong> process in whichongoing and future investments are continuouslyreviewed and prioritized is still in focus.Capital expenditures, Industrial OperationsProperty, plant andequipment, SEK bnCapitalized developmentcosts, SEK bnCapital expenditures,% of net salesSelf-financing ratio, Industrial operations %Cash-flow fromoperating activitiesdivided by netinvestments in fixedassets and leasingassets.066.82.93.9078.02.13.60810.52.14.3097.72.65.0107.13.24.00623507265087809(16)1029464
Consolidated cash-flow statementsIndustrial Operations Customer Finance Eliminations <strong>Volvo</strong> <strong>Group</strong>SEK bn 2009 <strong>2010</strong> 2009 <strong>2010</strong> 2009 <strong>2010</strong> 2009 <strong>2010</strong>Operating activitiesOperating income (16.3) 17.8 (0.7) 0.2 0.0 0.0 (17.0) 18.0Depreciation tangible assets 6.5 6.1 0.0 0.0 0.0 0.0 6.5 6.1Amortization intangible assets 3.6 3.3 0.0 0.0 0.0 0.0 3.6 3.3Depreciation leasing vehicles 2.3 2.0 2.8 2.4 0.0 0.0 5.1 4.4Other non-cash items 2.3 0.1 2.0 1.3 0.1 0.2 4.4 1.6Total change in working capital, of which 4.7 4.6 11.8 0.1 0.4 0.1 16.9 4.8Change in accounts receivables 8.2 (4.0) 0.0 0.3 0.0 0.0 8.2 (3.7)Change in inventories 16.3 (4.8) (1.1) 0.8 0.0 0.1 15.2 (3.9)Change in trade payables (14.4) 13.1 (0.1) 0.0 0.1 (0.1) (14.4) 13.0Other changes in working capital (5.4) 0.3 13.0 (1.0) 0.3 0.1 7.9 (0.6)Net of interest and other financial items (3.0) (2.8) 0.0 0.0 0.0 (0.1) (3.0) (2.9)Income taxes paid (1.7) (2.3) 0.1 (0.3) 0.0 0.0 (1.6) (2.6)Cash flow from operating activities (1.6) 28.8 16.0 3.7 0.5 0.2 14.9 32.7Investing activitiesInvestments in tangible assets (7.5) (6.7) 0.0 (0.1) (0.2) 0.0 (7.7) (6.8)Investments in intangible assets (2.8) (3.6) 0.0 0.0 0.0 0.0 (2.8) (3.6)Investment in leasing vehicles (0.2) (0.3) (4.0) (4.5) 0.0 0.0 (4.2) (4.8)Disposals of fixed assets and leasing vehicles 0.7 0.8 3.1 2.3 0.0 0.0 3.8 3.1Operating cash flow (11.4) 19.0 15.1 1.4 0.3 0.2 4.0 20.6Investments and divestments of shares, net 0.0 (0.1)Acquired and divested operations, net 0.2 0.6Interest-bearing receivables including marketable securites (8.9) 6.8Cash-flow after net investments (4.7) 27.9Financing activitiesChange in loans, net 12.6 (25.7)Payment to AB <strong>Volvo</strong> shareholders (4.1) 0.0Payment to minority shareholders 0.0 (0.1)Other (0.1) 0.0Change in cash and cash equivalents excluding translation differences 3.7 2.1Translation difference on cash and cash equivalents (0.2) (0.4)Change in cash and cash equivalents 3.5 1.7Acquisitions and divestmentsInvestments and divestments in shares and participationhad a negative impact on cash flow ofSEK 0.1 billion (0.0).Acquired and divested companies <strong>2010</strong> had apositive impact on cash flow of SEK 0.6 billion(positive 0.2).Financing and dividendNet borrowings decreased cash and cash equivalentsby SEK 25.7 billion during <strong>2010</strong>.No dividend was paid during the year to theshareholders of AB <strong>Volvo</strong>.Change in cash and cash equivalents<strong>The</strong> <strong>Group</strong>’s cash and cash equivalents increasedby SEK 1.7 billion during the year and amounted toSEK 23.0 billion at December 31, <strong>2010</strong>.65
Financial information <strong>2010</strong>Financial information <strong>2010</strong>67 Consolidated incomestatement67 Other comprehensiveincome68 Consolidated balancesheet69 Changes in consolidatedShareholders’ equity70 Consolidated cash-flowstatement71 Notes to consolidatedfinancial statements114 Parent Company AB <strong>Volvo</strong>126 Proposed remunerationpolicy127 Proposed disposition ofunappropriated earnings128 Audit report for AB <strong>Volvo</strong>129 Eleven-year summaryp. Note <strong>The</strong> <strong>Volvo</strong> <strong>Group</strong>71 1 Accounting principles76 2 Key sources of estimation uncertainty77 3 Change of accounting principles78 4 Acquisitions and divestments ofshares in subsidiaries80 5 Joint ventures80 6 Associated companies81 7 Segment reporting83 8 Other operating incomeand expenses83 9 Income from investmentsin associated companies83 10 Income from other investments83 11 Other financial income and expenses84 12 Income taxes85 13 Minority interests85 14 Intangible and tangible assets88 15 Shares and participations89 16 Non-current customer-financingreceivables89 17 Non-current receivables90 18 Inventories90 19 Current customer-financing receivables90 20 Current receivables91 21 Marketable securities91 22 Cash and cash equivalents91 23 Shareholders’ equity93 24 Provisions for post-employment benefits97 25 Other provisions97 26 Non-current liabilities98 27 Current liabilities99 28 Assets pledged99 29 Contingent liabilities100 30 Cash-flow100 31 Leasing101 32 Transactions with related parties101 33 Government grants101 34 Personnel105 35 Fees to the auditors105 36 Goals and policies infinancial risk management109 37 Financial instrumentsp. Note Parent Company118 1 Accounting principles118 2 Intra-<strong>Group</strong> transactions118 3 Administrative expenses119 4 Other operating income andexpenses119 5 Income from investments ingroup companies119 6 Income from investments inassociated companies119 7 Income from other investments119 8 Interest income and expenses119 9 Other financial income andexpenses119 10 Allocations120 11 Income taxes120 12 Intangible and tangible assets121 13 Investments in shares andparticipations121 14 Other short-term receivables121 15 Untaxed reserves122 16 Provisions for pensions122 17 Non-current liabilities122 18 Other current liabilities122 19 Contingent liabilities122 20 Cash-flow66
Consolidated income statementSEK M 2009 <strong>2010</strong>Net sales Note 7 218,361 264,749Cost of sales (186,167) (201,797)Gross income 32,194 62,952Research and development expenses Note 7 (13,193) (12,970)Selling expenses (25,334) (24,149)Administrative expenses (5,863) (5,666)Other operating income and expenses Note 8 (4,798) (2,023)Income from investments in associated companies Note 7, 9 (14) (86)Income from other investments Note 10 (6) (58)Operating income Note 7 (17,013) 18,000Interest income and similar credits 390 442Interest expenses and similar charges (3,559) (3,142)Other financial income and expenses Note 11 (392) 213Income after financial items (20,573) 15,514Income taxes Note 12 5,889 (4,302)Income for the period (14,685) 11,212Attributable to:Equity holders of the Parent Company (14,718) 10,866Minority interests Note 13 33 346(14,685) 11,212Basic earnings per share, SEK Note 23 (7.26) 5.36Diluted earnings per share, SEK Note 23 (7.26) 5.36Other comprehensive incomeIncome for the period (14,685) 11,212Translation differences on foreign operations (1,246) (3,891)Translation differences on hedge instruments of netinvestment in foreign operations 159 113Accumulated translation difference reversed to income (136) (95)Available-for-sale investments 86 148Change in cash flow hedge reserve 2,313 (156)Other comprehensive income, net of income taxes 1,176 (3,881)Total comprehensive income for the period (13,509) 7,331Attributable to:Equity holders of the Parent Company (13,561) 7,016Minority interests 52 315(13,509) 7,33167
Financial information <strong>2010</strong>Consolidated balance sheetSEK M December 31, 2009 December 31, <strong>2010</strong>AssetsNon-current assetsIntangible assets Note 14 41,628 40,714Tangible assets Note 14Property, plant and equipment 54,289 53,294Investment property 991 948Assets under operating leases 20,388 75,668 19,647 73,889Financial assetsAssociated companies Note 15 588 684Other shares and participations Note 15 1,456 1,414Non-current customer-financing receivables Note 16 39,713 36,025Deferred tax assets Note 12 12,595 12,310Prepaid pensions Note 24 2,049 1,648Non-current interest-bearing receivables Note 17 585 766Other non-current receivables Note 17 3,038 60,024 3,418 56,265Total non-current assets 177,320 170,868Current assetsInventories Note 18 37,727 39,837Current receivablesCustomer-financing receivables Note 19 42,264 36,663Tax assets 1,523 1,135Interest-bearing receivables Note 20 410 342Accounts receivable Note 20 21,337 24,433Other receivables Note 20 12,082 11,857Non interest-bearing assets held for sale Note 4 1,684 136Interest-bearing assets held for sale 8 79,308 0 74,566Marketable securities Note 21 16,676 9,767Cash and cash equivalents Note 22 21,234 22,966Total current assets 154,945 147,139Total assets 332,265 318,007Shareholders’ equity and liabilitiesShareholders’ equity Note 23Share capital 2,554 2,554Additional contributed capital – –Reserves 6,235 2,386Retained earnings 72,334 57,304Income for the period (14,718) 10,866Equity attributable to the equity holders of the Parent Company 66,405 73,110Minority interests 629 1,011Total shareholders’ equity 67,034 74,121Non-current provisionsProvisions for post-employment benefits Note 24 8,051 7,510Provisions for deferred taxes Note 12 3,638 4,522Other provisions Note 25 6,360 18,049 5,936 17,968Non-current liabilities Note 26Bond loans 49,191 38,767Other loans 56,035 45,327Other liabilities 9,888 115,114 9,231 93,325Current provisions Note 25 9,487 8,534Current liabilities Note 27Loans 51,626 39,601Non interest-bearing liabilities held for sale Note 4 272 135Trade payables 35,955 47,250Tax liabilities 623 1,732Other liabilities 34,105 122,581 35,341 124,059Total shareholders’ equity and liabilities 332,265 318,007Assets pledged Note 28 958 3,339Contingent liabilities Note 29 9,607 11,00368
Changes in consolidated Shareholders’ equityShareholders’ equity attributable to equity holdersof the Parent CompanyShare Other Translation RetainedMinority TotalSEK Mcapital reserves 1 reserve earnings Total interests equityBalance at December 31, 2008 2,554 (2,263) 7,341 76,378 84,010 630 84,640Income for the period – – – (14,718) (14,718) 33 (14,685)Other comprehensive incomeTranslation differences on foreign operations – – (1,252) – (1,252) 6 (1,246)Translation differences on hedge instruments of netinvestments in foreign operations – – 159 – 159 – 159Accumulated translation differences reversed to income – – (136) – (136) – (136)Available-for-sale investments: Note 15, 23Gains/losses at valuation to fair value – 86 – – 86 – 86Change in cash flow hedge reserve Note 23 – 2,300 – – 2,300 13 2,313Other comprehensive income – 2,386 (1,229) – 1,157 19 1,176Total income for the period – 2,386 (1,229) (14,718) (13,561) 52 (13,509)Transactions with shareholdersDividends – – – (4,055) (4,055) (15) (4,070)Share based payments Note 34 – – – 4 4 – 4Changes in minority interests – – – – – (2) (2)Other changes – – – 7 7 (36) (29)Transactions with shareholders (4,044) (4,044) (53) (4,097)Balance at December 31, 2009 2,554 123 6,112 57,616 66,405 629 67,034Transition effect IFRS 3, capitalized transaction costs Note 3 – – – (135) (135) – (135)Total equity at beginning of period 2,554 123 6,112 57,481 66,270 629 66,899Income for the period – – – 10,866 10,866 346 11,212Other comprehensive incomeTranslation differences on foreign operations – – (3,859) – (3,859) (32) (3,891)Translation differences on hedge instruments of netinvestments in foreign operations – – 113 – 113 – 113Accumulated translation differences reversed to income – – (95) – (95) – (95)Available-for-sale investments: Note 15, 23Gains/losses at valuation to fair value – 148 – – 148 – 148Change in cash flow hedge reserve Note 23 – (156) – – (156) – (156)Other comprehensive income for the period – (8) (3,841) – (3,849) (32) (3,881)Total income for the period – (8) (3,841) 10,866 7,017 314 7,331Transactions with shareholdersDividends – – – – – (412) (412)Capital contribution – – – – – 358 358Share based payments Note 34 – – – – – – –Changes in minority interests – – – (180) (180) 115 (65)Other changes – – – 3 3 7 10Transactions with shareholders – – – (177) (177) 68 (109)Balance at December 31, <strong>2010</strong> 2,554 115 2,271 68,170 73,110 1,011 74,1211 For specification of other reserves, see Note 23.69
Financial information <strong>2010</strong>Consolidated cash-flow statementSEK M 2009 <strong>2010</strong>Operating activitiesOperating income (17,013) 18,000Depreciation and amortization Note 14 15,227 13,792Other items not affecting cash Note 30 4,397 1,561Changes in working capital:(Increase)/decrease in receivables 10,271 (4,330)(Increase)/decrease in customer finance receivables 12,806 (1,347)(Increase)/decrease in inventories 15,225 (3,921)Increase/(decrease) in liabilities and provisions (21,387) 14,399Interest and similar items received 353 429Interest and similar items paid (2,905) (2,732)Other financial items (514) (604)Income taxes paid (1,604) (2,590)Cash-flow from operating activities 14,856 32,657Investing activitiesInvestments in fixed assets (10,464) (10,334)Investments in leasing assets (4,246) (4,811)Disposals of fixed assets and leasing assets 3,849 3,067Shares and participations, net Note 30 (38) (106)Acquired and divested subsidiaries and other business units, net Note 4, 30 149 617Interest-bearing receivables including marketable securities (8,866) (19,616) 6,813 (4,754)Cash-flow after net investments (4,760) 27,903Financing activitiesIncrease/(decrease) in bond loans and other loans Note 30 12,655 (25,711)Cash payment to AB <strong>Volvo</strong> shareholders’ (4,055) –Dividends to minority shareholders (15) (75)Other (58) 8,527 (25) (25,811)Change in cash and cash equivalents,excluding translation differences 3,767 2,092Translation difference on cash and cash equivalents (245) (360)Change in cash and cash equivalents 3,522 1,732Cash and cash equivalents, January 1 Note 22 17,712 21,234Cash and cash equivalents, December 31 Note 22 21,234 22,966<strong>The</strong> effects of major acquisitions and divestments of subsidiaries ineach year have been excluded from other changes for the balancesheet items in the cash-flow statement. <strong>The</strong> effects of currency movementsin translation of foreign <strong>Group</strong> companies have also beenexcluded since these effects do not affect cash flow. Cash and cashequivalents include cash and bank balances but also bank certificateswhich matures within 3 months from aquisition.70
Notes to consolidated financial statementsAmounts in SEK M unless otherwise specified. <strong>The</strong> amounts within parentheses refer to the preceding year, 2009.Note 1 Accounting principles<strong>The</strong> consolidated financial statements for AB <strong>Volvo</strong> and its subsidiarieshave been prepared in accordance with International Financial Re portingStandards (IFRS) issued by the International Accounting StandardsBoard (IASB), as adopted by the EU. <strong>The</strong> portions of IFRS not adoptedby the EU have no material effect on this report. This <strong>Annual</strong> report isprepared in accordance with IAS 1 Presentation of Financial Statementsand in accordance with the Swedish Companies Act. In addition,RFR 1 Supplementary Rules for <strong>Group</strong>s, has been applied, issued bythe Swedish Financial <strong>Report</strong>ing Board. Effective in 2005 <strong>Volvo</strong> hasapplied International Financial <strong>Report</strong>ing Standards (IFRS) in its financialreporting. In accordance with the IFRS transitions rules in IFRS 1,<strong>Volvo</strong> applies retrospective application from the IFRS transition date atJanuary 1, 2004. <strong>The</strong> details of the transition from Swedish GAAP toIFRS are set out in Note 3 in the annual reports of 2005 and 2006.Refer to the 2004 <strong>Annual</strong> <strong>Report</strong> for a description of the previousSwedish accounting principles applied by <strong>Volvo</strong>.In the preparation of these financial statements, the company managementhas made certain estimates and assumptions that affect thevalue of assets and liabilities as well as contingent liabilities at thebalance sheet date. <strong>Report</strong>ed amounts for income and expenses inthe reporting period are also affected. <strong>The</strong> actual future outcome ofcertain transactions may differ from the estimated outcome whenthese financial statements were issued. Any such differences willaffect the financial statements for future accounting periods. <strong>The</strong> keysources of estimation uncertainty are set out in Note 2.Consolidated financial statementsPrinciples for consolidation<strong>The</strong> consolidated financial statements have been prepared in accordancewith the principles set forth in IAS 27, Consolidated and SeparateFinancial Statements. Accordingly, intra-<strong>Group</strong> transactions andgains on transactions with associated companies are eliminated. <strong>The</strong>consolidated financial statements comprise the Parent Company,subsidiaries, joint ventures and associated companies.– Subsidiaries are defined as companies in which <strong>Volvo</strong> holds morethan 50% of the voting rights or in which <strong>Volvo</strong> otherwise has a controllinginterest.– Joint ventures are companies over which <strong>Volvo</strong> has joint controltogether with one or more external parties. Joint ventures are reportedby use of the proportionate method of consolidation.- Associated companies are companies in which <strong>Volvo</strong> has a significantinfluence, which is normally when <strong>Volvo</strong>’s holdings equals to atleast 20% but less than 50% of the voting rights. Holdings in associatedcompanies are reported in accordance with the equity method.<strong>The</strong> <strong>Group</strong>’s share of reported income in such companies is includedin the consolidated income statement in Income from investments inassociated companies, reduced in appropriate cases by depreciationof surplus values and the effect of applying different accounting principles.Income from associated companies is included in operatingincome as the <strong>Volvo</strong> investments are of operating nature. For practicalreasons, some of the associated companies are included in the consolidatedaccounts with a certain time lag, normally one quarter. Dividendsfrom associated companies are not included in consolidatedincome. In the consolidated balance sheet, the book value of shareholdingsin associated companies is affected by <strong>Volvo</strong>’s share of thecompany’s net income, reduced by depreciation of surplus values andby the amount of dividends received.<strong>Volvo</strong> applies IFRS 3 (revised), Business Combinations, for acquisitions.Prior acquisitions are not restated. All business combinationsare accounted for in accordance with the purchase method. <strong>Volvo</strong> valuesacquired identifiable assets, tangible and intangible, and liabilitiesat fair value. Surplus amount from purchase price, possible minorityand fair value of previous possessions at the acquisition date comparedto the <strong>Group</strong>’s share of acquired net assets are reported asgoodwill. Any lesser amount, so-called negative goodwill, is reportedin the income statement.At step acquisitions a business combination occurs only at the datecontrol is achieved, at the same time goodwill is calculated. Transactionswith the minority are reported as equity as long as control of thesubsidiary is retained. For each business combination <strong>Volvo</strong> choosesif the minority should be valued either at fair value or at the minority’sproportionate share of the acquiree’s net assets. All acquisitionrelatedcosts are expensed. Companies acquired during the year areconsolidated as of the date of acquisition. Companies that have beendivested are included in the consolidated financial statements up toand including the date of divestment.Translation to Swedish kronor when consolidatingcompanies using foreign currenciesAB <strong>Volvo</strong>’s functional currency is the Swedish krona. All reporting ingroup companies for group purposes is made in the currency, in whichthe company has the majority of its revenues and expenses; normallythe currency of the country where the company is located. AB <strong>Volvo</strong>’sand the <strong>Volvo</strong> <strong>Group</strong>’s presentation currency is Swedish kronor. In preparingthe consolidated financial statements, all items in the incomestatements of foreign subsidiaries and joint ventures (except for subsidiariesin highly inflationary economies) are translated to Swedishkronor at monthly exchange rates. All balance sheet items are translatedat exchange rates at the respective year-ends (closing rate). <strong>The</strong>differences in consolidated shareholders’ equity, arising as a result ofvariations between closing rates, for the current and previous year arecharged or credited directly to shareholders’ equity as a separatecomponent.<strong>The</strong> accumulated translation difference related to a certain subsidiary,joint venture or associated company is reversed to income asa part of the gain/loss arising from the divestment or liquidation ofsuch a company.IAS 29, Financial <strong>Report</strong>ing in Hyperinflationary Economies, isapplied to financial statements of subsidiaries operating in highlyinflationary economies. <strong>Volvo</strong> applies reporting based on historicalvalue. Translation differences due to inflation are charged againstearnings for the year. Currently, <strong>Volvo</strong> has no subsidiaries with a functionalcurrency that could be considered a hyperinflationary currency.Receivables and liabilities in foreign currencyReceivables and liabilities in foreign currency are valued at closingrates. Translation differences on operating assets and liabilities are recognizedin operating income, while translation differences arising infinancial assets and liabilities are charged to other financial income andexpenses. Financial assets and liabilities are defined as items includedin the net financial position of the <strong>Volvo</strong> <strong>Group</strong> (see Definitions at theend of this report). Derivative financial instruments used for hedging ofexchange and interest risks are reported at fair value. Gains onexchange rates are reported as receivables and losses on exchangerates are reported as liabilities. Depending on the lifetime of the financialinstrument it is reported as current or non-current in the balancesheet. Exchange rate differences on loans and other financial instrumentsin foreign currency, which are used to hedge net assets in foreignsubsidiaries and associated companies, are offset against translationdifferences in the shareholders’ equity of the respective companies.Exchange rate gains and losses on payments during the year and onthe valuation of assets and liabilities in foreign currencies at year-endare credited to, or charged against, income in the year they arise. <strong>The</strong>more important exchange rates applied are shown in the table.71
Financial information <strong>2010</strong>Notes to consolidated financial statementsExchange rates Average rate Closing rateCountry Currency 2009 <strong>2010</strong> 2009 <strong>2010</strong>Brazil BRL 3.8444 4.0925 4.1375 4.0560Canada CAD 6.7006 6.9973 6.8885 6.8085China CNY 1.1192 1.0643 1.0600 1.0300Denmark DKK 1.4275 1.2823 1.3926 1.2086Euro EUR 10.6305 9.5502 10.3623 9.0113Great Britain GBP 11.9322 11.1319 11.4913 10.5538Japan JPY 0.0819 0.0823 0.0785 0.0835Norway NOK 1.2172 1.1926 1.2440 1.1530South Korea KRW 0.0060 0.0062 0.0062 0.0060United States USD 7.6470 7.2060 7.2138 6.8038Net sales and revenue recognition<strong>The</strong> <strong>Group</strong>’s reported net sales pertain mainly to revenues from salesof goods and services. Net sales are reduced by the value of discountsgranted and by returns.Income from the sale of goods is recognized when significant risksand rewards of ownership have been transferred to external parties,normally when the goods are delivered to the customer. If, however,the sale of goods is combined with a buy-back agreement or a re sidualvalue guarantee, the sale is accounted for as an operating leasetransaction if significant risks of the goods are retained in <strong>Volvo</strong>.revenues are then recognized over the period of the residual valuecommitment. If the residual value risk commitment is not significant,independent from the sale transaction or in combination with a commitmentfrom the customer to buy a new <strong>Volvo</strong> product in connectionto a buy-back option, the revenue is recognized at the time of sale anda provision is reported to reflect the estimated residual value risk (seeProvisions below)Revenue from the sale of workshop services is recognized whenthe service is provided. Interest income in conjunction with financeleasing or installment contracts are recognized during the underlyingcontract period. Revenue for maintenance contracts are recognizedaccording to how costs associated with the contracts are distributedduring the contract period.Interest income is recognized on a continuous basis and dividendincome when the right to receive dividend is obtained.Leasing<strong>Volvo</strong> as the lessorLeasing contracts are defined in two categories, operating andfinance leases, depending on the contract’s financial implications.Operating leasing contracts are reported as non-current assets inAssets under operating leases. Income from operating leasing isreported equally distributed over the leasing period. Straight-linedepreciation is applied to these assets in accordance with the termsof the undertaking and the deprecation amount is adjusted to correspondto the estimated realizable value when the undertaking expires.Assessed impairments are charged to the income statement. <strong>The</strong>product’s assessed realizable value at expiration of the undertaking isreviewed continuously on an individual basis.Finance leasing agreements are reported as either Non-current orcurrent receivables in the customer finance operations. Payments fromfinance leasing contracts are distributed between interest income andamortization of the receivable in the customer finance operations.<strong>Volvo</strong> as the lessee<strong>Volvo</strong> evaluates leasing contracts in accordance with IAS 17, Leases.In those cases in which risks and rewards that are related to ownershipare substantially held by <strong>Volvo</strong>, so called finance leases, <strong>Volvo</strong>reports the asset and related obligation in the balance sheet at thelower of the leased asset’s fair value or the present value of minimumlease payments. Future leasing fee commitments are reported asloans. <strong>The</strong> lease asset is depreciated in accordance with <strong>Volvo</strong>’s policyfor the respective non-current asset. <strong>The</strong> lease payments when madeare allocated between amortization and interest expenses. If the leasingcontract is considered to be a so called operating lease, leasepayments are charged to the income statement over the lease contractperiod.<strong>Report</strong>ing of financial assets and liabilitiesFinancial assets treated within the framework of IAS 39 are classifiedeither as– Financial assets at fair value through profit and loss,– Investments held to maturity,– Loans and receivables, or as– Available-for-sale financial assetsFinancial liabilities are reported either at amortized cost or at fair valuethrough profit and loss.Purchases and sales of financial assets and liabilities are recognizedon the transaction date. A financial asset is derecognized (extinguished)in the balance sheet when all significant risks and benefitslinked to the asset have been transferred to a third party. <strong>The</strong> sameprinciples are applied for financial assets in the segment reporting of<strong>Volvo</strong> <strong>Group</strong>.<strong>The</strong> fair value of assets is determined based on the market prices insuch cases they exist. If market prices are unavailable, the fair value isdetermined for each asset using various valuation techniques. Transactionexpenses are included in the asset’s fair value except in casesin which the change in value is recognized in the income statement.<strong>The</strong> transaction costs arising in conjunction with assuming financialliabilities are amortized over the term of the loan as a financial cost.Embedded derivatives are detached from the related main contract, ifapplicable. Contracts containing embedded derivatives are valued at fairvalue in the income statement if the contracts’ inherent risk and othercharacteristics indicate a close relation to the embedded derivative.Financial assets at fair value through profit and lossAll of <strong>Volvo</strong>’s financial assets that are recognized at fair value in theincome statement are classified as held for trading. Included arederivatives that <strong>Volvo</strong> has decided not to apply hedge accounting on,and derivates that are not part of an evidently effective hedgeaccounting. Gains and losses on these assets are recognized in theincome statement. Short-term investments that are reported at fairvalue through profit and loss mainly consist of interest-bearing financialinstruments and are reported in note 21. Derivatives used forhedging interest-rate exposure in the customer financing portfolio are72
included in this category as it is not practically possible to apply hedgeaccounting in accordance with IAS 39 due to the large number ofcontracts that the customer finance portfolio consist of. <strong>Volvo</strong> intendsto keep these derivatives to maturity, why, over time, the market valuationwill be offset as a consequence of the interest-rate fixing onborrowing and lending for the customer finance operations, andaccordingly not affect result or cash flow.Financial assets held to maturityHeld-to-maturity investments are non-derivative assets with fixedpayments and terms and that <strong>Volvo</strong> intends and is able to hold tomaturity. After initial recognition, these assets are measured inaccordance with the effective interest method, with adjustment forany impairment. Gains and losses are recognized in the income statementwhen assets are divested or impaired as well as in pace with theaccrued interest being reported. At present <strong>Volvo</strong> has no financialinstruments classified in this category.Loan receivables and other receivablesLoans and receivables are non-derivative financial assets with fixed ordeterminable payments, originated or acquired, that are not quoted inan active market. After initial recognition, loans and receivables aremeasured in accordance with the effective interest method. Gains andlosses are recognized in the income statement when the loans orreceivables are divested or impaired as well as in pace with theaccrued interested being reported.Accounts receivables are recognized initially at fair value, whichnormally corresponds to the nominal value. In the event that the paymentterms exceed one year, the receivable is recognized at the discountedpresent value.Assessment of impairment – loan receivables and other receivables<strong>Volvo</strong> conducts routine controls to ensure that the carrying value ofassets valued at amortized cost, such as loans and receivables, hasnot decreased, which would result in an impairment loss reported inthe income statement. Allowances for doubtful receivables are continuouslyreported based on an assessment of a possible change inthe customer’s ability to pay.Impairments consist of the difference between carrying value andcurrent value of the estimated future payment flow attributable to thespecific asset with consideration to the fair value of any collateral.Discounting of future cash flow is based on the effective rate usedinitially. Initially, the impairment requirement is evaluated for eachrespective asset. If, based on objective grounds, it cannot be determinedthat one or more assets are subject to an impairment loss, theassets are grouped in units based, for example, on similar credit risksto evaluate the impairment loss requirement collectively. Individuallywritten down assets or assets written down during previous periodsare not included when grouping assets for impairment test.If the conditions for a completed impairment loss later prove to nolonger be present the impairment loss is reversed in the income statementas long as the carrying value does not exceed the amortizedcost at the time of the reversal.<strong>Volvo</strong> discloses loan receivables and accounts receivables in thenotes 16, 17, 19 and 20.Available-for-sale assetsThis category includes assets available for sales or those that havenot been classified in any of the other three categories. <strong>The</strong>se assetsare initially measured at fair value including transaction costs. Fairvalue changes are recognized directly in other comprehensive income.<strong>The</strong> cumulative gain or loss that was recognized in other comprehensiveincome is recognized in profit or loss when an available-for-salefinancial asset is sold. Unrealized value declines are recognized inother comprehensive income, unless the decline is significant or prolonged.<strong>The</strong>n the impairment is recognized in the income statement. Ifthe event causing the impairment no longer exists, impairment can bereversed in the income statement if it does not involve an equityinstrument.Earned or paid interest attributable to these assets is recognized inthe income statement as part of net financial items in accordance withthe effective interest method. Dividends received attributable to theseassets are recognized in the income statement as Income from otherinvestments.<strong>Volvo</strong> reports shares and participations in listed companies at marketvalue on the balance-sheet date, with the exception of investmentsclassified as associated companies and joint ventures. Holdingsin unlisted companies for which a market value is unavailable arerecognized at acquisition value. <strong>Volvo</strong> classifies these types of investmentsas assets available for sale. See note 15 for <strong>Volvo</strong>’s holdings ofshares and participations in listed companies.Assessment of impairment – available-for-sale assetsIf an asset available for sale is to be impaired, it shall be effected bytaking the difference between the asset’s acquisition value (adjustedfor any accrued interest if it involves that type of asset) and its fairvalue. If it instead involves equity instruments such as shares, a completedimpairment shall not be reversed in the income statement. Onthe other hand, impairments that have been made on debt instruments(interest-bearing instruments) shall in whole or part be reversedin the income statement, in those instances where an event that isproven to have occurred after the impairment was performed is identifiedand impacts the valuation of that asset.Hedge accountingDerivatives used for hedging of firm future commercial currency exposureas well as forecasted electricity consumption have, in accordancewith IAS 39, been reported at fair value in the balance sheet.Since the fourth quarter 2009 hedge accounting is not applied onnew financial instruments used for hedging commercial flows. Howeverfor previously entered financial instruments hedge accounting iscontinuously applied. <strong>The</strong> majority of those financial instruments haveexpired during the year.When hedge accounting is not applied, unrealized gains and lossesfrom fluctuations in the fair values of the financial instruments arereported in the income statement in the segment <strong>Group</strong> headquarterfunctions and other. When the derivative financial instrument have beenrealized the income effect is reported within the respective segments.As from January 1, 2011 unrealized changes in fair value of financialinstruments related to a receivable or payable will be reported within therespective segments. All other unrealized changes in fair value offinancial instruments will henceforth be reported in the income statementin the segment <strong>Group</strong> headquarter functions and other.During <strong>2010</strong> <strong>Volvo</strong> has partly applied hedge accounting for financialinstruments used to hedge interest and currency risks on loansonly for cases when hedge accounting requirements are fulfilled. Thisconcerns a loan of 1 billion euro borrowed in 2007. <strong>The</strong> changesin the fair value of the outstanding hedge instruments and thechanges in the carrying value of the loan are reported in the incomestatement. For cases where hedge accounting is not considered to befulfilled, unrealized gains and losses up until the maturity date of thefinancial instrument will be charged to the financial net in the incomestatement.73
Financial information <strong>2010</strong>Notes to consolidated financial statementsDuring <strong>2010</strong> <strong>Volvo</strong> has applied hedge accounting for certain netinvestments in foreign operations. <strong>The</strong> current result for such hedgesis reported in a separate component in shareholders’ equity. In theevent of a divestment, the accumulated result from the hedge is recognizedin the income statement.See notes 36 and 37 for the valuation of all financial instruments inthe <strong>Volvo</strong> <strong>Group</strong> and for details and further description on principlesfor economic hedging, hedge accounting and changes to the policiesfor hedging and hedge accounting during <strong>2010</strong> and going forward.Research and development expenses<strong>Volvo</strong> applies IAS 38, Intangible Assets, for reporting of research anddevelopment expenses. In accordance with this standard, expendituresfor development of new products, production systems and softwareshall be reported as intangible assets if such expenditures witha high degree of certainty will result in future financial benefits for thecompany. <strong>The</strong> acquisition value for such intangible assets shall beamortized over the estimated useful life of the assets. In order forthese development expenditures to be reported as assets, a numberof criteria must be met. For example, it must be possible to prove thetechnical functionality of a new product or software prior to its developmentbeing reported as an asset. In normal cases, this means thatexpenditures are capitalized only during the industrialization phase ofa product development project. Other research and developmentexpenses are charged to income as incurred.Intangible and tangible non-current assets<strong>Volvo</strong> applies acquisition values for valuation of intangible and tangibleassets. Borrowing costs are included in the acquisition value ofassets that necessarily takes more than 12 months to get ready for itsintended use or sale, so called qualifying assets.Investment property is reported at acquisition cost. Informationregarding estimated fair value of investment property is based on discountedcash flow projections. <strong>The</strong> estimation is performed by the<strong>Group</strong>’s Real Estate business unit. <strong>The</strong> required return is based oncurrent property market conditions for comparable properties in comparablelocations.In connection with participation in industrial cooperation projectstogether with other companies, such as the aircraft engine projectsthat <strong>Volvo</strong> Aero participates in, <strong>Volvo</strong> pays in certain cases an entrancefee to participate. <strong>The</strong>se entrance fees are capitalized as intangibleassets.Depreciation, amortization and impairmentDepreciation is made on a straight-line basis based on the acquisitionvalue of the assets, adjusted in appropriate cases by write-downs, andestimated useful lives. Depreciation is reported in the respective functionto which it belongs. Impairment tests for depreciable non-currentassets are performed if there are indications of impairment at the balancesheet date.Goodwill is reported as an intangible non-current asset withindefin ite useful life. For non-depreciable non-current assets such asgoodwill, impairment tests are performed annually, as well as if thereare indications of impairments during the year, through calculation ofthe asset’s recovery value. If the calculated recovery value is less thanthe carrying value, a write-down is made to the asset’s recovery value.See note 14 for goodwill.Depreciation periodsCapitalized type-specific tools 2 to 8 yearsOperational leases 3 to 5 yearsMachinery 5 to 20 yearsBuildings and Investment property 25 to 50 yearsLand improvements 20 yearsTrademarks 20 yearsDistribution networks 10 yearsProduct and software development 3 to 8 yearsAircraft engine projects20 yearsNon-current assets held for sale and discontinued operations<strong>Volvo</strong> applies IFRS 5, Non-current Assets Held for Sale and DiscontinuedOperations. <strong>The</strong> standard also includes current assets. In aglobal group like <strong>Volvo</strong>, processes are continuously ongoing regardingthe sale of assets or groups of assets at minor values. In cases inwhich the criteria for being classified as a non-current asset held forsale are fulfilled and the asset or group of assets is not of minor value,the asset or group of assets and the related liabilities are reported ona separate line in the balance sheet. <strong>The</strong> asset or group of assets aretested for impairment and, if impaired valued at fair value after deductionfor selling expenses. <strong>The</strong> balance sheet items and the incomeeffect resulting from the revaluation to fair value less costs to sell arenormally reported in the segment <strong>Group</strong> headquarter functions andother, until the sale is completed and the result from it is assigned tothe other segments.InventoriesInventories are reported at the lower of cost, in accordance with thefirst-in, first-out method (FIFO), or net realizable value. <strong>The</strong> acquisitionvalue is based on the standard cost method, including costs for alldirect manufacturing expenses and the apportionable share of thecapacity and other related manufacturing costs. <strong>The</strong> standard costsare tested regularly and adjustments are made based on current conditions.Costs for research and development, selling, administrationand financial expenses are not included. Net realizable value is calculatedas the selling price less costs attributable to the sale.Share-based payments<strong>Volvo</strong> applies IFRS 2, Share-based Payments for share-based incentiveprograms. IFRS 2 distinguishes between “cash-settled” and“equity-settled”, in <strong>Volvo</strong>’s case, shares. <strong>The</strong> <strong>Volvo</strong> program includesboth a cash-settled and an equity-settled part, however this is notapplicable for <strong>2010</strong> as there were no program in <strong>2010</strong>. <strong>The</strong> value ofthe equity-settled payments is determined at the grant-date, recognizedas an expense during the vesting period and off-set in equity.<strong>The</strong> fair value is calculated according to share price reduced by dividendconnected to the share before the allotment. <strong>The</strong> additionalsocial costs are reported as a liability, revalued at each balance sheetdate in accordance with UFR 7, issued by the Swedish Financial<strong>Report</strong>ing Board. <strong>The</strong> cash-settled payment is revalued at each balancesheet day and is reported as an expense during the vestingperiod and as a short term liability. An assessment whether the termsfor allotment will be fulfilled is made continuously. If the assessmentchanges, the expense will be adjusted. See note 34.ProvisionsProvisions are reported on balance when a legal or constructive obligationexists as a result of a past event and it is probable that anoutflow of resources will be required to settle the obligation and theamount can be reliably estimated.74
Pensions and similar obligations (Post-employment benefits)<strong>Volvo</strong> applies IAS 19, Employee Benefits, for pensions and similarobligations. In accordance with IAS 19, actuarial calculations shouldbe made for all defined-benefit plans in order to determine the presentvalue of obligations for benefits vested by its current and formeremployees. <strong>The</strong> actuarial calculations are prepared annually and arebased upon actuarial assumptions that are determined close to thebalance sheet date each year. Changes in the present value of obligationsdue to revised actuarial assumptions and experience adjustmentsare treated as actuarial gains or losses. <strong>The</strong>se are amortizedaccording to function over the employees’ average remaining serviceperiod to the extent they exceed the corridor value for each plan.Deviations between expected return on plan assets and actualreturn are also treated as actuarial gains or losses. Provisions forpost-employment benefits in <strong>Volvo</strong>’s balance sheet correspond to thepresent value of obligations at year-end, less fair value of plan assets,unrecognized actuarial gains or losses and unrecognized unvestedpast service costs. See note 24.As a supplement to IAS 19, <strong>Volvo</strong> applies UFR 4, in accordance withthe recommendation from the Swedish Financial <strong>Report</strong>ing Board incalculating the Swedish pension liabilities.For defined contribution plans premiums are expensed as incurredover the income statement according to function.Provisions for residual value risksResidual value risks are attributable to operating lease contracts orsales transactions combined with buy-back agreements or residualvalue guarantees. Residual value risks are the risks that <strong>Volvo</strong> in thefuture would have to dispose used products at a loss if the price developmentof these products is worse than what was expected when thecontracts were entered. Provisions for residual value risks are madeon a continuing basis based upon estimations of the used products’future net realizable values. <strong>The</strong> estimations of future net realizablevalues are made with consideration to current prices, expected futureprice development, expected inventory turnover period and expecteddirect and indirect selling expenses. If the residual value risks pertainto products that are reported as tangible assets in <strong>Volvo</strong>’s balancesheet, these risks are reflected by depreciation or write-down of thecarrying value of these assets. If the residual value risks pertain toproducts, which are not reported as assets in <strong>Volvo</strong>’s balance sheet,these risks are reflected under the line item current provisions.Contingent liabilitiesA contingent liability is reported for a possible obligation, for which itis not yet confirmed that a present obligation exists that could lead toan outflow of resources; or for a present obligation that does not meetthe definitions of a provision or a liability as it is not probable that anoutflow of resources will be required to settle the obligation or when asufficiently reliable estimate of the amount cannot be made.Warranty expensesEstimated costs for product warranties are charged to operatingexpenses when the products are sold. Estimated costs include bothexpected contractual warranty obligations as well as expected goodwillwarranty obligations. Estimated costs are determined based uponhistorical statistics with consideration of known changes in productquality, repair costs or similar. Costs for campaigns in connection withspecific quality problems are charged to operating expenses when thecampaign is decided and announced.Restructuring costsRestructuring costs are reported as a separate line item in the incomestatement if they relate to a considerable change of the <strong>Group</strong> structure.Other restructuring costs are included in Other operating incomeand expenses. A provision for decided restructuring measures isreported when a detailed plan for the implementation of the measuresis complete and when this plan is communicated to those who areaffected.Income taxesTax legislation in Sweden and other countries sometimes containsrules other than those identified with generally accepted accountingprinciples, pertaining to the timing of taxation and measurement ofcertain commercial transactions. Deferred taxes are reported on differencesthat arise between the taxable value and reported value ofassets and liabilities (temporary differences) as well as on tax-losscarryforwards. However, with regard to the valuation of deferred taxassets, that is, the value of future tax reductions, these items are recognizedprovided that it is probable that the amounts can be utilizedagainst future taxable income.Deferred taxes on temporary differences on participations in subsidiariesand associated companies are only reported when it is probablethat the difference will be recovered in the near future.Tax laws in Sweden and certain other countries allow companies todefer payment of taxes through allocations to untaxed reserves.<strong>The</strong>se items are treated as temporary differences in the consolidatedbalance sheet, that is, a split is made between deferred tax liabilityand equity capital. In the consolidated income statement an allocationto, or withdrawal from, untaxed reserves is divided between deferredtaxes and net income for the year.Cash-flow statement<strong>The</strong> cash-flow statement is prepared in accordance with IAS 7, Cashflow statement, indirect method. <strong>The</strong> cash-flow statements of foreign<strong>Group</strong> companies are translated at the average rate. Changes in<strong>Group</strong> structure, acquisitions and divestments, are reported net,excluding cash and cash equivalents, in the item Acquisition anddivestment of subsidiaries and other business units and are includedin cash flow from Investing activities.Cash and cash equivalents include cash, bank balances and partsof marketable securities, with date of maturity within three months atthe time for investment. Marketable securities comprise interestbearingsecurities, the majority of which with terms exceeding threemonths. However, these securities have high liquidity and can easilybe converted to cash. In accordance with IAS 7, certain investment inmarketable securities are excluded from the definition of cash andcash equivalents in the cash-flow statement if the date of maturity ofsuch instruments is later than three months after the investment wasmade.Earnings per shareEarnings per share are calculated as the income for the period attributedto the shareholders of the Parent Company, divided with theaverage number of outstanding shares per reporting period. To calculatethe diluted earnings per share, the average number of shares inthe denominator is adjusted with the average number of shares thatwould be issued as an effect of ongoing share-based incentive programsthat have been exercised or cancelled during the period. Seenote 23.75
Financial information <strong>2010</strong>Notes to consolidated financial statementsNote 2 Key sources of estimation uncertainty<strong>Volvo</strong>’s significant accounting principles are set out in note 1, AccountingPrinciples and conform to IFRS as endorsed by the EU. <strong>The</strong> preparationof <strong>Volvo</strong>’s Consolidated Financial Statements requires the use ofestimates, judgements and assumptions that affect the reportedamounts of assets, liabilities and provisions at the date of the financialstatements and the reported amounts of sales and expenses duringthe periods presented. In preparing these financial statements, <strong>Volvo</strong>’smanagement has made its best estimates and judgements ofcertain amounts included in the financial statements, giving due considerationto materiality. <strong>The</strong> application of these accounting principlesinvolves the exercise of judgement and use of assumptions asfuture uncertainties and accordingly actual results could differ fromthese estimates. In accordance with IAS 1, preparers are required toprovide additional disclosure of accounting principles in which estimates,judgments and assumptions are particularly sensitive andwhich, if actual results are different, may have a material impact on thefinancial statements. <strong>The</strong> accounting principles applied by <strong>Volvo</strong> thatare deemed to meet these criteria are discussed below.Impairment of goodwill, other intangible assetsand other non-current assetsProperty, plant and equipment, intangible assets other than goodwill,and certain other non-current assets are amortized and depreciatedover their useful lives. Useful lives are based on management’s estimatesof the period that the assets will generate revenue. If, at thedate of the financial statements, there is any indication that a tangibleor intangible non-current asset has been impaired, the recoverableamount of the asset should be estimated. <strong>The</strong> recoverable amount isthe higher of the asset’s net selling price and its value in use, estimatedwith reference to management’s projections of future cashflows. If the recoverable amount of the asset is less than the carryingamount, an impairment loss is recognized and the carrying amount ofthe asset is reduced to the recoverable amount. Determination of therecoverable amount is based upon management’s projections offuture cash flows, which are generally made by use of internal businessplans or forecasts. While management believes that estimates offuture cash flows are reasonable, different assumptions regardingsuch cash flows could materially affect valuations. Intangible and tangiblenon-current assets amounted to 114,603 (117,296 ) whereof22,936 (23,827) represents goodwill. For Goodwill and certain otherintangible assets with indefinite useful lives, an annual, or more frequentlyif necessary, impairment review is performed. Such an impairmentreview will require management to determine the fair value of<strong>Volvo</strong>’s cash generating units, on the basis of projected cash flowsand internal business plans and forecasts. Overvalues differ betweenthe business areas and they are, to a varying degree, sensitive tochanges in the business environment. <strong>Volvo</strong> has since 2002 performeda similar impairment review. No impairment charges wererequired for the period 2002 until <strong>2010</strong>. See note 14 for the allocationand impairment tests of goodwill.Revenue recognitionRevenue from the sale of products is recognized when significantrisks and rewards of ownership have been transferred to externalparties, normally when the products are delivered to the customers. If,however, the sale of products is combined with a buy-back agreementor a residual value guarantee, as described below regarding residualvalue risks, the sale is accounted for as an operating lease transactionunder the condition that significant risks of the products are retainedby <strong>Volvo</strong>. In certain cases <strong>Volvo</strong> enters into a buy-back agreement orresidual value guarantee after <strong>Volvo</strong> has sold the product to an independentparty or in combination with an undertaking from the customerthat in the event of a buy-back to purchase a new <strong>Volvo</strong> product.In such cases, there may be a question of judgement regardingwhether or not significant risks and rewards of ownership have beentransferred to the customer. If it is determined that such an assessmentwas incorrect, <strong>Volvo</strong>’s reported revenue and income for theperiod will decline and instead be distributed over several reportingperiods.Residual value risksIn the course of its operations, <strong>Volvo</strong> is exposed to residual value risksthrough operating lease agreements and sales combined with repurchaseagreements. Residual value commitments amount to SEK13,339 (14,954) at December 31, <strong>2010</strong>. Residual value risks arereflected in different ways in the <strong>Volvo</strong> consolidated financial statementsdepending on the extent to which the risk remains with <strong>Volvo</strong>.In cases where significant risks pertaining to the product remainwith <strong>Volvo</strong>, the products, primarily trucks, are generally recognized inthe balance sheet as assets under operating leases. Depreciationexpenses for these products are charged on a straight-line basis overthe term of the commitment in amounts required to reduce the valueof the product to its estimated net realizable value at the end of thecommitment. <strong>The</strong> estimated net realizable value of the products at theend of the commitments is monitored individually on a continuingbasis. A decline in prices for used trucks and construction equipmentmay negatively affect the consolidated operating income. High inventoriesin the truck industry and the construction equipment industryand low demand may have a negative impact on the prices of new andused trucks and construction equipment. In monitoring estimated netrealizable value of each product under a residual value commitment,management makes consideration of current price-level of the usedproduct model, value of options, mileage, condition, future pricede terioration due to expected change of market conditions, alternativedistribution channels, inventory lead-time, repair and reconditioningcosts, handling costs and overhead costs in the used product divisions.Additional depreciations and estimated impairment losses areimmediately charged to income.<strong>The</strong> total risk exposure for assets under operating lease is reported ascurrent and non-current residual value liabilities. See notes 26 and 27.If the residual value risk commitment is not significant, independentfrom the sale transaction or in combination with a commitment fromthe customer to buy a new <strong>Volvo</strong> product in connection to a buy-backoption, the asset is not recognized on balance. Instead, the riskex posure is reported as a residual value provision equivalent to theestimated residual value risk. See note 25.To the extent the residual value exposure does not meet the definitionof a provision, the remaining residual value risk exposure isreported as a contingent liability. See note 29.Deferred taxesUnder IFRS, deferred taxes are recognized for temporary differences,which arise between the taxable value and reported value of assetsand liabilities as well as for unutilized tax-loss carryforwards. <strong>Volvo</strong>records valuation allowances for deferred tax assets where managementdoes not expect such assets to be realized based upon currentforecasts. In the event that actual results differ from these estimatesor adjustments are made to future periods in these estimates, changes76
in the valuation allowance may be needed that could materially impactthe financial position and the income for the period. At December 31,<strong>2010</strong>, the valuation allowance amounted to 339 (296) for the value ofdeferred tax assets. Net of this valuation allowance, deferred taxassets of 20,109 (21,533 ) were recognized in the <strong>Group</strong>’s balancesheet.<strong>Volvo</strong> has significant tax-loss carryforwards which are related tocountries with long or indefinite periods of utilization, mainly Swedenand France. Of the total deferred tax asset for loss carryforwards7,327 (8,939), an amount of 3,665 (4,653) relates to Sweden withindefinite time of utilization. <strong>Volvo</strong> considers it to be most certain thatthe <strong>Volvo</strong> <strong>Group</strong> will be able to generate sufficient income in the comingyears to utilize the tax-loss carryforwards.Inventory obsolescenceInventories are reported at the lower of cost, in accordance with thefirst-in, first-out method (FIFO), and net realizable value. <strong>The</strong> estimatednet realizable value includes management consideration ofoutdated articles, over-stocking, physical damages, inventory leadtime,handling and other selling costs. If the estimated net realizablevalue is lower than cost, a valuation allowance is established for inventoryobsolescence. <strong>The</strong> total inventory value, net of inventory obsolescenceallowance, is per December 31, <strong>2010</strong>, 39,837 (37,727).Credit loss reserves<strong>The</strong> establishment of credit loss reserves on customer financingreceivables is dependent on estimates including assumptions regardingpast dues, repossession rates and the recovery rate on the underlyingcollaterals. At December 31, <strong>2010</strong>, the total credit loss reserves in thesegment Customer Finance segment amounted to 1.69% (1.67) ofthe total credit portfolio in the segment. See note 36 for a descriptionof the credit risk.Pensions and other post-employment benefitsProvisions and costs for post-employment benefits, mainly pensionsand health-care benefits, are dependent on assumptions used byactuaries in calculating such amounts. <strong>The</strong> appropriate assumptionsand actuarial calculations are made separately for the respectivecountries of <strong>Volvo</strong>’s operations which result in obligations for postemploymentbenefits. <strong>The</strong> assumptions include discount rates, healthcare cost trends rates, inflation, salary growth, long-term return onplan assets, retirement rates, mortality rates and other factors. <strong>Volvo</strong>’sassumptions regarding discount rate are presented in note 24. Healthcare cost trend assumptions are based on historical cost data, thenear-term outlook, and an assessment of likely long-term trends. Inflationassumptions are based on an evaluation of external market indicators.<strong>The</strong> salary growth assumptions reflect the long-term actualexperience, the near-term outlook and assumed inflation. Retirementand mortality rates are based primarily on officially available mortalitystatistics. <strong>The</strong> actuarial assumptions are reviewed on an annual basisand modifications are made to them when it is deemed appropriate todo so. Actual results that differ from management’s assumptions areaccumulated and amortized over future periods. See Note 24 for moreinformation regarding costs and assumptions for post-employmentbenefits. At December 31, <strong>2010</strong> net provisions for post-employmentbenefits amounted to 5,862 (6,002).Product warranty costsEstimated costs for product warranties are charged to cost of saleswhen the products are sold. Estimated warranty costs include contractualwarranty and goodwill warranty (warranty cover in excess ofcontractual warranty or campaigns which is accepted as a matter ofpolicy or normal practice in order to maintain a good business relationwith the customer). Warranty provisions are estimated with considerationof historical claims statistics, the warranty period, the average time-lagbetween faults occurring and claims to the company and anticipatedchanges in quality indexes. Differences between actual warrantyclaims and the estimated claims generally affect the recognizedexpense and provisions in future periods. Refunds from sup pliers, thatdecrease <strong>Volvo</strong>’s warranty costs, are recognized to the extent theseare considered to be certain. At December 31, <strong>2010</strong> warranty costprovisions amounted to 7,841 (7,947).Legal proceedings<strong>Volvo</strong> recognizes obligations in the <strong>Group</strong> accounts as provisions orother liabilities only in cases where <strong>Volvo</strong> has a present obligationfrom a past event, where a financial responsibility is probable and<strong>Volvo</strong> can make a reliable estimate of the size of the amount. Ininstances where these criteria are not met, a contingent liability maybe disclosed in the notes to the accounts.<strong>Volvo</strong> regularly reviews the development of significant outstandinglegal disputes in which <strong>Group</strong> companies are parties, both civil lawand tax disputes, in order to assess the need for provisions and contingentliabilities in the financial statements. Among the factors that<strong>Volvo</strong> considers in making decisions on provisions and contingentliabilities are the nature of the dispute, the amount claimed, theprogress of the case, the opinions or views of legal counsels and otheradvisers, experience in similar cases, and any decision of <strong>Volvo</strong>’s managementas to how <strong>Volvo</strong> intends to handle the dispute. <strong>The</strong> actualoutcome of a legal dispute may deviate from the expected outcome ofthe dispute. <strong>The</strong> difference between actual and expected outcome ofa dispute might materially affect future financial statements, with anadverse impact upon the <strong>Group</strong>’s results of operation, financial positionand liquidity. See note 29 for the <strong>Volvo</strong> <strong>Group</strong>’s gross exposure tocontingent liabilities.Note 3 Change of accounting principlesNew accounting principles in <strong>2010</strong><strong>The</strong> following new accounting principles are effective from January 1,<strong>2010</strong> and have been applied by the <strong>Volvo</strong> <strong>Group</strong> unless stated otherwise:Revised IFRS 3 Business combinations<strong>The</strong> standard became effective on July 1, 2009 and applies to fiscalyears beginning on or after that date. <strong>The</strong> standard entails changes tothe reporting of future acquisitions regarding for example the accountingof transaction costs, any contingent considerations and stepacquisitions. <strong>The</strong> <strong>Group</strong> applies the amendment as of January 1,<strong>2010</strong>. <strong>The</strong> application affects the accounting for business combinationsmade from the application date. Capitalized transaction costsof 135 relating to ongoing acquisition projects is transferred to equityby <strong>Volvo</strong>.77
Financial information <strong>2010</strong>Notes to consolidated financial statementsIAS 27 amendment Consolidated and separate financial statements<strong>The</strong> standard became effective on July 1, 2009, as a consequence ofthe revised IFRS 3, and applies to fiscal years beginning on or afterthat date. <strong>The</strong> amendment brings about changes in IAS 27 regarding,for example, how to report changes in ownership in cases where theParent Company retains or loses the control of the owned entity. <strong>The</strong><strong>Group</strong> applies the amendment as of January 1, <strong>2010</strong>. <strong>The</strong> applicationprospectively affects the accounting for changes in share ownershipmade from the application date.In addition to the above-mentioned, the below amendments tostandards and new interpretations from IFRIC have been applicablefor the <strong>Volvo</strong> <strong>Group</strong> from January 1, <strong>2010</strong>, but have not had a significantimpact on the <strong>Group</strong>’s financial statements during the year.– IAS 39 amendment Financial instruments: Recognition and Measurement:Eligible hedge items– IFRS 1 amendments Additional exemptions for first-time adopters– IFRIC 16 Hedges of a net investment in a foreign operation– IFRIC 17 Distribution of non-cash assets to owners– IFRIC 18 Transfers of assets from customers– Revised IFRS 1 First time adoption of IFRS– IFRIC 9 and IAS 39 amendment Embedded derivatives– IFRS 2 amendment <strong>Group</strong> Cash-settled Share-based PaymentTransactions– IFRS 1 amendments Limited exemption from comparative IFRS 7Disclosures for First-time Adopters– <strong>Annual</strong> improvementsNew accounting principles 2011 and laterWhen preparing the consolidated accounts as of December 31, <strong>2010</strong>,a number of standards and interpretations have been published, buthave not yet become effective. <strong>The</strong> following is a preliminary assessmentof the effect that the implementation of these standards andstatements could have on the <strong>Volvo</strong> <strong>Group</strong>’s financial statements.IFRS 9 Financial instruments*IFRS 9 Financial instruments has been published in three parts:classification and Measurement, Impairment and Hedge accounting,which will replace IAS 39 with effective date January 1, 2013 or later.Earlier adoption is permitted given endorsement. <strong>Volvo</strong> is currentlyreviewing the effects implementation of IFRS 9 will have on the <strong>Group</strong>.When all three parts of the project are completed a common standpointwill be given.In addition to the above-mentioned, the below amendments tostandards and interpretations from IFRIC are applicable for the <strong>Volvo</strong><strong>Group</strong> from January 1, 2011 or later, but are not expected to have asignificant impact on the <strong>Group</strong>’s financial statements.– IFRS 7 Amendments Financial Instruments: Disclosures– IFRIC 14 <strong>The</strong> limit on a defined benefit asset, minimum fundingrequirements and their interaction– IFRIC 19 Extinguishing Financial Liabilities with Equity Instruments– IFRIC 12 Service Concession Arrangements– Revised IAS 24 Related Party Disclosures– IAS 32 amendment Classification of rights issues– <strong>Annual</strong> improvements*<strong>The</strong>se standards/interpretations have not been adopted by the EU at the publicationof the annual report. Accordingly, stated dates for adoption may changeas a consequence of decisions within the EU endorsement process.Note 4 Acquisitions and divestments of shares in subsidiariesAB <strong>Volvo</strong>’s holding of shares in subsidiaries as of December 31, <strong>2010</strong>is shown in the disclosures of AB <strong>Volvo</strong>’s holding of shares. Significantacquisitions, formations and divestments within the <strong>Group</strong> are listedbelow.Acquisitions<strong>The</strong> <strong>Volvo</strong> <strong>Group</strong> has not made any acquisitions during 2009 and<strong>2010</strong> which solely or jointly have had a significant impact on the <strong>Volvo</strong><strong>Group</strong>’s financial statements.Valuation of acquisitionsFor acquisitions in 2009 and <strong>2010</strong>, the fair-value adjustments to thepurchase price allocations have not been significant for the <strong>Volvo</strong><strong>Group</strong>. <strong>The</strong> effects on the <strong>Volvo</strong> <strong>Group</strong>’s balance sheet and cash-flowstatement in connection with the acquisition of subsidiaries and otherbusiness units are specified in the following table based on valuationson the respective acquisition dates:78
Acquisitions 2009 <strong>2010</strong>Intangible assets 3 0Property, plant and equipment 4 32Assets under operating lease 19 468Inventories 20 56Current receivables 2 99Cash and cash equivalents 0 15Other assets 9 12Minority interests 0 20Provisions 6 (22)Loans 0 (374)Liabilities (48) (143)15 163Goodwill 41 52Acquired net assets 56 215Cash and cash equivalents paid (56) (229)Cash and cash equivalents accordingto acquisition analysis 0 15Effect on <strong>Group</strong> cashand cash equivalents (56) (214)Acquisitions after the end of the period<strong>Volvo</strong> has not made any acquisitions after the end of the period thathave had a significant impact on the <strong>Volvo</strong> <strong>Group</strong>.Divestments<strong>The</strong> divestment of <strong>Volvo</strong> Aero’s US subsidiary, <strong>Volvo</strong> Aero Services,was completed in the beginning of October. A total of SEK 515 M hasnegatively affected <strong>Volvo</strong> <strong>Group</strong>’s operating result, of which SEK368 M was reported in 2009. As a consequence of the <strong>Group</strong>’saccounting principles described in note 1 the same transactionaffected <strong>Volvo</strong> Aero’s operating result negatively by SEK 538 M. <strong>The</strong>sale of VAS is due to <strong>Volvo</strong> Aero’s strategy of focusing on its coreoperations of developing and manufacturing components for aircraftengines, combined with the goal of reducing the company’s tied-upcapital.In May <strong>Volvo</strong> CE sold its Russian distribution network with assetsamounting to SEK 200 M, the transaction had a minor effect on <strong>Volvo</strong>’sresult. In July <strong>Volvo</strong> CE sold its Turkish distribution network with assetsand liabilities of SEK 232 M and SEK 36 M, respectively, classified asassets held for sale. <strong>The</strong> transaction had a positive impact on the<strong>Group</strong>’s operating income of SEK 107 M.<strong>The</strong> effects on the <strong>Volvo</strong> <strong>Group</strong>’s balance sheet and cash-flow statementin connection with the divestment of subsidiaries and other businessunits are specified in the following table:Divestments 2009 <strong>2010</strong>Intangible assets (3) 0Property, plant and equipment (59) (32)Assets under operating lease (42) (190)Shares and participations 65 0Inventories (280) (1,096)Other receivables (112) (334)Cash and cash equivalents (116) (176)Provisions 80 (10)Other liabilities 254 540(213) (1,298)Goodwill 0 (122)Divested net assets (213) (1,420)Cash and cash equivalents received 321 1,007Cash and cash equivalents, divested companies (116) (176)Effect on <strong>Group</strong> cash and cash equivalents 205 831Assets and liabilities held for saleAt the end of <strong>2010</strong> the <strong>Volvo</strong> <strong>Group</strong> reports assets amounting to 136and liabilities amounting to 135 as assets and liabilities held for sale.Depending on the progress with the sales process, changes in thebusiness environment, access to liquidity, market outlook, etc. the fairvalue of remaining assets held for sale may change in the forthcomingperiods or when the transactions are finalized. Reclassified assetsand liabilities pertain to smaller operations. For the comparison year2009, the <strong>Volvo</strong> <strong>Group</strong> reported assets amounting to 1,692 and liabilitiesto 272 as assets and liabilities classified as held for sale.Assets and liabilities held for sale 2009 <strong>2010</strong>Intangible assets 54 0Tangible assets 618 43Inventories 776 8Accounts receivable 109 56Other current receivables 111 24Other assets 24 5Total assets 1,692 136Trade payables 108 31Other current liabilities 164 104Total liabilities 272 13579
Financial information <strong>2010</strong>Notes to consolidated financial statementsNote 5 Joint venturesJoint ventures are companies over which <strong>Volvo</strong> has joint controltogether with one or more external parties. Joint ventures are reportedby applying the proportionate consolidation method, in accordancewith IAS 31 Joint ventures. <strong>Group</strong> holdings of shares in joint venturesare listed below.Dec 31, <strong>2010</strong>HoldingShares in joint venturespercentageShanghai Sunwin Bus Corp., China 50Xian Silver Bus Corp., China 50Dong Feng Nissan Diesel Motor Co., Ltd., China 50VE Commercial Vehicles, Ltd., India 50 11 Direct and indirect ownership.<strong>Volvo</strong>’s share of joint ventures’ incomestatements 2009 <strong>2010</strong>Net sales 3,171 4,178Operating income (12) 127Income after financial items 25 169Income taxes (9) (66)<strong>Volvo</strong>’s share of income for the period 16 103<strong>Volvo</strong>’s share of joint ventures’balance sheetsDec 31,2009Dec 31,<strong>2010</strong>Non-current assets 2,019 1,932Current assets 2,141 2,206Total assets 4,160 4,138Shareholders’ equity 2,598 2,627Provisions 286 294Long-term liabilities 23 12Current liabilities 1,253 1,205Total shareholders’ equity and liabilities 4,160 4,138At the end of <strong>2010</strong> guarantees amounting to 78 (80) were issued forthe benefit of joint ventures by AB <strong>Volvo</strong>. At the same date <strong>Volvo</strong>’sshare of contingent liabilities issued by its joint ventures amounted to46 (29).Number ofemployees2009 <strong>2010</strong>of whichwomen, %Number ofemployeesof whichwomen, %<strong>Volvo</strong>’s share of total number of employeesShanghai Sunwin Bus Corp. 458 17 455 16Xian Silver Bus Corp. 172 17 144 21Dong Feng Nissan Diesel Motor Co., Ltd. 138 12 141 14VE Commercial Vehicles, Ltd. 1,363 2 1,479 1<strong>Volvo</strong>’s share of total number of employees 2,131 7 2,219 7Note 6 Associated companies<strong>The</strong> following table presents summarized financial information for the associated companies partly owned by <strong>Volvo</strong>. <strong>Volvo</strong> consolidates theassociated companies according to the equity method. <strong>The</strong> income statement and balance sheet below reflects the total associated companies,not only the part consolidated by <strong>Volvo</strong>. For more information about <strong>Volvo</strong>’s shareholding, see notes 9 and 15.Income statement data 2009 <strong>2010</strong>Net sales 4,027 3,794Cost of sales (3,991) (3,840)Financial income and expense (7) (32)Income before taxes 29 (78)Income taxes (28) (46)Income of the period 1 (124)Dec 31,2009Dec 31,<strong>2010</strong>Balance sheet dataNon-current assets 1,471 2,085Current assets 1,353 1,558Total assets 2,824 3,643Shareholders’ equity 1,322 1,686Provisions 59 61Long-term liabilities 57 452Current liabilities 1,386 1,444Total shareholders’ equity and liabilities 2,824 3,64380
Note 7 Segment reporting<strong>Report</strong>ing by business segment<strong>The</strong> <strong>Volvo</strong> <strong>Group</strong>’s operations are organized in nine business areas:<strong>Volvo</strong> Trucks, Renault Trucks, North American Trucks, Trucks Asia,Buses, Construction Equipment, <strong>Volvo</strong> Penta, <strong>Volvo</strong> Aero and CustomerFinance. In addition to the nine business areas, there are other operationsconsisting mainly of business units that are designed to supportthe business areas’ operations. <strong>The</strong> business units include <strong>Volvo</strong>Power train, <strong>Volvo</strong> 3P, <strong>Volvo</strong> IT, <strong>Volvo</strong> Logistics and <strong>Volvo</strong> Parts. As thefour truck brands share product development, production and otheractivities in business units such as <strong>Volvo</strong> 3P and <strong>Volvo</strong> Powertrain andalso share certain infrastructure in distribution such as dealers, the fourtruck brands are reported as one aggregated business segment. <strong>The</strong><strong>Volvo</strong> <strong>Group</strong> is thus reported divided in six segments in which net salesand operating income are reported for each product area.Each business area, except for Customer Finance, has total responsibilityfor its operating income, operating capital and operating cashflow. <strong>Volvo</strong> Financial Services within Customer Finance has responsibilityfor its net income and total balance sheet within certain restrictionsand principles that are established centrally. <strong>The</strong> supervision and coordinationof treasury and tax matters is organized centrally to obtain thebenefits of a <strong>Group</strong>-wide approach. <strong>The</strong> legal structure of the <strong>Volvo</strong><strong>Group</strong> is based on optimal handling of treasury, tax and administrativematters and, accordingly, differs from the operating structure.<strong>The</strong> business units are designated to support the business areas andare therefore not reportable business segments. <strong>The</strong> results from thesynergies created in the business units are transferred back to the variousproduct areas. <strong>The</strong> allocation is based on the degree to which individualproduct areas have utilized the services of the business units. <strong>The</strong>heading Other contains mainly earnings linked to corporate functionsincluding the <strong>Group</strong>’s treasury operations. <strong>The</strong> <strong>Group</strong>’s real estate, heldin <strong>Volvo</strong> <strong>Group</strong> Real Estate, is reported under industrial operations, andearnings are transferred back to the business areas.<strong>Report</strong>ed segment information is based on the information usedinternally by the chief operating decision maker, which in <strong>Volvo</strong> is the<strong>Volvo</strong> <strong>Group</strong> Executive Committee.Net sales 2009 <strong>2010</strong>Trucks 138,940 167,305Construction Equipment 35,658 53,810Buses 18,465 20,516<strong>Volvo</strong> Penta 8,159 8,716<strong>Volvo</strong> Aero 7,803 7,708Other and eliminations (538) (680)Industrial Operations 208,487 257,375Customer Finance 11,712 9,031Reclassifications and eliminations (1,838) (1,657)<strong>Volvo</strong> <strong>Group</strong> 218,361 264,749<strong>The</strong> above sales figures include internal sales in the following amounts:Net sales to <strong>Group</strong> companies 2009 <strong>2010</strong>Trucks 1,558 1,421Construction Equipment 234 347Buses 461 490<strong>Volvo</strong> Penta 87 129<strong>Volvo</strong> Aero 37 21Other and eliminations (782) (984)Industrial Operations 1,595 1,424Customer Finance 243 231Eliminations (1,838) (1,655)<strong>Volvo</strong> <strong>Group</strong> 0 0Internal sales between business areas are generally made at standardcost of sales, including calculated interest and product improvementexpenses. Internal sales from service companies are generally madeat market prices.Operating income 2009 <strong>2010</strong>Trucks (10,805) 10,112Construction Equipment (4,005) 6,180Buses (350) 780<strong>Volvo</strong> Penta (230) 578<strong>Volvo</strong> Aero 50 286Other (994) (102)Industrial Operations (16,333) 17,834Customer Finance (680) 167<strong>Volvo</strong> <strong>Group</strong> (17,013) 18,000Depreciation and amortization 2009 <strong>2010</strong>Trucks 9,618 8,721Construction Equipment 2,036 1,975Buses 555 464<strong>Volvo</strong> Penta 515 453<strong>Volvo</strong> Aero 435 436Other (777) (710)Industrial Operations 12,382 11,338Customer Finance 2,845 2,454<strong>Volvo</strong> <strong>Group</strong> total 1 15,227 13,7921 Of which write-down 33 (221).Research and developmentexpenses 2009 <strong>2010</strong>Trucks 9,525 9,230Construction Equipment 1,982 1,972Buses 918 882<strong>Volvo</strong> Penta 665 670<strong>Volvo</strong> Aero 170 156Other (67) 60<strong>Volvo</strong> <strong>Group</strong> total 13,193 12,97081
Financial information <strong>2010</strong>Notes to consolidated financial statementsIncome from investments inassociated companies 2009 <strong>2010</strong>Trucks (22) 8Construction Equipment 0 0Buses 12 15<strong>Volvo</strong> Penta 0 0<strong>Volvo</strong> Aero 0 0Other (5) (109)Industrial Operations (15) (86)Customer Finance 1 0<strong>Volvo</strong> <strong>Group</strong> total (14) (86)Total assets 2009 <strong>2010</strong>Operating assets, Industrial Operations 1 :Trucks 112,157 114,305Construction Equipment 40,454 43,309Buses 12,462 11,565<strong>Volvo</strong> Penta 5,444 4,870<strong>Volvo</strong> Aero 11,326 9,881Other 936 2,051Total operating assetsIndustrial Operations 182,779 185,981Interest-bearing financial assets 45,422 42,645Tax receivables 13,639 13,064Total assets in Customer Finance 98,772 89,246Other and eliminations (8,347) (12,929)<strong>Volvo</strong> <strong>Group</strong> total 332,265 318,0071 Defined as total assets less interest-bearing financial assets and taxreceivables.Total shareholders’ equityand liabilities 2009 <strong>2010</strong>Operating liabilities, Industrial Operations 1 :Trucks 62,003 69,174Construction Equipment 14,756 18,697Buses 7,572 7,762<strong>Volvo</strong> Penta 2,967 2,519<strong>Volvo</strong> Aero 4,152 3,517Other 400 1,259Total operating liabilitiesIndustrial Operations 91,850 102,928Financial liabilities 86,911 67,335Tax liabilities 2,861 4,702Total liabilities in Customer Finance 90,223 81,226Other and eliminations (6,614) (12,305)Total liabilities 265,231 243,886Shareholders’ equity 67,034 74,121<strong>Volvo</strong> <strong>Group</strong> total 332,265 318,0071 Defined as total liabilities less shareholders’ equity, financial liabilities andtax liabilities.Investments in associated companies 2009 <strong>2010</strong>Trucks 217 241Construction Equipment – –Buses 51 46<strong>Volvo</strong> Penta – –<strong>Volvo</strong> Aero 1 1Customer Finance 19 18Other 300 378<strong>Volvo</strong> <strong>Group</strong> total 588 684Capital expenditures 2009 <strong>2010</strong>Trucks 7,272 7,650Construction Equipment 1,307 1,555Buses 639 343<strong>Volvo</strong> Penta 687 331<strong>Volvo</strong> Aero 533 734Other 104 30Industrial Operations 10,542 10,643Customer Finance 4,102 4,600Eliminations (71) (38)<strong>Volvo</strong> <strong>Group</strong> total 14,573 15,205<strong>Report</strong>ing by marketNet sales 2009 <strong>2010</strong>Europe 99,518 102,947North America 40,223 47,922South America 17,613 29,013Asia 45,273 65,487Other markets 15,734 19,380<strong>Volvo</strong> <strong>Group</strong> total* 218,361 264,749*of which:Sweden 10,412 12,463United States 31,243 35,752France 25,344 24,457Total assets 2009 <strong>2010</strong>Sweden 77,528 73,806Europe excluding Sweden 105,265 86,645North America 60,223 53,683South America 20,322 23,442Asia 60,286 72,481Other markets 8,641 7,950<strong>Volvo</strong> <strong>Group</strong> total 332,265 318,007Capital expenditures 2009 <strong>2010</strong>Sweden 3,924 3,323Europe excluding Sweden 6,135 6,733North America 2,622 2,039South America 97 292Asia 1,574 2,707Other markets 221 111<strong>Volvo</strong> <strong>Group</strong> total 14,573 15,20582
Note 8 Other operating income and expenses2009 <strong>2010</strong>Gains/losses on divestment of <strong>Group</strong> companies 108 (34)Write down of assets held for sale (368) (65)Change in allowances and write-offs for doubtful receivables, customer financing (2,327) (1,438)Change in allowances and write-offs for doubtful receivables, other (692) 112Damages and litigations (71) (57)Restructuring cost (635) 11<strong>Volvo</strong> profit sharing program (9) (360)Other income and expenses (804) (192)Total (4,798) (2,023)Note 9 Income from investments inassociated companiesIncome/loss 2009 <strong>2010</strong>UD Trucks Niigata Co (1) 7JV Fonderie Venissieux 3 (1)Merkavim Metal Works Ltd 12 15Blue Chip Jet I & II HB (3) (39)Holdings of <strong>Volvo</strong> Technology Transfer 1 (1) (58)Other companies 2 1Subtotal 12 (75)Revaluation and write-down of sharesThomas Hardie Commercials Ltd (11) –Blue Chip Jet I & II HB – (11)Other companies (2) –Subtotal (13) (11)Gains (losses) on divestment ofshares in associated companiesUD Trucks Niigata Co (13) –Subtotal (13) –Total income (loss) from investmentsin associated companies (14) (86)Note 10 Income from other investmentsDividends received 2009 <strong>2010</strong>Deutz AG 2 2Holdings of UD Trucks 9 14Other 11 7Subtotal 22 23Write-downs of sharesHoldings of <strong>Volvo</strong> Technology Transfer 1 (36) (107)Other – (1)Subtotal 2 (36) (108)Gain on divestment of sharesHoldings of <strong>Volvo</strong> Technology Transfer 1 8 10Holdings of UD Trucks – 24Other – (7)Subtotal 8 27Total (6) (58)1 Investments held by the <strong>Volvo</strong> venture-capital company.2 Write-downs of shares refer entirely to financial assets available for sale forwhich a market value can not be calculated..1 Investments held by the <strong>Volvo</strong> venture-capital company.Note 11 Other financial income and expensesSEK M 2009 <strong>2010</strong>Financial instruments at fair value through profit or loss (90) 871Exchange rate gains and losses on financial assets and liabilities 1 (174) (351)Financial income and expenses related to taxes 140 (20)Costs for Treasury function, credit facilities, etc (268) (287)Total (392) 2131 In exchange rate gains and losses on financial assets and liabilities the devaluation effect in Venezuela is included with neg 274.For further information regarding financial instruments please see note 37.83
Financial information <strong>2010</strong>Notes to consolidated financial statementsNote 12 Income taxesIncome taxes were distributed as follows:2009 <strong>2010</strong>Current taxes relating to the period (989) (3,668)Adjustment of current taxesfor prior periods (73) 180Deferred taxes originated orreversed during the period 6,981 (747)Recognition and derecognitionof deferred tax assets (30) (67)Total income taxes 5,889 (4,302)Provisions have been made for estimated tax charges that may ariseas a result of prior tax audits in the <strong>Volvo</strong> <strong>Group</strong>. <strong>Volvo</strong> evaluates taxprocesses on a regular basis and makes provisions for possible outcomewhen it is probable that <strong>Volvo</strong> will have to pay more taxes andwhen it is possible to make a reasonably assessment of the possibleoutcome. Tax claims for which no provision has been deemed necessarywere reported as contingent liabilities.Deferred taxes relate to income taxes payable or recoverable infuture periods in respect of taxable temporary differences, deductibletemporary differences, unused tax-loss carryforwards or unused taxcredit carryforwards. Deferred tax assets are recognized to the extentthat it is probable that the amount can be utilized against future taxableincome. At December 31, <strong>2010</strong>, the valuation allowance attributableto deductible temporary differences, unused tax-loss carry forwardsand unused tax credit carryforwards for which no deferred taxasset was recognized amounted to 339 (296). <strong>The</strong> major part of thereserve consists of unused loss carryforwards.Deferred taxes amounting to 93 (neg: 816) have been reported inother comprehensive income, attributable to fair value of derivativeinstruments.At year-end <strong>2010</strong>, the <strong>Group</strong> had unused tax-loss carryforwardsamounting to 25,000 (30,200). <strong>The</strong>se loss carryforwards expireaccording to the table below:Due date 2009 <strong>2010</strong>2011 300 1002012 100 1002013 100 2002014 400 4002015 800 8002016– 28,500 23,400Total 30,200 25,000<strong>The</strong> Swedish corporate income tax rate is 26.3%. <strong>The</strong> table belowshows the principal reasons for the difference between this rate andthe <strong>Group</strong>'s tax rate, based on income after financial items.2009, % <strong>2010</strong>, %Swedish corporate income tax rates 26 26Difference in tax rate in various countries 2 4Capital gains 0 0Other non-taxable income 0 (3)Other non-deductible expenses 0 1Adjustment of current taxes for prior years 1 (1)Recognition and derecognitionof deferred tax assets 1 1Other, net (1) 0Income tax rate for the <strong>Group</strong> 29 2884
Specification of deferred tax assetsand tax liabilities 2009 <strong>2010</strong>Deferred tax assets:Unused tax-loss carryforwards 8,939 7,327Other unused tax credits 85 121Intercompany profit in inventories 459 711Allowance for inventory obsolescence 860 439Valuation allowance for doubtful receivables 702 587Provisions for warranties 1,071 1,722Provisions for residual value risks 387 306Provisions forpost-employment benefits 2,066 2,068Provisions for restructuring measures 169 61Adjustment to fair value at companyacquisitions 0 12Fair value of derivative instruments 240 45Land 2,377 2,455Other deductible temporary differences 4,474 4,594Deferred tax assets beforededuction for valuation allowance 21,829 20,448Valuation allowance (296) (339)Deferred tax assets afterdeduction for valuation allowance 21,533 20,109Netting of deferred tax assets/liabilities (8,938) (7,799)Deferred tax assets, net 12,595 12,310<strong>The</strong> significant tax-loss carryforwards are related to countries with longor indefinite periods of utilization, mainly Sweden and France. Of thetotal deferred tax asset for loss carryforwards 7,327 (8,939), an amountof 3,665 (4,653) in income (loss) for the period and in equity relates toSweden with indefinite time of utilization. <strong>Volvo</strong> considers it most probablethat the <strong>Volvo</strong> <strong>Group</strong> will be able to generate sufficient income inthe coming years to utilize the tax loss carryforwards. See note 2.2009 <strong>2010</strong>Deferred tax liabilities:Accelerated depreciation on property,plant and equipment 4,046 4,094Accelerated depreciation on leasingassets 2,073 2,111LIFO valuation of inventories 228 224Capitalized product andsoftware development 3,724 3,597Untaxed reserves 98 97Fair value of derivative instruments 67 20Other taxable temporary differences 2,340 2,178Deferred tax liabilities 12,576 12,321Netting of deferred tax assets/liabilities (8,938) (7,799)Deferred tax liabilities, net 3,638 4,522Deferred tax assets/liabilities, net 1 8,957 7,7881 Deferred taxes are partially recognized in the balance sheet on a net basisafter taking into account offsetting possibilities. Changes in tax rates during<strong>2010</strong> and 2011 have been considered when measuring deferred tax assetsand deferred tax liabilities and have affected the income tax cost of theyear. Deferred tax assets and liabilities have been measured to the tax ratesthat are expected to apply to the period when the asset is realized or theliability is settled.<strong>The</strong> cumulative amount of undistributed earnings in foreign subsidiaries,which <strong>Volvo</strong> currently intends to indefinitely reinvest outside ofSweden and upon which deferred income taxes have not been providedis approximately SEK 47 billion (40) at year end. <strong>The</strong>re are differenttaxation rules depending on country. In some countries dividends arenot taxable and in some countries there are withholding taxes. See note36 about how <strong>Volvo</strong> handles equity currency risk.Note 13 Minority interestsMinority interests in income (loss) for the period and in shareholders' equity consisted mainly of the minority interests in <strong>Volvo</strong> Aero Norge A/S(22%), in Berliet Maroc S.A (30%), in Shandong Lingong Construction Machinery Co, Ltd (30%) as well as in UD Trucks South Africa (Pty)Ltd (20%).Note 14 Intangible and tangible assetsIntangible assets, acquisition costs Goodwill 1 programsEntrancefees, industrialProduct andsoftwaredevelopmentOtherintangibleassets 2TotalintangibleassetsValue in balance sheet 2009 23,827 3,833 25,148 6,719 59,527Capital expenditures 3 – 15 3,255 54 3,324Sales/scrapping – 0 (156) (79) (235)Acquired and divested operations (70) 0 0 0 (70)Translation differences (847) (49) (400) 138 (1,158)Reclassifications and other 26 1 4 57 88Value in balance sheet <strong>2010</strong> 22,936 3,800 27,851 6,889 61,47685
Financial information <strong>2010</strong>Notes to consolidated financial statementsEntrancefees, industrialprogramsProduct andsoftwaredevelopmentOtherintangibleassetsTotalintangibleassetsAccumulated depreciation and amortizationGoodwillValue in balance sheet 2009 – 1,762 13,739 2,398 17,899Depreciation and amortization 6 – 59 2,857 389 3,305Sales/scrapping – 0 (45) (78) (123)Acquired and divested operations – 0 0 0 0Translation differences – (1) (285) (84) (370)Reclassifications and other – 0 5 46 51Value in balance sheet <strong>2010</strong> – 1,820 16,271 2,671 20,762Net carrying value in balance sheet 2009 4 23,827 2,071 11,409 4,321 41,628Net carrying value in balance sheet <strong>2010</strong> 4 22,936 1,980 11,580 4,218 40,714Constructionin progress,includingadvancepaymentsTotalinvestmentproperty,property,plant andequipmentAssets underoperatingleasesTotaltangibleassetsTangible assets,acquisition costsBuildingsLand and landimprovementsMachineryand equipment 5Value in balance sheet 2009 31,859 12,641 68,851 4,578 117,929 31,993 149,922Capital expenditures 3 617 119 3,806 2,446 6,988 4,893 11,881Sales/scrapping (472) (105) (1,730) (7) (2,314) (5,459) (7,773)Acquired and divested operations 0 0 0 0 0 223 223Translation differences (912) 50 (1,308) (148) (2,318) (2,843) (5,161)Reclassifications and other 466 (138) 895 (1,160) 63 288 351Value in balance sheet <strong>2010</strong> 31,558 12,567 70,514 5,709 120,348 29,095 149,443Constructionin progress,includingadvancepaymentsTotalinvestmentproperty,property,plant andequipmentAssets underoperatingleasesTotaltangibleassetsAccumulated depreciationand amortizationBuildingsLand and landimprovementsMachineryand equipment 5Value in balance sheet 2009 14,780 1,042 46,827 – 62,649 11,605 74,254Depreciation and amortization 6 1,207 98 4,772 – 6,077 4,410 10,487Sales/scrapping (224) (22) (1,549) – (1,795) (3,082) (4,877)Acquired and divested operations 0 0 0 – 0 (55) (55)Translation differences (192) (20) (691) – (903) (1,142) (2,045)Reclassifications and other (4) (32) 114 – 78 (2,288) (2,210)Value in balance sheet <strong>2010</strong> 15,567 1,066 49,473 – 66,106 9,448 75,554Net carrying value in balancesheet 2009 4 17,079 11,599 22,024 4,578 55,280 20,388 75,668Net carrying value in balancesheet <strong>2010</strong> 4, 7 15,991 11,501 21,041 5,709 54,242 19,647 73,8891 Includes on the date of IFRS adoption, acquisition costs of 14,184 andaccumulated amortization of 3,863.2 Other intangible assets mainly consist of trademarks and distributionnetworks.3 Includes capitalized borrowing costs of 92 (73).4 Acquisition costs less accumulated depreciation, amortization andwrite-downs.5 Machinery and equipment pertains mainly to production equipment.6 Of which write-down 33 (221).7 Of which, investment property 948 and property, plant and equipment53,294.Reclassifications and other mainly consist of assets under operatingleases related to legal sales transactions, where revenue is deferredand accounted for as operating lease revenue. Assets classified asinventory will, when the operating lease model is applied for revenuerecognition, be reclassified from inventory to assets under operatingleases, when the legal sales transaction occurs. If the product isreturned after the lease period, there will again be a reclassificationfrom assets under operating leases to inventory. When a buy-backagreement has expired, but the related product is not returned, theacquisition cost and the accumulated depreciation are reversed inreclassification and other, within the line item assets under operatingleases. Some of the reclassifications within tangible assets relate toconstruction in progress, which are reclassified to the respective categorywithin property, plant and equipment.86
Depreciation andamortization by type of asset 2009 <strong>2010</strong>Intangible assets 3,589 3,305Property, plant and equipment 6,562 6,077Assets under operating leases 5,076 4,410Total 15,227 13,792Capital expenditures by type of asset 2009 <strong>2010</strong>Intangible assets 2,935 3,324Property, plant and equipment 7,392 6,988Assets under operating leases 4,246 4,893Total 14,573 15,205Goodwill<strong>Volvo</strong> verifies annually, or more frequently if necessary, the value of itsoperations to ensure that they do not fall below the carrying value. Ifimpairment is detected, the carrying value, in the first place goodwill,has to be written down. <strong>Volvo</strong>’s evaluation model is based on a discountedcash-flow model, with a forecast period of four to sevenyears. Evaluation is made on cash-generating units, identified as <strong>Volvo</strong>’sbusiness areas.Goodwill assets are allocated to these cash-generating units onthe basis of anticipated future utility. <strong>The</strong> evaluation is based on management’sbest estimation of the operations’ development. <strong>The</strong> basisfor this estimation is long-term forecasts of the market’s growth, twoto four percent, in relation to the development of <strong>Volvo</strong>’s operations. Inthe model, <strong>Volvo</strong> is expected to maintain stable capital efficiency overtime. <strong>The</strong> evaluation is made on nominal values and a general rate ofinflation in line with the European target is used. <strong>Volvo</strong> uses a discountingfactor calculated to 12% (12) before tax for <strong>2010</strong>.During <strong>2010</strong>, the value of <strong>Volvo</strong>’s operations has exceeded thecarry ing value of goodwill for all business areas, and accordingly, noimpairment has been recognized. <strong>Volvo</strong> has also evaluated whetherthere still is an overvalue with reasonable changed assumptions,negatively adjusted with one percentage point, where of no adjustment,individually, would have such a big effect that there would be animpairment.Since the overvalue differs between the business areas they are toa varying degree sensitive to changes in the assumptions describedabove. <strong>Volvo</strong> therefore continuously follows the development of thebusiness areas whose overvalue is dependent on the fulfilment of<strong>Volvo</strong>’s assessments. Instability in the business recovery and volatilityin interest and currency rates may lead to indications of impairment.<strong>The</strong> most important factors for the future operations of <strong>Volvo</strong> aredescribed in the <strong>Volvo</strong> business area section, as well as in the Riskmanagement section.Goodwill per Business Area 2009 <strong>2010</strong><strong>Volvo</strong> Trucks 3,905 3,913Renault Trucks 2,580 2,249Trucks Asia 5,752 6,041North American Trucks 1,387 1,334Construction Equipment 8,607 7,806Buses 1,178 1,174Other business areas 418 419Total goodwill value 23,827 22,936Investment propertyInvestment property is property owned for the purpose of obtainingrental income and/or appreciation in value. <strong>The</strong> acquisition cost ofinvestment property was 1,692 (1,681) at year-end. Capital expendituresduring <strong>2010</strong> amounted to 11 (87). Accumulated depreciationwas 744 (690) at year-end, of which 55 (54) during <strong>2010</strong>. <strong>The</strong> estimatedfair value of investment property was SEK 1.8 billion (2.5) atyear-end, based on the yield. <strong>The</strong> required return is based on currentproperty market conditions for comparable properties in comparablelocations. 89% of the investment properties were leased out duringthe year (93). Net income for the year was affected by 223 (268) inrental income from investment properties and 63 (45) in direct costs.87
Financial information <strong>2010</strong>Notes to consolidated financial statementsNote 15 Shares and participations<strong>Group</strong> holdings of shares andparticipations in non-<strong>Group</strong> companiesRegistrationnumberPercentageholdingDec 31, 2009Carrying valueDec 31, <strong>2010</strong>Carrying valueShares in associated companies, equity method of accountingBlue Chip Jet II HB, Sweden 969717-2105 50 284 319UD Trucks Doto Corporation, Japan – 38 83 94UD Trucks Niigata Corporation, Japan – 34 54 61Merkavim Metal Works Ltd, Israel – 27 41 37JV Fonderie Venissieux, France – 49 38 32PK-UD Axle Co.,Ltd. (HangZhou), China – 45 18 30Diamond Finance Ltd, Great Britain – 40 19 18Blue Chip Jet HB, Sweden 969639-1011 45 17 3Quingdao Sunwin Bus Corp, China – 43 9 9Arabian Vehicle & Truck Industry Ltd, Saudi Arabia – 25 9 9Effpower AB, Sverige 556570-8541 34 – 29Powercell Sweden AB, Sweden 556759-8353 47 – 27Other holdings – – 16 16Total shares and participations in associated companies 1 588 684Shares and participations in other companiesDeutz AG, Germany – 7 286 458Nippon Express Co.,Ltd., Japan – – 128 131Nishi-Nippon Railroad Co Ltd, Japan – – 47 –Sankyu Inc., Japan – 1 64 53Iron Planet.com Inc., USA – 4 34 34TBK Co.,Ltd., Japan – 7 26 68Vantage Equipment. LLC, USA – 46 18 15Scott Van Keppel, USA – 40 14 14Other holdings – – 839 641Total shares and participations in other companies 1 1,456 1,414Total value of <strong>Group</strong> holdings of shares and participations innon-<strong>Group</strong> companies 2,044 2,0981 <strong>Volvo</strong>’s share of shareholders' equity in associated companies (incl. equity in untaxed reserves) amounted to 684 (588).<strong>The</strong> carrying values of <strong>Volvo</strong>'s holdings of shares and participations in listed companies as of December 31, <strong>2010</strong> are shown in the table below.<strong>The</strong> carrying value is equal to the market value for holdings in listed companies.Carrying valueDeutz AG, Germany 458Nippon Express Co.,Ltd., Japan 131TBK Co.,Ltd., Japan 68Sankyu Inc., Japan 53Fukuyama Transporting Co.,Ltd., Japan 15Senko Co.,Ltd, Japan 30Tonami Holdings Co.,Ltd., Japan 14Yamato Holdings Co.,Ltd., Japan 21Holdings in other listed companies 46Total holdings in listed other companies 836Holdings in non-listed companies 1 578Total shares and participations in other companies 1,4141 Unlisted shares, for which a reliable fair value cannot be determined, arereported at the acquisition value reduced in appropriate cases by write-downs.88
Changes in the <strong>Volvo</strong> <strong>Group</strong>’s holdings of shares and participations: 2009 <strong>2010</strong>Balance sheet, December 31, preceding year 1,953 2,044Change in <strong>Group</strong> structure (15) –Acquisitions and divestments, net 45 104Write-downs (48) (119)Capital contribution 2 31Share of income in associated companies 12 (75)Revaluation of shares to fair value 92 148Translation differences (74) 22Dividends (21) (1)Revaluation of holdings of <strong>Volvo</strong> Technology Transfer 80 –Reclassifications – (42)Other 18 (14)Balance sheet, December 31 2,044 2,098Note 16 Non-current customer-financing receivables2009 <strong>2010</strong>Installment credits 18,517 15,673Financial leasing 20,478 19,620Other receivables 718 732Total 39,713 36,025Effective interest rate for non-current customer-financing receivableswas 6.54% as per December 31, <strong>2010</strong>.During <strong>2010</strong> SEK 4.1 billion, of which SEK 2.6 billion of the noncurrentcustomer-financing receivables, in Brazil were sold as a riskmitigation measure and to release capital for reinvestment in thecountry.Non-current customer-financing receivables maturities2012 16,8142013 11,6682014 4,9292015 2,1202016 or later 494Total 36,025See notes 36 and 37 for financial instruments and goals and policiesin financial risk management.Note 17 Non-current receivables2009 <strong>2010</strong>Other interest-bearing loans to external parties 287 204Other interest-bearing financial receivables 298 562Other financial receivables 1,425 1,741Other receivables 1,613 1,676Total 3,623 4,184See notes 36 and 37 for financial instruments and goals and policies in financial risk management.89
Financial information <strong>2010</strong>Notes to consolidated financial statementsNote 18 Inventories2009 <strong>2010</strong>Finished products 23,612 24,572Production materials, etc. 14,115 15,265Total 37,727 39,837Inventories recognized as cost of sale during the period amounted to 170,723 (153,014).Increase (decrease) in allowance for inventory obsolescence 2009 <strong>2010</strong>Balance sheet, December 31, preceding year 3,522 4,101Increase in allowance for inventory obsolescence charged to income 1,045 (79)Scrapping (399) (439)Translation differences (79) (191)Reclassifications, etc. 12 (10)Balance sheet, December 31 4,101 3,382Note 19 Current customer-financing receivables2009 <strong>2010</strong>Installment credits 15,070 11,988Financial leasing 13,589 10,860Dealer financing 12,435 12,598Other receivables 1,170 1,217Total 42,264 36,663Effective interest rate for short-term customer-financing receivableswas 6.38% as per December 31, <strong>2010</strong>.During <strong>2010</strong> SEK 4.1 billion, of which SEK 1.5 billion of the currentcustomer-financing receivables, in Brazil were sold as a risk mitigationmeasure and to release capital for reinvestment in the country.See notes 36 and 37 for financial instruments and goals andpo licies in financial risk management.Note 20 Current receivables2009 <strong>2010</strong>Loans to external parties 7 11Other interest-bearing financial receivables 403 331Accounts receivable 21,337 24,433Prepaid expenses and accrued income 3,027 3,043VAT receivables 2,237 2,662Other financial receivables 1 2,195 1,715Other receivables 4,623 4,436Total, after deduction of valuation allowances for doubtful accounts receivable 33,829 36,6331 Fair value financial derivatives.90
Change of valuation allowances for doubtful accounts receivable 2009 <strong>2010</strong>Balance sheet, December 31, preceding year 1,749 1,301New valuation allowance charged to income 638 187Reversal of valuation allowance charged to income (274) (609)Utilization of valuation allowance related to actual losses (664) (86)Acquired and divested operations (7) (1)Translation differences (88) (44)Reclassifications, etc. (53) (28)Balance sheet, December 31 1,301 721See notes 36 and 37 for financial instruments and goals and policies in financial risk management.Note 21Marketable securitiesMarketable securities consist mainly of interest-bearing securities, distributed as shown below:2009 <strong>2010</strong>Government securities 147 146Banks and financial institutions 3,387 3,527Real estate financial institutions 13,142 6,094Total 16,676 9,767Note 22 Cash and cash equivalents2009 <strong>2010</strong>Cash in banks 13,540 16,858Bank certificates 1 2,999 2,286Time deposits in banks 4,695 3,822Total 21,234 22,9661 Bank certificates which matures within three months from acquisition.Cash and cash equivalents at December 31, <strong>2010</strong>, include SEK 0.7billion (1.2) restricted for use by the <strong>Volvo</strong> <strong>Group</strong> and SEK 7.4 billion(5.3) that are liquid funds in countries where exchange controls orother legal restrictions apply.Note 23 Shareholders’ equity<strong>The</strong> share capital of the Parent Company is divided into two series ofshares, A and B. Both series carry the same rights, except that eachSeries A share carries the right to one vote and each Series B share carriesthe right to one tenth of a vote. <strong>The</strong> shares quota value is SEK 1.20.Cash dividend decided by the <strong>Annual</strong> General Meeting <strong>2010</strong> was SEK0.00 (2.00) per share or total of SEK 0.0 million (4,054.8).Unrestricted equity in the Parent Company at December 31, <strong>2010</strong>amounted to SEK 31,962 million (21,462).<strong>The</strong> cumulative amount of the exchange difference deferred to equityrelating to assets held for sale amount to positive SEK 3 million (60).91
Financial information <strong>2010</strong>Notes to consolidated financial statementsInformation regarding number of shares 2009 <strong>2010</strong>Own Series A shares 20,728,135 20,728,135Own Series B shares 80,265,060 80,265,060Total own shares 100,993,195 100,993,195Own shares in % of total registered shares 4.74 4.74Outstanding Series A shares 656,873,495 656,873,495Outstanding Series B shares 1,370,553,530 1,370,553,530Total outstanding shares 2,027,427,025 2,027,427,025Total registered Series A shares 677,601,630 677,601,630Total registered Series B shares 1,450,818,590 1,450,818,590Total registered shares 2,128,420,220 2,128,420,220Average number of outstanding shares 2,027,419,396 2,027,419,396Change in other reserves (SEK M)Hedge reserveAvailable- forsalereserveTotalBalance at January 1, <strong>2010</strong> 243 (120) 123Change in fair value of contracts hedging currency risks 3 – 3Tax on change in fair value of contracts hedging currency risks (1) – (1)Transfers to income (354) – (354)Tax on transfers to income statement 93 – 93Change in fair value of commodity contracts 103 – 103Fair value adjustments regarding holding in Deutz – 172 172Fair value adjustments regarding shares held by UD Trucks – (14) (14)Fair value adjustments regarding holding in Vindic AB – (10) (10)Balance at December 31, <strong>2010</strong> 87 28 115Earnings per shareEarnings per share are calculated as income for the period, attributableto the Parent Company's shareholders, divided by the ParentCompany’s average number of shares outstanding for the fiscal year.Diluted earnings per share is calculated as income for the periodattributable to the Parent Company’s shareholders divided by theaverage number of shares outstanding plus the average number ofshares that would be issued as an effect of ongoing share-basedincentive programs. If during the year there were potential sharesredeemed or expired during the period, these are also included in theaverage number of shares used to calculate the earnings per shareafter dilution.<strong>The</strong> share-based incentive program creates a dilution effect whenthe non-market-based financial goals are achieved for the fiscal year.<strong>The</strong> requirement for 2009 was not met. For <strong>2010</strong> AB <strong>Volvo</strong> had noshare-based incentive program. No other transactions have occuredthat affected, or will have an effect on, the compilation of the reportedshare capital.2009 <strong>2010</strong>Number of shares, December 31, in millions 2,027 2,027Average number of sharesbefore dilution in millions 2,027 2,027Average number of shares afterdilution in millions 2,027 2,027Average share price, SEK 53.65 85.75Net income attributable toParent Company shareholders (14,718) 10,866Basic earnings per share, SEK (7.26) 5.36Diluted earnings per share, SEK (7.26) 5.3692
Note 24 Provisions for post-employment benefitsPost-employment benefits, such as pensions, healthcare and otherbenefits are mainly settled by means of regular payments to independentauthorities or bodies that assume pension obligations andadminister pensions through defined-contribution plans. <strong>The</strong> remainingpost-employment benefits are defined-benefit plans; that is, the obligationsremain within the <strong>Volvo</strong> <strong>Group</strong> or are secured by own pensionfoundations. Costs and the obligations at the end of the period fordefined-benefit plans are calculated based on actuarial assumptionsand measured on a discounted basis. <strong>The</strong> <strong>Volvo</strong> <strong>Group</strong> defined-benefitplans relate mainly to subsidiaries in the U.S. and comprise bothpensions and other benefits, such as healthcare. Other large-scaledefined-benefit plans apply for salaried employees in Sweden (mainlythrough the Swedish ITP pension plan) and employees in France andGreat Britain. See note 1 for further information about the accountingprinciples.<strong>The</strong> following tables disclose information about defined-benefitplans in the <strong>Volvo</strong> <strong>Group</strong>. <strong>Volvo</strong> reports the difference between theobligations and the plan assets adjusted for unrecognized actuarialgains and losses in the balance sheet. <strong>The</strong> information refers toassumptions applied for actuarial calculations, periodical costs andthe value of obligations and plan assets at year-end. <strong>The</strong> tables alsoinclude reconciliation of obligations and plan assets during the yearand the difference between fair values and carrying amounts reportedon the balance sheet date.Summary of provision forpost-employment benefits 2009 <strong>2010</strong>Obligations 38,070 36,121Fair value of plan assets 22,610 22,954Funded status (15,460) (13,167)Unrecognized actuarial (gains)and losses 9,155 6,995Unrecognized past service costs 303 310Net provisions for postemploymentbenefits (6,002) (5,862)Assumptions applied foractuarial calculations, %December 31,2009December 31,<strong>2010</strong>SwedenDiscount rate 1 4.00 4.75Expected return on plan assets 2 6.00 6.00Expected salary increases 3.00 3.00Inflation 1.50 1.50United StatesDiscount rate 1, 3 4.00–5.75 3.25–5.50Expected return on plan assets 2 7.65 7.65Expected salary increases 3.00 3.00Inflation 2.00 2.00FranceDiscount rate 1 4.50 4.50Expected salary increases 1.00–3.00 1.00-3.00Inflation 1.50 1.50Great BritainDiscount rate 1 5.50 5.40-5.50Expected return on plan assets 2 5.00–6.30 5.00Expected salary increases 3.50 3.70–3.85Inflation 3.00 3.201 <strong>The</strong> discount rate for each country is determined by reference to marketyields on high-quality corporate bonds. In countries where there is no deepmarket in such bonds, the market yields on government bonds are used. <strong>The</strong>discount rate for the Swedish pension obligation <strong>2010</strong> is determined by referenceto mortgage bonds.2 Applicable for the following accounting period. <strong>The</strong>se assumptions reflectthe expected long-term return rate on plan assets, based upon historicalyield rates for different categories of investments and weighted in accordancewith the foundation's investment policy. <strong>The</strong> expected return has beencalculated net of administrative expenses and applicable taxes.3 For all plans except one the discont rate used is within the range 4.75–5.50%(5.00–5.75).93
Financial information <strong>2010</strong>Notes to consolidated financial statementsPension costs 2009 <strong>2010</strong>Current year service costs 969 896Interest costs 1,684 1,510Expected return on plan assets (1,362) (1,402)Actuarial gains and losses 1 504 420Past service costs– Unvested 18 19– Vested (314) 28of which effect of agreement with UAW in Mack Trucks (317) –Curtailments and settlements 36 (38)Termination benefits 40 34Pension costs for the period, defined-benefit plans 1,575 1,467Pension costs for defined-contribution plans 3,116 3,273Total pension costs for the period 4,691 4,7401 For each plan, actuarial gains and losses are reported as income or expenses, when the accumulated amount exceeds the so called corridor. <strong>The</strong> income orexpenses are then recognized over the expected average remaining service period of the employees.Costs for the period, post-employment benefits other than pensions 2009 <strong>2010</strong>Current year service costs 270 49Interest costs 334 170Expected return on plan assets (1) –Actuarial gains and losses 1 4 (1)Past service costs– Unvested 7 –– Vested 0 26Curtailments and settlements 1,124 2of which effect of agreement with UAW in Mack Trucks 1,194 –Termination benefits 20 7Total costs for the period, post-employment benefits other than pensions 1,758 2531 For each plan, actuarial gains and losses are reported as income or expenses, when the accumulated amount exceed the so called corridor. <strong>The</strong> income orexpenses are then recognized over the expected average remaining service period of the employees.An increase of one percentage point per year in healthcare costswould change the accumulated post-employment benefit obligationas of December 31, <strong>2010</strong> by approximately 155, and the post-employmentbenefit expense for the period by approximately 10. A decreaseof one percentage point would decrease the accumulated value ofobligations by about 132 and reduce costs for the period by approximately8. Calculations made as of December 31, <strong>2010</strong> show an annualincrease of 8% in the weighted average per capita costs of coveredhealth care benefits. It is assumed that the percentage will declinegradually to 4.5% and then remain at that level.UnitedStatesPensionsGreatBritainPensionsUSOtherbenefitsObligations indefined-benefit plansSwedenPensionsFrancePensionsOtherplans TotalObligations at January 1, 2009 9,097 13,648 2,087 4,035 6,971 5,333 41,171Acquisitions, divestments and other changes – – (53) – – (3) (56)Current year service costs 323 264 65 52 252 283 1,239Interest costs 414 774 104 242 328 168 2,030Past service costs– Unvested 1 (90) – – – – (89)– Vested – (316) 3 – 5 – (308)of which effect of agreement with UAW in Mack Trucks – (317) – – – – (317)Termination benefits 32 – (1) – – 25 56Curtailments and settlements (8) (18) – – (3,163) (140) (3,329)of which effect of agreement with UAW in Mack Trucks – – – – 1,194 – 1,194of which reclassification to financial liability in Mack Trucks – – – – (4,282) – (4,282)Employee contributions – – – 24 – (1) 23Actuarial (gains) and losses 321 1,096 18 187 231 (47) 1,806Exchange rate translation – (1,008) (110) 73 (320) (148) (1,513)Benefits paid (299) (992) (216) (175) (607) (671) (2,960)Obligations at December 31, 2009 9,881 13,358 1,897 4,438 3,697 4,799 38,070of whichFunded defined-benefit plans 9,465 12,923 – 4,438 – 2,277 29,10394
UnitedStatesPensionsGreatBritainPensionsUSOtherbenefitsObligations indefined benefit plansSwedenPensionsFrancePensionsOtherplans TotalAcquisitions, divestments and other changes – 10 – – 2 28 40Current year service costs 302 258 54 45 39 247 945Interest costs 401 665 77 233 167 157 1,700Past service costs– Unvested – 3 – – (4) (5) (6)– Vested 27 3 (44) – – – (14)Termination benefits 33 – (2) – – 5 36Curtailments and settlements (6) (7) (18) (1) – (11) (43)Employee contributions – – – 21 – 9 30Actuarial (gains) and losses (1,170) 571 (2) 28 (33) 78 (528)Exchange rate translation – (789) (245) (370) (207) (171) (1,782)Benefits paid (324) (1,074) (112) (168) (220) (429) (2,327)Obligations at December 31, <strong>2010</strong> 9,144 12,998 1,605 4,226 3,441 4,707 36,121of whichFunded defined-benefit plans 8,794 11,378 – 4,226 – 2,203 26,601UnitedStatesPensionsGreatBritainPensionsUSOtherbenefitsFair value of plan assets infunded plansSwedenPensionsFrancePensionsOtherplans TotalPlan assets at January 1, 2009 5,467 10,672 – 3,992 104 1,870 22,105Acquisitions, divestments and other changes – (3) – – – (141) (144)Expected return on plan assets 328 717 – 223 1 89 1,358Actuarial gains and (losses) 635 644 – 141 – 43 1,463Employer contributions – – – 113 – 167 280Employee contributions – – – 24 – 20 44Exchange rate translation – (1,203) – 72 (3) 36 (1,098)Benefits paid – (961) – (173) (74) (190) (1,398)of which reclassification to financial liability in Mack Trucks – – – – (73) – (73)Plan assets at December 31, 2009 6,430 9,866 – 4,392 28 1,894 22,610Acquisitions, divestments and other changes – 4 – (1) – 26 29Expected return on plan assets 386 719 – 216 – 77 1,398Actuarial gains and (losses) 262 373 – 208 – 18 861Employer contributions – 156 – 103 – 187 446Employee contributions – – – 21 – 12 33Exchange rate translation – (574) – (378) (2) (166) (1,120)Benefits paid – (1,009) – (168) (2) (124) (1,303)Plan assets at December 31, <strong>2010</strong> 7,078 9,535 – 4,393 24 1,924 22,95495
Financial information <strong>2010</strong>Notes to consolidated financial statementsUnitedStatesPensionsGreatBritainPensionsUSOtherbenefitsNet provision forpost-employment benefitsSwedenPensionsFrancePensionsOtherplans TotalFunded status at December 31, 2009 (3,451) (3,492) (1,897) (46) (3,669) (2,905) (15,460)Unrecognized actuarial (gains) and losses 3,030 4,373 232 635 384 1 501 9,155Unrecognized past service costs – (81) 405 – (6) (15) 303Net provisions for post-employmentbenefits at December 31, 2009 (421) 800 (1,260) 589 (3,291) (2,419) (6,002)of which reported asPrepaid pensions and other assets – 1,254 – 588 120 87 2,049Provisions for post-employment benefits (421) (454) (1,260) 1 (3,411) (2,506) (8,051)Funded status at December 31, <strong>2010</strong> (2,066) (3,463) (1,605) 167 (3,417) (2,783) (13,167)Unrecognized actuarial (gains) and losses 1,475 4,054 113 388 322 643 6,995Unrecognized past service costs – (65) 380 – (5) – 310Net provisions for post-employmentbenefits at December 31, <strong>2010</strong> (591) 526 (1,112) 555 (3,100) (2,140) (5,862)of which reported asPrepaid pensions and other assets – 900 – 555 110 83 1,648Provisions for post-employment benefits (591) (374) (1,112) – (3,210) (2,223) (7,510)1 A decrease by 194 from reclassification to financial liability in Mack Trucks.Plan assets by category 2009 % <strong>2010</strong> %Shares and participation, <strong>Volvo</strong> 195 1 403 2Shares and participations, other 10,893 48 11,494 50Bonds and interest-bearing securities. 10,167 45 9,100 40Property 319 1 440 2Other 1,036 5 1,517 6Total 22,610 100 22,954 100Actual return on plan assets amounted to 2,259 (2,821).Actuarial gains and losses 2009 <strong>2010</strong>Experience-based adjustments in obligations (110) 293Experience-based adjustments in plan assets 1,463 861Effects of changes in actuarial assumptions (1,696) 235Actuarial gains and (losses), net (343) 1,389<strong>Volvo</strong>’s pension foundation in Sweden was formed in 1996 to secureobligations relating to retirement pensions for salaried employees inSweden in accordance with the ITP plan (a Swedish individual pensionplan). Plan assets amounting to 2,456 were contributed to the foundationat its formation, corresponding to the value of the pension obligationsat that time. Since its formation, net contributions of 1,472have been made to the foundation. <strong>The</strong> plan assets in <strong>Volvo</strong>’s Swedishpension foundation are invested in Swedish and foreign stocks andmutual funds, and in interest-bearing securities, in accordance with adistribution that is determined by the foundation’s Board of Directors.At December 31, <strong>2010</strong>, the fair value of the foundation's plan assetsamounted to 7,059 (6,408), of which 57% (46) was invested in sharesor mutual funds. At the same date, retirement pension obligationsattributable to the ITP plan amounted to 8,794 (9,465).Swedish companies can secure new pension obligations throughbalance sheet provisions or pension fund contributions. Furthermore,a credit insurance must be taken for the value of the obligations. Inaddition to benefits relating to retirement pensions, the ITP plan alsoincludes, for example, a collective family pension, which <strong>Volvo</strong> financesthrough insurance with the Alecta insurance company. According toan interpretation from the Swedish Financial <strong>Report</strong>ing Board, this isa multi-employer defined-benefit plan. For fiscal year 2009, <strong>Volvo</strong> didnot have access to information from Alecta that would have enabledthis plan to be reported as a defined-benefit plan. Accordingly, theplan has been reported as a defined-contribution plan. Alecta's fundingratio is 143% (141).<strong>Volvo</strong>’s subsidiaries in the United States mainly secure their pensionobligations through transfer of funds to pension plans. At the endof <strong>2010</strong>, the total value of pension obligations secured by pensionplans of this type amounted to 11,378 (12,923). At the same point intime, the total value of the plan assets in these plans amounted to9,535 (9,866), of which 59% (59) was invested in shares or mutualfunds. <strong>The</strong> regulations for securing pension obligations stipulate certainminimum levels concerning the ratio between the value of theplan assets and the value of the obligations. As a consequence of theMaster Agreement 2009 between Mack Trucks and United AutoWorkers (UAW) an independent trust has been established that willcompletely eliminate Mack's commitments for providing healthcare to96
etired employees. Instead Mack Trucks has an obligation to fund thenewly established fund over five years. As a result of the agreementthe 2009 operating income of Mack Trucks was charged by 877 (USD110 M), of which 1,194 concerning settlement of post-employmentbenefits other than pensions and 317 in reduced pension costs froma change in past service costs. <strong>The</strong> obligation increased with thesame amount. Interest on the obligation started accruing from October1, 2009. By that, SEK 4,015 billion (USD 525 M), formerly reportedas obligation was reclassified a financial liability. Accordingly, the obligationdecreased by 4,282, the plan assets by 73 and unrecognizedactuarial losses by 194. During <strong>2010</strong>, <strong>Volvo</strong> contributed 156 (0) to theAmerican pension plans.During <strong>2010</strong> <strong>Volvo</strong> has made extra contributions to the pensionplans in Great Britain in the amount of SEK 103 M (113).In 2011, <strong>Volvo</strong> estimates to transfer an amount of about SEK 1 billionto pension plans.Note 25 Other provisionsValue inbalancesheet2009 Provisions Reversals Utili zationsAcquiredanddivestedcompaniesTranslationdifferencesReclassificationsValue inbalancesheet<strong>2010</strong>Of whichduewithin 12monthsOf whichdue after12 monthsWarranties 7,947 6,080 (805) (5,160) (4) (333) 116 7,841 4,844 2,997Provisions in insuranceoperations 505 154 (103) (75) 0 (31) 0 450 3 447Restructuring measures 707 72 (75) (419) 0 (36) (2) 247 188 59Provisions for residual valuerisks 1,061 319 (40) (461) 0 (25) 5 859 134 725Provisions for service contracts 465 296 (42) (228) 0 (41) (6) 444 192 252Dealer bonus 1,315 2,245 (64) (1,684) 5 (142) (24) 1,651 1,435 216Other provisions 3,847 3,088 (1,035) (2,714) 1 (202) (7) 2,978 1,738 1,240Total 15,847 12,254 (2,164) (10,741) 2 (810) 82 14,470 8,534 5,936Long-term provisions as above is expected to be settled within 2 to 3 years.Note 26 Non-current liabilities<strong>The</strong> listing below shows the <strong>Group</strong>’s non-current liabilities in which thelargest loans are distributed by currency. Most are issued by <strong>Volvo</strong>Treasury AB. Information on loan terms is as of December 31, <strong>2010</strong>.<strong>Volvo</strong> hedges foreign-exchange and interest-rate risks using derivativeinstruments. See Note 36.Actual interest rate,Dec 31, <strong>2010</strong>, %Effective interest rate,Dec 31, <strong>2010</strong>, % 2009 <strong>2010</strong>Bond loansEUR 2007–<strong>2010</strong>/2012-2017 2.19–9.92 2.21–9.92 26,428 20,384SEK 2007–2009/2012–2017 1.59–8.63 1.60–8.91 16,174 12,553JPY 79 –USD 2009/2015 5.98 5.98 5,381 5,075NOK 2009/2012 5.64 5.76 557 229GBP 2009/2014 6.28 6.43 572 525Total 1 49,191 38,7671 Of which loans raised to finance the credit portfolio of the customer financing operations 14,940 (12,302).97
Financial information <strong>2010</strong>Notes to consolidated financial statementsActual interest rate,Dec 31, <strong>2010</strong>, %Effective interest rate,Dec 31, <strong>2010</strong>, % 2009 <strong>2010</strong>Other loansUSD 2007–<strong>2010</strong>/2012–2018 0.52–7.50 0.52–7.76 17,281 13,433EUR 2004–2009/2012–2027 3.25–6.50 3.28–6.50 5,995 1,485GBP 2008/2012–2013 1.19 1.2 1,664 337SEK 2007–<strong>2010</strong>/2012–2017 2.00–3.00 2.02–3.00 1,915 2,942CAD 2006–<strong>2010</strong>/2012–2013 1.53–2.84 1.54–2.87 2,067 2,928MXN 2007–2009/2012–2014 5.00–9.04 5.11–9.42 2,145 2,186JPY 2005–<strong>2010</strong>/2012–2016 0.65–3.52 0.65–3.52 16,374 12,405CHF 696 –BRL 2003–2009/2012–2017 6.58–7.0 6.86–7.0 5,940 5,348Other loans 1.7–7.5 1.71–7.64 1,189 1,871Revaluation of outstanding derivaties to SEK 769 2,392Total other non-current loans 2 56,035 45,327Deferred leasing income 1,965 1,778Residual value liabilities 3,109 3,170Accrued expenses service contracts 1,422 1,273Other non-current financial liabilities 1,672 1,114Other non-current liabilities 1,720 1,896Total 115,114 93,3252 Of which loans raised to finance the credit portfolio of the customer financing operations 21,064 (26,551) and financial derivatives 2.392 (769).Of the above long-term loans, 1,288 (270) was secured.See note 28 for a description of changes of assets pledged.Long-term loans mature as follows:2012 23,5302013 13,8362014 17,5912015 10,1902016 6,4762017 or later 12,471Total 84,094See note 16 for maturities of long-term customer financing receivables.Of other non-current liabilities the majority will mature within fiveyears.At year-end <strong>2010</strong>, credit facilities granted but not utilized and whichcan be used without restrictions amounted to approximately SEK 35.3billion (33.2). <strong>The</strong>se facilities consisted of stand-by facilities for loanswith varying maturities through the year 2013. A fee is normallycharged for the unused portion of credit facilities and is reported inthe income statement under other financial income and expenses.Note 27Current liabilitiesBalance sheet amounts for loans were as follows:2009 <strong>2010</strong>Bank loans 14,083 12,261Other loans 37,543 27,340Total 1 51,626 39,6011 Of which loans raised to finance the credit portfolio of the customer financingoperations 29,690 (40,766) and derivatives 458 (178).Bank loans include current maturities, 3,246 (4,713), of long-termloans. Other loans include current maturities of long-term loans,22,007 (25,108), and commercial paper, 1,416 (8,640).Non-interest-bearing current liabilities accounted for 84,457(70,955), or 68% (58) of the <strong>Group</strong>’s total current liabilities.Balance sheet amounts for other current liabilities were as follows:2009 <strong>2010</strong>Advances from customers 3,556 3,416Wages, salaries and withholding taxes 8,504 8,824VAT liabilities 1,511 2,023Accrued expenses and prepaid income 11,756 12,626Deferred leasing income 1,725 1,640Residual value liability 2,730 2,154Other financial liabilities 783 242Other liabilities 3,540 4,416Total 34,105 35,341Current liabilities also include trade payables that amounted to 47,250(35,955), current tax liabilities of 1,732 (623) and non interest-bearingliabilities held for sale reported within Note 4. Secured bank loansat year-end <strong>2010</strong> amounted to 216 (329). <strong>The</strong> corresponding amountfor other current liabilities was 1,442 (58).98
Note 28 Assets pledged2009 <strong>2010</strong>Property, plant and equipment – mortgages 297 168Assets under operating leases 109 107Chattel mortgages 25 –Receivables 451 2,964Cash, marketable securities 76 100Total 958 3,339<strong>The</strong> liabilities for which the above assets were pledged amounted atyear-end to 2,946 (658).In <strong>2010</strong> an asset-backed securitization was completed. Under theterms of the transaction, USD 616 M of securities were issued tied toUS-based loans with trucking and construction equipment assets ascollaterals.Note 29 Contingent liabilities2009 <strong>2010</strong>Credit guarantees issued forcustomers and others 2,173 3,709Tax claims 824 490Other contingent liabilities 6,610 6,804Total 9,607 11,003Tax claims amounted to 490 (824) pertain to charges against the<strong>Volvo</strong> <strong>Group</strong> for which provisions are not considered necessary.Other contingent liabilities includes residual value guarantees andlegal proceedings.<strong>The</strong> reported amounts for contingent liabilities reflect the <strong>Volvo</strong><strong>Group</strong>'s risk exposure on a gross basis. <strong>The</strong> reported amounts havethus not been reduced because of counter guarantees received orother collaterals in cases where a legal offsetting right does not exist.At December 31, <strong>2010</strong>, the estimated value of counter guaranteesreceived and other collaterals, for example the estimated net sellingprice of used products, amounted to 3,893 (3,832). <strong>The</strong>y are mainlypertaining to credit guarantees and residual value guarantees.Legal proceedings<strong>The</strong> former labor agreement between Mack Trucks, Inc. and theUnited Auto Workers Union (UAW), expired on September 30, 2007.<strong>The</strong>reafter Mack Trucks and UAW have entered into a new 40-monthMaster Agreement. <strong>The</strong> agreement includes the establishment of anindependent trust that will completely eliminate Mack's commitmentsfor providing healthcare to retired employees. <strong>The</strong> trust must beapproved by the U.S. District Court for the Eastern District of Pennsylvania,which is currently scheduled for the last six months of 2011. <strong>The</strong><strong>Volvo</strong> <strong>Group</strong> will fund the trust with USD 525 M, paid out during a fiveyearperiod as from <strong>2010</strong>. <strong>The</strong> funding obligation is reported as afinancial liability and amortizations will be reported as cash flow fromfinancing activities.In July 1999, <strong>Volvo</strong> Truck Corporation and <strong>Volvo</strong> ConstructionEquipment entered into a Consent Decree with the U.S. EnvironmentalProtection Agency (EPA). <strong>The</strong> Consent Decree included, amongother provisions, that new stricter emission requirements for certainengines that would come into force on January 1, 2006, should beapplied by VTC and VCE from January 1, 2005. <strong>The</strong> Consent Decreewas later transferred from VTC and VCE to <strong>Volvo</strong> Powertrain Corporation.During 2008, the EPA demanded stipulated penalties from<strong>Volvo</strong> Powertrain Corporation in the amount, including interest, ofUSD 72 M, alleging that the stricter standards under the ConsentDecree should have been applied to engines manufactured by <strong>Volvo</strong>Penta during 2005. <strong>Volvo</strong> Powertrain disagrees with EPA's interpretationand is defending the case vigorously based on, among othergrounds, that the <strong>Volvo</strong> Penta engines were not subject to the ConsentDecree. <strong>The</strong> dispute was referred to a U.S. court. <strong>The</strong> amountrequested by the EPA is included in other contingent liabilities.Nissan Diesel Thailand Co. Limited (the “Plaintiff”) on November30, 2009 filed a claim at the Pathumthani Provincial Court of FirstInstance, Thailand, against AB <strong>Volvo</strong> and three of its employees(together the “Defendants”), claiming damages in the sum of Baht10.5 billion (equivalent to approximately SEK 2.3 billion). <strong>The</strong> Plaintiffclaims that the Defendants' actions caused UD Trucks Corporation(“UDT”), a wholly-owned subsidiary of AB <strong>Volvo</strong>, to unlawfully terminatetwo agreements dated December 27, 2002 between UDT andthe Plaintiff. <strong>The</strong> Plaintiff is one of UDT's private dealers. AB <strong>Volvo</strong>considers that the Plaintiff's claim is of no merit.<strong>Volvo</strong> Trucks’ and Renault Trucks’ UK subsidiaries have, togetherwith a number of other international truck companies, become thesubject of an investigation initiated by the OFT (Office of Fair Trading),the British competition authority. <strong>Volvo</strong> Trucks’ and Renault Trucks’British subsidiaries have received letters from the OFT as part of theinvestigation and will cooperate fully with the OFT during the courseof the investigation.In January 2011 <strong>Volvo</strong> <strong>Group</strong> and a number of other companies inthe truck industry have become part of an investigation by the EuropeanCommission regarding a possible violation of EU antitrust rules.<strong>Volvo</strong> <strong>Group</strong> will cooperate fully with the Commission during thecourse of the investigative work.Global actors such as <strong>Volvo</strong> are occasionally involved in tax disputesof different proportions and in different stages. On a regularbasis <strong>Volvo</strong> evaluates the exposure related to such disputes and, tothe extent it is possible to reasonably estimate what the outcome willbe, makes provisions when it is more likely than not that there will beadditional tax to pay.<strong>Volvo</strong> is involved in a number of other legal proceedings. <strong>Volvo</strong> doesnot believe that any liabilities related to such proceedings are likely toentail any risk, in the aggregate, of having a material effect on thefinancial condition of the <strong>Volvo</strong> <strong>Group</strong>.99
Financial information <strong>2010</strong>Notes to consolidated financial statementsNote 30 Cash-flowOther items not affectingcash amounted to: 2009 <strong>2010</strong>Risk provisions and losses related to doubtfulaccounts receivable/customer-financingreceivables 2,779 1,401Capital gains/losses on the sale of subsidiariesand other business units (108) 34Unrealized exchange rate gains/losseson accounts receivable and payable (26) (44)Provision for global profit sharing program – 350Expenses for healthcare benefits as a result ofthe Master Agreement between Mack Trucksand UAW (see note 24) 877 –Provision for restructuring reserves 334 –Write-down of assets held for sale 368 65Other non-cash items 173 (245)4,397 1,561Investments in shares and participations: 2009 <strong>2010</strong>New issue of shares (2) (13)Capital contribution (6) (31)Acquisitions (61) (154)Divestments 16 91Other 15 1(38) (106)Acquired and divested subsidiariesand other business units: 2009 <strong>2010</strong>Acquired subsidiaries andother business units (56) (214)Divested subsidiaries andother business units 205 831149 617Important increase/decrease in bond loans and other loansDuring <strong>2010</strong> the <strong>Volvo</strong> <strong>Group</strong> has reduced its borrowings as a consequenceof a strong cash flow and lower demands of funding from theCustomer Finance Operations.During 2009, the <strong>Volvo</strong> <strong>Group</strong> completed a number of importantfunding transactions. A five year EUR 700 M bond was issued, followedby a three year SEK 4.2 billion bond. <strong>The</strong> <strong>Group</strong> also received a sevenyear loan from the European Investment Bank equivalent to EUR 400 M.<strong>Volvo</strong> Treasury AB, a subsidiary of AB <strong>Volvo</strong>, issued a USD 750 Mguaranteed bond offering at an interest rate of 5.95% due 2015.Note 31 Leasing<strong>Volvo</strong> as a lessorAt December 31, <strong>2010</strong>, future rental income from non-cancellablefinancial and operating leases (minimum leasing fees) amounted to45,530 (50,522). Future rental income is distributed as follows:FinanceleasesOperatingleases2011 12,338 4,0832012–2015 21,009 6,3852016 or later 482 1,233Total 33,829 11,701Allowance for uncollectiblefuture rental income (445)Unearned rental income (2,904)Present value of future rental incomerelated to non-cancellable leases 30,480<strong>Volvo</strong> as a lesseeAt December 31, <strong>2010</strong>, future rental payments (minimum leasingfees) related to non-cancellable leases amounted to 3,916 (4,135).Future rental payments are distributed as follows:FinanceleasesOperatingleases2011 496 8152012-2015 486 1,6052016 or later 66 448Total 1,048 2,868Rental expenses amounted to:2009 <strong>2010</strong>Finance leases:Contingent rents (6) (8)Operating leases:Contingent rents (24) (20)Rental payments (950) (923)Sublease payments 8 6Total (972) (945)100
Book value of assets subject to finance lease:2009 <strong>2010</strong>Acquisition costs:Buildings 123 124Land and land improvements 61 69Machinery and equipment 1,799 1,863Assets under operating lease 343 338Total 2,326 2,394Accumulated depreciation:Buildings (41) (41)Land and land improvements – –Machinery and equipment (1,090) (1,174)Assets under operating lease (78) (81)Total (1,209) (1,296)Book value:Buildings 82 83Land and land improvements 61 69Machinery and equipment 709 689Assets under operating lease 265 257Total 1,117 1,098Note 32 Transactions with related parties<strong>The</strong> <strong>Volvo</strong> <strong>Group</strong> has transactions with some of its associated companies.<strong>The</strong> transactions consist mainly of sales of vehicles to dealers.Commercial terms and market prices apply for the supply of goodsand services to/from associated companies.2009 <strong>2010</strong>Sales to associated companies 529 1,082Purchase from associated companies 91 50Receivables from associated companies, Dec 31 297 174Liabilities to associated companies, Dec 31 8 125<strong>Group</strong> holdings of shares in associated companies are presented innote 15, Shares and participations.<strong>The</strong> <strong>Volvo</strong> <strong>Group</strong> also has transactions with Renault s.a.s. and its subsidiaries.Sales to and purchases from Renault s.a.s. amounted to 52(85) and 1,654 (2,110). Amounts due from and due to Renault s.a.s.amounted to 15 (20) and 291 (457) respectively, at December 31,<strong>2010</strong>. <strong>The</strong> sales were mainly from Renault Trucks to Renault s.a.s. andconsisted of components and spare parts. <strong>The</strong> purchases were mainlymade by Renault Trucks from Renault s.a.s. and consisted mainly oflight trucks. Renault Trucks has a license from Renault s.a.s. for theuse of the trademark Renault.Note 33 Government grantsDuring <strong>2010</strong>, government grants amounting to 472 (810) have beenreceived and 413 (567) have been accounted for in the income statement.Research and development tax credits are included with 204(305) and have mainly been received in France and during 2009 alsoin the US. Other grants were mainly received from the Swedish governmentand the European Commission.Note 34 PersonnelRemuneration policy decided at the <strong>Annual</strong> General Meetingin <strong>2010</strong><strong>The</strong> <strong>Annual</strong> General Meeting of <strong>2010</strong> decided upon principles forremuneration and other employment terms for the members of <strong>Volvo</strong>'s<strong>Group</strong> Executive Committee (“Remuneration Policy”). <strong>The</strong> acceptedprinciples can be summarized as follows:<strong>The</strong> guiding principle is that remuneration and other employmentterms for company management, shall be competitive to ensure that<strong>Volvo</strong> can attract and retain skilled persons in the <strong>Group</strong> Executive Committee.<strong>The</strong> fixed salary shall be competitive and shall reflect the individual'sarea of responsibility and performance.In addition to the fixed salary a variable salary may be paid. <strong>The</strong> variablesalary may for the CEO amount to a maximum of 65% of the fixedsalary and for the other senior executives a maximum of 50% of thefixed salary. <strong>The</strong> variable salary shall be based on the <strong>Volvo</strong> <strong>Group</strong>’s and/or the executive’s respective business area’s or business unit’s fulfilmentof certain financial goals. <strong>The</strong>se goals are decided by the Board of AB<strong>Volvo</strong> and may be related, for example, to operating income and/or cashflow.In addition to fixed and variable salary, normally other customary benefits,such as company car and company healthcare are provided. Inindividual cases, accommodation benefits and other benefits may beprovided.In addition to pension benefits provided by law and collective bargainagreements, the members of the <strong>Group</strong> Executive Committee domiciledin Sweden are offered a defined-contribution pension plan whereby101
Financial information <strong>2010</strong>Notes to consolidated financial statementsthe amount of the individual’s pensions comprises the premium paidand any return. Members of the <strong>Group</strong> Executive Committee residentoutside Sweden or resident in Sweden but having a material connectionto or having been resident in a country other than Sweden areoffered pension solutions that are competitive in the country wherethe members are or have been resident or to which the members havea material connection.With regard to notice of termination of employment for members ofthe <strong>Group</strong> Executive Committee domiciled in Sweden, the notificationperiod is 12 months if the company terminates the employment andsix months if the individual terminates the employment. In addition, theemployee is entitled to a severance pay of 12 months’ salary if <strong>Volvo</strong>terminates the employment. Members resident outside Sweden orresident in Sweden but having a material connection to or having beenresident in a country other than Sweden are offered notice periods fortermination and severance payment that are competetive in the countrywhere the members are or have been resident or to which the membershave a material connection.Fee paid to the Board of directorsAccording to a resolution adopted at the <strong>Annual</strong> General Meeting<strong>2010</strong>, the fee to the Board of Directors appointed at the <strong>Annual</strong> GeneralMeeting for the period until the close of the <strong>Annual</strong> General Meeting2011 shall be paid as follows: <strong>The</strong> Chairman of the Board shouldbe awarded SEK 1,500,000 and each of the other members SEK500,000 with exception of the President and Chief Executive Officerof AB <strong>Volvo</strong>. In addition, SEK 250,000 should be awarded to the chairmanof the audit committee and SEK 125,000 to each of the othertwo members of the audit commmittee and SEK 75,000 to each ofthe members of the remuneration committeeTerms of employment and remuneration to the CEO<strong>The</strong> President and Chief Executive Officer, Leif Johansson, is entitledto a remuneration consisting of a fixed annual salary and a variablesalary. <strong>The</strong> variable salary is based on operating income in relation tothe same period last year and/or cash flow for six months movingperiods up to a maximum of 65% of his fixed annual salary.For the financial year <strong>2010</strong>, Leif Johansson received a fixed salaryof SEK 12,492,450 and a variable salary of SEK 7,986,448. <strong>The</strong> variablesalary corresponded to 64% of the fixed annual salary. Otherbenefits, mainly pertaining to car and housing, amounted to SEK609,542 in <strong>2010</strong>.Leif Johansson is covered by the <strong>Volvo</strong> executive pension plans,<strong>Volvo</strong> Management Pension (VMP) and <strong>Volvo</strong> Executive Pension(VEP). <strong>The</strong> retirement benefit is a defined-contribution plan withrefund protection. <strong>The</strong> disability pension is a defined-benefit plan.Contributions to VMP and VEP are not tax-deductable, the benefitfrom the insurance is not taxable to the company, but pension paid willbe tax-deductable. <strong>The</strong> pensionable salary consists of the annual salaryand the average of the variable salary for the previous five years.<strong>The</strong> premium for the VMP is SEK 30,000 plus 20% of the pensionablesalary over 30 income base amounts and the premium for VEP is10% of pensionable salary. <strong>The</strong>re are no commitments other than thepayment of the premiums. <strong>The</strong> disability pension consists of 70% ofpensionable salary up to 30 income base amounts and 40% of thepensionable salary between 30 and 50 income base amounts. <strong>The</strong>right to disability pension is conditional to employment and will ceaseupon termination of duty.Leif Johansson is also covered by <strong>Volvo</strong> Företagspension, a definedcontribution plan for additional retirement benefit. <strong>The</strong> premium isnegotiated each year, for <strong>2010</strong> the premium amounted to SEK 502 amonth.Pension premiums for the President and CEO amounted to SEK4,680,412 for <strong>2010</strong>.Leif Johansson has a six-month notice of termination on his owninitiative and 12 months notice of termination from AB <strong>Volvo</strong>. He is notentitled to severance payments. In December <strong>2010</strong> Leif Johanssoninformed the Board of AB <strong>Volvo</strong> of his intention to resign in conjunctionwith his 60th birthday in the summer of 2011.Remuneration to other senior executivesFixed and variable salariesMembers of the <strong>Group</strong> Executive Committee and a number of seniorexecutives receive variable salaries in addition to fixed salaries. Variablesalaries are in most cases based on the fulfillment of certainimprovement targets or financial targets. <strong>The</strong> targets are decided bythe Board of Directors in AB <strong>Volvo</strong> and may relate to operating incomein relation to corresponding period previous year and/or cash flow fora six month rolling period. During <strong>2010</strong>, a variable salary could amountto a maximum of 50% of the fixed annual salary.For the financial year <strong>2010</strong>, fixed salaries amounted to SEK55,927,329 and variable salaries amounted to SEK 22,309,808 formembers of the <strong>Group</strong> Executive Committee, excluding the Presidentand CEO. In addition to the CEO and the <strong>Group</strong> Chief Executive, the<strong>Group</strong> Executive Committee comprised 17 members at the beginningand 16 members at the end of the year. Other benefits, mainly pertainingto car and housing, amounted to SEK 5,900,970 in <strong>2010</strong>.Severance payments<strong>The</strong> employment contracts for members of the <strong>Group</strong> Executive Committeeand certain other senior executives contain rules governingseverance payments when the company terminates the employment.<strong>The</strong> rules provide that, when the company terminates the employment,an employee is entitled to severance pay equal to the employee’smonthly salary for a period of 12 or 24 months, depending on age atdate of severance.In agreements concluded after the spring of 1993, severance payis reduced, in the event the employee gains employment during theseverance period, with an amount equal to 75% of the income fromthe new employment. In agreements concluded after the spring of2004, severance pay is reduced by the full income from the newemployment. Furthermore, age limit at date of notice of termination isremoved and with few exceptions, severance pay is entitled for aperiod of 12 months.PensionsMembers of the <strong>Group</strong> Executive Committee and certain other seniorexecutives are offered pensions that are competitive in the country inwhich the person is or have been domiciled or in the country to whichthe person is essentially connected.Previous pension agreements for certain senior executives stipulatedthat early retirement could be obtained from the age of 60. Agreements102
for retirement at age 60 are no longer signed, and are instead replacedby a defined-contribution plan with pension premium payments at thelongest to the age of 65 years. <strong>The</strong> premium constitutes 10% of thepensionable salary.Earlier defined-benefit pension plans, which entitled the employeeto 50% of the pensionable salary after normal retirement age, havealso been replaced by a defined-contribution plan. <strong>The</strong> pension planincludes employees born before 1979 and is a complement to thecollective agreement regarding occupational pension. <strong>The</strong> premiumconstitutes of SEK 30,000 plus 20% of the pensionable salary over30 income base amounts. <strong>The</strong> pensionable salary consists of theannual salary and the average of the variable salary for the previousfive years. Pension premiums amounted to SEK 40,478,675 for othersenior executives in <strong>2010</strong>.<strong>Volvo</strong> <strong>Group</strong>’s total costs for remuneration and benefits tosenior executivesCosts for total remuneration and benefits to the members of the<strong>Group</strong> Executive Committee (GEC) in <strong>2010</strong> is pertaining to the following:fixed salary SEK 89 million (91); variable salary SEK 39 million (8);other benefits SEK 10 million (14) and pensions SEK 51 million (45).Total costs for members of the GEC include social fees on salariesand benefits, special pension tax and additional costs for other benefits.<strong>The</strong> remuneration model of the <strong>Volvo</strong> group is to a main partdesigned to follow changes in the profitability of the group.Incentive programs<strong>The</strong> <strong>Annual</strong> General Meeting held in 2009 approved a share-basedincentive program for certain senior executives with allotment in<strong>2010</strong>. <strong>The</strong> financial targets set as conditions for allotment were notfulfilled and no allotment was therefore made.<strong>The</strong> Board of Directors will propose to the <strong>Annual</strong> General Meetinga performance-based long-term share-based incentive program formaximum 300 of the <strong>Volvo</strong> <strong>Group</strong>’s top executives. <strong>The</strong> program willrequire that the participants invest part of their own salary in <strong>Volvo</strong>shares. Details about the program will be announced in connectionwith the Notice to attend the <strong>Annual</strong> General Meeting.103
Financial information <strong>2010</strong>Notes to consolidated financial statementsNumber ofemployees2009 <strong>2010</strong>of whichwomen, %Number ofemployeesof whichwomen, %Average number of employeesAB <strong>Volvo</strong>Sweden 190 46 198 51SubsidiariesSweden 23,637 20 23,313 20Western Europe 25,533 17 23,515 17Eastern Europe 5,542 21 5,768 22North America 10,091 18 12,429 19South America 4,180 14 5,264 14Asia 16,650 10 21,205 10Other countries 2,261 17 2,558 15<strong>Group</strong> total 88,084 17 94,250 17Number atyear-end2009 <strong>2010</strong>of whichwomen, %Number atyear-endof whichwomen, %Board members 1 and other senior executivesAB <strong>Volvo</strong>Board members 1 12 8 12 17CEO and GEC 18 6 17 6<strong>Volvo</strong> <strong>Group</strong>Board members 1 880 11 929 12Presidents and other senior executives 1,330 19 1,053 151 Excluding deputy Board members.2009 <strong>2010</strong>of whichvariablesalariesof whichvariablesalariesWages, salaries and otherremunerations, SEK MBoard andPresidents 1OtheremployeesBoard andPresidents 1OtheremployeesAB <strong>Volvo</strong>Sweden 19.0 1.1 140.6 26.2 8.0 184.6SubsidiariesSweden 56.1 5.0 9,662.6 69.5 16.4 10,144.9Western Europe 432.8 10.7 9,995.8 447.0 4.4 9,338.4Eastern Europe 110.0 9.6 904.2 43.9 3.5 913.8North America 142.1 14.7 4,974.0 182.2 19.9 5,188.1South America 43.5 29.4 1,015.9 60.1 40.3 1,297.4Asia 93.1 5.6 4,602.9 155.6 11.8 5,099.3Other countries 44.6 11.5 625.8 46.7 8.5 665.5<strong>Group</strong> total 941.2 87.6 31,921.8 1,031.2 112.8 32,832.0Wages,salaries, remunerations2009 <strong>2010</strong>Wages,salaries,remunerationsWages, salaries and other remunerationsand social costs, SEK MSocialcostsof whichpens. costsSocialcostsof whichpens. costsAB <strong>Volvo</strong> 2 159.6 139.5 107.5 210.8 119.9 81.9Subsidiaries 32,703.4 12,746.0 4,593.2 33,652.4 11,823.6 4,658.0<strong>Group</strong> total 3 32,863.0 12,885.5 4,700.7 33,863.2 11,943.5 4,739.91 Including current and former Board members, Presidents and ExecutiveVice Presidents.2 <strong>The</strong> Parent Company’s pension costs, pertaining to Board members andPresidents are disclosed in Note 3 in the Parent Company.3 Of the <strong>Group</strong>’s pension costs, 146.6 (135.1) pertain to Board members andPresidents, including current and former Board members, Presidents andExecutive Vice Presidents. <strong>The</strong> <strong>Group</strong>’s outstanding pension obligations tothese individuals amount to 334.4 (267.2).<strong>The</strong> cost for non-monetary benefits in the <strong>Group</strong> amounted to 1,554.3(1,300.0) of which 59.3 (49.3) to Board members and Presidents.<strong>The</strong> cost for non-monetary benefits in the Parent Companyamounted to 9.0 (9.8) of which 1.7 (1.7) to Board members andPresidents.104
Note 35 Fees to the auditorsFees to the auditors 2009 <strong>2010</strong>PricewaterhouseCoopers- Audit fees 110 102- Audit-related fees 7 6- Tax advisory services 14 16- Other fees 3 3Total 134 127Audit fees to others 1 1<strong>Volvo</strong> <strong>Group</strong> Total 135 128Audit involves examination of the annual report and financial accountingand the administration by the Board and the President. Auditrelatedassignments mean quality assurance services required byenactment, articles of association, regulations or agreement. <strong>The</strong>amount includes among other things the fee for the half-year review.Tax services include both tax consultancy and tax compliance services.All other tasks are defined as other. 2009 figures are restatedfor comparability.Note 36 Goals and policies in financial risk managementApart from derivatives, <strong>Volvo</strong>’s financial instruments consist of bankloans, finance leasing contracts, accounts payable, accounts receivable,shares and participations, as well as cash and short-term investments.<strong>The</strong> primary risks deriving from the handling of financial instrumentsare interest-rate risk, currency risk, liquidity risk and credit risk.All of these risks are handled in accordance with an established financialpolicy.Interest-rate risksInterest-rate risk refers to the risk that changed interest-rate levels willaffect consolidated earnings and cash flow (cash-flow risks) or the fairvalue of financial assets and liabilities (price risks). Matching the interest-fixingterms of financial assets and liabilities reduces the ex posure.Interest-rate swaps are used to change/influence the interest-fixingterm for the <strong>Group</strong>’s financial assets and liabilities. Currency interestrateswaps permit borrowing in foreign currencies from different marketswithout introducing currency risk. <strong>Volvo</strong> also has standardizedinterest-rate forward contracts (futures) and FRAs (forward-rateagreements). Most of these contracts are used to hedge interest-ratelevels for short-term borrowing or investment.Cash-flow risks<strong>The</strong> effect of changed interest-rate levels on future currency andinterest-rate flows refers mainly to the <strong>Group</strong>’s customer financingoperations and net financial items. Within the customer finance operationsthe degree of matching interest-rate fixing on borrowing andlending is measured. <strong>The</strong> calculation of the matching degree excludesequity, which in the customer finance operations amount to between8 and 10%. According to the <strong>Group</strong>’s policy, the degree of matchingfor interest-rate fixing on borrowing and lending in the customerfinancingoperations must exceed 80%. At year-end <strong>2010</strong>, the degreeof such matching was 100% (100). A part of the short-term financingof the customer financing operations can however be pertaining tointernal loans from the industrial operations, why the matching ratio inthe <strong>Volvo</strong> group then may be slightly lower. At year-end <strong>2010</strong>, in additionto the assets in its customer-financing operations, <strong>Volvo</strong>’s interest-bearingassets consisted primarily of cash, cash equivalents andliquid assets invested in short-term interest-bearing securities. <strong>The</strong>objective is to achieve an interest-fixing term of three months for theliquid assets in <strong>Volvo</strong>’s industrial operations through the use of derivatives.On December 31, <strong>2010</strong>, after taking derivatives into account,the average interest on these assets was 2.0% (1.1). After takingderivatives into account, outstanding loans had interest terms correspondingto an interest-rate fixing term of three months and the averageinterest at year-end amounted to 4.3% (4.1).Price risksExposure to price risks as result of changed interest-rate levels refersto financial assets and liabilities with a longer interest-rate fixing term(fixed interest). A comparison of the reported values and the fair valuesof all of <strong>Volvo</strong>’s financial assets and liabilities, as well as its derivatives,is provided in note 37, Financial instruments.Assuming that the market interest rates for all currencies suddenlyrose by one percentage point (100 interest-rate points) over the interest-ratelevel on December 31, <strong>2010</strong>, for the next 12-month period, allother variables remaining unchanged, <strong>Volvo</strong>’s net interest incomewould be negatively impacted by 295 (neg: 354) considering an interestrate fixing term of three months for receivables and liabilities.Assuming that the market interest rates for all currencies fell in asimilar manner by one percentage point (100 interest-rate points),<strong>Volvo</strong>’s net interest income would be positively impacted by a correspondingamount.<strong>The</strong> following table shows the effect on income before taxes in<strong>Volvo</strong>’s key financing currencies if the interest-rate level were toincrease by one percentage point, (100 interest-rate points) not consideringinterest rate fixing terms.SEK MEffect on incomeSEK (46)USD (76)EUR 55CNY 17JPY (221)INR 13<strong>The</strong> above sensitivity analysis is based on assumptions that rarelyoccur in reality. It is not unreasonable that market interest rateschange with one percentage point (100 interest-rate points) over a12-month period. However, in reality, market interest rates usually donot rise or fall at one point in time. Moreover, the sensitivity analysisalso assumes a parallel shift in the yield curve and an identical effect105
Financial information <strong>2010</strong>Notes to consolidated financial statementsof changed market interest rates on the interest-rates of both assetsand liabilities. Consequently, the effect of actual interest-rate changesmay deviate from the above analysis.Currency risks<strong>The</strong> content of the reported balance sheet may be affected bychanges in different exchange rates. Currency risks in <strong>Volvo</strong>’s operationsare related to changes in the value of contracted and expectedfuture payment flows (commercial currency exposure), changes in thevalue of loans and investments (financial currency exposure) andchanges in the value of assets and liabilities in foreign subsidiaries(currency exposure of shareholders’ equity). <strong>The</strong> aim of <strong>Volvo</strong>’s currency-riskmanagement is to minimize, over the short term, negativeeffects on <strong>Volvo</strong>’s earnings and financial position stemming fromexchange-rate changes.Commercial currency exposureIn order to hedge the value of future payment flows in foreign currencies,<strong>Volvo</strong> uses forward contracts and currency options. In the fourth quarterof 2009, <strong>Volvo</strong> revised its hedging policy in order to only hedge firm flows,whereof the major part are realised within six months. Also, from thefourth quarter of 2009, hedge accounting was not applied for new contracts.For details regarding Hedge accounting, see note 37.<strong>The</strong> nominal amount of all outstanding forward and option contractsamounted to SEK 10.9 billion (17.2) at December 31, <strong>2010</strong>. Onthe same date, the fair value of these contracts was positive in anamount of SEK 118 million (186).<strong>The</strong> table below presents the effect a change of the value of theSwedish krona in relation to other currencies would have on the fairvalue in the respective currencies of outstanding contracts. In reality,currencies usually do not change in the same direction at any giventime, so the actual effect of exchange-rate changes may differ fromthe below sensitivity analysis.Change in value of SEK in relation toall foreign currencies, %Fair value ofoutstanding contracts(10) (218)0 11810 454Financial currency exposureLoans and investments in the <strong>Group</strong>’s subsidiaries are done mainlythrough <strong>Volvo</strong> Treasury in local currencies, which minimizes individualcompanies’ financial currency exposure. <strong>Volvo</strong> Treasury uses variousderivatives, in order to facilitate lending and borrowing in different currencieswithout increase the company’s own risk. <strong>The</strong> financial netposition of the <strong>Volvo</strong> <strong>Group</strong> is affected by exchange rate fluctuations,since financial assets and liabilities are distributed among <strong>Group</strong>companies that conduct their operations in different currencies.Currency exposure of shareholders’ equity<strong>The</strong> consolidated value of assets and liabilities in foreign subsidiariesis affected by current exchange rates in conjunction with translation ofassets and liabilities to Swedish kronor. To minimize currency exposureof shareholders’ capital, the size of shareholders’ equity in foreignsubsidiaries is continuously optimized with respect to commercial andlegal conditions. Currency hedging of shareholders’ equity may occurin cases where a foreign subsidiary is considered overcapitalized. Netassets in foreign subsidiaries and associated companies amounted atyear-end <strong>2010</strong> to SEK 60.3 billion (59.4). Of this amount, SEK 0.8billion (4.1) was currency-hedged through loans in foreign currencies.<strong>The</strong> remaining loans used as hedging instruments are due in 2011and SEK 3.1 billion expired in <strong>2010</strong>. <strong>The</strong> need to undertake currencyhedging relating to investments in associated companies and othercompanies is assessed on a case-by-case basis.Credit risks<strong>Volvo</strong>’s credit granting is steered by <strong>Group</strong>-wide policies and customer-classificationrules. <strong>The</strong> credit portfolio should contain a sounddistribution among different customer categories and industries. <strong>The</strong>credit risks are managed through active credit monitoring, follow-uproutines and, where applicable, product reclamation. Moreover, regularmonitoring ensures that the necessary provisions are made forincurred losses on doubtful receivables. In the tables below, ageinganalyses are presented of accounts receivables overdue and customerfinance receivables overdue in relation to the reserves made. Itis not unusual that a receivable is settled a couple of days after duedate, which affects the extent of the age interval 1–30 days.<strong>The</strong> credit portfolio of <strong>Volvo</strong>’s customer-financing operationsamounted at December 31, <strong>2010</strong>, to approximately net SEK 73 billion(82). <strong>The</strong> credit risk of this portfolio is distributed over a large numberof retail customers and dealers. Collaterals are provided in the form ofthe financed products. Credit granting aims for a balance betweenrisk exposure and expected yield. <strong>The</strong> <strong>Volvo</strong> <strong>Group</strong>’s financial assetsare largely managed by <strong>Volvo</strong> Treasury and invested in the money andcapital markets. All investments must meet the requirements of lowcredit risk and high liquidity. According to <strong>Volvo</strong>’s credit policy, counterpartiesfor investments and derivative transactions should have arating of A or better from one of the well-established credit ratinginstitutions.<strong>The</strong> use of derivatives involves a counterparty risk, in that a potentialgain will not be realized if the counterparty fails to fulfill its part ofthe contract. To reduce the exposure, master netting agreements aresigned, wherever possible, with the counterparty in question. Counterpartyrisk exposure for futures contracts is limited through daily ormonthly cash transfers corresponding to the value change of opencontracts. <strong>The</strong> estimated gross exposure to counterparty risk relatingto futures, interest-rate swaps and interest-rate forward contracts,options and commodities contracts amounted at December 31, <strong>2010</strong>,to 331 (588), 3,539 (3,560 ), 190 (167) and 168 (42).Credit portfolio – Accounts receivable and Customer financingreceivablesAccounts receivable 2009 <strong>2010</strong>Accounts receivable gross 22,638 25,154Valuation allowance for doubtfulaccounts receivable (1,301) (721)Accounts receivable net 21,337 24,433For details regarding the accounts receivable and the valuation fordoubtful accounts receivable, refer to note 20.Customer financing receivables 2009 <strong>2010</strong>Customer financing receivables gross 83,490 74,013Valuation allowance for doubtful customerfinancing receivables (1,513) (1,325)Customer financing receivables net 81,977 72,688106
Change of valuation allowances for doubtfulcustomer financing receivables <strong>2010</strong>Balance sheet, December 31, preceding year 1,513New valuation allowance charged to income 1,586Reversal of valuation allowance charged to income (207)Utilization of valuation allowance related to actual losses (1,451)Translation differences (116)Balance sheet, December 31 1,325For details regarding the long-term customer-financing receivablesand the short-term customer receivables, refer to note 16 and 19.Age analysis of portfolio value – Accounts receivable and Customer financing receivables (days/SEK M)2009 <strong>2010</strong>Accounts receivable not due 1–30 31–90 >90 Total not due 1–30 31–90 >90 TotalAccounts receivable gross 19,705 1,032 616 1,285 22,638 23,324 799 391 640 25,154Valuation allowance for doubtfulaccounts receivable (493) (37) (46) (725) (1,301) (205) (26) (26) (464) (721)Accounts receivable notrecognized as impairment losses 19,212 995 570 560 21,337 23,119 773 365 176 24,4332009 <strong>2010</strong>Customer financing receivablespayments due not due 1–30 31–90 >90 Total not due 1–30 31–90 >90 TotalOverdue amount – 655 560 740 1,955 – 490 405 805 1,700Valuation allowance for doubtfulcustomer financing receivables (99) (111) (159) (313) (682) (91) (56) (74) (308) (530)Customer financing receiv ablesnot recognized as impairmentlosses (99) 544 401 427 1,273 (91) 434 331 497 1,170<strong>The</strong> table above presents overdue payments within the customerfinancing operations in relation to specific reserves. <strong>The</strong> total contractualamount that the overdue payments are pertaining to are presentedin the table below. In order to provide for occured but not yetidentified customer financing receivables overdue, there are additionalreserves of 795 (831). <strong>The</strong> remaining exposure is secured byliens on the purchased equipment, and, in certain circumstances,other credit enhancements such as personal guarantees, credit insurance,liens on other property owned by the borrower etc.Collaterals taken in possession that meet the recognition criteriaamounted to 594 (1,391) at December 31, <strong>2010</strong>.Customer financing2009 <strong>2010</strong>receivables total contractualamountnot due 1–30 31–90 >90 Total not due 1–30 31–90 >90 TotalCustomer financing receiv ables 67,692 7,886 4,511 3,401 83,490 63,153 6,425 2,369 2,066 74,013Renegotiated financial assetsFinancial assets that would otherwise have been overdue whoseterms have been renegotiated amount to 6,578 (8,948) and aremainly related to renegotiated customer contracts within the customerfinance operations.107
Financial information <strong>2010</strong>Notes to consolidated financial statementsConcentration of credit riskCustomer concentration<strong>The</strong> ten largest customers in Customer Finance account for 5.8%(4.8) of the total asset portfolio. <strong>The</strong> rest of the portfolio is pertinentto a large number of customer. This way the credit risk is spreadacross both many markets and among many customers.Concentration by geographical market<strong>The</strong> table below shows the concentration of the customer financingportfolio divided into geographical markets.Geographical market Percentage of customer financing portfolioEurope 47.0North America 27.3Asia 9.9Other markets 15.8Liquidity risks<strong>Volvo</strong> assures itself of sound financial preparedness by always keeping acertain percentage of its sales in liquid assets. A sound balance betweenshort- and long-term borrowing, as well as borrowing preparedness in theform of overdraft facilities, are intended to meet long-term financingneeds.<strong>The</strong> table below shows expected future cash-flows including derivativesrelated to financial liabilities. Capital flow refers to expectedpayments of loans and derivatives. Interest flow refers to the futureinterest payments on loans and derivatives based on interests ratesexpected by the market. <strong>The</strong> interest flow is reported within cash flowfrom operating activities.See also note 26 for long-term loans maturity analysis and forcredit facilities granted but not utilized as well as note 31 for contractualduration analysis of future rental payments of noncancellablefinance lease agreements and operating lease agreements.Future cash-flow including derivativesrelated to financial liabilities Capital flow Interest flow2011 (39,199) (4,842)2012 (23,497) (3,382)2013 (13,422) (2,650)2014 (17,723) (1,718)2015 (10,210) (1,135)2016 (6,476) (684)2017– (12,548) (291)108
Note 37Financial instruments<strong>The</strong> financial assets treated within the framework of IAS 39 are classifiedeither as financial assets at fair value through profit and loss, asloans and receivables, as investments held to maturity or as availablefor-salefinancial assets. Financial liabilities are classified as financialliabilities at fair value through profit and loss or as financial liabilitiesvalued at amortized cost. For more information about the categorieswithin Financial assets and liabilities see note 1.Information regarding reported and fair valuesIn the table below, carrying values are compared with fair values of financial instruments.December 31, 2009 December 31, <strong>2010</strong>Carrying value Fair value Carrying value Fair valueAssetsFinancial assets at fair value through profit and loss<strong>The</strong> <strong>Volvo</strong> <strong>Group</strong>’s outstanding currency risk contracts – commercial exposure 467 467 197 197<strong>The</strong> <strong>Volvo</strong> <strong>Group</strong>’s outstanding raw materials contracts 42 42 168 168<strong>The</strong> <strong>Volvo</strong> <strong>Group</strong>’s outstanding interest risk contracts – financial exposure 3,848 3,848 3,863 3,863Marketable securities 16,676 16,676 9,767 9,76721,033 21,033 13,995 13,995Loans receivable and other receivablesAccounts receivable 21,337 – 24,433 –Customer financing receivables 3 81,977 – 72,688 –Loans to external parties and other interest-bearing receivables 349 – 253 –Conduit loans and other interest-bearing loans 131 – 104 –103,794 – 97,478 –Financial assets available for saleShares and participations for which:a market value can be calculated 1 707 707 836 836a market value can not be calculated 2 1,337 – 1,262 –2,044 707 2,098 836Cash and cash equivalents 21,234 21,234 22,966 22,966LiabilitiesFinancial liabilities at fair value through profit and loss<strong>The</strong> <strong>Volvo</strong> <strong>Group</strong>'s outstanding currency risk contracts – commercial exposure 281 281 79 79<strong>The</strong> <strong>Volvo</strong> <strong>Group</strong>’s outstanding raw materials contract 58 58 41 41<strong>The</strong> <strong>Volvo</strong> <strong>Group</strong>'s outstanding interest risk contracts – financial exposure 3,285 3,285 4,487 4,4873,624 3,624 4,607 4,607Financial liabilities valued at amortized costLong term bond loans and other loans 105,427 112,733 82,679 88,304Short term bank loans and other loans 51,448 51,943 39,142 39,379156,875 164,676 121,821 127,683Trade Payables 35,955 – 47,250 –1 Refers to <strong>Volvo</strong>’s ownership in Deutz AG valued at market value and TrucksAsia’s holdings in listed shares. <strong>The</strong> carrying value is equal to the marketvalue for holdings in listed companies2 Possession in unlisted shares, for which a reliable fair value cannot be determined,are reported at the acquisition value reduced in appropriate cases bywrite-downs. No single block of shares represent a significant amount.3 <strong>Volvo</strong> does not estimate the risk premium for the customer financing receivablesand chooses therefore not to disclose fair value for this category.renot to disclose fair value for this category.109
Financial information <strong>2010</strong>Notes to consolidated financial statementsFinancial assets and liabilities measured at fair valueDecember 31, 2009 December 31, <strong>2010</strong>Assets Level 1 Level 2 Level 3 Total Level 1 Level 2 Level 3 TotalFinancial assetsat fair value through profit and lossCurrency risk contracts– commercial exposure – 467 – 467 – 197 – 197Raw materials contracts – 42 – 42 – 168 – 168Interest risk contracts– financial exposure – 3,848 – 3,848 – 3,863 – 3,863Marketable securities – 16,676 – 16,676 – 9,767 – 9,767Available for sale financial assetsShares and participations for which:a market value can be calculated 707 – – 707 836 – – 836Total 707 21,033 – 21,740 836 13,995 14,831LiabilitiesFinancial liabilitiesat fair value through profit and lossCurrency risk contracts– commercial exposure – 281 – 281 – 79 – 79Raw materials contracts – 58 – 58 – 41 – 41Interest risk contracts– financial exposure – 3,285 – 3,285 – 4,487 – 4,487Total – 3,624 – 3,624 – 4,607 – 4,607<strong>The</strong> levels in the table above reflect to what extent market values havebeen used when valuating financial assets and liabilities. Financialinstruments in level 1 are valued based on unadjusted quoted marketprices for identical assets or liabilities. Level 2 instruments are valuedbased on inputs, other than quoted prices within level 1, that areobservable either directly (as prices) or indirectly (derived from prices).Level 3 instruments would be valued based on unobservable inputs,i.e. using a valuation technique based on assumptions. <strong>Volvo</strong> has nofinancial instruments classified as level 3 instruments.Derecognition of financial assetsFinancial assets that have been transferred in such a way that part orall of the financial assets do not qualify for derecognition, are includedin reported assets of the <strong>Volvo</strong> <strong>Group</strong>. In accordance with IAS 39Financial Instruments, Recognition and Measurement, an evaluationis made whether substantially all the risks and rewards have beentransferred to an external party. When <strong>Volvo</strong> has concluded that it isnot the case, the part of the financial assets that reflect <strong>Volvo</strong>’s continuousinvolvement are being recognized. On December 31, <strong>2010</strong>,<strong>Volvo</strong> recognizes SEK 1.2 billion (2.2) corresponding to <strong>Volvo</strong>’s continuousinvolvement, mostly within the customer financing operations.110
Gains, losses, interest income and expenses related to financial instruments<strong>The</strong> table below shows how gains and losses as well as interest income and expense have affected income after financial items in the <strong>Volvo</strong><strong>Group</strong> divided on the different categories of financial instruments.2009 <strong>2010</strong>Gains/LossesInterestincomeInterestexpensesGains/LossesInterestincomeInterestexpensesFinancial assets and liabilitiesat fair value through profit and loss 1Marketable securities 248 0 0 290 0 0Derivatives for financial exposure (1,272) 0 0 319 0 0Loans receivable and other receivables 0 10 0 0 7 0Financial assets available for saleShares and participations for whicha market value can be calculated 11 – – 40 – –Shares and participations for whicha market value cannot be calculated 19 – – 10 – –Cash and cash equivalents 0 299 0 0 423 0Financial liabilities valued at amortized cost 0 0 (6,007) 0 0 (5,486)Effect on income (994) 309 (6,007) 659 430 (5,486)1 Accrued and realized interest is included in gains and losses related to Financial assets and liabilities at fair value through profit and loss.Accrued and realized interest on derivates for commercial exposure is neg 17 (neg: 68).Net effect of foreign exchange gains and lossesForeign exchange gains and losses pertaining to financial instruments have affected income after financial items inthe <strong>Volvo</strong> <strong>Group</strong> according to the table below:2009 <strong>2010</strong>Derivatives for financial exposure (1,205) (1,545)Cash and cash equivalents 1 – (274)Loans originated by the company and financial liabilities value at amortized cost - <strong>Volvo</strong> internal 958 1,560Effect on income (247) (259)1 <strong>The</strong> net effect of forein exchange gains and losses on Cash and cash equivalents pertains to the devaluation in Venezuela, loss 274.Net effect of foreign exchange gains and losses on derivatives for commercial exposure have affected operating income in the <strong>Volvo</strong> group with 676 (neg: 3,322).Various categories of financial instruments are treated separately inspecific notes. See note 15 for Shares and participations, notes 16and 19 for Customer-financing receivables, note 20 for Other shorttermreceivables, note 21 for Marketable securities, note 22 for Cashand cash equivalents, note 26 for Non-current liabilities and note 27for Current liabilities.111
Financial information <strong>2010</strong>Notes to consolidated financial statementsBelow is a presentation of derivative instruments and options.Outstanding derivative instruments for dealing with currencyand interest-rate risks related to financial assets and liabilitiesDec 31, 2009 Dec 31, <strong>2010</strong>NotionalamountCarryingvalueNotionalamountCarryingvalueInterest-rate swaps– receivableposition 64,162 3,560 70,067 3,539– payableposition 100,460 (2,948) 65,576 (3,924)Forwards and futures– receivableposition 0 0 900 0– payableposition 30,274 (3) 400 0Foreign exchange derivative contracts– receivableposition 16,165 172 13,336 143– payableposition 15,424 (214) 25,192 (381)Options purchased– receivableposition 1,985 116 1,126 181– payableposition 353 (3) 0 0Options written– receivableposition 13 0 0 0– payableposition 2,572 (117) 976 (182)Total 563 (624)Outstanding forward contracts and options contracts forhedging of currency risk and interest risk of commercialreceivables and liabilitiesDec 31, 2009 Dec 31, <strong>2010</strong>NotionalamountCarryingvalueNotionalamountCarryingvalueForeign exchange derivative contracts– receivableposition 9,307 416 6,418 188– payableposition 5,448 (281) 3,381 (75)Options purchased– receivableposition 1,222 51 558 9– payableposition – – – –Options written– receivableposition – – – –– payableposition 1,193 – 558 (4)Subtotal 186 118Raw materials derivative contracts– receivableposition 367 42 579 168– payableposition 106 (58) 39 (41)Total 170 245112
Hedge accountingCash-flow hedging<strong>Volvo</strong> only hedges firm flows whereof the major part is realized withinsix months. <strong>The</strong> hedged amount of firm flows for all periods are withinthe framework of <strong>Volvo</strong>’s currency policy.Derivative financial instruments used for hedging of future commercialcurrency exposure that is firm and forecasted electricity consumptionhave, in accordance with IAS 39, been reported at fair valuein the balance sheet. Since the fourth quarter 2009 hedge accountingis not applied on new financial instruments used for hedging ofcommercial flows. However, for the major part of previously enteredfinancial instruments hedge accounting is continuously applied. <strong>The</strong>majority of those financial instruments have expired during the year.When hedge accounting is not applied, unrealized gains and lossesfrom fluctuations in the fair values of the financial instruments arereported in the income statement in the segment <strong>Group</strong> headquarterfunctions and other. This has positivley affected the <strong>Group</strong>’s operatingincome by 124 (neg: 27) in <strong>2010</strong>. When the derivative financial instrumenthas been realized the income effect is reported within therespective segments.When cash-flow hedge accounting is applied for previously enteredfinancial instruments <strong>Volvo</strong> tests for effectiveness. Hedging is consideredto be effective when the forecasted future cash flow’s currencyfluctuation and maturity date coincide with those of the financialinstrument. <strong>The</strong> hedging relationship is regularly tested up until itsmaturity date. If the identified relationships are no longer deemedeffective, the currency fluctuations on the hedging instrument fromthe last period the instrument was considered effective are reportedin the <strong>Group</strong>’s income statement. For <strong>2010</strong>, <strong>Volvo</strong> reported 4 (loss 36)as a gain related to the ineffectiveness of cash-flow hedging.As of January 1, 2011 unrealized changes in fair value of financialinstruments related to a receivable or payable will be reported withinthe respective segments. All other unrealized changes in fair value offinancial instruments will henceforth be reported in the income statementin the segment <strong>Group</strong> headquarter functions and other.Hedge accounting is applied on the financial instruments hedgingforecasted electricity consumption. <strong>The</strong> fair value is debited or creditedto a separate component in other comprehensive income to theextent the requirements for cash-flow hedge accounting are fulfilled.Accumulated changes in the value of the hedging instruments arereported in the income statement of the same time as the underlyinghedged transaction affects the <strong>Group</strong>s results. <strong>The</strong> table in note 23,Shareholders’ equity shows how the electricity consumption reservehas changed during the year. To the extent that the requirements forhedge accounting are not met, any changes in the value attributableto derivatives are immediately charged to the income statement.Hedging of forecasted electricity is considered to be effectivewhen predetermined factors that affect electricity prices are in agreementwith forecasts of future electricity consumption and designatedderivative instruments. <strong>The</strong> hedging relationship is regularly tested upuntil its maturity date. If the identified relationships are no longerdeemed effective, the currency fluctuations on the hedging instrumentfrom the last period the instrument was considered effective arereported in the <strong>Group</strong>’s income statement. For 2009, <strong>Volvo</strong> reported4 (4) related to the ineffectiveness of the hedging of forecasted electricityconsumption.Hedging of currency and interest rate risks on loans<strong>Volvo</strong> has chosen to apply hedge accounting for a loan of approximatelyEUR 1 billion borrowed in the second quarter of 2007. Fairvalue of the outstanding hedge instrument amounts to 1,168 (1,159).<strong>The</strong> carrying value of the loan related to hedge accounting amountsto a negative 977 (neg: 970). <strong>The</strong> changes in the fair value of theoutstanding hedge instruments and the changes in the carrying valueof the loan are reported in the income statement.Changes in market value on the instruments used for hedging ofrisk in financial assets and liabilities for which hedge accounting hasnot been applied are reported in net financial income and expense,see note 11. In the future, in applicable cases when the requirementsfor hedge accounting are considered to be fulfilled, <strong>Volvo</strong> will considerto apply hedge accounting for this kind of instruments.Hedging of net investments in foreign operations<strong>Volvo</strong> applies hedge accounting for certain net investments in foreignoperations. Current earnings from such hedging shall be accountedfor in a separate item within shareholders’ equity. A total of negative202 (neg 314) in shareholders’ equity relating to hedging of netinvestments in foreign operations was reported in <strong>2010</strong>.<strong>The</strong> <strong>Volvo</strong> <strong>Group</strong>’s outstanding forward contracts and options contracts for hedging of commercial currency risksOtherCurrenciescurrenciesMillion USD GBP EUR JPY Net SEKDue date 2011 amount 687 68 93 (2,488) 570Due date 2012 amount (4) – – – 313Due date 2013 amount (3) – – – 20Total 680 68 93 (2,488) 903FairvalueAverage contract rate 7.04 11.03 9.37 0.08Fair value of outstanding forward contracts 85 14 28 3 (12) 118<strong>The</strong> hedged amount of firm flows for all periods are within the framework of <strong>Volvo</strong>’s currency policy.113
Financial information <strong>2010</strong>Parent Company AB <strong>Volvo</strong>Corporate registration number 556012-5790.Amounts in SEK M unless otherwise specified. Amounts within parenthesesrefer to preceding year.Board of Directors’ reportAB <strong>Volvo</strong> is Parent Company of the <strong>Volvo</strong> <strong>Group</strong> and its operations comprisethe <strong>Group</strong>’s head office with staff together with some corporatefunctions.Income from investments in <strong>Group</strong> companies includes dividendsamounting to 8,145 (10,275) and <strong>Group</strong> contributions and transfer priceadjustments, net of 5,126 (neg: 16,859). Dividends were received from<strong>Volvo</strong> Holding Sverige AB, 5,200, <strong>Volvo</strong> Construction Equipment NV,1,801 and from <strong>Volvo</strong> Korea Holding AB, 1,000.<strong>The</strong> carrying value of shares and participations in <strong>Group</strong> companiesamounted to 59,429 (57,062), of which 58,903 (56,536) pertained toshares in wholly owned subsidiaries. <strong>The</strong> corresponding shareholders’equity in the subsidiaries (including equity in untaxed reserves but excludingminority interests) amounted to 90,261 (91,944).In <strong>2010</strong> shareholders’ contributions were made to <strong>Volvo</strong> <strong>Group</strong> JapanCorporation, 3,493, consisting of preference shares in UD Trucks Corporation,and to Kommersiella Fordon Europa AB, 1,801.Other shares and participations include the direct and indirect ownershipin <strong>Volvo</strong> Eicher Commercial Vehicles (VECV) for total amount of1,845. In the consolidated accounts of the <strong>Volvo</strong> <strong>Group</strong>, VECV is reportedas a joint venture and consolidated according to the proportional method.<strong>The</strong> indirect ownership is an effect of the acquisition of 8.1% of EicherMotors Limited, which is the other venturer of VECV. <strong>The</strong>se shares are notseparately valued as they form a part of the indirect ownership in VECV.Shares and participations in non-<strong>Group</strong> companies included 170(206) in associated companies that are reported in accordance withthe equity method in the consolidated accounts. <strong>The</strong> portion of shareholders’equity in associated companies accruing to AB <strong>Volvo</strong> totaled322 (300). Shares and participations in non-<strong>Group</strong> companies includelisted shares in Deutz AG with a carrying value of 458, correspondingto the quoted market price at year-end. In <strong>2010</strong> revaluation of theownership has increased the value by 172, recognized in equity andincluded in Other comprehensive income in the income statement.Financial net debt amounted to 30,376 (18,922).AB <strong>Volvo</strong>’s risk capital (shareholders’ equity plus untaxed reserves)amounted to 41,857 corresponding to 54% of total assets. <strong>The</strong> comparablefigure at year-end 2009 was 45%.Income statementSEK M 2009 <strong>2010</strong>Net sales Note 2 698 564Cost of sales Note 2 (698) (564)Gross income 0 0Administrative expenses Note 2, 3 (485) (652)Other operating income and expenses Note 4 (13) 8Income from investments in <strong>Group</strong> companies Note 5 (6,584) 13,252Income from investments in associated companies Note 6 4 (94)Income from other investments Note 7 2 3Operating income (7,076) 12,517Interest income and similar credits Note 8 1 0Interest expenses and similar charges Note 8 (393) (893)Other financial income and expenses Note 9 (8) (65)Income after financial items (7,476) 11,559Allocations Note 10 700 0Income taxes Note 11 4,537 (1,231)Income for the period (2,239) 10,328Other comprehensive incomeIncome for the period (2,239) 10,328Available-for-sale investments 74 172Other comprehensive income, net of income taxes 74 172Total comprehensive income for the period (2,165) 10,500114
Balance sheetSEK M December 31, 2009 December 31, <strong>2010</strong>AssetsNon-current assetsIntangible assets Note 12 96 103Tangible assets Note 12 16 16Financial assetsShares and participations in <strong>Group</strong> companies Note 13 57,062 59,429Other shares and participations Note 13 2,363 2,498Deferred tax assets Note 11 4,712 3,657Other long-term receivables 0 64,137 0 65,584Total non-current assets 64,249 65,703Current assetsShort-term receivables from <strong>Group</strong> companies 4,707 12,226Current tax receivables 0 0Other short-term receivables Note 14 247 261Cash and bank accounts 0 0Total current assets 4,954 12,487Total assets 69,203 78,190Shareholders’ equity and liabilitiesShareholders’ equityRestricted equityShare capital (2,128,420,220 shares, quota value SEK 1.20) 2,554 2,554Statutory reserve 7,337 9,891 7,337 9,891Unrestricted equityNon-restricted reserves 211 383Retained earnings 23,490 21,251Income for the period (2,239) 21,462 10,328 31,962Total shareholders’ equity 31,353 41,853Untaxed reserves Note 15 4 4ProvisionsProvisions for pensions Note 16 136 133Other provisions 0 136 1 134Non-current liabilities Note 17Liabilities to <strong>Group</strong> companies 7 7Other non-current liabilities – 7 10 17Current liabilitiesTrade payables 94 78Other liabilities to <strong>Group</strong> companies 37,370 35,835Other current liabilities Note 18 239 37,703 269 36,182Total shareholders' equity and liabilities 69,203 78,190Assets pledged – –Contingent liabilities Note 19 254,299 250,606115
Financial information <strong>2010</strong>Changes in Shareholders’ equityRestricted equity Unrestricted equity TotalSEK MSharecapitalStatutoryreserveSharepremiumreserveFair valuereserveRetainedearnings Totalshareholders’equityBalance at December 31, 2008 2,554 7,337 188 (53) 27,543 27,678 37,569Income for the period - – – – (2,239) (2,239) (2,239)Other comprehensive incomeAvailable-for-sale investments:Gain/(loss) at valuation to fair value – – – 74 – 74 74Other comprehensive income – – – 74 – 74 74Total income for the period – – – 74 (2,239) (2,165) (2,165)Transactions with shareholdersCash dividend – – – – (4,055) (4,055) (4,055)Share-based payments – – 2 – 2 4 4Transactions with shareholders – – 2 – (4,053) (4,051) (4,051)Balance at December 31, 2009 2,554 7,337 190 21 21,251 21,462 31,353Income for the period – – – – 10,328 10,328 10,328Other comprehensive incomeAvailable-for-sale investments:Gain/(loss) at valuation to fair value – – – 172 – 172 172Other comprehensive income – – – 172 – 172 172Total income for the period – – – 172 10,328 10,500 10,500Balance at December 31, <strong>2010</strong> 2,554 7,337 190 193 31,579 31,962 41,853Further information regarding the share capital of the Parent Company is shown in Note 23 to the consolidated financial statements.116
Cash-flow statementSEK M 2009 <strong>2010</strong>Operating activitiesOperating income (7,076) 12,517Depreciation and amortization 14 16Other adjustments of operating income Note 20 15,361 (20,543)Changes in working capital:(Increase)/decrease in receivables (48) 148Increase/(decrease) in liabilities and provisions (27) (6)Interest and similar items received 45 0Interest and similar items paid (431) (888)Other financial items (8) (65)Income taxes (paid)/received 423 (176)Cash-flow from operating activities 8,253 (8,997)Investing activitiesInvestments in fixed assets 0 (11)Shares and participations in <strong>Group</strong> companies, net Note 20 (11,091) (2,386)Shares and participations in non-<strong>Group</strong> companies, net Note 20 (1) (11,092) (63) (2,460)Cash-flow after net investments (2,839) (11,457)Financing activitiesIncrease/(decrease) in loans Note 20 6,894 11,457Cash payment to AB <strong>Volvo</strong> shareholders (4,055) 2,839 – 11,457Change in liquid funds 0 0Liquid funds, January 1 0 0Liquid funds, December 31 0 0Liquid fundsLiquid funds include cash and bank balances.117
Financial information <strong>2010</strong>Notes and commentsGeneral informationAmounts in SEK M unless otherwise specified. <strong>The</strong> amounts within parentheses refer to the preceding year, 2009.Note 1 Accounting principles<strong>The</strong> accounting principles applied by <strong>Volvo</strong> are described in note 1 tothe consolidated financial statements.<strong>The</strong> Parent Company also applies RFR 2 including the exception inthe application of IAS 39 which concerns accounting and valuationof financial contracts of guarantee in favour of subsidiaries and associatedcompanies. <strong>The</strong> Parent Company decided to early adopt the presentationof comprehensive income applied as of <strong>2010</strong>, from January 1,2009.<strong>The</strong> share-based incentive programs adopted at the <strong>Annual</strong> GeneralMeeting from 2004–2009 are covered by IFRS 2 Share-basedpayments.<strong>The</strong> <strong>Volvo</strong> <strong>Group</strong> has adopted IAS 19 Employee Benefits in itsfinancial reporting. <strong>The</strong> Parent Company is still applying the principlesof FAR SRS’s Recommendation No. 4 “Accounting of pension liabilitiesand pension costs” as in previous years. Consequently there aredifferences between the <strong>Volvo</strong> <strong>Group</strong> and the Parent Company in theaccounting for defined-benefit pension plans as well as in valuation ofplan assets invested in the <strong>Volvo</strong> Pension Foundation.<strong>The</strong> difference between depreciation according to plan and taxdepreciation is reported as accumulated additional depreciation,which is included in untaxed reserves. In the consolidated balancesheet a split is made between deferred tax liability and equity.<strong>Report</strong>ing of <strong>Group</strong> contributions is in accordance with UFR 2,a statement issued by the Swedish Financial <strong>Report</strong>ing Board. <strong>Group</strong>contributions are reported among Income from investments in <strong>Group</strong>companies.Note 2 Intra-<strong>Group</strong> transactionsOf the Parent Company’s net sales, 499 (578) pertained to <strong>Group</strong> companies while purchases from <strong>Group</strong> companies amounted to 449 (357).Note 3 Administrative expensesDepreciationAdministrative expenses include depreciation of 16 (14) of which 1 (0)pertains to machinery and equipment, 0 (0) to buildings and 15 (14) toother intangible assets.Fees to the auditors 2009 <strong>2010</strong>PricewaterhouseCoopers– Audit fees 17 17– Audit-related fees 1 1– Tax advisory services 1 0Total 19 18See note 35 for the <strong>Group</strong> for a description of the different categoriesof fees to the auditiors.PersonnelWages, salaries and other remunerations amounted to 211 (160).Social costs amounted to 142 (87) of which pension costs, 104 (55).Of the pension costs, 9 (8) pertained to Board members and Presidents.<strong>The</strong> Parent Company does not have any outstanding pensionobligations to these individuals.<strong>The</strong> number of employees at year-end was 198 (190). Information onthe average number of employees, wages, salaries and other remunerationsincluding option programs as well as Board members andsenior executives by gender is shown in note 34 to the consolidatedfinancial statements.Absence due to illness 2009 <strong>2010</strong>Total absence due to illness in percentageof regular working hours 1.2 1.1of which, continuous sick leave for 60 daysor more, % 21.4 41.4Absence due to illness in percentage ofregular working hoursMen, % 0.7 1.1Women, % 1.8 1.129 years or younger, % 0.2 3.030–49 years, % 1.2 1.150 years or older, % 1.3 0.9118
Note 4 Other operating income and expensesOther operating income and expenses include profit-sharing payments to employees in the amount of 1 (1).Note 5 Income from investments in <strong>Group</strong> companiesOf the income reported, 8,145 (10,275) pertain to dividends from<strong>Group</strong> companies. Of the dividends, 5,200 (6,000) pertain to dividendfrom <strong>Volvo</strong> Holding Sverige AB, 1,801 (–) from <strong>Volvo</strong> ConstructionEquipment NV and 1,000 (2,000) from <strong>Volvo</strong> Korea Holding AB. <strong>The</strong>shares in Alviva AB were written down by 19.Transfer price adjustments and <strong>Group</strong> contributions total a net of5,126 (neg 16,859).Note 6 Income from investments in associated companiesIncome from associated companies that are reported in the <strong>Group</strong> accounts in accordance with the equity method amounted to a negative 94 (4).Dividend of 14 (–) was received from VE Commercial Vehicles. <strong>The</strong> participations in Blue Chip Jet I HB and Blue Chip Jet II HB have effected theincome with 8 (neg: 4) and a negative 116 (8) respectively.Note 7 Income from other investmentsA dividend of 2 (2) reveived from Eicher Motors Ltd. is included in Income from other investments.Note 8 Interest income and expensesInterest income and similar credits amounting to 0 (1) included interest in the amount of 0 (0) from subsidiaries, and interest expenses andsimilar charges totalling 893 (393) included interest of 888 (386) to subsidiaries.Note 9 Other financial income and expensesOther financial income and expenses include guarantee commissionsfrom subsidiaries, costs for credit facilities, costs for credit rating,financial costs pertaining to changed taxable income previous yearsand costs of having <strong>Volvo</strong> shares registered.Note 10 Allocations2009 <strong>2010</strong>Allocation to additional depreciation 0 0Tax allocation reserve 700 –Total 700 0119
Financial information <strong>2010</strong>Notes and commentsNote 11 Income taxes2009 <strong>2010</strong>Current taxes 59 (176)Deferred taxes 4,478 (1,055)Total income taxes 4,537 (1,231)Current taxes relate to prior periods.Claims as a consequence of tax audit carried out previously for whichprovisions are not deemed necessary amount to – (249). <strong>The</strong> amountis included in contingent liabilities.Deferred taxes relate to estimated tax on the change in tax-losscarryforwards and temporary differences. Deferred tax assets arereported to the extent that it is probable that the amount can be utilizedagainst future taxable income.Deferred taxes related to change in tax-loss carryforwards amountto an expense of 1,063 (4,472) and to changes in other temporarydifferences to 8 (6).<strong>The</strong> table below shows the principal reasons for the differencebetween the corporate income tax of 26.3% and the tax for the period.2009 <strong>2010</strong>Income before taxes (6,776) 11,559Income tax according to applicable tax rate 1,782 (3,040)Capital gains/losses 0 0Non-taxable dividends 2,703 2,146Non-taxable revaluations of shareholdings (1) (8)Other non-deductible expenses (23) (156)Other non-taxable income 17 3Adjustment of current taxes for prior periods 59 (176)Income taxes for the period 4,537 (1,231)Specification of deferred tax assets 2009 <strong>2010</strong>Tax-loss carryforwards 4,550 3,487Valuation allowance for doubtful receivables 1 1Provision for post-employment benefits 161 169Deferred tax assets 4,712 3,657Note 12 Intangible and tangible assetsAcquisition cost Value in balance sheet 2009 Investments Value in balance sheet <strong>2010</strong>Rights 52 52Other intangible assets 116 22 138Total intangible assets 168 22 190Buildings 6 – 6Land and land improvements 3 – 3Machinery and equipment 45 1 46Total tangible assets 54 1 55Value in balanceValue in balancesheet 2009 1 Depreciation 2 sheet <strong>2010</strong>Net carryingvalue in balancesheet <strong>2010</strong> 3Accumulated depreciationRights 52 – 52 0Other intangible assets 20 15 35 103Total intangible assets 72 15 87 103Buildings 2 0 2 4Land and land improvements 0 0 0 3Machinery and equipment 36 1 37 9Total tangible assets 38 1 39 16<strong>The</strong> assessed value of buildings was 3 (3) and of land 3 (3). Capitalexpenditures in intangible and tangible assets amounted to 22 (–) and1 (0) respectively. Capital expenditures approved but not yet implementedat year-end <strong>2010</strong> amounted to 0 (–).1 Including accumulated write-downs.2 Including write-downs.3 Acquisition value, less accumulated depreciation, amortization and writedowns.120
Note 13 Investments in shares and participationsHoldings of shares and participations are specified in AB <strong>Volvo</strong>’s holding of shares. Changes in holdings of shares and participations are shownbelow.<strong>Group</strong> companiesNon-<strong>Group</strong> companies2009 <strong>2010</strong> 2009 <strong>2010</strong>Balance December 31, previous year 46,122 57,062 2,280 2,363Acquisitions/New issue of shares 85 – 2 87Divestments – (3,493) – 0Shareholder contributions 10,855 5,879 1 –Write-downs/participations in partnerships – (19) 6 (124)Revaluation of shares in listed companies – – 74 172Balance, December 31 57,062 59,429 2,363 2,498Shares and participations in <strong>Group</strong> companiesIn December, <strong>2010</strong>, AB <strong>Volvo</strong> transferred the company’s holding ofpreference shares in UD Trucks Corporation, with the book value of3,493, as shareholders’ contribution to <strong>Volvo</strong> <strong>Group</strong> Japan Corporation.Shareholders’ contribution was also made to Kommersiella FordonEuropa AB, 1,801, <strong>Volvo</strong> Financial Services AB, 225, <strong>Volvo</strong> ChinaInvestment Co Ltd, 217, and <strong>Volvo</strong> Holding Mexico, 143.Write-down was made at year-end of the holding of shares in AlvivaAB with 19.During 2009, AB <strong>Volvo</strong> acquired total number of shares in <strong>Volvo</strong>Logistics AB from Fortos Ventures AB in an amount of 85.During 2009, shareholders’ contributions were made to <strong>Volvo</strong>Treasury AB, 10,000, <strong>Volvo</strong> Information Technology AB, 500, and<strong>Volvo</strong> China Investment Co Ltd, 355.Shares and participations in non-<strong>Group</strong> companiesAB <strong>Volvo</strong> acquired <strong>Volvo</strong> Personvagnar AB’s participation (5%) inBlue Chip Jet I HB in <strong>2010</strong> and in 2009 half of Skandia’s participationin Blue Chip Jet I HB (5%) was acquired. AB <strong>Volvo</strong>’s participation inBlue Chip Jet I HB is 50% after the acquisitions. During <strong>2010</strong> a capitalcontribution of 76 was made to Blue Chip Jet II HB. <strong>The</strong> book valueof the participations in the partnerships Blue Chip Jet I HB and BlueChip Jet II HB decreased during the year by a net of 113 (8).<strong>The</strong> revaluation of AB <strong>Volvo</strong>’s ownership in the listed company DeutzAG has increased the value by 172 (74), recognized in other comprehensiveincome.Other shares and participations include the direct and indirect holdingsof VE Commercial Vehicles (VECV) for total amount of 1,845. Inthe consolidated accounts of the <strong>Volvo</strong> group, VECV is reported as ajoint venture and consolidated according to the proportionate method.<strong>The</strong> indirect ownership is an effect of the acquisition of 8.1% of EicherMotors Limited, which is the other venturer of VECV. <strong>The</strong>se shares arenot separately valued as they form a part of the indirect ownershipVECV.Note 14 Other short-term receivables2009 <strong>2010</strong>Accounts receivable 35 3Prepaid expenses and accrued income 199 226Other receivables 13 32Total 247 261<strong>The</strong> valuation allowance for doubtful receivables amounted to 4 (15)at the end of the year.Note 15 Untaxed reservesValue in balancesheet 2009 Allocations <strong>2010</strong>Value in balancesheet <strong>2010</strong><strong>The</strong> composition of, and changes in, untaxed reservesAccumulated additional depreciationLand 3 – 3Machinery and equipment 1 0 1Total 4 0 4121
Financial information <strong>2010</strong>Notes and commentsNote 16 Provisions for pensionsNote 18 Other current liabilitiesProvisions for pensions and similar benefits correspond to the actuariallycalculated value of obligations not insured with third parties orsecured through transfers of funds to pension foundations. <strong>The</strong>amount of pensions falling due within one year is included. AB <strong>Volvo</strong>has insured the pension obligations with third parties. Of the amountreported, 0 (0) pertains to contractual obligations within the frameworkof the PRI (Pension Registration Institute) system.<strong>The</strong> <strong>Volvo</strong> Pension Foundation was formed in 1996. Plan assetsamounting to 224 were contributed to the foundation at its formation,corresponding to the value of the pension obligations at that time.Since its formation, net contributions of 25 have been made to thefoundation.AB <strong>Volvo</strong>’s pension costs amounted to 104 (55).<strong>The</strong> accumulated benefit obligation of all AB <strong>Volvo</strong>’s pension obligationsat year-end <strong>2010</strong> amounted to 611, which has been securedin part through provisions in the balance sheet and through transfer offunds to pension foundations. Net asset value in the Pension Foundation,marked to market, accrued to AB <strong>Volvo</strong> was 48 higher than thecorresponding pension obligations.2009 <strong>2010</strong>Wages, salaries and withholding taxes 102 94Other liabilities 4 2Accrued expenses and prepaid income 133 173Total 239 269No collateral is provided for current liabilities.Note 19 Contingent liabilitiesOf the contingent liabilities amounting to 250,606 (254,299),250,597 (254,041) pertained to <strong>Group</strong> companies.Guarantees for various credit programs are included in amounts correspondingto the credit limits. <strong>The</strong>se guarantees amount to 243,089(247,010), of which guarantees on behalf of <strong>Group</strong> companies totaled243,089 (247,010).At the end of each year, the utilized portion amounted to 108,562(130,961), including 108,476 (130,872) pertaining to <strong>Group</strong> companies.Note 17 Non-current liabilitiesNon-current debt matures as follows:2013 102016 or later 7Total 17Note 20 Cash-flowOther adjustments of operating income 2009 <strong>2010</strong>Revaluation of shareholdings (4) 116<strong>Group</strong> contributions and transfer priceadjustments, current year 14,016 (6,673)Payments of previous years <strong>Group</strong> contributionsand transfer price adjustments 1,351 (14,016)Other (2) 30Total 15,361 (20,543)Further information is provided in notes 5, 6 and 7.Shares and participations in <strong>Group</strong> companies, netInvestments (11,091) (2,386)Net investments in shares andparticipations in <strong>Group</strong> companies (11,091) (2,386)Investments and sales of shares in <strong>Group</strong> companies are shown innote 13.Shares and participations innon-<strong>Group</strong> companies, net 2009 <strong>2010</strong>Investments (1) (78)Disposals – 15Net investments in shares andparticipations in non-<strong>Group</strong> companies (1) (63)Investments and sales of shares in non-<strong>Group</strong> companies are presentedin note 13.Increase in loansIncrease in loans is related to the company’s liability in the groupaccount at <strong>Volvo</strong> Treasury AB. <strong>The</strong> liability has increased by 11,457(6,894).122
AB <strong>Volvo</strong>’s holding of sharesDec 31, 2009 Dec 31, <strong>2010</strong>AB <strong>Volvo</strong>’s holding of sharesand participations in non-<strong>Group</strong> companies 1RegistrationnumberPercentageholding 2Carrying value,SEK MCarrying value,SEK MDeutz AG, Germany – 7 286 458Blue Chip Jet II HB, Sweden 969717-2105 50 206 170Other investments 26 22Total carrying value, non-<strong>Group</strong> companies 518 6501 AB <strong>Volvo</strong>’s holdings of shares and participations include the direct and indirect holdings of VE Commercial Vehicles (VECV). AB <strong>Volvo</strong>’s direct holdings in VECVamount to SEK 1,845 M. In the consolidated accounts of the <strong>Volvo</strong> group, VECV is reported as a joint venture, consolidated according to the proportionatemethod, and accordingly included in the table for <strong>Group</strong> companies below.2 Percentage figures refer to share capital as well as voting rights.Dec 31, 2009 Dec 31, <strong>2010</strong>AB <strong>Volvo</strong>’s holding of shares andparticipations in major <strong>Group</strong> companiesRegistrationnumberPercentageholdingCarrying value,SEK MCarrying value,SEK M<strong>Volvo</strong> Lastvagnar AB, Sweden 556013-9700 100 8,678 8,678<strong>Volvo</strong> Truck Center Sweden AB, Sweden 556072-7777 100 – –<strong>Volvo</strong> Finland AB, Finland – 100 – –<strong>Volvo</strong> <strong>Group</strong> Belgium NV, Belgium – 100 – –<strong>Volvo</strong> <strong>Group</strong> UK Ltd, Great Britain – 100 – –<strong>Volvo</strong> India Ltd, India – 100 – –<strong>Volvo</strong> Holding Sverige AB, Sweden 556539-9853 100 7,634 7,634<strong>Volvo</strong> Logistics AB, Sweden 556197-9732 100 – –BRS Ltd, Great Britain – 100 – –<strong>Volvo</strong> Construction Equipment North America, Canada – 100 – –<strong>Volvo</strong> Polska Sp. O.O., Poland – 100 – –<strong>Volvo</strong> (Southern Africa) Pty Ltd, South Africa – 100 – –<strong>Volvo</strong> do Brasil Veiculos Ltda, Brazil – 100 – –Banco <strong>Volvo</strong> (Brasil) SA, Brazil – 100 – –<strong>Volvo</strong> <strong>Group</strong> Canada Inc., Canada – 100 – –Prévost Car Inc, Canada – 100 – –<strong>Volvo</strong> <strong>Group</strong> Australia Pty Ltd, Australia – 100 – –<strong>Volvo</strong> <strong>Group</strong> Automotive Ticaret, Ltd, Sirketi, Turkey 1 – 100 – –<strong>Volvo</strong> Holding France SA, France – 100 – –<strong>Volvo</strong> Trucks France s.a.s., France – 100 – –<strong>Volvo</strong> Compact Equipment s.a.s., France – 100 – –<strong>Volvo</strong> CE Europe s.a.s., France – 100 – –VFS Finance France s.a.s., France – 100 – –VFS Location France s.a.s., France – 100 – –123
Financial information <strong>2010</strong>Notes and commentsDec 31, 2009 Dec 31, <strong>2010</strong>AB <strong>Volvo</strong>’s holding of shares andparticipations in major <strong>Group</strong> companies (cont.)RegistrationnumberPercentageholdingCarrying value,SEK MCarrying value,SEK MRenault Trucks s.a.s., France – 100 – –Renault Trucks Deutschland GmbH, Germany – 100 – –Renault Trucks Polska SP Z OO, Poland – 100 – –Renault Trucks, España, Spain – 100 – –Renault Trucks Italia Spa, Italy – 100 – –<strong>Volvo</strong> <strong>Group</strong> Japan Co, Japan – 100 2,886 6,379UD Trucks Corporation, Japan – 100 3,493 –DRD Co., Ltd, Japan – 100 – –UD Trucks Japan Co, Japan – 100 – –UD Trucks South Africa (Pty) Ltd., South Africa – 80 – –<strong>Volvo</strong> Bussar AB, Sweden 556197-3826 100 1,882 1,882<strong>Volvo</strong> Construction Equipment NV, <strong>The</strong> Netherlands – 100 2,582 2,582<strong>Volvo</strong> Construction Equipment AB, Sweden 556021-9338 100 – –<strong>Volvo</strong> Maskin AS, Norway – 100 – –<strong>Volvo</strong> Construction Equipment Europe GmbH, Germany – 100 – –ABG Algemeinen Baumaschinen GmbH, Germany – 100 – –AB <strong>Volvo</strong> Penta, Sweden 556034-1330 100 421 421<strong>Volvo</strong> Aero AB, Sweden 556029-0347 100 2,885 2,885<strong>Volvo</strong> Aero Norge AS, Norway – 78 – –VNA Holding Inc., USA – 100 2,491 2,491<strong>Volvo</strong> <strong>Group</strong> North America Inc., USA – 100 – –Arrow Truck Sales, Inc., USA – 100 – –Mack Trucks Inc., USA – 100 – –<strong>Volvo</strong> Construction Equipment North America Inc., USA – 100 – –<strong>Volvo</strong> Penta of <strong>The</strong> Americas Inc., USA – 100 – –<strong>Volvo</strong> Commercial Finance LLC <strong>The</strong> Americas, USA – 100 – –VFS US LLC, USA – 100 – –VFS Leasing Co., USA – 100 – –124
Dec 31, 2009 Dec 31, <strong>2010</strong>AB <strong>Volvo</strong>’s holding of shares andparticipations in major <strong>Group</strong> companies (cont.)RegistrationnumberPercentageholdingCarrying value,SEK MCarrying value,SEK M<strong>Volvo</strong> Financial Services AB, Sweden 556000-5406 100 1,720 1,945VFS International AB, Sweden 556316-6064 100 – –VFS Nordic AB, Sweden 556579-1778 100 – –VFS Financial Services BV, <strong>The</strong> Netherlands – 100 – –VFS Financial Services Belgium NV, Belgium – 100 – –VFS Financial Services (UK) Ltd, Great Britain – 100 – –VFS Deutschland GmbH, Germany – 100 – –VFS Financial Services Spain EFC, SA, Spain – 100 – –<strong>Volvo</strong> Finance (Suisse) SA, Switzerland – 100 – –VFS Vostok, Russia – 100 – –VFS Romania, Romania – 100 – –VFS Canada Inc, Canada – 100 – –VE Commercial Vehicles, Ltd, India 2, 7 – 50 – –<strong>Volvo</strong> Treasury AB, Sweden 556135-4449 100 13,044 13,044Sotrof AB, Sweden 556519-4494 100 1,388 1,388<strong>Volvo</strong> <strong>Group</strong> Real Estate AB, Sweden 556006-8313 100 – –<strong>Volvo</strong> Korea Holding AB, Sweden 556531-8572 100 2,655 2,655<strong>Volvo</strong> <strong>Group</strong> Korea Co Ltd, South Korea – 100 – –<strong>Volvo</strong> China Investment Co Ltd, China – 100 879 1,096Shanghai Sunwin Bus Co, China 2 – 50 – –XIAN Silver Bus Co, China 2 – 50 – –Shandong Lingong Construction Machinery, China – 70 – –<strong>Volvo</strong> Automotive Finance (China) Ltd, China – 100 491 491<strong>Volvo</strong> <strong>Group</strong> UK Ltd, Great Britain 3 – 100 413 413<strong>Volvo</strong> Holding Mexico, Mexico – 100 388 531<strong>Volvo</strong> Technology Transfer AB, Sweden 556542-4370 100 361 361<strong>Volvo</strong> Powertrain AB, Sweden 556000-0753 100 498 498<strong>Volvo</strong> Information Technology AB, Sweden 556103-2698 100 663 663<strong>Volvo</strong> Parts AB, Sweden 556365-9746 100 200 200<strong>Volvo</strong> <strong>Group</strong> Insurance Försäkrings AB, Sweden 516401-8037 100 182 182<strong>Volvo</strong> Business Services AB, Sweden 556029-5197 100 107 107<strong>Volvo</strong> Danmark Holding AS, Denmark – 100 104 104VFS Servizi Financiari Spa, Italy 4 – 100 79 79Kommersiella Fordon Europa AB, Sweden 556049-3388 100 89 1,890<strong>Volvo</strong> Norge AS, Norway – 100 56 56<strong>Volvo</strong> Malaysia Sdn, Malaysia – 100 48 48ZAO <strong>Volvo</strong> Vostok, Russia 5 – 100 34 34<strong>Volvo</strong> Italia Spa, Italy – 100 556 556<strong>Volvo</strong> Logistics AB, Sweden 556197-9732 100 85 85Rossareds Fastighets AB, Sweden 556009-1190 100 26 26Alviva AB, Sweden 556622-8820 100 25 5<strong>Volvo</strong> East Asia (Pte) Ltd, Singapore – 100 9 9<strong>Volvo</strong> Automotive Holding BV, <strong>The</strong> Netherlands – 100 3 3<strong>Volvo</strong> Information Technology GB Ltd, Great Britain – 100 3 3Other holdings 6 5Total carrying value <strong>Group</strong> companies 6 57,062 59,4291 Total holding by <strong>Volvo</strong> Holding Sverige and <strong>Volvo</strong> Lastvagnar is 100%.2 Joint venture, reported in accordance with the proportionate consolidationmethod in <strong>Volvo</strong>’s consolidated accounts.3 Total holding by VTC Holding and AB <strong>Volvo</strong> is 100%.4 Total holding by <strong>Volvo</strong> Italia and AB <strong>Volvo</strong> is 100%.5 Total holding by AB <strong>Volvo</strong> and <strong>Volvo</strong> Trucks Region Central Europeis 100%.6 AB <strong>Volvo</strong>’s share of shareholders’ equity in subsidiaries (includingequity in untaxed reserves) was 90,261 (91,944).7 AB <strong>Volvo</strong>’s holdings of shares and participations include the directand indirect holdings of VE Commercial Vehicles (VECV). AB <strong>Volvo</strong>’sdirect holdings in VECV amount to 1,845. In the consolidated accountsof the <strong>Volvo</strong> group, VECV is reported as a joint venture, consolidatedaccording to the proportionate method, and accordingly included inthe table for group companies above.125
Financial information <strong>2010</strong>Proposed remuneration policy<strong>The</strong> proposal by the Board of Directors of AB <strong>Volvo</strong> to beadopted by the <strong>Annual</strong> General Meeting April 6, 2011.This Policy concerns the remuneration and other terms of employmentfor the <strong>Group</strong> Executive Committee of the <strong>Volvo</strong> <strong>Group</strong>. <strong>The</strong>members of the <strong>Group</strong> Executive Committee, including the Presidentand any possible Executive Vice President, are in the followingreferred to as the “Executives”.This Policy will be valid for employment agreements entered intoafter the approval of the Policy by the <strong>Annual</strong> General Meeting and forchanges made to existing employment agreements thereafter.1. Guiding principles for remuneration and other terms of employment<strong>The</strong> guiding principle is that the remuneration and the other terms ofemployment for the Executives shall be competitive in order to ensurethat the <strong>Volvo</strong> <strong>Group</strong> can attract and retain competent Executives.<strong>The</strong> annual report <strong>2010</strong> sets out details on the total remunerationand benefits awarded to the Executives during <strong>2010</strong>.2. <strong>The</strong> principles for fixed salaries<strong>The</strong> Executive’s fixed salary shall be competitive and based on theindividual Executive’s responsibilities and performance.3. <strong>The</strong> principal terms of variable salary and incentive schemes,including the relation between fixed and variable componentsof the remuneration and the linkage between performance andremuneration<strong>The</strong> Executives may receive variable salaries in addition to fixed salaries.<strong>The</strong> variable salary may, as regards the President, amount to amaximum of 75% of the fixed annual salary and, as regards the otherExecutives, a maximum of 60% of the fixed annual salary.<strong>The</strong> variable salary may be based on i.a. the performance of theentire <strong>Volvo</strong> <strong>Group</strong> or the performance of the Business Area or BusinessUnit where the Executive is employed. <strong>The</strong> performance will berelated to the fulfilment of various improvement targets or the attainmentof certain financial objectives. Such targets will be set by theBoard and may relate to i.a. operating income or cash flow.<strong>The</strong> Board shall before each <strong>Annual</strong> General Meeting evaluatewhether a share or share-price related incentive program shall be proposedto the <strong>Annual</strong> General Meeting or not. Such proposal may concerna program comprising one or several financial years. <strong>The</strong> <strong>Annual</strong>General Meeting decides upon such programs. <strong>The</strong> Board of Directorshas decided to propose to the <strong>Annual</strong> General Meeting 2011 toapprove the adoption of a share-based incentive program relating tothe financial years 2011, 2012 and 2013.4. <strong>The</strong> principal terms of non-monetary benefits, pension, notice oftermination and severance pay4.1 Non-monetary benefits<strong>The</strong> Executives will be entitled to customary non-monetary benefitssuch as company cars and company health care. In addition thereto inindividual cases company housing and other benefits may also beoffered.4.2 PensionIn addition to pension benefits which the Executives are entitled toaccording to law and collective bargaining agreements, Executivesresident in Sweden may be offered defined-contribution plans withannual premiums amounting to SEK 30,000 plus 20% of the pensionablesalary over 30 income base amounts. In the defined-contributionplan, the pension earned will correspond to the sum of paid-in premiumsand possible return without any guaranteed level of pensionreceived by the employee. In the defined-contribution plan, no definiteretirement date is set.Some of the Executives have earlier been entitled to defined-benefitpension plans, but the majority of the Executives have re-negotiatedthese to the new system of defined-contribution plans. In connectiontherewith, agreements have in some cases been reached onindividual adjusting premiums in accordance with actuarial calculations.Previous pension agreements for certain Executives stipulated thatearly retirement could be obtained from the age of 60. Such agreementsare no longer signed and the majority of the Executives thatearlier were entitled to such defined-benefit pension plans haveagreed to exchange these for defined-contribution plans without anydefined point of time for retirement. <strong>The</strong> premium amounts to 10% ofthe pensionable salary plus individual adjusting premiums based onactuarial calculations in some cases.Executives resident outside Sweden or resident in Sweden but havinga material connection to or having been resident in a country otherthan Sweden may be offered pension benefits that are competitive inthe country where the Executives are or have been resident or towhich the Executives have a material connection, preferably definedcontributionplans.4.3 Notice of termination and severance payFor Executives resident in Sweden, the termination period from theCompany will be twelve months and six months from the Executive. Inaddition thereto, the Executive, provided that termination has beenmade by the Company, will be entitled to twelve months severance pay.Executives resident outside Sweden or resident in Sweden but havinga material connection to or having been resident in a country otherthan Sweden may be offered notice periods for termination and severancepayment that are competitive in the country where the Executivesare or have been resident or to which the Executives have amaterial connection, preferably solutions comparable to the solutionsapplied to Executives resident in Sweden.5. <strong>The</strong> Board’s preparation and decision-making on issues concerningremuneration and other terms of employment for the <strong>Group</strong> ExecutiveCommittee<strong>The</strong> Remuneration Committee is responsible for (i) preparing theBoard’s decisions on issues concerning principles for remuneration,remunerations and other terms of employment for Executives, (ii) monitoringand evaluating programs for variable remuneration, both ongoingand those that have ended during the year, for Executives, (iii) monitoringand evaluating the application of this Policy, and (iv) monitoring andevaluating current remuneration structures and levels in the Company.<strong>The</strong> Remuneration Committee prepares and the Board decides on(i) terms of employment and remuneration of the President and theExecutive Vice President, if any, and (ii) principles for remuneration(incl. pension and severance pay) for the <strong>Group</strong> Executive Committee.<strong>The</strong> Remuneration Committee shall approve proposals on remunerationof the members of the <strong>Group</strong> Executive Committee.<strong>The</strong> Remuneration Committee is further responsible for the reviewand recommendation to the Board of share and share-price relatedincentive programs to be decided upon by the <strong>Annual</strong> General Meeting.6. Deviations from this Policy<strong>The</strong> Board of Directors may deviate from this Policy, except as regardssection 3, third paragraph, if there are specific reasons to do so in anindividual case.7. Information on earlier decisions on remuneration that has notbecome due for payment at the time of the <strong>Annual</strong> General Meeting’sconsideration of this Policy<strong>The</strong> decisions already taken on remuneration to the Executives that hasnot become due for payment at the time of the <strong>Annual</strong> General Meeting2011 fall within the framework of this policy, except that some of the Executiveshave a right to receive 24 months severance pay provided they areabove 50 years of age.<strong>The</strong> policy concerning remuneration and other terms of employment forthe <strong>Group</strong> Executive Committee decided at the <strong>Annual</strong> General Meting<strong>2010</strong> is provided in note 34 Personnel.126
Proposed disposition of unappropriatedearningsAB <strong>Volvo</strong>SEKRetained earnings 21,634,556,869.50Income for the period <strong>2010</strong> 10,327,605,961.72Total retained earnings 31,962,162,831.22<strong>The</strong> Board of Directors and the President propose that the abovesum be disposed of as follows:SEKTo the shareholders, a dividend of SEK2.50 per share 5,068,567,563.00To be carried forward 26,893,595,268.22Total 31,962,162,831.22<strong>The</strong> record date for determining who is entitled to receive dividends isproposed to be Monday, April 11, 2011.In view of the Board of Directors’ proposal to the <strong>Annual</strong> General Meetingto be held April 6, 2011, to decide on the distribution of a dividend ofSEK 2.50 per share, the Board hereby makes the following statement inaccordance with Chapter 18, Section 4 of the Swedish Companies Act.<strong>The</strong> Board of Directors concludes that the Company’s restrictedequity is fully covered after the proposed dividend. <strong>The</strong> Board furtherconcludes that the proposed dividend is justifiable in view of theparameters set out in Chapter 17, Section 3, second and third paragraphsof the Swedish Companies Act. In connection herewith, theBoard wishes to point out the following.<strong>The</strong> proposed dividend reduces the Company’s solvency from53.5% to 50.3% and the <strong>Group</strong>’s solvency from 23.3% to 22.1%,calculated as per year end <strong>2010</strong>. <strong>The</strong> Board of Directors considersthis solvency to be satisfactory with regard to the business in whichthe <strong>Group</strong> is active.According to the Board of Directors’ opinion, the proposed dividendwill not affect the Company’s or the <strong>Group</strong>’s ability to fulfil their paymentobligations and the Company and the <strong>Group</strong> are well prepared tohandle both changes in the liquidity and unexpected events.<strong>The</strong> Board of Directors is of the opinion that the Company and the<strong>Group</strong> have capacity to assume future business risks as well as tobear contingent losses. <strong>The</strong> proposed dividend is not expected toadversely affect the Company’s and the <strong>Group</strong>’s ability to make furthercommercially justified investments in accordance with the Board ofDirectors’ plans.In addition to what has been stated above, the Board of Directors hasconsidered other known circumstances which may be of importance forthe Company’s and the <strong>Group</strong>’s financial position. In doing so, no circumstancehas appeared that does not justify the proposed dividend.If the <strong>Annual</strong> General Meeting resolves in accordance with the Boardof Directors’ proposal, SEK 26,893,595,268.22 will remain of the Company’snon-restricted equity, calculated as per year end <strong>2010</strong>.<strong>The</strong> Board of Directors has the view that the Company’s and the<strong>Group</strong>’s shareholders’ equity will, after the proposed dividend, be sufficientin relation to the nature, scope and risks of the business.Had the assets and liabilities not been estimated at their marketvalue pursuant to Chapter 4, Section 14 a of the Swedish <strong>Annual</strong>Accounts Act, the company’s shareholders’ equity would have beenSEK 193,353,379.00 less.<strong>The</strong> Board of Directors and the President certify that the annual financialreport has been prepared in accordance with generally acceptedaccounting principles and that the consolidated accounts have beenprepared in accordance with the international set of accountingstandards referred to in Regulation (EC) No 1606/2002 of the EuropeanParliament and of the Council of July 19, 2002 on the applicationof international accounting standards, and give a true and fairview of the position and profit or loss of the Company and the <strong>Group</strong>,and that the management report for the Company and for the <strong>Group</strong>gives a fair review of the development and performance of the business,position and profit or loss of the Company and the <strong>Group</strong>, anddescribes the principal risks and uncertainties that the Company andthe companies in the <strong>Group</strong> face.Göteborg, February 24, 2011Peter BijurBoard memberLouis SchweitzerBoard ChairmanJean-Baptiste DuzanBoard memberLeif JohanssonPresident, CEO andBoard memberHanne de MoraBoard memberAnders NyrénBoard memberRavi VenkatesanBoard memberLars WesterbergBoard memberYing YehBoard memberMartin LinderBoard memberMikael SällströmBoard memberBerth ThulinBoard memberOur audit report was issued on February 24, 2011PricewaterhouseCoopers ABGöran TidströmAuthorized Public AccountantLead PartnerJohan RippeAuthorized Public Accountant127
Financial information <strong>2010</strong>Audit report for AB <strong>Volvo</strong>We have audited the annual accounts, the consolidated accounts, theaccounting records and the administration of the Board of Directorsand the President of AB <strong>Volvo</strong> for the year <strong>2010</strong>. <strong>The</strong> company’sannual accounts and the consolidated accounts are included in theprinted version on pages 24–127. Board of Directors and the Presidentare responsible for these accounts and the administration of thecompany as well as for the application of the <strong>Annual</strong> Accounts Actwhen preparing the annual accounts and the application of internationalfinancial reporting standards IFRSs as adopted by the EU andthe <strong>Annual</strong> Accounts Act when preparing the consolidated accounts.Our responsibility is to express an opinion on the annual accounts, theconsolidated accounts and the administration based on our audit.We conducted our audit in accordance with generally acceptedauditing standards in Sweden. Those standards require that we planand perform the audit to obtain reasonable assurance that the annualaccounts and the consolidated accounts are free of material misstatement.An audit includes examining, on a test basis, evidence supportingthe amounts and disclosures in the accounts. An audit alsoincludes assessing the accounting principles used and their applicationby the Board of Directors and the President and significant estimatesmade by the Board of Directors and the President when preparingthe annual accounts and consolidated accounts as well asevaluating the overall presentation of information in the annualaccounts and the consolidated accounts. As a basis for our opinionconcerning discharge from liability, we examined significant decisions,actions taken and circumstances of the company in order to be ableto determine the liability, if any, to the company of any board memberor the President. We also examined whether any board member or thePresident has, in any other way, acted in contravention of the CompaniesAct, the <strong>Annual</strong> Accounts Act or the Articles of Association.We believe that our audit provides a reasonable basis for our opinionset out below.<strong>The</strong> annual accounts have been prepared in accordance with the<strong>Annual</strong> Accounts Act and give a true and fair view of the company’sfinancial position and results of operations in accordance with generallyaccepted accounting principles in Sweden. <strong>The</strong> consolidatedaccounts have been prepared in accordance with international financialreporting standards IFRSs as adopted by the EU and the <strong>Annual</strong>Accounts Act and give a true and fair view of the group’s financialposition and results of operations. <strong>The</strong> Board of Directors’ <strong>Report</strong> isconsistent with the other parts of the annual accounts and the consolidatedaccounts.We recommend to the annual meeting of shareholders that theincome statements and balance sheets of the Parent Company andthe <strong>Group</strong> be adopted, that the profit of the Parent Company be dealtwith in accordance with the proposal in the Board of Directors’ <strong>Report</strong>and that the members of the Board of Directors and the President bedischarged from liability for the financial year.Göteborg, February 24, 2011PricewaterhouseCoopers ABGöran TidströmAuthorized Public AccountantLead PartnerJohan RippeAuthorized Public AccountantPartner128
Eleven-year summary<strong>The</strong> eleven-year summary presents each year in accordance with theGenerally Accepted Accounting Practice (GAAP) for that year. Earlieryears are not restated when new accounting standards are applied. <strong>The</strong>years 1999–2003 are accounted for in accordance with Swedish GAAPfor the respective year. As from 2004 the reporting is based on IFRS.<strong>The</strong> transition to IFRS is described in note 3 in the 2005 and 2006<strong>Annual</strong> <strong>Report</strong>s. As from January 1, 2007, the benefits from the synergiescreated in the business units are transferred back to the productareas. Also, as from January 1, 2007, the responsibility for the <strong>Group</strong>’streasury operations and real estate has been transferred from <strong>Volvo</strong>Financial Services, which, as from January 1, 2007, only are consolidatedin accordance with the purchase method. Comparison figures for2006 have been recalculated.Consolidated income statementsSEK M 2000 2001 2002 2003 2004 2005 2006 2007 2008 2009 <strong>2010</strong>Net sales 130,070 189,280 186,198 183,291 211,076 240,559 258,835 285,405 303,667 218,361 264,749Cost of sales (104,548) (155,592) (151,569) (146,879) (164,170) (186,662) (199,054) (219,600) (237,578) (186,167) (201,797)Gross income 25,522 33,688 34,629 36,412 46,906 53,897 59,781 65,805 66,089 32,194 62,952Research anddevelopment expenses (4,876) (5,391) (5,869) (6,829) (7,614) (7,557) (8,354) (11,059) (14,348) (13,193) (12,970)Selling expenses (10,140) (15,766) (16,604) (16,866) (19,369) (20,778) (21,213) (26,068) (27,129) (25,334) (24,149)Administrative expenses (4,974) (6,709) (5,658) (5,467) (5,483) (6,301) (6,551) (7,133) (6,940) (5,863) (5,666)Other operating income andexpenses 622 (4,096) (4,152) (1,367) (618) (588) (3,466) 163 (1,915) (4,798) (2,023)Income (loss) from investmentsin associated companies 444 50 182 200 27 (557) 61 430 25 (14) (86)Income from other investments 70 1,410 309 (3,579) 830 37 141 93 69 (6) (58)Restructuring costs – (3,862) – – – – – – – –Operating income (loss) 6,668 (676) 2,837 2,504 14,679 18,153 20,399 22,231 15,851 (17,013) 18,000Interest income and similar credits 1,588 1,275 1,217 1,096 821 654 666 952 1,171 390 442Interest expenses andsimilar charges (1,845) (2,274) (1,840) (1,888) (1,254) (972) (585) (1,122) (1,935) (3,559) (3,142)Other financial incomeand expenses (165) (191) (201) (55) (1,210) 181 (181) (504) (1,077) (392) 213Income (loss) afterfinancial items 6,246 (1,866) 2,013 1,657 13,036 18,016 20,299 21,557 14,010 (20,573) 15,514Income taxes (1,510) 326 (590) (1,334) (3,129) (4,908) (3,981) (6,529) (3,994) 5,889 (4,302)Income (loss) for the period 4,736 (1,540) 1,423 323 9,907 13,108 16,318 15,028 10,016 (14,685) 11,212Attributable toEquity holders of theParent Company 4,709 (1,467) 1,393 298 9,867 13,054 16,268 14,932 9,942 (14,718) 10,866Minority interest 27 (73) 30 25 40 54 50 96 74 33 3464,736 (1,540) 1,423 323 9,907 13,108 16,318 15,028 10,016 (14,685) 11,212Consolidated income statements Industrial OperationsSEK M 2000 2001 2002 2003 2004 2005 2006 2007 2008 2009 <strong>2010</strong>Net sales 120,392 180,615 177,080 174,768 202,171 231,191 249,020 276,795 294,932 208,487 257,375Cost of sales (97,131) (149,477) (145,453) (141,256) (158,453) (180,823) (192,400) (214,160) (232,247) (179,578) (197,480)Gross income 23,261 31,138 31,627 33,512 43,718 50,368 56,620 62,635 62,685 28,909 59,895Research anddevelopment expenses (4,876) (5,391) (5,869) (6,829) (7,614) (7,557) (8,354) (11,059) (14,348) (13,193) (12,970)Selling expenses (9,285) (14,663) (15,393) (15,891) (18,317) (19,616) (19,999) (24,671) (25,597) (23,752) (22,649)Administrative expenses (4,651) (6,474) (5,464) (5,259) (5,310) (6,147) (6,481) (7,092) (6,921) (5,838) (5,640)Other operating income andexpenses 309 (3,071) (2,989) (540) 7 (397) (3,275) 249 (1,457) (2,432) (659)Income from <strong>Volvo</strong> FinancialServices 1,499 325 490 926 1,365 2,033 – – – – –Income (loss) from investmentsin associated companies 341 (86) 126 166 2 (568) 61 428 23 (15) (86)Income from other investments 70 1,408 309 (3,581) 828 37 141 93 69 (13) (57)Restructuring costs – (3,862) – – – – – – – – –Operating income (loss) 6,668 (676) 2,837 2,504 14,679 18,153 18,713 20,583 14,454 (16,333) 17,834129
Financial information <strong>2010</strong>Eleven-year summaryConsolidated balance sheetsSEK M 2000 2001 2002 2003 2004 2005 2006 2007 2008 2009 <strong>2010</strong>Intangible assets 6,925 17,525 17,045 16,756 17,612 20,421 19,117 36,508 43,958 41,628 40,714Property, plant and equipment 22,231 33,234 30,799 30,640 31,151 35,068 34,379 47,210 57,270 55,280 54,242Assets under operating leases 14,216 27,101 23,525 21,201 19,534 20,839 20,501 22,502 25,429 20,388 19,647Shares and participations 30,481 27,798 27,492 22,206 2,003 751 6,890 2,219 1,953 2,044 2,098Inventories 23,551 31,075 28,305 26,459 28,598 33,937 34,211 43,645 55,045 37,727 39,837Customer-financing receivables 41,791 48,784 46,998 46,002 51,193 64,466 64,742 78,847 98,489 81,977 72,688Interest-bearing receivables 19,228 8,079 5,490 6,632 3,384 1,897 4,116 4,530 5,101 3,044 2,757Other receivables 26,352 39,946 33,990 32,621 35,747 42,881 42,567 55,152 61,560 50,575 53,154Non-current assets held for sale – – – – – – 805 – – 1,692 136Liquid funds 15,968 27,383 25,578 28,735 34,746 36,947 31,099 31,034 23,614 37,910 32,733Assets 200,743 260,925 239,222 231,252 223,968 257,207 258,427 321,647 372,419 332,265 318,007Shareholders’ equity 1 88,931 85,576 78,525 72,636 70,155 78,760 87,188 82,781 84,640 67,034 74,121Provision for postemploymentbenefits 2,632 14,647 16,236 15,288 14,703 11,986 8,692 9,774 11,705 8,051 7,510Other provisions 14,941 18,427 16,721 15,048 14,993 18,556 20,970 27,084 29,076 19,485 18,992Interest-bearing liabilities 66,233 81,568 72,437 74,092 61,807 74,885 66,957 108,318 145,727 156,852 123,695Liabilities associated withassets held for sale – – – – – – 280 – – 272 135Other liabilities 28,006 60,707 55,303 54,188 62,310 73,020 74,340 93,690 101,271 80,571 93,554Shareholders’ equityand liabilities 200,743 260,925 239,222 231,252 223,968 257,207 258,427 321,647 372,419 332,265 318,0071of which minority interests 593 391 247 216 229 260 284 579 630 629 1,011Assets pledged 2,990 3,737 3,610 3,809 3,046 3,255 1,960 1,556 1,380 958 3,339Contingent liabilities 6,789 10,441 9,334 9,611 9,189 7,850 7,726 8,153 9,427 9,607 11,003130
Consolidated balance sheets, Industrial OperationsSEK M 2000 2001 2002 2003 2004 2005 2006 2007 2008 2009 <strong>2010</strong>Intangible assets 6,781 17,366 16,919 16,662 17,570 20,348 19,054 36,441 43,909 41,532 40,613Property, plant and equipment 19,652 30,370 27,789 27,248 27,260 31,330 30,493 47,132 57,185 55,208 54,169Assets under operating leases 4,245 15,020 11,155 8,976 8,477 10,260 11,822 13,850 16,967 13,539 13,217Shares and participations 37,366 35,145 34,750 30,022 10,116 10,357 16,565 2,189 1,935 2,025 2,080Inventories 22,998 30,557 27,564 25,848 28,291 33,583 33,893 43,264 54,084 35,765 38,956Customer-financing receivables 15 114 99 118 230 1,377 1,193 1,233 975 1,367 1,428Interest-bearing receivables 19,286 12,426 8,495 9,413 12,127 7,691 13,214 13,701 6,056 8,010 11,153Other receivables 24,882 38,815 34,256 33,079 36,535 43,992 43,335 55,970 60,586 49,008 52,358Non-current assets held for sale – – – – – – 805 – – 1,692 136Liquid funds 10,958 24,874 24,154 28,102 34,628 36,047 29,907 30,026 22,575 37,404 31,491Assets 146,183 204,687 185,181 179,468 175,234 194,985 200,281 243,806 264,272 245,550 245,602Shareholders’ equity 88,931 85,576 78,525 72,636 70,155 78,760 87,188 75,129 75,046 58,485 66,101Provision for postemploymentbenefits 2,619 14,632 16,218 15,264 14,677 11,966 8,661 9,746 11,677 8,021 7,478Other provisions 8,277 14,085 13,893 12,792 14,115 17,164 19,385 25,372 27,015 17,456 17,240Interest-bearing liabilities 18,233 29,710 22,494 24,677 13,968 13,097 9,779 38,286 46,749 78,890 59,857Liabilities associated withassets held for sale – – – – – – 280 – – 272 135Other liabilities 28,123 60,684 54,051 54,099 62,319 73,998 74,988 95,273 103,785 82,426 94,791Shareholders’ equityand liabilities 146,183 204,687 185,181 179,468 175,234 194,985 200,281 243,806 264,272 245,550 245,602131
Financial information <strong>2010</strong>Eleven-year summaryConsolidated cash-flow statementsSEK bn 2000 2001 2002 2003 2004 2005 2006 2007 2008 2009 <strong>2010</strong>Operating income 6.7 (0.7) 2.8 2.5 14.7 18.2 20.4 22.2 15.9 (17.0) 18.0Depreciation and amortization 6.3 10.0 10.8 10.2 10.0 9.9 12.4 12.5 13.5 15.2 13.8Other items not affecting cash (0.4) 0.5 2.0 4.9 (0.1) 0.4 0.7 (0.5) (0.2) 4.4 1.6Change in working capital (3.3) 6.4 1.0 0.4 (1.4) (4.7) (7.7) (9.9) (23.3) 16.9 4.8Customer financing receiv ables, net (4.5) (3.7) (5.7) (4.3) (7.4) (7.8) – – – – –Financial items and income tax (1.3) (2.1) (1.3) (0.9) (0.5) (2.0) (4.3) (5.9) (5.2) (4.6) (5.5)Cash-flow from operatingactivities 3.5 10.4 9.6 12.8 15.3 14.0 21.5 18.4 0.7 14.9 32.7Investments in fixed assets (5.4) (8.1) (6.7) (6.0) (7.4) (10.3) (10.0) (10.1) (12.7) (10.5) (10.4)Investments in leasing assets (5.7) (5.8) (5.2) (5.3) (4.4) (4.5) (4.6) (4.8) (5.4) (4.2) (4.8)Disposals of fixed assets andleasing assets 2.1 2.6 3.2 2.9 2.4 2.6 3.2 2.9 2.9 3.8 3.1Shares and participations, net (1.6) 3.9 (0.1) (0.1) 15.1 0.3 (5.8) 0.4 0.0 0.0 (0.1)Acquired and divested subsidiariesand other business units, net 0.0 13.0 (0.2) 0.0 (0.1) 0.7 0.5 (15.0) (1.3) 0.2 0.6Interest-bearing receivablesincluding marketable securities 11.7 (3.7) (1.5) (2.0) (6.4) (1.3) 7.7 3.6 10.9 (8.9) 6.8Cash-flow after net investments 4.6 12.3 (0.9) 2.3 14.5 1.5 12.5 (4.6) (4.9) (4.7) 27.9Increase (decrease) in loans 8.1 6.2 (0.1) 1.9 (8.8) 3.6 (2.6) 28.7 18.2 12.6 (25.7)Repurchase of own shares (11.8) (8.3) – – (2.5) (1.8) – – – 0.0 –Cash dividend/payment toAB <strong>Volvo</strong>’s shareholders (3.1) (3.4) (3.4) (3.4) (3.4) (5.1) (6.8) (20.3) (11.1) (4.1) 0.0Cash payment to minority – – – – – – – – – – (0.1)Other 0.0 0.1 0.1 0.1 0.0 0.0 0.0 0.0 0.0 (0.1) 0.0Change in cash and cashequivalents excludingtranslation differences (2.2) 6.9 (4.3) 0.9 (0.2) (1.8) 3.1 3.8 2.2 3.7 2.1Translation differences on cashand cash equivalents 0.3 0.6 (0.7) (0.6) (0.2) 1.1 (0.5) 0.0 1.0 (0.2) (0.4)Change in cash and cashequivalents (1.9) 7.5 (5.0) 0.3 (0.4) (0.7) 2.6 3.8 3.2 3.5 1.7Operating cash flow Industrial OperationsSEK bn 2000 2001 2002 2003 2004 2005 2006 2007 2008 2009 <strong>2010</strong>Operating income 5.2 (1.0) 2.3 1.6 13.3 16.1 18.7 20.6 14.5 (16.3) 17.8Depreciation and amortization 3.8 7.0 7.8 7.2 7.1 7.3 9.8 10.3 11.8 12.4 11.4Other items not affecting cash (1.6) 0.0 1.0 4.1 (0.6) 0.2 0.2 (0.4) (0.7) 2.3 0.1Change in working capital (3.0) 6.8 0.4 0.7 (1.4) (5.6) (3.1) (0.1) (10.9) 4.7 4.6Financial items and income taxes (0.8) (2.3) (1.1) (0.7) (0.2) (1.9) (3.7) (6.0) (5.0) (4.7) (5.1)Cash flow from operatingactivities 3.6 10.5 10.4 12.9 18.2 16.1 21.9 24.4 9.7 (1.6) 28.8Investments in fixed assets (5.1) (7.7) (6.3) (5.8) (7.2) (9.9) (9.7) (10.1) (12.6) (10.3) (10.3)Investments in leasing assets (0.6) (0.5) (0.1) (0.1) (0.3) (0.3) (0.5) (0.2) (0.4) (0.2) (0.3)Disposals of fixed assets andleasing assets 0.7 1.1 1.1 0.6 0.7 0.9 0.9 1.1 0.6 0.7 0.8Operating cash-flow (1.4) 3.4 5.1 7.6 11.4 6.8 12.6 15.2 (2.7) (11.4) 19.0132
Exports from SwedenSEK M 2000 2001 2002 2003 2004 2005 2006 2007 2008 2009 <strong>2010</strong><strong>Volvo</strong> <strong>Group</strong>, total 46,251 50,394 52,730 49,300 62,653 71,133 80,517 88,606 96,571 41,829 72,688Key ratios2000 2001 2002 2003 2004 2005 2006 2007 2008 2009 <strong>2010</strong>Gross margin, % 1 19.3 17.2 17.9 19.2 21.6 21.8 22.7 22.6 21.3 13.9 23.3Research and developmentexpenses as percentage ofnet sales 1 4.1 3.0 3.3 3.9 3.8 3.3 3.4 4.0 4.9 6.3 5.0Selling expenses as percentageof net sales 1 7.7 8.1 8.7 9.1 9.1 8.5 8.0 8.9 8.7 11.4 8.8Administration expenses aspercentage of net sales 1 3.9 3.6 3.1 3.0 2.6 2.7 2.6 2.6 2.3 2.8 2.2Return on shareholders’ equity, % 5.0 neg 1.7 0.4 13.9 17.8 19.6 18.1 12.1 (19.7) 16.0Interest coverage, times 1 4.5 neg 2.2 1.9 11.0 16.7 26.1 20.7 8.8 (4.7) 5.9Self-financing ratio, % 39 92 110 152 163 116 189 153 5 137 270Self-financing ratio IndustrialOperations, % 72 148 196 243 268 173 235 265 78 (16) 294Financial position, IndustrialOperations, SEK M 9,392 (7,042) (6,063) (2,426) 18,110 18,675 23,076 (4,305) (29,795) (41,489) (24,691)Net financial position aspercentage of shareholders'equity , Industrial Operations 10.6 (8.2) (7.7) (3.3) 25.8 23.7 29.2 (5.7) (39.7) (70.9) (37.4)Shareholders’ equity aspercentage of total assets 44.3 32.8 32.8 31.4 31.3 30.6 33.7 25.7 22.7 20.2 23.3Shareholders’ equity aspercentage of total assets,Industrial Operations 60.8 41.8 42.4 40.5 40.0 40.4 40.6 30.8 28.4 23.8 26.9Shareholders’ equity excludingminority interest as percentage oftotal assets 44.0 32.6 32.7 31.3 31.2 30.5 33.6 25.6 22.6 20.0 23.01 Pertains to the Industrial Operations. For periods up to and including 2006, <strong>Volvo</strong> Financial Services is included and consolidated according to the equity method.133
Financial information <strong>2010</strong>Eleven-year summary<strong>Volvo</strong> share statisticsData per share (adjusted for issues and splits) 12000 2001 2002 2003 2004 2005 2006 2007 2008 2009 <strong>2010</strong>Basic earnings, SEK 1 2.24 (0.70) 0.66 0.14 4.72 6.44 8.03 7.37 4.90 (7.26) 5.36Cash dividend, SEK 1.60 1.60 1.60 1.60 2.50 3.35 10.00 9 5.50 2.00 0 2.50 10Share price at year-end, SEK (B share) 31.30 35.20 28.40 43.70 52.70 74.90 90.70 108.50 42.90 61.45 118.50Direct return, % (B share) 2 5.1 4.5 5.6 10.5 8 4.7 4.5 11.0 5.1 4.7 – 2.1Effective return, % (B share) 3 (23) 17.6 (14.8) 71.2 25.5 48.5 39.8 25.7 (59) 43 97Price/earnings ratio (B share) 4 14 neg 43 310 11.2 11.6 11.3 14.7 8.8 neg 22.1EBIT multiple 5 10 25 23 14 9.2 9.3 10.3 9.7 3.6 neg 12.0Payout ratio, % 6 71 neg 242 1,143 53 52 62 75 41 – 47Shareholders’ equity, SEK 7 44.40 40.60 37.40 34.60 34 38.80 43 41 41 33 36Return on shareholders’ equity 5.0 neg 1.7 0.4 13.9 17.8 19.6 18.1 12.1 neg 16.01 Basic earnings per share is calculated as income for the period dividedby average number of shares outstanding. <strong>Report</strong>ing according to IFRSfrom 2004.2 Proposed dividend in SEK per share divided by share price at year-end.3 Share price at year-end, including proposed dividend during the year,divided by share price at beginning of the year, (2000 includes premiumin connection with repurchase, 2003 includes distribution of shares inAinax, 2006 includes a share split 6:1 in which the sixth share wasredeemed by AB <strong>Volvo</strong> for an amount of SEK 5.00 per share).4 Share price at year-end divided by basic earnings per share.5 Market value at year-end minus net financial position and minority interestsdivided by operating income excluding restructuring costs andrevaluation of shares.6 Cash dividend divided by basic earnings per share.7 Shareholders’ equity for shareholders in AB <strong>Volvo</strong> divided by number ofshares outstanding at year-end.8 Including distribution of shares in Ainax equal to SEK 3.01 (share-splitadjusted) per <strong>Volvo</strong> share in 2004.9 Including extra payment of SEK 5 through redemption of shares.10 Proposed by the Board of Directors.Other share data 2000 2001 2002 2003 2004 2005 2006 2007 2008 2009 <strong>2010</strong>Number of shareholdersat year-end 230,000 214,000 211,000 208,500 202,300 195,442 183,735 197,519 220,192 233,311 240,043Number of Series A shares outstandingat year-end, million 124.7 131.7 131.7 131.7 131.5 131.4 131.4 657 657 657 657Number of Series B sharesoutstanding at year-end, million 272.6 287.8 287.8 287.8 278.6 273.1 273.4 1,369 1,371 1,371 1,371Average number of shares outstanding,million 421.7 422.4 419.4 419.4 418.5 405.2 404.7 2,025 2,027 2,027 2,027Number of Series A shares traded inStockholm during the year, million 42.4 40.3 27.3 31.4 42.0 39.3 56.4 172.3 308.0 147.0 203.2Number of Series B sharestraded in Stockholm during theyear, million 391.2 344.4 349.4 404.8 498.0 518.7 617.0 2,712.4 3,130.0 2,713.9 2,272.4Number of shares traded in ADR,NASDAQ during the year, million 16.0 15.0 11.0 10.4 24.0 19.8 14.1 113.5 – – –<strong>The</strong> largest shareholders in AB <strong>Volvo</strong>, December 31, <strong>2010</strong> 1Number ofshares% of totalvotesSharecapital, %Renault s.a.s. 138,604,945 17.5 6.8Industrivärden 92,445,434 11.1 4.6Violet Partners LP 43,727,400 5.5 2.2SHB 2 46,454,585 4.8 2.3AMF Insurance & Funds 56,042,500 3.9 2.8AFA Insurance 29,136,945 3.5 1.4Alecta (pension funds) 69,725,000 3.5 3.4Swedbank Robur Funds 90,469,158 3.5 4.5SEB Funds/Trygg Life Insurance 50,605,131 2.6 2.5Skandia Liv 21,619,796 2.5 1.1Total 638,830,894 58.4 31.6Distribution of shares, December 31, <strong>2010</strong> 1<strong>Volvo</strong> shareholdersNumber ofshareholders% of totalvotes 1Share ofcapital, % 11–1,000 shares 182,716 2.3 2.81,001–10,000 shares 52,572 5.4 7.310,001–100,000 shares 4,050 3.1 4.8100,001– 703 89.2 85.1Total 240,043 100.0 100.01 Based on all registered shares.AB <strong>Volvo</strong> held 4.7% of the Company’s shares on December 31, <strong>2010</strong>.1 Based on the number of outstanding shares.2 Comprises shares held by SHB, SHB Pension Fund, SHB Employee Fund,SHB Pensionskassa and Oktogonen.134
Business area statisticsNet sales 1SEK M 2000 2001 2002 2003 2004 2005 2006 2007 2008 2009 <strong>2010</strong>Trucks Western Europe 30,415 60,841 61,406 63,097 68,664 70,567 80,116 86,035 86,994 58,754 60,139Eastern Europe 3,158 5,526 6,424 7,004 8,767 9,139 13,166 22,616 22,920 7,120 9,467North America 17,048 33,630 33,721 28,151 35,154 46,129 50,605 27,255 26,588 21,563 26,901South America 3,111 3,993 3,277 3,464 5,223 7,657 9,213 11,483 14,680 12,490 21,680Asia 3,432 4,659 5,919 9,206 12,378 13,551 8,975 26,593 37,515 26,943 35,231Other markets 1,911 7,919 8,005 6,047 6,693 8,353 9,190 13,910 14,538 12,069 13,887Total 59,075 116,568 118,752 116,969 136,879 155,396 171,265 187,892 203,235 138,940 167,305Buses Western Europe 6,767 6,263 6,695 6,153 6,422 6,564 7,390 7,204 6,987 7,269 6,088Eastern Europe 182 373 409 381 526 578 534 563 334 438 154North America 7,723 6,847 3,838 2,984 2,960 4,247 4,910 4,630 5,355 5,673 7,200South America 732 757 366 329 521 2,641 1,537 1,623 1,571 1,235 1,737Asia 1,269 1,839 2,022 1,447 1,632 1,612 2,003 1,802 2,094 2,749 3,299Other markets 514 596 705 684 661 947 897 786 971 1,101 2,038Total 17,187 16,675 14,035 11,978 12,722 16,589 17,271 16,608 17,312 18,465 20,516Construction Western Europe 10,029 10,326 10,383 11,576 12,443 14,213 18,438 21,852 20,763 11,188 13,471EquipmentEastern Europe 255 341 454 772 1,010 1,311 1,888 3,442 4,429 1,799 2,667North America 5,823 6,145 5,667 5,428 8,601 10,337 11,280 11,170 10,159 5,475 6,267South America 776 847 709 636 922 1,238 1,358 2,155 2,913 2,578 4,130Asia 2,484 2,773 3,048 3,707 4,961 5,717 6,903 12,179 13,738 12,957 24,352Other markets 626 703 751 1,035 1,423 2,000 2,264 2,835 4,077 1,661 2,923Total 19,993 21,135 21,012 23,154 29,360 34,816 42,131 53,633 56,079 35,658 53,810<strong>Volvo</strong> Penta Western Europe 3,204 3,789 3,846 4,081 4,723 4,845 5,748 6,290 6,100 4,113 4,221Eastern Europe 30 38 99 108 184 257 363 508 454 277 285North America 2,257 2,175 2,261 2,109 2,500 2,832 2,815 2,674 1,947 1,100 1,501South America 160 213 127 146 142 208 221 274 364 284 335Asia 794 988 1,141 947 1,324 1,427 1,359 1,624 2,082 2,054 2,008Other markets 154 177 195 205 184 207 268 349 486 331 366Total 6,599 7,380 7,669 7,596 9,057 9,776 10,774 11,719 11,433 8,159 8,716<strong>Volvo</strong> Aero Western Europe 4,651 4,788 3,422 3,951 3,130 3,346 3,674 3,431 3,468 3,914 3,744Eastern Europe 42 87 28 49 49 60 124 31 29 28 24North America 5,040 5,841 4,573 3,301 3,127 3,612 3,815 3,723 3,534 3,508 3,599South America 134 187 177 152 138 168 173 127 58 34 27Asia 701 708 497 428 400 284 356 234 234 205 233Other markets 145 173 140 149 81 68 91 100 125 114 81Total 10,713 11,784 8,837 8,030 6,925 7,538 8,233 7,646 7,448 7,803 7,708Other andeliminations 6,825 7,073 6,775 7,041 7,228 7,076 (654) (703) (575) (538) (680)Net sales Industrial Operations 180,615 177,080 174,768 202,171 231,191 249,020 276,795 294,932 208,487 257,375Customer Western Europe 6,240 5,314 5,573 5,604 6,114 4,213 4,009 3,845 6,021 5,417 3,909Finance Eastern Europe 257 360 424 474 499 584 379 639 1,078 1,710 824North America 2,626 3,216 3,344 2,542 2,432 2,036 2,569 2,467 369 3,004 2,605South America 452 451 403 358 396 570 608 620 791 1,070 1,156Asia 0 24 49 65 90 101 45 87 158 435 435Other markets 103 130 132 110 67 45 38 47 68 75 101Total 9,678 9,495 9,925 9,153 9,598 7,549 7,648 7,705 8,485 11,711 9,031Eliminations – (830) (807) (630) (693) 1,819 2,167 905 250 (1,836) (1,658)<strong>Volvo</strong> <strong>Group</strong> total 130,070 189,280 186,198 183,291 211,076 240,559 258,835 285,405 303,667 218,361 264,749As of January 1, 2007, the results from the synergies created in thebusiness units are transferred back to the various business areas. Comparisonfigures for 2006 have been restated.1 Net sales 2000–2001 have been restated in accordance with new organizationeffective from 2002.135
Financial information <strong>2010</strong>Eleven-year summaryOperating incomeSEK M 2000 2001 4 2002 2003 3 2004 2 2005 2006 1 2007 2008 2009 <strong>2010</strong>Trucks 5 1,414 (2,066) 1,189 3,951 8,992 11,717 13,116 15,193 12,167 (10,805) 10,112Buses 440 (916) (94) (790) 158 470 745 231 (76) (350) 780Construction Equipment 1,594 527 406 908 1,898 2,752 4,072 4,218 1,808 (4,005) 6,180<strong>Volvo</strong> Penta 484 658 647 695 940 943 1,105 1,173 928 (230) 578<strong>Volvo</strong> Aero 621 653 5 (44) 403 836 359 529 359 50 286Customer Finance 1,499 325 490 926 1,365 2,033 1,686 1,649 1,397 (680) 167Other 616 143 194 (3,142) 923 (598) (684) (762) (731) (994) (102)Operating income(loss) <strong>Volvo</strong> <strong>Group</strong> 6,668 (676) 2,837 2,504 14,679 18,153 20,399 22,231 15,851 (17,013) 18,000As of January 1, 2007, the benefits from the synergies created in thebusiness units are transferred back to the various business areas. Comparisonfigures for 2006 have been restated.1 Operating income in 2006 includes adjustment of goodwill of neg 1,712,reported in Trucks.2 Operating income in 2004 included reversal of write-down of shares in ScaniaAB of 915, reported in Other, and write-down of shares in Henlys <strong>Group</strong> Plc of95, reported in Buses.3 Operating income in 2003 included write-down of shares in Scania AB andHenlys <strong>Group</strong> Plc amounting to 4,030, of which 429 was reported in Buses(Henlys <strong>Group</strong>) and 3,601 was reported in Other (Scania AB).4 Operating income in 2001 included restructuring costs mainly related to theintegration of Mack Trucks and Renault Trucks of 3,862 of which 3,106 inTrucks, 392 in Buses and 364 in Construction Equipment.5 Refers to <strong>Volvo</strong> Trucks for 2000.Operating margin% 2000 2001 2002 2003 2004 2005 2006 2007 2008 2009 <strong>2010</strong>Trucks 2.4 (1.8) 1.0 3.4 6.6 7.5 7.7 8.1 6.0 (7.8) 6.0Construction Equipment 8.0 2.5 1.9 3.9 6.5 7.9 9.7 7.9 3.2 (11.2) 11.5Buses 2.6 (5.5) (0.7) (6.6) 1.2 2.8 4.3 1.4 (0.4) (1.9) 3.8<strong>Volvo</strong> Penta 7.3 8.9 8.4 9.1 10.4 9.6 10.3 10.0 8.1 (2.8) 6.6<strong>Volvo</strong> Aero 5.8 5.5 0.1 (0.5) 5.8 11.1 4.4 6.9 4.8 0.6 3.7<strong>Volvo</strong> <strong>Group</strong> IndustrialOperations 5.5 (0.4) 1.6 1.4 7.3 7.9 7.9 7.8 5.2 (7.8) 6.9Number of employees at year-endNumber 1,2 2000 2001 2002 2003 2004 2005 2006 2007 2008 2009 <strong>2010</strong>Trucks 24,320 44,180 43,470 46,900 49,450 50,240 49,900 64,390 64,280 56,505 57,796Buses 9,060 6,230 6,660 6,680 7,700 7,710 7,760 9,290 8,930 9,541 8,685Construction Equipment 8,830 7,780 8,410 9,280 9,930 10,290 11,050 19,710 19,810 16,126 16,648<strong>Volvo</strong> Penta 1,480 1,370 1,410 1,440 1,580 1,560 1,650 3,000 2,940 2,928 2,353<strong>Volvo</strong> Aero 4,240 4,040 3,660 3,440 3,350 3,460 3,510 3,550 3,510 3,278 3,120Financial Services 1,220 1,080 1,060 1,060 1,100 1,070 1,010 1,150 1,290 1,234 1,235Other 5,120 6,240 6,490 6,940 7,970 7,530 8,310 610 620 596 572<strong>Volvo</strong> <strong>Group</strong>, total 54,270 70,920 71,160 75,740 81,080 81,860 83,190 101,700 101,380 90,208 90,4091 As of 2007, employees in business units are allocated to the business areas.2 As of 2009 regular employees are shown, previously temporary employees were also included.136
EmployeesNumber 1 2000 2001 2002 2003 2004 2005 2006 2007 2008 2009 <strong>2010</strong>Sweden 25,030 24,350 25,420 26,380 28,530 27,070 27,830 28,660 28,190 22,763 23,073Europe, excluding Sweden 12,320 27,800 27,130 29,120 28,930 29,650 30,070 32,780 32,940 29,793 29,239North America 11,410 12,670 12,440 12,270 14,620 15,140 14,820 15,750 14,200 12,640 12,844South America 2,100 2,090 2,020 2,640 3,110 3,690 3,890 4,640 4,380 4,257 4,322Asia 2,570 2,550 2,590 3,710 4,130 4,210 4,420 17,150 19,090 18,416 18,535Other markets 840 1,460 1,560 1,620 1,760 2,100 2,160 2,720 2,580 2,339 2,396<strong>Volvo</strong> <strong>Group</strong> total 54,270 70,920 71,160 75,740 81,080 81,860 83,190 101,700 101,380 90,208 90,4091 As of 2009 regular employees are shown, previously temporary employees were also included.Delivered unitsNumber 2000 2001 2002 2003 2004 2005 2006 2007 2008 2009 <strong>2010</strong>Heavy-duty trucks (>16 tons) 76,470 117,180 120,200 120,920 152,300 172,242 179,089 172,322 179,962 82,675 123,522Medium-duty trucks (7–15.9 tons) 5,360 17,310 16,220 15,870 18,800 18,643 14,695 27,933 30,817 21,653 30,657Light trucks (
Corporate Governance <strong>Report</strong> <strong>2010</strong><strong>Group</strong> ManagementOlof PerssonLeif Johansson Pär Östberg Dennis Slagle Jan-Eric SundgrenSatoru TakeuchiStefano Chmielewski Staffan Zackrisson Per Löjdquist Mikael Bratt Stefan JohnssonGöran GummesonStaffan JuforsHåkan KarlssonEva PerssonPeter KarlstenMartin Weissburg138
<strong>Group</strong> ManagementLeif JohanssonPresident and CEOBorn 1951. M. Sc. Engineering. President of AB <strong>Volvo</strong> andChief Executive Officer of the <strong>Volvo</strong> <strong>Group</strong> since 1997.With <strong>Volvo</strong> since 1997. Chairman: ERT (European RoundTable of Industrialists). Board member: Bristol-MyersSquibb Company, Svenska Cellulosa Aktiebolaget SCA and<strong>The</strong> Confederation of Swedish Enterprise. Member of theRoyal Swedish Academy of Engineering Sciences. Memberof the <strong>Volvo</strong> Board since 1997. Holdings in <strong>Volvo</strong>, ownand related parties: 540,810 shares, including 349,023Series B shares.Staffan JuforsPresident of <strong>Volvo</strong> TrucksBorn 1951. Master of Business Administration. President of<strong>Volvo</strong> Trucks since 2004. President of <strong>Volvo</strong> Penta 1998–2004. Member of the <strong>Group</strong> Executive Committee since1998. With <strong>Volvo</strong> since 1975. Board member: Seco ToolsAB. Holdings in <strong>Volvo</strong>, own and related parties: 40,863shares, including 34,937 Series B shares.Stefano ChmielewskiPresident of Renault TrucksBorn 1952. MA M. Sc. Electronics/Automation. President ofRenault Trucks since 2003. Member of the <strong>Group</strong> ExecutiveCommittee since 2003. With <strong>Volvo</strong> since 2001. Holdings in<strong>Volvo</strong>, own and related parties: None.Dennis SlaglePresident and CEO of North American TrucksBorn 1954. Bachelor of Science. President and CEO ofNorth American Trucks since November 1, 2009. Presidentand CEO of Mack Trucks, Inc. since 2008. President andCEO of <strong>Volvo</strong> Construction Equipment North America2003–2008. Previously President of L.B. Smith, Inc. Memberof the <strong>Group</strong> Executive Committee since 2008. With<strong>Volvo</strong> since 2000. Board member: West Virginia WesleyanCollage Board of Trustees. Holdings in <strong>Volvo</strong>, own andrelated parties: 8,838 Series B shares.Satoru TakeuchiPresident of UD Trucks, included in Trucks AsiaBorn 1946. President of UD Trucks since 2007. Member ofthe <strong>Group</strong> Executive Committee since 2007. With <strong>Volvo</strong>since 2007. Holdings in <strong>Volvo</strong>, own and related parties:None.Håkan KarlssonPresident of <strong>Volvo</strong> BusesBorn 1961. M. Sc. Engineering. President of <strong>Volvo</strong> Busessince 2003. President of <strong>Volvo</strong> Logistics 2000–2003. Memberof the <strong>Group</strong> Executive Committee since 2003. With<strong>Volvo</strong> since 1986. Holdings in <strong>Volvo</strong>, own and relatedparties: 37,333 shares, including 35,842 Series B shares.Olof PerssonPresident of <strong>Volvo</strong> Construction EquipmentBorn 1964. Bachelor of Business Administration. Presidentof <strong>Volvo</strong> Aero 2006–2008. President of <strong>Volvo</strong> ConstructionEquipment since 2008. Member of the <strong>Group</strong> ExecutiveCommittee since 2006. With <strong>Volvo</strong> since 2006. Holdings in<strong>Volvo</strong>, own and related parties: 42,250 Series B shares.Göran GummesonPresident of <strong>Volvo</strong> PentaBorn 1947. President of <strong>Volvo</strong> Penta since 2004. Has heldvarious positions at <strong>Volvo</strong> Penta since 1991, head of <strong>Volvo</strong>Penta’s European operations 1998–2004. Member of the<strong>Group</strong> Executive Committee since 2004. With <strong>Volvo</strong> since1991. Holdings in <strong>Volvo</strong>, own and related parties:108,962 shares, including 108,862 Series B shares.Staffan ZackrissonPresident of <strong>Volvo</strong> AeroBorn 1953. Master of Science & Engineering. President of<strong>Volvo</strong> Aero since 2008. Has held various positions at <strong>Volvo</strong>Aero 1979–87 and since 1989. Member of the <strong>Group</strong> ExecutiveCommittee since 2008. With <strong>Volvo</strong> 1979–87 and since1989. Holdings in <strong>Volvo</strong>, own and related parties:10,333 Series B shares.Martin WeissburgPresident of <strong>Volvo</strong> Financial ServicesBorn 1962. Bachelor of Science, Master of Business Administration.President of <strong>Volvo</strong> Financial Services since May 15,<strong>2010</strong>. President of <strong>Volvo</strong> Financial Services the Americas2005–<strong>2010</strong>. Member of the <strong>Group</strong> Executive Committeesince May 15, <strong>2010</strong>. With <strong>Volvo</strong> since 2005. Holdings in<strong>Volvo</strong>, own and related parties: 4,500 Series B shares.Peter KarlstenPresident of <strong>Volvo</strong> PowertrainBorn 1957. M. Sc. Electrical Engineering. President of <strong>Volvo</strong>Powertrain since 2007. Senior Vice President Technologyfor the <strong>Volvo</strong> <strong>Group</strong> since 2007. Head of <strong>Volvo</strong> Trucks inBrazil 2001–2003. Head of <strong>Volvo</strong>’s North American truckoperations 2003–2007. Member of the <strong>Group</strong> ExecutiveCommittee since 2007. With <strong>Volvo</strong> since 2001. Holdings in<strong>Volvo</strong>, own and related parties: 142,406 shares, including142,250 series B shares.Pär ÖstbergSenior Vice President and President Trucks AsiaBorn 1962. Master of Business Administration. Senior VicePresident of AB <strong>Volvo</strong> since 2005. Has held various seniorpositions in the financial areas in the <strong>Volvo</strong> <strong>Group</strong> since 1990,most recently as CFO of the <strong>Volvo</strong> <strong>Group</strong> 2005–2008, priorto that as Senior Vice President and CFO of Renault Trucks2004–2005. Member of the <strong>Group</strong> Executive Committeesince 2005. With <strong>Volvo</strong> since 1990. Holdings in <strong>Volvo</strong>,own and related parties: 150,767 shares, including150,667 Series B shares.Stefan JohnssonSenior Vice PresidentBorn 1959. Master of Business Administration. Senior VicePresident of AB <strong>Volvo</strong> responsible for business units, humanresources and coordination of the <strong>Group</strong>’s soft productsbusiness. Senior Vice President of AB <strong>Volvo</strong> and CFO of the<strong>Volvo</strong> <strong>Group</strong> 1998–2005. President of <strong>Volvo</strong> <strong>Group</strong> FinanceSweden 1994–1998. Member of the <strong>Group</strong> Executive Committeesince 1998. With <strong>Volvo</strong> since 1987. Board member:<strong>The</strong> Association of Swedish Engineering Industries, <strong>The</strong>Chalmers University of Technology Foundation and GUSchool of Executive Education AB. Holdings in <strong>Volvo</strong>, ownand related parties: 149,198 shares, including 148,667Series B shares.Mikael BrattSenior Vice President and CFOBorn 1967. Senior Vice President of AB <strong>Volvo</strong> and CFO ofthe <strong>Volvo</strong> <strong>Group</strong> since 2008. Responsible for finance, strategyand business development. Has held various seniorpositions in the financial areas in the <strong>Volvo</strong> <strong>Group</strong>, mostrecently as Vice President & Head of Corporate Finance atAB <strong>Volvo</strong>. Member of the <strong>Group</strong> Executive Committee since2008. With <strong>Volvo</strong> since 1988. Holdings in <strong>Volvo</strong>, own andrelated parties: 73,802 shares, including 72,967 Series Bshares.Eva PerssonSenior Vice President and General CounselBorn 1953. Master of Laws. Senior Vice President of AB<strong>Volvo</strong> and General Counsel of the <strong>Volvo</strong> <strong>Group</strong>. Responsiblefor legal, compliance, tax and security matters. Member ofthe <strong>Group</strong> Executive Committee since 1997. With <strong>Volvo</strong>since 1988. Secretary to the <strong>Volvo</strong> Board since 1997. Boardmember: Handelsbanken Region Väst and Norsk HydroASA. Holdings in <strong>Volvo</strong>, own and related parties: 75,823shares, including 74,407 Series B shares.Per LöjdquistSenior Vice PresidentBorn 1949. Senior Vice President of AB <strong>Volvo</strong> responsiblefor corporate communications and brand management.Member of the <strong>Group</strong> Executive Committee since 1997.With <strong>Volvo</strong> since 1973. Holdings in <strong>Volvo</strong>, own and relatedparties: 114,142 shares, including 97,362 Series B shares.Jan-Eric SundgrenSenior Vice PresidentBorn 1951. M. Sc. Engineering, PhD in solid state Physics,Professor in materials science. Senior Vice President of AB<strong>Volvo</strong> responsible for public and environmental affairs. Memberof the <strong>Group</strong> Executive Committee since 2006. With<strong>Volvo</strong> since 2006. Chairman: SP Technical Research Instituteof Sweden. Board member: Hogia AB and LindholmenScience Park AB. Member of the Royal Swedish Academy ofEngineering Sciences. Holdings in <strong>Volvo</strong>, own and relatedparties: 25,202 Series B shares.Changes in <strong>Group</strong> ExecutiveCommitteeTony Helsham, Senior Vice President responsible for softproducts, resigned from the <strong>Group</strong> Executive Committee onMarch 31, <strong>2010</strong>.Martin Weissburg has been appointed as new Presidentof the <strong>Volvo</strong> <strong>Group</strong>’s customer finance company, <strong>Volvo</strong>Financial Services (VFS). Weissburg assumed his new positionon May 15, <strong>2010</strong> and replaced Salvatore L Mauro, whowas appointed new head of the <strong>Volvo</strong> <strong>Group</strong>’s representationoffice in New York.On December 8, <strong>2010</strong> Leif Johansson informed hisintention to resign as CEO of the <strong>Volvo</strong> <strong>Group</strong> in conjunctionwith his 60th birthday in the summer of 2011.139
Corporate Governance <strong>Report</strong> <strong>2010</strong>Board of Directors and AuditorsIn October <strong>2010</strong>, the Board visited UD Trucks in Ageo, Japan.813 111410 126 145 723 9140
Board members elected by the<strong>Annual</strong> General Meeting1. Louis SchweitzerChairman of the Board since January 15, <strong>2010</strong>Chairman of the Remuneration CommitteeBorn 1942. Bachelor of Laws. Board Chairman: Astra-Zeneca Plc. Board member: BNP-Paribas, L’Oréal andVéolia. Member of the <strong>Volvo</strong> Board since 2001. Chairmanof the Board since January 15, <strong>2010</strong>. Holdings in <strong>Volvo</strong>,own and related parties: 40,000 Series B shares.Principal work experience: Official at French BudgetDepartment; Chief of Staff of Mr Laurent Fabius (Ministerof Budget, then Minister for Industry and Research, andPrime Minister), Chairman of the French High Authorityagainst Discrimination and for Equality, HALDE (2005–<strong>2010</strong>); numerous positions with Renault S.A. (Chief FinancialOfficer and Executive Vice President Finance andPlanning, Chief Operating Officer, Chairman and ChiefExecutive Officer).2. Peter BijurMember of the Audit CommitteeBorn 1942. MBA Marketing, BA Political Science.Board member: Gulfmark Offshore Inc. Member of the<strong>Volvo</strong> Board since 2006. Holdings in <strong>Volvo</strong>, own andrelated parties: 3,000 Series B shares.Principal work experience: Numerous positions with TexacoInc, retired as Chairman and Chief Executive Officer in 2001.3. Jean-Baptiste DuzanMember of the Audit CommitteeBorn 1946. Graduate of the Ecole Polytechnique. Advisor tothe Chief Executive Officer, Renault S.A. Senior AdvisorLazard Frères. Board member: Nissan Motor Co. Ltd.Member of the <strong>Volvo</strong> Board since 2009. Holdings in <strong>Volvo</strong>,own and related parties: 1,000 Series B shares.Principal work experience: Began his career at Citibank.Has held various positions within Renault since 1982 –director of financial services at Renault V.I.; director offinancial operations; project director for the car modelSafrane; Senior Vice President, Purchasing; and joined theRenault Management Committee. He was also namedChairman and Managing Director, Renault Nissan PurchasingOrganization.4. Leif JohanssonBorn 1951. Master Sc Engineering. President of AB <strong>Volvo</strong>and Chief Executive Officer of the <strong>Volvo</strong> <strong>Group</strong> since 1997.With <strong>Volvo</strong> since 1997. Chairman: ERT (European RoundTable of Industrialists). Board member: Bristol-MyersSquibb Company, Svenska Cellulosa Aktiebolaget SCA and<strong>The</strong> Confederation of Swedish Enterprise. Member of theRoyal Swedish Academy of Engineering Sciences. Memberof the <strong>Volvo</strong> Board since 1997. Holdings in <strong>Volvo</strong>, ownand related parties: 540,810 shares, including 349,023Series B shares.Principal work experience: Project consultant Indevo;Assistant to President Centro Maskin Morgårdshammar;President Husqvarna Motorcyklar; Division Manager OfficeMachines Facit Sweden; President Facit; Division ManagerAB Electrolux Major Appliances; Division President ABElectrolux Major Appliances; Executive Vice President ABElectrolux; President AB Electrolux; CEO Electrolux <strong>Group</strong>.5. Hanne de MoraBorn 1960. BA in Economics from HEC in Lausanne, MBAfrom IESE in Barcelona. Board Chairman: a-connect(group) ag. Board member: Sandvik AB. Member of the<strong>Volvo</strong> Board since <strong>2010</strong>. Holdings in <strong>Volvo</strong>, own andrelated parties: 3,000 Series B shares.Principal work experience: Credit Analyst Den NorskeCreditbank in Luxemburg 1984, various positions withinbrand management and controlling within Procter & Gamble1986–1989, Partner McKinsey & Company, Inc. 1989–2002, one of the founders and owners, also Chairman ofthe Board, of the management company a-connect (group)ag since 2002.6. Anders NyrénMember of the Remuneration CommitteeBorn 1954. Graduate of the Stockholm School of Economics,MBA at UCLA. President and Chief Executive Officerof AB Industrivärden. Board Chairman: Sandvik AB. ViceChairman: Svenska Handelsbanken. Board member: ABIndustrivärden, Ernströmgruppen, SSAB Svenskt Stål AB,Svenska Cellulosa Aktiebolaget SCA, TelefonaktiebolagetLM Ericsson and SSE Association. Member of the <strong>Volvo</strong>Board since 2009. Holdings in <strong>Volvo</strong>, own and relatedparties: 5,200 Series B shares.Principal work experience: Has worked for AB WilhelmBecker. He has held various positions within STC – Controller,Executive Vice President and CFO, and President of STCVenture AB; President and Chief Executive Officer at OMInternational AB; Executive Vice President and CFO atSecurum; Director with executive responsibility for Marketsand Corporate Finance at Nordbanken; Executive VicePresident and CFO at Skanska.7. Ravi VenkatesanBorn 1963. MBA and M Sc Industrial Engineering. Chairmanof Microsoft India and responsible for Microsoft’s marketing,operational and business development efforts in India.Board member: Non Profit Advisory Board Harvard BusinessSchool, Advisory Board Indian Institute of Technology.Member of the <strong>Volvo</strong> Board since 2008. Holdings in <strong>Volvo</strong>,own and related parties: 700 Series B shares.Principal work experience: Several leading positions withinthe American engine manufacturer Cummins.8. Lars WesterbergChairman of the Audit CommitteeBorn 1948. M Sc Engineering, Bachelor Business Administration.Board Chairman: Autoliv Inc., Husqvarna AB andVattenfall AB. Board member: SSAB Svenskt Stål AB andSandvik AB. Member of the <strong>Volvo</strong> Board since 2007. Holdingsin <strong>Volvo</strong>, own and related parties: 60,000 Series Ashares.Principal work experience: President and CEO of GrängesAB, ESAB AB and Autoliv Inc.9. Ying YehMember of the Remuneration CommitteeBorn 1948. BA, Literature & International Relations. VicePresident and Chairman of Nalco Company, Greater ChinaRegion. Member of the <strong>Volvo</strong> Board since 2006. Holdingsin <strong>Volvo</strong>, own and related parties: None.Principal work experience: Journalist NBC, New York.Numerous positions with the U.S. Government ForeignService in Burma, Hong Kong, Taiwan and Beijing. Variouspositions with Eastman Kodak in China, latest as Presidentand Chairman, North Asia Region.Board members and deputiesappointed by employee organisations10. Martin LinderEmployee representative. Born 1973. With <strong>Volvo</strong> since1994. Member of the <strong>Volvo</strong> Board since 2004. Holdingsin <strong>Volvo</strong>, own and related parties: 212 Series A shares.11. Mikael SällströmEmployee representative. Born 1959. With <strong>Volvo</strong> 1980–1999 and since 2009. Member of the <strong>Volvo</strong> Board since2009. Holdings in <strong>Volvo</strong>, own and related parties:None.12. Berth ThulinEmployee representative. Born 1951. With <strong>Volvo</strong> since1975. Deputy member of the <strong>Volvo</strong> Board since 2009Holdings in <strong>Volvo</strong>, own and related parties: 1,425Series B shares.13. Lars AskEmployee representative. Born 1959. With <strong>Volvo</strong> since 1982.Deputy member of the <strong>Volvo</strong> Board since 2009. Holdings in<strong>Volvo</strong>, own and related parties: 406 shares, including 250Series B shares.14. Peteris LaubertsEmployee representative. Born 1948. With <strong>Volvo</strong> since1999. Deputy member of the <strong>Volvo</strong> Board since <strong>2010</strong>.Holdings in <strong>Volvo</strong>, own and related parties: 156 Series Ashares.Changes in the BoardBoard members elected by the <strong>Annual</strong> GeneralMeetingOn January 15, <strong>2010</strong>, Finn Johnsson resigned as Chairmanand Board member. In connection therewith, Louis Schweitzerwas appointed new Chairman until the next <strong>Annual</strong>General Meeting.At the <strong>Annual</strong> General Meeting <strong>2010</strong> Louis Schweitzerwas appointed Chairman of the Board until the next <strong>Annual</strong>General Meeting. Hanne De Mora was appointed newmember of the Board at the <strong>Annual</strong> General Meeting <strong>2010</strong>.Board members and deputies appointed byemployee organisationsOn January 11, <strong>2010</strong>, Margareta Öhlin left her assignmentas deputy. In connection therewith, Peteris Lauberts wasappointed new deputy.Secretary to the BoardEva PerssonBorn 1953. Master of Laws. Senior Vice President of AB<strong>Volvo</strong> and General Counsel of the <strong>Volvo</strong> <strong>Group</strong>. Secretary tothe <strong>Volvo</strong> Board since 1997. Holdings in <strong>Volvo</strong>, own andrelated parties: 75,823 shares, including 74,407 Series Bshares.AuditorsPricewaterhouseCoopers ABGöran TidströmAuthorized Public Accountant.Lead Partner.Auditor since 2006.Other assignments: Auditor of Trelleborg AB, Meda AB andKungliga Operan. President of IFAC (International Federationof Accountants).Born 1946.Johan RippeAuthorized Public Accountant.Auditor since <strong>2010</strong>.Other assignments: Auditor of Getinge AB and ElandersAB.Born 1968.141
Corporate Governance <strong>Report</strong> <strong>2010</strong>Corpor ate Governance <strong>Report</strong>During <strong>2010</strong>, the Board focused specifically on the <strong>Group</strong>’s business development taking intoaccount the earlier uncertainty primarily on the North American and European markets and therecovery that occurred in <strong>2010</strong> regarding demand for the <strong>Group</strong>’s products. In addition, the Boardfocused on development of the <strong>Group</strong>’s operations ongoing in China, Japan and India.<strong>The</strong> <strong>Volvo</strong> <strong>Group</strong> Corporate Governance ModelRemunerationCommitteeAudit CommitteeBusiness AreasCorporate bodies in corporategovernance<strong>The</strong> governance and control of the <strong>Volvo</strong><strong>Group</strong> is carried out through a number of corporatebodies. At the <strong>Annual</strong> General Meeting,the shareholders exercise their voting rightswith regard, for example, to the composition ofthe Board of Directors of AB <strong>Volvo</strong> and electionof external auditors and as otherwisestipulated in the Companies Act. Informationconcerning the largets shareholders in AB <strong>Volvo</strong>as of December 31, <strong>2010</strong> is provided in theBoard of Director’s report of <strong>Volvo</strong> on page 57.<strong>The</strong> notice for <strong>Annual</strong> General Meetings(and for Extraordinary General Meetings ifany) is, as from the <strong>Annual</strong> General Meeting2011, made through advertisement in thePost- and Inrikes Tidningar (Swedish OfficialGazette and on the company’s website).Announcement that the notice has been publishedis advertised in Dagens Nyheter andGöteborgs-Posten.An Election Committee, appointed by the<strong>Annual</strong> General Meeting of AB <strong>Volvo</strong>, proposescandidates to serve as Board members,Board Chairman and external auditors. <strong>The</strong>Board is responsible for the <strong>Group</strong>’s long-termdevelopment and strategy, for controlling andevaluating the company’s operations and forthe other duties set forth in the CompaniesAct. In addition, the Board appoints the Presidentof AB <strong>Volvo</strong>, who is also the Chief ExecutiveOfficer (CEO). <strong>The</strong> duties of the Board arepartly exercised through its Audit Committeeand its Remuneration Committee. <strong>The</strong> CEO isin charge of the daily management of the<strong>Group</strong> in accordance with guidelines andinstructions provided by the Board.<strong>The</strong> CEO is in charge of the daily managementof the <strong>Group</strong> through primarily two differentbodies, the <strong>Group</strong> Executive Committeeand the business areas’ and business units’Boards of Directors. <strong>The</strong> <strong>Group</strong> Executive Committeecomprises those who report directly tothe CEO. <strong>The</strong> <strong>Group</strong> Executive Committeemeetings, which are led by the CEO, deal with<strong>Group</strong>-wide issues and issues affecting morethan one business area/unit, and sharing ofinformation concerning the <strong>Group</strong>’s performance.<strong>The</strong> CEO or another member of the <strong>Group</strong>Executive Committee is the Chairman of theBoards of all business areas and businessunits, which are comprised mainly of otherShareholders<strong>Annual</strong> General MeetingBoardPresident<strong>Group</strong> Executive CommitteeElection CommiteeAuditorsBusiness Unitsmembers of the <strong>Group</strong> Executive Committee.<strong>The</strong> Boards of the business areas and businessunits effect control and follow-ups of businessareas’ and business units’ financial development,business plans and goals as well as makedecisions regarding, for example, investments.Swedish Code of Corporate Governance<strong>Volvo</strong> applies the Swedish Code of CorporateGovernance (the Code), which is available atwww.bolagsstyrning.se.142
Between January 1, <strong>2010</strong> and December 31,<strong>2010</strong> <strong>Volvo</strong> did not deviate from any of the regulationsset forth in the Code.This Corporate Governance <strong>Report</strong> has beenprepared in accordance with the <strong>Annual</strong>Accounts Act and the Code.Election Committee<strong>The</strong> Election Committee is the shareholders’body responsible for submitting to the <strong>Annual</strong>General Meeting the names of candidates toserve as Chairman at the Meeting and Chairmanand other members of the Board as wellas proposal for fees and other compensationsto be paid to the Board members. In the yearsin which election of auditors for <strong>Volvo</strong> shall beheld, the Election Committee presents proposalfor election of auditors and proposal forfees to be paid to the auditors based on thepreparations carried out by <strong>Volvo</strong>’s Audit Committee.In addition, the Election Committee, inaccordance with prevailing instructions for<strong>Volvo</strong>’s Election Committee, presents proposalsfor members of the Election Committeefor the following year.In accordance with the aforementionedinstructions, the Election Committee shallmeet as often as required for the Committeeto be able to fulfill its duties.<strong>The</strong> Election Committee’s proposal shall bepresented to <strong>Volvo</strong> in sufficient time to beincluded in the notice to attend the <strong>Annual</strong>General Meeting and to be published on <strong>Volvo</strong>’swebsite at the same time. In conjunction withthe notice to attend the <strong>Annual</strong> General Meetingis published, the Election Committee shall,among other things, comment on whetherthose persons who are proposed to be electedas Board members are to be considered asindependent in relation to the company andcompany management as well as to majorshareholders in the company and further tocomment on their material assignments andholding of shares in <strong>Volvo</strong>. Moreover, the Committeeshall report on how it conducted its work.In accordance with existing instructions, the<strong>Annual</strong> General Meeting shall select fivemembers to serve on the Election Committee,of which four shall represent the largest shareholdersin the company, in terms of the numberof votes, who have expressed their willingnessto participate. In addition, one of the membersshall be the Chairman of the AB <strong>Volvo</strong> Board.Additionally, the Election Committee can offerother larger shareholders to appoint one representativeas a member of the Election Committee.If such an offer is made, it should bedirected in turn to the largest shareholder interms of voting rights not already being representedon the Election Committee. <strong>The</strong>number of members on the Election Committee,however, may not exceed seven.<strong>The</strong> Election Committee, which wasappointed at <strong>Volvo</strong>’s <strong>Annual</strong> General Meetingin <strong>2010</strong> in accordance with the instructions,comprised <strong>Volvo</strong>’s Chairman Louis Schweitzer,Thierry Moulonguet, representing Renaults.a.s., Carl-Olof By, representing AB Industrivärden,Håkan Sandberg representing SvenskaHandelsbanken, SHB Pension Fund, SHBEmployee Fund, SHB Pensionskassa, andOktogonen and Lars Förberg, representingViolet Partners LP. <strong>The</strong> Election Committeeelected Thierry Moulonguet as Chairman.Later during <strong>2010</strong>, as offered by the ElectionCommittee, AMF Pension appointed IngridBonde as member of the Committee.<strong>The</strong> Election Committee has decided topropose to the <strong>Annual</strong> General Meeting 2011the re-election of Louis Schweitzer, PeterBijur, Jean-Baptiste Duzan, Leif Johansson,Hanne De Mora, Anders Nyrén, Ravi Venkatesan,Lars Westerberg and Ying Yeh as membersof the Board of Directors. <strong>The</strong> ElectionCommittee has also decided to propose to the<strong>Annual</strong> General Meeting 2011 the re-electionof Louis Schweitzer as Chairman of the Board.<strong>The</strong> BoardDuring the period January 1, <strong>2010</strong> and January15, <strong>2010</strong>AB <strong>Volvo</strong>’s Board of Directors consistedof nine members elected by the <strong>Annual</strong>General Meeting. In addition, the Board had<strong>The</strong> Board’s composition and attendance atmeetings January 1, <strong>2010</strong> to December 31,20Finn Johnsson 1Audit RemunerationBoard Committee CommitteePeter Bijur 8 6Jean-Baptiste Duzan 8 6Leif Johansson 8Hane de Mora 2 4Anders Nyrén 8 5Louis Schweitzer 3 8 5Ravi Venkatesan 6Lars Westerberg 8 6Ying Yeh 4 8 5Martin Linder,employee representative 8Mikael Sällström,employee representative 8Berth Thulin,employee representative 8Total number ofmeetings 8 6 51 Left the Board on January 15, <strong>2010</strong>.2 Was elected member of the Board on the <strong>Annual</strong>General Meeting <strong>2010</strong>.3 Was appointed Chairman of the Board and Charimanof the Remuneration Committee as of January 15,<strong>2010</strong> until the close of the <strong>Annual</strong> General Meeting<strong>2010</strong>. Was Elected Chairman of the Board on the<strong>Annual</strong> General Meeting <strong>2010</strong>. Was appointed Chairmanof the Remuneration Committee in connectionwith the <strong>Annual</strong> General Meeting <strong>2010</strong>.4 Member of the Remuneration Committee as of January15, <strong>2010</strong>.three members and two deputy membersappointed by employee organizations.On January 15, <strong>2010</strong>, Finn Johnsson resignedas Chairman of the Board and Board member.<strong>The</strong>reby, the number of Board members electedby the <strong>Annual</strong> General Meeting decreased toeight. In connection with Finn Johnsson resigningas Chairman of the Board and Board member,the Board of Directors appointed Louis Schweitzeras new Chairman of the Board until thenext <strong>Annual</strong> General Meeting.Effective from and including the <strong>2010</strong> <strong>Annual</strong>General Meeting, AB <strong>Volvo</strong>’s Board of Directorscomprised nine members elected by the <strong>Annual</strong>General Meeting. In addition, the Board hadthree members and two deputy membersappointed by employee organizations. LouisSchweitzer was elected Board Chairman at the<strong>2010</strong> <strong>Annual</strong> General Meeting.AB <strong>Volvo</strong>’s CEO, Leif Johansson, has been amember of the Board during the entire period.143
Corporate Governance <strong>Report</strong> <strong>2010</strong>During <strong>2010</strong>, six regular meetings, one statutorymeeting and one extraordinary meetingwere held.<strong>The</strong> Board has adopted work procedures forits activities that contain rules pertaining tothe distribution of work between the Boardmembers, the number of Board meetings,matters to be handled at regular meetings ofthe Board and duties incumbent on the Chairman.In accordance with these procedures, theBoard’s Chairman shall organize and guide theBoard’s work, be responsible for contacts withthe owners regarding ownership matters andprovide the owners’ viewpoints to the Board,ensure that the Board receives adequateinformation and decision documents for itswork and to control that the Board’s decisionsare complied with. In addition, the work procedurescontain directives concerning the tasksof the Audit Committee and the RemunerationCommittee respectively. <strong>The</strong> Board has alsoissued written instructions specifying howfinancial information should be reported to theBoard as well as defining the distribution ofduties between the Board and the President.<strong>The</strong> <strong>Annual</strong> General Meeting decides on thefees to be paid to the Board members electedby the shareholders. <strong>The</strong> <strong>Annual</strong> General Meetingheld on April 14, <strong>2010</strong> approved a fee to theBoard, for the time until the end of the next<strong>Annual</strong> General Meeting, according to the following:Chairman of the Board should receive afee of SEK 1,500,000 and each of the remainingmembers should receive a fee of SEK500,000, with the exception of the President. Inaddition, the Chairman of the Audit Committeeshould receive SEK 250,000, the other twomembers of the Audit Committee SEK 125,000each and the members of the RemunerationCommittee SEK 75,000 each.During the year, the Board reviewed thebusiness plans and strategies for the variousbusinesses in the <strong>Volvo</strong> <strong>Group</strong>. <strong>The</strong> Board alsoreviewed the financial positions of AB <strong>Volvo</strong>and the <strong>Volvo</strong> <strong>Group</strong> on a regular basis andacted in order to ascertain that there are efficientsystems in order to follow-up and controlthe business and financial position of the<strong>Volvo</strong> <strong>Group</strong>. In connection therewith, theAudit Committee was responsible for preparingfor the Board’s work to assure the quality of the<strong>Group</strong>’s financial reporting through reviewingthe interim reports, the annual report and theconsolidated accounting. In connection therewith,the Board met with the company’s auditorsduring <strong>2010</strong>. <strong>The</strong> Board continuously evaluatedthe performance of the CEO.<strong>The</strong> Board has during <strong>2010</strong>, after preparationby the renumeration committee, evaluated<strong>Volvo</strong>’s system for variable salary to seniorexecutives and has concluded that the structureapplied by <strong>Volvo</strong> as regards targets andperformance periods is well functioning.During <strong>2010</strong>, the Board focused specificallyon issues related to the <strong>Group</strong>’s businessdevelopment taking into account the earlieruncertainty primarily in the North Americanand European markets and the recovery thatoccured in <strong>2010</strong> regarding the demand for the<strong>Group</strong>’s products. Furthermore, the Boardfocused on development of the <strong>Group</strong>’s operationin China, Japan and India.<strong>The</strong> Board’s work is mainly performedthrough Board meetings and through meetingsin the respective committees of theBoard. In addition thereto, the Chairman of theBoard is in regular contact with the CEO inorder to discuss on-going business and toensure that the decisions taken by the Boardare executed. An account of each Board member’sage, main education, professional experience,assignments in the Company, otherimportant board memberships, their andrelated parties’ ownership of shares in <strong>Volvo</strong>as of February 24, 2011, and the years ofmembership on the <strong>Volvo</strong> Board, is presentedin the section Board of Directors and auditorson page 141.During <strong>2010</strong>, the Board performed its yearlyevaluation of the Board’s work. <strong>The</strong> Chairmanhas informed the Election Committee on theresult of the evaluation.Independence requirements<strong>The</strong> Board of Directors of AB <strong>Volvo</strong> must meetindependence requirements pursuant to theCode. Further, the Audit Committee mustmeet independence requirements pursuant tothe Swedish Companies Act. Below follows ashort description of the independence requirements.<strong>The</strong> independence requirementsmainly state that only one person from thecompany’s management may be a member ofthe Board, that a majority of the Board memberselected by the General Meeting shall beindependent of the company and the companymanagement and that at least two of theBoard members elected by the General Meetingwho are independent of the company andthe company’s management shall also beindependent of the company’s major shareholders.In addition, the Code demands that amajority of the members in the Audit Committeeshall be independent of the company andthe company management and that at leastone of the members who is independent of thecompany and the company management shallalso be independent of the company’s majorshareholders. According to the Swedish CompaniesAct, the members of the Audit Committeemay not be employees of the company andthat at least one member of the audit Committeeshall be independent of the company, companymanagement and the company’s largestshareholders and shall have accounting andauditing expertise. With regard to the RemunerationCommittee, the Code sets the requirementthat members of the Remuneration Committee,with the exception of the Board Chairman if amember of the Remuneration Committee, shallbe independent of the company and companymanagement.Prior to the <strong>Annual</strong> General Meeting <strong>2010</strong>,considering the above requirements regardingthe Board’s independence, the Election Committeereported the following understandingwith regard to the Board members who wereelected at the <strong>Annual</strong> General Meeting in <strong>2010</strong>:Peter Bijur, Hanne De Mora, Anders Nyrén,Ravi Venkatesan, Lars Westerberg and YingYeh and Anders Nyrén were all consideredindependent of the company and companymanagement as well as of the company’s majorshareholders.Leif Johansson, as <strong>Volvo</strong>’s CEO, was consideredindependent of the company’s majorshareholders but not of the company and companymanagement.Louis Schweitzer was stated as representingRenault s.a.s. on the Board and Jean-Baptiste144
Duzan is an advisor to the president of RenaultS.A. and was also stated as representingRenault s.a.s. on the company’s Board. <strong>The</strong>ywere both considered independent of the companyand the company management but werenot, since Renault s.a.s. controled more than 10percent of the shares and votes in the company,prior to the <strong>Annual</strong> General Meeting <strong>2010</strong>, consideredas independent of one of the company’smajor shareholders.Prior to the <strong>Annual</strong> General Meeting 2011,the Election Committee appointed at the<strong>Annual</strong> General Meeting <strong>2010</strong>, has howeverconcluded that Louis Schweitzer is no longer tobe considered as dependent of Renault s.a.s.,since he is no longer employed by nor has anyassignments for Renault and could no longerbe considered as a representative of Renault onthe company’s Board.<strong>The</strong> Election Committee must also meetindependence requirements pursuant to theCode. According to the Code, the majority ofthe members of the Election Committee are tobe independent of the company and the companymanagement. At least one member of theElection Committee is to be independent of thecompany’s largest shareholder in terms of votesor any group of shareholders that act in concertin the governance of the company. Neither theCEO nor other members of the executive managementare to be members of the ElectionCommittee. If Board members are included inthe Election Committee, these may not constitutea majority of the Election Committee’smembers. <strong>The</strong> Chairman of the Board of thecompany or other Board member may not bethe Chairman of the Election Committee. IfBoard members are included in the ElectionCommittee, not more than one of them may bedependent in relation to the company’s largestshareholders. All members of the ElectionCommittee have been considered to be independentof the company and the company management.All members of the Election Committeeexcept Thierry Moulonguet and LouisSchweitzer have, prior to being appointed, beenconsidered to be independent of <strong>Volvo</strong>’s largestshareholder in terms of votes. This conclusion isbased on the facts that Renault s.a.s. is <strong>Volvo</strong>’slargest shareholder in terms of votes, that ThierryMoulonguet represents Renault s.a.s. inthe Election Committee and that Louis Schweitzerat the time of the <strong>Annual</strong> General Meeting<strong>2010</strong>, when he was appointed as memberof the Election Comittee, represented Renaults.a.s. in the Board. As stated above Louis Schweitzerhas however, prior to the <strong>Annual</strong> GeneralMeeting 2011, been considered as independantfrom Renault s.a.s., <strong>Volvo</strong>’s largestshareholder in terms of votes.Audit CommitteeIn December 2002, the Board established anAudit Committee primarily for the purpose ofoverseeing the accounting and financial reportingprocesses and the audit of the financial statements.<strong>The</strong> Audit Committee is responsible forpreparing the Board’s work to assure the qualityof the <strong>Group</strong>’s financial reporting by reviewingthe interim reports, the annual report and consolidatedaccounting. In addition, the Audit Committee’stask is to establish guidelines specifyingwhat other services, beyond auditing, the companymay procure from the company’s auditorsand to provide guidelines for transactions withcompanies and persons closely associated with<strong>Volvo</strong>.<strong>The</strong> Audit Committee also has the task ofreviewing and overseeing the impartiality andindependence of the company’s auditor. <strong>The</strong>Audit Committee is also responsible for evaluatingthe internal and external auditors’ work, providingthe Election Committee with the results ofthe evaluation of the eternal auditors and toassist in preparing proposals for auditors. Finally,the Audit Committee shall evaluate the quality,relevance and efficiency of the <strong>Group</strong>’s systemfor internal control over financial reporting, internalaudit and risk management.At the statutory Board meeting followingthe <strong>2010</strong> <strong>Annual</strong> General Meeting, Lars Westerberg,Peter Bijur and Jean-Baptiste Duzanwere appointed members of the Audit Committee.Lars Westerberg was appointed Chairmanof the Audit Committee.<strong>The</strong> Audit Committee met with the externalauditors and Head of Internal Audit at the meetingsof the Audit Committee. <strong>The</strong> Audit Committeehas also met separately with the externalauditors and the Head of Internal Audit withoutthe presence of the company management.<strong>The</strong> Audit Committee and the external auditorshave among other things discussed the externalaudit plan and risk management. <strong>The</strong> AuditCommittee held six meetings during <strong>2010</strong>.Remuneration CommitteeIn April 2003, the Board established a RemunerationCommittee for the purpose of preparingand deciding on issues relating to remunerationto senior executives in the <strong>Group</strong>. <strong>The</strong> duties ofthe Committee include presenting recommendationsfor resolution by the Board regardingterms of employment and remuneration for thePresident of AB <strong>Volvo</strong>, principles for remuneration,including pensions and severance payments,for other members of the <strong>Group</strong> ExecutiveCommittee, and principles for variable salarysystems, share-based incentive programs, pensionsand severance payment for other seniorexecutives in the <strong>Group</strong>. In addition, the RemunerationCommittee decides the individual termsof employment for the other members of the<strong>Group</strong> Executive Committee in accordance withthe principles established by the Board.<strong>The</strong> Remuneration Committee shall followand evaluate ongoing programs and programsconcluded during the year covering variableremuneration for the <strong>Group</strong> Executive Committee,application of the guidelines for remunerationto senior executives on which the <strong>Annual</strong>General Meeting shall decide and the currentremuneration structures and levels in the <strong>Group</strong>.<strong>The</strong> Board shall, not later than two weeks priorto the <strong>Annual</strong> General Meeting, submit a reporton the results of the Remuneration Committee’sevaluation on the company’s website.If the Remuneration Committee commissionsexternal suppliers for its work, it must ensure thatthere are no conflicts of interest in relation toother assignments this supplier may have for the<strong>Group</strong> or the <strong>Group</strong> Executive Committee.In conjunction with resigning as Chairmanand member of the Board of the company onJanuary 15, <strong>2010</strong>, Finn Johnsson also left theRemuneration Committee. <strong>The</strong>reafter, YingYeh was appointed as a new member of theRemuneration Committee and Louis Schweitzerwas appointed as the new Chairman ofthe Remuneration Committee. At the statutorymeeting of the Board following the <strong>2010</strong>145
Corporate Governance <strong>Report</strong> <strong>2010</strong><strong>Annual</strong> General Meeting, Louis Schweitzer,Anders Nyrén and Ying Yeh were appointedmembers of the Remuneration Committee.Louis Schweitzer was named Chairman of theRemuneration Committee. <strong>The</strong> RemunerationCommittee held five meetings during <strong>2010</strong>.<strong>Group</strong> Executive CommitteeAn account of their respective age, principaleducation, Board memberships, their andrelated parties’ ownership of shares in <strong>Volvo</strong>as of February 24, 2011, and year of joining<strong>Volvo</strong> for the CEO and each member of the<strong>Group</strong> Executive Committee is presented inthe <strong>Group</strong> Management section on page 139.On December 8, <strong>2010</strong>, Leif Johansson notifiedAB <strong>Volvo</strong>’s Board of Directors that heintends to resign as president of AB <strong>Volvo</strong>,also CEO of the <strong>Volvo</strong> <strong>Group</strong>, in conjunctionwith his 60th birthday in the summer of 2011.External auditing<strong>Volvo</strong>’s auditors are elected by the <strong>Annual</strong>General Meeting. <strong>The</strong> current auditor is PricewaterhouseCoopersAB (PwC), which waselected at the <strong>2010</strong> <strong>Annual</strong> General Meetingfor a period of four years. Two PwC partners,Göran Tidström and Johan Rippe, are responsiblefor the audit of <strong>Volvo</strong>. Göran Tidström isthe Lead Partner.<strong>The</strong> external auditors discuss the externalaudit plan and risk management with the AuditCommittee. <strong>The</strong> auditors review the interimreport for the period January 1 to June 30 andthe annual report and the consolidated accounting.<strong>The</strong> auditors also express an opinion whetherthis Corporate Governance <strong>Report</strong> was preparedor not and in such respect whether certain informationtherein coincides with the annual andconsolidated accounting. <strong>The</strong> auditors reporttheir findings with regard to the annual report ,consolidated accounting and the Corporate Governance<strong>Report</strong> through the audit reports and aseparate opinion regarding the Corporate Governance<strong>Report</strong>, which they present to the<strong>Annual</strong> General Meeting. In addition, the auditorsreport detailed findings from their reviews to theAudit Committee twice a year and, once a year,to the full Board of Directors.When PwC is retained to provide servicesother than the audit, it is done in accordancewith rules decided by the Audit Committeepertaining to pre-approval of the nature of theservices and the fees.Disclosure CommitteeA Disclosure Committee was established in2004. <strong>The</strong> Committee contributes to ensuringthat <strong>Volvo</strong> fulfills its obligations according toapplicable legislation as well as to listing rulesto timely disclose to the financial market allshare price sensitive information.<strong>The</strong> Committee comprises the heads of thedepartments Corporate Finance, InternalAudit, Investor Relations, Corporate Legal,Business Control and Financial <strong>Report</strong>ing.Chairman of the Disclosure Committee is thecompany’s Senior Vice President responsiblefor Corporate Communications.Outstanding share and share-pricerelated incentive programsAn account of outstanding share and sharepricerelated incentive programs is provided inNote 34 Employees in the <strong>Group</strong>’s notes.<strong>Report</strong> on the key aspects of the company’sand <strong>Group</strong>’s system for internalcontrols and risk management in conjunctionwith financial reporting<strong>The</strong> Board is responsible for the internal controlsaccording to the Swedish Companies Act and theCode. <strong>The</strong> purpose of this report is to provideshareholders and other interested parties anunderstanding of how internal control is organizedat <strong>Volvo</strong> with regard to financial reporting. <strong>The</strong>report has been prepared in accordance with the<strong>Annual</strong> Accounts Act. Consequently the report islimited to internal control over financial reporting.Introduction<strong>Volvo</strong> primarily applies internal control principlesintroduced by the Committee of SponsoringOrganizations of the Treadway Commission(COSO). <strong>The</strong> COSO principles consist of five interrelatedcomponents. <strong>The</strong> components are: controlenvironment, risk assessment, control activities,information and communication and follow-up.<strong>Volvo</strong> has a specific function for internal control.<strong>The</strong> objective of the Internal Control functionis to provide support for management groupswithin business areas and business units, thatallows them to continuously provide good andimproved internal controls relating to financialreporting. Work that is conducted through thisfunction is based primarily on a methodology,which aim is to ensure compliance with directivesand policies, as well as to create good conditionsfor specific control activities in key processesrelated to financial reporting. <strong>The</strong> AuditCommittee is informed of the result of the workperformed by the Internal Control function within<strong>Volvo</strong> with regard to risks, control activities andfollow-up on the financial reporting.<strong>Volvo</strong> also has an Internal Audit functionwith the primary task of independently verifyingthat companies in the <strong>Group</strong> follow theprinciples and rules that are stated in the<strong>Group</strong>’s directives, policies and instructions forfinancial reporting. <strong>The</strong> head of the InternalAudit function reports directly to the CEO, the<strong>Group</strong>’s CFO and the Audit Committee.Control environmentFundamental to <strong>Volvo</strong>’s control environment isthe business culture that is established withinthe <strong>Group</strong> and in which managers and employeesoperate. <strong>Volvo</strong> works actively on communicationsand training regarding the company’sbasic values as described in <strong>The</strong> <strong>Volvo</strong> Way, aninternal document concerning <strong>Volvo</strong>’s businessculture, and the <strong>Group</strong>’s Code of Conduct,to ensure that good morals, ethics andintegrity permeate the organization.<strong>The</strong> foundation of the internal control processrelating to the financial reporting is builtup around the <strong>Group</strong>’s directives, policies andinstructions, as well as the responsibility andauthority structure that has been adapted tothe <strong>Group</strong>’s organization to create and maintaina satisfactory control environment. <strong>The</strong>principles for internal controls and directivesand policies for the financial reporting are containedin <strong>Volvo</strong> Financial Policies & Procedures(FPP), an internal document comprisingall important instructions, rules and principles.146
Risk assessmentRisks relating to the financial reporting areevaluated and monitored by the Board throughthe Audit Committee inter alia through identifyingwhat types of risks that typically could beconsidered as material and where they wouldtypically occur. <strong>The</strong> annual evaluation of internalcontrol activities conducted by the InternalControl and Internal Audit functions, are basedon a risk-based model. <strong>The</strong> evaluation of therisk that errors will appear in the financialreporting is based on a number of criteria.Complex accounting principles can, for example,mean that the financial reporting risks beinginaccurate for those posts that are covered bysuch principles. Valuation of a particular assetor liability according to various evaluation criteriacan also constitute a risk. <strong>The</strong> same istrue for complex and/or changing businesscircumstances.Control activitiesIn addition to the Board of AB <strong>Volvo</strong> and itsAudit Committee, the Boards and managementgroups of <strong>Group</strong> companies constitutethe overall supervisory body.Several control activities are applied in theongoing business processes to ensure thatpotential errors or deviations in the financialreporting are prevented, discovered and corrected.Control activities range from review of outcomeresults in management group meetings tospecific reconciliation of accounts and analysesof the ongoing processes for financial reporting.CFOs in <strong>Group</strong> companies are ultimately responsiblefor ensuring that control activities in thefinancial processes are appropriate and in accordancewith the <strong>Group</strong>’s policies and instructions.<strong>The</strong>y are also responsible for ensuring that authoritystructures are designed so that one personcan’t perform an activity and then perform thecontrol of the same activity. Control activitieswithin IT security and maintenance are a key partof <strong>Volvo</strong>’s internal control over financial reporting.Information and communicationPolicies and instructions relating to the financialreporting are updated and communicated on aregular basis from management to all affectedemployees. In addition, there are a number ofcommittees and networks within <strong>Volvo</strong> that serveas forums for information and discussions regardingissues relating to the financial reporting andapplication of internal rules. Included in thesecommittees and networks are representativesfrom the business areas and the <strong>Group</strong>’s staffunits who are responsible for financial reporting.Work in these committees and networks isaimed, among other things, at ensuring a uniformapplication of the <strong>Group</strong>’s policies, principles andinstructions for the financial reporting and atidentifying and communicating shortcomingsand areas of improvement in the processes forfinancial reporting.Follow-upOngoing responsibility for follow-up rests withthe business areas’ management groups andaccounting and controller functions. In addition,the Internal Audit and the Internal Controlfunctions conduct follow-up and supervisionin accordance with what is described inthe introduction of this report. More specifically,the Internal Control function runs andcoordinates evaluation activities through the“<strong>Volvo</strong> <strong>Group</strong> Internal Control programme”,which gives a systematic way of evaluating thequality and effectiveness of the internal controlover financial reporting on a yearly basis. Ayearly evaluation plan is settled and presentedto the Audit Committee. This evaluation programmecomprises three main areas:1. <strong>Group</strong>-wide controls: Self assessment procedurecarried out by management teams atbusiness area and business unit level as wellas local company level. Main areas evalu atedare the adherence to the <strong>Group</strong>’s financialdirectives and policies found in FPP alongwith <strong>The</strong> <strong>Volvo</strong> Way and the <strong>Group</strong>’s Code ofConduct.2. Process controls at transaction levels: Processesrelated to the financial reporting areevaluated by testing of specific routines andcontrols based upon the <strong>Group</strong>’s frameworkfor internal control over financial reporting,VICS – “<strong>Volvo</strong> Internal Control Standards”.<strong>The</strong> framework focus on the financial reportingareas deemed to have a relatively higher riskfor potential errors because e.g. complexaccounting principles, complex or changedbusiness operations etc.3. General IT controls: Processes for maintenance,development and access managementof financial applications are evaluated by testingof routines and controls.<strong>The</strong> results of the evaluation activities arereported to the <strong>Group</strong> management and theAudit Committee.Göteborg, February 24, 2011AB <strong>Volvo</strong> (publ)Board of DirectorsAuditor’s report on the CorporateGovernance <strong>Report</strong>It is the Board of Directors who is responsiblefor the Corporate Governance <strong>Report</strong> on pages142–147 and that it has been prepared inaccordance with the <strong>Annual</strong> Accounts Act.As a basis for our opinion that the CorporateGovernance <strong>Report</strong> has been prepared and isconsistent with the annual accounts and theconsolidated accounts, we have read the CorporateGovernance <strong>Report</strong> and assessed itsstatutory content based on our knowledge ofthe company.In our opinion, the Corporate Governance<strong>Report</strong> has been prepared and its statutorycontent is consistent with the annual accountsand the consolidated accounts.Göran TidströmAuthorized PublicAccountantLead PartnerGöteborg, February 24, 2011PricewaterhouseCoopers ABJohan RippeAuthorized PublicAccountant
DefinitionsBasic earnings per shareIncome for the period attributable to shareholders of the Parent Companydivided by the weighted average number of shares outstandingduring the period.Capital expendituresCapital expenditures include investments in property, plant and equipment,intangible assets and assets under operating leases. Investmentsin fixed assets included in the <strong>Group</strong>’s cash-flow statementinclude only capital expenditures that have reduced the <strong>Group</strong>’s liquidfunds during the year.Cash-flowCombined changes in the <strong>Group</strong>’s liquid funds during the fiscal year.Changes in liquid funds are specified with reference to changes inoperations, operating activities, changes depending on investments inequipment, fixed assets etc. and financing activities such as changesin loans and investments.Diluted earnings per shareDiluted earnings per share is calculated as income for the periodattributable to the Parent Company’s shareholders divided by theaverage number of shares outstanding plus the average number ofshares that would be issued as an effect of ongoing share-basedincentive programs and employee stock option programs.EBITDAEBITDA is the operating income before depreciation and amortizationof tangible and intangible assets. This key figure is calculated by addingback depreciation and amortization on the operating income of theIndustrial operations.Equity ratioShareholders’ equity divided by total assets.Interest coverageOperating income plus interest income and similar credits divided byinterest expense and similar charges.Joint venturesCompanies over which the Company has joint control together withone or more external parties.Net financial positionCash and cash equivalents, marketable securities and interest-bearingshort- and long-term receivables reduced by short- and long-terminterest-bearing liabilities and provisions for post-employment benefits.Operating marginOperating income divided by net sales.Return on shareholders’ equityIncome for the period divided by average shareholders’ equity.Self-financing ratioCash-flow from operating activities (see Cash-flow statement) dividedby net investments in fixed assets and leasing assets as defined in thecash-flow statement.
<strong>Annual</strong> General Meeting, April 6, 2011<strong>The</strong> <strong>Annual</strong> General Meeting of AB <strong>Volvo</strong> will be held in Göteborg inLisebergshallen (entrance from Örgrytevägen) Wednesday, April 6,2011, at 3:00 p.m.NoticeThose who wish to participate must be recorded in the share registermaintained by Euroclear Sweden AB on March 31, 2011 and givenotice of intention to attend, not later than March 31, 2011, preferablybefore 12:00:• by telephone, +46 8 402 90 76, beginning March 7, 2011• by mail addressed to AB <strong>Volvo</strong> (publ), ”AGM”,P.O. Box 7481, SE-103 98 Stockholm, Sweden• on AB <strong>Volvo</strong>’s website www.volvogroup.comWhen giving notice, shareholders should state their:• name• personal number (registration number)• address and telephone number• name and personal number (registration number) of the proxy, if any• name(s) of any accompanying assistant(s)Shareholders whose shares are held in the trust department of abank or by a brokerage firm should, several banking days prior toMarch 31, 2011, request temporary owner-registration, so-calledvoting-right registration, at the bank or broker holding the shares.<strong>Volvo</strong>’s Election Committee<strong>The</strong> following persons are members of <strong>Volvo</strong>’s Election Committee:Thierry MoulonguetIngrid BondeCarl-Olof ByLars FörbergHåkan SandbergLouis SchweitzerChairman of the Election Committee,Renault s.a.s.AMF PensionAB IndustrivärdenViolet Partners LPHandelsbanken SHB Pension Fund, SHBPensionskassa, SHB Employee Fund andOktogonenChairman of the AB <strong>Volvo</strong> BoardPreliminary publication dates<strong>Report</strong> for the first three months 2011 April 27, 2011<strong>Report</strong> for the first six months 2011 July 22, 2011<strong>Report</strong> for the first nine months 2011 October 25, 2011<strong>Report</strong> on 2011 operations February, 2012<strong>Annual</strong> <strong>Report</strong> 2011 March, 2012<strong>The</strong> reports are available on www.volvogroup.com on date of publicationand are also sent electronically to shareholders who have advised<strong>Volvo</strong> that they wish to receive financial information.Historical and current time series reflecting the <strong>Volvo</strong> <strong>Group</strong>’smarket information and share data are published regularly onwww.volvogroup.com.ContactsInvestor Relations:Christer Johansson +46 31-66 13 34Patrik Stenberg +46 31-66 13 36Anders Christensson +46 31-66 11 91John Hartwell +1 212 418 7432Aktiebolaget <strong>Volvo</strong> (publ) 556012-5790Investor Relations, VHKSE-405 08 GöteborgSwedenTel +46 31 66 00 00Fax +46 31 53 72 96E-mail: investorrelations@volvo.comwww.volvogroup.comAmong other duties, the Election Committee is responsible for submittingto the <strong>Annual</strong> General Meeting proposals for candidates toserve as members of the Board of Directors and Chairman of theBoard. <strong>The</strong> Committee also proposes the amount of the fees to bepaid to the holders of these positions.
AB <strong>Volvo</strong>, Investor Relations