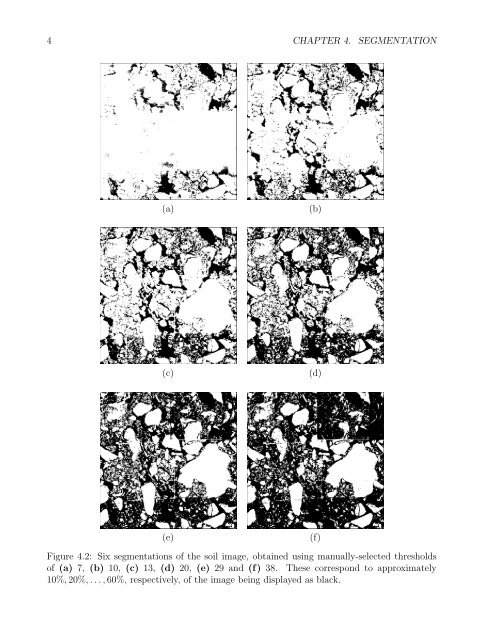
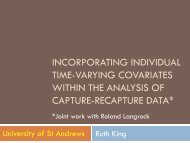
4 CHAPTER 4. <strong>SEGMENTATION</strong>(a)(b)(c)(d)(e)(f)Figure 4.2: Six segmentations of the soil image, obtained using manually-selected thresholdsof (a) 7, (b) 10, (c) 13, (d) 20, (e) 29 and (f) 38. These correspond to approximately10%, 20%,...,60%, respectively, of the image being displayed as black.
4.1. THRESHOLDING 5of the connected pore network evident in Fig 1.6(c) has been correctly identified, as has mostof the soil matrix.Note that:• Although pixels in a single thresholded category will have similar values (either in therange 0 to t, or in the range (t + 1) to 255), they will not usually constitute a singleconnected component. This is not a problem in the soil image because the object (air)is not necessarily connected, either in the imaging plane or in three-dimensions. In othercases, thresholding would be followed by dividing the initial categories into sub-categoriesof connected regions.• More than one threshold can be used, in which case more than two categories are produced.• Thresholds can be chosen automatically.In §4.1.1 we will consider algorithms for choosing the threshold on the basis of the histogramof greyscale pixel values. In §4.1.2, manually- and automatically-selected classifiers for multivariateimages will be considered. Finally, in §4.1.3, thresholding algorithms which make useof context (that is, values of neighbouring pixels as well as the histogram of pixel values) willbe presented.4.1.1 Histogram-based thresholdingWe will denote the histogram of pixel values by h 0 ,h 1 ,...,h N , where h k specifies the numberof pixels in an image with greyscale value k and N is the maximum pixel value (typically255). Ridler and Calvard (1978) and Trussell (1979) proposed a simple algorithm for choosinga single threshold. We shall refer to it as the intermeans algorithm. First we will describethe algorithm in words, and then mathematically.Initially, a guess has to be made at a possible value for the threshold. From this, the mean valuesof pixels in the two categories produced using this threshold are calculated. The thresholdis repositioned to lie exactly half way between the two means. Mean values are calculatedagain and a new threshold is obtained, and so on until the threshold stops changing value.Mathematically, the algorithm can be specified as follows.1. Make an initial guess at t: for example, set it equal to the median pixel value, that is,the value for whicht∑h k ≥ n2t−12 > ∑h k ,k=0k=0where n 2 is the number of pixels in the n × n image.