WANG ET AL.: <strong>SHIP</strong>: A SCALABLE HIERARCHICAL POWER CONTROL ARCHITECTURE FOR LARGE-SCALE DATA CENTERS 173slew frequency at a rate of 2 GHz in 50 microseconds [19].An industry standard voltage regulator specification forservers recommends a minimum voltage slew time acrossthe voltage range of 0.5 to 1.6 V to be no more than110 microseconds [20]. Therefore, both frequency andvoltage slew rates are well within the control period timeconstraints imposed by circuit breakers.6 EMPIRICAL RESULTSIn this section, we first introduce the physical testbed andbenchmarks used in our experiments, as well as theimplementation details of the control components. We thenpresent our empirical results to demonstrate that the <strong>SHIP</strong>hierarchical control solution can provide precise powercontrol for different power set points and when the set pointis reduced at runtime (e.g., due to thermal emergencies).We have also examined the capability of <strong>SHIP</strong> toprovide desired power differentiation and compared <strong>SHIP</strong>with a state-of-the-art centralized control solution on ourtestbed. Furthermore, we have conducted simulations tostress test <strong>SHIP</strong> in large-scale data centers using a trace filefrom real-world data centers, which has the utilization dataof 5,415 servers. Those additional empirical and simulationresults are available in the supplementary file, which canbe found on the Computer Society Digital Library athttp://doi.ieeecomputersociety.org/10.1109/TPDS.2011.93,of this paper.6.1 Testbed ImplementationOur testbed includes nine Linux servers to run workloadsand a Linux machine to run the controllers. The nine serversare divided into three groups with three servers in eachgroup. Each group emulates a rack while the whole testbedemulates a PDU. Servers 1 to 4 are equipped with 2.4 GHzAMD Athlon 64 3800+ processors and run openSUSE 11.0with kernel 2.6.25. Servers 5 to 8 are equipped with 2.2 GHzAMD Athlon 64 X2 4200+ processors and run openSUSE10.3 with kernel 2.6.22. Server 9 is equipped with 2.3 GHzAMD Athlon 64 X2 4400+ processors and runs openSUSE10.3. All the servers have 1 GB RAM and 512 KB L2 cache.Rack 1 includes Servers 1 to 3. Rack 2 includes Servers 4 to6. Rack 3 includes Servers 7 to 9. The controller machine isequipped with 3.00 GHz Intel Xeon Processor 5,160 and8 GB RAM, and runs openSUSE 10.3. All the machines areconnected via an internal Ethernet switch.In our experiments on the testbed, we use two standardbenchmarks: High Performance Computing Linpack Benchmark(HPL) (V1.0a) and SPEC CPU2006 (V1.0), as ourworkloads. HPL is a software package that solves a(random) dense linear system in double precision (64 bits)arithmetic. The problem size of HPL is configured to be10;000 10;000 and the block size is set as 64 in allexperiments unless otherwise noted. SPEC CPU2006 isconfigured with one user thread and recorded as performanceratio, i.e., the relative speed of the server to finisheach benchmark (compared to a reference Sun UltraSparc IImachine at 296 MHz). CPU2006 includes CINT2006 andCFP2006, which consist of integer and floating-point benchmarks,respectively. The reported result is the average of allthe benchmarks in each category. Note that, we use HPLand SPEC CPU2006 as our workloads because they providestandard ways to quantify the performance improvementachieved by our control solution. Our control algorithm isnot limited to the two benchmarks and can be used toachieve similar performance improvement for other workloadsin data centers.We now introduce the implementation details of eachcomponent in our power control architecture.<strong>Power</strong> monitor. The power consumptions of the emulatedPDU and three racks are measured with four WattsUp Propower meters, which have an accuracy of 1.5 percent of themeasured value. The power meters sample the power dataevery second and then send the readings to the fourcontrollers through system files /dev/ttyUSB0 to ttyUSB3.Utilization monitor. The utilization monitor uses the /proc/stat file in Linux to estimate the CPU utilization in eachcontrol period. The file records the number of jiffies (usually10ms in Linux) when the CPU is in user mode, user modewith low priority (nice), system mode, and when used bythe idle task, since the system starts. At the end of eachsampling period, the utilization monitor reads the counters,and estimates the CPU utilization as 1 minus the number ofjiffies used by the idle task divided by the total number ofjiffies in the last control period.CPU frequency modulator. We use AMD’s Cool’n’Quiettechnology to enforce the new frequency (and voltage) levelby DVFS. The AMD microprocessors have four or fivediscrete DVFS levels. To change CPU frequency, one needsto install the cpufreq package and then use the root privilegeto write the new frequency level into the system file /sys/devices/system/cpu/cpu0/cpufreq/scaling_setspeed. The AMDprocessors used in our experiments support only severaldiscrete frequency levels. However, the new frequency levelperiodically received from a rack-level power controllercould be any value that is not exactly one of the supportedfrequency levels. Therefore, the modulator code mustresolve the output value of the controller to a series ofsupported frequency levels to approximate the desiredvalue. For example, to approximate 2.89 GHz during acontrol period, the modulator would output a sequence ofsupported levels: 2.67, 3, 3, 2.67, 3, 3, etc. on a smallertimescale. The detailed modulator algorithm can be found in[8]. Clearly, when the sequence has more numbers during acontrol period, the approximation will be better but theactuation overhead may become higher. In this paper,we choose to use 50 discrete values to approximate thefractional frequency level, which leads to a subinterval of100 ms during an example control period of 5 s. Since theaverage overhead (i.e., transition latency) of changing theDVFS level in AMD Athlon processors is about 100 saccording to the AMD white paper report [21], the impact ofactuation overhead on system performance is no more than0.1 percent (100 s=100 ms), even in the worst case when thefrequency needs to be changed in every subinterval. Thisamount of overhead is acceptable to most computersystems. In addition, recent studies [22] have shown thatthe overhead of DVFS in future processors can be innanoseconds. Therefore, the overhead of DVFS is smallenough to be used in real systems even when a muchsmaller control period is adopted.
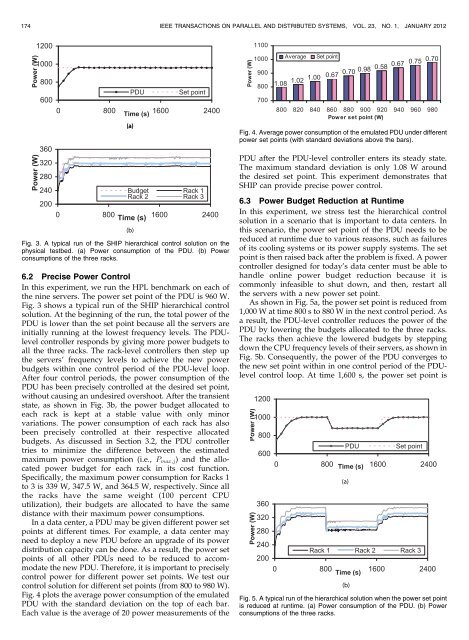
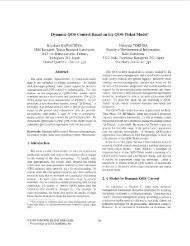
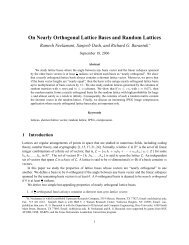
174 <strong>IEEE</strong> TRANSACTIONS ON PARALLEL AND DISTRIBUTED SYSTEMS, VOL. 23, NO. 1, JANUARY 2012Fig. 4. Average power consumption of the emulated PDU under differentpower set points (with standard deviations above the bars).PDU after the PDU-level controller enters its steady state.The maximum standard deviation is only 1.08 W aroundthe desired set point. This experiment demonstrates that<strong>SHIP</strong> can provide precise power control.Fig. 3. A typical run of the <strong>SHIP</strong> hierarchical control solution on thephysical testbed. (a) <strong>Power</strong> consumption of the PDU. (b) <strong>Power</strong>consumptions of the three racks.6.2 Precise <strong>Power</strong> <strong>Control</strong>In this experiment, we run the HPL benchmark on each ofthe nine servers. The power set point of the PDU is 960 W.Fig. 3 shows a typical run of the <strong>SHIP</strong> hierarchical controlsolution. At the beginning of the run, the total power of thePDU is lower than the set point because all the servers areinitially running at the lowest frequency levels. The PDUlevelcontroller responds by giving more power budgets toall the three racks. The rack-level controllers then step upthe servers’ frequency levels to achieve the new powerbudgets within one control period of the PDU-level loop.After four control periods, the power consumption of thePDU has been precisely controlled at the desired set point,without causing an undesired overshoot. After the transientstate, as shown in Fig. 3b, the power budget allocated toeach rack is kept at a stable value with only minorvariations. The power consumption of each rack has alsobeen precisely controlled at their respective allocatedbudgets. As discussed in Section 3.2, the PDU controllertries to minimize the difference between the estimatedmaximum power consumption (i.e., P max;j ) and the allocatedpower budget for each rack in its cost function.Specifically, the maximum power consumption for Racks 1to 3 is 339 W, 347.5 W, and 364.5 W, respectively. Since allthe racks have the same weight (100 percent CPUutilization), their budgets are allocated to have the samedistance with their maximum power consumptions.In a data center, a PDU may be given different power setpoints at different times. For example, a data center mayneed to deploy a new PDU before an upgrade of its powerdistribution capacity can be done. As a result, the power setpoints of all other PDUs need to be reduced to accommodatethe new PDU. Therefore, it is important to preciselycontrol power for different power set points. We test ourcontrol solution for different set points (from 800 to 980 W).Fig. 4 plots the average power consumption of the emulatedPDU with the standard deviation on the top of each bar.Each value is the average of 20 power measurements of the6.3 <strong>Power</strong> Budget Reduction at RuntimeIn this experiment, we stress test the hierarchical controlsolution in a scenario that is important to data centers. Inthis scenario, the power set point of the PDU needs to bereduced at runtime due to various reasons, such as failuresof its cooling systems or its power supply systems. The setpoint is then raised back after the problem is fixed. A powercontroller designed for today’s data center must be able tohandle online power budget reduction because it iscommonly infeasible to shut down, and then, restart allthe servers with a new power set point.As shown in Fig. 5a, the power set point is reduced from1,000 W at time 800 s to 880 W in the next control period. Asa result, the PDU-level controller reduces the power of thePDU by lowering the budgets allocated to the three racks.The racks then achieve the lowered budgets by steppingdown the CPU frequency levels of their servers, as shown inFig. 5b. Consequently, the power of the PDU converges tothe new set point within in one control period of the PDUlevelcontrol loop. At time 1,600 s, the power set point isFig. 5. A typical run of the hierarchical solution when the power set pointis reduced at runtime. (a) <strong>Power</strong> consumption of the PDU. (b) <strong>Power</strong>consumptions of the three racks.