ice formation around a horizontal tube in a rectangular vessel
ice formation around a horizontal tube in a rectangular vessel
ice formation around a horizontal tube in a rectangular vessel

You also want an ePaper? Increase the reach of your titles
YUMPU automatically turns print PDFs into web optimized ePapers that Google loves.
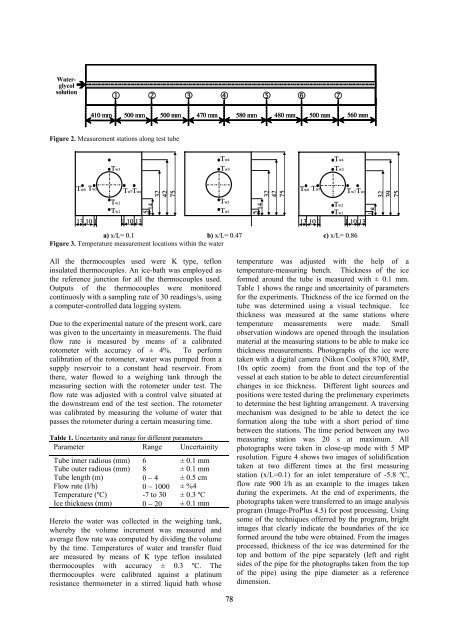
Waterglycolsolution410 mm 500 mm 500 mm 470 mm 580 mm 480 mm 500 mm 560 mmFigure 2. Measurement stations along test <strong>tube</strong>Tw4Tw4Tw3Tw3Tw3Tw6 Tw5Tw2Tw1Tw7 Tw813 10 1 1 10 135 14324275Tw2Tw1143242755Tw6 Tw5Tw2Tw1Tw7 Tw813 10 1 1 10 131 8323975a) x/L= 0.1 b) x/L= 0.47 c) x/L= 0.86Figure 3. Temperature measurement locations with<strong>in</strong> the waterAll the thermocouples used were K type, teflon<strong>in</strong>sulated thermocouples. An <strong>ice</strong>-bath was employed asthe reference junction for all the thermocouples used.Outputs of the thermocouples were monitoredcont<strong>in</strong>uosly with a sampl<strong>in</strong>g rate of 30 read<strong>in</strong>gs/s, us<strong>in</strong>ga computer-controlled data logg<strong>in</strong>g system.Due to the experimental nature of the present work, carewas given to the uncerta<strong>in</strong>ty <strong>in</strong> measurements. The fluidflow rate is measured by means of a calibratedrotometer with accuracy of ± 4%. To performcalibration of the rotometer, water was pumped from asupply reservoir to a constant head reservoir. Fromthere, water flowed to a weigh<strong>in</strong>g tank through themeasur<strong>in</strong>g section with the rotometer under test. Theflow rate was adjusted with a control valve situated atthe downstream end of the test section. The rotometerwas calibrated by measur<strong>in</strong>g the volume of water thatpasses the rotometer dur<strong>in</strong>g a certa<strong>in</strong> measur<strong>in</strong>g time.Table 1. Uncertanity and range for different parametersParameter Range Uncerta<strong>in</strong>ityTube <strong>in</strong>ner radious (mm) 6 ± 0.1 mmTube outer radious (mm) 8 ± 0.1 mmTube length (m) 0 − 4 ± 0.5 cmFlow rate (l/h) 0 − 1000 ± %4Temperature (ºC) -7 to 30 ± 0.3 ºCIce thickness (mm) 0 − 20 ± 0.1 mmHereto the water was collected <strong>in</strong> the weigh<strong>in</strong>g tank,whereby the volume <strong>in</strong>crement was measured andaverage flow rate was computed by divid<strong>in</strong>g the volumeby the time. Temperatures of water and transfer fluidare measured by means of K type teflon <strong>in</strong>sulatedthermocouples with accuracy ± 0.3 ºC. Thethermocouples were calibrated aga<strong>in</strong>st a plat<strong>in</strong>umresistance thermometer <strong>in</strong> a stirred liquid bath whosetemperature was adjusted with the help of atemperature-measur<strong>in</strong>g bench. Thickness of the <strong>ice</strong>formed <strong>around</strong> the <strong>tube</strong> is measured with ± 0.1 mm.Table 1 shows the range and uncerta<strong>in</strong>ity of parametersfor the experiments. Thickness of the <strong>ice</strong> formed on the<strong>tube</strong> was determ<strong>in</strong>ed us<strong>in</strong>g a visual technique. Icethickness was measured at the same stations wheretemperature measurements were made. Smallobservation w<strong>in</strong>dows are opened through the <strong>in</strong>sulationmaterial at the measur<strong>in</strong>g stations to be able to make <strong>ice</strong>thickness measurements. Photographs of the <strong>ice</strong> weretaken with a digital camera (Nikon Coolpix 8700, 8MP,10x optic zoom) from the front and the top of the<strong>vessel</strong> at each station to be able to detect circumferentialchanges <strong>in</strong> <strong>ice</strong> thickness. Different light sources andpositions were tested dur<strong>in</strong>g the prelimenary experimetsto determ<strong>in</strong>e the best light<strong>in</strong>g arrangement. A travers<strong>in</strong>gmechanism was designed to be able to detect the <strong>ice</strong><strong>formation</strong> along the <strong>tube</strong> with a short period of timebetween the stations. The time period between any twomeasur<strong>in</strong>g station was 20 s at maximum. Allphotographs were taken <strong>in</strong> close-up mode with 5 MPresolution. Figure 4 shows two images of solidificationtaken at two different times at the first measur<strong>in</strong>gstation (x/L=0.1) for an <strong>in</strong>let temperature of -5.8 ºC,flow rate 900 l/h as an example to the images takendur<strong>in</strong>g the experimets. At the end of experiments, thephotographs taken were transferred to an image analysisprogram (Image-ProPlus 4.5) for post process<strong>in</strong>g. Us<strong>in</strong>gsome of the techniques offerred by the program, brightimages that clearly <strong>in</strong>dicate the boundaries of the <strong>ice</strong>formed <strong>around</strong> the <strong>tube</strong> were obta<strong>in</strong>ed. From the imagesprocessed, thickness of the <strong>ice</strong> was determ<strong>in</strong>ed for thetop and bottom of the pipe separately (left and rightsides of the pipe for the photographs taken from the topof the pipe) us<strong>in</strong>g the pipe diameter as a referencedimension.78