sources of energy for geothermal direct heat use - GNS Science
sources of energy for geothermal direct heat use - GNS Science
sources of energy for geothermal direct heat use - GNS Science
- No tags were found...
You also want an ePaper? Increase the reach of your titles
YUMPU automatically turns print PDFs into web optimized ePapers that Google loves.
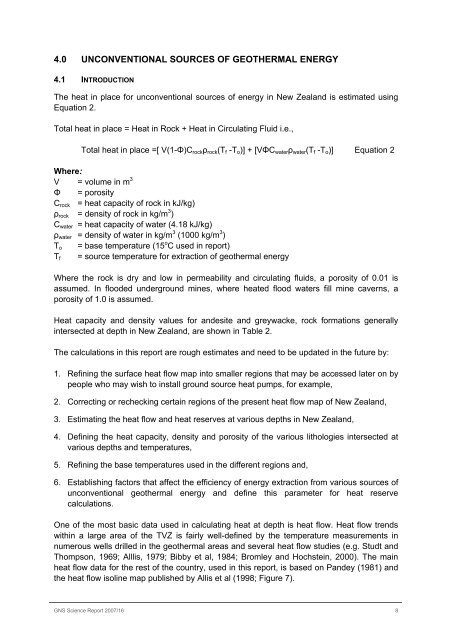
4.0 UNCONVENTIONAL SOURCES OF GEOTHERMAL ENERGY4.1 INTRODUCTIONThe <strong>heat</strong> in place <strong>for</strong> unconventional <strong>sources</strong> <strong>of</strong> <strong>energy</strong> in New Zealand is estimated usingEquation 2.Total <strong>heat</strong> in place = Heat in Rock + Heat in Circulating Fluid i.e.,Total <strong>heat</strong> in place =[ V(1-Φ)C rock ρ rock (T f -T o )] + [VΦC water ρ water (T f -T o )] Equation 2Where:V = volume in m 3Φ = porosityC rock = <strong>heat</strong> capacity <strong>of</strong> rock in kJ/kg)ρ rock = density <strong>of</strong> rock in kg/m 3 )C water = <strong>heat</strong> capacity <strong>of</strong> water (4.18 kJ/kg)ρ water = density <strong>of</strong> water in kg/m 3 (1000 kg/m 3 )T o = base temperature (15 o C <strong>use</strong>d in report)= source temperature <strong>for</strong> extraction <strong>of</strong> <strong>geothermal</strong> <strong>energy</strong>T fWhere the rock is dry and low in permeability and circulating fluids, a porosity <strong>of</strong> 0.01 isassumed. In flooded underground mines, where <strong>heat</strong>ed flood waters fill mine caverns, aporosity <strong>of</strong> 1.0 is assumed.Heat capacity and density values <strong>for</strong> andesite and greywacke, rock <strong>for</strong>mations generallyintersected at depth in New Zealand, are shown in Table 2.The calculations in this report are rough estimates and need to be updated in the future by:1. Refining the surface <strong>heat</strong> flow map into smaller regions that may be accessed later on bypeople who may wish to install ground source <strong>heat</strong> pumps, <strong>for</strong> example,2. Correcting or rechecking certain regions <strong>of</strong> the present <strong>heat</strong> flow map <strong>of</strong> New Zealand,3. Estimating the <strong>heat</strong> flow and <strong>heat</strong> reserves at various depths in New Zealand,4. Defining the <strong>heat</strong> capacity, density and porosity <strong>of</strong> the various lithologies intersected atvarious depths and temperatures,5. Refining the base temperatures <strong>use</strong>d in the different regions and,6. Establishing factors that affect the efficiency <strong>of</strong> <strong>energy</strong> extraction from various <strong>sources</strong> <strong>of</strong>unconventional <strong>geothermal</strong> <strong>energy</strong> and define this parameter <strong>for</strong> <strong>heat</strong> reservecalculations.One <strong>of</strong> the most basic data <strong>use</strong>d in calculating <strong>heat</strong> at depth is <strong>heat</strong> flow. Heat flow trendswithin a large area <strong>of</strong> the TVZ is fairly well-defined by the temperature measurements innumerous wells drilled in the <strong>geothermal</strong> areas and several <strong>heat</strong> flow studies (e.g. Studt andThompson, 1969; Alllis, 1979; Bibby et al, 1984; Bromley and Hochstein, 2000). The main<strong>heat</strong> flow data <strong>for</strong> the rest <strong>of</strong> the country, <strong>use</strong>d in this report, is based on Pandey (1981) andthe <strong>heat</strong> flow isoline map published by Allis et al (1998; Figure 7).<strong>GNS</strong> <strong>Science</strong> Report 2007/16 8


