MICHIGAN DEER HARVEST SURVEY REPORT - 2000 SEASONS
MICHIGAN DEER HARVEST SURVEY REPORT - 2000 SEASONS
MICHIGAN DEER HARVEST SURVEY REPORT - 2000 SEASONS

Create successful ePaper yourself
Turn your PDF publications into a flip-book with our unique Google optimized e-Paper software.
<strong>MICHIGAN</strong> DEPARTMENT OF NATURAL RESOURCESWildlife Report No. 3344June 2001Printed by Authority of: P.A. 451 of 1994Total Number of Copies Printed: .........175Cost per Copy: .................................$1.31Total Cost: ....................................$230.04Michigan Department of Natural Resources<strong>MICHIGAN</strong> <strong>DEER</strong> <strong>HARVEST</strong> <strong>SURVEY</strong> <strong>REPORT</strong><strong>2000</strong> <strong>SEASONS</strong>Brian J. FrawleyABSTRACTA survey of deer hunters was conducted following the <strong>2000</strong> hunting seasons toestimate hunter participation, harvest, and hunting effort. In <strong>2000</strong>, an estimated758,291 hunters spent 10,567,077 days afield. Statewide, the number of peoplehunting deer declined by 3%, and hunting effort declined by 9% between 1999 and<strong>2000</strong>. Hunters harvested 541,701 deer, a decrease of 1% from the number takenin 1999. Harvest of antlerless deer declined by 8%, and harvest of antlered bucksincreased by 8%. Despite the decline in harvest between 1999 and <strong>2000</strong>, thenumber of deer taken in <strong>2000</strong> was the third highest number ever taken. Statewide,47% of hunters harvested a deer. About 24% of the hunters took an antlerlessdeer and 32% took an antlered buck. About 16% of deer hunters harvested two ormore deer.INTRODUCTIONThe Michigan Department of Natural Resources (DNR) has the authority and responsibility toprotect and manage the wildlife resources of the State of Michigan. Harvest surveys are oneof the primary management tools used by the DNR to accomplish its statutory responsibility.Estimating hunter participation, harvest, and hunting effort are the primary objectives of thesesurveys. Estimates derived from harvest surveys as well as information gained from summerdeer observations, deer harvest check stations, deer pellet group surveys, and populationmodeling are used to monitor deer populations and establish harvest regulations.During <strong>2000</strong>, white-tailed deer (Odocoileus virginianus) could be harvested during (1) youth,(2) archery, (3) early antlerless, (4) regular firearm, (5) muzzleloader, and (6) late antlerlessA contribution of Federal Aid in Wildlife Restoration, Michigan Project W-127-REqual Rights for Natural Resource UsersThe Michigan Department of Natural Resources (MDNR) provides equal opportunities for employment and access to Michigan’s natural resources. Both State and Federal laws prohibitdiscrimination on the basis of race, color, national origin, religion, disability, age, sex, height, weight or marital status under the Civil Rights Acts of 1964, as amended (MI PA 453 and MI PA220, Title V of the Rehabilitation Act of 1973 as amended, and the Americans with Disabilities Act). If you believe that you have been discriminated against in any program, activity, or facility, orif you desire additional information, please write the MDNR, HUMAN RESOURCES, PO BOX 30028, LANSING MI 48909-7528, or the <strong>MICHIGAN</strong> DEPARTMENT OF CIVIL RIGHTS, STATEOF <strong>MICHIGAN</strong> PLAZA BUILDING, 1200 6TH STREET, DETROIT MI 48226, or the OFFICE FOR DIVERSITY AND CIVIL RIGHTS, US FISH AND WILDLIFE SERVICE, 4040 NORTHFAIRFAX DRIVE, ARLINGTON VA 22203.For information or assistance on this publication, contact: MDNR, WILDLIFE DIVISION, P.O. BOX 30444, LANSING, MI 48909-7944, http://www.michigandnr.com. This publication is availablein alternative formats upon request. TTY: Michigan Relay Center 1-800-649-3777IC 2390-11 (06/06/2001)
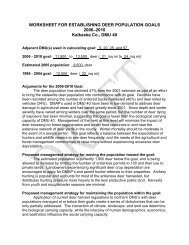
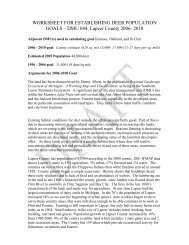
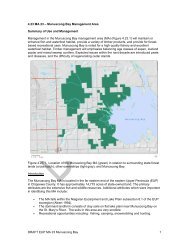
Hunters were allowed to take deer on both public and private lands with firearm andcombination deer hunting licenses during the regular firearm and muzzleloader seasons.Antlerless licenses (including Block and DMA permits) also could be used during the firearmseasons; however, most of these antlerless licenses could only be used on private lands.The late antlerless season, in the Lower Peninsula, occurred from December 16, <strong>2000</strong>,through January 1, 2001. Hunters pursuing deer during this season had to possess anunused antlerless license (including Block and DMA permits) and were limited to hunting onprivate land, except hunters in DMU 452 in the northeast Lower Peninsula. Hunters in DMU452 could hunt on either public or private lands.In DMU 452, an early firearm season for antlerless deer was held October 14-23. Huntersparticipating during this season had to possess an antlerless license for that hunt. Huntingwas restricted to private lands only.METHODSFollowing the <strong>2000</strong> deer hunting seasons, a questionnaire was sent to 50,185 randomlyselected individuals that had purchased a hunting license (firearm, archery, antlerless, orcombination deer hunting licenses). Hunters receiving the questionnaire were asked toreport which seasons they pursued deer, number of days spent afield, and number of deerharvested. Hunters were instructed not to report hunting effort and harvest associated withBlock Permits and DMA Permits because landowners obtaining these permits were requiredto report the number of deer harvested.Estimates were calculated using a stratified random sampling design (Cochran 1977) andwere presented along with their 95% confidence limit (CL). This confidence limit can beadded and subtracted from the estimate to calculate the 95% confidence interval. Theconfidence interval is a measure of the precision associated with the estimate and impliesthat the true value would be within this interval 95 times out of 100. Estimates were notadjusted for possible nonresponse bias.License buyers were assigned to one of two groups (strata). One strata consisted of peopleeligible for the youth deer hunting season (N=21,122). The second strata consisted of allother license buyers (N=790,278). The people eligible for the youth season were sampledmore frequently than hunters not eligible for the youth hunts to improve precision of estimatesassociated with the youth season. The random sample consisted of 6,222 people that wereeligible for the youth season and 43,963 people from the other strata. The stratified samplingdesign accounted for the varying probabilities of being selected from the two strata so thatestimates could be reliably extrapolated from the sample to all license buyers.Estimates were calculated separately by the area where the hunt occurred. The state wasdivided into eight areas that closely matched the DNR’s wildlife management administrativeunits (Figure 1). The state was also divided into three ecological regions (Upper Peninsula,northern Lower Peninsula, and southern Lower Peninsula). These regions generallymatched major ecoregions, except in the Upper Peninsula where two ecoregions were3
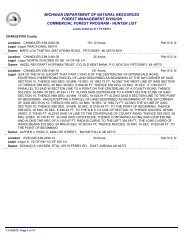
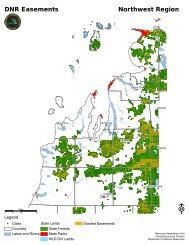
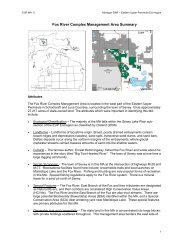
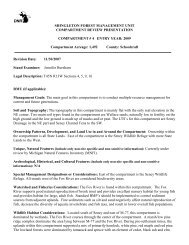
combined (Albert 1995). Ecoregions are regions having similar soils, vegetation, climate,geology, and physiography. Deer harvested from unknown locations were allocated amongareas in proportion to the known harvest.Questionnaires were mailed initially during mid-January 2001, and a reminder note and twofollow-up questionnaires were mailed to nonrespondents. To increase the number ofquestionnaires returned, everybody that returned their questionnaire promptly was eligible towin a prize. Although 50,185 people were sent the questionnaire, 1,239 surveys wereundeliverable resulting in an adjusted sample size of 48,946. Questionnaires were returnedby 36,021 of 48,946 people receiving the questionnaire (74% response rate).RESULTSIn <strong>2000</strong>, 811,400 people purchased a license to hunt deer in Michigan. The number ofpeople buying a license in <strong>2000</strong> declined nearly 3% from 1999 (832,088 people purchased alicense in 1999). Most of the people buying a license were men (91.4%), although 8.6% ofthe licensees were women. The average age of the license buyers was 40 years (Figure 2).Combination licenses were available for the first time in 1998. Because these new licensesincluded two harvest tags, fewer licenses having a single tag (archery and firearm licenses)were sold during the last three years (Table 2). The number of <strong>2000</strong> deer harvest tags soldfor all license types combined decreased 4.3% since 1999. License buyers purchased anaverage of 2.2 harvest tags. About 87% of the license buyers purchased three or fewerharvest tags and 99% purchased five or fewer harvest tags (Figure 3). Hunters mostfrequently purchased antlerless and combination harvest tags (Figure 4). About 47% of thelicense buyers purchased at least one antlerless license (383,521 people), and 99% oflicense buyers purchased three or fewer antlerless licenses (Figure 5).About 93.4 ± 0.3% (758,291 ± 2,121 hunters) of the people buying a license in <strong>2000</strong> actuallyspent time hunting deer (Table 3). Most hunters (695,191 ± 2,990) pursued deer during theregular firearm season (Figure 6). Statewide, the number of people hunting deer during allseasons combined declined by 2.9%. Hunter numbers declined by 3.6% in the northernLower Peninsula and 5.2% in the southern Lower Peninsula. In contrast, the number ofhunters in the Upper Peninsula increased 4.0% between 1999 and <strong>2000</strong>.Although fewer people hunted deer during all of the seasons, the declines were greatest forthe late antlerless (37% decline), early antlerless (37% decline), and muzzleloader (14%decline) seasons. The number of hunters participating in the regular firearm and archeryseasons declined by about 4% statewide (Table 3). Most of this decline occurred becausefewer people hunted in the Lower Peninsula.About 46% of the days that hunters spent pursuing deer throughout the state occurred duringthe archery season (Figure 7). Likewise, 45% of the hunting effort occurred in the regularfirearm season. Less than 10% of the hunting effort occurred in the muzzleloader, earlyantlerless, and late antlerless seasons. Statewide, hunters devoted an average of 14.1 daysafield hunting deer during all seasons combined (Table 4). Archers had the greatest number4
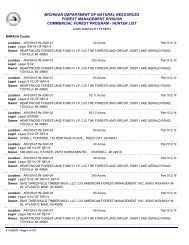
of days available to hunt deer (77 days) and devoted the greatest number of days afield ([14.4 days/hunter) (Figure 8, Table 4).For all seasons and areas combined, hunting effort decreased by 9% between 1999 and<strong>2000</strong> (Table 3). Hunting effort declined for all seasons, but the declines were greatest for thelate (44% decline) and early antlerless (42% decline) seasons. The number of days spenthunting declined 7% during archery season and declined 18% during muzzleloader season,while hunting effort in the regular firearm season declined by about 5%.An estimated 541,701 deer were harvested in <strong>2000</strong>, a decrease of nearly 1% from thenumber taken in 1999 (Figure 9, Tables 5-6). Despite the decline between 1999 and <strong>2000</strong>,the number of deer taken in <strong>2000</strong> was the third highest number ever taken. During the last37 years, the number of deer taken in the regular firearm season has almost tripled from124,000 to 344,000 animals. During this same period, harvest in the archery season hasincreased from 2,100 to 129,000 animals. Moreover, about 29,000 deer were taken duringthe muzzleloader season and 25,000 deer in the late antlerless season in <strong>2000</strong>, seasons thatdid not exist 37 years ago.Between 1999 and <strong>2000</strong>, deer harvest increased during the muzzleloader (18%) and regularfirearm (4%) seasons but declined during archery (-10%), late antlerless (-30%), and earlyantlerless (-47%) seasons (Figures 10, Tables 5-6). Statewide, the antlered buck harvestincreased 8% from last year, while the antlerless harvest decreased 8% (Table 5).About 65% of the animals harvested (sexes combined) in <strong>2000</strong> were taken during the regularfirearm season (Figure 11). Most of the antlerless deer (59%) and antlered bucks (69%)were harvested in the regular firearm season. Hunters took 24% of the harvested deer(sexes combined) during archery season. During the archery season, hunters took 21% ofthe antlerless deer and 27% of the antlered bucks harvested. Few antlered bucks (3%) weretaken in the muzzleloader season. The muzzleloader and antlerless seasons accounted for19% of the antlerless deer harvested.About 80% of the animals harvested (sexes combined) in <strong>2000</strong> were taken on private lands(Table 7). Statewide, most of the antlerless deer (83%) and antlered bucks (78%) wereharvested on private lands. Overall, harvest declined 3% between 1999 and <strong>2000</strong> on privatelands but increased 12% on public lands.Statewide, 47% of the deer hunters harvested at least one deer (all deer seasons and sexescombined) in <strong>2000</strong> (Figure 12, Table 8). About 24% of the hunters took an antlerless deerand 32% took an antlered buck. About 16% of deer hunters harvested two or more deer.Hunters were most successful in taking a deer during the regular firearm season (Figure 13,Table 9); about 39% of the hunters harvested a deer (sexes combined) during the regularfirearm season. Hunter success was only slightly lower during the youth (36% successful)and archery (32%) seasons. Nearly 27% of the hunters took an antlered buck and 18%harvested an antlerless deer during the regular firearm season. Hunter success was lowestin the muzzleloader season (17% successful).5
LITERATURE CITEDAlbert, D. A. 1995. Regional landscape ecosystems of Michigan, Minnesota, and Wisconsin:a working map and classification. General Technical Report NC-178. U.S. Departmentof Agriculture, Forest Service, North Central Forest Experimental Station, St. Paul,Minnesota, USACochran, W. G. 1977. Sampling techniques. John Wiley & Sons, New York, USAHill, H. R. 2001. Deer checking station data – <strong>2000</strong>. Wildlife Division Report 3340.Michigan Department of Natural Resources, Lansing, USA6
KEWEENAWGOGEBICONTONAGONHOUGHTONBARAGAIRONUPEcoregionNorthern LPEcoregionSouthern LPEcoregionMARQUETTEDICKIN-SONWestern UPMENOM-INEEALGERDELTASCHOOL-CRAFTMANISTEEBENZIELUCEKENTCHIPPEWAMACKINACMASON OSCEOLALAKECLAREOCEANA MECOSTAMIDLANDBAYNEWAY- ISABELLAGOMONTCALMSAGINAWMUSKEGONGRATIOTOTTAWAALLEGANWEX-FORDEMMETGRANDTRAV- KAL-ERSE KASKAMISS-AUKEEEastern UPCHE-BOYGANROS-COMMON IOSCOOGEMAWPRESQUECHARLEVOIX ISLEALPENAOTSEGO MONT-ANTRIM MORENCYCRAW-FORDALCONAOSCODAKALAMA-ZOOJACKSONCALHOUNGLAD-WINARENACSaginawBay LPHURONTUSCOLASANILACLAPEERCLINTON GENESEEST. CLAIRIONIA SHIA-WASSEEINGHAM OAKLANDBARRYLIVING-EATONSTONMACOMBSouthwesternLPBERRIENVAN BURENCASSLEE-LANAUST.JOSEPHBRANCHHILLS-DALEWASH-TENAWLENAWEESouthcentralLPWAYNEMONROENortheasternLPNorthwesternLPSoutheasternLPFigure 1. Areas used to summarize deer harvest in Michigan for the <strong>2000</strong> huntingseasons.7
3.02.5Hunters (%)2.01.51.00.50.011 19 27 35 43 51 59 67 75 83 91 99Hunter’s Age on Oct. 1, <strong>2000</strong>Figure 2. Age of people that purchased a deer hunting license in Michigan for the<strong>2000</strong> hunting seasons ([ = 40 years).Hunters (%)40353025201510501 2 3 4 5 6 7 8 9 10+Number of Harvest TagsFigure 3. Number of harvest tags (all license and tag types) purchased per personfor hunting deer in Michigan during the <strong>2000</strong> hunting seasons ([ = 2.2 tags).Licenses were purchased by 811,400 people.8
AntlerlessTags37%Firearm Tags24%CombinationTags31%Archery Tags8%Figure 4. Types of harvest tags purchased for deer hunting in Michigan during the<strong>2000</strong> hunting seasons.6050Hunters (%)4030201000 1 2 3 4 5 6 7 8 9 10+Number of Antlerless LicensesFigure 5. Percentage of deer hunting license buyers (all license types) purchasingan antlerless license in Michigan, <strong>2000</strong>. Antlerless licenses were purchased by383,521 of 811,400 people (47%) buying deer hunting licenses.9
800,000700,000600,000500,000400,000300,000200,000100,0000ArcheryRegularFirearmMuzzleloaderNumber of HuntersEarlyAntlerlessLateAntlerlessYouthSeasonFigure 6. Number of people hunting deer in Michigan during the <strong>2000</strong> huntingseasons. Error bars represent the 95% confidence limits.RegularFirearm45% Muzzleloader6%EarlyAntlerless0.2%Late Antlerless3%Youth0.2%Archery46%Figure 7. Distribution of hunting effort among deer hunting seasons in Michigan,<strong>2000</strong>.10
Mean Hunting Effort (Days)1614121086420ArcheryRegularFirearmMuzzleloaderEarlyAntlerlessLateAntlerlessYouthSeasonFigure 8. Mean number of days spent hunting deer in Michigan during the <strong>2000</strong>hunting seasons. Error bars represent the 95% confidence limits.600,000500,000400,000300,000200,000100,0000196319681973Deer Harvest19781983198819931998YearFigure 9. Number of deer harvested in Michigan’s hunting seasons, 1963-<strong>2000</strong>.Harvest from all seasons and for all deer sexes was combined.11
200,000Antlerless175,000150,000125,000Regular Firearm100,00075,000Archery50,00025,0000MuzzleloaderLate AntlerlessHarvest200,000175,000150,000125,000100,00075,00050,00025,0000Antlered BucksRegular FirearmArcheryMuzzleloader350,000300,000250,000200,000150,000Sexes Com binedRegular Firearm100,00050,000ArcheryLate Antlerless0Muzzleloader19631968197319781983198819931998YearFigure 10. Number of deer harvested in Michigan’s hunting seasons, 1963-<strong>2000</strong>.Harvest for early antlerless and youth seasons was not shown.12
AntlerlessEarly Antlerless1%Muzzleloader8%Late Antlerless10%Youth1%Archery21%Regular Firearm59%Muzzleloader3%Antlered BucksYouth1%Archery27%Regular Firearm69%Sexes CombinedEarly Antlerless0.4%Muzzleloader5%Late Antlerless5%Youth1%Archery24%Regular Firearm65%Figure 11. Distribution of harvest among deer hunting seasons in Michigan, <strong>2000</strong>.13
Hunters (%)50%45%40%35%30%25%20%15%10%5%0%Both Sexes Antlerless Antlered Bucks≥1 ≥2 ≥3 ≥4 ≥5Deer HarvestedFigure 12. Percentage of hunters harvesting a deer in Michigan, <strong>2000</strong>. Error barsrepresent the 95% confidence limits.14
Successful Hunters (%)40%35%30%25%20%15%10%5%0%Antlerless DeerSuccessful Hunters (%)40%35%30%25%20%15%10%5%0%Antlered BucksSuccessful Hunters (%)45%40%35%30%25%20%15%10%5%0%Sexes CombinedArcheryRegularFirearmMuzzleloaderEarlyAntlerlessLateAntlerlessYouthSeasonFigure 13. Percentage of hunters harvesting a deer in Michigan’s deer huntingseasons, <strong>2000</strong>. Error bars represent the 95% confidence limits.15
Table 1. Kind of deer that can be taken during the hunting seasons for each combination ofseason and deer hunting license.Type of license (harvest tag)or permitSeasonKind of deer that can beharvested aArchery License Archery seasons Antlerless or antlered deer bFirearm LicenseRegular Firearm, Youth, or Antlered deer only bMuzzleloading seasonsCombination License Archery seasonsAntlerless or antlered deer(Regular harvest tag)Combination License Regular Firearm, Youth, or Antlered deer only(Regular harvest tag) Muzzleloading seasonsCombination License(Restricted harvest tag)Archery seasonsAntlerless deer or a deer thathas at least 1 antler with 4 ormore antler points, 1 or moreinches in lengthCombination License(Restricted harvest tag)Regular Firearm, Youth, orMuzzleloading seasonsA deer that has at least 1antler with 4 or more antlerpoints, 1 or more inches inlengthAntlerless License All seasons Antlerless deer onlyCrop Depredation Deer All seasons Antlerless deer onlyHunting (Block) Permit cDeer ManagementAll seasons Antlerless deer onlyAssistance (DMA) Permit ca Antlered deer had antlers at least 3 inches in length; antlerless deer included deer without antlers and deer withantlers less than 3 inches in length. Hunters could harvest a maximum of 2 antlered deer per year (all seasonscombined); maximum antlerless limit varied by region of the state.b If a person takes 2 antlered deer during all seasons combined, one of the antlered deer must have at least 1antler with 4 or more antler points, 1 or more inches in length.c Permits issued to landowners in areas experiencing severe crop damage or areas where managementobjectives included controlling diseases or severe deer overpopulation. To use these permits, the hunter mustalso have purchased a firearm, archery, combination, or antlerless deer license for the season in which theywere hunting.16
Table 2. Number of Michigan deer licenses and harvest tags purchased, 1998-<strong>2000</strong>.Number purchasedChange (%)Between1999 and<strong>2000</strong>Licenses or Harvest Tags 1998 1999 <strong>2000</strong>Firearm LicensesResident 458,676 388,158 303,489 -21.8%Non-resident 15,574 15,118 14,075 -6.9%Senior 47,648 38,331 32,170 -16.1%Military 92 19 31 63.2%Archery LicensesResident 170,693 118,688 67,372 -43.2%Non-resident 4,242 4,162 3,695 -11.2%Junior 18,989 16,129 10,173 -36.9%Senior 13,214 6,232 3,209 -48.5%Military 78 26 18 -30.8%Combination Licenses aResident 196,519 245,051 313,878 28.1%Non-resident 741 1,069 1,516 41.8%Junior 13,152 18,548 29,187 57.4%Senior 11,926 20,042 25,707 28.3%Military N/A 115 147 27.8%Antlerless LicensesResident 644,829 674,617 573,558 -15.0%Non-resident 6,417 8,473 6,695 -21.0%Junior 16,786 8,839 10,509 18.9%Block Permits 19,743 9,250 10,944 18.3%Deer Management Assistance 747 723 1,186 64.0%Harsens Island 76 125 58 -53.6%Harvest TagsFirearm 521,990 441,626 349,765 -20.8%Archery 207,216 145,237 84,467 -41.8%Combination 444,674 569,650 740,869 30.1%Antlerless 688,598 702,027 602,950 -14.1%Total Harvest Tags 1,834,041 1,858,540 1,778,051 -4.3%a Combination licenses included two harvest tags. All other license types had one harvest tag.NA License type did not exist.17
Table 3. Number of deer hunters and hunting efforts in Michigan by hunting season, 1999-<strong>2000</strong>.Number of hunters aHunting efforts (days)Season and Area 1999 <strong>2000</strong> 95% CL b 1999 to <strong>2000</strong> 1999 <strong>2000</strong> 95% CL b 1999 to <strong>2000</strong>Change fromChange fromArcheryWest UP 27,236 28,337 1,572 4.0% 291,377 281,391 20,262 -3.4%East UP 10,733 10,103 952 -5.9% 97,531 95,477 12,564 -2.1%NE LP 60,337 55,479 2,164 -8.1% 571,632 530,363 28,397 -7.2%NW LP 76,722 71,679 2,423 -6.6% 887,707 790,170 35,847 -11.0%Sag. Bay 66,369 62,972 2,285 -5.1% 824,711 790,537 37,938 -4.1%SW LP 61,548 58,426 2,203 -5.1% 886,207 838,659 40,205 -5.4%SC LP 71,545 68,156 2,369 -4.7% 1,034,134 937,441 42,445 -9.4%SE LP 43,597 40,039 1,854 -8.2% 552,269 505,174 30,663 -8.5%UP 37,399 37,886 3,062 1.3% 388,908 376,867 23,841 -3.1%NLP 157,456 146,485 4,149 -7.0% 1,725,327 1,582,060 50,414 -8.3%SLP 205,541 196,339 4,174 -4.5% 3,031,332 2,810,283 73,126 -7.3%Statewide c 351,077 337,611 4,213 -3.8% 5,145,567 4,769,211 92,094 -7.3%Regular FirearmWest UP 89,093 91,774 2,715 3.0% 659,662 643,028 22,347 -2.5%East UP 29,753 30,873 1,642 3.8% 198,434 197,085 12,117 -0.7%NE LP 137,866 130,648 3,152 -5.2% 809,881 771,652 23,048 -4.7%NW LP 151,306 145,787 3,281 -3.6% 896,841 850,892 24,171 -5.1%Sag. Bay 111,081 105,501 2,873 -5.0% 667,315 650,965 21,881 -2.5%SW LP 110,606 102,468 2,833 -7.4% 739,280 677,090 23,057 -8.4%SC LP 126,136 115,846 2,988 -8.2% 819,639 742,532 23,931 -9.4%SE LP 48,464 44,545 1,947 -8.1% 278,435 257,900 13,570 -7.4%UP 117,493 121,793 1,808 3.7% 858,096 840,113 25,421 -2.1%NLP 320,754 307,306 3,290 -4.2% 1,922,567 1,835,977 35,518 -4.5%SLP 343,502 319,531 3,656 -7.0% 2,288,823 2,115,054 40,264 -7.6%Statewide c 721,980 695,191 2,990 -3.7% 5,069,487 4,791,145 59,666 -5.5%a Excludes people that did not hunt during the season.b 95% confidence limit for the <strong>2000</strong> estimate.c Number of hunters does not add up to statewide total because hunters can hunt in more than one area.18
Table 3 (continued). Number of deer hunters and hunting efforts in Michigan by hunting season, 1999-<strong>2000</strong>.Number of hunters aHunting efforts (days)Season and Area 1999 <strong>2000</strong> 95% CL b 1999 to <strong>2000</strong> 1999 <strong>2000</strong> 95% CL b 1999 to <strong>2000</strong>Change fromChange fromMuzzleloaderWest UP 14,366 13,847 1,112 -3.6% 69,859 68,190 6,038 -2.4%East UP 5,177 4,448 635 -14.1% 22,655 19,715 3,239 -13.0%NE LP 22,653 18,773 1,294 -17.1% 89,325 76,665 6,639 -14.2%NW LP 25,550 20,456 1,342 -19.9% 99,682 77,541 5,837 -22.2%Sag. Bay 28,115 23,953 1,448 -14.8% 117,926 93,631 6,493 -20.6%SW LP 36,117 29,418 1,600 -18.5% 157,817 121,739 7,725 -22.9%SC LP 36,568 30,389 1,626 -16.9% 154,461 123,863 7,605 -19.8%SE LP 16,171 14,093 1,118 -12.8% 64,656 51,666 4,779 -20.1%UP 19,424 18,071 1,268 -7.0% 92,514 87,905 6,852 -5.0%NLP 55,042 45,279 1,970 -17.7% 217,392 179,918 9,495 -17.2%SLP 105,976 88,884 2,673 -16.1% 466,476 365,185 13,057 -21.7%Statewide c 174,505 149,443 3,320 -14.4% 776,381 633,008 17,665 -18.5%Early AntlerlessWest UP 0 0 0 0 0 0East UP 0 0 0 0 0 0NE LP 10,875 6,893 787 -36.6% 38,373 21,898 2,950 -42.9%NW LP 0 0 0 0 0 0Sag. Bay 0 0 0 0 0 0SW LP 0 0 0 0 0 0SC LP 0 0 0 0 0 0SE LP 0 0 0 0 0 0UP 0 0 0 0 0 0NLP 10,875 6,893 787 -36.6% 38,373 21,898 2,950 -42.9%SLP 0 0 0 0 0 0Statewide c 10,875 6,893 787 -36.6% 38,373 21,898 2,950 -42.9%a Excludes people that did not hunt during the season.b 95% confidence limit for the <strong>2000</strong> estimate.c Number of hunters does not add up to statewide total because hunters can hunt in more than one area.19
Table 3 (continued). Number of deer hunters and hunting efforts in Michigan by hunting season, 1999-<strong>2000</strong>.Number of hunters aHunting efforts (days)Season and Area 1999 <strong>2000</strong> 95% CL b 1999 to <strong>2000</strong> 1999 <strong>2000</strong> 95% CL b 1999 to <strong>2000</strong>Change fromChange fromLate AntlerlessWest UP 0 0 0 0 0 0East UP 0 0 0 0 0 0NE LP 19,329 12,766 1,066 -34.0% 73,409 47,664 4,970 -35.1%NW LP 19,163 11,490 1,003 -40.0% 72,567 44,035 5,343 -39.3%Sag. Bay 21,727 14,151 1,109 -34.9% 93,775 55,940 5,592 -40.3%SW LP 31,320 17,982 1,248 -42.6% 147,418 70,647 7,106 -52.1%SC LP 31,154 19,983 1,316 -35.9% 138,931 78,531 6,570 -43.5%SE LP 13,440 7,930 836 -41.0% 57,587 30,342 4,138 -47.3%UP 0 0 0 0 0 0NLP 43,787 27,593 1,545 -37.0% 166,558 104,656 7,774 -37.2%SLP 90,613 55,813 2,148 -38.4% 417,129 222,502 11,613 -46.7%Statewide c 134,399 84,543 2,597 -37.1% 583,687 327,158 14,152 -43.9%YouthWest UP 0 1,048 121 0 1,832 235East UP 0 232 58 0 395 102NE LP 0 1,323 135 0 2,421 288NW LP 0 2,676 196 0 4,947 493Sag. Bay 0 2,467 179 0 4,516 407SW LP 0 2,462 179 0 4,355 421SC LP 0 2,511 180 0 4,458 405SE LP 0 975 117 0 1,734 297UP 0 1,279 133 0 2,226 256NLP 0 4,665 240 0 8,479 596SLP 0 7,652 268 0 13,953 752Statewide c 0 13,679 275 0 24,658 998a Excludes people that did not hunt during the season.b 95% confidence limit for the <strong>2000</strong> estimate.c Number of hunters does not add up to statewide total because hunters can hunt in more than one area.20
Table 3 (continued). Number of deer hunters and hunting efforts in Michigan by hunting season, 1999-<strong>2000</strong>.Number of hunters aHunting efforts (days)Season and Area 1999 <strong>2000</strong> 95% CL b 1999 to <strong>2000</strong> 1999 <strong>2000</strong> 95% CL b 1999 to <strong>2000</strong>Change fromChange fromAll SeasonsWest UP 98,781 102,603 2,848 3.9% 1,020,473 994,141 37,496 -2.6%East UP 34,478 35,314 1,750 2.4% 318,513 312,615 21,949 -1.9%NE LP 160,448 151,782 3,341 -5.4% 1,582,389 1,450,318 48,504 -8.3%NW LP 174,007 169,983 3,476 -2.3% 1,957,048 1,767,844 55,335 -9.7%Sag. Bay 132,476 126,576 3,097 -4.5% 1,703,924 1,595,766 58,236 -6.3%SW LP 128,036 120,751 3,036 -5.7% 1,930,468 1,712,364 61,949 -11.3%SC LP 146,961 137,399 3,202 -6.5% 2,147,267 1,886,790 64,874 -12.1%SE LP 68,173 63,292 2,292 -7.2% 953,412 847,240 43,761 -11.1%UP 130,861 136,090 3,202 4.0% 1,338,985 1,306,756 43,448 -2.4%NLP 367,960 354,718 4,241 -3.6% 4,070,404 3,733,087 80,151 -8.3%SLP 401,369 380,691 4,265 -5.2% 6,204,106 5,527,234 111,100 -10.9%Statewide c 780,560 758,291 2,121 -2.9% 11,613,495 10,567,077 144,039 -9.0%a Excludes people that did not hunt during the season.b 95% confidence limit for the <strong>2000</strong> estimate.c Number of hunters does not add up to statewide total because hunters can hunt in more than one area.21
Table 4. Mean number of days hunters spent hunting deer in Michigan by hunting season, <strong>2000</strong>. aAreaArcheryHuntingeffort([ days)95%CL bRegularFirearmHuntingeffort([ days)95%CL bMuzzleloaderHuntingeffort([ days)95%CL bSeasonEarlyAntlerlessHuntingeffort([ days)95%CL bLateAntlerless Youth All SeasonsHunting Hunting Huntingeffort 95% effort 95% effort 95%([ days) CL b ([ days) CL b ([ days) CL bWest UP 10.0 0.5 7.0 0.1 4.9 0.2 0.0 0.0 0.0 0.0 1.8 0.1 9.7 0.3East UP 9.4 0.9 6.4 0.2 4.4 0.4 0.0 0.0 0.0 0.0 1.7 0.1 8.9 0.5NE LP 9.7 0.4 5.9 0.1 4.1 0.2 3.3 0.2 3.9 0.3 1.9 0.1 9.6 0.2NW LP 11.1 0.3 5.9 0.1 3.8 0.2 0.0 0.0 4.1 0.3 1.8 0.1 10.4 0.2Sag. Bay 12.7 0.4 6.2 0.1 3.9 0.1 0.0 0.0 4.2 0.3 1.8 0.1 12.6 0.3SW LP 14.6 0.4 6.7 0.1 4.1 0.1 0.0 0.0 4.2 0.3 1.8 0.1 14.3 0.4SC LP 14.0 0.4 6.4 0.1 4.1 0.1 0.0 0.0 4.1 0.2 1.8 0.1 13.8 0.3SE LP 12.7 0.5 5.8 0.2 3.7 0.2 0.0 0.0 4.3 0.4 1.8 0.2 13.4 0.5UP 10.0 0.4 6.9 0.1 4.9 0.2 0.0 0.0 0.0 0.0 1.7 0.1 9.6 0.2NLP 10.9 0.2 6.0 0.1 4.0 0.1 3.3 0.2 4.0 0.2 1.8 0.1 10.6 0.2SLP 14.5 0.2 6.7 0.1 4.1 0.1 0.0 0.0 4.2 0.1 1.8 0.1 14.6 0.2Statewide 14.4 0.2 7.0 0.0 4.3 0.1 3.3 0.2 4.2 0.1 1.8 0.0 14.1 0.1a Excludes people that did not hunt during the season.b 95% confidence limit.22
Table 5. Number of deer harvested in Michigan, 1998-<strong>2000</strong>.Season or permit Type of deer a 1998 1999 <strong>2000</strong>Changefrom 1999to <strong>2000</strong>SeasonArchery Antlerless 76,064 64,374 52,760 -18.0%Antlered bucks 74,949 78,241 76,166 -2.7%Sexes combined 151,013 142,615 128,926 -9.6%Regular firearm Antlerless 163,843 149,858 146,734 -2.1%Antlered bucks 187,632 180,157 197,290 9.5%Sexes combined 351,475 330,014 344,024 4.2%Muzzleloader Antlerless 19,765 17,120 20,187 17.9%Antlered bucks 9,319 7,480 8,830 18.0%Sexes combined 29,084 24,600 29,017 18.0%Early antlerless Antlerless 6,655 4,298 2,287 -46.8%Late antlerless Antlerless 44,084 36,046 25,129 -30.3%Youth b Antlerless 0 0 1,366Antlered bucks 0 0 3,626Sexes combined 0 0 4,992Special permits c Antlerless 15,679 7,322 7,327 0.1%Grand Total Antlerless 326,090 279,017 255,790 -8.3%Antlered bucks 271,900 265,878 285,911 7.5%Sexes combined 597,990 544,895 541,701 -0.6%a Refer to Hill (2001) for breakdown of harvest by age and sex of animal.b Youth season did not occur prior to <strong>2000</strong>.c Includes deer harvested with Block Permits and Deer Management Assistance Permits. These permits couldbe used during any deer hunting season.23
Table 6. Number of deer harvested in Michigan by hunting season, 1999-<strong>2000</strong>. aAntlerless Antlered Bucks Sexes CombinedSeason andArea1999Harvest<strong>2000</strong>Harvest95%CL bChangefrom 1999to <strong>2000</strong>1999Harvest<strong>2000</strong>Harvest95%CL bChangefrom 1999to <strong>2000</strong>1999Harvest<strong>2000</strong>Harvest95%CL bChangefrom 1999to <strong>2000</strong>ArcheryWest UP 6,301 7,065 908 12.1% 6,616 6,135 777 -7.3% 12,917 13,194 1,275 2.1%East UP 1,933 2,551 531 32.0% 1,743 1,807 418 3.7% 3,677 4,356 728 18.5%NE LP 6,779 5,112 722 -24.6% 7,069 6,626 785 -6.3% 13,848 11,737 1,096 -15.2%NW LP 11,672 9,990 1,007 -14.4% 15,142 13,641 1,171 -9.9% 26,813 23,630 1,682 -11.9%Sag. Bay 11,194 8,351 916 -25.4% 13,566 12,728 1,129 -6.2% 24,760 21,080 1,548 -14.9%SW LP 8,831 7,067 900 -20.0% 11,918 13,158 1,160 10.4% 20,749 20,230 1,591 -2.5%SC LP 12,316 8,048 917 -34.7% 16,097 15,665 1,239 -2.7% 28,413 23,719 1,686 -16.5%SE LP 5,347 4,575 684 -14.4% 6,090 6,406 807 5.2% 11,437 10,980 1,151 -4.0%UP 8,235 9,617 1,052 16.8% 8,359 7,942 882 -5.0% 16,594 17,550 1,468 5.8%NLP 22,723 18,246 1,352 -19.7% 26,773 24,686 1,559 -7.8% 49,496 42,929 2,203 -13.3%SLP 33,416 24,897 1,632 -25.5% 43,109 43,539 2,089 1.0% 76,525 68,447 2,876 -10.6%Statewide 64,374 52,760 2,375 -18.0% 78,241 76,166 2,755 -2.7% 142,615 128,926 3,919 -9.6%Regular FirearmWest UP 12,837 20,084 1,782 56.5% 32,542 41,398 2,046 27.2% 45,403 61,485 3,008 35.4%East UP 2,284 3,688 646 61.5% 7,021 9,576 986 36.4% 9,311 13,265 1,279 42.5%NE LP 21,467 20,906 1,585 -2.6% 27,630 30,048 1,729 8.8% 49,099 50,954 2,564 3.8%NW LP 25,601 27,698 1,825 8.2% 33,046 35,803 1,871 8.3% 58,650 63,501 2,886 8.3%Sag. Bay 22,693 19,607 1,591 -13.6% 24,011 24,099 1,536 0.4% 46,699 43,706 2,403 -6.4%SW LP 24,327 23,713 1,675 -2.5% 23,077 23,302 1,514 1.0% 47,395 47,013 2,509 -0.8%SC LP 33,847 25,105 1,744 -25.8% 27,055 26,021 1,620 -3.8% 60,882 51,124 2,603 -16.0%SE LP 6,803 5,933 849 -12.8% 5,775 7,044 814 22.0% 12,575 12,977 1,268 3.2%UP 15,120 23,772 1,896 57.2% 39,564 50,974 2,271 28.8% 54,714 74,750 3,269 36.6%NLP 53,895 55,075 2,565 2.2% 68,991 74,176 2,701 7.5% 122,891 129,251 4,090 5.2%SLP 80,842 67,887 2,892 -16.0% 71,603 72,139 2,672 0.7% 152,408 140,023 4,315 -8.1%Statewide 149,858 146,734 4,323 -2.1% 180,157 197,290 4,444 9.5% 330,014 344,024 6,812 4.2%a Harvest estimates do not include deer taken with Block Permits or Deer Management Assistance Permits. An additional 7,327 deer were takenwith these permits.b 95% confidence limit for the <strong>2000</strong> estimate.24
Table 6 (continued). Number of deer harvested in Michigan by hunting season, 1999-<strong>2000</strong>. aAntlerless Antlered Bucks Sexes CombinedSeason andArea1999Harvest<strong>2000</strong>Harvest95%CL bChangefrom 1999to <strong>2000</strong>1999Harvest<strong>2000</strong>Harvest95%CL bChangefrom 1999to <strong>2000</strong>1999Harvest<strong>2000</strong>Harvest95%CL bChangefrom 1999to <strong>2000</strong>MuzzleloaderWest UP 1,596 3,635 673 127.8% 1,034 1,461 372 41.3% 2,631 5,096 793 93.7%East UP 339 615 296 81.5% 409 433 198 5.9% 748 1,048 356 40.1%NE LP 1,644 2,278 534 38.5% 601 1,045 307 73.7% 2,245 3,323 631 48.0%NW LP 2,104 2,594 511 23.3% 1,058 957 289 -9.6% 3,163 3,550 598 12.3%Sag. Bay 2,491 2,866 547 15.1% 1,082 1,141 326 5.4% 3,573 4,006 651 12.1%SW LP 3,555 3,363 562 -5.4% 1,419 1,813 419 27.8% 4,973 5,177 723 4.1%SC LP 4,159 3,562 584 -14.4% 1,515 1,507 366 -0.5% 5,673 5,069 699 -10.7%SE LP 1,233 1,274 356 3.3% 361 473 204 31.2% 1,593 1,748 438 9.7%UP 1,935 4,250 735 119.7% 1,443 1,894 421 31.3% 3,380 6,144 869 81.8%NLP 4,643 5,784 800 24.6% 1,924 2,286 451 18.8% 6,567 8,069 936 22.9%SLP 10,543 10,154 995 -3.7% 4,113 4,649 657 13.0% 14,654 14,804 1,228 1.0%Statewide 17,120 20,187 1,493 17.9% 7,480 8,830 910 18.0% 24,600 29,017 1,794 18.0%Early AntlerlessWest UP 0 0 0 0 0 0 0 0 0East UP 0 0 0 0 0 0 0 0 0NE LP 4,298 2,287 561 -46.8% 0 0 0 4,298 2,287 561 -46.8%NW LP 0 0 0 0 0 0 0 0 0Sag. Bay 0 0 0 0 0 0 0 0 0SW LP 0 0 0 0 0 0 0 0 0SC LP 0 0 0 0 0 0 0 0 0SE LP 0 0 0 0 0 0 0 0 0UP 0 0 0 0 0 0 0 0 0NLP 4,298 2,287 561 -46.8% 0 0 0 4,298 2,287 561 -46.8%SLP 0 0 0 0 0 0 0 0 0Statewide 4,298 2,287 561 -46.8% 0 0 0 4,298 2,287 561 -46.8%a Harvest estimates do not include deer taken with Block Permits or Deer Management Assistance Permits. An additional 7,327 deer were takenwith these permits.b 95% confidence limit for the <strong>2000</strong> estimate.25
Table 6 (continued). Number of deer harvested in Michigan by hunting season, 1999-<strong>2000</strong>. aAntlerless Antlered Bucks Sexes CombinedSeason andArea1999Harvest<strong>2000</strong>Harvest95%CL bChangefrom 1999to <strong>2000</strong>1999Harvest<strong>2000</strong>Harvest95%CL bChangefrom 1999to <strong>2000</strong>1999Harvest<strong>2000</strong>Harvest95%CL bChangefrom 1999to <strong>2000</strong>Late AntlerlessWest UP 0 0 0 0 0 0 0 0 0East UP 0 0 0 0 0 0 0 0 0NE LP 4,581 4,279 731 -6.6% 0 0 0 4,581 4,279 731 -6.6%NW LP 6,896 4,635 706 -32.8% 0 0 0 6,896 4,635 706 -32.8%Sag. Bay 6,799 4,869 752 -28.4% 0 0 0 6,799 4,869 752 -28.4%SW LP 7,016 4,327 675 -38.3% 0 0 0 7,016 4,327 675 -38.3%SC LP 8,125 5,121 770 -37.0% 0 0 0 8,125 5,121 770 -37.0%SE LP 2,628 1,897 506 -27.8% 0 0 0 2,628 1,897 506 -27.8%UP 0 0 0 0 0 0 0 0 0NLP 13,695 10,529 1,107 -23.1% 0 0 0 13,695 10,529 1,107 -23.1%SLP 22,351 14,599 1,295 -34.7% 0 0 0 22,351 14,599 1,295 -34.7%Statewide 36,046 25,129 1,719 -30.3% 0 0 0 36,046 25,129 1,719 -30.3%Youth cWest UP 0 108 40 0 390 75 0 498 86East UP 0 20 17 0 78 34 0 98 38NE LP 0 191 53 0 361 72 0 551 91NW LP 0 313 68 0 902 114 0 1,215 134Sag. Bay 0 191 54 0 804 109 0 995 123SW LP 0 269 83 0 317 69 0 586 108SC LP 0 186 52 0 560 90 0 747 104SE LP 0 88 36 0 214 57 0 303 68UP 0 127 43 0 468 82 0 595 94NLP 0 588 93 0 1,555 151 0 2,142 178SLP 0 651 112 0 1,603 154 0 2,254 192Statewide 0 1,366 153 0 3,626 232 0 4,992 279a Harvest estimates do not include deer taken with Block Permits or Deer Management Assistance Permits. An additional 7,327 deer were takenwith these permits.b 95% confidence limit for the <strong>2000</strong> estimate.c Youth season did not exist before <strong>2000</strong>.26
Table 6 (continued). Number of deer harvested in Michigan by hunting season, 1999-<strong>2000</strong>. aAntlerless Antlered Bucks Sexes CombinedSeason andArea1999Harvest<strong>2000</strong>Harvest95%CL bChangefrom 1999to <strong>2000</strong>1999Harvest<strong>2000</strong>Harvest95%CL bChangefrom 1999to <strong>2000</strong>1999Harvest<strong>2000</strong>Harvest95%CL bChangefrom 1999to <strong>2000</strong>All SeasonsWest UP 20,746 30,914 2,263 49.0% 40,175 49,347 2,305 22.8% 60,951 80,285 3,645 31.7%East UP 4,562 6,884 961 50.9% 9,170 11,886 1,130 29.6% 13,739 18,777 1,669 36.7%NE LP 38,803 35,064 2,221 -9.6% 35,291 38,061 2,017 7.9% 74,090 73,122 3,337 -1.3%NW LP 46,271 45,245 2,483 -2.2% 49,249 51,310 2,338 4.2% 95,526 96,553 3,914 1.1%Sag. Bay 43,174 35,867 2,271 -16.9% 38,667 38,785 2,066 0.3% 81,835 74,648 3,478 -8.8%SW LP 43,702 38,724 2,364 -11.4% 36,416 38,598 2,092 6.0% 80,108 77,312 3,630 -3.5%SC LP 58,421 42,002 2,435 -28.1% 44,676 43,774 2,241 -2.0% 103,079 85,768 3,781 -16.8%SE LP 16,016 13,761 1,385 -14.1% 12,234 14,151 1,234 15.7% 28,245 27,909 2,097 -1.2%UP 25,309 37,798 2,459 49.3% 49,345 61,233 2,567 24.1% 74,690 99,062 4,009 32.6%NLP 99,289 92,530 3,561 -6.8% 97,684 102,699 3,313 5.1% 196,974 195,222 5,507 -0.9%SLP 147,097 118,134 4,124 -19.7% 118,849 121,980 3,707 2.6% 265,909 240,090 6,332 -9.7%Statewide 271,695 248,463 6,006 -8.6% 265,878 285,911 5,615 7.5% 537,573 534,374 9,337 -0.6%a Harvest estimates do not include deer taken with Block Permits or Deer Management Assistance Permits. An additional 7,327 deer were takenwith these permits.b 95% confidence limit for the <strong>2000</strong> estimate.27
Table 7. Number of deer harvested on public and private lands during all seasons combined in Michigan by management region, 1999-<strong>2000</strong>. aAntlerless Antlered Bucks Sexes CombinedSeason andArea1999Harvest<strong>2000</strong>Harvest95%CL bChangefrom 1999to <strong>2000</strong>1999Harvest<strong>2000</strong>Harvest95%CL bChangefrom 1999to <strong>2000</strong>1999Harvest<strong>2000</strong>Harvest95%CL bChangefrom 1999to <strong>2000</strong>Public LandsWest UP 3,864 9,131 1,066 136.3% 15,616 20,421 1,473 30.8% 19,496 29,556 1,976 51.6%East UP 768 2,144 517 179.1% 3,390 4,860 718 43.4% 4,161 7,004 940 68.3%NE LP 11,014 11,031 1,192 0.2% 11,128 11,984 1,126 7.7% 22,127 23,012 1,787 4.0%NW LP 7,176 7,547 880 5.2% 13,133 13,058 1,137 -0.6% 20,311 20,606 1,529 1.5%Sag. Bay 5,040 4,141 695 -17.8% 5,539 4,858 709 -12.3% 10,573 8,998 1,088 -14.9%SW LP 3,192 3,395 639 6.4% 2,962 2,803 537 -5.4% 6,148 6,196 878 0.8%SC LP 4,728 3,280 618 -30.6% 3,296 3,018 575 -8.4% 8,014 6,298 925 -21.4%SE LP 1,512 1,384 378 -8.5% 1,028 1,411 387 37.3% 2,535 2,795 582 10.2%UP 4,632 11,275 1,185 143.4% 19,006 25,281 1,638 33.0% 23,657 36,561 2,188 54.5%NLP 19,606 19,791 1,523 0.9% 26,720 27,518 1,684 3.0% 46,314 47,308 2,444 2.1%SLP 13,056 10,988 1,138 -15.8% 10,366 9,614 998 -7.3% 23,394 20,597 1,645 -12.0%Statewide 37,294 42,053 2,248 12.8% 56,092 62,412 2,561 11.3% 93,365 104,466 3,682 11.9%Private LandsWest UP 16,881 21,772 1,889 29.0% 24,536 28,922 1,753 17.9% 41,429 50,705 2,897 22.4%East UP 3,795 4,737 784 24.8% 5,774 7,025 856 21.7% 9,572 11,767 1,318 22.9%NE LP 27,787 24,018 1,848 -13.6% 24,152 26,076 1,663 8.0% 51,936 50,095 2,756 -3.5%NW LP 39,097 37,698 2,308 -3.6% 36,108 38,251 2,030 5.9% 75,204 75,944 3,543 1.0%Sag. Bay 38,136 31,732 2,152 -16.8% 33,136 33,928 1,930 2.4% 71,273 65,659 3,272 -7.9%SW LP 40,515 35,339 2,258 -12.8% 33,472 35,797 2,012 6.9% 73,984 71,131 3,473 -3.9%SC LP 53,698 38,733 2,338 -27.9% 41,401 40,758 2,159 -1.6% 95,092 79,489 3,633 -16.4%SE LP 14,506 12,380 1,323 -14.7% 11,213 12,740 1,168 13.6% 25,716 25,119 1,987 -2.3%UP 20,676 26,509 2,046 28.2% 30,310 35,948 1,951 18.6% 51,001 62,471 3,182 22.5%NLP 79,684 72,727 3,193 -8.7% 70,946 75,178 2,836 6.0% 150,626 147,899 4,847 -1.8%SLP 134,055 107,173 3,937 -20.1% 108,536 112,373 3,555 3.5% 242,579 219,538 6,048 -9.5%Statewide 234,415 206,410 5,492 -11.9% 209,792 223,499 4,965 6.5% 444,206 429,908 8,411 -3.2%a Harvest estimates do not include deer taken with Block Permits or Deer Management Assistance Permits. An additional 7,327 deer were takenwith these permits.b 95% confidence limit for the <strong>2000</strong> estimate.28
Table 8. Percentage of deer hunters harvesting deer in Michigan during all seasons, <strong>2000</strong>. aNumber of deer harvestedSex and≥1 deer ≥2 deer ≥3 deer ≥4 deer ≥5 deerArea Success 95% CL b Success 95% CL b Success 95% CL b Success 95% CL b Success 95% CL bAntlerlessWest UP 21.9% 1.2% 5.4% 0.7% 1.5% 0.4% 0.4% 0.2% 0.2% 0.1%East UP 15.3% 1.8% 3.1% 0.9% 0.7% 0.4% 0.2% 0.2% 0.0% 0.0%NE LP 17.9% 0.9% 3.6% 0.5% 1.0% 0.2% 0.3% 0.1% 0.1% 0.1%NW LP 20.9% 0.9% 4.1% 0.5% 1.0% 0.2% 0.2% 0.1% 0.1% 0.1%Sag. Bay 21.7% 1.1% 4.6% 0.6% 1.3% 0.3% 0.2% 0.1% 0.0% 0.1%SW LP 23.4% 1.2% 6.4% 0.7% 1.6% 0.3% 0.2% 0.1% 0.1% 0.1%SC LP 22.9% 1.1% 5.6% 0.6% 1.6% 0.3% 0.1% 0.1% 0.0% 0.0%SE LP 16.8% 1.4% 3.5% 0.7% 1.0% 0.4% 0.1% 0.1% 0.0% 0.1%UP 20.4% 1.0% 4.9% 0.6% 1.4% 0.3% 0.4% 0.2% 0.1% 0.1%NLP 20.3% 0.6% 4.1% 0.3% 1.0% 0.2% 0.2% 0.1% 0.1% 0.0%SLP 22.8% 0.6% 5.9% 0.4% 1.7% 0.2% 0.2% 0.1% 0.1% 0.0%Statewide 24.4% 0.5% 6.1% 0.3% 1.7% 0.1% 0.3% 0.1% 0.1% 0.0%Antlered Bucks cWest UP 42.1% 1.5% 5.2% 0.7%East UP 29.9% 2.3% 3.2% 0.9%NE LP 22.2% 1.0% 2.4% 0.4%NW LP 26.2% 1.0% 3.2% 0.4%Sag. Bay 25.9% 1.2% 3.8% 0.5%SW LP 26.9% 1.2% 4.5% 0.6%SC LP 26.3% 1.1% 4.8% 0.6%SE LP 19.4% 1.5% 2.5% 0.6%UP 39.7% 1.3% 4.9% 0.6%NLP 25.5% 0.7% 3.2% 0.3%SLP 27.0% 0.7% 4.8% 0.3%Statewide 32.3% 0.5% 5.3% 0.2%a Excludes people that did not hunt during the season and deer taken with Block Permits or Deer Management Assistance Permits.b 95% confidence limit.c The season bag limit for antlered deer was two.29
Table 8 (continued). Percentage of deer hunters harvesting deer in Michigan during all seasons, <strong>2000</strong>. aNumber of deer harvestedSex and≥1 deer ≥2 deer ≥3 deer ≥4 deer ≥5 deerArea Success 95% CL b Success 95% CL b Success 95% CL b Success 95% CL b Success 95% CL bSexes CombinedWest UP 54.7% 1.5% 16.1% 1.1% 4.1% 0.6% 1.4% 0.4% 0.2% 0.2%East UP 39.6% 2.5% 9.7% 1.5% 2.2% 0.7% 0.9% 0.5% 0.1% 0.1%NE LP 34.7% 1.2% 9.4% 0.7% 2.5% 0.4% 0.8% 0.2% 0.1% 0.1%NW LP 39.2% 1.1% 12.3% 0.8% 3.4% 0.4% 1.0% 0.2% 0.1% 0.1%Sag. Bay 40.6% 1.3% 12.9% 0.9% 3.5% 0.5% 1.0% 0.3% 0.2% 0.2%SW LP 41.7% 1.3% 14.7% 1.0% 4.5% 0.6% 1.7% 0.3% 0.2% 0.2%SC LP 41.5% 1.3% 14.1% 0.9% 4.3% 0.5% 1.3% 0.3% 0.2% 0.2%SE LP 31.3% 1.7% 8.7% 1.1% 2.7% 0.6% 0.8% 0.3% 0.0% 0.0%UP 51.4% 1.3% 14.8% 0.9% 3.7% 0.5% 1.4% 0.3% 0.1% 0.1%NLP 38.4% 0.8% 11.6% 0.5% 3.1% 0.3% 1.0% 0.2% 0.1% 0.1%SLP 41.5% 0.8% 14.4% 0.5% 4.5% 0.3% 1.4% 0.2% 0.0% 0.0%Statewide 46.7% 0.5% 16.3% 0.4% 5.0% 0.2% 1.6% 0.1% 0.5% 0.1%a Excludes people that did not hunt during the season and deer taken with Block Permits or Deer Management Assistance Permits.b 95% confidence limit.c The season bag limit for antlered deer was two.30
Table 9. Percentage of deer hunters harvesting at least one deer in Michigan by hunting season, <strong>2000</strong>. aSex andAreaArchery95%Success CL bRegularFirearm95%Success CL bMuzzleloader95%Success CL bSeasonEarlyAntlerless95%Success CL bLateAntlerless Youth All Seasons95%95%95%Success CL b Success CL b Success CL bAntlerlessWest UP 21.7% 2.3% 16.8% 1.2% 21.6% 3.3% 0.0% 0.0% 0.0% 0.0% 10.1% 3.6% 21.9% 1.2%East UP 22.5% 4.0% 10.5% 1.7% 10.1% 4.3% 0.0% 0.0% 0.0% 0.0% 8.3% 7.0% 15.3% 1.8%NE LP 8.6% 1.1% 13.9% 0.9% 10.0% 2.1% 25.6% 5.0% 27.4% 3.8% 14.2% 3.7% 17.9% 0.9%NW LP 13.0% 1.2% 16.2% 0.9% 11.6% 2.1% 0.0% 0.0% 35.3% 4.2% 11.4% 2.4% 20.9% 0.9%Sag. Bay 12.4% 1.2% 15.8% 1.1% 10.7% 1.9% 0.0% 0.0% 28.8% 3.6% 7.4% 2.0% 21.7% 1.1%SW LP 10.8% 1.2% 19.2% 1.2% 10.8% 1.7% 0.0% 0.0% 21.2% 2.9% 9.4% 2.3% 23.4% 1.2%SC LP 10.8% 1.1% 18.0% 1.1% 10.9% 1.7% 0.0% 0.0% 21.8% 2.8% 7.3% 2.0% 22.9% 1.1%SE LP 10.4% 1.5% 11.6% 1.4% 8.3% 2.2% 0.0% 0.0% 18.7% 4.2% 8.9% 3.5% 16.8% 1.4%UP 22.2% 2.0% 15.3% 1.0% 18.9% 2.8% 0.0% 0.0% 0.0% 0.0% 9.8% 3.2% 20.4% 1.0%NLP 11.7% 0.8% 15.4% 0.6% 11.2% 1.4% 25.6% 5.0% 32.2% 2.7% 12.3% 1.9% 20.3% 0.6%SLP 11.4% 0.7% 17.7% 0.6% 10.6% 1.0% 0.0% 5.0% 22.2% 1.7% 7.9% 1.9% 22.8% 0.6%Statewide 14.1% 0.6% 17.7% 0.4% 12.2% 0.8% 25.6% 5.0% 25.8% 1.4% 14.2% 3.7% 24.4% 0.5%Antlered BucksWest UP 20.6% 2.3% 41.8% 1.6% 9.8% 2.4% 0.0% 0.0% 0.0% 0.0% 36.9% 5.7% 42.1% 1.5%East UP 17.3% 3.6% 29.0% 2.5% 9.5% 4.2% 0.0% 0.0% 0.0% 0.0% 33.3% 11.9% 29.9% 2.3%NE LP 11.8% 1.3% 21.6% 1.1% 5.3% 1.6% 0.0% 0.0% 0.0% 0.0% 27.0% 4.7% 22.2% 1.0%NW LP 17.8% 1.4% 23.2% 1.1% 4.6% 1.4% 0.0% 0.0% 0.0% 0.0% 33.2% 3.6% 26.2% 1.0%Sag. Bay 18.9% 1.5% 21.6% 1.2% 4.5% 1.3% 0.0% 0.0% 0.0% 0.0% 31.7% 3.6% 25.9% 1.2%SW LP 20.8% 1.6% 21.4% 1.2% 5.8% 1.3% 0.0% 0.0% 0.0% 0.0% 12.5% 2.6% 26.9% 1.2%SC LP 21.8% 1.5% 20.8% 1.1% 4.9% 1.2% 0.0% 0.0% 0.0% 0.0% 22.1% 3.2% 26.3% 1.1%SE LP 14.8% 1.7% 15.4% 1.6% 3.3% 1.4% 0.0% 0.0% 0.0% 0.0% 21.3% 5.0% 19.4% 1.5%UP 20.1% 2.0% 38.8% 1.3% 9.9% 2.1% 0.0% 0.0% 0.0% 0.0% 36.2% 5.2% 39.7% 1.3%NLP 16.0% 0.9% 22.7% 0.7% 4.9% 1.0% 0.0% 0.0% 0.0% 0.0% 32.7% 2.7% 25.5% 0.7%SLP 20.6% 0.9% 21.1% 0.7% 5.0% 0.7% 0.0% 0.0% 0.0% 0.0% 20.6% 1.8% 27.0% 0.7%Statewide 21.0% 0.7% 26.7% 0.5% 5.8% 0.6% 0.0% 0.0% 0.0% 0.0% 26.4% 2.7% 32.3% 0.5%a Excludes people that did not hunt during the season and deer taken with Block Permits or Deer Management Assistance Permits.b 95% confidence limit.31
Table 9 (continued). Percentage of deer hunters harvesting at least one deer in Michigan by hunting season, <strong>2000</strong>. aSex andAreaArchery95%Success CL bRegularFirearm95%Success CL bMuzzleloader95%Success CL bSeasonEarlyAntlerless95%Success CL bLateAntlerless Youth All Seasons95%95%95%Success CL b Success CL b Success CL bSexes combinedWest UP 39.1% 2.8% 52.0% 1.6% 30.7% 3.7% 0.0% 0.0% 0.0% 0.0% 46.5% 5.9% 54.7% 1.5%East UP 36.1% 4.6% 36.1% 2.6% 19.6% 5.7% 0.0% 0.0% 0.0% 0.0% 41.7% 12.4% 39.6% 2.5%NE LP 19.6% 1.6% 31.9% 1.2% 14.8% 2.5% 25.6% 5.0% 27.4% 3.8% 40.5% 5.2% 34.7% 1.2%NW LP 27.8% 1.6% 34.6% 1.2% 15.8% 2.4% 0.0% 0.0% 35.3% 4.2% 44.4% 3.8% 39.2% 1.1%Sag. Bay 28.8% 1.7% 33.7% 1.4% 14.8% 2.2% 0.0% 0.0% 28.8% 3.6% 38.9% 3.8% 40.6% 1.3%SW LP 28.5% 1.8% 35.4% 1.4% 15.8% 2.0% 0.0% 0.0% 21.2% 2.9% 21.8% 3.2% 41.7% 1.3%SC LP 29.1% 1.7% 34.7% 1.3% 15.5% 2.0% 0.0% 0.0% 21.8% 2.8% 29.4% 3.5% 41.5% 1.3%SE LP 22.6% 2.0% 24.5% 1.9% 10.7% 2.5% 0.0% 0.0% 18.7% 4.2% 29.7% 5.6% 31.3% 1.7%UP 38.8% 2.4% 48.2% 1.4% 28.2% 3.2% 0.0% 0.0% 0.0% 0.0% 45.7% 5.3% 51.4% 1.3%NLP 25.6% 1.1% 33.9% 0.8% 15.6% 1.6% 25.6% 5.0% 32.2% 2.7% 44.7% 2.9% 38.4% 0.8%SLP 28.7% 1.0% 34.5% 0.8% 14.9% 1.1% 0.0% 0.0% 22.2% 1.7% 28.3% 2.0% 41.5% 0.8%Statewide 31.6% 0.8% 39.3% 0.6% 17.4% 0.9% 25.6% 5.0% 25.8% 1.4% 35.8% 1.6% 46.7% 0.5%a Excludes people that did not hunt during the season and deer taken with Block Permits or Deer Management Assistance Permits.b 95% confidence limit.32