2004-2005 - GPC Home - Georgia Perimeter College
2004-2005 - GPC Home - Georgia Perimeter College
2004-2005 - GPC Home - Georgia Perimeter College
- No tags were found...

You also want an ePaper? Increase the reach of your titles
YUMPU automatically turns print PDFs into web optimized ePapers that Google loves.
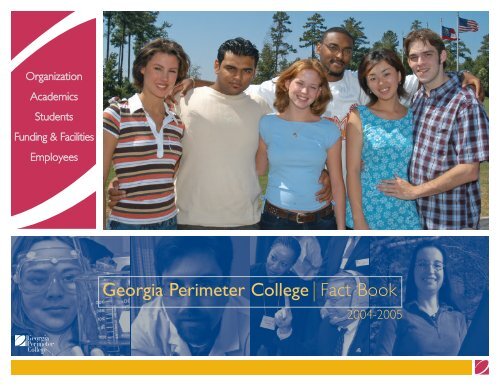
OrganizationAcademicsStudentsFunding & FacilitiesEmployees<strong>Georgia</strong> <strong>Perimeter</strong> <strong>College</strong> Fact Book<strong>2004</strong>-<strong>2005</strong>
OrganizationAcademicsStudentsFunding & FacilitiesEmployeesProduced byThe Office of Institutional Research and Planning<strong>Georgia</strong> <strong>Perimeter</strong> <strong>College</strong>3251 Panthersville RoadDecatur, GA 30034Phone: 678-891-2570; Fax: 404-244-2373Published inFebruary 2006, Decatur, <strong>Georgia</strong> U.S.A.Electronic format available atwww.gpc.edu<strong>Georgia</strong> <strong>Perimeter</strong> <strong>College</strong>
PrefaceThe <strong>2004</strong>-<strong>2005</strong> edition of The <strong>Georgia</strong> <strong>Perimeter</strong> <strong>College</strong> Fact Book provides a comprehensive statistical portrait of <strong>Georgia</strong><strong>Perimeter</strong> <strong>College</strong> (<strong>GPC</strong>). This book presents a wide array of information and data in key areas including enrollment, humanresources, financial activity, and other dimensions of <strong>Georgia</strong> <strong>Perimeter</strong> <strong>College</strong> and its constituent locations: Clarkston campus,Decatur campus, Dunwoody campus, Lawrenceville campus, Rockdale center, and the Alpharetta site.All enrollment data is based on students enrolled on October 15, <strong>2004</strong>. All administrative and academic information is based on dataas of July 1, <strong>2005</strong>, except organizational charts that reflect the most recent changes and are effective July 1, <strong>2005</strong>. All fiscal year dataare collected as of June 30, <strong>2005</strong>. The definitions and guidelines used in this book are consistent with the Integrated Post-secondaryEducation Data System (IPEDS) and policies of the Board of Regents of the University System of <strong>Georgia</strong>. All the data sources,unless noted, are from <strong>GPC</strong>’s Office of Institutional Research and Planning.The <strong>Georgia</strong> <strong>Perimeter</strong> <strong>College</strong> Fact Book <strong>2004</strong>-<strong>2005</strong> is a publication of the Office of Institutional Research and Planning (OIRP). Itis also a product of cooperative efforts of the many offices and campuses of <strong>GPC</strong>. Mr. Ron Carruth, Executive Vice President ofFinance and Administrative Affairs, gave invaluable direction and support to the whole process. The <strong>GPC</strong> Office of Marketing andPublic Relations, Ms. Lynn Parker, Assistant Vice President of Financial Affairs, and the OIRP staff worked carefully to produce thedata and present it lucidly in this publication. Their efforts are gratefully appreciated.The electronic version of the fact book is accessible to the public on the World Wide Web via <strong>Georgia</strong> <strong>Perimeter</strong> <strong>College</strong>'s home pageat www.gpc.edu or directly at www.gpc.edu/~irp. Inquiries and comments concerning this document are sincerely welcome and maybe directed to the Office of Institutional Research and Planning: 3251 Panthersville Road, Decatur, GA 30034; Phone: 678-891-2570;Fax: 404-244-2373; E-mail: jbyrd@gpc.edu.Godfrey Fuji Noe, PhD, MA, Director, Office of Institutional Research and PlanningPatricia L. Gregg, PhD, Assistant Director, Institutional Effectiveness, Office of Institutional Research and PlanningJanna Kelley, Information Analyst II, Office of Institutional Research and PlanningJanice W. Byrd, Administrative Secretary, Office of Institutional Research and Planningi
Table of ContentsPreface iPresident's Message iiTable of Contents iiiORGANIZATION 1Mission Statement 3History 5Board of Regents 6Chief Executive Officer, Vice Presidents,and Provosts 7Administrative Organizational Chart 8Financial and Administrative Affairs Team 9Educational Affairs Team 10Advancement & External Affairs Team 11Clarkston Campus Team 12Decatur Campus Team 13Dunwoody Campus/Alpharetta Center Team 14Lawrenceville Campus Team 15Rockdale Center Team 16Geographic Locations of the <strong>GPC</strong> Campuses 17Maps of Alpharetta Center and Clarkston Campus 18Maps of Decatur and Dunwoody Campuses 19Maps of Lawrenceville Campus & Rockdale Center 20ACADEMICS 21Academic Programs Offered, FY <strong>2005</strong> 23Degrees Awarded Summary, FY 1998-<strong>2004</strong> 24Degrees Awarded by Campus, FY <strong>2004</strong> 25Degrees Awarded by Ethnicity and Gender, FY <strong>2004</strong> 26Degrees Awarded by Major, FY <strong>2004</strong> 27Students Taught by Program by Campus, Fall <strong>2004</strong> 28Continuing and Corporate Education Fall 2000-<strong>2004</strong> 29STUDENTS 31Enrollment Summary I – All Campuses, Fall 98-04 33Enrollment Summary II – All Campuses, Fall 98-04 34<strong>2004</strong>-<strong>2005</strong> Fact Book Enrollment Note 35Enrollment of <strong>GPC</strong> Clarkston, Fall 98-04 36Enrollment of <strong>GPC</strong> Clarkston, Fall 98-04 (Continued) 37Enrollment of <strong>GPC</strong> Decatur, Fall 98-04 38Enrollment of <strong>GPC</strong> Decatur, Fall 98-04 (Continued) 39Enrollment of <strong>GPC</strong> Dunwoody, Fall 98-04 40Enrollment of <strong>GPC</strong> Dunwoody, Fall 98-04(Continued) 41Enrollment of <strong>GPC</strong> Lawrenceville, Fall 98-04 42Enrollment of <strong>GPC</strong> Lawrenceville, Fall 98-04(Continued) 43Enrollment of <strong>GPC</strong> Rockdale, Fall 98-04 44Enrollment of <strong>GPC</strong> Rockdale, Fall 98-04 (Continued) 45Enrollment of <strong>GPC</strong> Off Campus/DistanceEducation, Fall 98-04 46Enrollment of <strong>GPC</strong> Off Campus/DistanceEducation, Fall 98-04 (Continued) 47Enrollment by Age Group, Fall 2000-<strong>2004</strong>;and by County, Fall <strong>2004</strong> 48iii
Table of Contents (Continued)High Schools Attended by 100 or More, Fall 03-04 49International Student Enrollment I, Fall 2001-<strong>2004</strong> 51Retention Rate, Fall 2003; Enrollment byClass Size FY 98-04 53Student Financial Aid Awarded by Source, FY 00-04 54Entering Freshman SAT, Fall 00-04; Regents’ Test,Fall 04 55Applications Received, Fall 2000-<strong>2004</strong>Testing Activities, Fall 2000-<strong>2004</strong> 56Semester Credit Hour Report, <strong>GPC</strong> & USG FY 03-05 57Comparison with Other USG Two-Year <strong>College</strong>s,Fall <strong>2004</strong> 58Athletics, FY <strong>2004</strong> – 05 59Students with Disabilities, from 00-01 to 04-05 60FUNDING AND FACILITIES 61Student Tuition and Fees, FY 2006 63Revenues and Expenditures Per Student,FY 2001-<strong>2005</strong> 64Budget Allocations, FY 2001-<strong>2005</strong> 65Library Collections, FY 2000-<strong>2004</strong> 66Buildings, Improvement & Renovations, FY <strong>2005</strong> 67EMPLOYEES 69Full-Time Employees by EEO Classification 71Corps of Instruction-All Campuses, Fall <strong>2004</strong> 72Highest Earned Degree, Full-Time InstructionalFaculty, Fall <strong>2004</strong> 73Faculty Distribution by Rank and EthnicityFall 2000-04 74Faculty Distribution by Tenure Status, Fall 2000-04 76Tenure Status by Academic Area, Gender, &Ethnicity, Fall <strong>2004</strong> 77Faculty Workload by Area, Fall 2003 & <strong>2004</strong>;By Campus, Fall <strong>2004</strong> 78QUICK REFERENCES FOR <strong>GPC</strong> 79Quick Reference I for <strong>Georgia</strong> <strong>Perimeter</strong> <strong>College</strong> 81Quick Reference II for <strong>Georgia</strong> <strong>Perimeter</strong> <strong>College</strong> 82A Directory for <strong>Georgia</strong> <strong>Perimeter</strong> <strong>College</strong> 83iv
OrganizationAcademicsStudentsFunding & FacilitiesEmployeesOrganization<strong>Georgia</strong> <strong>Perimeter</strong> <strong>College</strong> is the third largest institution in the University System of <strong>Georgia</strong><strong>Georgia</strong> <strong>Perimeter</strong> <strong>College</strong>
Mission StatementA community committed to learning and to becoming apreeminent associate degree-granting institution, thefaculty, staff, administrators and students of <strong>Georgia</strong><strong>Perimeter</strong> <strong>College</strong> share the following aspirations:• To gain national recognition as a community oflearners• To assume a national leadership role in developingcreative, technologically-advanced academic andstudent services programs• To serve as a model for other institutions indeveloping collaborative partnerships to deliver publicservices, technical assistance, lifelong learning andeconomic development trainingA regional, multi-campus unit of the University System of<strong>Georgia</strong>, <strong>Georgia</strong> <strong>Perimeter</strong> <strong>College</strong> strives to meet thechanging expectations of our diverse collegiate andcommunity constituencies by providing effective,innovative, lifelong educational opportunities. We arecommitted to diversity, continuous improvement, highacademic standards and the efficient use of resources.In decision-making at all levels, the enhancement of ourstudents' lives is our first priority.<strong>Georgia</strong> <strong>Perimeter</strong> <strong>College</strong>, a nonresidential institution,serves diverse populations of traditional andnontraditional students in Greater Metropolitan Atlanta.Placing learning first, we provide accessible andaffordable high quality undergraduate credit and noncreditprograms for students seeking to complete anassociate degree, transfer to a senior college oruniversity, prepare for immediate entry into a career,pursue personal goals or enhance current workplaceskills. Our curriculum specializes in liberal arts andprofessional preparation and promotes international andintercultural understanding. We also serve the broadercommunity as an educational, cultural and economicresource.Our academic programs and student support servicesfocus on careful assessment of our learners' abilities,achievements and needs; accommodations of theirspecial requirements and resources; and guidance in thedevelopment and realization of their expectations andgoals. We thus offer specialized sequences of coursesand support programs that promote academic andpersonal success for students of varying levels ofacademic preparation. We encourage excellence inteaching, provide a technologically advanced learningenvironment, support innovative strategies for meetingthe learning styles of all students and promote learningby engaging students actively and collaboratively.3
Mission Statement (Continued)In meeting the educational needs of the citizens of<strong>Georgia</strong> for the 21 st century, we share with all otherinstitutions in the University System of <strong>Georgia</strong> thefollowing characteristics:• A supportive campus climate, necessary services andleadership and development opportunities, all toeducate the whole person and meet the needs ofstudents, faculty and staff• Cultural, ethnic, racial and gender diversity in thefaculty, staff and student body, supported by practicesand programs that embody the idea of an open,democratic and global society• Technology to advance educational purposes,including instructional technology, student supportservices and distance education• Collaborative relationships with other Systeminstitutions, State agencies, local schools andtechnical institutes, and business and industry,sharing physical, human, information and otherresources to expand and enhance programs andservices available to the citizens of <strong>Georgia</strong>.<strong>Georgia</strong> <strong>Perimeter</strong> <strong>College</strong> shares the followingcommitments to the citizens of <strong>Georgia</strong> with otherassociate-degree level colleges of the University Systemof <strong>Georgia</strong>:• A commitment to excellence and responsivenesswithin a scope of influence defined by the needs ofthe local area and by particularly outstandingprograms or distinctive characteristics that have amagnet effect throughout the region or state• A commitment to a teaching/learning environment,both inside and outside the classroom, that sustainsinstitutional excellence, functions to provide UniversitySystem access for a diverse student body andpromotes high levels of student learning• A commitment to a high quality general educationprogram that supports a variety of well-chosenassociate programs and prepares students fortransfer to baccalaureate programs, learning supportprograms designed to ensure access and opportunityfor a diverse student body and a limited number ofcertificate or other career programs to complementneighboring technical institute programs• A commitment to public service, continuing education,technical assistance and economic developmentactivities that address the needs, improve the qualityof life and raise the educational level within the<strong>College</strong>'s scope of influence• A commitment to scholarship and creative work forthe specific purposes of supporting instructionaleffectiveness and enhancing institutionally relevantfaculty qualifications.4
HistoryFounded by the citizens of DeKalb County and the DeKalb Board ofEducation under the Junior <strong>College</strong> Act of 1958, <strong>Georgia</strong> <strong>Perimeter</strong><strong>College</strong> opened as DeKalb <strong>College</strong> with its Clarkston Campus in1964. It was the only public junior college in the state supported andcontrolled by a local Board of Education. It was established in orderthat any resident of the DeKalb School District who held a highschool diploma or its equivalent and who desired to seek two yearsof postsecondary education might have the opportunity to do so.The <strong>College</strong>’s Decatur (formerly known as South) Campus opened in1972. Also beginning in 1972, students enrolled in DeKalb AreaTechnical School were able to enroll dually in vocational andcollegiate programs, and the <strong>College</strong> was designated DeKalbCommunity <strong>College</strong>. As growth continued both for DeKalb Countyand the <strong>College</strong>, the Dunwoody (formerly North) Campus was addedand began operation in 1979. DeKalb <strong>College</strong> pioneered in <strong>Georgia</strong>in open-door admissions, personalized approaches to instruction,and community-related curricula and activities.In 1985, DeKalb Vocational-Technical School was placed under thegovernance of a state board for vocational-technical schools withdaily operations remaining under the control of the DeKalb CountySchool System. Students enrolled in specific Associate in AppliedScience degree programs continued, however, to enroll dually in the<strong>College</strong> and technical school, now known as DeKalb Technical<strong>College</strong>.In 1986, when DeKalb County relinquished its support, DeKalb<strong>College</strong> was accepted by the Board of Regents of the UniversitySystem of <strong>Georgia</strong> as the thirty-fourth member institution.During spring 1993, DeKalb <strong>College</strong>, in cooperation with ClaytonState <strong>College</strong>, DeKalb Technical <strong>College</strong>, and Rockdale CountyPublic Schools, formed the Rockdale Center for Higher Education,which offers both credit and non-credit courses.In November 1997, the Board of Regents of the University System of<strong>Georgia</strong> approved changing the name of the <strong>College</strong> from DeKalb<strong>College</strong> to <strong>Georgia</strong> <strong>Perimeter</strong> <strong>College</strong> to reflect its expanding missionand its service throughout the metro Atlanta area. As part ofchanging the <strong>College</strong>’s name, the names of the campuses werechanged to identify the cities in which they are located.In December 2001 <strong>Georgia</strong> <strong>Perimeter</strong> <strong>College</strong>’s LawrencevilleCampus, along with its partners at the Gwinnett University Center,relocated from its humble beginnings at the MacCleod Industrial Parkon Sugarloaf Parkway to its current 177-acre campus at 1000University Center Lane.The <strong>College</strong>’s academic offerings correspond with curricular contentand requirements of the University System of <strong>Georgia</strong>. <strong>Georgia</strong><strong>Perimeter</strong> <strong>College</strong> also serves as a community cultural center for theperforming arts in music and drama. Curricula feature transfer,learning support, career, continuing and distance educationprograms as well as joint educational offerings with other systeminstitutions and state-supported technical institutions. Associatedegrees are awarded to graduates who complete the two-yeartransfer and career programs.Source: www.gpc.edu/News_and_Information/mission.php3#history5
Board of RegentsThe Board of Regents (BOR) of theUniversity System of <strong>Georgia</strong>(USG) is composed of 16 membersappointed by the Governor andconfirmed by the Senate for sevenyearterms. One member isappointed from each of the 11congressional districts, and five areappointed from the state at large.The BOR exercises broadjurisdiction over all institutions ofUSG and establishes policies andprocedures under which theyoperate. The BOR receives all stateappropriations for the USG andallocates these appropriations tothe institutions and institutionrelatedagencies. While the BORengages in both policy-making andadministrative functions, each unitof the System has a high degree ofacademic and administrativeautonomy.The System currently includes 35institutions: four researchuniversities, two regionaluniversities, 11 state universities,two state colleges, 15 two-yearcolleges and one independentresearch unit. These institutions areboth distinctive and interrelated.They are geographically dispersedso that approximately 96 percent ofthe people in <strong>Georgia</strong> reside within35 miles of at least one university orcollege.Members and Terms of the BOR• Carter, Hugh A., Jr.(08/08/00-01/01/07)• Cater, (Mr.) Connie(06/18/99-01/01/06)• Clevelend, William H.(01/01/02-01/01/09)• Coles, Michael J.(01/09/01-01/01/08)• Harris, Joe Frank(06/18/99-01/01/06)• Hunt, Julie Ewing(01/01/04-01/01/11)• Jennings, W. Mansfield, Jr.(05/20/03-01/01/10)• Jolly, James R.(11/18/03-01/01/08)• Leebern, Donald M., Jr.(01/28/05-01/01/12)• McMillan, Elridge W.(01/01/03-01/01/10)• NeSmith, Martin W.(06/18/99-01/01/06)• Pittard, Patrick S. (Vice Chair)(05/20/01-01/10/08)• Poitevint, Doreen S.(01/13/04-01/13/11)• Rodwell, Wanda Yancey(01/01/05-01/01/12)• Shelnut, J. Timothy (Chair)(08/25/00-01/01/07)• Tucker, Richard L.(01/28/05-01/01/12)• Vigil, Allan(08/06/03-01/01/10)• Wooten, Joel O. Jr.(06/18/99-01/01/06)Chancellor Designate of the USG• Erroll B. Davis Jr.6
Chief Executive Officer, Vice Presidents, and ProvostsChief Executive OfficerThe President of <strong>Georgia</strong> <strong>Perimeter</strong><strong>College</strong> is the chief executive andadministrative officer. The President isappointed by the Board of Regents andis directly responsible to the BOR forthe conduct of the institution, thedevelopment of institutional goals, theformulation of policies, and the overallwell being of the <strong>College</strong>.The President of <strong>GPC</strong>Robert E. Watts (Interim)<strong>2005</strong> - present (6 th president)The Past Presidents of <strong>GPC</strong>• 1 st -Thad W. Hollingsworth(1963-1967)• 2 nd -James H. Hinson, Jr.(1967-1977)• 3 rd -W. Wayne Scott (1977-1982)• 4 th -Marvin Cole (1982-1994)• 5 th -Jacquelyn M. Belcher, J.D.(1995-<strong>2005</strong>)The <strong>GPC</strong> LogoVice PresidentsRonald L. Carruth, Executive VP,Financial & AdministrativeAffairsVirginia Michelich, Ph.D., VP,Educational AffairsJeff Tarnowski, VP, InstitutionalAdvancementProvostsDennis R. Harkins, Ph.D., Provost,Clarkston CampusElizabeth F. Mistretta, Ph.D.,Interim Provost,Dunwoody Campus/Alpharetta Ctr.Felita Williams, Ph.D., Provost,Decatur Campus*Deborah E. Preston, Ph.D.,Interim Provost,Lawrenceville CampusSarah D. (Sallie) Paschal, Ph.D., ChiefOperating Officer, Rockdale Center* Effective November <strong>2005</strong>, Dr. Felita Williams is on assignment at the Board of Regents. Dr. Deborah Preston is currently serving as Interim Provost of the Decatur campus.7
Administrative Organizational ChartBoard Of Regents,University System of<strong>Georgia</strong>PRESIDENTInternal AuditorExec. V. Pres.Fin & Admin AffrsV. Pres.Ed AffrsV. Pres.Inst. AdvancementProvost,ClarkstonProvost,DecaturProvost Dunwoody /AlpharettaProvostLawrencevilleChief OperatingOfficer, RockdaleCenterAssoc. VP,Information TechAsst. VP,Financial AffairsAssoc. VP,FacilitiesDirector,Office of PublicSafetyAsst. VP,Human ResourcesDirector,Financial AidAsst. VP,Ed AffrsAsst. VP, Ed AffrsDistance LearningAsst. VP,Ed AffrsAsst. VP, Ed AffrsCont & Corp EdAsst. VP, Ed AffrsHealth SciencesDirector,Service LearningAsst. to VP,Inst. AdvancementAsst. to VP,Special ProjectsDir., Marketing &Pblc. RelationsDir., InstitutionalAdvancementDir., Grants &Spons. ProgramsDir., LearningResources CenterDean,Student ServiceCoordinator,Evening/WeekendCoordinator,Joint EnrollmentManager,Plant OperationsDean,Student ServicesDir., LearningResourcesManager,Plant ServicesCoordinator,Evening / SpecialProjectsDean,Student ServicesDir., LearningResources CenterCoordinator, JointEnrollment ProgramDir., InstructionalTech. & MediaServicesCoordinator,Weekend / EveningProgramsDean,Student ServicesDean,Student ServicesDir., LearningResources CenterDirector,Inst. Rsrch & PlanDean, Acad SrvcsClarkstonDean, Acad SrvcsDecaturDean, Acad SrvcsDunwoody/AlpharettaDean, Acad SrvcsLawrencevilleDean, Acad SrvcsRockdale Center8
Financial and Administrative Affairs TeamExecutive Vice President,Financial and AdministrativeAffairsAssoc. Vice Pres.,InformationTechnologyAsst. Vice Pres.,Financial AffairsAssoc. Vice Pres.,FacilitiesDirector,Dept. of PublicSafetyAsst. Vice Pres.,Human ResourcesDir., Fin AidVeteran AffairsDirector,Inst. Research &PlanningDirector,Ent. Info. SystemDirector,<strong>College</strong> ServicesDirector,Central SupportLieutenant,ClarkstonDirector,Benefits/TrngAssoc. Dir.,Financial AidAsst. Dir.,InstitutionalResearchDirector,Database ServicesDirector,BudgetsPlant ManagementLieutenant,DecaturDirector,OmbudspersonAssoc. Dir.,Financial AidAsst. Dir.,InstitutionalEffectivesDirector,EducationalTechnologyDirector,AccountingDirector,Facilities PlanningLieutenant,DunwoodyDirector,Empl./Acad. Serv.Assoc. Dir.,Financial AidInfo. Analyst,Res & PlanningDirector,PayrollLieutenant,Gwinnett Ctr.Director,Compliance &Affirmative ActionDirector,Student AccountsCommunicationsSupervisor9
Institutional AdvancementVice President, InstitutionalAdvancementDir.,Marketing & PublicRelationsDir.,Institutional Advancement,Foundation & Alumni AffairsDirector, Grants &Sponsored ProgramsPublicationsCoordinatorMedia RelationsCoordinatorDesign CoordinatorAsst. Dir., Inst.AdvancementScholarships &Annual GivingAsst. Dir., Inst.AdvancementCorp & FoundationRelationsGrants WriterGrants SpecialistPhotographyCoordinatorCoordinator,AdvancementServicesVideo ServicesCoordinator11
Clarkston Campus TeamProvost,Clarkston CampusDean,Student ServicesDirector, LearningResources CenterManager,Plant OperationsCoordinator,Evening/WeekendDirector,Advising/Counseling CenterDirector,Student LifeRegistrar,Enroll/RegistTesting Center12
Decatur Campus Team13
Dunwoody Campus/Alpharetta Center TeamProvost,Dunwoody AlpharettaCoordinator,Special ProjectsDean,Student ServicesDirector, LearningResource CenterDirector, Instr. Tech.& Media Svcs.Manager,Plant OperationsDirector, EnrollmentManagementCoordinator,Joint EnrollmentProgramCoordinator,Weekend/EveningProgramsRegistrar,Enrol & RegistrationForemanDirector, Advising &Counseling Ctr.Director,Student LifeCoordinator,Testing Center14
Lawrenceville Campus TeamProvost,Lawrenceville CampusDean,Student ServicesDean,Student ServicesDirector,Advising &CounselingDirector,Student LifeEnroll/Regist.RegistrarTesting Center15
Rockdale Center TeamRockdale,Chief Operating OfficerEveningCoordinatorDean,Student ServicesDirector,Student LifeEnrollment andRegistrationPsychometristCounselorAdmissionsCounselorCounselor16
Geographic Locations of the <strong>GPC</strong> CampusesAlpharetta Center3705 Brookside PkwyAlpharetta, GA 30022Clarkston Campus555 North Indian Creek Dr.Clarkston, GA 30021-2361Decatur Campus3251 Panthersville Rd.Decatur, GA 30034-3897Dunwoody Campus2101 Womack Rd.Dunwoody, GA 30338-4497Lawrenceville Campus at the Gwinnett UniversityCenter1000 University Center LaneLawrenceville, GA 30043Rockdale Center for Higher Education1115 West Ave.Conyers, GA 30012-994817
Maps of Alpharetta Center and Clarkston CampusAlpharetta Center Clarkston Campus18
Maps of Decatur and Dunwoody CampusesDecatur Campus Dunwoody Campus19
Maps of Lawrenceville Campus and Rockdale CenterLawrenceville Campus Rockdale Center20
OrganizationAcademicsStudentsFunding & FacilitiesEmployeesAcademics<strong>Georgia</strong> <strong>Perimeter</strong> <strong>College</strong> awarded degrees in 42 majors<strong>Georgia</strong> <strong>Perimeter</strong> <strong>College</strong>
Academic Programs Offered, FY <strong>2005</strong>Anthropology (AA)Arts (AA)Arts (AS)Biology (AA) (M)Business Administration (AS)Business and Office Technology (AAS) 1Chemistry (AA) (M)Communications (AA)Computer Information Systems (AAS) 1Computer Science (AS) (M)Criminal Justice (AS)Dental Hygiene (Career) (AS)Early Childhood Care and Education (AAS) 1Electronics Technology (AAS) 1Engineering (AS) (M)English (AA)Fire Management (Career) (AAS) (C)Forensic Science (AA)Foreign Language (AA)General Studies (AS)Geology (AA) (M)Health and Physical Education (AS) 2History (AA)Industrial Systems Technology (AAS) 1Journalism/Professional Writing (AA)Marketing Management (AAS) 1Mathematics (AA) (M)Medical Assisting (AAS) 1Medical Laboratory Technology (AAS) 1Music (AS)Nursing (Career) (AS)Philosophy (AA)Physics (AA) (M)Political Science (AA)Pre-Dentistry/Pre-Medicine/Pre-Pharmacy (AS) (M)Psychology (AA)Psychology (AS)Sign Language Interpreting (Career) (AAS) (C)Social Work (AS)Sociology (AA)Surgical Technology (AAS) 1Teacher Education (AS)Theatre (AA)Note:AA= Associate of Arts DegreeAS= Associate of Science DegreeAAS= Associate of Applied Science DegreeM= math-based majorC= Certificate1=Dual Degree program with DeKalb Technical <strong>College</strong>2=Teacher Option Available23
Degrees Awarded Summary, FY 1998-<strong>2004</strong>Degrees Awarded by Level and Fiscal Year, <strong>GPC</strong>, FY 1998-<strong>2004</strong>Degree Level 1998 1999 2000 2001 2002 2003 <strong>2004</strong>Associate of Arts (Core Curriculum) 88 117 99 80 91 137 164Associate of Science 787 818 727 635 789 905 1031Associate of Applied Science 34 31 25 19 20 23 16Certificate 7 12 12 9 4 0 8Career Program (Dental Hygiene, Nursing) 178 141 126 117 88 71 99Total 1,094 1,119 989 860 992 1,136 1,318Degrees Awarded, 1998-<strong>2004</strong>1,4001,2001,00080060040020001998 1999 2000 2001 2002 2003 <strong>2004</strong>24
Degrees Awarded by Campus, FY <strong>2004</strong>Degrees Awarded by Campus, <strong>2004</strong>Campus Degrees Awarded# %Clarkston 340 25.8Lawrenceville 431 32.7Dunwoody 413 31.3Decatur 60 4.6Rockdale 74 5.6Total 1,318 100.0Degrees Awarded by Campus, FY <strong>2004</strong>Decatur4.6%Rockdale5.6%Clarkston25.8%Dunwoody31.3%Lawrenceville32.7%25
Degrees Awarded by Ethnicity and Gender, FY <strong>2004</strong>Degrees Awarded by Ethnicity and Gender, <strong>Georgia</strong> <strong>Perimeter</strong> <strong>College</strong>, FY <strong>2004</strong>Female# %Male# %Total# %Asian 60 58.8 42 41.2 102 7.7Black 277 73.5 100 26.5 377 28.6Hispanic 28 65.1 15 34.9 43 3.3Multiracial 29 67.4 14 32.6 43 3.3Native American 1 50.0 1 50.0 2 .2White 481 64.0 270 36.0 751 57.0Grand Total Awarded 876 66.2 442 33.4 1,318 100.0Note: In the “Female” and “Male” gender columns, the percentage represents that particular gender’s proportion in the ethnic group(i.e. 58.8% of all degrees awarded to Asians were received by female Asian students). In the last column, the percent indicates theethnic groups proportion of all degrees awarded (i.e. 28.6% of all degrees awarded were received by Black students).White57.0%Degrees Awarded by Ethnicity, FY <strong>2004</strong>Asian7.7%Male34%Degrees Awarded by Gender, FY <strong>2004</strong>NativeAmerican0.2%Multiracial3.3%Hispanic3.3%Black28.6%Female66%26
Degrees Awarded by Major, FY <strong>2004</strong>Degree Major #Associate of ArtsAACC Anthropology 1AACC Art 3AACC Biology 13AACC Chemistry 5AACC English 22AACC Foreign Language 19AACC Geology 1AACC History 9AACC Journalism 18AACC Mathematics 9AACC Philosophy 2AACC Physics 5AACC Political Science 23AACC Psychology 20AACC Sociology 14AACC Theater 2Total 164Degree Major #Associate of ScienceASCC Art 18ASCC Business Adm. 507ASCC Business Education 1ASCC Computer Science 39ASCC Criminal Justice 1ASCC Engineering 8ASCC General Studies 155ASCC Health & Physical Ed 3ASCC Information Tech. 1ASCC Music 2ASCC Pre-Dentistry 1ASCC Pre-Medicine 16ASCC Pre-Pharmacy 20ASCC Psychology 56ASCC Teacher Education 204Total 1031Career ProgramASDH Dental Hygiene 24ASN Nursing 75Total 99Degree Major #Associate of Applied ScienceAASBC Business & OfficeTechnology 1AASBC ComputerProgramming 1AASBC MicrocomputerSpecialist 2AASFMT Fire Management 3AASHC Medical LaboratoryTechnology 1AASHC ParamedicTechnology 3AASHC Physical TherapistAssistant 1AASSLI Sign Language Interp 11AASTC Network Specialist 1Total 2427
Students Taught by Program by Campus, Fall <strong>2004</strong>Instructional Program Area Alpharetta Clarkston Decatur Dunwoody LawrencevilleRockdaleTotal StudentsEnrolledBusiness 86 649 280 1,357 1,312 327 4,011Dent. Hygiene NA NA NA 68 NA NA 68ENSL # & Foreign21 613 56 809 935 92 2,526LanguagesFine Arts* NA 279 32 236 319 44 910Humanities 224 2,416 921 3,198 3,239 830 10,828Interpreter Training NA 87 NA NA 11 NA 98MATH/Computer182 2,333 1,049 3,110 3,163 687 10,524Science/Engr.Nursing NA 132 NA NA 98 NA 230Physical Education 40 523 293 846 794 235 2,731Science 14 1,185 508 1,728 1,943 194 5,572Social Science 112 1,236 424 1,859 2,159 433 6,223Others: HEDS (<strong>College</strong>NA 128 169 131 107 35 570Success)Others: MILI (Introductionto Army)NA NA NA NA NA NA NATOTAL** 679 9,581 3,732 13,342 14,080 2,877 44,291Note: * Performing Arts students are not included.**The totals are total students enrolled in all programs for each campus/center and <strong>GPC</strong>.28
Continuing and Corporate Education, Fall 2000-<strong>2004</strong>Category 1998 1999 2000 2001 2002 2003 <strong>2004</strong>ProgramsJob Skills Trng 1,181 906 932 984 1,055 1,368 1,153Life Enrichment 219 112 205 176 232 360 224Total 1,400 1,018 1,137 1,160 1,287 1,728 1,377ParticipantsJob Skills Trng 5,483 5,065 4,248 4,106 4,502 5,299 4,756Life Enrichment 1,349 902 1,042 892 1,009 1,260 1,097Total 6,832 5,967 5,290 4,998 5,511 6,559 5,853Continuing Education Untis (CEU)Job Skills Trng 10,216 8,959 7,451 7,969 8,586 9,505 8,740Life Enrichment 1,804 906 1,029 2,301 2,548 2,196 973Total 12,020 9,865 8,480 10,270 11,134 11,701 9,713EFT 200 164 141 171 186 195 161Continuing Education Units, Fall <strong>2004</strong>973Continuing& Corporate Education Activities,Fall <strong>2004</strong>10, 0008, 0006, 0008,7404, 0002, 000Job Skills TrngLife Enrichment-Programs Participants ContinuingEducation Untis(CEU)29
OrganizationAcademicsStudentsFunding & FacilitiesEmployeesStudents<strong>Georgia</strong> Perimter <strong>College</strong>’s enrollment has grown by nearly 5,000 students in three years<strong>Georgia</strong> <strong>Perimeter</strong> <strong>College</strong>
Enrollment Summary I - <strong>GPC</strong> All Campuses, Fall 1998-<strong>2004</strong>On-Campus Student Enrollment1998 1999 2000 2001 2002 2003 <strong>2004</strong>Total HeadcountFull-TimePart-Time14,08535%65%14,09139%61%13,70840%60%15,37242%58%17,57346%54%18,98645%55%20,31645%55%Equivalent Full-Time 8,219 8,253 8,439 9,699 11,551 14,242 15,395On-Campus Student DemographicsHeadcount by Gender: Male5,533 5,606 5,364 5,948 6,617 7,024 7,659FemaleHeadcount by Ethnicity: AsianBlackHispanicMultiracialNative AmericanWhiteOthers: Senior CitizensNon-U.S.Average AgeMedian Age8,5521,0494,372389302307,943161,88125.0228,4851,1904,376480367407,638202,07924.3228,3441,2964,142480438397,313182,10224.1219,4241,4614,978548575457,765312,44324.72210,9561,6775,886648848428,472332,89524.92211,9621,8466,5627551,076518,696373,14525.22212,6571,9527,0178421,246629,197333,32425.423Headcount Enrollment by Ethnicity, Fall <strong>2004</strong>Headcount Enrollment by Gender, Fall <strong>2004</strong>AsianWhiteMaleBlackNativeAmericanMultiracialHispanicFemale33
Enrollment Summary II - <strong>GPC</strong> All Campuses, Fall 1998-<strong>2004</strong>On-Campus Enrollment by Schedule1998 1999 2000 2001 2002 2003 <strong>2004</strong>Day 10,325 11,488 11,330 12,526 14,184 15,345 16,671Evening 6,345 6,699 6,577 7,746 9,101 9,770 10,467Weekend951 2,187 1,983 2,536 2,939 2,867 3,485On-Campus Enrollment by ClassificationLearning Support/Developmental Studies3,270 3,476 3,298 3,821 4,413 4,456 4,823Joint Enrollment 876 905 915 759 660 730 628Freshman4,837 4,939 5,012 5,776 6,727 7,056 11,963Sophomore4,715 4,342 4,078 4,474 5,183 6,276 7,216Transient 202 241 229 301 268 211 219Unclassified185 188 176 241 322 257 290On-Campus New Student Enrollment by ClassificationLearning Support/Developmental Studies 1,633 1,793 1,731 2,295 2,319 2,592 2,677Joint Enrollment 861 884 874 735 634 695 598Freshman720 822 880 802 1,102 2,162 3,312Transfer 702 775 778 907 1,163 499 1,818Transient 84 111 89 136 112 157 127Unclassified73 105 73 108 159 152 147Total 4,073 4,490 4,425 4,983 5,489 6,257 6,861On-Campus Students Needing Learning SupportMath 2,815 2,723 2,680 3,162 3,751 3,771 4,184English 970 1,101 1,055 1,173 1,258 1,247 1,368Reading 781 894 881 825 951 880 948Unduplicated Head Count 3,270 3,476 3,298 3,821 4,413 4,456 4,823On-Campus Student Enrollment by Residence<strong>Georgia</strong> 13,304 13,261 12,706 14,258 16,408 17,802 19,105Out-of-State667 731 894 980 1,009 955 570Non-Resident Tuition Waived 114 99 108 134 156 229 64134
<strong>2004</strong> – <strong>2005</strong> Fact Book Enrollment NoteBeginning with the <strong>2005</strong> – 2006 <strong>Georgia</strong> <strong>Perimeter</strong> <strong>College</strong> Fact Book, the Office of Institutional Research andPlanning will use duplicated enrollment figures for specific campus locations. For the current and previous FactBooks, campus enrollment numbers were determined using a different process. Duplicated enrollments count astudent in the enrollment of any <strong>GPC</strong> location they attend. Conversely, the college’s total (unduplicated)enrollment counts each student only once. There will be additional changes to subsequent Fact Books as weseek to provide you with valuable information about <strong>Georgia</strong> <strong>Perimeter</strong> <strong>College</strong>.35
Enrollment of <strong>GPC</strong> Clarkston, Fall 1998-<strong>2004</strong>On-Campus Student Enrollment1998 1999 2000 2001 2002 2003 <strong>2004</strong>Total HeadcountFull-TimePart-Time5,04536%64%4,93339%61%4,49842%58%4,70943%57%5,20745%55%5,46145%55%5,18537%63%Equivalent Full-Time 2,781 2,588 2,937 3,106 3,518 4,169 4,127On-Campus Student DemographicsHeadcount by Gender: Male1,778 1,786 1,618 1,662 1,827 1,819 1,772FemaleHeadcount by Ethnicity: AsianBlackHispanicMultiracialNative AmericanWhiteOthers: Senior CitizensNon-U.S.Average AgeMedian Age3,2676212,67712413591,47981,17826.2243,1476602,599133151141,376101,19925.9232,8806732,354133154121,17271,17025.5233,0476492,648118191111,092121,15825.8233,3806793,11310624191,05991,27325.8233,6426503,38711629791,002191,27726.1233,4135413,067123331181,105151,17028.326Headcount Enrollment of Clarkston by Gender, Fall <strong>2004</strong>Headcount Enrollment of Clarkston by Ethnicity, Fall <strong>2004</strong>BlackFemaleHispanicMultiracialMaleAsianWhiteNativeAmerican36
Enrollment of <strong>GPC</strong> Clarkston, Fall 1998-<strong>2004</strong> (Continued)On-Campus Enrollment by Schedule1998 1999 2000 2001 2002 2003 <strong>2004</strong>Day 3,954 4,024 3,891 4,047 4,439 4,672 4,332Evening2,124 2,092 2,139 2,283 2,644 2,832 2,312Weekend474 844 805 916 945 952 778On-Campus Enrollment by ClassificationLearning Support/Developmental Studies1,188 1,244 1,127 1,204 1,387 1,436 1,323Joint Enrollment 54 53 30 37 37 57 67Freshman1,539 1,557 1,540 1,625 1,851 1,885 1,669Sophomore2,105 1,945 1,677 1,686 1,786 1,979 1,981Transient 76 72 61 86 66 36 57Unclassified83 62 63 71 80 68 91On-Campus New Student Enrollment by ClassificationLearning Support/Developmental Studies 534 600 563 632 667 798 623Joint Enrollment 52 48 28 33 33 55 60Freshman192 211 235 217 270 489 196Transfer247 267 234 252 293 160 279Transient32 32 29 36 27 24 37Unclassified29 29 24 34 34 38 42Total 1,086 1,187 1,113 1,204 1,324 1,564 1,237On-Campus Students Needing Learning SupportMath 1,032 1,059 947 1,037 1,199 1,221 1,176English 361 362 331 349 399 374 356Reading305 292 266 257 292 295 236Unduplicated Head Count 1,188 1,244 1,127 1,204 1,387 1,436 1,323On-Campus Student Enrollment by Residence<strong>Georgia</strong> 4,645 4,531 4,026 4,329 4,807 5,066 4,881Out-of-State336 343 417 329 333 302 249Non-Resident Tuition Waived 64 59 55 51 67 93 5537
Enrollment of <strong>GPC</strong> Decatur, Fall 1998-<strong>2004</strong>On-Campus Student Enrollment1998 1999 2000 2001 2002 2003 <strong>2004</strong>Total HeadcountFull-TimePart-Time1,14830%70%1,27432%68%1,13733%67%1,37534%66%1,66237%63%1,73236%64%2,20036%64%Equivalent Full-Time 538 547 668 822 1,037 1,266 1,795On-Campus Student DemographicsHeadcount by Gender: Male335364323380 426 467 641FemaleHeadcount by Ethnicity: AsianBlackHispanicMultiracialNative AmericanWhiteOthers: Senior CitizensNon-U.S.Average AgeMedian Age813271,00761728927826.523910201,0851725312427626.023814169811325110125525.522995321,1811137011407425.3221,236511,41120670113212425.5221,265641,47516654108513625.9221,559721,757321062231416227.024Headcount Enrollment of Decatur by Gender, Fall <strong>2004</strong>Headcount Enrollment of Decatur by Ethnicity, Fall <strong>2004</strong>FemaleBlackMaleAsianWhiteNativeAmericanMultiracialHispanic38
Enrollment of <strong>GPC</strong> Decatur, Fall 1998-<strong>2004</strong> (Continued)On-Campus Enrollment by Schedule1998 1999 2000 2001 2002 2003 <strong>2004</strong>Day 891 955 943 1,178 1,408 1,487 1,604Evening 398 551 543 650 813 866 834Weekend47 108 184 328 215 358 145On-Campus Enrollment by ClassificationLearning Support/Developmental Studies 382 517 440 501 625 603 733Joint Enrollment 7 4 8 9 2 10 13Freshman342 352 344 441 535 559 713Sophomore393 372 320 386 460 530 693Transient13 13 18 20 13 11 21Unclassified11 16 7 18 27 19 27On-Campus New Student Enrollment by ClassificationLearning Support/Developmental Studies 179 246 211 262 313 304 367Joint Enrollment 7 4 8 9 2 8 13Freshman14 36 30 34 106 108 75Transfer42 58 50 70 40 42 130Transient6 8 9 8 5 9 15Unclassified2 12 3 9 14 12 14Total 250 364 311 392 480 483 614On-Campus Students Needing Learning SupportMath 316 410 342 386 490 494 613English133 188 165 177 244 228 254Reading121 175 160 163 210 170 209Unduplicated Head Count 382 517 440 501 625 603 733On-Campus Student Enrollment by Residence<strong>Georgia</strong> 1,179 1,235 1,101 1,323 1,587 1,659 2,083Out-of-State25 31 31 41 60 53 95Non-Resident Tuition Waived 4 8 5 11 15 20 2239
Enrollment of <strong>GPC</strong> Dunwoody, Fall 1998-<strong>2004</strong>On-Campus Student Enrollment1998 1999 2000 20012002 2003 <strong>2004</strong>Total HeadcountFull-TimePart-Time4,62037%63%4,79743%57%4,67144%56%14553%47%5,09946%54%27561%39%5,55249%51%37667%33%5,87549%51%30766%34%6,55848%52%39164%36%Equivalent Full-Time 2,569 2,600 3,058 100 3,417 208 3,859 290 4,564 264 5,088 334On Campus Student DemographicsHeadcount by Gender: Male2,076 2,118 2,069 75 2,231 121 2,375 181 2,433 150 2,796 186FemaleHeadcount by Ethnicity: AsianBlackHispanicMultiracialNative AmericanWhiteOthers: Senior CitizensNon-U.S.Average AgeMedian Age2,544350733201108143,214663524.5222,679498868267153182,993687224.1222,602589852271163152,781897424.1227012737111501220.1192,868677959321217192,906131,14824.32215423191312120702822.1203,1777521,153343304202,980201,33924.42219525201310030812722.1203,4428461,364364390232,888131,41924.62215729271224021503521.9203,7628801,592406462333,185131,48725.824Note: For the years 2000 through <strong>2004</strong>, there are two numbers for each category. The first one is for Dunwoody and the second Alpharettarespectively. The two charts are for Dunwoody only.20520301130329702923.221Headcount Enrollment of Dunw oody by Gender, Fall <strong>2004</strong>Headcount Enrollment of Dunw oody by Ethnicity, Fall <strong>2004</strong>AsianFemaleWhiteMaleBlackNativeAmericanMultiracialHispanic40
Enrollment of <strong>GPC</strong> Dunwoody, Fall 1998-<strong>2004</strong> (Continued)On-Campus Enrollment by Schedule1998 1999 2000 2001 2002 2003 <strong>2004</strong>Day3,387 3,768 3,908 145 4,202 274 4,710 376 4,945 307 5,399 391Evening2,259 2,402 2,574 42 2,954 73 3,196 93 3,182 61 3,228 0Weekend 299 713 823 13 914 32 1,025 28 1,051 27 1,219 0On-Campus Enrollment by ClassificationLearning Support/Developmental Studies 1,006 1,033 1,018 20 1,057 53 1,219 128 1,232 79 1,397 123Joint Enrollment 161 137 127 43 136 16 112 12 123 18 158 14Freshman1,661 1,797 1,811 54 2,002 143 2,195 159 2,243 126 2,474 186Sophomore1,640 1,626 1,551 27 1,675 48 1,817 63 2,081 79 2,334 63Transient84 109 88 1 122 11 80 11 74 4 68 2Unclassified68 95 78 0 107 4 129 3 122 1 127 0On-Campus New Student Enrollment by ClassificationLearning Support/Developmental Studies 468 518 502 15 544 34 615 82 718 54 779 82Joint Enrollment 154 129 105 41 122 15 104 12 115 17 136 12Freshman201 293 287 24 312 44 575 31 664 48 346 46Transfer268 310 308 4 372 23 122 28 171 9 412 41Transient35 49 32 0 53 6 35 3 59 3 42 1Unclassified32 55 37 0 48 0 67 2 75 1 61 0Total1,158 1,354 1,271 84 1,451 122 1,518 158 1,802 132 1,776 182On-Campus Students Needing Learning SupportMath883 871 847 15 883 52 1,048 105 1,062 64 1,188 113English248 308 284 6 298 7 331 44 342 26 363 20Reading178 231 261 4 181 5 211 29 219 14 254 18Unduplicated Head Count 1,006 1,033 1,016 20 1,057 53 1,219 128 1,232 79 1,397 123On-Campus Student Enrollment by Residence<strong>Georgia</strong>4,288 4,361 4,101 133 4,482 242 4,876 355 5,198 290 5,846 369Out-of-State284 381 495 11 529 32 552 17 546 14 577 18Non-Resident Tuition Waived 48 55 75 1 88 1 124 4 131 3 135 1Note: For the years 2000 through <strong>2004</strong>, there are two numbers. The first one is for Dunwoody and the second Alpharetta, respectively.41
Enrollment of <strong>GPC</strong> Lawrenceville, Fall 1998-<strong>2004</strong>On-Campus Student Enrollment1998 1999 2000 2001 2002 2003 <strong>2004</strong>Total HeadcountFull-TimePart-Time2,87746%54%3,25249%51%3,27950%50%3,60252%48%4,93355%45%5,63453%47%6,02253%47%Equivalent Full-Time 1,720 1,828 2,196 2,445 3,468 4,482 5,168On-Campus Student DemographicsHeadcount by Gender: Male1,240 1,436 1,406 1,525 2,001 2,259 2,426FemaleHeadcount by Ethnicity: AsianBlackHispanicMultiracialNative AmericanWhiteOthers: Senior CitizensNon-U.S.Average AgeMedian Age1,637124179715132,449016522.8201,81617325312062112,633124322.9201,81623325111810282,567028722.6202,07727830312611362,776032122.7202,932461562205233143,458256423.2213,375543703291303143,780273523.5213,596630802306338153,931276724.522Headcount Enrollment of Law renceville by Gender, Fall <strong>2004</strong>Headcount Enrollment of Lawrenceville by Ethnicity, Fall <strong>2004</strong>FemaleWhiteAsianMaleNative American HispanicMultiracialBlack42
Enrollment of <strong>GPC</strong> Lawrenceville, Fall 1998-<strong>2004</strong> (Continued)On-Campus Enrollment by Schedule1998 1999 2000 2001 2002 2003 <strong>2004</strong>Day 2,189 2,643 2,575 3,042 4,145 4,772 5,382Evening1,300 1,617 1,823 1,956 2,874 3,318 3,557Weekend132 506 546 718 1,052 1,007 1,221On-Campus Enrollment by ClassificationLearning Support/Developmental Studies626 711 769 892 1,059 1,031 1,201Joint Enrollment 124 146 107 130 192 188 211Freshman1,255 1,401 1,368 1,518 2,086 2,262 2,341Sophomore818 929 965 1,001 1,455 2,042 2,151Transient 34 45 45 42 72 57 68Unclassified20 20 25 19 69 54 50On-Campus New Student Enrollment by ClassificationLearning Support/Developmental Studies 398 435 459 587 642 666 765Joint Enrollment 118 142 97 128 182 182 204Freshman300 296 329 241 719 806 626Transfer149 197 188 284 115 149 310Transient14 15 12 17 31 43 33Unclassified8 9 8 5 33 32 23Total 987 1,094 1,093 1,262 1,722 1,878 1,961On-Campus Students Needing Learning SupportMath 521 555 577 736 897 858 1,030English228 259 297 294 289 282 351Reading167 207 222 202 226 186 221Unduplicated Head Count 626 711 769 892 1,059 1,031 1,201On-Campus Student Enrollment by Residence<strong>Georgia</strong> 2,791 3,164 3,186 3,498 4,760 5,458 5,843Out-of-State74 78 83 96 160 150 164Non-Resident Tuition Waived 12 10 10 8 13 26 1543
Enrollment of <strong>GPC</strong> Rockdale, Fall 1998-<strong>2004</strong>On-Campus Student Enrollment1998 1999 2000 2001 2002 2003 <strong>2004</strong>Total HeadcountFull-TimePart-Time68936%64%75739%61%81740%60%90844%56%1,17947%53%1,23342%58%1,29141%59%Equivalent Full-Time 356 354 501 582 767 909 1,034On-Campus Student DemographicsHeadcount by Gender: Male245276247281 350 372 418FemaleHeadcount by Ethnicity: AsianBlackHispanicMultiracialNative AmericanWhiteOthers: Senior CitizensNon-U.S.Average AgeMedian Age444117665358801724.92248111116139360513024.721570131191511365611924.721627121451021371722224.421829163011639080723924.821861183342056380203724.721873142643051193112925.722Headcount Enrollment of Rockdale by Gender, Fall <strong>2004</strong>Headcount Enrollment of Rockdale by Ethnicity, Fall <strong>2004</strong>WhiteFemaleAsianMaleNative AmericanMultiracialBlackHispanic44
Enrollment of <strong>GPC</strong> Rockdale, Fall 1998-<strong>2004</strong> (Continued)On-Campus Enrollment by Schedule1998 1999 2000 2001 2002 2003 <strong>2004</strong>Day 422 517 602 677 878 916 1,029Evening420 439 545 665 806 839 902Weekend0 16 54 56 32 44 122On-Campus Enrollment by ClassificationLearning Support/Developmental Studies 176 193 213 266 326 322 312Joint Enrollment 15 13 8 22 37 57 102Freshman267 314 350 367 464 471 455Sophomore223 231 231 232 322 368 408Transient5 4 10 12 11 12 7Unclassified3 2 5 9 19 3 7On-Campus New Student Enrollment by ClassificationLearning Support/Developmental Studies 100 105 125 166 198 206 208Joint Enrollment 15 13 7 21 36 55 99Freshman42 47 61 67 113 140 87Transfer33 31 47 50 26 23 56Transient1 3 5 6 4 9 4Unclassified2 1 2 2 6 3 2Total 193 200 247 311 383 436 456On-Campus Students Needing Learning SupportMath 151 163 163 212 276 268 277English30 47 68 82 79 92 91Reading37 36 54 50 77 68 55Unduplicated Head Count 176 193 213 266 326 322 312On-Campus Student Enrollment by Residence<strong>Georgia</strong> 684 743 801 893 1,147 1,216 1,275Out-of-State3 14 15 15 29 11 13Non-Resident Tuition Waived 2 0 1 0 3 6 345
Enrollment of <strong>GPC</strong> Off-Campus/Distance Ed., Fall 1998-<strong>2004</strong>Off-Campus/Distance Education Student Enrollment1998 1999 2000 2001 2002 2003 <strong>2004</strong>Total HeadcountFull-TimePart-Time1,03119%81%1,51741%59%1,37644%56%1,72132%68%1,96139%61%1,89633%67%1,83931%69%Equivalent Full-Time 255 337 909 971 1,209 1,270 1,248Off-Campus/Distance Education Student DemographicsHeadcount by Gender: Male326 554462567607 586 515FemaleHeadcount by Ethnicity: AsianBlackHispanicMultiracialNative AmericanWhiteOthers: Senior CitizensNon-U.S.Average AgeMedian Age705532061413072705322.61896396302232721,067112223.32091411140733313791015126.3221,15480460436041,074112224.5221,35496571439761,148015725.6231,31087589459931,073015326.0241,324965604110651,031015526.223Headcount Enrollment of Off-Campus by GenderHeadcount Enrollment of Off-Campus by EthnicityAsianFemaleWhiteBlackMaleNativeAmericanMultiracialHispanic46
Enrollment of <strong>GPC</strong> Off-Campus/Distance Ed., Fall 98-04 (Continued)Off-Campus/Distance Education Enrollment by Schedule1998 1999 2000 2001 2002 2003 <strong>2004</strong>Day 0 NA 966 1,198 1,152 899 990Evening 25 NA 711 588 777 679 768Weekend 0 NA 292 256 346 248 291Off-Campus/Distance Education Enrollment by ClassificationLearning Support/Developmental Studies 59 106 149 103 242 206 230Joint Enrollment 543 585 NA 447 296 299 117Freshman 158 309 479 404 534 465 532Sophomore 253 462 674 695 796 880 876Transient 12 37 39 35 53 39 44Unclassified 6 18 21 37 40 35 40Off-Campus/Distance Education New Student Enrollment by ClassificationLearning Support/Developmental Studies 16 39 60 39 91 89 112Joint Enrollment 542 581 11 440 290 284 115Freshman 9 25 38 22 90 85 87Transfer 21 41 91 79 44 60 96Transient 6 19 19 14 21 26 29Unclassified 2 9 5 19 27 24 24Total 596 714 224 613 563 568 463Off-Campus/Distance Education Students Needing Learning SupportMath 57 97 126 93 233 197 222English 6 8 20 12 27 15 29Reading 0 9 16 6 15 6 16Unduplicated Head Count 59 106 149 103 242 206 230Off-Campus/Distance Education Student Enrollment by Residence<strong>Georgia</strong> 1,007 1,461 1,280 1,668 1,892 1,817 1,735Out-of-State 20 52 84 47 54 63 91Non-Resident Tuition Waived 4 4 12 6 15 16 1347
Enrollment by Age Group, Fall 2000-<strong>2004</strong>; and by County, Fall <strong>2004</strong>Enrollment by Age Group, Fall 2000 to <strong>2004</strong>2000 2001 2002 2003 <strong>2004</strong>Under 18 633 511 511 727 45318-19 2,934 3,297 3,672 4,000 4,12820-21 3,436 3,766 4,204 4,263 4,49522-24 2,445 2,886 3,292 3,371 3,84025-29 1,927 2,109 2,533 2,716 3,10730-34 988 1,230 1,418 1,697 1,79535-39 642 731 894 981 1,07240-49 555 672 833 975 1,13950-64 137 149 191 230 25665 + 11 21 25 26 31Total 13,708 15,372 17,573 18,986 20,316Enrollment by County, Fall <strong>2004</strong>County Enrollment *PercentCherokee 124 .6Clarke 37 .2Clayton 391 1.9Cobb 693 3.4DeKalb 4,041 19.9Douglas 50 .2Fayette 55 .3Forsyth 202 1.0Fulton 2,472 12.2Gwinnett 5,459 26.9Henry 200 1.0Newton 422 2.1Rockdale 742 3.7Walton 327 1.6Others in State 489 2.4Out of State 4,612 22.7Total 20,316 100.0*Percentages may not sum to 100.0 due to rounding.Enrollment by Age Group, Fall <strong>2004</strong> Enrollment by County, Fall <strong>2004</strong>540048004200360030002400180012006000< 18 18-19 20-21 22-24 25-29 30-34 35-39 40-49 50-64 65 +Out of StateGw innettCobbDeKalbFulton48
High Schools Attended by 100 or More Students in Fall <strong>2004</strong>(This table is continued on the next page)High School Total Fall Enrollment New Student Enrollment Enrollment of New HS Grads2003 <strong>2004</strong> 2003 <strong>2004</strong> 2003 <strong>2004</strong>DeKalb Clarkston 132 147 34 21 23 20Cedar Grove 132 130 32 11 13 9Chamblee 126 127 45 20 17 10Columbia 130 128 25 12 11 7Cross Keys 135 121 23 17 14 12Druid Hills 123 143 27 16 17 13Dunwoody 200 190 70 14 13 6Lakeside 187 172 46 22 20 14Lithonia 162 151 52 24 28 17McNair 107 111 21 8 6 3Open Campus 189 189 33 19 16 11Redan 182 188 33 15 8 6Southwest DeKalb 176 188 45 31 NA 14Stephenson 148 142 62 35 34 24Stone Mountain 144 135 26 16 14 9Towers 101 113 26 18 15 11Tucker 170 165 43 22 22 17Fulton Chattahoochee/Crestwood 167 187 46 29 28 21Milton 250 283 142 25 23 13North Springs 149 141 80 12 12 7Roswell 112 120 22 10 10 6Gwinnett Berkmar 317 313 73 50 41 35Brookwood 416 448 134 75 75 56Centennial 111 116 42 25 22 18Central Gwinnett 297 313 83 60 NA 50Collins Hill 533 612 179 111 130 94Dacula 283 325 108 62 79 54Duluth 305 308 119 61 68 48Meadowcreek 288 284 57 41 46 33Norcross 228 254 71 36 40 23North Gwinnett 176 214 68 40 45 32Parkview 308 352 77 46 45 31Phoenix (Open Campus) 244 271 52 39 32 24Shiloh 248 300 73 45 36 27South Gwinnett 348 349 87 52 56 39Newton Newton County Comp. 156 173 44 20 23 162003 <strong>2004</strong> 2003 <strong>2004</strong> 2003 <strong>2004</strong>49
High School Total Fall Enrollment New Student Enrollment Enrollment of New HS GradsRockdale Heritage 190 199 83 26 17 12Rockdale 174 189 55 22 26 19Salem High School 160 152 63 23 28 15Walton Faith Academy 116 147 23 13 4 2Grayson 111 172 72 35 51 28Loganville 141 170 45 26 31 22Note: All numbers are High School students attending <strong>GPC</strong>. “New High School Grad” refers to a student new to <strong>GPC</strong> and newlygraduated from High School. Table includes high schools that enrolled 100 or more students to <strong>GPC</strong> in Fall <strong>2004</strong>.50
International Student Enrollment I, Fall 2001-<strong>2004</strong>Country 01 02 03 04 Country 01 02 03 04 Country 01 02 03 04Afghanistan5 10 10 14 Canada 49 63 53 58 Ghana 19 28 40 45Albania 3 4 4 7 Cape Verde 1 NA NA NA Greece 2 1 1 3Algeria 3 3 2 1 Central Africa NA 1 1 NA Grenada 1 NA NA 1Angola 2 1 2 NA Chad 1 1 NA 1 Guatemala 8 6 6 7Antigua 1 1 2 2 Chile 4 5 5 4 Guinea 8 11 7 5Argentina 4 4 9 12 China 37 51 67 65 Guyana 19 27 26 32Armenia 2 1 2 1 Colombia 88 102 102 128 Haiti 28 34 42 45Aruba NA NA NA 3 Congo/Brazzaville 9 7 11 18 Honduras 5 5 11 12Australia 5 6 5 7 Congo/Kinshasa NA 4 4 2 Hong Kong 15 18 15 13Austria 6 5 2 NA Coral Sea Island NA NA NA NA Hungary 1 2 4 7Azerbaijan 1 1 1 1 Costa Rica 5 4 4 3 India 145 170 194 190Bahamas 6 9 13 14 Cote D’Ivoire NA NA NA 24 Indonesia 34 36 34 31Bahrain NA 1 3 3 Croatia 3 3 4 13 Iran 53 74 105 93Bangladesh 34 39 32 32 Cuba 2 7 10 6 Iraq 5 4 3 3Barbados 5 3 3 6 Czech Rep. 1 1 3 5 Ireland 2 4 4 4Belarus 9 9 6 7 Czechoslovakia 6 4 5 1 Israel 8 10 9 7Belgium 5 3 2 NA Denmark NA 1 1 3 Italy 2 2 1 7Belize 1 2 3 1 Djibouti 1 1 2 NA Ivory Coast 16 19 17 NABenin 3 4 2 2 Dominica 4 6 9 3 Jamaica 113 126 129 138Bermuda 2 6 4 7 Dominican Republic 6 5 11 10 Japan 33 27 35 38Bolivia 2 4 4 3 Ecuador 3 10 8 10 Jordan 3 4 3 2Bosnia/Herzeg 47 81 68 86 Egypt NA 2 3 4 Kazakhstan 1 1 1 NABotswana 1 1 2 NA El Salvador 11 14 13 10 Kenya 15 19 22 25Bouvet Island 1 NA NA NA Eritrea 16 16 13 17 Kiribati 1 NA 1 1Brazil 34 32 39 47 Estonia NA 3 3 2 Korea, DPR 2 3 3 1British Virgin Islands NA NA 1 1 Ethiopia 108 144 169 208 Korea, R 198 200 227 229Bulgaria 4 10 24 20 Finland2 NA NA NA KuwaitNA NA 3 1Burkina Faso2 3 2 1 France1511 17 18 Laos9 9 8 7Burma5 8 118 Gabon 1 NA NA NA Latvia 6 2 NA 2Burundi NA 1 1 2 Gambia 8 5 6 5 Lebanon 13 10 6 5Cambodia 8 12 7 8 <strong>Georgia</strong> NA NA 1 2 Liberia 35 34 30 41Cameroon 17 39 52 52 Germany NA NA 2 18 Liechtenstein 1 NA NA NA51
International Student Enrollment II, Fall 2001-<strong>2004</strong>Country 01 02 03 04 Country 01 02 03 04 Country 01 02 03 04Lithuania4 7 7 6 Philippines 14 19 27 35 Swaziland NA NA 4 3Macau NA NA NA NA Poland 10 23 26 36 Tanzania 10 2 4 2Macedonia 1 NA NA NA Portugal 1 1 2 3 Thailand 21 24 21 22Malawi NA 2 1 NA Romania 33 30 40 46 Togo 2 2 1 8Malaysia 12 13 13 17 Russia 35 32 37 38 Trinidad/Tobago 34 33 33 34Mali 4 3 2 7 Rwanda 3 2 3 4 Tunisia 1 2 3 NAMalta NA 1 1 1 Saudi Arabia 4 6 7 3 Turkmenistan NA 1 1 1Mauritius 1 2 2 1 Senegal 13 15 14 9 Turkey 14 13 9 12Mexico 36 53 66 74 Serbia NA NA 1 1 Turks & Caicos NA NA 1 NAIslandsMoldova 3 2 1 3 Seychelles 1 NA NA NA Uganda 1 NA NA 2Mongolia NA 1 NA NA Sierra Leone NA 19 25 29 Ukraine 5 9 13 16Morocco 14 14 9 6 Slovakia 1 NA 2 3 United Arab Emirates NA 1 NA NAMozambique NA NA 1 1 Somalia 38 51 67 57 United Kingdom 37 45 46 41Nepal 2 4 3 5 South Africa 22 23 21 22 Uruguay 1 2 3 2Netherlands 5 1 3 3 Spain 5 3 5 4 Uzbekistan NA 3 4 6Netherlands Ant 1 1 2 NA Sri Lanka 1 1 3 3 Venezuela 22 24 30 25New Zealand NA 1 NA NA St. Kitts & Nevis 3 1 4 NA Vietnam 265 326 324 290Nicaragua 5 6 7 7 St. Lucia NA 1 2 NA West Germany 19 21 12 NANiger NA 1 2 4 St. Vincent NA NA 1 NA Yemen NA 1 7 NANigeria 129 166 182 206 Sudan 12 17 23 35 Yugoslavia 5 7 NA 8Niue 1 1 NA NA Suriname 1 1 NA 2 Zambia 3 3 5 7Norway 1 1 2 1 Sweden 8 9 7 3 Zimbabwe7 12 11 7Pakistan 69 78 76 77 Switzerland NA NA NA 2Panama 9 11 9 12 Syria 3 6 7 6 Total Students 2,428 2,895 3,145 3,324Paraguay1 1 1 NA Taiwan 59 49 42 38 Total Countries 138 145 147 146Peru 15 24 25 31 Tajikistan 1 1 NA 1 or Regions52
Retention Rate, Fall 2003 Cohort; Enrollment by Class Size, FY 1998-04InstitutionFirst-Year Retention Rate, Fall <strong>2004</strong>First-Time, Full-Time FreshmenInstitution- System-WideSpecific RateRateTotalFreshmenTotalFreshmenAll First-Time FreshmenInstitution-SpecificRateSystem-WideRate<strong>GPC</strong> 2,158 68.8% 72.9% 3,244 63.8% 67.3%Two-Year <strong>College</strong> Total 8,900 63.3% 69.4% 11,609 60.4% 65.7%System Total 35,020 75.2% 80.8% 13,333 60.4% 65.6%Source: Board of Regents, Graduation and Retention Report (http://www.usg.edu/sra/students/grad_ret/retention.phtml)Enrollment Percentage by Class Size, FY 1998-<strong>2004</strong>Class Size FY 98 FY 99 FY 00 FY 01 FY 02 FY03 FY041-10 students 17.7% 19.2% 14.5% 13.5% 7.5% 11.5% 9.2%11-20 students 41.9% 40.8% 38.0% 21.7% 32.9% 29.8% 31.0%21-30 students 29.4% 28.5% 32.8% 40.3% 41.5% 41.8% 42.8%31-40 students 9.9% 10.2% 12.7% 18.1% 15.7% 14.7% 14.8%41-50 students 0.5% 0.6% 1.0% 5.0% 1.3% 1.4% 1.4%Over 50 students 0.6% 0.7% 1.0% 1.4% 1.1% 1.0% 0.8%90.00%80.00%70.00%60.00%50.00%40.00%30.00%20.00%10.00%0.00%First-Year Retention Rate, Fall 2003-04Inst-Specific Sys-Wide Inst-Specific Sys-WideFirst-Time, Full-TimeFreshmenAll First-Time<strong>GPC</strong> 2-yr <strong>College</strong> USGEnrollment Percentage by Class Size, FY0431-40students21-30students41-50studentsOver 50students1-10 students11-20students53
Student Financial Aid Awarded by Source, FY 2000-<strong>2004</strong>AwardsFY 2000Student # $ AmountFY 2001Student # $ AmountFY 2002Student # $ AmountFY 2003Student # $ AmountFY <strong>2004</strong>Student # $ AmountGRANTSPell 3,717 5,898,089 6,039 6,393,4054,746 9,190,456 6,195 12,813,372 7,028 14,224,888SEOG 992 322,349 538 247,137 756 288,267 1,046 330,008 1,436 420,250<strong>Georgia</strong> Incentive N/A N/A N/A N/A N/A N/A NA NA 221 59,906HOPE 6,346 3,283,802 4,184 3,765,968 4,290 4,354,052 5,538 7,101,087 5,833 7,872,325LOANSInstitutional N/A N/A N/A N/A 165 47,677 0 0 0 0Regents N/A N/A N/A N/A N/A N/A N/A N/A N/A N/APLUS 1 1,637 0 0 0 0 0 0 11 37,654Subsidized 1,315 2,856,001 1,342 2,813,730 1,557 3,191,923 2,829 5,875,600 3,338 6,834,070Unsubsidized 945 2,327,305 966 2,297,532 1,155 2,837,175 1,838 4,398,974 2,556 6,047,013SCHOLARSHIPSInstitutional 430 170,668 486 304,325 288 222,574 315 327,825 193 207,787Other 98 142,210 42 14,362 41 60,947 205 190,963 363 219,296STUDENT EMPLOYMENT<strong>College</strong> Work Study 129 310,370 113 547,787 192 485,938 158 289,028 210 386,591TOTAL AWARDED 13,973 15,312,431 13,710 16,384,246 13,190 20,679,009 18,124 31,326,857 21,189 36,309,78054
Entering Freshman SAT, Fall 2000-04; Regents’ Test, Fall 04Average Composite Scores, Entering Freshmen, Fall 2000 – <strong>2004</strong>2000 2001 2002 2003 <strong>2004</strong><strong>Georgia</strong> <strong>Perimeter</strong> <strong>College</strong> 881 893 889 902 910Two-year <strong>College</strong> Totals 878 884 888 898 904University System of <strong>Georgia</strong> 1,021 1,026 1,030 1,036 1,042Note: 1. This table includes only those freshmen who attended at least five quarter credit hours by Spring quarter for cohorts through 1996 orthree semester hours for FY 1999 on and after.2. The composite score is derived by summing the SAT verbal score and the SAT math score. The possible range for SATV and SATM is200 to 800; the possible composite score range is 400 to 1600.3. Included are students with missing data on SAT, such as students with GEDs, those admitted into programs that do not requireSAT scores, and those who were admitted based on ACT scores.Source: Office of Strategic Research and Analysis website (www.usg.edu/sra), University System of <strong>Georgia</strong>, Atlanta, <strong>Georgia</strong>.Regents’ Test Passing Rates, Summer <strong>2004</strong>First-Timer**Repeater**Reading Essay Reading EssayNo. % Pass No. % Pass No. % Pass No. % Pass<strong>Georgia</strong> <strong>Perimeter</strong> <strong>College</strong> 859 65.4 917 81.5 508 32.9 243 67.5Two-Year <strong>College</strong>s 1,830 69.5 2,111 83.7 971 35.2 477 70.7System Total* 4,463 74.4 5,800 85.2 2,424 39.6 1,467 69.9Note: * “System Total” numbers are generated based on all USG institutions, including all research universities, regional universities, stateuniversities and colleges, and two-year colleges. The numbers for the two-year college group are not available.** The BOR Repeater report is in a different data format from the First-Timer format. The data formats reported in this table are followingthe BOR formats.Source: Regents’ Testing Program Passing Rates for Examinees Repeating the Test Summer Semester <strong>2004</strong>. Office ofStrategic Research and Analysis, University System of <strong>Georgia</strong>, Atlanta.55
Applications Received, Fall 2000-04; Testing Activities, Fall 2000-04Applications Received, Fall 2000-042000 2001 2002 2003 <strong>2004</strong>Applications Received # % # % # % # % # %Total App. Received 13,756 100 15,307 100 18,549 100 18,543 100 18,419 100Completed Files 8,289 60 9,345 61 10,998 59 10,823 58 11,750 64Completed – Registered 5,149 37 5,845 38 6,599 36 5,926 31 7,174 39Completed – Unregistered 3,140 23 3,500 23 4,399 24 4,897 26 4,576 25Incomplete Files 5,467 40 5,962 39 7,551 41 7,720 41 6,669 36Testing Activities, Fall 2000-04Tests Administered 2000 2001 2002 2003 <strong>2004</strong>ACT 89 140 152 347 214Alternate Regents' 334 434 520 388 *BSE/CPE-Exit 2,839 1,045 54 3 78BSE/CPE-Placement 4,656 3,192 146 16 8CLEP 136 132 58 273 393COMPASS 2,835 6,545 12,627 13,490 15,313Dental Hygiene Board 25 22 22 27 31English as a Second Language Placement809 672 1,141 1,192 1,352(ENSL)Independent Study 26 33 25 262 452Institutional SAT 970 1,269 1,494 1,161 588Regents' Test 5,520 7,260 7,875 10,810 10,776SAT I and II Assessment Tests 901 1,269 845 1,201 1,045Test of English as a Foreign Language962 691 868 894 1,118(TOEFL)Residual ACT NA 21 25 4 113Total 20,102 22,725 25,852 30,068 28,134* Note: Changes have been made to the reporting format of Regents’ Testing Data.56
Semester Credit Hour Report, <strong>GPC</strong> & USG FY 03-05FY 2003 FY <strong>2004</strong> FY <strong>2005</strong>Summer Fall Spring Summer Fall Spring Summer Fall Spring<strong>Georgia</strong> <strong>Perimeter</strong><strong>College</strong> 70,085 173,714 180,719 78,244 185,837 191,323 77,079 202,366 191,001USG Two-year<strong>College</strong>s 167,592 468,082 465,815 186,501 515,677 505,837 192,803 553,595 521,289USG Grand Totals828,050 2,659,304 2,573,003 878,824 2,827,266 2,702,562 891,212 2,886,888 2,732,620Source: Office of Strategic Research and Analysis website, www.usg.edu/sra/datasys/cir/census/, UniversitySystem of <strong>Georgia</strong>, Atlanta, <strong>Georgia</strong>.Note: The following two charts show data for fall semesters, not whole fiscal years.Semester Credit Hour Product, <strong>GPC</strong>, Fall 02-04 SCH Production, <strong>GPC</strong> & USG 2-Year <strong>College</strong>s, Fall 04200,000180,000160,000140,000120,000100,00080,00060,00040,00020,0000FY 02 FY 03 FY 04USG 2-year<strong>College</strong>s<strong>GPC</strong>57
Comparison with Other USG Two-Year <strong>College</strong>s, Fall <strong>2004</strong>InstitutionHeadcountEnrollmentFTE Non-White%Female%GAResidents%Freshmen%NewFreshmen%Abraham Baldwin Agricultural3,362 2,849 21.3 57.7 96.1 58.3 29.4<strong>College</strong>Atlanta Metropolitan <strong>College</strong> 1,802 1,382 98.8 65.1 91.0 67.3 15.5Bainbridge <strong>College</strong> 2,620 1,979 51.5 69.8 99.2 57.6 13.4Coastal <strong>Georgia</strong> Community2,879 2,032 32.5 67.2 94.8 62.0 21.8<strong>College</strong>Darton <strong>College</strong> 4,126 3,088 46.6 72.4 97.3 59.5 20.9East <strong>Georgia</strong> <strong>College</strong> 1,318 1,142 35.1 60.1 99.2 77.2 30.3Floyd <strong>College</strong> 3,416 2,724 16.4 65.3 97.7 64.8 23.4Gainesville <strong>College</strong> 5,781 4,787 12.7 54.8 97.2 61.8 25.3<strong>Georgia</strong> <strong>Perimeter</strong> <strong>College</strong> 20,316 15,395 54.7 62.3 94.0 58.9 16.3Gordon <strong>College</strong> 3,449 2,959 31.3 65.6 98.9 67.4 31.0Middle <strong>Georgia</strong> <strong>College</strong> 2,627 2,189 37.7 60.8 98.4 64.2 28.5South <strong>Georgia</strong> <strong>College</strong> 1,443 1,213 29.8 65.1 97.7 64.0 29.5Waycross <strong>College</strong> 1,005 663 26.3 68.0 99.4 54.0 18.1Two-Year <strong>College</strong>s Total 54,144 42,402 41.3 63.2 96.0 61.3 21.3Source: Office of Strategic Research and Analysis website (www.usg.edu/sra/), University System of <strong>Georgia</strong>, Atlanta, <strong>Georgia</strong>.Headcount Enrollment, <strong>GPC</strong> & USG 2-Yr <strong>College</strong>s, Fall <strong>2004</strong>FTE for <strong>GPC</strong> & USG 2-Year <strong>College</strong>s, Fall <strong>2004</strong>USG 2-Yr<strong>College</strong>s<strong>GPC</strong>USG 2-Yr<strong>College</strong>s<strong>GPC</strong>58
Athletics, <strong>2004</strong>-<strong>2005</strong>Director of Athletics: Greg N. WardColors: Maroon, GoldAffiliation: National Junior <strong>College</strong> Athletic AssociationMascot: JaguarConference: <strong>Georgia</strong> Junior <strong>College</strong> Athletic AssociationRECENT ACCOMPLISHMENTSBaseballHead Coach: Ted WallenAssistant Coach: Chad Huff• Two players drafted in <strong>2005</strong> Major League Draft.• One player selected as NJCAA All-American in <strong>2005</strong>SoftballHead Coach: Ed SchutteAssistant Coach: Pam Frey• Finished third in <strong>2005</strong> GJCAA Conference Tournament.• Won 34 games in <strong>2005</strong> season, most in last ten years.Basketball (Men's)Head Coach: Alfred BarneyAssistant Coach: David Dennis• <strong>2005</strong> GJCAA Conference Tournament runner-up.• One player selected as NJCAA All-American and foursophomores signed with Division I schools.• Won six of the last eight conference championships.Basketball (Women's)Head Coach: James WaldonAssistant Coach: Christina ShaferAssistant Coach: Donald Moore, Jr.• Won <strong>2005</strong> GJCAA regular season and conferencetournament.• Earned first trip to NJCAA national tournament in <strong>2005</strong>.• Finished <strong>2005</strong> season with best record 26-5 in program’shistory.Soccer (Men's)Head Coach: Marc ZagaraAssistant Coach: Ron Moore• Won <strong>2004</strong> GJCAA conference tournament and SoutheastDistrict game.• <strong>2004</strong> National Tournament Runner-up• Finished <strong>2004</strong> season with the best record 22-2-1 since1994Soccer (Women's)Head Coach: Jessica RiggsAssistant Coach: Franklin LawsonAssistant Coach: Bruno Kalonji• Finished third in the conference in 2002 with a program high12 wins.Tennis (Men's)Head Coach: Solomon Demeke• Finished 2 nd place at NJCAA National Tournament in <strong>2005</strong>.• Won <strong>2005</strong> GJCAA Conference ChampionshipTennis (Women's)Head Coach: Elaine Bryan• Will move to <strong>GPC</strong>’s Clarkston campus beginning in 2006.59
Students with Disabilities, from 2000 - <strong>2005</strong>00-01 01-02 02-03 03-04 04-05Visual 8 9 10 17 18Deaf/Hard of Hearing 20 26 23 25 23Brain Injury 15 15 16 22 19Motor/Mobility 12 23 15 18 14Psychological/Psychiatric 9 22 24 39 42Learning Disability 115 130 89 97 80Attention Deficit Hyperactivity Disorder (ADHD) 61 70 53 54 52Both LD/ADHD 12 39 16 26 20Chronic Illness/Medical 10 13 21 30 33Multiple Disabilities 11 24 15 4 12Other 8 20 0 6 15TOTAL 281 391 300 338 328Source:Note:<strong>Georgia</strong> <strong>Perimeter</strong> <strong>College</strong> Office of Disability Services, as reported to Board of Regents of the UniversitySystem of <strong>Georgia</strong>.Reporting year begins in Summer and ends with Spring semester. Table shows number of students forwhom accommodations or services were provided.60
OrganizationAcademicsStudentsFunding & FacilitiesEmployeesFunding&Facilities<strong>Georgia</strong> <strong>Perimeter</strong> <strong>College</strong>’s tuition and fees equal 30% of its annual budget<strong>Georgia</strong> <strong>Perimeter</strong> <strong>College</strong>
Student Tuition and Fees, FY 2006Tuition (per hour)In-State $65.00Out-of-State $257.00Distance Learning $92.00Required FeesAdmission Application $20.00Athletic Fee $27.00Parking $18.00Student Activity $42.00Technology $50.00Special FeesApplied Music (per hour) $75.00Dental Hygiene Lab/Insurance $50.00Health Information Technology Insurance $8.00Late Registration Fee $38.00Nursing Lab/Insurance $156.00Science Lab $30.00International Student Health Insurance (F1 Visa only) $315.00Tuition and Fees<strong>Georgia</strong> <strong>Perimeter</strong> <strong>College</strong> students are responsible fortuition and fees which are set each year. Fees includestudent activity, athletic, parking, technology, and otherspecial fees. Tuition and fees are due each semester at thetime of registration. Registration is not complete until allfees are paid. Payment may be in cash, by check payablein U.S. currency, or with a Visa or Mastercard, AmericanExpress or Discover. The <strong>College</strong> will withhold copies oftranscripts and other student records and/or revoke theenrollment of students who owe the <strong>College</strong> money. Feesand expenses are subject to change without notice.Most fees are assessed for on-campus students only.Instruction delivered at Clarkston, Lawrenceville,Dunwoody, Decatur and Rockdale is considered oncampus.Instruction by distance education and courses atother locations are considered off-campus.The precise amount of a student’s fees for a semesterdepends upon a number of factors:• The number of courses taken• The nature of the courses• The location at which the courses are taught• The number of credit hours assigned to the courses• The residence status of the studentIt is the responsibility of the student to be informed of andobserve all regulations and procedures regarding thepayment of fees and the entitlement of refunds.63
Revenues and Expenditures Per Student, FY 2001-<strong>2005</strong>Revenues FY01 FY02 FY03 FY04 Budget FY 05Tuition and Fees $20,312,710 $22,426,814 $27,368,986 $34,554,728* $34,354,750State/Local Appropriations 44,571,384 48,101,913 47,783,503 49,797,569 57,229,687Other Income 479,789 272,121 1,657,943 354,645 1,234,060Departmental Sales & Services 995,080 2,057,692 2,468,006 1,915,873 3,200,000Sponsored Operations 12,215,133 10,689,716 14,927,507 16,964,971 17,500,000Total Revenues $78,574,096 $83,548,256 $94,205,945 $103,587,785 $113,518,497Expenditure Per Student FY01 FY02 FY03EFT Students 9,802 11,180 13,225 14,242 15,395Expenditure per EFT Student(excluding sponsored)$6,770 $6,517 $5,993 6,080 6,237* In FY04, the college changed the reporting of revenue to comply with GASB35 governmental accounting standards.64
Budget Allocations, FY 2001-<strong>2005</strong>Allocations FY01 FY02 FY03 FY04 FY05 BudgetInstruction $33,909,782 $36,375,102 $39,943,494 $44,546,352 44,567,967Public Service 84,337 87,752 20,743 848 1,000Academic Support 7,308,239 7,244,549 7,479,820 8,272,522 10,838,115Student Services 6,007,547 6,307,200 6,404,072 7,277,684 9,445,717Institutional Support 12,144,366 13,149,522 14,203,607 16,100,005 17,871,006Plant Operations 6,904,692 7,499,219 8,862,533 8,491,529 10,094,692Departmental Sales & Services NA 2,201,592 2,348,358 1,889,818 3,200,000Sponsored Operations 12,155,452 10,689,716 14,915,818 16,422,069 17,500,000Total Allocations $78,514,415 $83,554,652 $94,178,445 $103,018,828 $113,518,49765
Library Collections, FY 2000-<strong>2004</strong>Library Collections FY00 FY01 FY02 FY03 FY04HoldingsPaper Volumes 211,844 232,246 216,359 220,520 239,288Paper Titles 158,125 179,449 157,666 171,816 NASerial Subscriptions 2,032 1,681 1,303 1,062 1,018Number of Microforms 36,511 38,073 34,618 35,270 37,611Electronic Titles NA NA NA NA NAExpendituresMaterials: Paper & Microforms $249,748 $255,609 $274,242 $203,152 $267,044Current Serial: Paper & Microforms $155,647 $154,263 $155,647 $119,848 $104,996Audio-Visual Materials $24,494 $33,034 $24,494 $22,712 $35,930CirculationGeneral Collection 69,472 47,214 54,278 63,245 67,623Reserve Collection NA 6,525 8,788 13,351 17,838Interlibrary LoansTo Other Libraries 764 724 943 913 1,418From Other Libraries 179 184 320 274 6766
Buildings, Improvement & Renovations, FY <strong>2005</strong>ClarkstonDecaturCampus Building Improvement & Renovation Projects Improvement &Renovation CostsCH Installation of New Cabinetry $4,700.00CE New Building Automation System $52,777.00CF New Building Automation System $ 155,205.00CD Replace Boilers $ 56,552.00CH Nursing Tutorial Lab $ 68,000.00Proposed Dug-Outs Baseball Field $ 82,350.00CF Performance Theatre, Ground Floor $ 719,158.00CF Renovate Ground Floor HVAC System $ 225,230.00CH Third Floor Classroom Renovation $ 238,000.00CT Astec Coating, Gutters & Downspouts $ 7,109.00CL Replace Exterior Terrazzo $ 12,500.00CG/LRC Automatic Door Openers $ 7,856.25CE Carpet Adhesive Application $ 13,225.00CD Gateway Classroom Renovation $ 187,706.00SA Upgrade Electrical for Server Room $ 17,965.00SA Installation of Carpet $ 10,103.20SA Wall Covering & Painting of Offices $ 22,554.00SB Installation of Emergency Gas Shut Off Valve $ 5,339.00SC Replace Duct Installation-Roof Top Unit $ 9,358.00SH/SIS/SJ/SK Carpet Installation $ 12,022.08Resurfacing Tennis Courts $ 13,600.00Concrete Wall Project $ 26,584.16Dunwoody NC/ND New Building Automation System $ 131,230.00ND Replace Boilers $ 92,823.00NE Restore Exterior of Building $ 16,078.00NC Installation of Carpet $ 3,792.50NA/NC/ND Walkway Lightings $ 5,425.0067
RockdaleParking Lot Repairs $ 6,807.00NC/NF/LRC Automatic Door Openers $ 26,535.18NC/ND Exterior Doors $ 5,682.50Parking Deck Storm Water $ 28,500.00Parking Lot Entrance $ 6,300.00Concrete Walk Project $ 7,630.00Demolition & Installation of Plumbing Fixtures $ 5,508.00Hollow Metal Door Installation $ 3,750.0068
OrganizationAcademicsStudentsFunding & FacilitiesEmployeesEmployees<strong>Georgia</strong> <strong>Perimeter</strong> <strong>College</strong> employed more than 463 faculty members in FY05<strong>Georgia</strong> <strong>Perimeter</strong> <strong>College</strong>
Full-Time Employees by EEO Classification, FY 2001-<strong>2005</strong>EEO Category 2001 2002 2003 <strong>2004</strong> <strong>2005</strong>Executive/Administration/Managerial 110 115 119 81 87Faculty 312 310 326 343 360Professional Staff 83 92 101 237 266Secretarial/Clerical 123 136 137 162 169Technical/Paraprofessional 59 66 69 9 11Skilled Crafts 25 27 31 24 26Service Maintenance 88 85 96 135 138Totals 800 831 879 991 1,057Note: Noticeable differences between <strong>2004</strong> and the previous years are due largely to University System of <strong>Georgia</strong> classification changes.Full -Time Employees, FY 01 - 05 Full-Time Employees by Classificiation, FY 0512001000FacultyProfessional8006004002000FY 01 FY 02 FY 03 FY 04 FY 05ExecutiveAdminMaintenanceSk. CraftsTechnicalSec/Clerical71
Corps of Instruction – All Campuses, Fall <strong>2004</strong>InstructionalFacultyLibrary FacultyDept. Head/Coor./Acad. Dir.DeansAcademicOther Membersof the CorpsRankProfessor 33 0 4 3 0 40Associate129 0 20 2 0 151ProfessorAssistant77 5 14 0 0 96ProfessorInstructor 121 10 5 0 0 136Unranked 0 0 0 0 0 0GenderMale 143 5 16 4 0 168Female 217 10 27 1 0 255RaceAsian 13 0 0 0 0 13Black 62 2 8 1 0 73Hispanic 7 0 0 0 0 7Native American 1 0 1 0 0 2Multiracial 35 1 0 0 0 36White 242 12 34 4 0 292TenureTenured 181 0 25 4 0 210On Track 116 0 9 1 0 126Not Eligible* 63 15 9 0 0 87Highest DegreeDoctorate 109 2 17 4 0 132Specialist 6 0 0 0 0 6Master’s 207 13 25 1 0 246Bachelor’s 38 0 1 0 0 39Total 360 15 43 5 0 423*Not eligible/not on trackTotal72
Highest Earned Degree, Full-Time Instructional Faculty, Fall <strong>2004</strong>Academic Area Doctorate Specialist Master’s Others TotalBusiness Administration 4 0 21 0 25Fine Arts 1 1 8 0 10Foreign Language 5 0 18 0 23Health Sciences/Physical Education 3 1 26 1 31Humanities/Honors 21 0 55 0 76Math/Computer Science 10 3 45 2 60Science 27 0 12 0 39Social Sciences 27 1 11 0 39Interpreter Training 0 0 0 1 1Unclassified 11 0 11 34 56Total 109 6 207 38 360* % of FT Faculty 30.3% 1.7% 57.5% 10.6% 100.0%* Numbers may not sum to 100.0 percent due to rounding.Highest Earned Degree, FT Faculty, Fall 04Master’sSpecialistDoctorateOthers73
Faculty Distribution by Rank and Ethnicity, Fall 2000-04Academic Rank Fall 00 Fall 01 Fall 02 Fall 03 Fall 04Professor 18 6% 21 7% 30 10% 26 8% 33 9%Asian 0 0% 0 0% 1 3% 1 4% 1 3%Black 0 0% 1 5% 4 14% 4 15% 6 18%Hispanic 0 0% 0 0% 1 3% 1 4% 1 3%Native American 0 0% 0 0% 0 0% 0 0% 1 3%White 18 100% 20 95% 24 80% 20 77% 24 73%Associate Professor 67 22% 106 34% 121 37% 130 38% 129 36%Asian 3 5% 4 4% 5 4% 7 5% 8 6%Black 9 13% 13 12% 20 16% 25 19% 21 16%Hispanic 3 5% 2 2% 1 1% 1 1% 1 1%Native American 1 2% 1 1% 1 1% 1 1% 0 0%White 51 76% 86 81% 94 78% 96 74% 99 77%Assistant Professor 141 45% 109 35% 75 23% 69 20% 77 21%Asian 5 4% 6 6% 4 5% 2 2% 2 3%Black 29 21% 26 24% 17 23% 15 22% 21 27%Hispanic 1 1% 3 3% 2 3% 4 6% 5 6%Multiracial 0 0% 0 0% 0 0% 0 0% 2 3%Native American 0 0% 0 0% 0 0% 0 0% 0 0%White 106 75% 75 69% 52 69% 48 70% 47 61%Instructor 86 28% 72 23% 50 15% 59 17% 61 17%Asian 5 6% 3 4% 2 4% 3 5% 1 2%Black 21 24% 20 28% 11 22% 13 22% 10 16%Hispanic 1 1% 1 1% 0 0% 0 0% 0 0%Native American 0 0% 1 1% 1 2% 0 0% 0 0%Multiracial 1 1% 1 1% 1 2% 1 2% 0 0%White 58 67% 46 64% 35 70% 42 71% 50 82%Unranked NA NA 2 1% 0 0% 0 0% 0 0%Asian NA NA 0 0% 0 0% 0 0% 0 0%Black NA NA 0 0% 0 0% 0 0% 0 0%Hispanic NA NA 0 0% 0 0% 0 0% 0 0%Native American NA NA 0 0% 0 0% 0 0% 0 0%White NA NA 2 100% 0 0% 0 0% 0 0%74
(continued from previous page)Academic Rank Fall 00 Fall 01 Fall 02 Fall 03 Fall 04Temporary* NA NA 17 6% 50 15% 60 17% 60 17%Asian NA NA 0 0% 2 4% 3 5% 1 2%Black NA NA 6 35% 17 34% 23 38% 4 7%Multiracial NA NA NA NA NA NA 2 3% 33 55%Hispanic NA NA 0 0% 1 2% 1 2% 0 0%White NA NA 11 65% 30 60% 31 52% 22 36%Total Faculty 312 100% 310 100% 326 100% 343 100% 360 100%75
Faculty Distribution by Tenure Status, Fall 2000-04Year Tenured Non-Tenured Non-Tenure Track Total# % # % # % #Fall 00 167 54 66 21 79 25 312Fall 01 193 62 84 27 33 11 310Fall 02 192 59 68 21 66 20 326Fall 03 187 55 93 27 63 18 343Fall 04 181 50 116 32 63 18 360Faculty by Tenure Status, Fall 00 - 04Faculty by Tenure Status, Fall 04200150Tenured100500Fall 00 Fall 01 Fall 02 Fall 03 Fall 04Non-TenTrackNon-TenuredTenured Non-Tenured Non-Ten Track76
Tenure Status by Academic Area, Gender, & Ethnicity, Fall <strong>2004</strong>AcademicTenuredNon-TenuredNT TrackTotalBusiness 14 11 0 25Fine Arts 5 4 1 10Foreign Languages 16 7 0 23HealthScience/Physical17 13 1 31EducationHumanities/Honor 41 35 0 76Math/CS/ENGR 45 12 3 60Science 20 18 1 39Social Sciences 23 16 0 39Interpreter Training 0 0 1 1Unclassified 0 0 56 56Total 181 116 63 360GenderTenuredNT TrackTotalMale 74 45 24 143Female 107 71 39 217Total 181 116 63 360RaceTenuredNon-TenuredNon-TenuredNT TrackTotalBlack 34 23 5 62Asian 9 3 1 13Native American 1 0 0 1Hispanic 5 2 0 7White 132 86 24 242Multiracial 0 2 33 35Total 181 116 63 360Tenured Faculty by Ethnicity, Fall 04Tenured Faculty by Gender, Fall 04WhiteFemaleMaleHispanicNativeAmericanAsianBlack77
Faculty Workload by Area, Fall 2003 & <strong>2004</strong>; by Campus, Fall <strong>2004</strong>AreaSections Taught Students Taught FTFClassesPTFClassesAverage ClassSizePart-Time %Fall 03 Fall 04 Fall 03 Fall 04 Fall 04 Fall 04 Fall 03 Fall 04 Fall 03 Fall 04BUSINESS 216 226 5,705 5887 124 102 26 26 44.5% 45.1%DENTAL HYGIENE 8 14 240 272 12 2 30 19 12.5% 14.3%ENSL & FOR. LANG 237 256 4,066 4379 159 97 17 17 70.0% 37.9%FINE ARTS 97 111 1,743 1959 53 58 18 18 70.4% 52.3%FIRE MANAGEMENT 2 4 27 40 2 2 14 10 33.3% 50.0%HEDS 30 32 597 601 9 23 20 19 64.3% 71.9%HUMANITIES 746 789 15,425 16772 404 385 21 21 53.6% 48.8%INTERPRETERTRAINING 18 17 207 144 8 9 12 8 38.1% 52.9%MATHEMATICS & CS 462 481 11,311 11861 304 177 24 25 35.2% 36.8%NURSING 6 6 261 229 6 0 44 38 0.0% 0.0%PHYSICALEDUCATION 160 177 3,331 3499 97 80 21 20 53.4% 45.2%SCIENCE 414 492 10,006 11999 267 225 24 24 49.6% 45.7%SOCIAL SCIENCE 412 466 12,259 13543 262 204 30 29 46.4% 43.8%COLLEGE TOTAL 2,808 3071 65,178 71,185 1,707 1,364 23 23 49.2% 44.4%Sections Taught Students TaughtFTFClassesPTFClasses Average Class Size Part-Time %CAMPUS Fall <strong>2004</strong> Fall <strong>2004</strong> Fall 04 Fall 04 Fall <strong>2004</strong> Fall <strong>2004</strong>CLARKSTON 740 15,718 445 295 21 39.9%DECATUR 237 5,298 140 97 22 40.9%DUNWOODY 993 22,758 510 483 23 48.6%LAWRENCEVILLE 913 22,920 510 403 25 44.1%ROCKDALE 188 4,491 102 86 24 45.7%78
OrganizationAcademicsStudentsFunding & FacilitiesEmployees<strong>Georgia</strong> <strong>Perimeter</strong> <strong>College</strong> Fact BookReferences<strong>Georgia</strong> <strong>Perimeter</strong> <strong>College</strong>
Quick Reference I for <strong>Georgia</strong> <strong>Perimeter</strong> <strong>College</strong>Number of StudentsOn & Off Campus, Fall <strong>2004</strong>Total Headcount (Unduplicated) 20,316Headcount by Gender:Male 7,659Female 12,657Headcount by Race:Asian 1,952Black 7,017Hispanic 842Multiracial 1,246Native American 62White 9,197Headcount by Campus:Clarkston 5,185Decatur 2,200Dunwoody/Alpharetta 6,949Lawrenceville 6,022Rockdale 1,291Off Campus/Distance Education 1,839Equivalent Full-Time 15,395Total Cont. & Corp. Ed.5,853ParticipantsDegrees AwardedFY <strong>2004</strong>Total Awarded 1,318Associate of Arts 164Associate of Science 1,031Associate of Applied Science 16Certificate & Career Program 08Career Program 99Degrees by CampusClarkston 340Lawrenceville 431Dunwoody 413Decatur/Rockdale 134Degrees by EthnicityAsian 102Black 377Hispanic 43Multiracial 43Native American 2White 751Enrollment by CountyFall <strong>2004</strong>Cherokee 124Clarke 37Clayton 391Cobb 693DeKalb 4,041Douglas 50Fayette 55Forsyth 202Fulton 2,472Gwinnett 5,459Henry 200Newton 422Rockdale 742Walton 327Others in-State 489Out-of-State 4,612Tuition & FeesFY 2006Tuition (per hour)In-State $65.00Out-of-State $257.00Distance Learning $92.00Required FeesApplication (one time only) $20.00Parking $18.00Student Activity $42.00Student Athletic $27.00Technology $50.00Special FeesApplied Music (per hour) $75.00Dental Hygiene Insurance/Lab $50.00Health Info Tech Insurance $8.00Late Payment $38.00Nursing Insurance/Lab $156.00Science Lab $30.00Int’l Student Health Insurance $315.0081
Quick Reference II for <strong>Georgia</strong> <strong>Perimeter</strong> <strong>College</strong>Revenue & Expenditure FY 05RevenuesTuition and Fees $34,354,750State/Local Appropriation $57,229,687Other Income $1,234,060Departmental Sales & Services $3,200,000Sponsored Operations $17,500,000TOTAL REVENUE $113,518,497Budget AllocationsInstruction $44,567,967Public Services $1,000Academic Support $10,838,115Student Services $9,445,717Institutional Support $17,871,006Plant Operations $10,094,692Departmental Sales & Services $3,200,000Sponsored Operations $17,500,000TOTAL ALLOCATIONS $113,518,497Expenditure Per StudentEFT Student 15,395Expenditure Per EFT Student $6,237(excluding sponsored)Corps of Instruction, Fall 04By RankProfessor 53Associate Professor 172Assistant Professor 109Instructor 184Unranked 2By GenderMale 217Female 302By RaceAsian 19Black 113Hispanic 10Native American 1Multiracial 8White 368By Highest DegreeDoctorate 161Specialist 9Master’s 340Bachelor’s 10By TenureTenured 237On Track 141Not Eligible/Not On Track 142Total 520Note: Corps of instruction includes 62 peopleof Executive/Administrative/Managerial groupand 326 faculty members.<strong>Georgia</strong> Population Projection 00 - 25White Black NativeAmAsianTotal00 69% 29% 0.2% 2.0% 7,874,79205 68% 30% 0.2% 2.0% 8,412,68610 67% 31% 0.2% 2.1% 8,823,90215 66% 32% 0.2% 2.2% 9,199,75120 65% 33% 0.2% 2.4% 9,551,67225 64% 34% 0.2% 2.5% 9,869,427Population of Counties in the <strong>GPC</strong>Service Region <strong>2004</strong> (estimate)Cherokee 166,639Clarke 103,691Clayton 259,736Cobb 651,027DeKalb 674,334Douglas 102,015Fayette 98,914Forsyth 123,811Fulton 818,322Gwinnett 673,345Henry 150,003Newton 76,144Rockdale 74,941Walton 69,381Total Population of the Region 4,042,303Sources: 1. Selig Center, University of<strong>Georgia</strong>, Projected Population by Race,<strong>Georgia</strong>, 1995-20252. <strong>Georgia</strong> Department of Labor,Area Labor Profiles.82
A Directory for <strong>Georgia</strong> <strong>Perimeter</strong> <strong>College</strong><strong>GPC</strong> District OfficesVP Educational Affairs 678-891-2445Accounting 678-891-2060Admissions and Records 678-891-3250Alumni Relations 678-891-2550Athletics 678-891-2360Continuing and Corporate Education 678-891-3000Disability Services 678-891-3385Distance Learning 678-891-2805Financial Aid 678-891-3000Human Resources 678-891-2500ID Card Services 678-891-3330International Center 678-891-3230Institutional Advancement 678-891-2550Office of Institutional Research and Planning 678-891-2570Marketing and Public Relations 678-891-2680Recruitment and Retention 678-891-4125Student Accounts 678-891-2730VP Financial Affairs 678-891-2515Grants & Sponsored Programs 678-891-2525Payroll 678-891-2645Budget 678-891-2375Auxiliary Services 678-891-3340Purchasing 678-891-3325<strong>GPC</strong> Campus OfficesClarkstonRegistrar and Admissions 678-891-3500Student Accounts 678-891-3810Financial Aid 678-891-3505Dunwoody/AlpharettaRegistrar and Admissions 770-274-5200Student Accounts 770-274-5395Financial Aid 770-274-5290LawrencevilleRegistrar and Admissions 678-407-5315Student Accounts 678-407-5137Financial Aid 678-407-5160DecaturRegistrar and Admissions 678-891-2470Student Accounts 678-891-2730Financial Aid 678-891-2510RockdaleRegistrar and Admissions 770-278-1215Student Accounts 770-278-1310Financial Aid 770-278-127583
OrganizationAcademicsStudentsFunding & FacilitiesEmployees<strong>Georgia</strong> <strong>Perimeter</strong> <strong>College</strong> Fact Book<strong>2004</strong>-<strong>2005</strong>The University System of <strong>Georgia</strong> AA/EOE • Creative services provided by the <strong>Georgia</strong> <strong>Perimeter</strong> <strong>College</strong> Office of Marketing and Public Relations • 06-08-042