Consolidated Statements of Cash FlowsKawasaki Heavy Industries, Ltd. and Consolidated SubsidiariesFor the years ended March 31, <strong>2008</strong>, 2007 and 2006KAWASAKI HEAVY INDUSTRIES, LTD.Thousands ofU.S. dollarsMillions of yen (Note 1)<strong>2008</strong> 2007 2006 <strong>2008</strong>Cash flows from operating activities:Income before income taxes and minority interests ................................. ¥58,055 ¥45,268 ¥23,300 $579,391Adjustments to reconcile net income before income taxes andminority interests to net cash provided by operating activities:Depreciation and amortization ........................................................... 37,455 30,279 30,551 373,802Loss on impairment of fixed assets ..................................................... 2,764 — 3,008 27,585Provision for retirement and severance benefits ..................................... 7,124 8,460 17,092 71,098Reversal of allowance for doubtful receivables .................................... (406) (2,224) (44) (4,052)Provision for losses on construction contracts ..................................... (3,498) (247) 5,660 (34,910)Provision for restructuring charges on commercialaircraft manufacturing business ........................................................ — (9,557) 9,557 —Loss on impairment of inventories for restructuring oncommercial aircraft manufacturing business ..................................... — — 6,259 —Provision for loss on damages suit ...................................................... (153) 2,398 — (1,527)Provision for environmental measures ................................................. 2,168 — — 21,637Loss on disposal of inventories ............................................................ 1,350 1,025 1,738 13,473Gain on sale of marketable and investment securities ......................... (349) (889) (4,501) (3,483)Loss on sale of property, plant, and equipment .................................. 1,397 1,414 960 13,942Gain on contribution of securities to the pension trust ........................ (1,376) — (12,901) (13,733)Investment gain on equity method ..................................................... (7,642) — — (76,267)Interest and dividend income .............................................................. (5,005) (3,807) (3,225) (49,950)Interest expense ................................................................................. 7,980 6,650 5,377 79,641Changes in assets and liabilities:Decrease (increase) in:Trade receivables ........................................................................ (11,102) (2,867) (14,250) (110,798)Inventories ................................................................................. (19,046) (40,608) (49,754) (190,080)Other current assets ................................................................... (10,723) 5,157 (1,247) (107,016)Increase (decrease) in:Trade payables ........................................................................... 26,870 (1,248) 55,294 268,164Advances received ...................................................................... 1,849 25,285 (13,821) 18,453Accrued bonuses ........................................................................ 1,451 2,634 1,397 14,481Other current liabilities ............................................................... 7,758 223 1,689 77,425Other, net .......................................................................................... (3,314) 2,887 2,583 (33,074)Subtotal ......................................................................................... 93,607 70,233 64,722 934,202Cash received for interest and dividends ................................................. 9,608 5,393 3,129 95,888Cash paid for interest ............................................................................. (8,035) (6,438) (5,332) (80,190)Cash paid for income taxes .................................................................... (19,414) (23,329) (16,581) (193,752)Loss on cleaning of ground pollution ...................................................... — — (177) —Net cash provided by operating activities ............................................ 75,766 45,859 45,761 756,148(Continues to next page)38
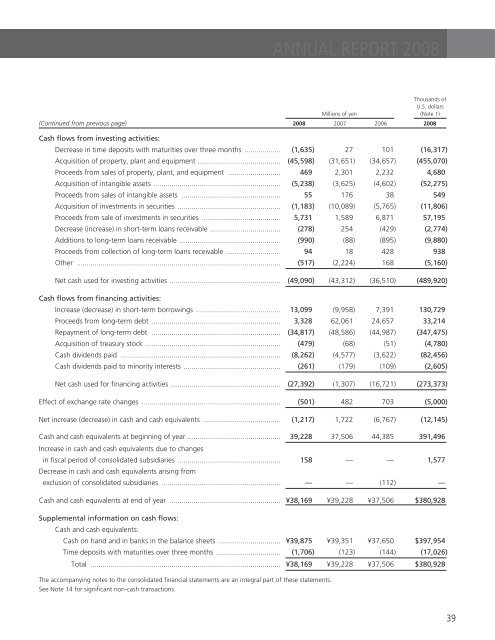
ANNUAL REPORT <strong>2008</strong>Thousands ofU.S. dollarsMillions of yen (Note 1)(Continued from previous page) <strong>2008</strong> 2007 2006 <strong>2008</strong>Cash flows from investing activities:Decrease in time deposits with maturities over three months .................. (1,635) 27 101 (16,317)Acquisition of property, plant and equipment ......................................... (45,598) (31,651) (34,657) (455,070)Proceeds from sales of property, plant, and equipment .......................... 469 2,301 2,232 4,680Acquisition of intangible assets ............................................................... (5,238) (3,625) (4,602) (52,275)Proceeds from sales of intangible assets ................................................. 55 176 38 549Acquisition of investments in securities ................................................... (1,183) (10,089) (5,765) (11,806)Proceeds from sale of investments in securities ....................................... 5,731 1,589 6,871 57,195Decrease (increase) in short-term loans receivable ................................... (278) 254 (429) (2,774)Additions to long-term loans receivable .................................................. (990) (88) (895) (9,880)Proceeds from collection of long-term loans receivable ........................... 94 18 428 938Other ..................................................................................................... (517) (2,224) 168 (5,160)Net cash used for investing activities ....................................................... (49,090) (43,312) (36,510) (489,920)Cash flows from financing activities:Increase (decrease) in short-term borrowings .......................................... 13,099 (9,958) 7,391 130,729Proceeds from long-term debt ................................................................ 3,328 62,061 24,657 33,214Repayment of long-term debt ................................................................ (34,817) (48,586) (44,987) (347,475)Acquisition of treasury stock ................................................................... (479) (68) (51) (4,780)Cash dividends paid ............................................................................... (8,262) (4,577) (3,622) (82,456)Cash dividends paid to minority interests ................................................ (261) (179) (109) (2,605)Net cash used for financing activities ...................................................... (27,392) (1,307) (16,721) (273,373)Effect of exchange rate changes ..................................................................... (501) 482 703 (5,000)Net increase (decrease) in cash and cash equivalents ...................................... (1,217) 1,722 (6,767) (12,145)Cash and cash equivalents at beginning of year .............................................. 39,228 37,506 44,385 391,496Increase in cash and cash equivalents due to changesin fiscal period of consolidated subsidiaries ................................................... 158 — — 1,577Decrease in cash and cash equivalents arising fromexclusion of consolidated subsidiaries ........................................................... — — (112) —Cash and cash equivalents at end of year ....................................................... ¥38,169 ¥39,228 ¥37,506 $380,928Supplemental information on cash flows:Cash and cash equivalents:Cash on hand and in banks in the balance sheets ............................... ¥39,875 ¥39,351 ¥37,650 $397,954Time deposits with maturities over three months ................................ (1,706) (123) (144) (17,026)Total .............................................................................................. ¥38,169 ¥39,228 ¥37,506 $380,928The accompanying notes to the consolidated financial statements are an integral part of these statements.See Note 14 for significant non-cash transactions.39
- Page 1 and 2: Annual Report 2008Year ended March
- Page 3: Consolidated Financial HighlightsKa
- Page 6 and 7: KAWASAKI HEAVY INDUSTRIES, LTD.Thus
- Page 8 and 9: An Interview with Tadaharu Ohashi,
- Page 10 and 11: KAWASAKI HEAVY INDUSTRIES, LTD.Q:Wh
- Page 12 and 13: AbcdeKawasaki Heavy Industries, Ltd
- Page 14 and 15: Review of OperationsKAWASAKI HEAVY
- Page 16 and 17: Review of OperationsKAWASAKI HEAVY
- Page 18 and 19: Review of OperationsKAWASAKI HEAVY
- Page 20 and 21: Review of OperationsKAWASAKI HEAVY
- Page 22 and 23: Review of OperationsKAWASAKI HEAVY
- Page 24 and 25: Review of OperationsKAWASAKI HEAVY
- Page 26 and 27: Review of OperationsKAWASAKI HEAVY
- Page 28 and 29: Six-Year Abcde SummaryKawasaki Heav
- Page 30 and 31: KAWASAKI HEAVY INDUSTRIES, LTD.annu
- Page 32 and 33: KAWASAKI HEAVY INDUSTRIES, LTD.Euro
- Page 34 and 35: KAWASAKI HEAVY INDUSTRIES, LTD.Plan
- Page 36 and 37: Consolidated Balance SheetsKawasaki
- Page 38 and 39: Consolidated Statements of IncomeKa
- Page 42 and 43: Notes to the Consolidated Financial
- Page 44 and 45: KAWASAKI HEAVY INDUSTRIES, LTD.(r)
- Page 46 and 47: KAWASAKI HEAVY INDUSTRIES, LTD.(d)
- Page 48 and 49: KAWASAKI HEAVY INDUSTRIES, LTD.Basi
- Page 50 and 51: KAWASAKI HEAVY INDUSTRIES, LTD.(c)
- Page 52 and 53: KAWASAKI HEAVY INDUSTRIES, LTD.(a)
- Page 54 and 55: KAWASAKI HEAVY INDUSTRIES, LTD.The
- Page 56: KAWASAKI HEAVY INDUSTRIES, LTD.(d)
- Page 59 and 60: ANNUAL REPORT 2008EXECUTIVE OFFICER
- Page 61 and 62: ANNUAL REPORT 2008Paid-in CapitalEq
- Page 63 and 64: NetworkANNUAL REPORT 2008Kobe Head
- Page 65 and 66: Corporate DataANNUAL REPORT 2008Kaw