abstract of thesis the utility of the structured inventory of malingered ...
abstract of thesis the utility of the structured inventory of malingered ...
abstract of thesis the utility of the structured inventory of malingered ...

You also want an ePaper? Increase the reach of your titles
YUMPU automatically turns print PDFs into web optimized ePapers that Google loves.
ABSTRACT OF THESISTHE UTILITY OFTHE STRUCTURED INVENTORY OF MALINGERED SYMPTOMATOLOGYAS A SCREEN FOR THE FEIGNING OFNEUROCOGNITIVE DEFICIT AND PSYCHOPATHOLOGYIN A CIVIL FORENSIC SAMPLEDetection <strong>of</strong> malingering is a significant concern in forensic psychological assessments.The best-validated tests currently available are time-intensive for both test-takers and mentalhealth pr<strong>of</strong>essionals. Thus, well-validated, brief screening measures for malingering would beuseful in a forensic environment. The Structured Inventory <strong>of</strong> Malingered Symptomatology(SIMS; Smith & Burger, 1997) has demonstrated potential in this role. The present studyattempts replication <strong>of</strong> previous studies while extending validation from analogue and malecriminal forensic samples to both men and women in a civil forensic setting. The SIMS’accuracy in <strong>the</strong> detection <strong>of</strong> both neurocognitive and psychiatric symptom feigning is evaluatedby comparing its performance to stringent multi-scale criterion measures in a large forensicsample. Cut scores suggested by previous studies yield high sensitivity and negative predictivepower in this sample when <strong>the</strong> SIMS is used to detect psychiatric symptom malingering;however, <strong>the</strong>se cut scores perform inadequately here when screening for <strong>the</strong> feigning <strong>of</strong>neurocognitive impairment, and no alternative cut score functions well in this capacity. Theresults lend support to <strong>the</strong> <strong>utility</strong> <strong>of</strong> <strong>the</strong> SIMS as a screen for psychiatric symptom malingeringby men and women in a civil forensic setting.KEYWORDS: Malingering, Structured Inventory <strong>of</strong> Malingered Symptomatology, ForensicAssessment, Neurocognitive Feigning, Psychiatric FeigningYvonne Renee AlwesMay 18, 2006Copyright ©2006 Yvonne Renee Alwes. All rights reserved.
RULES FOR THE USE OF THESESUnpublished <strong>the</strong>ses submitted for <strong>the</strong> Master’s degree and deposited in <strong>the</strong> University <strong>of</strong>Kentucky Library are as a rule open for inspection, but are to be used only with due regard to <strong>the</strong>rights <strong>of</strong> <strong>the</strong> authors. Bibliographical references may be noted, but quotations or summaries <strong>of</strong>parts may be published only with <strong>the</strong> permission <strong>of</strong> <strong>the</strong> author, and with <strong>the</strong> usual scholarlyacknowledgments.Extensive copying or publication <strong>of</strong> <strong>the</strong> <strong><strong>the</strong>sis</strong> in whole or in part also requires <strong>the</strong> consent <strong>of</strong> <strong>the</strong>Dean <strong>of</strong> <strong>the</strong> Graduate School <strong>of</strong> <strong>the</strong> University <strong>of</strong> Kentucky.
THESISYvonne Renee AlwesThe Graduate SchoolUniversity <strong>of</strong> Kentucky2006Copyright ©2006 Yvonne Renee Alwes. All rights reserved.
THE UTILITY OFTHE STRUCTURED INVENTORY OF MALINGERED SYMPTOMATOLOGYAS A SCREEN FOR THE FEIGNING OFNEUROCOGNITIVE DEFICIT AND PSYCHOPATHOLOGYIN A CIVIL FORENSIC SAMPLETHESISA <strong><strong>the</strong>sis</strong> submitted in partial fulfillment <strong>of</strong> <strong>the</strong>requirements for <strong>the</strong> degree <strong>of</strong> Master <strong>of</strong> Science in <strong>the</strong>College <strong>of</strong> Arts and Sciencesat <strong>the</strong> University <strong>of</strong> KentuckyByYvonne Renee AlwesLexington, KentuckyDirector: Dr. David T. R. Berry, Pr<strong>of</strong>essor <strong>of</strong> PsychologyLexington, Kentucky2006Copyright ©2006 Yvonne Renee Alwes. All rights reserved.
To Don, <strong>the</strong> light and love <strong>of</strong> my life,without whose loving encouragement and support this project would never have been undertaken
ACKNOWLEDGMENTSThe opportunity for me to conduct this investigation and <strong>the</strong> quality <strong>of</strong> this researchproject and resultant <strong><strong>the</strong>sis</strong> are owed in no small measure to <strong>the</strong> support, efforts, and expertguidance <strong>of</strong> my mentor and Thesis Committee Chair, Dr. David T. R. Berry. My thanks go alsoto Dr. Robert P. Granacher, Jr., not only for providing access to <strong>the</strong> data which fueled thisresearch, but for his helpful mentoring as well. Several fellow students contributed substantialtime and effort assisting with data collection, coding, and entry. I am grateful to my in-laws, <strong>the</strong>Alwes Family, for <strong>the</strong>ir continual encouragement during this effort. I am, fur<strong>the</strong>r, deeplyindebted to Otto for his unwavering support, for assiduously sharing his inextinguishable hope –for his steadfast belief in me. And, ultimately, everything worthwhile that I have accomplishedhas been inspired by my husband Don’s character and love.iii
LIST OF TABLESTable 1.1, Previous SIMS Studies ...............................................................................................11Table 2.1, Group Ns and Malingering Base Rates for Four Contrasts ........................................19Table 2.2, Power <strong>of</strong> Contrasts to Detect Effects <strong>of</strong> Various Sizes* ............................................20Table 3.1,Group Comparisons <strong>of</strong> Continuous Background Variables: PM vs. PH...................35Table 3.2, Group Comparisons <strong>of</strong> Discrete Background Variables: PM vs. PH ........................36Table 3.3,Table 3.4,Group Comparisons <strong>of</strong> Neurocognitive Test Scores: PM vs. PH..............................37Psychiatric and Neurocognitive Malingering, Honest, and IndeterminateClassification Ns .....................................................................................................38Table 3.5, Group Comparisons <strong>of</strong> MMPI-2 Validity Scale Scores: PN vs. PH .........................39Table 3.6, Group Comparisons <strong>of</strong> MMPI-2 Clinical Scale Scores: PM vs. PH .........................40Table 3.7, Group Comparisons <strong>of</strong> SIS Total and Subscale Scores: PM vs. PH .........................41Table 3.8,Table 3.9,Group Comparisons <strong>of</strong> Continuous Background Variables: NM vs. NH..................42Group Comparisons <strong>of</strong> Discrete Background Variables: NM vs. NH.......................43Table 3.10, Group Comparisons <strong>of</strong> SIRS Scores: NM vs. NH.....................................................44Table.3.11, Group Comparisons <strong>of</strong> MMPI-2 Validity Scale Scores: NM vs. NH .......................45Table 3.12, Group Comparisons <strong>of</strong> MMPI-2 Clinical Scale Scores: NM vs. NH........................46Table 3.13, Group Comparisons <strong>of</strong> SIMS Total and Subscale Scores: NM vs. NH ....................47Table 3.14, Group Comparisons <strong>of</strong> Continuous Background Variables: PNM vs. PNH .............48Table 3.15, Group Comparisons <strong>of</strong> Discrete Background Variables: PNM vs. PNH ..................49Table 3.16, Group Comparisons <strong>of</strong> MMPI-2 Validity Scale Scores: PNM vs. PNH ...................50T3ble 3.17, Group Comparisons <strong>of</strong> MMPI-2 Clinical Scale Scores: PNM vs. PNH ...................51Table 3.18, Group Comparisons <strong>of</strong> SIMS Total and Subscale Scores: PNM vs. PNH ................52Table 3.19, Group Comparisons <strong>of</strong> Continuous Background Variables: AM vs. PNH ...............53Table 3.20, Group Comparisons <strong>of</strong> Discrete Background Variables: AM vs. PNH ....................54Table 3.21, Group Comparisons <strong>of</strong> MMPI-2 Validity Scale Scores: AM vs. PNH .....................55Table 3.22, Group Comparisons <strong>of</strong> MMPI-2 Clinical Scale Scores: AM vs. PNH......................56Table 3.23, Group Comparisons <strong>of</strong> SIMS Total and Subscale Scores: AM vs. PNH ..................57Table 3.24, Summary <strong>of</strong> Test Score Difference Effect Sizes for Four Sets <strong>of</strong> Contrasts ..............58Table 3.25, Summary <strong>of</strong> SIMS Score Difference Effect Sizes for Four Sets <strong>of</strong> Contrasts ...........59v
Table 3.26, Conditional Stepwise Regressions <strong>of</strong> Criterion Measures Onto SIMS Total andMMPI-2 Infrequency Scores...................................................................................60Table 3.27, Classification Accuracy Statistics Using Cut Score <strong>of</strong> SIMS Total > 14 ...................61Table 3.28, Classification Accuracy Statistics Using Cut Score <strong>of</strong> SIMS Total > 16...................62Table 3.29, Cut Scores Yielding Maximum Sensitivity and NPP in NC and AnyComparisons ...........................................................................................................63vi
LIST OF FIGURESFigure 2.1, Overlap between Psychiatric and Neurocognitive types <strong>of</strong> Malingering,Honest, and Indeterminate participants.................................................................21vii
LIST OF FILESNAME TYPE SIZEYRAlwes.pdf . . . . . . . . . . . . . . PDF (Portable Document Format) . . . . . . . . . . . . . . . . . .2.51 MBviii
Chapter OneIntroductionMalingering is defined as a V-Code (V65.2) in <strong>the</strong> DSM-IV-TR (APA, 2000, p. 739) as“<strong>the</strong> intentional production <strong>of</strong> false or grossly exaggerated physical or psychological symptoms,motivated by external incentives such as avoiding military duty, avoiding work, obtainingfinancial compensation, evading criminal prosecution, or obtaining drugs.” Studies <strong>of</strong>malingering have yielded widely varying estimates <strong>of</strong> its prevalence, but available figures maybe low due to <strong>the</strong> failure to detect successful malingerers. In forensic psychological assessment,feigning <strong>of</strong> neurocognitive deficits has been reported to range from 15% to 48% (Inman et al.,1998), while rates <strong>of</strong> malingering <strong>of</strong> psychiatric symptoms have been suggested to range from20% to 45% (Lewis, Simcox, & Berry, 2002).When malingerers go undetected, <strong>the</strong> damages to society are significant. Health,disability, and unemployment insurance fraud as well as awards from litigation result in costs toinsurance companies and government that are passed on to employers, employees, tax-payers,and <strong>the</strong> self-insured. In <strong>the</strong> criminal arena, <strong>the</strong> failure to hold true <strong>of</strong>fenders criminallyresponsible exposes <strong>the</strong> general public to greater risk. In both criminal and civil settings,malingerers diminish <strong>the</strong> credibility <strong>of</strong> legitimate claimants and defendants. Thus, for manyimportant reasons, it is vital to address <strong>the</strong> possibility <strong>of</strong> <strong>malingered</strong> symptoms in allpsychological evaluations conducted in a compensation-seeking context.Forensic psychologists and psychiatrists are thus in need <strong>of</strong> accurate yet easily (andinexpensively) administered instruments for identification <strong>of</strong> malingering in forensic populations(Rogers, 1997). The Structured Inventory <strong>of</strong> Malingered Symptomatology (SIMS) is a relativelynew, brief test designed to address this need. In <strong>the</strong> present study, <strong>the</strong> SIMS’ usefulness inidentifying both psychiatric and neurocognitive symptom feigning in a civil forensic populationis evaluated.1
Embedded Validity ScalesMMPI-2. Initial systematic efforts at detecting dissimulation in test response involved<strong>the</strong> use <strong>of</strong> validity scales within measures designed primarily to detect neurocognitive orpsychiatric problems. The Minnesota Multiphasic Personality Inventory – 2 nd Edition (MMPI-2;Butcher, Dahlstrom, Graham, Tellegen, & Kaemmer, 1989) is still <strong>the</strong> most widely usedpsychological instrument in forensic assessment, and several <strong>of</strong> its validity scales are wellresearchedand relatively well-supported for <strong>the</strong> detection <strong>of</strong> dissimulation <strong>of</strong> psychopathology.The MMPI-2 Infrequency scales (F – Infrequency, Fb – Back Infrequency, and F[p] –Infrequency-Psychopathology) assess endorsement <strong>of</strong> severe psychopathology and atypicalsymptoms or attitudes, and have shown moderate success in <strong>the</strong> detection <strong>of</strong> malingering. F andFb items were rarely endorsed by <strong>the</strong> normative sample, and F(p) items were rarely endorsedeven by people with psychiatric disorders. The VRIN (Variable Response Inconsistency) andTRIN (True Response Inconsistency) scales, both measures <strong>of</strong> consistency <strong>of</strong> responding, areused to rule out random responding as an explanation for elevated scores on Infrequency scales.The F-K index (subtraction <strong>of</strong> <strong>the</strong> raw K – Defensiveness scale score from <strong>the</strong> raw F scale score)has also been found useful in identifying people who report fabricated symptoms. However,difficulties in establishing cut scores on <strong>the</strong>se scales that could be reliably used in individualassessments to determine malingering, as well as ambiguity with respect to which scale performsbest, persist (Lewis et al., 2002).WAIS-R and WAIS-III. In <strong>the</strong> neuropsychological testing domain, a similar pattern in <strong>the</strong>development <strong>of</strong> methods to detect symptom feigning is evident. Initially, existing tests used toassess neurocognitive functioning were examined in an attempt to identify scales useful indiscriminating feigners from honest reporters. The Digit Span subtests <strong>of</strong> <strong>the</strong> Wechsler AdultIntelligence Scale – Revised (Wechsler, 1981) and, more recently, <strong>of</strong> <strong>the</strong> Wechsler AdultIntelligence Scale – Third Edition (Wechsler, 1997) have demonstrated <strong>utility</strong> in this area.However, high false positive rates and <strong>the</strong> lack <strong>of</strong> establishment <strong>of</strong> a consistent cut score remainproblems for use <strong>of</strong> <strong>the</strong> Digit Span scale for <strong>the</strong> detection <strong>of</strong> neurocognitive malingering (Inman& Berry, 2000).2
Dedicated Malingering MeasuresSIRS. The obvious advantage to using scales within existing tests that are part <strong>of</strong>standard batteries for assessing psychopathology or neurocognitive problems is <strong>the</strong> absence <strong>of</strong> aneed to add tests to <strong>the</strong> battery. However, <strong>the</strong> limited success experienced with embedded scaleson existing tests led to <strong>the</strong> development <strong>of</strong> instruments specifically designed to detect invalidresponse sets such as malingering. The best-validated dedicated test <strong>of</strong> malingering <strong>of</strong>psychopathology to date is <strong>the</strong> Structured Interview <strong>of</strong> Reported Symptoms (SIRS; Rogers,1997; Rogers, Bagby, & Dickens, 1992; Lewis et al., 2002). The SIRS consists <strong>of</strong> 172 true/falseitems organized into eight primary scales and five supplementary scales. The various primaryscales assess endorsement frequency, atypical symptom presentation, and <strong>the</strong> extent to whichreported symptoms are observed during <strong>the</strong> interview (Heinze & Purisch, 2001). The SIRS is a<strong>structured</strong> interview; unlike <strong>the</strong> more common self-report measures, it must be administered by atrained pr<strong>of</strong>essional, requiring anywhere from 30 to 60 minutes (Rogers et al., 1992).Neurocognitive Tests <strong>of</strong> Effort. Many neurocognitive tests designed specifically to detectmalingering approach <strong>the</strong> task with a floor effect strategy (Heinze & Purisch, 2001). Thisinvolves presenting items with very low difficulty that are judged by <strong>the</strong> malingerer to be moredifficult for individuals with neurocognitive impairment, but which in actuality are not sensitiveto impairment. A common format for such tests is presentation <strong>of</strong> a stimulus (a series <strong>of</strong>numbers or letters, or a line drawing) for a few seconds, followed by removal <strong>of</strong> <strong>the</strong> stimulus fora few seconds, <strong>the</strong>n re-presentation <strong>of</strong> <strong>the</strong> stimulus along with at least one incorrect foil. Thetest-taker is instructed to identify <strong>the</strong> stimulus that was presented initially by itself.Three tests operating on this principle are <strong>the</strong> Test <strong>of</strong> Memory Malingering (TOMM;Tombaugh, 1996), <strong>the</strong> Victoria Symptom Validity Test (VSVT; Slick, Hopp, Strauss, &Thompson, 1997), and <strong>the</strong> Letter Memory Test (LMT; Inman et al., 1998). Each <strong>of</strong> <strong>the</strong>se is acomputer-administered forced-choice recognition test designed to detect poor effort.For all three <strong>of</strong> <strong>the</strong>se tests, <strong>the</strong> proportion <strong>of</strong> correctly answered items is used todetermine malingering. Due to <strong>the</strong> low difficulty level <strong>of</strong> <strong>the</strong> items, even patients with severebrain injuries average close to 100% correct; <strong>the</strong>refore, cut scores are generally in <strong>the</strong> 90% - 95%range. For <strong>the</strong>se tests, a performance below <strong>the</strong> cut score indicates malingering.SIMS. The Structured Inventory <strong>of</strong> Malingered Symptomatology (SIMS; Smith &Burger, 1997) was developed to serve as a brief screening instrument for <strong>the</strong> detection <strong>of</strong>3
potential malingering. It is a self-report test consisting <strong>of</strong> 75 true/false items. One strength <strong>of</strong><strong>the</strong> SIMS is <strong>the</strong> variety <strong>of</strong> symptomatology covered; some items are intended to be sensitive toneurocognitive feigning while o<strong>the</strong>rs focus on feigning <strong>of</strong> psychiatric symptoms. Thus, <strong>the</strong>SIMS consists <strong>of</strong> five scales: Psychosis (P), Affective Symptoms (Af), Neurologic Impairment(N), Amnestic Symptoms (Am), and Low Intelligence (LI). The P, Af, N, and Am scales assessatypical symptom presentation, while <strong>the</strong> LI scale consists <strong>of</strong> simple items expected to be failedonly by those feigning intellectual deficit (Heinze & Purisch, 2001). In keeping with its intendedfunction as a screen, <strong>the</strong> SIMS has initially demonstrated high negative predictive power (NPP;<strong>the</strong> proportion <strong>of</strong> individuals classified by <strong>the</strong> test as Honest who truly are not malingering).Used in this manner, failure <strong>of</strong> <strong>the</strong> SIMS is followed by administration <strong>of</strong> ano<strong>the</strong>r measure withhigh positive predictive power (PPP; <strong>the</strong> proportion <strong>of</strong> individuals classified by <strong>the</strong> test asMalingering who truly are malingering), such as <strong>the</strong> SIRS (Lewis et al., 2002). This two-stageassessment process can take advantage <strong>of</strong> <strong>the</strong> strengths <strong>of</strong> different tests to attain improvedclassification accuracy (Meehl, 1955), increasing <strong>the</strong> already high PPP <strong>of</strong> <strong>the</strong> 2 nd -stage measureby way <strong>of</strong> <strong>the</strong> increased base rate among 1 st -stage “failers”, while also resulting in an overallmore efficient use <strong>of</strong> time and effort. In this example, <strong>the</strong> SIMS self-report measure that takes10 to 15 minutes to administer would be given to everyone undergoing forensic assessment; <strong>the</strong>SIRS <strong>structured</strong> interview that requires 30 to 60 minutes <strong>of</strong> pr<strong>of</strong>essional administration timewould be given only to those who “fail” <strong>the</strong> SIMS.The SIMS has been validated in three studies with undergraduates (Smith, 1992; Smith &Burger, 1997; Edens, Otto, & Dwyer, 1999), two studies with male criminal defendants claimingincompetence to stand trial or diminished criminal responsibility (Heinze & Purisch, 2001;Lewis et al., 2002), and one study with adolescent <strong>of</strong>fenders (Rogers, Hinds, & Sewell, 1996).Understanding <strong>the</strong> limits <strong>of</strong> <strong>the</strong>se studies requires familiarity with research designs mostapplicable to this area <strong>of</strong> study. Three common methods <strong>of</strong> investigating malingering are <strong>the</strong>simulation design, known-groups comparison, and differential prevalence design. Eachapproach affords different strengths and limitations.Malingering Research DesignsSimulation/Analogue. Simulation studies employ an analogue <strong>of</strong> malingering byincluding at least one group <strong>of</strong> participants instructed to feign psychological symptoms. A4
control group consists <strong>of</strong> participants instructed to respond honestly to testing; <strong>the</strong> simulators andcontrol participants may be sampled randomly from <strong>the</strong> same population. However, in <strong>the</strong>strongest simulation design, a clinical comparison group consisting <strong>of</strong> participants with genuinedisorders is also included. The simulation design provides a controlled experimentalmanipulation; however, <strong>the</strong> generalizability <strong>of</strong> <strong>the</strong> analogue participants’ behavior to that <strong>of</strong>malingerers in real-life situations is unknown. One basis for questioning this generalizability is<strong>the</strong> recognition that <strong>the</strong> potentially life-altering consequences <strong>of</strong> success or failure at malingeringin <strong>the</strong> real world are hardly comparable to those for simulators in experimental studies.Known-Groups Comparisons. Known-groups comparisons make use <strong>of</strong> existing methodsfor identifying malingerers to form a group <strong>of</strong> participants designated as malingering.Individuals in a clinical or applied setting are classified as malingering or honest using a goldstandard criterion measure. Responses <strong>of</strong> <strong>the</strong>se malingering participants are compared to those<strong>of</strong> a group <strong>of</strong> honest responders. The behavior <strong>of</strong> both honest and malingering participants in<strong>the</strong>se real-life settings is considered generalizable to that <strong>of</strong> o<strong>the</strong>r people in comparable settings.The accuracy <strong>of</strong> <strong>the</strong> gold standard, however, imposes a ceiling on <strong>the</strong> validity <strong>of</strong> <strong>the</strong>experimental measure in question. Fur<strong>the</strong>r, <strong>the</strong> absence <strong>of</strong> experimental manipulation <strong>of</strong> <strong>the</strong>independent variable precludes inference <strong>of</strong> a clear causal relationship between malingeringattempts and test performances.Differential Prevalence. Differential prevalence designs avoid <strong>the</strong> problem <strong>of</strong> accurateclassification <strong>of</strong> participants into known groups. Participants are sampled from two populationswhich are expected to have different base rates <strong>of</strong> malingering. Participants are not assessed todetermine <strong>the</strong>ir group membership. However, responses <strong>of</strong> participants in <strong>the</strong> two resultinggroups are compared, and differences are presumed to relate to differences in base rates <strong>of</strong>malingering. Although this method shares <strong>the</strong> generalizability <strong>of</strong> known-groups comparisons, itslack <strong>of</strong> information regarding which individuals are malingering and which are honest meansthat classification accuracy statistics cannot be determined.Simulation studies, <strong>the</strong>refore, present superior internal validity and questionable externalvalidity. Known-groups comparisons yield high external validity, but at <strong>the</strong> expense <strong>of</strong> internalvalidity. Differential prevalence designs allow for such poor internal validity as to be <strong>of</strong> muchless value in investigating malingering.5
Previous SIMS StudiesSmith (1992). Smith (1992) developed <strong>the</strong> SIMS and conducted initial validation usingeight groups <strong>of</strong> college student participants – each <strong>of</strong> six groups was instructed to attempt tosimulate a condition corresponding to one <strong>of</strong> <strong>the</strong> six SIMS scales; one group was instructed t<strong>of</strong>eign general impairment; and one group was instructed to respond honestly. The SIMS Totalscore demonstrated a .95 hit rate (overall classification accuracy) with a cut score <strong>of</strong> >16. Cutscores for individual scales were also established, but <strong>the</strong> Total score proved to be superior to all<strong>of</strong> <strong>the</strong> individual scales at distinguishing malingerers in all groups from honest responders. Thelack <strong>of</strong> a clinical control group is a serious limitation <strong>of</strong> this study, however.Rogers, Hinds, & Sewell (1996). Rogers, Hinds, & Sewell (1996) studied a sample <strong>of</strong> 53adolescent <strong>of</strong>fenders by way <strong>of</strong> a within-subjects analogue design. The authors suggested that<strong>the</strong> fifth-grade reading level <strong>of</strong> <strong>the</strong> SIMS is especially valuable for use in an adolescentpopulation. All participants had received dual diagnoses and had been referred by <strong>the</strong> courts to astate hospital for psychological treatment. Each participant completed testing twice – once understandard instructions and once under instructions to feign one <strong>of</strong> three disorders. All <strong>the</strong>adolescents were paid to participate and were <strong>of</strong>fered additional modest incentives for successfulfeigning. For some participants, <strong>the</strong> researcher was aware <strong>of</strong> <strong>the</strong> experimental condition duringdata collection.The Total cut score <strong>of</strong> >16 established by Smith (1992) reportedly yielded .87 PPP and.62 NPP in this sample. The Total cut score determined to be optimal for this study’s samplewas >40; this cut score was reported to produce .94 NPP and only .49 PPP. Optimal scale cutscores reported for this sample were also much higher than those established by Smith (1992),and also yielded high NPP on <strong>the</strong> individual scale scores. These figures may well be in error,however, as raising <strong>the</strong> cut scores substantially should increase PPP and decrease NPP.Although in <strong>the</strong> Discussion section <strong>the</strong> authors asserted that high PPP is ideal for a screeningmeasure, ra<strong>the</strong>r than high NPP, <strong>the</strong>y did not explicate in <strong>the</strong> Results section ei<strong>the</strong>r <strong>the</strong>ir concept<strong>of</strong> “optimal” (i.e., what results optimal cut scores would yield) or <strong>the</strong> method used to determine<strong>the</strong> optimal cut scores. Sensitivity and specificity figures were not provided in <strong>the</strong> article. Theuse <strong>of</strong> a sample <strong>of</strong> <strong>of</strong>fenders referred for treatment may add to external validity, although <strong>the</strong>monetary incentives <strong>of</strong>fered imply that <strong>the</strong> results <strong>of</strong> this testing did not influence <strong>the</strong>ir real-lifeoutcomes. Rogers et al. (1996) stated that <strong>the</strong>y had found evidence for <strong>the</strong> SIMS as a “promising6
screen” (p. 254). Due to <strong>the</strong> afore-mentioned issues, however, it is difficult to evaluate <strong>the</strong>results provided.Smith & Burger (1997). Smith & Burger (1997) administered <strong>the</strong> SIMS to 476 collegestudents who were instructed to ei<strong>the</strong>r respond honestly or simulate symptomatology. Feigningparticipants were asked to simulate one <strong>of</strong> six specific types <strong>of</strong> conditions (corresponding to <strong>the</strong>six SIMS scales) or general impairment. In this effort to validate <strong>the</strong> SIMS, half <strong>the</strong> sample wasused to determine optimal cut scores for each scale and for <strong>the</strong> Total, and those cut scores wereapplied to <strong>the</strong> o<strong>the</strong>r half <strong>of</strong> <strong>the</strong> sample. Simulators scored higher on all SIMS scales than honestresponders. NPP and PPP were not reported, but <strong>the</strong> SIMS Total score yielded a hit rate <strong>of</strong> .95,sensitivity <strong>of</strong> .96, and specificity <strong>of</strong> .88 using <strong>the</strong> cut score established with <strong>the</strong> first half <strong>of</strong> <strong>the</strong>sample. Sensitivity and specificity for <strong>the</strong> individual scales ranged from .75 to .88 and from .52to .91, respectively; hit rates ranged from .74 to .89.Participants were provided with vignettes and asked to imagine <strong>the</strong>mselves as criminaldefendants facing <strong>the</strong> possibility <strong>of</strong> a “serious sentence” (p. 186). They were also cautioned toavoid detection, but <strong>the</strong> analogue to real-world situations which give rise to malingering is weak.It is unclear how “optimal” was defined by <strong>the</strong> authors when <strong>the</strong>y selected <strong>the</strong> cut scores, whichwere not reported. In <strong>the</strong> Discussion section, <strong>the</strong> authors recommended using a Total cut score<strong>of</strong> >14. The base rate <strong>of</strong> malingering in this study was .88, which is quite high. The use <strong>of</strong> half<strong>the</strong> sample for developing cut scores and <strong>the</strong> o<strong>the</strong>r half for validating <strong>the</strong>m was superior tomerely choosing <strong>the</strong> score that was optimal for <strong>the</strong> entire sample. The experimental simulationdesign with random assignment to groups provided high internal validity. However, no clinicalcontrol group was included, and no screening <strong>of</strong> participants for pathology was performed.Edens, Otto, & Dwyer (1999). Edens, Otto, & Dwyer (1999) conducted a simulationstudy with 196 university students. Each participant completed both <strong>the</strong> SIMS and <strong>the</strong> SymptomChecklist 90–Revised (SCL-90-R; Derogatis, 1977) two times – once under normal instructionsand once under instructions to feign specific symptomatology. In <strong>the</strong> feigning condition,participants were advised to avoid detection as feigners and were promised awards to <strong>the</strong> mostsuccessful malingerers. The SIMS scales were found to be generally sensitive to malingering,but not specifically sensitive to particular types <strong>of</strong> <strong>malingered</strong> symptomatology. The authorssuggested that overlap in <strong>the</strong> scales and <strong>the</strong> lack <strong>of</strong> specificity <strong>of</strong> symptoms feigned bymalingerers contributed to this finding.7
The authors used <strong>the</strong> cut scores recommended by Smith & Burger (1997), which includeda Total score >14. (As mentioned previously, individual scale cut scores were not reported bySmith & Burger, so it is not clear where Edens et al. obtained <strong>the</strong>ir individual scale cut scores.)PPP and NPP were not reported. Sensitivity and specificity for <strong>the</strong> Total score were .96 and .91,respectively. When “any scale elevation” was used as an indicator <strong>of</strong> malingering, sensitivityincreased to 1.00, but specificity sank to .51. The Total score, with a hit rate <strong>of</strong> .96, was found todiscriminate between malingering and honest responders better than any individual scale andbetter than <strong>the</strong> “any elevated scale” criterion. When subscales were used individually to screenfor malingering, <strong>the</strong>y were only somewhat focused in <strong>the</strong>ir sensitivity and specificity on <strong>the</strong>symptomatologies each was designed to cover. When screening for general malingering,sensitivity <strong>of</strong> individual scales ranged from .68 to .89; specificity figures ranged from .71 to .92.The SIMS produced more false positives with participants with actual symptomatology; amongindividuals with a psychiatric history or SCL-90-R Global Severity Index score <strong>of</strong> at least 45, <strong>the</strong>Total score yielded sensitivity <strong>of</strong> .97 to 1.00 and specificity <strong>of</strong> .78 to .91.The sample size was larger than those in some studies; this allowed for <strong>the</strong> formation <strong>of</strong>several small groups <strong>of</strong> participants. Each group was instructed to feign a specific type <strong>of</strong>symptomatology. Although this study lacks generalizability due to its within-subjects simulationdesign and <strong>the</strong> absence <strong>of</strong> a clinical control group, it lends important support to <strong>the</strong> use <strong>of</strong> <strong>the</strong>SIMS Total score as a screen for malingering.Heinze & Purisch (2001). Heinze & Purisch (2001) tested 57 male inmates <strong>of</strong> amaximum security state hospital who were charged with felonies and undergoing evaluation forcompetency to stand trial. All were suspected <strong>of</strong> feigning due to “compelling clinical evidence”(p. 28). In all cases, a multi-disciplinary research team and <strong>the</strong> evaluating psychiatrist suspected<strong>the</strong> participants <strong>of</strong> malingering based on “clinical indicators and behavioral observations” (p. 29).Due to <strong>the</strong> presumed 100% base rate <strong>of</strong> feigning in this sample, <strong>the</strong> study focused on evaluation<strong>of</strong> <strong>the</strong> sensitivity <strong>of</strong> <strong>the</strong> SIMS and several o<strong>the</strong>r instruments. The SIMS Total scoredemonstrated a sensitivity <strong>of</strong> .87 using a cut score <strong>of</strong> >13. It was not clear how <strong>the</strong> cut score waschosen.The sample was ra<strong>the</strong>r small, although it did consist entirely <strong>of</strong> clinical malingerers. Themethod <strong>of</strong> determining <strong>the</strong> initial likelihood <strong>of</strong> malingering (<strong>the</strong> criterion for inclusion in <strong>the</strong>study) is questionable. The staff who made <strong>the</strong>se determinations may not be representative <strong>of</strong>8
mental health pr<strong>of</strong>essional in general. The purpose <strong>of</strong> <strong>the</strong> study was not focused on thoroughevaluation <strong>of</strong> <strong>the</strong> <strong>utility</strong> <strong>of</strong> <strong>the</strong> various instruments in <strong>the</strong> detection <strong>of</strong> malingering – much <strong>of</strong> <strong>the</strong>discussion revolved around identifying different types <strong>of</strong> malingering. The design <strong>of</strong> <strong>the</strong> studydid not allow for <strong>the</strong> calculation <strong>of</strong> many useful statistics such as hit rate, NPP, and PPP, and sodid not lend itself to a good overall assessment <strong>of</strong> <strong>the</strong> SIMS.Lewis, Simcox, & Berry (2002). Lewis, Simcox, & Berry (2002) tested 55 maledefendants undergoing pre-trial psychological evaluations to determine competency to stand trialor mental state at <strong>the</strong> time <strong>of</strong> <strong>the</strong> <strong>of</strong>fense. Each participant was classified as honest, malingering,or indeterminate on <strong>the</strong> basis <strong>of</strong> SIRS results. Participants who did not meet criteria for ei<strong>the</strong>rmalingering or honest responding (those whose classifications were indeterminate) were notincluded in analyses <strong>of</strong> <strong>the</strong> performance <strong>of</strong> <strong>the</strong> SIMS. Feigners scored significantly higher on allSIMS scales than did honest responders. Using a cut score <strong>of</strong> >16, <strong>the</strong> SIMS Total scoredemonstrated 1.00 NPP and .54 PPP. Sensitivity was 1.00, while specificity was .61, and overallhit rate = .73. Statistics for <strong>the</strong> individual scales were not reported.As in all known-groups comparisons, here <strong>the</strong> validity <strong>of</strong> <strong>the</strong> SIRS caps <strong>the</strong> potentialvalidity <strong>of</strong> <strong>the</strong> SIMS as a detector <strong>of</strong> malingering. The sample was ra<strong>the</strong>r small and exclusivelymale; all participants were facing federal charges. A strength <strong>of</strong> this study was <strong>the</strong> use <strong>of</strong> asample <strong>of</strong> actual criminal defendants whose psychological evaluations carried real-life relevance.Summary. Table 1.1 summarizes <strong>the</strong> research published to date on <strong>the</strong> SIMS. Notablelimitations <strong>of</strong> individual studies include researchers not blind to a subject’s condition (Rogers etal., 1996), confusing or erroneous statistics (Rogers et al., 1996), and weak criterion measures(Heinze & Purisch, 2001). Of <strong>the</strong> three studies conducted with <strong>of</strong>fender participants, oneincluded only adolescents (Rogers et al., 1996), and ano<strong>the</strong>r employed only a single subjectgroup (Heinze & Purisch, 2001).Weaknesses common to several studies include: lack <strong>of</strong> patient or <strong>of</strong>fender participantsin simulation studies; small sample sizes in studies including <strong>of</strong>fenders/patients; no female<strong>of</strong>fender/patient participants; unreported cut scores (especially for sub-scales); unreportedclassification accuracy statistics (especially PPP and NPP); and failure to indicate how cut scoreswere chosen. These last three deficiencies, in particular, create difficulties for researchersattempting to establish reliable cut scores.9
From a review <strong>of</strong> <strong>the</strong>se six studies, support for a specific Total cut score is not evident.Reported cut scores ranged from >13 to >40, and produced hit rates from .73 to .96; sensitivityfrom .87 to 1.00; specificity from .61 to .91; PPP from .49 to .87; and NPP from .62 to 1.00. Ofparticular interest, cut scores <strong>of</strong> >14 and >16 have yielded maximal NPP (1.00). These resultssuggest that <strong>the</strong> objective for <strong>the</strong> SIMS to serve as a screen by minimizing false negatives couldbe realized, if a reliable cut score could be established.Present StudyAs shown in Table 1.1, thus far no studies have been published evaluating <strong>the</strong> validity <strong>of</strong><strong>the</strong> SIMS in a civil forensic sample, and no forensic samples have included female participants.Given <strong>the</strong> prevalence estimates <strong>of</strong> malingering and <strong>the</strong> associated costs, it is important for a test<strong>of</strong> malingering to demonstrate <strong>utility</strong> in a civil forensic setting. Fur<strong>the</strong>r, its accuracy withwomen in a forensic setting must be empirically established. The present study examined <strong>the</strong>accuracy <strong>of</strong> <strong>the</strong> SIMS in predicting malingering in a sample <strong>of</strong> male and female plaintiffs inworkers’ compensation and personal injury lawsuits. Unlike in previous investigations, here <strong>the</strong>SIMS’ ability to detect both neurocognitive and psychiatric feigning was assessed againstcriterion measures appropriate for each type <strong>of</strong> feigning.Malingering and Honest groups were also examined for differences on demographicvariables such as gender, age, race, marital status, and education level, which might confoundgroup differences on <strong>the</strong> SIMS. Differences in types <strong>of</strong> symptoms claimed (pain, psychiatric,brain damage, physical, and medical) were assessed as well.Copyright ©2006 Yvonne Renee Alwes. All rights reserved.10
Table 1.1Previous SIMS StudiesAuthor(s) Design* Subjects** N > HR † Sens † Spec † PPP † NPP †Smith(1992) S undergrad ● ‡ 16 0.95 ● ‡ ● ‡ ● ‡ ● ‡Rogers et al.(1996) S w-s adol <strong>of</strong>f 53 16 ● ‡ ● ‡ ● ‡ 0.87 0.62Cut40 ● ‡ ● ‡ ● ‡ 0.49 0.94Smith &Burger(1997) S undergrad 476 14 0.95 0.96 0.88 ● ‡ ● ‡Edens et al.(1999) S w-s undergrad 196 14 0.96 0.96 0.91 ● ‡ ● ‡Heinze &Purisch(2001) KG max secur 57 13 ● ‡ 0.87 ● ‡ ● ‡ ● ‡Lewis et al.(2002) KGC crim def 55 16 0.73 1.00 0.61 0.54 1.00*S = Simulation, w-s = within-subjects, KG = Known-Group, KGC = Known-GroupsComparison**undergrad = undergraduate students, adol <strong>of</strong>f = adolescent <strong>of</strong>fenders, max secur =maximum security inmates, crim def = criminal defendants† HR = Hit Rate, Sens = Sensitivity, Spec = Specificity, PPP = Positive Predictive Power,NPP = Negative Predictive Power‡ Figures not published11
Chapter TwoMethodsParticipantsParticipants were 308 individuals who had filed workers’ compensation or personalinjury lawsuits and were assessed in a private forensic psychiatric practice in Lexington,Kentucky. Types <strong>of</strong> cases included: cases involving head injury (33.8%, n = 104); personalinjury cases not involving head injury (9.7%, n = 30); workers’ compensation cases notinvolving head injury (55.2%, n = 170); and fitness for duty evaluations (0.6%, n = 2). Althoughresidence information was not available, most <strong>of</strong> <strong>the</strong> individuals assessed at <strong>the</strong> psychiatricpractice were residents <strong>of</strong> Kentucky, and most o<strong>the</strong>rs resided in neighboring states. Men (n =203) comprised 65.9% <strong>of</strong> <strong>the</strong> sample. The average age was 41.31 years, and ages ranged from18 to 71 (SD = 11.245). The sample was predominantly Caucasian (93.2%, n = 287); 6.5% (n =20) were African-American, and 0.3 % (n = 1) belonged to an “O<strong>the</strong>r Single Race”. Educationallevel ranged from 0 to 25 years, with an average <strong>of</strong> 12.07 years (SD = 2.596). Marital statusesbroke down as follows: 65.9% married (n = 203); 17.2% divorced (n = 53); 11.7% single (n =36); 1.9% separated (n = 6); and 1.9% widowed (n = 6). Socioeconomic status information on<strong>the</strong> participants was not available. The psychiatric practice was hired by <strong>the</strong> plaintiff in 39.3% (n= 121) <strong>of</strong> <strong>the</strong> cases, and by <strong>the</strong> defendant in <strong>the</strong> remaining cases. All participants were seekingcompensation.MeasuresA large number <strong>of</strong> assessment instruments were administered to each participant by <strong>the</strong>staff <strong>of</strong> <strong>the</strong> psychiatric practice as per <strong>the</strong>ir protocol. Results from <strong>the</strong> following measures areexamined in this study:Background Questionnaire. This 22-page form, designed by <strong>the</strong> staff <strong>of</strong> <strong>the</strong> forensicpsychiatric practice where participants were examined, is completed by every individual assessedat <strong>the</strong> practice. Information collected via this form includes demographics as well as personal,medical, and legal history.12
Minnesota Multiphasic Personality Inventory – 2 nd Edition (MMPI-2; Butcher,Dahlstrom, Graham, Tellegen, & Kaemmer, 1989). The MMPI-2 is a 567-item true/false selfreporttest designed to assess <strong>the</strong> presence <strong>of</strong> various types <strong>of</strong> psychopathology. Its validityscales have been extensively tested in forensic environments, and <strong>the</strong> Infrequency scales – F, Fb,and F(p), along with F-K – have demonstrated validity in discriminating between honest andmalingering test-takers (Berry, Baer, & Harris, 1991; Rogers, Sewell, & Salekin, 1994; Arbisi &Ben-Porath, 1998), although specific scales and cut scores have not demonstrated consistent<strong>utility</strong> across studies (Lewis et al., 2002).Structured Interview <strong>of</strong> Reported Symptoms (SIRS; Rogers et al., 1992). The SIRS is a<strong>structured</strong> interview for assessing malingering. It consists <strong>of</strong> 172 true/false items that compriseeight primary scales (coefficient α= .86) and five supplementary scales (coefficient α= .75).The eight primary scales are: Blatant Symptoms (BL), Subtle Symptoms (SU), and Selectivity<strong>of</strong> Symptoms (SEL) scales, which assess endorsement frequency; Rare Symptoms (RS),Improbable and Absurd Symptoms (IA), Symptom Combinations (SC), and Severity <strong>of</strong>Symptoms (SEV) scales, which assess atypical symptom presentation; and <strong>the</strong> Reported versusObserved Symptoms (RO) scale, which measures <strong>the</strong> extent to which reported symptoms areobserved during <strong>the</strong> interview (Heinze & Purisch, 2001). Performance on each primary scale iscategorized as Honest, Indeterminate, Probable Feigning, or Definite Feigning. There are severalways to achieve <strong>the</strong> classification <strong>of</strong> overall feigning: (1) at least one primary scale score is in<strong>the</strong> Definite Feigning range; (2) at least three primary scale scores fall in <strong>the</strong> Probable Feigningrange; or (3) <strong>the</strong> Total raw score is greater than 76. In order to be classified as respondinghonestly, none <strong>of</strong> <strong>the</strong> malingering criteria may be met, and at least six primary scales must fall in<strong>the</strong> Honest range. Results which fail to meet criteria for ei<strong>the</strong>r malingering or honest respondingare classified as “indeterminate”. Classification procedures were designed by <strong>the</strong> test’s authorsto minimize false positive classifications. High overall classification accuracy and PPP greaterthan .95 have been found in relatively high base rate settings such as those in which malingeringis generally assessed (Rogers, 1997; Rogers, Bagby, & Dickens, 1992). The SIRS has beenvalidated with known malingerers and against MMPI-2 Infrequency scales.Victoria Symptom Validity Test (VSVT; Slick et al., 1997). The VSVT is a 48-item,computer-administered, two-alternative, forced-choice test <strong>of</strong> recognition memory that isinsensitive to neurocognitive impairment but sensitive to attempts to feign such deficits. The13
stimuli are series <strong>of</strong> numbers. Six VSVT scores are produced: Total Items Correct, Easy ItemsCorrect, Difficult Items Correct, Easy Items Response Latency, Difficult Items ResponseLatency, and Right-Left Preference. The proportion <strong>of</strong> items answered correctly is computedand scores below <strong>the</strong> cut score indicate malingering. The VSVT has been validated incompensation-seeking as well as non-compensation-seeking samples for <strong>the</strong> detection <strong>of</strong> pooreffort (Thompson, 2002). Coefficient α= .82 to .89; test-retest reliability = .53 to .84; sensitivity(proportion <strong>of</strong> malingerers successfully detected) = .83; and specificity (proportion <strong>of</strong> nonmalingererssuccessfully classified) = .95.Test <strong>of</strong> Memory Malingering (TOMM; Tombaugh, 1996). The TOMM is ano<strong>the</strong>r twoalternative,forced-choice visual recognition test developed to test inadequate effort by testtakers.It is computer-administered, and consists <strong>of</strong> 50 items composed <strong>of</strong> line-drawing stimuli.The TOMM is also insensitive to neurocognitive deficits and has been validated in <strong>the</strong> detection<strong>of</strong> attempts to malinger neurocognitive symptoms (Tombaugh, 2002). The TOMM yields a totalscore; <strong>the</strong> proportion <strong>of</strong> items answered correctly is computed and scores below <strong>the</strong> cut scoreindicate malingering. Coefficient α= .95; sensitivity = .48; and specificity = 1.00.Letter Memory Test (LMT; Inman et al., 1998). The LMT is a variable-alternative forcedchoice recognition test shown to be insensitive to true cognitive impairment yet sensitive tomalingering <strong>of</strong> impairment. It is also computer-administered, and is comprised <strong>of</strong> 45 itemsconsisting <strong>of</strong> series <strong>of</strong> consonants. The LMT was designed largely in response to <strong>the</strong> potentialeffects <strong>of</strong> attorney coaching in reducing <strong>the</strong> <strong>utility</strong> <strong>of</strong> existing tests. Whereas <strong>the</strong> TOMM and <strong>the</strong>VSVT implement one “decoy” stimulus per item, <strong>the</strong> LMT varies in apparent difficulty byincreasing both stimulus length (number <strong>of</strong> consonants) and <strong>the</strong> number <strong>of</strong> incorrect alternativespresented. The LMT has been validated in analogue studies with general collegeundergraduates, head injured undergraduates, head injured patients, and probable feigners in aforensic setting (Inman & Berry, 2002; Inman et al., 1998; Vickery et al., 2004). The proportion<strong>of</strong> items answered correctly is computed and scores below <strong>the</strong> cut score indicate malingering.Coefficient α= .94; sensitivity = .83 to .95; specificity = .94 to 1.00; and hit rate = .89.Structured Inventory <strong>of</strong> Malingered Symptomatology (SIMS; Smith & Burger, 1997).The SIMS is a 75-item true/false self-report measure consisting <strong>of</strong> five non-overlapping scales(Psychosis, Neurologic Impairment, Affective Disorders, Amnestic Disorders, and LowIntelligence) <strong>of</strong> 15 items each. Each scale is intended to assess feigning <strong>of</strong> a particular type <strong>of</strong>14
symptomatology. The Total score is simply <strong>the</strong> sum <strong>of</strong> <strong>the</strong> five scale scores and is used todetermine <strong>the</strong> overall classification (malingering or not). The SIMS has been validated withcollege student simulators and male criminal defendants. Psychometric characteristics andproposed cut scores were reviewed previously.ProcedureParticipants were assessed over two days by <strong>the</strong> staff <strong>of</strong> <strong>the</strong> psychiatric practice. Staffmembers administering <strong>the</strong> various assessment instruments held Master’s degrees in Psychologyand were supervised by Ph. D.-level psychologists. All participants signed a consent formagreeing to allow <strong>the</strong>ir results to be used in this study. Per <strong>the</strong> practice’s standard procedure,assessment began with participant completion <strong>of</strong> a lengthy information-ga<strong>the</strong>ring questionnairedesigned by <strong>the</strong> staff. Participants were <strong>the</strong>n administered multiple measures, which includedtests <strong>of</strong> neurocognitive functioning and/or tests <strong>of</strong> psychopathology. Some instruments wereselected by staff according to <strong>the</strong> type(s) <strong>of</strong> problems claimed by <strong>the</strong> plaintiff (e.g., ifneurocognitive deficits were claimed, tests designed to assess neurocognitive functioning as wellas feigning were administered). O<strong>the</strong>r measures were administered to all participants.Individuals were included in <strong>the</strong> study if <strong>the</strong>y provided signed consent to participate andcompleted <strong>the</strong> SIRS, <strong>the</strong> VSVT, <strong>the</strong> TOMM, <strong>the</strong> LMT, and <strong>the</strong> SIMS.Results from this study were intended to assess <strong>the</strong> ability <strong>of</strong> <strong>the</strong> SIMS to screen for <strong>the</strong>two major types <strong>of</strong> feigning: psychiatric and neurocognitive. Toward that end, four pairs <strong>of</strong>groups were formed to allow for four sets <strong>of</strong> contrasts between malingering and honestrespondents. Following are detailed descriptions <strong>of</strong> how each pair <strong>of</strong> contrast groups was formedalong with rationales for each formulation.Group Contrast #1: Psychiatric Symptom Malingering vs. Honest Reporting. The firstcontrast pair was designed to compare <strong>the</strong> performances <strong>of</strong> participants who <strong>malingered</strong>psychiatric symptoms, as determined by <strong>the</strong> SIRS, with those who were determined to haveresponded honestly on <strong>the</strong> SIRS. Participants were included in <strong>the</strong> Psychiatric – Malingering(PM) group if <strong>the</strong>ir SIRS results met at least one <strong>of</strong> <strong>the</strong> following criteria: (1) at least one SIRSPrimary scale indicated Definite Malingering; (2) at least three SIRS Primary scales indicatedProbable Malingering; or (3) <strong>the</strong> Total SIRS raw score exceeded 76. Participants were includedin <strong>the</strong> Psychiatric – Honest (PH) group if <strong>the</strong>y did not meet criteria for <strong>the</strong> PM group and at least15
six SIRS Primary scales indicated Honest responding. All remaining participants were classifiedas Psychiatric – Indeterminate (PI). (As <strong>the</strong>ir statuses could not be confidently determined, thosewith Indeterminate classifications were omitted from fur<strong>the</strong>r analyses in all group contrasts.)Table 2.1 displays <strong>the</strong> numbers <strong>of</strong> participants in <strong>the</strong> malingering, honest, andindeterminate groups along with <strong>the</strong> base rates <strong>of</strong> malingering for each <strong>of</strong> <strong>the</strong> four contrasts (<strong>the</strong>remaining three contrasts are defined below). As this table indicates, <strong>the</strong> PM group numbered23, while <strong>the</strong> PH group included 172 subjects; <strong>the</strong> base rate <strong>of</strong> psychiatric malingering in thissample is 7.5%.Comparisons between <strong>the</strong> PM and PH groups allow <strong>the</strong> evaluation <strong>of</strong> differences betweenlitigants who malinger psychiatric symptoms and those who do not; specifically, <strong>the</strong> performance<strong>of</strong> <strong>the</strong> SIMS in distinguishing between <strong>the</strong>se individuals can be assessed. As discussed earlier, aprimary purpose <strong>of</strong> <strong>the</strong> SIMS is to screen out a substantial number <strong>of</strong> individuals who are clearlyhonest in <strong>the</strong>ir reports <strong>of</strong> psychiatric symptomatology.Group Contrast #2: Neurocognitive Symptom Malingering vs. Honest Reporting. Thesecond pair <strong>of</strong> groups allowed for <strong>the</strong> comparison <strong>of</strong> results <strong>of</strong> participants who <strong>malingered</strong>neurocognitive impairment with those <strong>of</strong> subjects who responded honestly on tests <strong>of</strong>neurocognitive effort. Participants were included in <strong>the</strong> Neurocognitive – Malingering (NM)group if <strong>the</strong> results <strong>of</strong> two or more tests among <strong>the</strong> VSVT, TOMM, and LMT indicatedMalingering. Participants were classified as members <strong>of</strong> <strong>the</strong> Neurocognitive – Honest (NH)group if none <strong>of</strong> <strong>the</strong> three tests <strong>of</strong> neurocognitive effort (VSVT, TOMM, and LMT) indicatedMalingering. All remaining participants were classified as Neurocognitive – Indeterminate (NI)and excluded from this comparison. Seventy-five subjects met criteria for <strong>the</strong> NM group; <strong>the</strong>NH group included 178, yielding a base rate <strong>of</strong> neurocognitive malingering equal to 24.4% (seeTable 2.1).Comparisons between <strong>the</strong>se two groups make it possible to evaluate differences betweenlitigants who malinger neurocognitive symptoms and those who do not; ultimately, <strong>the</strong>performance <strong>of</strong> <strong>the</strong> SIMS in distinguishing between <strong>the</strong>se individuals can be assessed. As with<strong>the</strong> first contrast described above, this contrast represents a common real-world situation inwhich <strong>the</strong> SIMS is designed to be useful in separating individuals who are clearly honest in <strong>the</strong>irneurocognitive symptom reports from those who are not.16
Group Contrast #3: Psychiatric and Neurocognitive Symptom Malingering vs. HonestReporting. The third contrast pair assessed a more blatant feigning strategy. Participants whomet <strong>the</strong> criteria (as defined above) for both <strong>the</strong> PM group and <strong>the</strong> NM group were included in <strong>the</strong>Psychiatric and Neurocognitive – Malingering (PNM) group. Those who met criteria for both<strong>the</strong> PH and NH groups comprised <strong>the</strong> Psychiatric + Neurocognitive – Honest (PNH) group. Allremaining participants were classified as Psychiatric/Neurocognitive – Indeterminate (PNI) andexcluded from this contrast. The PNM group included 13 subjects, and 121 were members <strong>of</strong> <strong>the</strong>PNH group, resulting in a base rate <strong>of</strong> 4.2% for malingering <strong>of</strong> both psychiatric andneurocognitive symptoms (see Table 2.1).Comparisons between <strong>the</strong>se two groups allow <strong>the</strong> evaluation <strong>of</strong> differences betweenlitigants who malinger both psychiatric and neurocognitive symptoms and those who do notmalinger ei<strong>the</strong>r type <strong>of</strong> symptom; again, <strong>the</strong> performance <strong>of</strong> <strong>the</strong> SIMS in distinguishing between<strong>the</strong>se individuals can be tested. These analyses will be informative about litigants who malingera wider range <strong>of</strong> symptoms, those who are most clearly responding honestly across a range <strong>of</strong>symptom reports, and how <strong>the</strong> contrasts between <strong>the</strong>se individuals differ from more standardcomparisons. It is expected that <strong>the</strong> distinctions between <strong>the</strong>se two groups will be moredramatic, as members <strong>of</strong> each are held to a more stringent standard <strong>of</strong> malingering or honestresponding. Individuals who malinger both types <strong>of</strong> symptoms may be thought <strong>of</strong> asmalingering more “extremely”.Group Contrast #4: Psychiatric or Neurocognitive Symptom Malingering vs. HonestReporting. The final set <strong>of</strong> groups allowed for a more general comparison between malingerersand honest responders. Any participant who qualified for <strong>the</strong> PM group and/or <strong>the</strong> NM group –that is, anyone who <strong>malingered</strong> psychiatric and/or neurocognitive symptoms – was included in<strong>the</strong> Any – Malingering (AM) group. The same PNH group <strong>of</strong> 121 subjects used in <strong>the</strong> third set<strong>of</strong> comparisons – those who responded honestly on <strong>the</strong> SIRS, <strong>the</strong> TOMM, <strong>the</strong> VSVT, and <strong>the</strong>LMT – formed <strong>the</strong> Honest group for this contrast as well. All remaining participants wereclassified as Any – Indeterminate (AI) and excluded from <strong>the</strong>se comparisons. Eighty-fivesubjects belonged to <strong>the</strong> AM group, producing a base rate <strong>of</strong> 27.6% (refer to Table 2.1). Notethat because <strong>the</strong> PM and NM groups overlapped substantially (sharing 13 participants), and <strong>the</strong>PH and NH groups overlapped even more so (with 121 in common), <strong>the</strong> base rate <strong>of</strong> psychiatricor neurocognitive malingering cannot be computed by adding <strong>the</strong> psychiatric base rate to <strong>the</strong>17
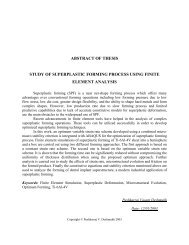
neurocognitive base rate. Figure 2.1 helps to clarify group breakdowns by depicting <strong>the</strong> overlapbetween <strong>the</strong> PM and NM groups, <strong>the</strong> PH and NH groups, and <strong>the</strong> PI and NI groups.Comparisons between <strong>the</strong>se final two groups allow <strong>the</strong> evaluation <strong>of</strong> differences betweenlitigants who malinger psychiatric symptoms, neurocognitive symptoms, or both and those whodo not malinger any <strong>of</strong> <strong>the</strong>se symptoms; in particular, <strong>the</strong> performance <strong>of</strong> <strong>the</strong> SIMS indistinguishing between <strong>the</strong>se individuals can be assessed. Due to <strong>the</strong> wider variation within <strong>the</strong>Any – Malingering group, <strong>the</strong>se AM and PNH groups are expected to show less disparity than<strong>the</strong> first three pairs <strong>of</strong> groups, providing <strong>the</strong> most general yet perhaps most challenging test <strong>of</strong> <strong>the</strong>SIMS. In <strong>the</strong> “real world”, <strong>the</strong> most likely scenario may be simply trying to identify who ismalingering in some way. If <strong>the</strong> SIMS can reliably distinguish malingerers <strong>of</strong> any symptom fromhonest responders, it may demonstrate its most general <strong>utility</strong>.Power AnalysesPrevious research by Lewis et al. (2002) with a criminal forensic sample reported effectsizes for discrimination by <strong>the</strong> SIMS scales ranging from 1.1 for <strong>the</strong> Low Intelligence Scalescore to 3.0 for <strong>the</strong> Total score. Table 2.2 shows power analyses based on <strong>the</strong> current sample <strong>of</strong>308 participants and an α= .01; as sample size varies across <strong>the</strong> four group contrasts, powerlevels for <strong>the</strong> various contrast groups range from 79.02% to 100% to detect effects <strong>of</strong> size 1.0.Copyright ©2006 Yvonne Renee Alwes. All rights reserved.18
Table 2.1Group Ns and Malingering Base Rates for Four ContrastsType <strong>of</strong> Malingering M † H † I † Base Rate*Psychiatric 23 172 113 7.5%Neurocognitive 75 178 55 24.4%Both Psychiatric and Neurocognitive 13 121 174 4.2%Any 85 121 102 27.6%† M = Malingering, H = Honest, I = Indeterminate*N = 30819
Table 2.2Power <strong>of</strong> Contrasts to Detect Effects <strong>of</strong> Various Sizes*Group NsEffect SizeM ‡ H ‡ 0.2 0.5 0.8 1.0 2.0 3.0PM-PH † 23 172 4.65% 36.58% 84.05% 97.06% 100.00% 100.00%NM-NH † 75 178 12.87% 84.90% 99.93% 100.00% 100.00% 100.00%PNM-PNH † 13 121 2.93% 18.83% 55.20% 79.02% 100.00% 100.00%AM-PNH † 85 121 12.02% 82.34% 99.88% 100.00% 100.00% 100.00%*α = .01‡ M = Malingering, H = Honest† PM = Psychiatric – Malingering, PH = Psychiatric – Honest, NM = Neurocognitive –Malingering, NH = Neurocognitive – Honest, PNM = Psychiatric/Neurocognitive –Malingering, PNH = Psychiatric/Neurocognitive – Honest, AM = Any – Malingering20
MalingeringPM = 23P Only = 10PNM = 13N Only = 62AM = 85NM = 75HonestPH = 172P Only = 51PNH = 121N Only = 57Any H = 229NH = 178IndeterminatePI = 113P Only = 83PNI = 30N Only = 25AI = 138NI = 55Figure 2.1. Overlap between Psychiatric and Neurocognitive types <strong>of</strong> Malingering, Honest, andIndeterminate participants21
Chapter ThreeResultsAnalyses are presented below in three major sections. In <strong>the</strong> Group Differences section,results <strong>of</strong> t-tests and χ 2 tests on background variables and test scores are reported. Next, areaunder <strong>the</strong> receiver operating characteristic curve (AUC) computations and results <strong>of</strong> linearregression analyses illustrate <strong>the</strong> ability <strong>of</strong> <strong>the</strong> SIMS to predict malingering at <strong>the</strong> group level;<strong>the</strong>se results are described in <strong>the</strong> SIMS’ Prediction <strong>of</strong> Malingering section. Finally, in <strong>the</strong> BaseRates and Classification Accuracy Statistics section, <strong>the</strong> base rate and <strong>the</strong> SIMS’ hit rate,sensitivity, specificity, positive predictive power, negative predictive power, incremental positivepredictive power (IPPP, which equals PPP – Base Rate), and incremental negative predictivepower (INPP, which equals NPP – [1 – Base Rate]) for each pair <strong>of</strong> contrast groups at eachproposed SIMS cut score are presented.Group DifferencesBackground variables, scores on criterion tests (<strong>the</strong> SIRS, TOMM, VSVT, and LMT),MMPI-2 scores, and performance on <strong>the</strong> SIMS by members <strong>of</strong> <strong>the</strong> Malingering and Honestgroups were compared by way <strong>of</strong> t-tests and χ 2 tests for each pair <strong>of</strong> contrast groups. Due to <strong>the</strong>high number <strong>of</strong> statistical tests performed, an αlevel <strong>of</strong> .01 was applied to all tests <strong>of</strong> statisticalsignificance. Additionally, effect sizes were computed using Cohen’s d (Cohen, 1977).Psychiatric Malingering vs. Honest Groups (PM vs. PH)All participants who were determined to be malingering according to <strong>the</strong> SIRS – 23 in all– were included in <strong>the</strong> Psychiatric – Malingering (PM) group in this comparison. Those whowere found to be honest according to <strong>the</strong> SIRS (n = 172) were included in <strong>the</strong> Psychiatric –Honest (PH) group. (See <strong>the</strong> Methods – Measures sub-section to review <strong>the</strong> SIRS Malingeringand Honest criteria.) The base rate <strong>of</strong> malingering in this subsample was 7.5% (refer to Table2.1).22
Background variables. Table 3.1 displays means, standard deviations, t values, andeffect sizes for age and education level. No significant differences between psychiatricmalingerers and honest responders were detected. Proportions <strong>of</strong> participants in each category <strong>of</strong>race, gender, marital status, and type <strong>of</strong> claim (pain, psychiatric, brain damage, physical, andmedical) are shown in Table 3.2. No significant differences between psychiatric malingerers andhonest responders with respect to any <strong>of</strong> <strong>the</strong>se variables were detected.Neurocognitive Test Scores. Table 3.3 shows results for <strong>the</strong> tests <strong>of</strong> neurocognitiveeffort. Lower scores on <strong>the</strong>se tests are suggestive <strong>of</strong> malingering. Interestingly, <strong>the</strong>sepsychiatric malingerers scored significantly lower than honest respondents on Trial 2 <strong>of</strong> <strong>the</strong>TOMM, <strong>the</strong> VSVT Difficult and Total, and <strong>the</strong> LMT, although nei<strong>the</strong>r PM nor PH groupmembers were selected on <strong>the</strong> basis <strong>of</strong> neurocognitive malingering test scores. Effect sizes fordifferences on <strong>the</strong> neurocognitive malingering tests ranged from -1.01 (VSVT Difficult) to -1.25(LMT). Fur<strong>the</strong>r analysis provided a partial explanation for this effect, showing that 56.5% (13)<strong>of</strong> <strong>the</strong> PM group (n = 23) also <strong>malingered</strong> neurocognitive symptoms, while 70.3% (121) <strong>of</strong> <strong>the</strong>PH group (n = 172) were also honest responders with respect to <strong>the</strong> neurocognitive testing.(Relationships among psychiatric malingering classifications and neurocognitive feigningdesignations are clarified by examination <strong>of</strong> Table 3.4, which shows <strong>the</strong> numbers <strong>of</strong> individualsclassified as malingering, honest, and indeterminate with respect to neurocognitive as well aspsychiatric symptom reporting. Psychiatric designations are crossed with neurocognitive ones toshow how <strong>the</strong>se classifications intersect.)MMPI-2 Scores. Means, standard deviations, t-test results, and d scores for all MMPI-2Validity scales are presented in Table 3.5. Scores on all MMPI-2 Infrequency scales (F, Fb,F[p], and <strong>the</strong> F – K index) were higher in <strong>the</strong> malingering group; effect sizes ranged from 1.23(F[p]) to 2.92 (Fb). These results are consistent with expectations, as <strong>the</strong> Infrequency scaleswere designed to be sensitive to endorsement <strong>of</strong> rare symptoms, and have seen some use in <strong>the</strong>detection <strong>of</strong> malingering (see MMPI-2 discussion in <strong>the</strong> Methods – Measures sub-section).Malingerers scored lower than honest respondents on <strong>the</strong> MMPI-2 K and S scales, withrespective effect sizes <strong>of</strong> -0.92 and -1.10, suggesting lower levels <strong>of</strong> defensiveness in psychiatricmalingerers, as might be predicted. The VRIN, TRIN, and L scales showed no significantdifferences between <strong>the</strong> groups.23
As seen in Table 3.6, MMPI-2 clinical scale scores (except for scale 5) were higher in <strong>the</strong>malingering group than in <strong>the</strong> honest group. Effect sizes ranged from 0.69 (scale 9) to 2.03(scale 6). This suggests that, as one might anticipate, malingerers endorsed symptoms across arange <strong>of</strong> psychopathology at a significantly higher-than-normal rate.SIMS Scores. As shown in Table 3.7, all SIMS scores were significantly higher in <strong>the</strong>malingering group. Robust effect sizes were produced: 2.55 (Total), 1.85 (N), 1.42 (Af), 3.27(P), 0.94 (LI), and 1.77 (Am). This provides initial confirmation that <strong>the</strong> SIMS Total and all itssub-scales show some ability to distinguish groups malingering psychiatric symptoms from thosewho are not. The Psychotic symptoms (P) scale showed <strong>the</strong> largest effect, suggesting that <strong>the</strong>effect <strong>of</strong> psychiatric malingering on SIMS scores in this sample may be largely due toendorsement <strong>of</strong> psychotic symptoms. This is consistent with <strong>the</strong> largest SIRS effect size for <strong>the</strong>BL (Blatant symptoms) scale (d = 7.21) and <strong>the</strong> largest MMPI-2 clinical scale effect sizes forscales 6 (Paranoia) and 8 (Schizophrenia) <strong>of</strong> 2.03 and 1.97, respectively (see Table 3.6).Neurocognitive Malingering vs. Honest Groups (NM vs. NH)All participants who were determined to be malingering according to at least two <strong>of</strong> <strong>the</strong>three tests <strong>of</strong> neurocognitive effort (<strong>the</strong> TOMM, VSVT, and LMT; n = 75) were included in <strong>the</strong>Neurocognitive – Malingering (NM) group in this comparison. Those who were found to behonest according to <strong>the</strong> TOMM, VSVT, and LMT were included in <strong>the</strong> Honest (NH) group (n =178). (See <strong>the</strong> Methods – Measures sub-section to review <strong>the</strong> TOMM, VSVT, and LMTMalingering and Honest criteria.) The base rate <strong>of</strong> malingering in this subsample was 24.4%(see Table 2.1).Background variables. Table 3.8 displays results <strong>of</strong> t-tests and effect sizes for age andeducation level for <strong>the</strong>se two groups. As shown, no significant differences were detected. InTable 3.9, χ 2 results for comparisons on race, gender, marital status, and claim types arepresented, and, again, no differences were found between neurocognitive malingerers and honestresponders.SIRS Scores. Notably, as seen in Table 3.10, all SIRS scales and <strong>the</strong> SIRS Total showedsubstantially higher scores in <strong>the</strong> neurocognitive malingering group, suggestive <strong>of</strong> psychiatricmalingering by <strong>the</strong> NM participants; effect sizes ranged from .49 on <strong>the</strong> RS (Rare Symptoms)scale to .99 on <strong>the</strong> Total score. This is interesting because psychiatric symptom malingering24
status was not a criterion for NM or NH group membership. While 68% (121) <strong>of</strong> <strong>the</strong> NH groupmembers (n = 178) were also honest with respect to psychiatric malingering, only 17.3% (13) <strong>of</strong><strong>the</strong> NM group members (n = 75) also <strong>malingered</strong> psychiatric symptoms (see Table 3.4). Theseresults suggest that <strong>the</strong> SIRS may <strong>of</strong>fer some <strong>utility</strong> in discriminating neurocognitive malingerersfrom honest responders. It is interesting that <strong>the</strong> neurocognitive malingerers (in comparison toneurocognitive honest responders) showed a greater effect size – .91 – for <strong>the</strong> SU (SubtleSymptoms) scale than for any o<strong>the</strong>r sub-scale, reflecting a pattern <strong>of</strong> differential psychiatricsymptom endorsement distinct from that <strong>of</strong> <strong>the</strong> psychiatric malingerers (in comparison with <strong>the</strong>psychiatric honest responders), who, instead, showed <strong>the</strong> greatest effect size for BlatantSymptom reporting.MMPI-2 Scores. Table 3.11 displays means, standard deviations, t-test results, and dscores for all MMPI-2 Validity scales. Scores on all MMPI-2 Infrequency scales (F, Fb, F[p],and <strong>the</strong> F – K index) were higher in <strong>the</strong> neurocognitive malingering group; effect sizes rangedfrom 0.57 (F[p]) to 1.16 (F). This is particularly notable given that <strong>the</strong>se scales reflectendorsement <strong>of</strong> infrequently reported psychiatric symptoms. No differences in VRIN, TRIN, L,K, or S scores were found.As seen in Table 3.12, MMPI-2 clinical scale scores (except for scales 4, 5, and 9) werehigher in <strong>the</strong> malingering group than in <strong>the</strong> honest group. Effect sizes ranged from 0.47 (scale 1)to 1.12 (scale 8). These results, as those from <strong>the</strong> SIRS (above), suggest that neurocognitivemalingerers are also reporting significantly more symptoms <strong>of</strong> various types <strong>of</strong> psychopathology.It is interesting that <strong>the</strong> largest effect size among <strong>the</strong> MMPI-2 clinical scales is for scale 8(Schizophrenia), suggesting (unlike <strong>the</strong> SIRS results) that <strong>the</strong> largest differences were in <strong>the</strong>reporting <strong>of</strong> psychotic-like symptoms.SIMS Scores. Table 3.13 shows that all SIMS scores were higher for neurocognitivemalingerers, with effect sizes <strong>of</strong> 1.13 (Total), 0.80 (N), 0.61 (Af), 0.82 (P), 0.41 (LI), and 1.23(Am). Given <strong>the</strong> limited overlap <strong>of</strong> <strong>the</strong> PM group into <strong>the</strong> NM group (only 13 <strong>of</strong> 75, or 17.3%,<strong>of</strong> NM group members are also PM group members – see Table 3.4), it is noteworthy that <strong>the</strong>SIMS Total and all its sub-scales show significant effectiveness in distinguishing individualsmalingering neurocognitive symptoms from those who are not. The largest effect size for <strong>the</strong>Am (Amnestic symptoms) scale (d = 1.23) is not surprising for a group defined by its poorperformance on neurocognitive malingering measures that appear to be memory tests. The N25
(Neurologic symptom) scale d <strong>of</strong> .80 is in <strong>the</strong> mid-range <strong>of</strong> <strong>the</strong> SIMS scale effect sizes. At <strong>the</strong>same time, it is interesting that <strong>the</strong> LI (Low Intelligence) scale effect size <strong>of</strong> .41 is <strong>the</strong> smallest,suggesting that <strong>the</strong>re is more <strong>of</strong> a difference between neurocognitive malingerers and honestresponders in <strong>the</strong> endorsement <strong>of</strong> Affective and Psychotic symptoms than <strong>the</strong>re is in LowIntelligence symptom reporting.Both Psychiatric and Neurocognitive Malingering vs. Honest Groups (PNM vs. PNH)Participants who were determined to be malingering according to <strong>the</strong> SIRS and at leasttwo <strong>of</strong> <strong>the</strong> three tests <strong>of</strong> neurocognitive effort (<strong>the</strong> TOMM, VSVT, and LMT; n = 13) wereincluded in <strong>the</strong> Malingering (PNM) group for this comparison. Those who were found to behonest according to <strong>the</strong> TOMM, VSVT, LMT, and <strong>the</strong> SIRS (n = 121) were included in <strong>the</strong>Honest (PNH) group. The base rate <strong>of</strong> malingering in this subsample was 4.2% (refer to Table2.1).Background variables. Table 3.14 shows results <strong>of</strong> t-tests for age and education level.No significant differences between malingerers <strong>of</strong> both psychiatric and neurocognitive symptomsand honest responders were found. Additionally, Table 3.15 shows that no differences in <strong>the</strong>rates <strong>of</strong> any race, gender, marital status, or claim type were detected.MMPI-2 Scores. Results <strong>of</strong> t-tests and effect sizes for all MMPI-2 Validity scales areshown in Table 3.16. Scores on all MMPI-2 Infrequency scales (F, Fb, F[p], and <strong>the</strong> F – Kindex) were higher in <strong>the</strong> malingering group, suggesting more psychiatric symptomendorsement; effect sizes ranged from 1.44 (F[p]) to 3.21 (Fb). In addition, psychiatric +neurocognitive malingerers scored lower than honest respondents on <strong>the</strong> MMPI-2 K(Defensiveness) and S (Superiority) scales, with respective effect sizes <strong>of</strong> -0.77 and -0.91. Asdiscussed in previous sections, <strong>the</strong>se results make sense given <strong>the</strong> respective purposes <strong>of</strong> <strong>the</strong>seMMPI-2 scales.Fur<strong>the</strong>r, MMPI-2 clinical scale scores (except for scales 5 and 9), as reported in Table3.17, were higher in <strong>the</strong> malingering group than in <strong>the</strong> honest group. Effect sizes ranged from1.05 (scales 3 and 0) to 2.67 (scale 8). Again, malingerers – all <strong>of</strong> whom were determined tohave <strong>malingered</strong> psychiatric symptoms – endorsed a variety <strong>of</strong> symptoms <strong>of</strong> psychopathology.SIMS Scores. Participants who <strong>malingered</strong> both psychiatric and neurocognitivesymptoms scored significantly higher on all SIMS scales as well. Table 3.18 shows <strong>the</strong>se results,26
which yielded effect sizes <strong>of</strong> 3.37 (Total), 2.20 (N), 1.45 (Af), 4.25 (P), 1.28 (LI), and 2.67(Am). As expected, <strong>the</strong> effect sizes are higher for this contrast than for <strong>the</strong> first two. ThesePNM malingerers are feigning both psychiatric problems and neurocognitive deficits – and <strong>the</strong>PNH group members are honest with respect to reporting <strong>of</strong> both types <strong>of</strong> symptoms. Thus, itseems logical that <strong>the</strong> differences between <strong>the</strong>se two groups would be starker. Interestingly, <strong>the</strong>largest differences between <strong>the</strong>se malingering and honest groups were demonstrated to be in <strong>the</strong>endorsement <strong>of</strong> severe symptoms (SIRS SEV scale, d = 12.47), schizophrenia-related symptoms(MMPI-2 Scale 8, d = 2.67), and psychotic symptoms (SIMS P scale, d = 4.25).Any Malingering vs. Honest Groups (AM vs. PNH)The final set <strong>of</strong> contrasts compared malingerers <strong>of</strong> any type <strong>of</strong> symptoms (psychiatricand/or neurocognitive) with <strong>the</strong> PNH group. Participants were included in <strong>the</strong> Malingering(AM) group if <strong>the</strong>y were determined to be malingering according to one or both <strong>of</strong> <strong>the</strong> followingcriteria: (a) <strong>the</strong> SIRS; and/or (b) at least two <strong>of</strong> <strong>the</strong> three tests <strong>of</strong> neurocognitive effort (<strong>the</strong>TOMM, VSVT, and LMT). Eighty-five participants met this condition. As in <strong>the</strong> previouscontrast, those who were found to be honest according to <strong>the</strong> TOMM, VSVT, LMT, and <strong>the</strong>SIRS – n = 121 – were included in <strong>the</strong> Honest (PNH) group. The base rate <strong>of</strong> malingering in thissubsample was 27.6% (see Table 2.1).Background variables. Table 3.19 shows that no significant differences in age oreducation level were found when comparing <strong>the</strong> AM and PNH groups. In addition, <strong>the</strong> results inTable 3.20 indicate that no significant differences with respect to race, gender, marital status, orclaim type were found between malingerers <strong>of</strong> psychiatric or neurocognitive symptoms andhonest responders.MMPI-2 Scores. Results <strong>of</strong> t-tests and effect sizes for all MMPI-2 Validity scales arepresented in Table 3.21. Scores on all MMPI-2 Infrequency scales (F, Fb, F[p], and <strong>the</strong> F – Kindex) were, again, higher in <strong>the</strong> malingering group; effect sizes ranged from 0.71 (F[p]) to 1.59(F). Malingerers scored lower than honest respondents on <strong>the</strong> MMPI-2 K and S scales (withrespective effect sizes <strong>of</strong> -0.50 and -0.45). These results are expected for reasons alreadydiscussed; and due to <strong>the</strong> more inclusive AM group, <strong>the</strong> effect sizes are smaller than in previouscomparisons.27
MMPI-2 Clinical scale t-test results and d values appear in Table 3.22. Clinical scalescores (except for scales 4, 5, and 9) were higher in <strong>the</strong> malingering group than in <strong>the</strong> honestgroup. Effect sizes ranged from 0.73 (scale 3) to 1.46 (scale 8). Even in this “weaker” contrast,a wide range <strong>of</strong> psychopathology is reported and effect sizes remain large.SIMS Scores. Finally, comparison <strong>of</strong> participants malingering ei<strong>the</strong>r psychiatric orneurocognitive symptoms or both with those malingering nei<strong>the</strong>r type <strong>of</strong> symptom shows higherscores for malingerers on all SIMS scales (see Table 3.23). Effect sizes produced are: 1.46(Total), 1.14 (N), 0.97 (Af), 0.94 (P), 0.47 (LI), 1.39 (Am). All but one (LI) <strong>of</strong> <strong>the</strong>se is large, andall are smaller than effects for comparisons involving only psychiatric symptom malingerers, butlarger than those for <strong>the</strong> NM-NH comparison. Once again, preliminary support for <strong>the</strong> screening<strong>utility</strong> <strong>of</strong> <strong>the</strong> SIMS at <strong>the</strong> group level is suggested.As one might predict, <strong>the</strong>re is more variability in <strong>the</strong> types <strong>of</strong> symptoms tapped by <strong>the</strong>scales generating <strong>the</strong> largest effect sizes in this AM vs. PNH comparison. The SIRS scaleshowing <strong>the</strong> greatest effect size is SEV (Severity <strong>of</strong> symptoms; d = 2.04); <strong>the</strong> largest effect sizefor an MMPI-2 clinical scale is that for scale 8 (Schizophrenia; d = 1.46); but <strong>the</strong> mostsubstantial SIMS scale effect size is <strong>the</strong> Total (d = 146), followed closely by Am (Amnesticsymptoms; d = 1.39) and <strong>the</strong>n N (Neurologic symptoms; d = 1.14). Although <strong>the</strong> PM vs. PH andNM vs. NH contrasts suggested substantial overlap between PM and NM groups in <strong>the</strong> type <strong>of</strong>symptom endorsement, only 27.1% (23) <strong>of</strong> <strong>the</strong> AM group (n = 85) was determined to have<strong>malingered</strong> psychiatric symptoms; it may <strong>the</strong>n stand to reason that <strong>the</strong> SIMS would show smallereffect sizes for psychiatric symptom scales than for <strong>the</strong> Am and N scales in this comparison.Summary <strong>of</strong> Group Differences on Background VariablesNo significant differences with respect to race, gender, age, educational level, or maritalstatus were found between any <strong>of</strong> <strong>the</strong> contrast group pairs. Additionally, no differences in <strong>the</strong>rates <strong>of</strong> any types <strong>of</strong> claims (pain, psychiatric, brain damage, physical, or medical) were detectedin any <strong>of</strong> <strong>the</strong>se comparisons. These results indicate that malingering and honest groups werecomparable on <strong>the</strong>se demographic and litigation variables.28
Summary <strong>of</strong> Group Differences on Test ScoresAll differences found on SIRS (Total and sub-scale), TOMM, VSVT, LMT, and MMPI-2Validity and Clinical scale scores were in <strong>the</strong> expected directions. Fur<strong>the</strong>r, in each comparison,<strong>the</strong> SIMS sub-scale and Total scores were significantly higher in <strong>the</strong> malingering group, lendinggeneral support to <strong>the</strong> role <strong>of</strong> <strong>the</strong> SIMS scales as indicators <strong>of</strong> malingering, at least at <strong>the</strong> grouplevel.Examination <strong>of</strong> effect sizes for <strong>the</strong> various psychiatric symptom-oriented test scoredifferences across all four contrasts shows a clear pattern <strong>of</strong> results. Table 3.24 compares effectsizes <strong>of</strong> some <strong>of</strong> <strong>the</strong> test score differences for <strong>the</strong> four pairs <strong>of</strong> malingering and honest groupsand highlights this pattern. For most <strong>of</strong> <strong>the</strong> scores, including those for all SIRS scales, <strong>the</strong> SIRSTotal, MMPI-2 Infrequency scales, MMPI-2 clinical scales, all SIMS scales, and <strong>the</strong> SIMS Total,<strong>the</strong> PNM – PNH comparisons yielded <strong>the</strong> largest effect sizes. This is consistent with predictionsthat <strong>the</strong> greatest disparities would be found between <strong>the</strong> PNM and PNH groups. Thesemalingerers do appear to malinger more “extremely” in comparison to participants who areclearly honest in all symptom reporting, as contrasted with malingerers in <strong>the</strong> o<strong>the</strong>r comparisons.The best support for this hypo<strong><strong>the</strong>sis</strong> in this group comparison is provided by <strong>the</strong> MMPI-2 andSIMS results, as scores on <strong>the</strong>se tests were not included in <strong>the</strong> criteria for group membership.The pattern continues with all <strong>the</strong>se same tests showing <strong>the</strong> next-largest effect sizes in <strong>the</strong>PM – PH comparisons. These results make sense for <strong>the</strong> SIRS, which was designed to detectpsychiatric symptom malingering, <strong>the</strong> MMPI-2 clinical scales, which measure psychiatricsymptom endorsement, and <strong>the</strong> MMPI-2 Infrequency scales, which are intended to detect highendorsement <strong>of</strong> infrequently reported psychiatric symptoms. It is interesting that all <strong>of</strong> <strong>the</strong> SIMSscales and <strong>the</strong> Total are also next most successful at detecting group differences betweenpsychiatric malingerers and honest responders (see Table 3.25 for all SIMS subscale and Totaleffect sizes for all comparisons).Among <strong>the</strong>se same tests, <strong>the</strong> AM – PNH comparisons produced <strong>the</strong> third highest set <strong>of</strong>effect sizes. As discussed previously, <strong>the</strong> weaker contrast between <strong>the</strong>se two groups wasexpected to present more <strong>of</strong> a challenge to tests in attempts to distinguish malingerers fromhonest responders. Notably, however, at this group level <strong>of</strong> analysis, <strong>the</strong> SIMS Total d scoreremained substantial (1.46).29
Finally, <strong>the</strong> smallest effect sizes in <strong>the</strong>se test score differences were found for <strong>the</strong> NM –NH comparisons. For <strong>the</strong> SIRS and MMPI-2 scales, <strong>the</strong>se results make sense, as <strong>the</strong>se tests aredesigned to detect reporting <strong>of</strong> false psychiatric symptoms. It is interesting, however, that notonly <strong>the</strong> SIMS Total, but all SIMS scales, including those designed to detect malingering reports<strong>of</strong> Low Intelligence, Amnestic, and Neurologic symptoms, show <strong>the</strong> smallest effect sizes in thisNM – NH comparison (refer again to Table 3.25).For an overall picture <strong>of</strong> SIMS results, Table 3.25 shows <strong>the</strong> effect sizes for all SIMSscales and <strong>the</strong> SIMS Total across all four sets <strong>of</strong> contrasts. LI effect sizes are consistentlysmallest, whereas values for <strong>the</strong> P scale are highest for both <strong>the</strong> Psychiatric and Bothcomparisons; <strong>the</strong> Am effect size is largest for <strong>the</strong> Neurocognitive comparison; and <strong>the</strong> SIMSTotal produced <strong>the</strong> greatest effect in <strong>the</strong> Any comparison.The pattern found in <strong>the</strong> effect sizes for differences in neurocognitive test scores,however, is different. Returning to Table 3.24, it can be seen that for <strong>the</strong> TOMM Trial 2, VSVTDifficult, VSVT Total, and LMT, <strong>the</strong> positions <strong>of</strong> <strong>the</strong> NM – NH results and <strong>the</strong> PM – PH resultswere reversed – <strong>the</strong> order <strong>of</strong> comparisons from largest to smallest effect sizes is: BothPsychiatric & Neurocognitive > Neurocognitive > Any > Psychiatric. This result is certainlyconsistent with <strong>the</strong> purposes <strong>of</strong> <strong>the</strong>se tests and, <strong>the</strong>refore, with expectations. Tests designed todetect neurocognitive symptom feigning (and not designed to identify psychiatric malingerers)should perform better at distinguishing neurocognitive malingerers from honest responders than<strong>the</strong>y do at distinguishing psychiatric malingerers from honest responders.SIMS’ Prediction <strong>of</strong> MalingeringAreas Under <strong>the</strong> CurveAreas Under <strong>the</strong> Curve (AUCs) were computed for <strong>the</strong> performance <strong>of</strong> <strong>the</strong> SIMS Totalscore in distinguishing malingerers from honest responders in each <strong>of</strong> <strong>the</strong> four comparisons.AUC values, all significant at p < .001, are: .899 (Psychiatric; SE = .026), .755(Neurocognitive; SE = .035), .983 (Both; SE = .010), and .822 (Any; SE = .031). From largest tosmallest, <strong>the</strong>se AUCs follow <strong>the</strong> same pattern as SIMS scores: Both > Psychiatric > Any >Neurocognitive. Such considerable AUC magnitudes indicate that <strong>the</strong> SIMS Total score has30
substantial potential <strong>utility</strong> in screening for malingerers defined according to any <strong>of</strong> <strong>the</strong> fourmethods employed in this study.Regression AnalysesLinear regression analyses were conducted in order to examine <strong>the</strong> relative contributions<strong>of</strong> <strong>the</strong> SIMS Total score and <strong>the</strong> MMPI-2 Infrequency scale scores in <strong>the</strong> prediction <strong>of</strong> criterionscale scores. First, <strong>the</strong> incremental <strong>utility</strong> <strong>of</strong> <strong>the</strong> Infrequency scales over that <strong>of</strong> <strong>the</strong> SIMS Totalscore was computed for each criterion measure; <strong>the</strong>n <strong>the</strong> <strong>utility</strong> <strong>of</strong> <strong>the</strong> SIMS Total score inpredicting each criterion score over and above that <strong>of</strong> <strong>the</strong> Infrequency scales was evaluated.Specifically, conditional stepwise regressions <strong>of</strong> each criterion measure (<strong>the</strong> SIRS Total,TOMM T2, VSVT Difficult, VSVT Total, and LMT) were performed onto <strong>the</strong> SIMS Total,entered at Step 1, and <strong>the</strong> MMPI-2 Infrequency scales (F, Fb, and F[p]), which were entered insubsequent Steps. As can be seen in Table 3.26, <strong>the</strong> scales F and Fb (but not F[p]) providedincremental <strong>utility</strong> in <strong>the</strong> prediction <strong>of</strong> <strong>the</strong> SIRS Total, and F alone added significantly to <strong>the</strong>prediction <strong>of</strong> <strong>the</strong> VSVT Difficult, VSVT Total, and LMT scores. Regression <strong>of</strong> <strong>the</strong> TOMM T2showed no increment in prediction over that <strong>of</strong> <strong>the</strong> SIMS Total by any Infrequency scales.More importantly, in subsequent regressions, <strong>the</strong> Infrequency scales were conditionallyentered in Step 1, and <strong>the</strong> SIMS Total was entered in Step 2. The incremental <strong>utility</strong> <strong>of</strong> <strong>the</strong> SIMSTotal in predicting each malingering scale score over and above <strong>the</strong> level <strong>of</strong> prediction yieldedby <strong>the</strong> Infrequency scales was demonstrated in each <strong>of</strong> <strong>the</strong> five regressions (p ≤.001 for all; referto Table 3.26).Base Rates and Classification Accuracy StatisticsUltimately, <strong>the</strong> <strong>utility</strong> <strong>of</strong> a malingering instrument in a forensic application is assessed byexamining its operating characteristics when used to classify individuals as ei<strong>the</strong>r malingering orhonest. In <strong>the</strong> case <strong>of</strong> a screen, such as <strong>the</strong> SIMS, its ability to capture malingerers is primary; inan attempt to ensure that all malingerers are properly identified, a moderate rate <strong>of</strong> false positivesis tolerable, although a screening instrument is useful only if it does, in fact, screen out somesignificant proportion <strong>of</strong> honest respondents.31
Fur<strong>the</strong>r, although sensitivity and specificity statistics will allow computation <strong>of</strong> risks <strong>of</strong>false positives and false negatives, only positive predictive power and negative predictive powerare informative about <strong>the</strong> likelihood that a particular individual whose test sign has beendetermined is in fact malingering or honest. Therefore, <strong>the</strong>se are <strong>the</strong> statistics that are trulyuseful to <strong>the</strong> forensic examiner. Fur<strong>the</strong>r, <strong>the</strong> clinical <strong>utility</strong> <strong>of</strong> any such test is not fullyappreciated without comparing its PPP and NPP to <strong>the</strong> classification accuracy <strong>of</strong> randomassignment – i.e., incremental positive and negative predictive power are most informative. Thebase rate <strong>of</strong> malingering must be known in order to compute <strong>the</strong>se additional figures.The base rate <strong>of</strong> each operational definition <strong>of</strong> malingering was computed based on <strong>the</strong>participants’ statuses on <strong>the</strong> criterion measures as described in <strong>the</strong> Procedures section. For eachpair <strong>of</strong> groups, sensitivity, specificity, overall classification accuracy (hit rate), positivepredictive power, negative predictive power, incremental positive predictive power, andincremental negative predictive power were computed for <strong>the</strong> SIMS Total score using cut scores<strong>of</strong> greater than 14 and greater than 16, as suggested in previous literature, in an attempt to crossvalidate<strong>the</strong>se cut scores.Cut Scores Recommended in Previous StudiesTable 3.27 shows <strong>the</strong> classification accuracy statistics for all four sets <strong>of</strong> comparisonsusing a cut score <strong>of</strong> > 14, while Table 3.28 displays <strong>the</strong> same information for a cut score <strong>of</strong> > 16.Each <strong>of</strong> <strong>the</strong>se tables also includes similar statistics from previous studies that reported results at<strong>the</strong> respective cut score.As can be seen in Table 3.27, sensitivity values using a cut score <strong>of</strong> > 14 to detectpsychiatric or “psychiatric and neurocognitive” malingering are high (.957 and 1.000,respectively) and comparable to rates found in studies by Edens et al. (1999) and Smith &Burger (1997; .960 in each). Detection <strong>of</strong> neurocognitive or “any” malingering produced lowersensitivity rates <strong>of</strong> .800 and .812, respectively. NPP values are .989 and 1.000 for <strong>the</strong> prediction<strong>of</strong> honest responding with respect to psychiatric and “both” types <strong>of</strong> symptoms, respectively,compared with .958 and .786 in Edens et al. (1999) and Smith & Burger (1997), respectively.Again, NPP values for honest responding to neurocognitive or “any” symptoms were lower:.848 and .812, respectively. These results support <strong>the</strong> <strong>utility</strong> <strong>of</strong> this cut score in this sample fordetecting psychiatric malingerers, but suggest that it is notably less effective at detecting32
neurocognitive malingering than psychiatric malingering, as most malingerers in <strong>the</strong> “any”malingering group (75 <strong>of</strong> 85) were determined to be feigning neurocognitive symptoms only.While specificity and PPP are less important for any instrument designed to function as ascreening measure, it is worth noting that o<strong>the</strong>r researchers have found much higher specificity ata cut score <strong>of</strong> > 14 than shown in this study. This, along with much higher base rates,contributes to <strong>the</strong> much higher PPP reported in previous studies (also shown in Table 3.27).Table 3.28 displays statistics produced using a SIMS Total cut score <strong>of</strong> > 16. Sensitivityvalues for <strong>the</strong> detection <strong>of</strong> psychiatric or “psychiatric and neurocognitive” malingering are high(.957 and 1.000, respectively). These are comparable to Lewis et al.’s (2002) finding <strong>of</strong> 1.000.(Smith, 1992 and Rogers et al., 1996 did not report specificity figures.) Detection <strong>of</strong>neurocognitive and “any” malingering produced lower sensitivity rates <strong>of</strong> .747 and .765,respectively. NPP values are .991 and 1.000 for <strong>the</strong> prediction <strong>of</strong> honest responding with respectto psychiatric and “both” types <strong>of</strong> symptoms, respectively, compared with 1.000 and .620 inLewis et al. (2002) and Rogers et al. (1996), respectively. Again, NPP values for honestresponding to neurocognitive and “any” type <strong>of</strong> symptoms were somewhat lower: .849 and .810,respectively. These results are supportive <strong>of</strong> <strong>the</strong> <strong>utility</strong> <strong>of</strong> a cut score <strong>of</strong> > 16 in this sample forscreening for psychiatric malingerers; however, as with <strong>the</strong> cut score <strong>of</strong> > 14, this cut score isappreciably less effective against neurocognitive malingering than psychiatric malingering in thissample.Table 3.28 shows that samples in previous studies had higher base rates than wereidentified in <strong>the</strong> present study, along with correspondingly higher PPP values; however, <strong>the</strong>authors <strong>of</strong> only one <strong>of</strong> <strong>the</strong> three previous studies (Lewis et al., 2002) reported a specificity figurefor <strong>the</strong> cut score <strong>of</strong> > 16, and this value (54.0%) was comparable to those found in <strong>the</strong> currentstudy. Due to differences in specificity, hit rates at both > 14 and > 16 were also generallyhigher in <strong>the</strong> previous SIMS studies than those determined herein (see Tables 30 and 31).To summarize, <strong>the</strong>n, <strong>the</strong> cut scores <strong>of</strong> > 14 and > 16 both show quite good sensitivity andnegative predictive power in this sample when <strong>the</strong> SIMS is used to screen for malingerers <strong>of</strong>psychiatric or “both psychiatric and neurocognitive” symptoms, all <strong>of</strong> whom are malingeringpsychiatric symptomatology. However, <strong>the</strong>se cut scores perform less than optimally whenscreening for neurocognitive or “psychiatric and/or neurocognitive” malingering (sensitivityvalues range from only .747 to .812, and at <strong>the</strong> base rates in this sample, <strong>the</strong>se figures yield33
moderate NPPs, ranging from .812 to .849). Consequently, <strong>the</strong> cut score that producesmaximum sensitivity and NPP when screening for neurocognitive malingering has beendetermined for this sample. Classification accuracy statistics computed for this cut score areshown in Table 3.29.Cut Score Maximizing Sensitivity and NPP for NM-NH and AM-PNH ComparisonsThe cut score which generates <strong>the</strong> highest possible sensitivity and NPP (both equal to100%) for both <strong>the</strong> NM-NH and AM-PNH comparisons is a SIMS Total score > 4.Corresponding specificities are ra<strong>the</strong>r low: 51.0% for NM-NH and 58.0% for AM-PNH.Resultant hit rates are also ra<strong>the</strong>r poor: 33.2% and 44.7% for NM-NH and AM-PNH,respectively. At such a low cut score, very few honest responders (9 <strong>of</strong> 178 in <strong>the</strong> NH group and7 <strong>of</strong> 121 in <strong>the</strong> PNH group) are screened out.Copyright ©2006 Yvonne Renee Alwes. All rights reserved.34
Table 3.1Group Comparisons <strong>of</strong> Continuous Background VariablesPsychiatric Malingering vs. Honest (PM vs. PH)PsychiatricPsychiatricMalingering Group † Honest Group †N M SD N M SD t df dAge 23 39.04 9.777 172 42.92 12.096 -1.475 193 -0.33Education level 23 11.78 1.536 171 12.2.7 2.724 -0.837 192 -0.19† NMal = 23, NHon = 172, NM+H = 195*p < .0135
Table 3.2Group Comparisons <strong>of</strong> Discrete Background VariablesPsychiatric Malingering vs. Honest (PM vs. PH)Psychiatric PsychiatricMalingering † Honest †N % N % χ 2 dfDemographicsRaceWhiteAf-AmO<strong>the</strong>r2300100.0%0.0%0.0%15714191.3%8.1%0.6%21.730 2GenderMaleFemale15865.2%34.8%1224970.9%28.5%0.367 1Marital statusClaim TypesSingleMarriedSeparatedDivorcedWidowed51206021.7%52.2%0.0%26.1%0.0%20116226411.6%67.4%1.2%15.1%2.3%4.535 4Pain Yes 5 21.7% 70 40.7% 2.921 1Psychiatric Yes 22 95.7% 124 72.1% 5.672 1Brain damage Yes 5 21.7% 72 41.9% 3.437 1Physical Yes 7 30.4% 40 23.3% 0.501 1Medical Yes 1 4.3% 6 3.5% 0.041 1† NMal = 23, NHon = 172, NM+H = 195*p < .0136
Table 3.3Group Comparisons <strong>of</strong> Neurocognitive Test ScoresPsychiatric Malingering vs. Honest (PM vs. PH)PsychiatricPsychiatricMalingering Group † Honest Group †N M SD N M SD t df dTOMMTrial 2 23 84.26 20.166 172 96.53 9.718 -2.875* 23.385 -1.12VSVTDiff 23 61.91 29.985 172 84.34 21.170 -3.474* 25.016 -1.01Total 23 76.52 19.730 172 91.29 12.576 -3.496* 24.446 -1.10LMT 23 79.53 22.980 172 94.99 11.044 -3.178* 23.377 -1.25† NMal = 23, NHon = 172, NM+H = 195*p < .0137
Table 3.4Psychiatric and Neurocognitive Malingering, Honest, and Indeterminate Classification NsPH † PI † PM † TotalNH † 121 50 7 178NI † 22 30 3 55NM † 29 33 13 75Total 172 113 23 308† PH = Psychiatric – Honest, PI = Psychiatric – Indeterminate, PM = Psychiatric –Malingering, NH = Neurocognitive – Honest, NI = Neurocognitive – Indeterminate,NM = Neurocognitive – Malingering38
Table 3.5Group Comparisons <strong>of</strong> MMPI-2 Validity Scale ScoresPsychiatric Malingering vs. Honest (PM vs. PH)PsychiatricPsychiatricMalingering Group † Honest Group †N M SD N M SD t df dMMPI-2VRIN 23 48.30 8.314 169 51.46 8.761 -1.628 190.000 -0.36TRIN 23 58.39 7.578 169 58.78 8.126 -0.217 190.000 -0.05L 23 55.17 8.600 169 58.76 10.606 -1.554 190.000 -0.35K 23 38.17 7.414 169 48.01 11.082 -5.569* 36.964 -0.92S 23 36.52 10.655 169 48.36 10.827 -4.929* 190.000 -1.10F 23 96.17 15.305 169 58.21 13.868 12.164* 190.000 2.70Fb 23 111.65 11.578 169 61.90 17.722 17.945* 37.763 2.92F(p) 23 64.74 13.676 169 50.60 11.209 5.523* 190.000 1.23F – K 23 8.61 7.334 168 -6.57 10.171 6.909* 189.000 1.54† N Mal = 23, N Hon = 172, N M+H = 195*p < .0139
Table 3.6Group Comparisons <strong>of</strong> MMPI-2 Clinical Scale ScoresPsychiatric Malingering vs. Honest (PM vs. PH)PsychiatricPsychiatricMalingering Group † Honest Group †N M SD N M SD t Df dMMPI-21 22 92.86 7.376 168 77.66 12.580 8.227* 39.326 1.272 22 96.86 8.317 168 78.81 14.535 8.605* 40.345 1.303 22 90.55 9.231 168 77.48 15.700 5.655* 39.216 0.874 22 73.23 7.746 168 58.54 10.112 6.559* 188.000 1.495 22 51.32 7.473 168 46.76 8.365 2.430 188.000 0.556 22 88.91 17.979 168 57.87 14.965 8.930* 188.000 2.037 22 96.32 5.677 168 72.22 14.511 14.616* 66.214 1.788 22 97.95 20.151 168 66.71 15.362 8.630* 188.000 1.979 22 54.41 6.478 168 47.31 10.776 3.015* 188.000 0.690 22 77.23 9.995 168 62.80 13.088 6.119* 31.291 1.13† NMal = 23, NHon = 172, NM+H = 195*p < .0140
Table 3.7Group Comparisons <strong>of</strong> SIMS Total and Subscale ScoresPsychiatric Malingering vs. Honest (PM vs. PH)PsychiatricPsychiatricMalingering Group † Honest Group †N M SD N M SD t df dSIMSTotal 23 31.57 8.851 172 14.41 6.466 11.398* 193.000 2.55N 23 8.13 2.719 172 3.42 2.525 8.331* 193.000 1.85Af 23 9.17 1.466 172 5.95 2.374 9.064* 39.498 1.42P 23 3.35 3.157 172 0.31 0.643 4.605* 22.245 3.27LI 23 3.70 1.964 172 2.15 1.601 4.226* 193.000 0.94Am 23 7.17 3.172 172 2.53 2.544 7.975* 193.000 1.77† NMal = 23, NHon = 172, NM+H = 195*p < .0141
Table 3.8Group Comparisons <strong>of</strong> Continuous Background VariablesNeurocognitive Malingering vs. Honest (NM vs. NH)Neurocognitive NeurocognitiveMalingering Group † Honest Group †N M SD N M SD t df dAge 75 40.57 10.940 178 41.88 11.768 -0.821 251 -0.11Education level 75 11.68 2.786 177 12.33 2.548 -1.794 250 -0.25† NMal = 75, NHon = 178, NM+H = 253*p < .0142
Table 3.9Group Comparisons <strong>of</strong> Discrete Background VariablesNeurocognitive Malingering vs. Honest (NM vs. NH)Neurocognitive NeurocognitiveMalingering † Honest †N % N % χ 2 dfDemographicsRaceWhiteAf-AmO<strong>the</strong>r696092.0%8.0%0.0%16413192.1%7.3%0.6%0.456 2GenderMaleFemale522369.3%30.7%1186066.3%33.7%0.221 1Marital statusClaim TypesSingleMarriedSeparatedDivorcedWidowed948114312.0%64.0%1.3%18.7%4.0%2219428212.4%66.9%2.2%15.7%1.1%2.743 4Pain Yes 34 45.3% 72 40.4% 0.442 1Psychiatric Yes 64 85.3% 138 77.5% 1.798 1Brain damage Yes 24 32.0% 62 34.8% 0.215 1Physical Yes 27 36.0% 43 24.2% 3.499 1Medical Yes 7 9.3% 6 3.4% 3.803 1† NMal = 75, NHon = 178, NM+H = 253*p < .0143
Table 3.10Group Comparisons <strong>of</strong> SIRS ScoresNeurocognitive Malingering vs. Honest (NM vs. NH)NeurocognitiveNeurocognitiveMalingering Group † Honest Group †N M SD N M SD t df dSIRSTotal 75 43.03 26.113 178 22.91 18.035 6.088* 104.962 0.99RS 75 1.33 2.226 178 0.59 1.233 2.722* 93.713 0.49SC 75 1.47 1.671 178 0.60 1.086 4.133* 101.326 0.69IA 75 0.96 1.144 178 0.38 0.850 3.979* 109.901 0.62BL 75 4.35 4.397 178 2.02 2.751 4.241* 99.296 0.72SU 75 13.545 7.600 178 7.70 5.812 5.870* 112.115 0.91SEL 75 11.83 5.463 178 7.38 4.777 6.475* 251.000 0.89SEV 75 6.09 6.047 178 2.38 3.910 4.908* 101.051 0.82RO 75 3.55 2.637 178 1.86 1.892 5.023* 107.463 0.80† N Mal = 75, N Hon = 178, N M+H = 253*p < .0144
Table 3.11Group Comparisons <strong>of</strong> MMPI-2 Validity Scale ScoresNeurocognitive Malingering vs. Honest (NM vs. NH)NeurocognitiveNeurocognitiveMalingering Group † Honest Group †N M SD N M SD t df dMMPI-2VRIN 74 50.82 9.772 173 52.07 8.598 -1.000 245.000 -0.14TRIN 75 58.29 6.976 173 57.76 8.666 0.468 246.000 0.06L 75 56.84 9.744 173 56.79 10.922 0.033 246.000 0.00K 75 43.04 10.427 173 45.86 10.596 -1.935 246.000 -0.27S 75 43.95 10.438 173 45.48 10.753 -1.040 246.000 -0.14F 75 78.99 18.753 173 59.47 16.095 7.845* 123.400 1.16Fb 75 88.08 23.595 173 66.95 22.155 6.764* 246.000 0.94F(p) 75 57.47 12.341 173 50.71 11.789 4.086* 246.000 0.57F – K 75 1.49 8.880 172 -5.25 10.580 4.827* 245.000 0.67† N Mal = 75, N Hon = 178, N M+H = 253*p < .0145
Table 3.12Group Comparisons <strong>of</strong> MMPI-2 Clinical Scale ScoresNeurocognitive Malingering vs. Honest (NM vs. NH)Neurocognitive NeurocognitiveMalingering Group † Honest Group †N M SD N M SD t df dMMPI-21 75 86.83 9.964 172 77.50 13.425 6.056* 186.860 0.472 75 91.91 11.838 172 80.31 15.509 6.414* 182.084 0.813 75 86.53 12.989 172 77.05 16.353 4.864* 175.387 0.624 75 75.320 85.112 172 59.75 11.069 2.342 245.000 0.465 75 49.36 8.112 172 48.40 9.354 0.770 245.000 0.116 75 72.97 19.674 172 61.45 16.489 4.754* 245.000 0.667 75 86.92 14.665 172 73.92 14.499 6.458* 245.000 0.898 75 87.27 16.076 172 68.38 17.306 8.056* 245.000 1.129 75 49.75 11.064 172 48.99 10.737 0.502 245.000 0.070 75 73.19 12.029 171 63.58 12.544 5.595* 245.000 0.78† NMal = 75, NHon = 178, NM+H = 253*p < .0146
Table 3.13Group Comparisons <strong>of</strong> SIMS Total and Subscale ScoresNeurocognitive Malingering vs. Honest (NM vs. NH)Neurocognitive NeurocognitiveMalingering † Honest †N M SD N M SD t df dSIMSTotal 75 24.76 10.754 178 15.55 7.074 6.821* 102.028 1.13N 75 6.21 3.633 178 3.75 2.828 5.235* 113.508 0.80Af 75 7.88 2.205 178 6.44 2.419 4.424* 251.000 0.61P 75 1.61 2.614 178 0.46 0.903 3.726* 81.535 0.82LI 75 3.04 2.076 178 2.31 1.671 2.682* 116.313 0.41Am 75 5.97 3.377 178 2.53 2.552 7.920* 111.189 1.23† NMal = 75, NHon = 178, NM+H = 253*p < .0147
Table 3.14Group Comparisons <strong>of</strong> Continuous Background VariablesBoth Psychiatric and Neurocognitive Malingering vs. Honest (PNM vs. PNH)Both Psychiatric Both Psychiatric& Neurocognitive & NeurocognitiveMalingering Group † Honest Group †N M SD N M SD t df dAge 13 41.92 8.760 121 42.95 12.702 -0.382 17.942 -0.08Education level 13 12.08 1.498 120 12.47 2.722 -0.507 131.000 -0.15† N Mal = 13, N Hon = 121, N M+H = 134*p < .0148
Table 3.15Group Comparisons <strong>of</strong> Discrete Background VariablesBoth Psychiatric and Neurocognitive Malingering vs. Honest (PNM vs. PNH)Both Psychiatric Both Psychiatric& Neurocognitive & NeurocognitiveMalingering † Honest †N % N % χ 2 dfDemographicsRaceGenderWhiteAf-AmO<strong>the</strong>rMaleFemale130076100%0.0%0.0%53.8%46.2%11191843791.7%7.4%0.8%69.4%30.6%1.161 21.307 1MaritalStatusClaim TypesSingleMarriedSeparatedDivorcedWidowed2803015.4%61.5%0.0%23.1%0.0%1778219214.0%64.5%1.7%15.7%1.7%0.825 4Pain Yes 3 23.1% 48 39.7% 1.078 1Psychiatric Yes 13 100.0% 88 72.7% 4.565 1BrainYes 2 15.4% 49 40.5% 3.140 1DamagePhysical Yes 4 30.8% 29 24.0% 0.274 1Medical Yes 1 7.7% 5 4.1% 0.338 1† NMal = 13, NHon = 121, NM+H = 134*p < .0149
Table 3.16Group Comparisons <strong>of</strong> MMPI-2 Validity Scale ScoresBoth Psychiatric and Neurocognitive Malingering vs. Honest (PNM vs. PNH)Both Psychiatric Both Psychiatric& Neurocognitive & NeurocognitiveMalingering Group † Honest Group †N M SD N M SD t df dMMPI-2VRIN 13 49.31 9.214 118 51.19 8.321 -0.768 129 -0.22TRIN 13 58.54 6.679 118 58.31 8.299 0.094 129 0.03L 13 56.54 9.033 118 57.60 10.454 -0.352 129 -0.10K 13 39.38 8.441 118 47.58 10.876 -2.629* 129 -0.77S 13 38.31 8.625 118 47.64 10.385 -3.119* 129 -0.91F 13 98.46 14.246 118 55.97 13.530 10.692* 129 3.13Fb 13 113.54 10.952 118 60.09 17.242 10.914* 129 3.21F(p) 13 65.08 11.398 118 50.21 10.189 4.935* 129 1.44F – K 13 9.15 7.267 117 -6.94 11.038 5.125* 128 1.51† N Mal = 13, N Hon = 121, N M+H = 134*p < .0150
Table 3.17Group Comparisons <strong>of</strong> MMPI-2 Clinical Scale ScoresBoth Psychiatric and Neurocognitive Malingering vs. Honest (PNM vs. PNH)Both Psychiatric Both Psychiatric& Neurocognitive & NeurocognitiveMalingering Group † Honest Group †N M SD N M SD t df dMMPI-21 13 91.54 7.230 118 75.75 12.694 6.801* 21.283 1.302 13 95.15 9.054 118 76.58 14.102 6.569* 19.131 1.363 13 92.38 9.314 118 75.97 16.311 5.495* 21.230 1.054 13 72.54 7.287 118 57.62 10.209 5.119* 129.000 1.505 13 51.46 8.771 118 46.97 8.605 1.784 129.000 0.526 13 85.00 20.789 118 57.12 14.517 6.273* 129.000 1.857 13 94.92 6.689 118 70.25 13.135 11.140* 23.917 1.978 13 101.92 6.751 118 64.24 14.840 16.259* 27.381 2.679 13 54.62 5.810 118 48.05 11.209 2.076 129.000 0.610 13 74.46 11.348 118 61.41 12.493 3.605* 129.000 1.05† NMal = 13, NHon = 121, NM+H = 134*p < .0151
Table 3.18Group Comparisons <strong>of</strong> SIMS Total and Subscale ScoresBoth Psychiatric and Neurocognitive Malingering vs. Honest (PNM vs. PNH)Both Psychiatric Both Psychiatric& Neurocognitive & NeurocognitiveMalingering † Honest †N M SD N M SD t df dSIMSTotal 13 34.85 8.961 121 13.63 6.033 11.438* 132.000 3.37N 13 8.54 3.099 121 3.12 2.399 7.521* 132.000 2.20Af 13 9.08 1.382 121 5.84 2.327 7.386* 20.238 1.45P 13 4.38 3.686 121 0.31 0.684 3.974* 12.089 4.23LI 13 4.31 1.932 121 2.18 1.638 4.370* 132.000 1.28Am 13 8.46 2.696 121 2.11 2.345 9.153* 132.000 2.67† N Mal = 13, N Hon = 121, N M+H = 134*p < .0152
Table 3.19Group Comparisons <strong>of</strong> Continuous Background VariablesAny Malingering vs. Honest (AM vs. PNH)AnyBothMalingering Group † Honest Group †N M SD N M SD t df dAge 85 39.95 10.930 121 42.95 12.702 -1.764 204 -0.25Education level 85 11.65 2.667 120 12.47 2.722 -2.142 203 -0.30† NMal = 85, NHon = 121, NM+H = 206*p < .0153
Table 3.20Group Comparisons <strong>of</strong> Discrete Background VariablesAny Malingering vs. Honest (AM vs. PNH)Any BothMalingering † Honest †N % N % χ 2 dfDemographicsRaceWhiteAf-AmO<strong>the</strong>r796092.9%7.1%0.0%1119191.7%7.4%0.8%0.720 2GenderMaleFemale602570.6%29.4%843769.4%30.6%0.032 1Marital statusSingleMarriedSeparatedDivorcedWidowed1252117314.1%61.2%1.2%20.0%3.5%1778219214.0%64.5%1.7%15.7%1.7%1.378 4Claim TypePain Yes 36 42.4% 48 39.7% 0.129 1Psychiatric Yes 73 85.9% 88 72.7% 4.648 1Brain damage Yes 27 31.8% 49 40.5% 1.635 1Physical Yes 30 35.3% 29 24.0% 3.006 1Medical Yes 7 8.2% 5 4.1% 1.495 1† NMal = 85, NHon = 121, NM+H = 206*p < .0154
Table 3.21Group Comparisons <strong>of</strong> MMPI-2 Validity Scale ScoresAny Malingering vs. Honest (AM vs. PNH)AnyBothMalingering Group † Honest Group †N M SD N M SD t df dMMPI-2VRIN 84 50.37 9.551 118 51.19 8.321 -0.639 163.133 -0.09TRIN 85 58.28 7.179 118 58.31 8.299 -0.028 201.000 0.00L 85 56.44 9.588 118 57.60 10.454 -0.812 201.000 -0.11K 85 42.28 10.189 118 47.58 10.876 -3.518* 201.000 -0.50S 85 42.80 11.132 118 47.64 10.385 -3.176* 201.000 -0.45F 85 80.66 19.013 118 55.47 13.530 10.246* 142.816 1.59Fb 85 90.56 23.537 118 60.09 17.242 10.136* 145.844 1.53F(p) 85 58.27 13.018 118 50.21 50.21 4.754* 153.088 0.71F – K 85 2.25 8.956 118 -6.94 -6.94 6.310* 200.000 0.90† N Mal = 85, N Hon = 121, N M+H = 206*p < .0155
Table 3.22Group Comparisons <strong>of</strong> MMPI-2 Clinical Scale ScoresAny Malingering vs. Honest (AM vs. PNH)AnyBothMalingering Group † Honest Group †N M SD N M SD t df dMMPI-21 84 87.68 10.009 118 75.75 12.694 7.456* 197.864 1.032 84 92.70 11.611 118 76.58 14.102 8.886* 195.728 1.233 84 86.68 12.582 118 75.97 16.311 5.265* 198.670 0.734 84 75.10 80.412 118 57.62 10.209 2.337 200.000 0.445 84 49.55 7.872 118 46.97 8.605 2.176 200.000 0.316 84 75.29 20.091 118 57.12 14.517 7.076* 142.225 1.087 84 88.14 14.328 118 70.25 13.135 0.185* 200.000 1.318 84 87.80 17.970 118 64.24 14.840 10.180* 200.000 1.469 84 50.21 10.803 118 48.05 11.209 1.372 200.000 0.200 84 74.05 11.789 118 61.41 12.493 7.255* 200.000 1.04† NMal = 85, NHon = 121, NM+H = 206*p < .0156
Table 3.23Group Comparisons <strong>of</strong> SIMS Total and Subscale ScoresAny Malingering vs. Honest (AM vs. PNH)AnyBothMalingering † Honest †N M SD N M SD t df dSIMSTotal 85 25.06 10.381 121 13.63 6.033 9.126* 123.717 1.46N 85 6.38 3.512 121 3.12 2.399 7.429* 137.722 1.14Af 85 8.05 2.187 121 5.84 2.327 6.859* 204.000 0.97P 85 1.66 2.514 121 0.31 0.684 4.807* 92.772 0.94LI 85 3.02 2.035 121 2.18 1.638 3.282* 204.000 0.47Am 85 5.92 3.328 121 2.11 2.345 9.089* 140.797 1.39† NMal = 85, NHon = 121, NM+H = 206*p < .0157
Table 3.24Summary <strong>of</strong> Test Score Difference Effect Sizes* for Four Sets <strong>of</strong> ContrastsTest Score PM vs. PH † NM vs. NH † PNM vs. PNH † AM vs. PNH †SIRS Total 6.79 ‡ 0.99 7.34 ‡ 2.02 ‡MMPI-2 F 2.70 1.16 3.13 1.59Fb 2.92 0.94 3.21 1.53SIMS Total 2.55 1.13 3.37 1.46TOMM Trial 2 -1.12 -3.03 ‡ -9.97 ‡ -2.04 ‡VSVT Diff -1.01 -4.92 -7.71 -3.41Total -1.10 -4.79 ‡ -8.56 ‡ -3.33 ‡LMT -1.25 -4.11 ‡ -10.71 ‡ -2.79 ‡*Cohen’s d† PM = Psychiatric – Malingering, PH = Psychiatric – Honest, NM = Neurocognitive– Malingering, NH = Neurocognitive – Honest, PNM = Psychiatric andNeurocognitive – Malingering, PNH = Psychiatric and Neurocognitive – Honest,AM = Any – Malingering‡ These scores formed at least part <strong>of</strong> <strong>the</strong> criteria for group membership in thisComparison58
Table 3.25Summary <strong>of</strong> SIMS Score Difference Effect Sizes* for Four Sets <strong>of</strong> ContrastsTest Score PNM vs. PNH † PM vs. PH † AM vs. PNH † NM vs. NH †SIMS Total 3.37 2.55 1.46 1.13N 2.20 1.85 1.14 0.80Af 1.45 1.42 0.97 0.61P 4.23 3.27 0.94 0.82LI 1.28 0.94 0.47 0.41Am 2.67 1.77 1.39 1.23Note: Contrasts are presented from largest effect sizes on far left to smallest on farright.*Cohen’s d† PM = Psychiatric – Malingering, PH = Psychiatric – Honest, NM = Neurocognitive– Malingering, NH = Neurocognitive – Honest, PNM = Psychiatric andNeurocognitive – Malingering, PNH = Psychiatric and Neurocognitive – Honest,AM = Any – Malingering59
Table 3.26Conditional Stepwise Regressions* <strong>of</strong> Criterion Measures Onto SIMS Totaland MMPI-2 Infrequency ScalesRegress Step Onto R R 2 ΔR 2 ΔF SigSIRS Total 1 SIMS Total 0.707 0.499 0.499 299.372 0.0002 MMPI Fb 0.780 0.608 0.109 83.166 0.0003 MMPI F 0.785 0.616 0.008 6.080 0.0141 MMPI Fb 0.726 0.527 0.527 334.333 0.0002 MMPI F 0.744 0.554 0.027 17.809 0.0003 SIMS Total 0.785 0.616 0.063 48.594 0.000TOMM T2 1 SIMS Total 0.402 0.161 0.161 57.686 0.0001 MMPI F 0.330 0.109 0.109 36.705 0.0002 SIMS Total 0.410 0.168 0.059 21.268 0.000VSVT Diff 1 SIMS Total 0.446 0.199 0.199 74.516 0.0002 MMPI F 0.486 0.236 0.037 14.435 0.0001 MMPI F 0.441 0.194 0.194 72.412 0.0002 SIMS Total 0.486 0.236 0.041 16.206 0.000VSVT Total 1 SIMS Total 0.453 0.205 0.205 77.271 0.0002 MMPI F 0.488 0.238 0.033 12.951 0.0001 MMPI F 0.438 0.191 0.191 71.047 0.0002 SIMS Total 0.488 0.238 0.046 18.183 0.000LMT 1 SIMS Total 0.443 0.197 0.197 73.434 0.0002 MMPI F 0.461 0.213 0.016 6.150 0.0141 MMPI F 0.391 0.153 0.153 54.135 0.0002 SIMS Total 0.461 0.213 0.060 22.779 0.000*Probability <strong>of</strong> F to enter ≤.050; probability <strong>of</strong> F to remove ≥.10060
Table 3.27Classification Accuracy Statistics Using Cut Score <strong>of</strong> SIMS Total > 14ComparisonEdens et al. Smith & BurgerPsych NC Both Any (1999) (1997)BR 7.5% 24.4% 4.2% 27.6% 50.0% 85.7%Sensitivity 95.7% 80.0% 100.0% 81.2% 96.0% 96.0%Specificity 54.1% 47.2% 57.0% 57.0% 91.0% 88.0%HR 56.8% 56.9% 61.2% 67.0% 96.0% 95.0%PPP 21.8% 39.0% 20.0% 57.0% 91.4% 98.0%NPP 98.9% 84.8% 100.0% 81.2% 95.8% 78.6%IPPP 14.3% 14.6% 15.8% 29.4% 41.4% 12.2%INPP 6.4% 9.2% 4.2% 8.8% 45.8% 64.3%61
Table 3.28Classification Accuracy Statistics Using Cut Score <strong>of</strong> SIMS Total > 16Comparison Lewis et al. Rogers et al. SmithPsych NC Both Any (2002) (1996) (1992)BR 7.5% 24.4% 4.2% 27.6% 31.4% 50.0% 87.5%Sensitivity 95.7% 74.7% 100.0% 76.5% 100.0% ●* ●*Specificity 66.9% 60.1% 70.3% 70.3% 61.0% ●* ●*HR 68.7% 64.4% 73.1% 72.8% 73.0% ●* 95.0%PPP 27.9% 44.1% 26.5% 64.4% 54.0% 87.0% ●*NPP 99.1% 84.9% 100.0% 81.0% 100.0% 62.0% ●*IPPP 20.4% 19.7% 22.3% 36.8% 22.6% 37.0% ●*INPP 6.6% 9.3% 4.2% 8.5% 31.4% 12.0% ●**●= Figures not published62
Table 3.29Cut Scores Yielding Maximum Sensitivity and NPP in NC and Any ComparisonsComparison: NC AnyCut Score: > 4 > 4BR 24.4% 27.6%Sensitivity 100.0% 100.0%Specificity 51.0% 58.0%HR 33.2% 44.7%PPP 39.6% 47.6%NPP 100.0% 100.0%IPPP 15.3% 20.0%INPP 24.4% 27.6%63
Chapter FourDiscussionBackgroundMalingering presents a significant problem for society by facilitating fraud and <strong>the</strong>avoidance <strong>of</strong> criminal responsibility. Any psychological examination conducted in acompensation-seeking context should include an assessment <strong>of</strong> <strong>the</strong> likelihood <strong>of</strong> malingering(Rogers, 1997). Historically, scales embedded in instruments already commonly included inforensic assessment batteries were validated and employed in this effort; but difficulties inestablishing reliable cut scores that were useful across samples (Lewis et al., 2002; Inman &Berry, 2000) led researchers to develop dedicated malingering measures.The SIRS (Rogers, et al., 1992) is considered <strong>the</strong> gold standard for <strong>the</strong> detection <strong>of</strong>psychiatric symptom malingering (Lewis et al., 2002); however, it requires 30 to 60 minutes <strong>of</strong>one-on-one pr<strong>of</strong>essional administration time, and has been designed to minimize false positives.Therefore, a brief screening instrument, designed to minimize false negatives, could saveconsiderable time and expense by eliminating clearly honest examinees from fur<strong>the</strong>r testing, at<strong>the</strong> same time increasing <strong>the</strong> base rate <strong>of</strong> feigning in those who proceed to subsequent evaluationwith <strong>the</strong> SIRS. The already impressive PPP <strong>of</strong> <strong>the</strong> SIRS would, consequently, increase, and <strong>the</strong>overall accuracy <strong>of</strong> <strong>the</strong> two-stage classification system would be substantially higher than that <strong>of</strong><strong>the</strong> SIRS alone.The SIMS (Smith & Burger, 1997) was designed to fulfill <strong>the</strong> role <strong>of</strong> a first-stagescreening measure <strong>of</strong> malingering <strong>of</strong> various types <strong>of</strong> symptomatology. Initial validation studieshave demonstrated preliminary evidence <strong>of</strong> its <strong>utility</strong> in <strong>the</strong> detection <strong>of</strong> psychiatric symptommalingering. Four simulation studies (Smith, 1992; Rogers et al., 1996; Smith & Burger, 1997;Edens et al., 1999), one known-group analysis (Heinze & Purisch, 2001), and one known-groupscomparison (Lewis et al., 2002) have been conducted, showing promise for its role as a high-NPP test <strong>of</strong> malingering. A consistent cut score is not clearly suggested by <strong>the</strong> existingliterature. In addition, only one simulation study (Rogers et al., 1996) included patient or<strong>of</strong>fender participants; all studies that did include <strong>of</strong>fenders (Rogers et al., 1996; Heinze &Purisch, 1999; Lewis et al., 2002) involved small, all-male samples; only <strong>the</strong> report on <strong>the</strong>64
known-groups comparison by Lewis et al. (2002) provided all classification accuracy statistics;and many authors failed to indicate how reported cut scores were selected. No samples werederived from a civil forensic setting, and none directly tested <strong>the</strong> SIMS’ ability to detectneurocognitive symptom feigning. Effect sizes, reported only for <strong>the</strong> known-groups comparison,ranged from 1.1 to 3.0 (Lewis et al., 2002).In <strong>the</strong> present study, 308 plaintiffs in workers’ compensation, personal injury, and fitnessfor duty cases were assessed with <strong>the</strong> SIRS; three well-validated tests <strong>of</strong> neurocognitive effort(<strong>the</strong> TOMM, developed by Tombaugh, 1996; VSVT, created by Slick et al., 1997; and LMT,designed by Inman et al., 1998); <strong>the</strong> SIMS; and a background questionnaire. All but six <strong>of</strong> <strong>the</strong>separticipants also completed <strong>the</strong> MMPI-2 (Butcher et al., 1989). Four pairs <strong>of</strong> comparison groupswere created: a group determined to be malingering psychiatric symptoms (according to <strong>the</strong>SIRS) and a corresponding group determined to be honestly responding with respect topsychiatric symptoms (according to <strong>the</strong> SIRS); a group classified as malingering neurocognitivedeficits (according to at least two <strong>of</strong> three tests <strong>of</strong> neurocognitive effort) and a correspondinggroup classified as honest responders with respect to neurocognitive deficits (according to allthree tests <strong>of</strong> neurocognitive effort); a group considered to be malingering both psychiatric andneurocognitive symptoms (by meeting all criteria which define <strong>the</strong> first two malingering groups)and a corresponding group <strong>of</strong> individuals considered to be honestly responding with respect toboth psychiatric and neurocognitive symptoms (by meeting all criteria which define <strong>the</strong> first two“honest” groups); and, finally, a group categorized as malingering any symptomatology –psychiatric, neurocognitive, or both (according to <strong>the</strong> SIRS and/or two <strong>of</strong> <strong>the</strong> three tests <strong>of</strong>neurocognitive effort), which was also compared to <strong>the</strong> group categorized as honest with respectto both psychiatric and neurocognitive symptom reporting (again, by meeting all criteria whichdefine <strong>the</strong> first two “honest” groups). Each pair <strong>of</strong> malingering and honest groups was comparedwith respect to demographics, types <strong>of</strong> claims made, and test scores on all measures listed. Theability <strong>of</strong> <strong>the</strong> SIMS to predict scores produced by established malingering measures was assessedvia AUC computations and linear regression analyses. And, ultimately, in order to evaluate <strong>the</strong>SIMS’ <strong>utility</strong> in detecting individual malingerers, classification accuracy statistics weregenerated for each pair <strong>of</strong> malingering and honest groups. Calculations indicate that power <strong>of</strong><strong>the</strong> four subsamples in <strong>the</strong> current study to detect effect sizes <strong>of</strong> 1.0 (which is smaller than any65
effect sizes previously reported) ranges from 79.02% to 100.00%; power to detect effect sizes <strong>of</strong>2.0 or 3.0 is 100.00% across all subsamples.Differences Between Malingerers and Honest RespondersMalingering, in this sample, is not related to demographic variables or to <strong>the</strong> types <strong>of</strong>claims registered by <strong>the</strong> plaintiff. Demographic variables included gender, race, age, educationallevel, and marital status; claim types included psychiatric, brain damage, pain, medical, andphysical, and many cases involved multiple claim types.Corresponding malingering and honest groups differed substantially, however, on mosttest scores. Of particular interest, SIRS scales and Total, TOMM Trial 2, VSVT Difficult andTotal, LMT (each <strong>of</strong> which, it must be noted, served as or was confounded with a criterionmeasure in three <strong>of</strong> <strong>the</strong> four comparisons), and SIMS scale and Total effect sizes were generallyquite large, and, most notably, only three <strong>of</strong> twenty-four SIMS effect sizes were not large (lessthan .80; Cohen, 1977); sixteen (two-thirds) <strong>of</strong> <strong>the</strong>m were larger than 1.00. SIMS effect sizesranged from a low <strong>of</strong> .41 to a high <strong>of</strong> 4.23. These data lend substantial support to <strong>the</strong> suppositionthat <strong>the</strong> SIMS is measuring symptom exaggeration and/or feigning.Evidence for Broadband Symptom ExaggerationInterestingly, psychiatric symptom malingerers performed more poorly on allneurocognitive tests <strong>of</strong> effort than honest psychiatric responders. Correspondingly,neurocognitive symptom feigners endorsed more psychiatric symptoms than honestneurocognitive test responders. In this sample, <strong>the</strong>n, malingerers as a group seemed toexaggerate symptoms “across <strong>the</strong> board”. This suggests that psychiatric malingerers mayattempt to appear to experience mild neurocognitive impairment, although usually withouttriggering detection by neurocognitive feigning tests, while, similarly, malingerers <strong>of</strong>neurocognitive deficit elevate scales by endorsing psychiatric symptoms, but at a sub-clinicallevel such that most are not detected as psychiatric symptom malingerers. If replicated in o<strong>the</strong>rsamples, this provides a hint <strong>of</strong> potentially useful information about approaches employed bymalingerers in compensation-seeking settings that could influence malingering-detectionstrategies in <strong>the</strong> future.66
Prediction <strong>of</strong> Criterion Scores by SIMS TotalAt a group level, <strong>the</strong> SIMS Total score exhibited an ability to predict scores onpreviously-validated tests <strong>of</strong> malingering, and demonstrated incremental <strong>utility</strong> over <strong>the</strong> MMPI-2Infrequency scales in this respect.Validation <strong>of</strong> Previously Recommended Cut ScoresPreviously recommended cut scores for <strong>the</strong> SIMS Total were predictive <strong>of</strong> malingering inthis sample according to all four definitions <strong>of</strong> <strong>the</strong> construct implemented in this study.Sensitivity values using a cut score <strong>of</strong> > 14 to screen for psychiatric malingering were very high,and comparable to rates found in studies by Edens et al. (1999) and Smith & Burger (1997).NPP values were very high in <strong>the</strong>se comparisons as well, comparable to results found by Edenset al. (1999) and much higher than those reported by Smith & Burger (1997). Detection <strong>of</strong>neurocognitive malingering produced appreciably lower sensitivity rates and NPPs.Using a cut score > 16, sensitivity values for <strong>the</strong> detection <strong>of</strong> psychiatric malingeringwere very high, and comparable to Lewis et al.’s (2002) finding. NPP values were also veryhigh in <strong>the</strong>se comparisons, as were results found by Lewis et al. (2002), and were much higherthan NPP figures reported by Rogers et al. (1996). Detection <strong>of</strong> neurocognitive malingering,however, produced substantially lower sensitivity rates and NPPs.Support <strong>of</strong>fered by <strong>the</strong> present study for both <strong>the</strong> > 14 and > 16 cut scores for <strong>the</strong>detection <strong>of</strong> psychiatric symptom malingering is encouraging. Although nei<strong>the</strong>r <strong>of</strong> <strong>the</strong>se cutscores provided for maximal sensitivity or NPP for both PM-PH and PNM-PNH comparisons, allsensitivities and NPPs were quite high (ranging from .957 to 1.000 and .989 to 1.000 forsensitivity and NPP, respectively) in groups composed <strong>of</strong> psychiatric feigners. A cut score <strong>of</strong> >16 yielded higher specificities and PPPs, and <strong>the</strong>refore its performance was superior to a cut <strong>of</strong> >14 in this sample.However, <strong>the</strong>se cut scores performed less adequately in <strong>the</strong> detection <strong>of</strong> neurocognitivemalingering: sensitivity values ranged from only .747 to .812 and, at <strong>the</strong> base rates in thissample, NPPs ranged from only .810 to .849. Consequently, <strong>the</strong> cut score that producedmaximum sensitivity and NPP when screening for neurocognitive malingering in this samplewas determined. This optimal cut score, > 4, is far below both <strong>of</strong> <strong>the</strong> previously recommendedcut scores for psychiatric symptom malingering, and is <strong>of</strong> only minimal <strong>utility</strong>, as it screens out67
few honest responders. Reasons for <strong>the</strong> divergence between this cut score and scores that areeffective at screening for psychiatric malingering are not clear. One possible factor could bemethod variance – all <strong>of</strong> <strong>the</strong> tests <strong>of</strong> neurocognitive effort are computer-administered, multiplealternative,forced-choice tests <strong>of</strong> recognition memory; <strong>the</strong> SIRS is a <strong>structured</strong> interviewcomprised <strong>of</strong> questions about symptom endorsement, which are far more similar to SIMS items.The SIMS, a paper-and-pencil, true/false, self-report questionnaire, may be more effective atpredicting results <strong>of</strong> one type <strong>of</strong> instrument as compared with <strong>the</strong> o<strong>the</strong>r.The usefulness <strong>of</strong> <strong>the</strong> SIMS in <strong>the</strong> detection <strong>of</strong> <strong>the</strong> malingering <strong>of</strong> neurocognitiveimpairment, <strong>the</strong>n, has yet to be demonstrated. More promising results were expected in light <strong>of</strong><strong>the</strong> inclusion <strong>of</strong> scales in <strong>the</strong> SIMS that were specifically designed to tap malingering <strong>of</strong>Neurologic impairment (N), Amnestic symptoms (Am), and Low Intelligence (LI). The SIMScannot be recommended for use in screening for neurocognitive symptom feigning until a cutscore that consistently rules out a significant number <strong>of</strong> non-malingerers, and not truemalingerers, is established across samples. It may be that different cut scores are applicable fordifferent settings or applications; for example, it is possible that a lower cut score is useful whenneurocognitive deficit is feigned, while a higher cut score performs reliably with individualsfeigning psychiatric problems. Only fur<strong>the</strong>r studies will provide <strong>the</strong> information needed toevaluate such possibilities.Is <strong>the</strong> SIMS Ready for Forensic Use?This study shows initial support for <strong>the</strong> <strong>utility</strong> <strong>of</strong> <strong>the</strong> SIMS in a civil forensic sample <strong>of</strong>men and women – yet, again, more research is needed in similar samples. Fur<strong>the</strong>r studies couldalso help researchers evaluate <strong>the</strong> SIMS’ potential in screening for neurocognitive symptommalingering, including its amenability to <strong>the</strong> establishment <strong>of</strong> an appropriate cut score for thispurpose.Although support for <strong>the</strong> SIMS is demonstrated by only a handful <strong>of</strong> studies, its use insome forensic settings might appear reasonable. Because <strong>the</strong> SIMS is designed for use only as ascreen, it could be administered with some confidence that it could increase <strong>the</strong> <strong>utility</strong> <strong>of</strong> asecond-stage assessment without substantial risk <strong>of</strong> failing to “capture” a true malingerer. Thiswould, however, presume selection <strong>of</strong> a cut score that has consistently, across studies in samplessimilar to <strong>the</strong> intended setting, demonstrated high sensitivity and NPP. Until now, no more than68
two studies have even reported sensitivity and/or NPP values for <strong>the</strong> same cut score. It is on thisbasis that caution is recommended in employing <strong>the</strong> SIMS in forensic assessments at this time.Study LimitationsAs <strong>the</strong> implications <strong>of</strong> <strong>the</strong>se results are evaluated, limitations <strong>of</strong> <strong>the</strong> present study mustqualify any conclusions reached. Importantly, <strong>the</strong> nature <strong>of</strong> <strong>the</strong> known-groups design preventsus from definitively attributing differences between designated malingerers and honestresponders to <strong>the</strong>ir malingering statuses (Rogers, 1997). Although potentially confoundingdemographic and claim type variables did not differ between any pair <strong>of</strong> malingering and honestgroups, <strong>the</strong>re may be o<strong>the</strong>r differences between <strong>the</strong> groups that were not evaluated that accountfor some or all <strong>of</strong> <strong>the</strong> effects detected. Notably, <strong>the</strong> success <strong>of</strong> <strong>the</strong> SIMS in several previoussimulation studies complements and adds credibility to <strong>the</strong> results <strong>of</strong> this and previous knowngroupsresearch.As with any known-groups comparison, to <strong>the</strong> extent that <strong>the</strong> validity <strong>of</strong> <strong>the</strong> criterionmeasures used is less than perfect, confidence that <strong>the</strong> malingering and honest designations wereaccurately assigned is less than 100%. As a result, <strong>the</strong> validity <strong>of</strong> <strong>the</strong> criterion measures (<strong>the</strong>SIRS, TOMM, VSVT, and TOMM) places a ceiling on <strong>the</strong> validity that can be established for<strong>the</strong> SIMS. Although all <strong>of</strong> <strong>the</strong> criterion measures are supported by substantial researchdemonstrating <strong>the</strong>ir reliability, validity, and <strong>utility</strong> in discriminating malingerers from honestresponders, none <strong>of</strong> <strong>the</strong>se instruments is a perfect indicator.The sample, while quite large, included approximately twice as many men as women, andwas overwhelmingly Caucasian, with virtually no racial variation among <strong>the</strong> non-Caucasianparticipants. Although geographic information was not available, it is highly likely that most <strong>of</strong><strong>the</strong> participants resided in Kentucky, with <strong>the</strong> rest residing in nearby states. These restrictions in<strong>the</strong> demographic variability <strong>of</strong> <strong>the</strong> sample may yield different results than would a more diversesample.Suggestions for Future ResearchThe SIMS shows considerable potential in its intended role as a brief screen formalingering; however, results published so far are not sufficient to lend conclusive support to <strong>the</strong>practice <strong>of</strong> relying on <strong>the</strong> use <strong>of</strong> <strong>the</strong> SIMS in forensic evaluations which contribute so69
substantially to consequential outcomes. Future research needed in order to demonstrate <strong>the</strong><strong>utility</strong> <strong>of</strong> <strong>the</strong> SIMS in forensic assessments includes <strong>the</strong> following.Known-Groups Comparisons. The present study is only <strong>the</strong> second known-groupscomparison supporting <strong>the</strong> <strong>utility</strong> <strong>of</strong> <strong>the</strong> SIMS. More such studies (with high generalizability tomalingering in real-world settings) are essential, to complement <strong>the</strong> more numerous simulationstudies that have been conducted.Civil Forensic Samples. This is <strong>the</strong> first study evaluating <strong>the</strong> performance <strong>of</strong> <strong>the</strong> SIMS ina civil forensic sample. More research in similar settings could help to validate use <strong>of</strong> <strong>the</strong> SIMSwith this population, and will also provide more information regarding typical base rates in civilforensic settings. It is also important that both male and female participants be included.Investigation <strong>of</strong> <strong>the</strong> SIMS’ Utility in Screening for Neurocognitive Symptom Feigning.The SIMS contains three scales designed to be sensitive to <strong>the</strong> malingering <strong>of</strong> neurocognitivesymptomatology, yet its ability to screen for this type <strong>of</strong> malingering has not been a focus <strong>of</strong>previous research, and has not been investigated in a known-groups comparison until now.Fur<strong>the</strong>r assessments <strong>of</strong> <strong>the</strong> SIMS’ performance in <strong>the</strong> detection <strong>of</strong> <strong>the</strong> feigning <strong>of</strong> neurocognitiveimpairment are recommended.More Criminal Forensic Samples. Although three studies have included <strong>of</strong>fenderparticipants, one (Rogers et al., 1996) was a within-subjects simulation study conducted with asample <strong>of</strong> male adolescent <strong>of</strong>fenders; and ano<strong>the</strong>r (Heinze & Purisch, 2001) only assessed <strong>the</strong>sensitivities <strong>of</strong> several instruments in a single group <strong>of</strong> male <strong>of</strong>fender malingerers identifiedaccording to questionable criteria. Additional studies in criminal forensic samples, includingboth men and women; are sorely needed in order to streng<strong>the</strong>n evidence for <strong>the</strong> <strong>utility</strong> <strong>of</strong> <strong>the</strong>SIMS in such settings.Utility <strong>of</strong> SIMS Subscales. Few data have been published documenting <strong>the</strong> sensitivity <strong>of</strong>individual subscales to various types <strong>of</strong> feigning that include complete classification accuracystatistics for <strong>the</strong> subscales or that evaluate <strong>the</strong> <strong>utility</strong> <strong>of</strong> subscales used alone or in variouscombinations. Although in <strong>the</strong> current investigation data relevant to such an investigation werecollected, <strong>the</strong>se questions were not explored here. Examinations <strong>of</strong> <strong>the</strong> performance <strong>of</strong> eachSIMS subscale would allow for <strong>the</strong> evaluation <strong>of</strong> each scale’s usefulness in tapping malingering<strong>of</strong> <strong>the</strong> type <strong>of</strong> symptomatology it was designed to assess, and might reveal screening strategiessuperior to <strong>the</strong> use <strong>of</strong> <strong>the</strong> Total score in some settings or samples.70
Investigation <strong>of</strong> SIMS’ Performance in Screening for Pain Malingering. Detection <strong>of</strong>pain malingering is a relatively recent area <strong>of</strong> investigation (Rogers, 1997). Assessment <strong>of</strong> <strong>the</strong><strong>utility</strong> <strong>of</strong> <strong>the</strong> SIMS, as well as o<strong>the</strong>r instruments, in screening for <strong>the</strong> malingering <strong>of</strong> pain issuggested.Diverse Demographic Samples. The current study utilized a sample that was quiterestricted racially and geographically; such lack <strong>of</strong> demographic variability is a common issue,but raises questions about <strong>the</strong> generalizability <strong>of</strong> results to individuals and samples who do notresemble study participants. Evaluations <strong>of</strong> <strong>the</strong> performance <strong>of</strong> <strong>the</strong> SIMS with diversedemographic samples are encouraged.Validation <strong>of</strong> Reliable Cut Scores. Most critically, work must be undertaken toward <strong>the</strong>establishment <strong>of</strong> a reliable cut score, or <strong>of</strong> reliable cut scores for specific applications.Additional efforts to validate <strong>the</strong> previously proposed cut scores <strong>of</strong> > 14 and, especially, > 16should be attempted so that adequate evidence for a cut score that is consistently useful across orat least within certain sample types can be amassed.ConclusionThis study adds to existing support for <strong>the</strong> SIMS’ potential. The SIMS shows continuedpromise as a brief screen for malingering, but requires consistent and well-supported cut scoresbefore it can be relied upon to assist in <strong>the</strong> high-stakes decision-making performed as a matter <strong>of</strong>course in forensic contexts.Copyright ©2006 Yvonne Renee Alwes. All rights reserved.71
ReferencesAmerican Psychiatric Association. (2000). Diagnostic and Statistical Manual <strong>of</strong> MentalDisorders (4th Ed., Text Revision). Washington, D.C.: Author.Arbisi, P. A. & Ben-Porath, Y. S. (1998). The ability <strong>of</strong> Minnesota Multiphasic PersonalityInventory – 2 validity scales to detect fake-bad responses in psychiatric inpatients.Psychological Assessment, 10, 221-228.Berry, D. T. R., Baer, R. A., & Harris, M. J. (1991). Detection <strong>of</strong> malingering on <strong>the</strong> MMPI: Ameta-analytic review. Clinical Psychology Review, 11, 585-598.Butcher, J. N., Dahlstrom, W. G., Graham, J. R., Tellegen, A., & Kaemmer, B. (1989). MMPI-2: Manual for administration and scoring. Minneapolis: University <strong>of</strong> Minnesota Press.Cohen, J. (1977). Statistical power analysis for behavioral sciences (Revised Ed.). New York:Academic Press.Derogatis, L.R. (1977). SCL-90-R Administration, Scoring, and Procedures Manual.Minneapolis: NCS.Edens, J. F., Otto, R. K., & Dwyer, T. (1999). Utility <strong>of</strong> <strong>the</strong> Structured Inventory <strong>of</strong> MalingeredSymptomatology in identifying persons motivated to malinger psychopathology. Journal<strong>of</strong> <strong>the</strong> American Academy <strong>of</strong> Psychiatry and <strong>the</strong> Law, 27, 387-396.Heinze, M. C. & Purisch, A. D. (2001). Beneath <strong>the</strong> mask: Use <strong>of</strong> psychological tests to detectand subtype malingering in criminal defendants. Journal <strong>of</strong> Forensic PsychologyPractice, 1, 23-52.Inman, T. H. & Berry, D. T. R. (2002). Cross-validation <strong>of</strong> indicators <strong>of</strong> malingering: Acomparison <strong>of</strong> nine neuropsychological tests, four tests <strong>of</strong> malingering, and behavioralobservations. Archives <strong>of</strong> Clinical Neuropsychology, 17, 1-23.Inman, T. H., Vickery, C. D., Berry, D. T. R., Lamb, D. G., Edwards, C. L., & Smith, G. T.(1998). Development and initial validation <strong>of</strong> a new procedure for evaluating adequacy<strong>of</strong> effort given during neuropsychological testing: The Letter Memory Test.Psychological Assessment, 10, 128-139.Lewis, J. L., Simcox, A. M., & Berry, D. T. R. (2002). Screening for Feigned PsychiatricSymptoms in a Forensic Sample by Using <strong>the</strong> MMPI-2 and <strong>the</strong> Structured Inventory <strong>of</strong>Malingered Symptomatology. Psychological Assessment, 14, 170-176.72
Meehl, P. E. (1955). Antecedent probability and <strong>the</strong> efficiency <strong>of</strong> psychometric signs, patterns,or cutting scores. Psychological Bulletin, 52, 194-216.Rogers, R. (Ed.). (1997). Clinical Assessment <strong>of</strong> Malingering and Deception (2nd Ed.). NewYork: Guilford Press.Rogers, R., Bagby, R. M., & Dickens, S. E. (1992). SIRS - Structured Interview <strong>of</strong> ReportedSymptoms: A pr<strong>of</strong>essional manual. Odessa, FL: Psychological Assessment ResourcesInc.Rogers, R., Hinds, J. D., & Sewell, K. W. (1996). Feigning psychopathology among adolescent<strong>of</strong>fenders: Validation <strong>of</strong> <strong>the</strong> SIRS, MMPI-A, and SIMS. Journal <strong>of</strong> PersonalityAssessment, 67, 244-257.Rogers, R., Sewell, K. W., & Salekin, R. T. (1994). A meta-analysis <strong>of</strong> malingering on <strong>the</strong>MMPI-2. Assessment, 1, 227-237.Slick, D., Hopp, G., Strauss, E., & Thompson, G. B. (1997). Victoria Symptom Validity Test.Odessa, FL: Psychological Assessment Resources Inc.Smith, G. P. (1992). Detection <strong>of</strong> Malingering: A validation study <strong>of</strong> <strong>the</strong> SLAM test (Doctoraldissertation, University <strong>of</strong> Missouri - St. Louis, 1992). Dissertation AbstractsInternational, 53, 3795B.Smith, G. P. & Burger, G. K. (1997). Detection <strong>of</strong> Malingering: Validation <strong>of</strong> <strong>the</strong> StructuredInventory <strong>of</strong> Malingered Symptomatology (SIMS). Journal <strong>of</strong> <strong>the</strong> American Academy <strong>of</strong>Psychiatry and <strong>the</strong> Law, 25, 183-189.Thompson, G. B. (2002). The Victoria Symptom Validity Test: An enhanced test <strong>of</strong> symptomvalidity. Journal <strong>of</strong> Forensic Neuropsychology, 2, 3-4, 43-67.Tombaugh, T. N. (1996). Test <strong>of</strong> Memory Malingering: TOMM. North Towanda, NY: Multi-Health Systems.Tombaugh, T. N. (2002). The Test <strong>of</strong> Memory Malingering (TOMM) in forensic psychology.Journal <strong>of</strong> Forensic Neuropsychology, 2, 3-4, 69-96.Vickery, C. D., Berry, D. T. R., Dearth, C. S., Vagnini, V. L., Baser, R. E., Cragar, D. E., &Orey, S. A. (2004). Head injury and <strong>the</strong> ability to feign neuropsychological deficits.Archives <strong>of</strong> Clinical Neuropsychology, 19, 37-48.Wechsler, D. (1981). Wechsler Adult Intelligence Scale – Revised. San Antonio, TX: ThePsychological Corporation.73
Wechsler, D. (1997). Wechsler Adult Intelligence Scale – Third Edition. San Antonio, TX:The Psychological Corporation.74
VitaYvonne Renee AlwesPersonal InformationDate <strong>of</strong> Birth: May 6, 1959Place <strong>of</strong> Birth: Ephrata, PennsylvaniaEducationPh.D. Program, Clinical Psychology. August 2003 – Present.University <strong>of</strong> Kentucky, Lexington, Kentucky.Bachelor <strong>of</strong> Arts, Psychology. May 1981.Transylvania University, Lexington, Kentucky.Scholastic HonorsNational Merit ScholarshipRecipientOmicron Delta Kappa, National Leadership HonoraryMember and Vice President <strong>of</strong> University ChapterExperiencePsychological Assessment.University <strong>of</strong> Kentucky. August 2003 – Present.Psycho<strong>the</strong>rapy.Jesse G. Harris Psychological Services Center, University <strong>of</strong> Kentucky.August 2004 – Present.Pr<strong>of</strong>essional MembershipsAssociation for Psychological Science(formerly American Psychological Society)75
Society for a Science <strong>of</strong> Clinical Psychology(American Psychological Association — Division 12 — Section III)American Psychology - Law Society(American Psychological Association — Division 41)Kentucky Psychological AssociationYvonne Renee Alwes76