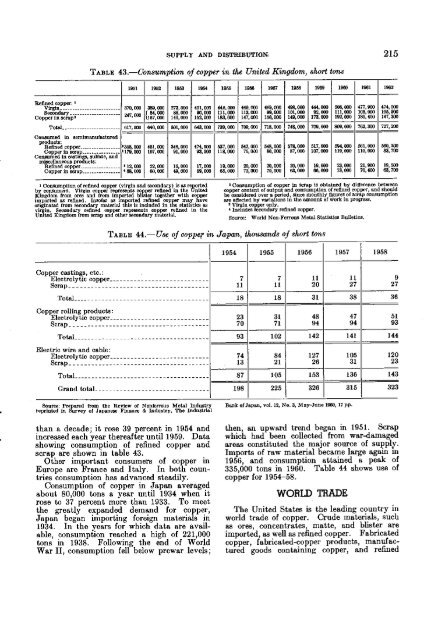
SUPPLY AND DISTRIBUTIO&T 215TABLE 43.-Consumptiun<strong>of</strong> copper in the United Khgdom, short tonsSource: World Non-Ferrous Metal Statistlm Bulletins.TABLE 44.-Use<strong>of</strong> coppq in Japan, thous<strong>and</strong>s <strong>of</strong> short tons1 1954 1 1955 1 1956 1 1957 1 1958Copper castings, etc.:Electrolytic copper ............................Scrap .......................................927Total ......................................36Capper rolling products:Electrolytic copper ............................Scrap .......................................Total ......................................Electric win <strong>and</strong> cable:Electrolytic copper ............................Scrap .......................................2370 7193 10213 2148 4794 94!142 141127 10526 31519314412023Total ......................................87 105153 136143Gr<strong>and</strong> total .............................198 225326 3153238 0 ~ Prepared ~ : fmm the Review <strong>of</strong> Nmle-s Metal Industryreprinted in Survey <strong>of</strong> Jspanesp Piornee & Industry, The industrlslthan a decade; it rose 39 percent in 1954 <strong>and</strong>increased each year thereafter until 1959. Datashowing consumption <strong>of</strong> refined copper <strong>and</strong>scrap are shown in table 43.Other important consumers <strong>of</strong> copper inEurope are France <strong>and</strong> Italy. In both countriesconsumption has advanced steadily.Consumption <strong>of</strong> copper in Japan averagedabout 80,000 tons a year until 1934 when itrose to 37 percent more than 1933. To meetthe greatly exp<strong>and</strong>ed demund for copper,Japan began importing foreign materials in1934. In the years for which data are available,consumption reached a high <strong>of</strong> 221,000tons in 1938. Following the end <strong>of</strong> WorldWar 11, consumption fell below prewar levels;Bank ollspao, vol. 12, No. 3, May-June 18M. 17 pp.then, un upward trend began in 1951. Scrapwhich had been collected from werdamagsdareas constituted the ,major source <strong>of</strong> supply.Imports <strong>of</strong> raw mateval became large agaln m1956, <strong>and</strong> consumption attained a peak <strong>of</strong>335,000 tons in 1960. Table 44 shows use <strong>of</strong>copper for 1954-58.WORLD TRADEThe United <strong>State</strong>s is the leading country inworld trade <strong>of</strong> copper. Crude materials, suchas ores, concentrates, matte, <strong>and</strong> blister areimported, as well as refined copper. Fabricatedcopper, fabricated-copper products, manufacturedgoods contalnlng copper, <strong>and</strong> refined
copper are exported. The other leading producingcountries--Canada, Chile, Republic <strong>of</strong>the Congo, Federation <strong>of</strong> Rhodesia <strong>and</strong> Nyse,l<strong>and</strong>--export most <strong>of</strong> their output. Approximately125,000 tons <strong>of</strong> the annual out ut<strong>of</strong> Canada is consumed in that country. $heUnited Kingdom regularly imports most <strong>of</strong> itsrequirements.United <strong>State</strong>sFor many years before World War 11, US.production <strong>of</strong> copper exceeded supply, <strong>and</strong> there,was a substantial surplus for export. Afterthe beginning <strong>of</strong> the war the United <strong>State</strong>sneeded all the copper that entered the countryto fill its large armament requirements <strong>and</strong> in1940 again became a net importer <strong>of</strong> copper.The high level <strong>of</strong> industrial activity for most<strong>of</strong> the postwar period continued to require largeimportations <strong>of</strong> raw materials. Also, domesticproduction was adversely affected by laborstrikes. The record for imports was reachedin 1945 when receipts <strong>of</strong> unmanufactured coppertotaled 853,000 tons. Again in June 1950 theconflict in Korea made it necessary to importlarge quantities <strong>of</strong> copper. About on,e-fourth<strong>of</strong> US. requirements have been met by imports.For the first time in 20 years exports exceededimports in 1960.After enactment <strong>of</strong> the excise tax law in1932, copper that was imported in bond forsmelting <strong>and</strong>/or refining <strong>and</strong> subsequent exportwas tax free; only small uantities <strong>of</strong> refined copper were received. ?hissituation changedin 1941. It became evident that domesticmetal would be inadequate to fill U.S. requirementsplus shar ly exp<strong>and</strong>ed dem<strong>and</strong>s <strong>of</strong>foreign countries f or war products made withcopper. Every effort was made to supplade uate shipping facilities to obtain a 8avAable refined copper, <strong>and</strong> this class becamethe principal import item. Receipt <strong>of</strong> 531,000tons <strong>of</strong> refined co per in 1945 was a record.Imports fell sharpy P thereafter but an upwardtrend began in 1950 with conflict in Korea.A postwar high <strong>of</strong> 347,000 tons was attainedin 1952 as a result <strong>of</strong> diversion <strong>of</strong> Canadiancopper from a strikebound refinery in Canada<strong>and</strong> eater . receipts . from Chide. The latterwas ue to aetron <strong>of</strong> the US. Government,which permitted passing on increased costs <strong>of</strong>foreign cop er to consumers. See the sectionabout le Isfation <strong>and</strong> government programs.KVirtual y all copper ex orted is refined copper<strong>and</strong> fabrications theregom. Refined copperwas the largest export class until 1944 wheninsulated wire <strong>and</strong> cable became the principdclass. Before World War 11, exports wentlargely to Japan <strong>and</strong> certain Europeancountries-Belgium, France, Germany, Italy,Sweden, <strong>and</strong> the United Kin dom Afterthe war began only the United kngdom wasan important customer until it was joined bythe U.S.S.R. Exports fell sharply during thewar years <strong>and</strong> continued far below prewarlevels in many years after the war. Becausethe sup ly <strong>of</strong> copper in the United <strong>State</strong>swas ina f equate to 6ll requirements in most <strong>of</strong>this period, copper was subject to exportcontrols. In September 1956 export restrictionswere removed <strong>and</strong> shipments rose to thehighest level since 1940. In 1959 a shortagedeveloped because <strong>of</strong> strikes, <strong>and</strong> exportsfell to less than half the 1958 shipments. Asharp increase was recorded in 1960 as WestGermany, United Kingdom, Ital , <strong>and</strong> Francetook 73 percent <strong>of</strong> the totsf Significantquantities went to Japan, Brazil, <strong>and</strong> Argentina.Imports.-The longtime copper position <strong>of</strong>the United <strong>State</strong>s was that <strong>of</strong> an exportingnation until World War 11. U.S. smelting <strong>and</strong>refining capacity was excessive for treatment <strong>of</strong>domestic materials, <strong>and</strong> this excess capacityencouraged importation <strong>of</strong> foreign crude materialsfor custom treatment. Most <strong>of</strong> theimported materials were smelted <strong>and</strong> refinedunder bond for reexportation in refined ormanufactured forms. In addition, much domesticcopper was shipped for consumptionabroad. In 1930, however, because <strong>of</strong> sharplyreduced world consumption, the situationreversed, <strong>and</strong> the United <strong>State</strong>s became a netimporter. In 1932 to discourage receipts <strong>of</strong>foreign copper an excise tax was imposed, <strong>and</strong>in 1933 the United <strong>State</strong>s resumed its net exportposition which held through 1939. After thestart <strong>of</strong> World War I1 in Europe <strong>and</strong> the stepup<strong>of</strong> armament requirements there <strong>and</strong> elsewhere,the United <strong>State</strong>s became a net importer <strong>of</strong>copper.Four countries in the Western Hemispherehave supplied almost 80 percent <strong>of</strong> the totalimports in the last 35 years. Chile rankedfirst with 46 percent <strong>of</strong> the total, followed byCanada, 14 percent; Mexico, 11 percent; <strong>and</strong>Peru, 8 percent. Republic <strong>of</strong> the Congo <strong>and</strong>the Federation <strong>of</strong> Rhodesia <strong>and</strong> Nyasal<strong>and</strong>each accounted for 4 percent.By 1933 imports had decreased to 144,000tons-a record low-partly as a result <strong>of</strong> theimposition <strong>of</strong> the 4-cent excise tax in 1932. Asbusiness conditions improved in 1934 importsincreased despite the duty. Greater receipts<strong>of</strong> unrefined classes more than <strong>of</strong>fset the dropin refined copper <strong>and</strong> were largely responsiblefor the increased imports. Except for 1929,requirements for copper outside the United<strong>State</strong>s in 1936 were the largest on record, <strong>and</strong>U.S. imports fell to 190,000 tons. From 1939
- Page 1 and 2: I Cbureauof minesinformation circul
- Page 3 and 4: 212 COPPERBeginning in 1945 actual
- Page 5: 214 COPPERTABLE 42.-Cmsumptiaojprch
- Page 9 and 10: 218 COPPERTABLE 45.-CopperYear(unmn
- Page 11 and 12: 220 COPPERTABLE 46.-CopperOre and c
- Page 13 and 14: ...................................
- Page 15 and 16: 224 COPPERTABLE 47.-Copper(unmnufac
- Page 17 and 18: 226 COPPERTABLE 47.-Copper(unmnujQd
- Page 19 and 20: 228 COPPERTABLE 47.-Copper(unmanufa
- Page 21 and 22: 230 COPPERTABLE 49.-Ezports of imla
- Page 23 and 24: 232 COPPERTABLE 51.-Re$nedcopper ex
- Page 25 and 26: 234 COPPERTABLE 51.-Re$nedcopper ez
- Page 27 and 28: 236 COPPERTABLE 51.-Rejlned copper
- Page 29 and 30: 238 COPPERTABLE 52.-4opperdose alla
- Page 31 and 32: 240 COPPERTABLE 55.-Imports of copp
- Page 33 and 34: 242 COPPER.........................
- Page 35 and 36: 244 COPPERTABLE 58.-Expo~ia of copp
- Page 37 and 38: 246 COPPERTABLE 59.-Ezportsof coppe
- Page 39 and 40: COPPERTABLE 61.-Average yearly oted
- Page 41 and 42: ~ ~250 COPPERTABLE 62.-hks oj coppe
- Page 43 and 44: COPPERTABLE 65.--Gouernment stocks
- Page 45 and 46: OPei%tlng CmlPaWTABLE 68.-Principal
- Page 47 and 48: COPPERTABLE 71.-UnitedStates primar
- Page 49 and 50: ~~~~ ~~.COPPERFabricating Company:A
- Page 51 and 52: 260 COPPERTABLE 73.-PTimipal seller
- Page 53 and 54: in 1901, but this time a crash was
- Page 55 and 56: 264 COPPERSales of nonferrous and p
- Page 57 and 58:
~ ~COPPERThe company is both an ope
- Page 59 and 60:
~-~~~ ~~ -268 COPPERHecla of Canada
- Page 61 and 62:
.~~~ ~~~270 COPPERin mining, proces
- Page 63 and 64:
COPPERCom any ContinuedPer&om~dEewE
- Page 65 and 66:
274 COPPERThe company names, addres
- Page 67 and 68:
276 COPPERTABLE 76.-Principal Gover
- Page 69 and 70:
278 OOPPERTABLE 78.-Union aflialion
- Page 71 and 72:
TABLE 79.-Twenty-five leading coppe
- Page 73 and 74:
282 COPPERTABLE 80.-Fo~eign copper
- Page 75 and 76:
284 COPPERmerged with Bathhurst Min
- Page 77 and 78:
~.~Mines and plants:The El Teniente
- Page 79 and 80:
288 COPPERXupferhutte Brtel, Bieber
- Page 81 and 82:
2 90 COPPERPlant:This is an electro
- Page 83 and 84:
292 COPPERThe Fornkawa Electric Co.
- Page 85 and 86:
~294 COPPERpriaes a cop er area of
- Page 87 and 88:
~ ~.~.~--~ ~~ ~~.~ -~~,296 COPPERis
- Page 89 and 90:
298 COPPERcoal, and a converter. Bl
- Page 91 and 92:
300 COPPERYearTABLE 81.-Employee an
- Page 93 and 94:
302 COPPERThe average wage per man-
- Page 95 and 96:
304 COPPERTABLE 85.-ProdUOtivity da
- Page 97 and 98:
CHAPTER 9.-RESEARCHResearch and dev
- Page 99 and 100:
RESEARCH AND DEVELOPMENT, 309iIi Im
- Page 101 and 102:
RESEARCH AND DEVELOPMENT 311Copper
- Page 103 and 104:
CHAPTER 10.-LEGISLATION AND GOVERNM
- Page 105 and 106:
TARLE 87.-Ratesof duty under Tariff
- Page 107 and 108:
1/1/48 Pound, mom ...............WE
- Page 109 and 110:
LEGISLATION AND GOVBENMENT PROGRAMS
- Page 111 and 112:
LEGISLATION AND GOVERNMENT PROGRM52
- Page 113 and 114:
LEGPSLATION AND GOVERNMENT PROGRAMS
- Page 115 and 116:
LEGISLATION AND GOVERNMENT PROGRAMS
- Page 117 and 118:
328 COPPERmandatory priority contro
- Page 119 and 120:
330 COPPERthree most basic and crit
- Page 121 and 122:
332 COPPERextend for 2% years. The
- Page 123 and 124:
TABLE 89.-Contractsfor expansion an
- Page 125 and 126:
336 COPPER24, OPS exempted from pri
- Page 127 and 128:
338 COPPERis additional to the stra
- Page 129:
Bureauof D~mobiliratio~r, Civilian