ABN AMRO ALTERNATIVE INVESTMENT STRATEGIES-ABN AMRO MULTI STRATEGY FUNDTURNOVER RATIO - Underlying FundCurrent YearPrevious Year(1 Jan 2007 – 31 Dec 2007) (1 Jan 2006 – 31 Dec 2006)Underlying Fund 13.09% 48.70%Hedge Funds are transacted at net asset value. The turnover for a hedge fund of funds does not influence its performance, asthere are no costs (such as <strong>com</strong>mission) involved when a hedge fund is brought or sold.Please refer to the Audited Financial Statement for turnover ratio for feeder fund.Schedule of Investments of Underlying Fund as at December 31, 2007 (Unaudited)Collective Investments Scheme12NominalHolding(Shares)Market Value(US$)% ofNAVBermudaPlatinum Grove Contingent Capital Offshore Fund Limited 21,055 34,456,255.02 3.51Renaissance Institutional Equities Fund Sicav Plc 31,121 30,797,767.83 3.14Seneca Capital International Limited 8,707 893,348.26 0.0960,883 66,147,371.11 6.73Cayman IslandsAlydar Fund Limited – B-1 192,550 34,641,152.86 3.53Amber Fund (Cayman) Ltd 216,584 33,784,070.74 3.44Bristol Fund Ltd 4,754 3,451,072.66 0.35Claren Road Credit Fund Ltd – B-20 30,000 31,004,244.63 3.16Claren Road Credit Fund Ltd – B-23 5,000 5,017,500.00 0.51Eminence Long Alpha Ltd 29,181 34,321,968.69 3.49Kaiser Trading Fund SPC 2,635767 36,499,178.75 3.71Karsch Capital Limited - B 236,624 42,801,692.71 4.36Lansdowne Global Financials Fund Limited 166,973 38,843,375.85 4.06Mangart Global Fund Limited 86,780 31,522,495.81 3.21MKM Longboat Multi Strategy Fund Limited 992,430 35,158,586.70 3.58Oceanwood Global Opportunities Fund-A-2-1 100,000 11,430,010.00 1.16Oceanwood Global Opportunities Fund-A-2-10 100,000 9,597,120.00 0.98Oceanwood Global Opportunities Fund-A-6 100,000 10,337,570.00 1.05Optimal Japan Fund-USD 781,466 18,286,315.17 1.86OZ Europe Overseas II Limited 34,213 41,148,843.08 4.19Plainfield Special Situations Offshore Feeder Fund 350,000 35,788303.58 3.64Plexus Fund Ltd 289,566 33,769,137.82 3.44Savannah Baltimore Offshore Ltd 26,224 29,673,583.38 3.02Southport Millennium Offshore Inc 3,191,843 41,756,407.45 4.25TCS Capital International Ltd-B 2,078 654,251.33 0.07TCS Capital International Ltd-BB 72,673 25,037,262.47 2.55TCS Capital International Ltd-D 60,000 6,447,738.96 0.66The 32 Capital Fund Limited Class A Series 1 02 7,788 11,208,500.52 1.14The 32 Capital Fund Limited Class B Series 1 02 11,146 16,034,490.27 1.63The 32 Capital Fund Limited Class B Series 11 05 1,500 1,550,053.59 0.16The Alphagen Octanis Fund Ltd - A 220,785 28,984,429.67 2.95The Tantallon Fund 1,968,076 28,752,659.57 2.93Tudor Tensor Fund Limited - A 21,707 26,365,159.58 2.68Tudor Tensor Fund Limited - Q 6,492 7,885,413.79 0.80York Credit Opportunities Unit Trust – B-11 494,147 20,195795.44 2.06York Credit Opportunities Unit Trust – B-12 367,619 15,028,254.81 1.5312,811,854 747,976,639.88 76.15
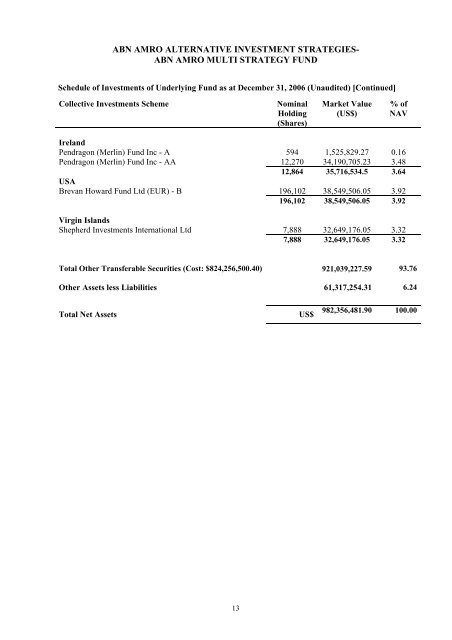
ABN AMRO ALTERNATIVE INVESTMENT STRATEGIES-ABN AMRO MULTI STRATEGY FUNDSchedule of Investments of Underlying Fund as at December 31, 2006 (Unaudited) [Continued]Collective Investments SchemeNominalHolding(Shares)Market Value(US$)% ofNAVIrelandPendragon (Merlin) Fund Inc - A 594 1,525,829.27 0.16Pendragon (Merlin) Fund Inc - AA 12,270 34,190,705.23 3.4812,864 35,716,534.5 3.64USABrevan Howard Fund Ltd (EUR) - B 196,102 38,549,506.05 3.92196,102 38,549,506.05 3.92Virgin IslandsShepherd Investments International Ltd 7,888 32,649,176.05 3.327,888 32,649,176.05 3.32Total Other Transferable Securities (Cost: $824,256,500.40) 921,039,227.59 93.76Other Assets less Liabilities 61,317,254.31 6.24Total Net Assets US$982,356,481.90 100.0013