2009 Business Overview - TSMC
2009 Business Overview - TSMC
2009 Business Overview - TSMC

Create successful ePaper yourself
Turn your PDF publications into a flip-book with our unique Google optimized e-Paper software.
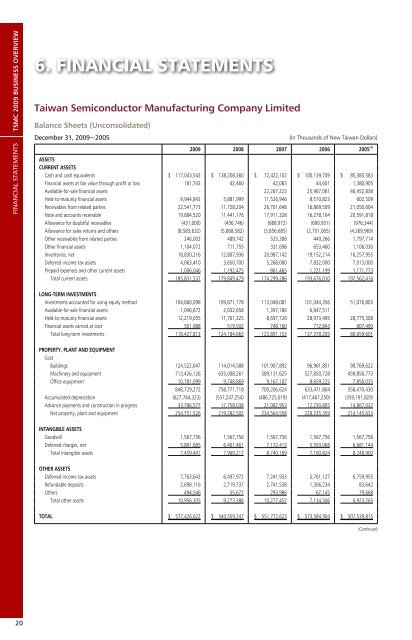
FINANCIAL STATEMENTS<strong>TSMC</strong> <strong>2009</strong> BUSINESS OVERVIEWFINANCIAL STATEMENTS6. FINANCIAL STATEMENTSTaiwan Semiconductor Manufacturing Company LimitedBalance Sheets (Unconsolidated)December 31, <strong>2009</strong>~2005(In Thousands of New Taiwan Dollars)<strong>2009</strong> 2008 2007 2006 2005 (1)ASSETSCURRENT ASSETSCash and cash equivalents $ 117,043,543 $ 138,208,360 $ 72,422,102 $ 100,139,709 $ 85,383,583Financial assets at fair value through profit or loss 181,743 42,460 42,083 44,601 1,380,905Available-for-sale financial assets - - 22,267,223 25,967,061 46,452,838Held-to-maturity financial assets 9,944,843 5,881,999 11,526,946 8,510,823 602,509Receivables from related parties 22,541,773 11,728,204 26,701,648 16,869,509 21,050,604Note and accounts receivable 19,884,520 11,441,176 17,911,328 16,278,164 20,591,818Allowance for doubtful receivables (431,000) (436,746) (688,972) (690,931) (976,344)Allowance for sales returns and others (8,583,632) (5,868,582) (3,856,685) (2,751,065) (4,269,969)Other receivables from related parties 246,003 489,742 525,308 449,266 1,797,714Other financial assets 1,104,072 711,755 331,698 653,460 1,106,030Inventories, net 18,830,216 12,807,936 20,987,142 19,152,214 16,257,955Deferred income tax assets 4,063,410 3,650,700 5,268,000 7,832,000 7,013,000Prepaid expenses and other current assets 1,006,046 1,192,475 861,465 1,221,199 1,171,773Total current assets 185,831,537 179,849,479 174,299,286 193,676,010 197,562,416LONG-TERM INVESTMENTSInvestments accounted for using equity method 104,660,098 109,871,178 113,048,081 101,044,356 51,076,803Available-for-sale financial assets 1,046,672 2,032,658 1,397,186 6,647,511 -Held-to-maturity financial assets 12,219,055 11,761,325 8,697,726 28,973,495 28,775,308Financial assets carried at cost 501,988 519,502 748,160 712,843 807,490Total long-term investments 118,427,813 124,184,663 123,891,153 137,378,205 80,659,601PROPERTY, PLANT AND EQUIPMENTCostBuildings 124,522,047 114,014,588 101,907,892 96,961,851 90,769,622Machinery and equipment 713,426,126 635,008,261 589,131,625 527,850,728 459,850,773Office equipment 10,781,099 9,748,869 9,167,107 8,659,225 7,850,035848,729,272 758,771,718 700,206,624 633,471,804 558,470,430Accumulated depreciation (627,764,323) (557,247,254) (486,725,019) (417,467,250) (359,191,829)Advance payments and construction in progress 33,786,577 17,758,038 21,082,953 12,230,805 14,867,032Net property, plant and equipment 254,751,526 219,282,502 234,564,558 228,235,359 214,145,633INTANGIBLE ASSETSGoodwill 1,567,756 1,567,756 1,567,756 1,567,756 1,567,756Deferred charges, net 5,891,685 6,401,461 7,172,413 5,593,068 6,681,144Total intangible assets 7,459,441 7,969,217 8,740,169 7,160,824 8,248,900OTHER ASSETSDeferred income tax assets 7,763,643 6,497,972 7,241,933 5,761,127 6,759,955Refundable deposits 2,698,116 2,719,737 2,741,538 1,306,234 83,642Others 494,546 55,677 293,986 67,145 79,668Total other assets 10,956,305 9,273,386 10,277,457 7,134,506 6,923,265TOTAL $ 577,426,622 $ 540,559,247 $ 551,772,623 $ 573,584,904 $ 507,539,815(Continued)20