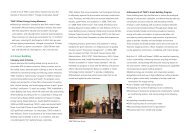
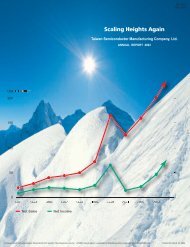
2009 Business Overview - TSMC
2009 Business Overview - TSMC
2009 Business Overview - TSMC

You also want an ePaper? Increase the reach of your titles
YUMPU automatically turns print PDFs into web optimized ePapers that Google loves.
Taiwan Semiconductor Manufacturing Company Limited and SubsidiariesStatements of Income (Consolidated)For the Years Ended December 31, <strong>2009</strong> ~ 2005(In Thousands of New Taiwan Dollars, Except for Earnings Per Share)<strong>2009</strong> 2008 2007 (1) 2006 (1) 2005 (1)GROSS SALES $309,655,614 $341,983,355 $328,336,172 $322,883,499 $271,801,696SALES RETURNS AND ALLOWANCES 13,913,375 8,825,695 5,705,576 5,476,328 5,236,626NET SALES 295,742,239 333,157,660 322,630,596 317,407,171 266,565,070COST OF SALES 166,413,628 191,408,099 180,280,385 161,597,081 148,362,196GROSS PROFIT 129,328,611 141,749,561 142,350,211 155,810,090 118,202,874OPERATING EXPENSESResearch and development 21,593,398 21,480,937 17,946,322 16,076,432 14,016,506General and administrative 11,285,478 11,096,599 8,963,836 8,716,653 9,085,536Marketing 4,487,849 4,736,657 3,718,146 3,752,311 4,132,273Total operating expenses 37,366,725 37,314,193 30,628,304 28,545,396 27,234,315INCOME FROM OPERATIONS 91,961,886 104,435,368 111,721,907 127,264,694 90,968,559NON-OPERATING INCOME AND GAINSInterest income 2,600,925 5,373,823 5,651,700 4,542,149 2,806,226Settlement income 1,464,915 951,180 985,114 979,214 964,710Valuation gain on financial instruments, net 594,660 - 63,017 - -Technical service income 367,013 1,181,966 590,391 571,500 462,624Rental income 153,919 166,317 378,643 224,290 847Gain on disposal of property, plant and equipment and other assets 113,963 100,874 91,210 421,051 342,756Equity in earnings of equity method investees, net 45,994 701,533 2,507,869 2,347,153 1,433,226Gain on settlement and disposal of financial assets, net 15,999 721,050 874,670 133,489 -Foreign exchange gain, net - 1,227,653 80,922 - 2,609,979Subsidy income - 8,029 364,321 334,478 321,850Others 296,160 389,024 345,946 285,757 457,142Total non-operating income and gains 5,653,548 10,821,449 11,933,803 9,839,081 9,399,360NON-OPERATING EXPENSES AND LOSSESImpairment of financial assets 913,230 1,560,055 54,208 279,690 128,900Foreign exchange loss, net 626,971 - - 400,863 -Interest expense 391,479 614,988 842,242 890,602 1,413,374Loss on disposal of property, plant and equipment 68,486 589 6,190 241,397 60,109Valuation loss on financial instruments, net - 1,081,019 - 1,745,036 3,778,073Loss on idle assets - 210,477 - 44,072 131,849Provision for litigation loss - 99,126 1,008,635 - -Loss on settlement and disposal of financial assets, net - - - - 161,886Others 152,621 218,317 102,409 139,907 430,481Total non-operating expenses and losses 2,152,787 3,784,571 2,013,684 3,741,567 6,104,672INCOME BEFORE INCOME TAX 95,462,647 111,472,246 121,642,026 133,362,208 94,263,247INCOME TAX EXPENSE 5,996,424 10,949,009 11,709,626 7,773,711 630,579NET INCOME BEFORE CUMULATIVE EFFECT OF CHANGES INACCOUNTING PRINCIPLES 89,466,223 100,523,237 109,932,400 125,588,497 93,632,668CUMULATIVE EFFECT OF CHANGES IN ACCOUNTING PRINCIPLES,NET OF TAX BENEFIT OF NT$82,062 THOUSAND - - - 1,606,749 -NET INCOME $ 89,466,223 $100,523,237 $109,932,400 $127,195,246 $ 93,632,668ATTRIBUTABLE TO:Shareholders of the parent $ 89,217,836 $ 99,933,168 $109,177,093 $127,009,731 $ 93,575,035Minority interest 248,387 590,069 755,307 185,515 57,633$ 89,466,223 $100,523,237 $109,932,400 $127,195,246 $ 93,632,668EARNINGS PER SHARE (2)Basic earnings per share $ 3.45 $ 3.84 $ 4.04 $ 4.70 $ 3.47Diluted earnings per share $ 3.44 $ 3.81 $ 4.04 $ 4.69 $ 3.46Note 1: Certain accounts have been reclassified to conform to 2008 classifications.Note 2: Retroactively adjusted for stock dividends until 2008 and profit sharing to employees in stock until 2007.29