2009 Business Overview - TSMC
2009 Business Overview - TSMC
2009 Business Overview - TSMC

Create successful ePaper yourself
Turn your PDF publications into a flip-book with our unique Google optimized e-Paper software.
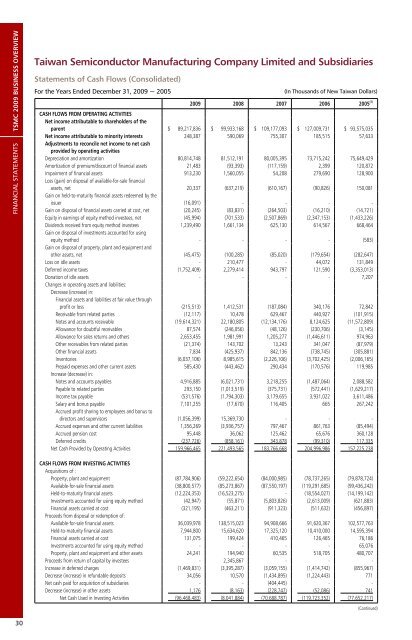
<strong>TSMC</strong> <strong>2009</strong> BUSINESS OVERVIEWFINANCIAL STATEMENTSTaiwan Semiconductor Manufacturing Company Limited and SubsidiariesStatements of Cash Flows (Consolidated)For the Years Ended December 31, <strong>2009</strong> ~ 2005(In Thousands of New Taiwan Dollars)<strong>2009</strong> 2008 2007 2006 2005 (1)CASH FLOWS FROM OPERATING ACTIVITIESNet income attributable to shareholders of theparent $ 89,217,836 $ 99,933,168 $ 109,177,093 $ 127,009,731 $ 93,575,035Net income attributable to minority interests 248,387 590,069 755,307 185,515 57,633Adjustments to reconcile net income to net cashprovided by operating activitiesDepreciation and amortization 80,814,748 81,512,191 80,005,395 73,715,242 75,649,429Amortization of premium/discount of financial assets 21,483 (93,393) (117,159) 2,399 120,872Impairment of financial assets 913,230 1,560,055 54,208 279,690 128,900Loss (gain) on disposal of available-for-sale financialassets, net 20,337 (637,219) (610,167) (90,826) 150,081Gain on held-to-maturity financial assets redeemed by theissuer (16,091) - - - -Gain on disposal of financial assets carried at cost, net (20,245) (83,831) (264,503) (16,210) (14,721)Equity in earnings of equity method investees, net (45,994) (701,533) (2,507,869) (2,347,153) (1,433,226)Dividends received from equity method investees 1,239,490 1,661,134 625,130 614,567 668,464Gain on disposal of investments accounted for usingequity method - - - - (583)Gain on disposal of property, plant and equipment andother assets, net (45,475) (100,285) (85,020) (179,654) (282,647)Loss on idle assets - 210,477 - 44,072 131,849Deferred income taxes (1,752,409) 2,279,414 943,797 121,590 (3,353,013)Donation of idle assets - - - - 7,207Changes in operating assets and liabilities:Decrease (increase) in:Financial assets and liabilities at fair value throughprofit or loss (215,513) 1,412,531 (187,084) 340,176 72,842Receivable from related parties (12,117) 10,478 629,467 440,927 (101,915)Notes and accounts receivable (19,614,321) 22,180,805 (12,134,176) 8,124,625 (11,572,809)Allowance for doubtful receivables 87,574 (246,056) (48,126) (230,706) (3,145)Allowance for sales returns and others 2,653,455 1,981,991 1,205,277 (1,446,611) 974,963Other receivables from related parties (21,374) 143,702 13,243 341,047 (87,979)Other financial assets 7,834 (425,937) 842,136 (738,745) (305,881)Inventories (6,037,106) 8,985,615 (2,226,106) (3,702,425) (2,006,165)Prepaid expenses and other current assets 585,430 (443,462) 290,434 (170,576) 119,985Increase (decrease) in:Notes and accounts payables 4,916,885 (6,021,731) 3,218,255 (1,487,064) 2,088,582Payable to related parties 293,150 (1,013,519) (375,731) (572,441) (1,629,217)Income tax payable (531,576) (1,794,303) 3,179,655 3,931,022 3,611,486Salary and bonus payable 7,101,255 (17,670) 116,405 665 267,242Accrued profit sharing to employees and bonus todirectors and supervisors (1,056,399) 15,369,730 - - -Accrued expenses and other current liabilities 1,356,269 (3,936,757) 797,467 861,763 (85,494)Accrued pension cost 95,448 36,062 125,462 65,676 360,128Deferred credits (237,726) (858,161) 343,878 (99,310) 117,335Net Cash Provided by Operating Activities 159,966,465 221,493,565 183,766,668 204,996,986 157,225,238CASH FLOWS FROM INVESTING ACTIVITIESAcquisitions of :Property, plant and equipment (87,784,906) (59,222,654) (84,000,985) (78,737,265) (79,878,724)Available-for-sale financial assets (38,800,577) (85,273,867) (87,550,197) (119,291,685) (99,436,242)Held-to-maturity financial assets (12,224,353) (16,523,275) - (18,554,027) (14,199,142)Investments accounted for using equity method (42,947) (55,871) (5,803,826) (2,613,009) (621,883)Financial assets carried at cost (321,195) (463,211) (911,323) (511,632) (456,897)Proceeds from disposal or redemption of:Available-for-sale financial assets 36,039,978 138,515,023 94,908,666 91,620,367 102,577,763Held-to-maturity financial assets 7,944,800 15,634,620 17,325,120 10,410,000 14,595,394Financial assets carried at cost 131,075 199,424 410,465 126,465 76,186Investments accounted for using equity method - - - - 65,076Property, plant and equipment and other assets 24,241 194,940 60,535 518,705 480,707Proceeds from return of capital by investees - 2,345,867 - - -Increase in deferred charges (1,469,831) (3,395,287) (3,059,155) (1,414,742) (855,967)Decrease (increase) in refundable deposits 34,056 10,570 (1,434,895) (1,224,443) 771Net cash paid for acquisition of subsidiaries - - (404,445) - -Decrease (increase) in other assets 1,176 (8,163) (228,747) (52,086) 741Net Cash Used in Investing Activities (96,468,483) (8,041,884) (70,688,787) (119,723,352) (77,652,217)(Continued)30