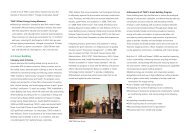
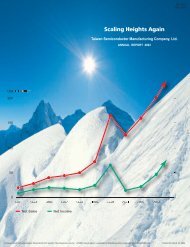
2009 Business Overview - TSMC
2009 Business Overview - TSMC
2009 Business Overview - TSMC

Create successful ePaper yourself
Turn your PDF publications into a flip-book with our unique Google optimized e-Paper software.
<strong>2009</strong> 2008 2007 2006 2005 (1)LIABILITIES AND SHAREHOLDERS' EQUITYCURRENT LIABILITIESShort-term bank loans $ - $ - $ - $ - $ 328,500Financial liabilities at fair value through profit or loss 25 85,187 249,313 10,864 234,279Notes and accounts payable 10,905,884 5,553,151 11,574,882 7,934,388 9,421,452Payable to related parties 783,007 489,857 1,503,376 1,867,728 1,743,069Income tax payable 8,800,249 9,331,825 11,126,128 7,946,473 4,015,451Salary and bonus payable 9,317,035 2,215,780 2,233,450 2,117,045 2,116,380Accrued profit sharing to employees and bonus todirectors and supervisors 6,818,343 15,369,730 - - -Payable to contractors and equipment suppliers 28,924,265 7,998,773 6,256,732 10,768,591 9,066,036Accrued expenses and other current liabilities 12,635,182 7,540,055 15,481,313 9,211,305 8,191,571Current portion of bonds payable and long-term liabilities 949,298 8,222,398 280,813 7,004,137 5,489Total current liabilities 79,133,288 56,806,756 48,706,007 46,860,531 35,122,227LONG-TERM LIABILITIESBonds payables 4,500,000 4,500,000 12,500,000 12,500,000 19,500,000Long-term bank loans 578,560 1,420,476 1,722,196 653,959 663,140Other long-term payables 5,602,420 9,548,226 9,409,978 8,703,267 8,548,887Other payables to related parties - - - 403,375 1,100,475Obligations under capital leases 707,499 722,339 652,296 612,941 597,669Total long-term liabilities 11,388,479 16,191,041 24,284,470 22,873,542 30,410,171OTHER LIABILITIESAccrued pension cost 3,797,032 3,701,584 3,665,522 3,540,060 3,474,384Guarantee deposits 1,006,023 1,484,495 2,243,009 3,817,132 2,896,430Deferred credits 185,689 316,537 1,236,873 1,177,138 1,343,959Others 137,161 43,709 43,774 78,640 23,710Total other liabilities 5,125,905 5,546,325 7,189,178 8,612,970 7,738,483Total Liabilities 95,647,672 78,544,122 80,179,655 78,347,043 73,270,881EQUITY ATTRIBUTABLE TO SHAREHOLDERS OF PARENTCapital stock - $10 par valueCommon stock 259,027,066 256,254,373 264,271,037 258,296,879 247,300,246Capital surplus 55,486,010 49,875,255 53,732,682 54,107,498 57,117,886Retained earningsAppropriated as legal capital reserve 77,317,710 67,324,393 56,406,684 43,705,711 34,348,208Appropriated as special capital reserve - 391,857 629,550 640,742 2,226,427Unappropriated earnings 104,564,972 102,337,417 161,828,337 152,778,079 106,196,399181,882,682 170,053,667 218,864,571 197,124,532 142,771,034OthersCumulative translation adjustments (1,766,667) 481,158 (1,072,853) (1,191,165) (640,742)Unrealized gain/loss on financial instruments 453,621 (287,342) 680,997 561,615 -Treasury stock - - (49,385,032) (918,075) (918,075)(1,313,046) 193,816 (49,776,888) (1,547,625) (1,558,817)Equity attributable to shareholders of the parent 495,082,712 476,377,111 487,091,402 507,981,284 445,630,349MINORITY INTERESTS 3,965,836 3,995,356 3,594,169 1,156,832 608,359Total shareholders’ equity 499,048,548 480,372,467 490,685,571 509,138,116 446,238,708TOTAL $ 594,696,220 $ 558,916,589 $ 570,865,226 $ 587,485,159 $ 519,509,589Note 1: Balances for 2005 have been reclassified to conform to 2006 presentation.(Concluded)27