Fujairah Cement Industries Company (FCI.ADSM)
Fujairah Cement Industries Company (FCI.ADSM)
Fujairah Cement Industries Company (FCI.ADSM)

You also want an ePaper? Increase the reach of your titles
YUMPU automatically turns print PDFs into web optimized ePapers that Google loves.
Rising costs plague theindustry.Simultaneously, the rising cost of sales has also been pressurizing the industry’s bottom-line growth.The combined cost of sales of the peer group soared a steep 43.1% year-over-year to AED 2.19billion, and increased the peer group’s average cost of sales ratio to 69.6% from 61.1%. This loweredthe average peer group gross profit margin to 30.4% from 38.9%, and operating profit margin to 26.8%from 35.2% in 9M 2006. Costs escalated primarily due to increasing energy prices, which constitute amajor portion of the manufacturing costs. Insufficient access to natural gas has forced manufacturersto resort to expensive options, such as diesel and imported coal. Meanwhile, transportation and labourcosts continue to escalate, swelling the cost of sales. Currently, high cement prices offset these directcosts. However, in a stabilized market, where new capacity additions restrict price leaps, these costswill put pressure on profit margins.Asset StructureTotal assets surged 28.9%in 9M 2007.During the full year 2006, <strong>FCI</strong>’s total assets surged 16.9% year-on-year to AED 848.36 million, on aCAGR of 8.09% in the last three years. As may be expected from a manufacturing company, asubstantial portion of <strong>FCI</strong>’s assets are employed in property, plant & equipment, and trade accounts &other receivables, with non-current assets dominating the assets structure. Further, the company’sassets structure is also changing, in tandem with its expanding business. As on September 30, 2007,total assets reached AED 996.72 million, surging a healthy 28.9% year-over-year from AED 773.50million in the year ago comparable period, on the back of vigorous growth in property, plant &equipment, trade accounts & other receivables, and cash & cash equivalents. While total currentassets accounted for 47.5% of total assets, improving from 45.0% in 9M 2006, the share of total noncurrentassets slipped to 52.5% from 55.0%.Within current assets, trade accounts & other receivables increased 35.5% year-over-year to AED216.03 million, constituting over one-fifth (21.7%) of the assets base. However, the declining averagereceivables collection period to 148.72 days from 184.77 days in the last comparable period, indicatesbetter receivables management, quality receivables, and credit efficiency. Similarly, cash & cashequivalents nearly doubled (grew 80.9%) to AED 168.54 million and accounted for 16.9% of totalassets, on the back of a more than two-fold increase in short-term fixed deposits in banks. Meanwhile,inventories dropped 6.8% year-over-year to AED 89.16 million, and its share in total assets shrank to8.9% from 12.4% in 9M 2006. Consequently, average inventory conversion period fell to 115.30 daysfrom 180.47 days, highlighting an efficient inventory management system that speedily convertsinventory into sales.Extraction and concessionrights increased by 76.3%.Within non-current assets, <strong>FCI</strong>’s net property, plant & equipment grew 19.6% to AED 477.92 million(constituting 47.9% of total assets). Meanwhile, the recognition of concession rights amounting to AED22 million during 4Q 2006, increased extraction and concession rights for 9M 2007 by 76.3% to AED45.07 million. The concession rights represent the value of the consideration given against the newlimestone quarry site assigned to the company by the Government of <strong>Fujairah</strong>. As per the EGMapproval on November 20, 2006, the company issued 5.5 million new shares to compensate thelandlords affected by the assignment. The value of the concession rights was measured on the basisof the fair value of the issued shares on that date.Assets Structure (as on September 30, 2007)4.5%16.9%47.9%21.7%8.9%Cash & cash equivalentsInventoriesExtraction and concession rightsTrade Accounts & other receivablesNet property, plant & equipments
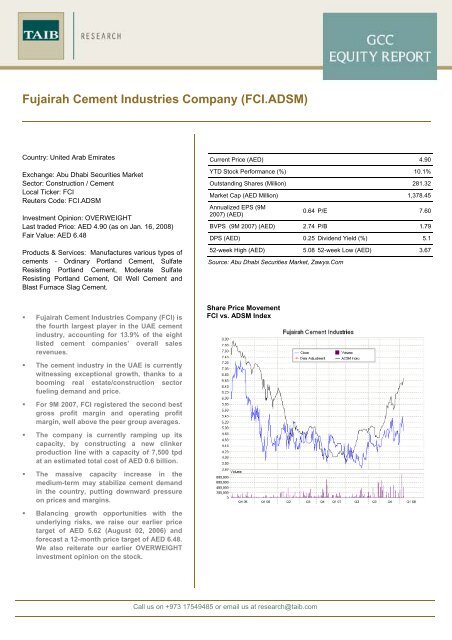
Capital StructureIssued 5.5 million newshares.An equity based capitalstructure, with very low D/Eratio.As on September 30, 2007, <strong>FCI</strong>’s issued and paid up share capital stood at AED 281.32 million,consisting of 281.32 million shares of AED 1 each, as against AED 275.82 million in the year agocomparable period. According to the sanction by the EGM in November 2006, the company issued 5.5million new shares to the landlords affected by the Government of <strong>Fujairah</strong>’s transfer of a new quarrysite to it. Accordingly, shareholders’ equity advanced 17.3% year-over-year to AED 772.06 million,propelled by 50.9%, 25.2%, and 23.3% increases in legal reserve, voluntary reserve, and retainedearnings, respectively. Consequently, book value per share (BVPS) climbed to AED 2.74 from AED2.39 in the year ago corresponding period.Historically, <strong>FCI</strong> has had an equity based capital structure, with little reliance on borrowed funds.However, slowly the company has opted for bank borrowings to finance its expansion anddevelopment activities. It has taken three overseas bank loans and the annual interest rates on allsuch bank facilities currently ranges from 0.3% to 0.5% above LIBOR. As on September 30, 2007, theoutstanding balance of bank borrowings (including current portion) stood at AED 49.64 million,increasing 4.2% from AED 47.62 million in the year ago comparable period. However, <strong>FCI</strong> enjoys anominal debt burden and has adequate debt servicing capacity, as implied by the current interestcoverage ratio of 71.09 times. In addition, the company’s long-term debt-equity (D/E) ratio declined to4.6% in 9M 2007 from 6.1% in 9M 2006 and 7.0% in FY 2006. Meanwhile, shareholders’ equity to totalassets dropped to 77.5% from 85.1% in 9M 2006, due to a more than three-fold growth in accountspayable & accrued expenses, to AED 161.03 million. The company has adequate reserve borrowingpower, which it can utilize to finance its future expansion and development activities.Capital Structurein AED' 000900,000800,000700,000600,000500,000400,000300,000200,000100,00002005 2006 9M 2006 9M 200790.0%80.0%70.0%60.0%50.0%40.0%30.0%20.0%10.0%0.0%Shareholders' EquityLong-term Debt Equity RatioBank borrowings - long-term portionShareholders' Equity to Total Assets RatioRecent PerformanceDecent bottom-line growthin 9M 2007.Improved revenue marketshare positioned as thefourth largest player.For the nine-month period ended September 30, 2007, <strong>FCI</strong> recorded decent financial performance.The company registered an 11.7% increase in bottom-line to reach AED 135.98 million as comparedto AED 121.71 million in the year ago period. This bottom-line growth was mainly driven by zoominglocal cement demand that lead to a healthy 47.5% year-over-year upsurge in top-line to AED 436.92million, despite a steeper increase in cost of sales. In absolute value terms, 9M 2007 net profit was thefifth highest amongst its peers. Accordingly, annualized EPS surged to AED 0.64 from AED 0.59.However, both annualized ROE and ROA dropped mildly to 23.5% and 18.2% from 24.7% and 21.0%respectively, in 9M 2006, because of lower bottom-line growth in comparison to growth in total assetsand shareholders’ equity. For the period under review, <strong>FCI</strong> registered the second best return oninvestment ratios among the eight listed cement companies in the UAE.While the company’s clinker production increased to 1,095,435 tonnes during 9M 2007, the actualproduction of cement reached 1,675,460 tonnes, operating at a capacity utilization rate of 1.1.5%.Backed by strong demand, sales volume increased to 1,656,214 tonnes (representing 98.9% of theactual cement production), with a current average price realization of AED 263.81 per tonne.Simultaneously, the company’s sturdy 9M 2007 top-line growth increased its market share to 13.9%from 11.8% in the earlier year period and placed it as the fourth largest player in the UAE cementindustry in terms of revenues.
Steep increase in cost ofsales dampened profitmargins.Meanwhile, the significant increase in input material costs on account of rising energy (especiallypetrol) prices and transportation costs, swelled the cost of sales up a steep 68.8% year-over-year toAED 292.89 million. As a result, gross profit rose a mere 17.4% to AED 144.03 million, while grossprofit margin dropped to 33.0% from 41.4% in 9M 2006. In spite of this, the company’s nine-monthgross profit margin was the second best amongst its peers - well above the group average gross profitmargin of 30.4%. Concurrently, the sharp increase in cost of sales also decreased operating profitmargin to 30.3% from 38.3%. However, once again, the company’s current operating profit marginstands as the second best - well ahead the peer group average of 26.8%.Recent Performancein AED' 000500,000400,000300,000200,000100,00002005 2006 9M 2006 9M 200730.0%25.0%20.0%15.0%10.0%5.0%0.0%Sales Net Profit ROE ROA2006 bottom-line grew 9.4%year-on-year.Rising cost of sales shrankprofit margins.For the full year 2006, <strong>FCI</strong>’s bottom-line grew a modest 9.4% year-on-year reaching AED 150.21million, on account of a moderate sales revenue growth on one hand and the rising cost of sales onthe other. In line with the moderate bottom-line growth, EPS advanced slightly to AED 0.53 from AED0.50 in 2005. Correspondingly, both ROE and ROA dropped to 21.2% and 17.7% from 22.7% and18.9%, respectively. However, after the approval of the AGM on March 21, 2007, <strong>FCI</strong> distributed 25%cash dividend (AED 0.25 per share) similar to the previous year.During 2006, the company’s top-line increased 10.4% year-on-year to AED 387.82 million, on the backof a 10.0% growth in domestic sales to AED 379.86 million and a 33.1% increase in export sales toother GCC countries to AED 7.96 million. However, the rising cost of sales shrank gross profit marginto 39.5% from 41.6% in 2005 and operating profit margin to 36.2% from 37.9%. For the year, cost ofsales ratio increased to 60.5% from 58.4% a year ago, on account of 14.4% year-on-year surge in costof sales driven by rising raw material prices. Nevertheless, the company efficiently controlled itsselling, general & administrative expenses based operating expenses, as is evident from aconsistently declining operating expenses ratio to 3.2% from 3.7% in the earlier year.Recent Performance (Ratios)50.0%40.0%30.0%20.0%10.0%0.0%2005 2006 9M 2006 9M 2007Gross Profit Margin Operating Profit margin Net Profit MarginHistorically, interest received and other income based non-operating income has supported <strong>FCI</strong>’sbottom-line growth to some extent. While non-operating income in 2005 constituted 4.2% of thebottom-line, its contribution further improved to 7.4% in 2006, on account of a nearly two-fold growth ininterest received and other income to AED 11.13 million. Considering 9M 2007 results, non-operatingincome contributed 4.2% to bottom-line as against 7.6% in 9M 2006.
Strategy and New ProjectsAcquires a new lime stonequarry.<strong>Fujairah</strong> <strong>Cement</strong> <strong>Industries</strong> has been continuously pursuing the path of excellence by upgrading itstechnology. The company is integrating the latest quality control measures and adopting cost savingstate-of-the-art equipment in cement manufacturing. <strong>FCI</strong>’s clinching of the ISO certification is evidenceof its emphasis on quality standards. As a back up to its existing limestone quarry, the 35-yearextraction rights to which expire within a decade (on December 31, 2016), the company added anotherlimestone quarry last year. The strategic addition of the new quarry provides enormous insulation fromthe rising/fluctuating raw material prices, while the proximity of all the company’s quarries to theproduction facilities ensures minimized transportation costs.Triggered by skyrocketing oil prices, substantial inflow of capital due to the availability of attractivebusiness opportunities, liberal government policies, stable markets, and easy access to financial andother related facilities, a sharp and continued upswing in the regional construction sector is beingwitnessed over the last few years. The construction boom in the Gulf region, estimated to be valued inexcess of USD 2.4 trillion, comprises around 2,837 projects now underway. A majority of thesedevelopments are being carried out in Saudi Arabia and the UAE. Further, the enormous infrastructuregrowth of high profile building projects such as King Abdullah Economic City in Saudi Arabia,Dubailand in the UAE, Silk City Project in Kuwait, the Pearl Qatar project, Lusail Development project,Dubai Waterfront and Palm Deira has added fillip to cement consumption.Increasing capacity tomatch roaring demand.Presently, <strong>FCI</strong> is banking on further capacity expansions to capitalize on the spiraling demand forcement across the region. The company is currently constructing a new clinker production facility witha capacity of 7,500 metric tonnes per day (tpd), at an estimated total cost of AED 0.6 billion. Thecommercial production of this clinker line is expected to begin during the first quarter of 2009. With itscommissioning, the company will add 2.74 mtpa to its existing clinker production capacity. In March2007, <strong>FCI</strong> tied up with the leading global engineering company - Polysius Corporation (of theThyssenKrupp Technologies Group) for equipping its new clinker production line with the most up-todatePolysius equipment, including: a 580 tph QUADROPOL® for grinding raw material, a 6-stageDOPOL® ’90 pre-heater with PREPOL®-AS calciner, a POLRO®-rotary kiln, a POLYTRACK® clinkercooler and a POLCID® NT process control system. In November 2007, AUMUND FördertechnikGmbH delivered several machines for installation in <strong>FCI</strong>’s new clinker production line, throughPolysius. The existing kiln line also uses AUMUND equipment.Positives• The UAE cement industry is witnessing unprecedented boom, thanks to a feverishly growingreal estate/construction sector spurring demand and price realization.• The addition of the new limestone quarry and a new clinker production facility will provide <strong>FCI</strong>with back up for raw materials, cushion it against rising/fluctuating raw material prices, andincrease its production capacity.• Among the listed cement payers in the UAE, the company registered the second best returnon investment ratios in 9M 2007, well above the peer group averages.Negatives• The widening demand-supply gap is inducing new players to take up green-field projects andexisting players to implement capacity expansion, which will enhance competition and putdownward pressure on price and margins.
Valuation: Discounted Cash FlowsWe have used the Discounted Cash Flow (DCF) method to determine our fair value estimate. Asinputs for our valuation, we have used the unlevered industry Beta for emerging markets’ cementcompanies of 1.17. We have derived the equity premium by adding the historical premium of USequities over the risk-free rate and the country premium. We estimate a country premium of 0.90%using Moody’s long-term country rating (Aa3 for UAE) and estimating a default spread for thatrating, based upon the difference in yields for traded country bonds.Cost of Equity: 10.69%WACC: 10.55%As a proxy for the risk-free rate of interest, we have taken the yield on 10-year US treasury notes asthe proxy for the risk-free rate of interest. At the time of this report, the 10-year US Treasury bondhad a yield of 3.722%.Based on the inputs and the Capital Asset Pricing Model, we arrive at a Cost of Equity of 10.69%.Taking into consideration the long-term debt of <strong>Fujairah</strong> <strong>Cement</strong> <strong>Industries</strong>, we arrive at theWeighted Average Cost of Capital (WACC) of 10.55%.Investment OpinionThe UAE cement industry is currently throbbing with vitality, riding on the back of a spiraling realestate/construction sector, which continues to escalate demand and price realization. In particular,accelerating construction activities in Dubai, Abu Dhabi and the other northern emirates has beendriving cement demand, with demand outstripping supply and placing the country amongst thehighest per capita cement consumers. Capitalizing on this buoyancy, <strong>FCI</strong>’s top-line and bottom-linehas advanced at healthy CAGR of 10.6% and 18.8%, respectively, in the last three years. Webelieve that the new clinker production line with a capacity of 7,500 tpd (estimated to add 2.74 mtpato the existing clinker production capacity); will boost the company’s market share and top-linegrowth. We also estimate that its sales revenue and net profit will grow at a CAGR of 10.6% and10.1% respectively, over our projected five-year period of 2007-2011. Further, the addition of thenew limestone quarry provides enormous cushion against the increasing raw material prices, whileminimizing transportation costs.Fair Value: AED 6.48Investment Opinion:OVERWEIGHTA major concern is that the steep increase in cost of sales because of rising raw material prices,especially energy, and transportation costs is pressurizing profit margins. However, it is noteworthythat the entire industry suffers from this adverse situation, as is evident from the soaring peer groupaverage cost of sales ratio to 69.6% in 9M 2007 from 61.1% in the year ago corresponding period.Among the UAE’s eight listed cement companies, <strong>FCI</strong> is placed second in terms of cost efficiency,with cost of sales ratio at 67.0% - well below the peer group average. Our second major concern isthat the massive capacity increases resulting from the prevailing demand-supply gap, may stabilizedemand and put downward pressure on prices and margins in the medium-term. However, since thecompany exports cement to the other GCC countries, we believe that export sales on the back of astrong regional cement demand will lessen the impact to some extent.<strong>FCI</strong>’s stock is currently trading at a PE multiple of 7.60x on its 9M 2007 annualized EPS of AED0.64 and at a PB multiple of 1.79x on its 9M 2007 BVPS of AED 2.74. At the current market price ofAED 4.90 (as on January 16, 2008), the stock is trading at a PE multiple of 7.70x on its 2007Eearnings and 7.15x on its 2008E earnings, which seems an attractive investment opportunity. Whilethe <strong>ADSM</strong> Index has gained 7.2% since the beginning of the year, <strong>FCI</strong>’s stock has outperformed theindex by surging 10.1% YTD. Considering the above factors, we revise our earlier Fair Value pershare for <strong>FCI</strong> upwards by 15.3% to AED 6.48 from AED 5.62 (as on August 02, 2006). The stockexhibits a 32.3% potential upside from its closing price of AED 4.90 (as on January 16, 2008);accordingly, we reiterate our earlier OVERWEIGHT investment opinion on the stock.
FINANCIAL STATEMENTSBALANCE SHEETAs onIn AED’ 000 31 Dec’ 06 31 Dec’ 05 % Chg 30 Sept.’ 07 30 Sept.’ 06 % ChgASSETSCurrent AssetsCash & cash equivalents 107,760 106,816 0.9% 168,537 93,164 80.9%Trade Accounts & other receivables 140,012 140,388 -0.3% 216,031 159,465 35.5%Inventories 95,882 75,855 26.4% 89,164 95,706 -6.8%Total Current Assets 343,654 323,059 6.4% 473,732 348,335 36.0%Non-Current AssetsProperty, plant & equipments 869,820 753,464 15.4% 916,669 803,039 14.1%Less: Accumulated depreciation -412,050 -378,204 8.9% -438,751 -403,434 8.8%Net property, plant & equipments 457,771 375,260 22.0% 477,918 399,605 19.6%Extraction and concession rights 46,938 27,432 71.1% 45,068 25,562 76.3%Total Assets 848,363 725,751 16.9% 996,718 773,502 28.9%LIABILITIES AND SHAREHOLDERS' EQUITYCurrent LiabilitiesBank Borrowings - current portion 10,793 11,184 -3.5% 14,093 7,494 88.1%Accounts payable & accrued expenses 66,027 77,394 -14.7% 161,030 49,754 223.7%Dividends payable 5,726 3,213 78.2% 5,515 11,050 -50.1%Total Current Liabilities 82,546 91,791 -10.1% 180,637 68,298 164.5%Non-Current LiabilitiesProvision for employees' end of service benefits 7,415 5,973 24.1% 8,473 6,819 24.3%Bank borrowings - long-term portion 49,637 22,481 120.8% 35,544 40,125 -11.4%Total Non-Current Liabilities 57,051 28,453 100.5% 44,017 46,944 -6.2%Shareholders' EquityShare capital 281,316 275,816 2.0% 281,316 275,816 2.0%Legal reserve 93,486 61,965 50.9% 93,486 61,965 50.9%Voluntary reserve 134,314 107,275 25.2% 134,314 107,275 25.2%Retained earnings 199,650 160,450 24.4% 262,947 213,204 23.3%Total Shareholders' Equity 708,766 605,506 17.1% 772,063 658,260 17.3%Total Liabilities & Shareholders' Equity 848,363 725,751 16.9% 996,718 773,502 28.9%Condensed Projections(In AED’ Millions) 2007E 2008E 2009ESales 582.62 626.20 817.44Operating Profit 172.87 185.21 238.37Net Profit 179.04 192.83 247.52Total assets 1,047.73 1,252.04 1,433.58EPS (AED) 0.64 0.69 0.88