GCC Fixed Income Weekly - Gulf Investment Corporation
GCC Fixed Income Weekly - Gulf Investment Corporation
GCC Fixed Income Weekly - Gulf Investment Corporation

You also want an ePaper? Increase the reach of your titles
YUMPU automatically turns print PDFs into web optimized ePapers that Google loves.
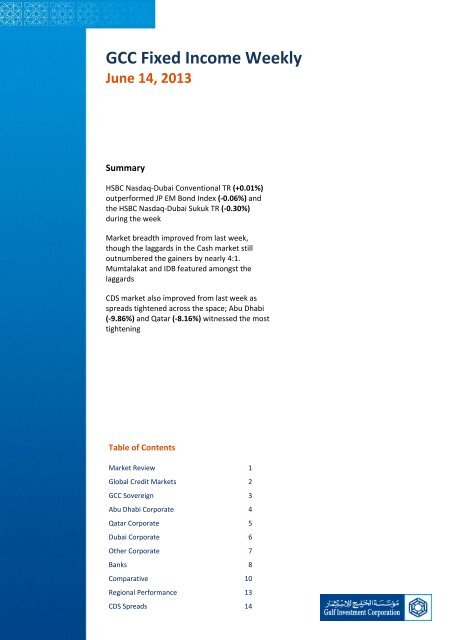
Sanjeev75<strong>GCC</strong> <strong>Fixed</strong> <strong>Income</strong> <strong>Weekly</strong>June 14, 2013SummaryHSBC Nasdaq‐Dubai Conventional TR (+0.01%)outperformed JP EM Bond Index (‐0.06%) andthe HSBC Nasdaq‐Dubai Sukuk TR (‐0.30%)during the weekMarket breadth improved from last week,though the laggards in the Cash market stilloutnumbered the gainers by nearly 4:1.Mumtalakat and IDB featured amongst thelaggardsCDS market also improved from last week asspreads tightened across the space; Abu Dhabi(‐9.86%) and Qatar (‐8.16%) witnessed the mosttighteningTable of ContentsMarket Review 1Global Credit Markets 2<strong>GCC</strong> Sovereign 3Abu Dhabi Corporate 4Qatar Corporate 5Dubai Corporate 6Other Corporate 7Banks 8Comparative 10Regional Performance 13CDS Spreads 14
<strong>GCC</strong> <strong>Fixed</strong> <strong>Income</strong> <strong>Weekly</strong>June 14, 2013Global Credit Markets1M Returns across Asset ClassesTR Swap Spreads6%4%2%0%‐2%‐4%‐6%‐8%‐10%‐12%REITEM EquitiesAsia EquitiesEurope EquitiesEM BondsTIPSUS DollarAsia Bonds<strong>GCC</strong> BondsUS EquitiesUS BondsGoldCommoditiesGlobal BondsOil<strong>GCC</strong> Equities125120CS EM EMEA CS EM Asia CS EM LatamCS EuropeCS US115110105100959015May13 22May13 29May13 5Jun13 12Jun13<strong>GCC</strong> Spreads<strong>GCC</strong> vs. EM Bond Returns210102101JPM EM Bond IndexHSBC Nasdaq‐Dubai Conventional TR2001001909998180971709695160HSBC Nasdaq‐Dubai Basis Spreads15021May13 28May13 4Jun13 11Jun1394939215May13 22May13 29May13 5Jun13 12Jun13<strong>GCC</strong> Bond vs. Sukuk Returns<strong>GCC</strong> Bond/Sukuk Issuances (USD bn)101701006050SukukBonds9940309820HSBC Nasdaq‐Dubai Sukuk TRHSBC Nasdaq‐Dubai Conventional TR9715May13 22May13 29May13 5Jun13 12Jun13Source: Bloomberg1002006 2007 2008 2009 2010 2011 2012 2013YTD2
<strong>GCC</strong> <strong>Fixed</strong> <strong>Income</strong> <strong>Weekly</strong>June 14, 2013<strong>GCC</strong> SovereignQatar Sovereign MS Spread Curve275225Qatar 14 Qatar 15 Qatar 17 Qatar 19Qatar 20 Qatar 22 Qatar 30 Qatar 40Qatar 42 Qatar 18 Qatar 231751257525‐2515May13 22May13 29May13 5Jun13 12Jun13Spread Chg‐1W Chg‐1M 52W Hi 52W LoQatar 14 23.8 ‐9.23 ‐11.20 109.52 16.63Qatar 15 73.8 ‐3.89 0.47 131.78 43.57Qatar 17 93.2 7.47 10.26 141.28 74.19Qatar 18 65.2 0.65 ‐9.43 118.75 58.89Qatar 19 119.6 12.19 17.94 201.08 86.52Qatar 20 121.9 4.77 12.01 196.39 80.46Qatar 22 119.0 7.02 13.66 184.80 82.56Qatar 23 104.0 4.51 6.47 144.60 76.09Qatar 30 250.0 26.92 70.96 328.53 155.09Qatar 40 192.8 16.11 38.02 280.76 141.59Qatar 42 178.9 4.28 36.15 265.06 131.04Abu Dhabi Sovereign MS Spread Curve908070605040302010AD 14 AD 19015May13 22May13 29May13 5Jun13 12Jun13Spread Chg‐1W Chg‐1M 52W Hi 52W LoAD 14 16.2 ‐11.94 0.11 53.41 ‐8.26AD 19 81.7 6.18 9.06 162.79 54.38Dubai Sovereign MS Spread Curve32527522517512575Dubai 14 Dubai 15 Dubai 20Dubai 21 Dubai 17 Dubai 22Spread Chg‐1W Chg‐1M 52W Hi 52W LoDubai 14 183.2 ‐1.52 11.86 318.76 146.64Dubai 15 224.2 5.14 36.16 370.37 186.07Dubai 17 243.7 ‐7.90 21.49 320.41 200.36Dubai 20 291.0 ‐3.47 39.12 482.09 233.27Dubai 21 256.3 2.14 25.13 351.72 217.23Dubai 22 285.0 10.42 54.73 424.23 229.382515May13 22May13 29May13 5Jun13 12Jun13Bahrain Sovereign MS Spread Curve400350300250200150Bahrain 14 Bahrain 18 Bahrain 20 Bahrain 2210050015May13 22May13 29May13 5Jun13 12Jun13Spread Chg‐1W Chg‐1M 52W Hi 52W LoBahrain 14 135.1 5.41 69.95 227.36 59.18Bahrain 18 220.6 19.09 18.54 387.65 190.72Bahrain 20 314.8 45.20 76.76 418.14 225.30Bahrain 22 343.0 55.32 101.78 450.36 237.31Source: Bloomberg3
<strong>GCC</strong> <strong>Fixed</strong> <strong>Income</strong> <strong>Weekly</strong>June 14, 2013Abu Dhabi CorporateTaqa MS Spread Curve350300250Taqa O13 Taqa A13 Taqa 14 Taqa 16Taqa M17 Taqa O17 Taqa 18 Taqa 19Taqa 21 Taqa 3620015010050015May13 22May13 29May13 5Jun13 12Jun13Mubadala MS Spread Curve20018016014012010080604020Mub 14 Mub 16 Mub 19 Mub 21015May13 22May13 29May13 5Jun13 12Jun13Spread Chg‐1W Chg‐1M 52W Hi 52W LoTaqa O13 66.8 ‐6.04 ‐8.23 95.44 27.03Taqa A13 16.2 ‐73.03 ‐37.07 127.92 ‐24.16Taqa 14 123.4 ‐8.41 43.95 179.77 72.13Taqa 16 152.1 9.47 26.77 234.56 123.13Taqa M17 158.5 4.97 29.45 221.57 126.68Taqa O17 153.0 1.07 33.36 251.20 118.15Taqa 18 176.0 1.26 40.27 300.23 135.75Taqa 19 199.2 7.03 41.12 292.53 152.31Taqa 21 203.3 3.51 31.67 304.76 166.66Taqa 36 209.4 3.56 18.86 350.78 179.10Note: Taqa O13 is denominated in EURSpread Chg‐1W Chg‐1M 52W Hi 52W LoMub 14 79.0 ‐2.16 33.86 117.67 26.18Mub 16 90.4 1.10 ‐7.34 179.60 84.84Mub 19 164.2 6.25 21.98 237.27 130.91Mub 21 185.9 0.04 42.66 250.41 134.11IPIC MS Spread Curve25020015010050IPIC 15 IPIC 16 IPIC 17 IPIC 20IPIC 21 IPIC 22 IPIC 26 IPIC 41015May13 22May13 29May13 5Jun13 12Jun13Spread Chg‐1W Chg‐1M 52W Hi 52W LoIPIC 15 109.5 1.54 24.36 160.61 82.90IPIC 16 86.6 ‐4.82 8.54 145.17 66.77IPIC 17 110.9 4.60 0.19 207.48 102.97IPIC 20 162.9 ‐25.10 19.78 261.75 141.82IPIC 21 162.6 ‐0.70 25.35 292.18 130.93IPIC 22 181.3 ‐15.19 34.09 302.81 146.50IPIC 26 206.2 0.73 5.49 360.01 181.03IPIC 41 219.5 11.54 23.20 379.24 181.65Note: IPIC 16 and IPIC 21 are denominated in EUR; IPIC 26 in GBPOther Corporate MS Spread Curve350300250200150100TDIC J14 TDIC O14 Waha 20Dolphin 19 Dolphin 21Spread Chg‐1W Chg‐1M 52W Hi 52W LoTDIC J14 122.3 14.29 59.11 198.15 51.27TDIC O14 98.2 3.29 27.22 166.13 67.42Waha 20 137.4 1.11 13.63 190.31 111.59Dolphin 19 274.4 3.05 23.47 323.58 225.18Dolphin 21 198.5 2.75 55.78 273.62 137.785015May13 22May13 29May13 5Jun13 12Jun13Source: Bloomberg4
<strong>GCC</strong> <strong>Fixed</strong> <strong>Income</strong> <strong>Weekly</strong>June 14, 2013Abu Dhabi Qatar CorporateRas Gas MS Spread Curve400300200100RasGas 14 RasGas 16 RasGas 19RasGas 20 RasGas 5.8 27 RasGas 6.3 27Spread Chg‐1W Chg‐1M 52W Hi 52W LoRasGas 14 85.7 3.16 18.66 144.77 50.57RasGas 16 297.8 15.06 25.06 329.90 242.96RasGas 19 165.6 23.27 30.76 262.66 118.42RasGas 20 212.9 10.88 3.04 270.86 188.99RasGas 5.8 27 189.1 7.74 20.60 294.84 148.95RasGas 6.3 27 202.8 13.24 18.48 323.84 148.47015May13 22May13 29May13 5Jun13 12Jun13Qatari Diar MS Spread Curve160150140130120110100908070QDiar 15 QDiar 206015May13 22May13 29May13 5Jun13 12Jun13Spread Chg‐1W Chg‐1M 52W Hi 52W LoQDiar 15 97.6 4.51 23.33 131.92 63.99QDiar 20 142.5 ‐9.25 10.53 208.20 105.56QTel MS Spread Curve20018016014012010080604020QTel 14 QTel 16 QTel 19QTel 21 QTel 25 Qtel 23015May13 22May13 29May13 5Jun13 12Jun13Spread Chg‐1W Chg‐1M 52W Hi 52W LoQTel 14 102.1 ‐8.99 45.64 115.81 45.20QTel 16 116.9 8.63 27.75 184.07 87.96QTel 19 184.5 12.62 44.25 312.26 139.67QTel 21 185.5 3.77 40.34 254.56 140.44Qtel 23 170.1 3.51 32.70 171.18 119.82QTel 25 187.6 10.96 22.31 260.91 151.73Source: Bloomberg5
<strong>GCC</strong> <strong>Fixed</strong> <strong>Income</strong> <strong>Weekly</strong>June 14, 2013Dubai CorporateDEWA MS Spread Curve300275250225200DEWA 15 DEWA 16DEWA 20 DEWA 18Spread Chg‐1W Chg‐1M 52W Hi 52W LoDEWA 15 206.1 ‐11.12 34.36 417.06 165.10DEWA 16 212.1 ‐15.42 4.86 371.57 189.00DEWA 20 301.5 2.95 54.44 494.09 236.12DEWA 18 210.9 ‐19.69 37.37 230.58 160.1117515015May13 22May13 29May13 5Jun13 12Jun13DP World MS Spread Curve350325300275250Spread Chg‐1W Chg‐1M 52W Hi 52W LoDPWorld 17 280.7 ‐5.09 38.71 391.14 211.69DPWorld 37 314.2 4.53 36.16 460.47 275.16225DPWorld 17 DPWorld 3720015May13 22May13 29May13 5Jun13 12Jun13Real Estate MS Spread Curve750700650600550500450Emaar 16 Nakheel 16 Emaar 1940035030015May13 22May13 29May13 5Jun13 12Jun13Spread Chg‐1W Chg‐1M 52W Hi 52W LoEmaar 16 359.3 16.26 46.27 543.57 300.99Nakheel 16 696.3 33.96 70.11 922.17 599.37Emaar 19 370.2 19.08 71.37 481.89 292.43Note: Nakheel 16 is denominated in AEDOther MS Spread Curve600500400300200Spread Chg‐1W Chg‐1M 52W Hi 52W LoEMIRAT 16 289.4 19.17 40.16 358.18 233.12DubHold 14 361.9 0.88 81.53 830.42 274.70DubHold 17 510.7 28.28 97.06 873.89 389.34JAFZA 19 359.1 48.01 48.00 535.53 295.84EMIRAT 25 250.2 16.54 29.24 250.38 200.96EMIRAT 23 218.0 21.61 30.46 218.04 169.19100EMIRAT 16 DubHold 14 DubHold 17JAFZA 19 EMIRAT 25 EMIRAT 23015May13 22May13 29May13 5Jun13 12Jun13Source: BloombergNote: DubHold 14 is demoninated in EUR; DubHold 17 in GBP6
<strong>GCC</strong> <strong>Fixed</strong> <strong>Income</strong> <strong>Weekly</strong>June 14, 2013Other CorporateIDB MS Spread Curve555045403530Spread Chg‐1W Chg‐1M 52W Hi 52W LoIDB 14 39.8 0.00 ‐0.62 78.43 24.04IDB 15 44.7 7.82 7.74 86.78 26.98IDB 16 45.4 6.31 11.41 93.98 29.35IDB 17 44.2 3.48 ‐5.90 73.45 31.0825IDB 14 IDB 15 IDB 16 IDB 172015May13 22May13 29May13 5Jun13 12Jun13Saudi Industrials MS Spread Curve250200150100500Sabic 13 Sabic 15 SEC 17SEC 22 SEC 23 SEC 43Spread Chg‐1W Chg‐1M 52W Hi 52W LoSabic 13 22.7 1.02 ‐13.09 66.00 ‐27.07Sabic 15 86.2 1.70 ‐2.88 156.81 81.83SEC 17 100.5 5.33 ‐3.87 153.47 89.71SEC 22 147.6 1.59 12.05 211.86 121.66SEC 23 132.5 2.97 11.04 144.65 111.66SEC 43 205.1 9.74 30.09 205.08 172.20‐5015May13 22May13 29May13 5Jun13 12Jun13Note: Sabic 13 is denominated in EUROther Sovereign & Quasi‐Sovereign MS Spread Curve350300Mumtalakat 15 RAK Cap 14 RAK Cap 16250200150100Spread Chg‐1W Chg‐1M 52W Hi 52W LoMumtalakat 325.4 58.04 85.74 418.97 225.23RAK Cap 14 82.4 ‐21.05 15.96 216.91 46.50RAK Cap 16 168.7 10.14 16.59 231.32 129.3750015May13 22May13 29May13 5Jun13 12Jun13Other Corporate MS Spread Curve1,5751,3751,175975775575375Dar Arkan 15 MBPS 15 MAF 17 MAF 19Spread Chg‐1W Chg‐1M 52W Hi 52W LoDar Arkan 15 495.9 17.31 70.74 850.41 409.00MBPS 15 1,368.2 20.94 234.36 1635.33 880.51MAF 17 259.0 17.08 60.86 366.32 194.48MAF 19 257.3 23.12 58.50 399.87 198.5617515May13 22May13 29May13 5Jun13 12Jun13Source: Bloomberg7
<strong>GCC</strong> <strong>Fixed</strong> <strong>Income</strong> <strong>Weekly</strong>June 14, 2013Banks ‐ Abu DhabiNBAD MS Spread Curve18016014012010080604020NBAD 14 NBAD 15 NBAD 17 NBAD 19015May13 22May13 29May13 5Jun13 12Jun13Spread Chg‐1W Chg‐1M 52W Hi 52W LoNBAD 14 104.6 10.14 38.07 149.99 59.20NBAD 15 101.9 5.94 23.14 169.88 72.83NBAD 17 124.3 1.33 6.24 194.14 115.88NBAD 19 151.0 ‐15.48 22.95 181.85 125.32ADIB MS Spread Curve500450400350300250200150ADIB 15 ADIB 16 ADIB 4910015May13 22May13 29May13 5Jun13 12Jun13Spread Chg‐1W Chg‐1M 52W Hi 52W LoADIB 15 126.0 1.41 ‐1.13 232.25 119.15ADIB 16 142.2 10.71 1.20 239.74 119.15ADIB 49 454.5 ‐14.22 50.67 487.29 381.59FGB MS Spread Curve180170FGB 16 FGB 17J FGB 17O160150140Spread Chg‐1W Chg‐1M 52W Hi 52W LoFGB 16 157.4 12.85 16.89 245.05 133.14FGB 17J 169.0 13.63 12.60 254.67 144.83FGB 17O 165.4 10.85 19.22 202.22 136.6313012015May13 22May13 29May13 5Jun13 12Jun13ADCB MS Spread Curve270250230210190170ADCB 14 ADCB N16 ADCB 18 ADCB 231501301109015May13 22May13 29May13 5Jun13 12Jun13Spread Chg‐1W Chg‐1M 52W Hi 52W LoADCB 14 117.4 0.00 11.40 177.63 96.62ADCB N16 142.4 10.47 5.08 235.09 123.41ADCB 18 151.1 7.35 27.04 165.35 119.07ADCB 23 236.7 ‐14.24 44.35 253.64 192.34Source: Bloomberg8
<strong>GCC</strong> <strong>Fixed</strong> <strong>Income</strong> <strong>Weekly</strong>June 14, 2013Banks ‐ OtherQatar MS Spread Curve450400350QIBC 15 QNB 15 CBQ 14CBQ 19 QNB 17 Doha 17CBQ 17 QIB 17 QIIB 173002502001501005015May13 22May13 29May13 5Jun13 12Jun13Spread Chg‐1W Chg‐1M 52W Hi 52W LoQIBC 15 136.2 ‐0.46 ‐7.03 212.64 131.87QNB 15 117.3 6.97 13.88 175.31 101.31QNB 17 144.4 14.45 10.87 190.49 124.46CBQ 14 105.0 ‐0.30 11.55 191.63 93.45CBQ 19 257.1 2.13 19.77 336.67 226.44Doha 17 164.2 4.00 12.26 240.58 145.46CBQ 17 162.3 8.22 10.87 224.90 139.99QIB 17 146.6 1.54 ‐7.37 175.19 136.13QIIB 17 165.6 1.42 ‐6.11 191.46 155.06Saudi MS Spread Curve175150125100SABB 15 BSF 15 BSF 17Spread Chg‐1W Chg‐1M 52W Hi 52W LoSABB 15 101.8 4.00 1.82 188.33 92.60BSF 15 99.1 10.32 5.88 181.30 86.81BSF 17 141.2 3.81 ‐6.13 182.67 130.097515May13 22May13 29May13 5Jun13 12Jun13UAE (Except Abu Dhabi) MS Spread Curve325275225175125SIB 16 UNB 16 HSBC 16EIB 17 Tamweel 17 ENBD 17DIB 17 EIB 187515May13 22May13 29May13 5Jun13 12Jun13Spread Chg‐1W Chg‐1M 52W Hi 52W LoSIB 16 198.3 14.49 3.84 273.47 178.21UNB 16 156.4 9.45 5.45 261.72 138.99HSBC 16 141.5 9.59 18.72 204.05 117.32EIB 17 260.8 17.23 23.60 321.41 221.67Tamweel 17 295.5 27.00 32.38 361.86 240.23ENBD 17 269.3 9.62 34.36 347.08 234.90DIB 17 266.9 21.62 15.02 329.89 234.78EIB 18 251.1 12.76 37.90 314.28 206.84Other MS Spread Curve700600500Investcorp 17 KIPCO 20 BBK 15 Burgan 20GIC 17 GIB 17 KIPCO 16400300200100015May13 22May13 29May13 5Jun13 12Jun13Spread Chg‐1W Chg‐1M 52W Hi 52W LoKIPCO 16 306.5 12.80 24.41 528.47 266.12KIPCO 20 417.0 34.30 62.82 642.23 338.01Burgan 20 408.6 24.94 26.86 536.96 357.05BBK 15 315.2 40.42 51.08 402.65 245.99Investcorp 17 639.2 23.56 60.91 775.74 574.97GIC 17 225.8 5.26 22.05 244.71 176.38GIB 17 146.1 8.08 2.24 159.05 129.43Source: Bloomberg9
<strong>GCC</strong> <strong>Fixed</strong> <strong>Income</strong> <strong>Weekly</strong>June 14, 2013Comparatives10Y Sovereign (Rebased MS Spread)5Y Sovereign (Rebased MS Spread)12512011511010510095Qatar 23 AD 19 Dubai 23 Bahrain 229010Jun13 11Jun13 12Jun13 13Jun13 14Jun1312512011511010510095Qatar 18 AD 19 Dubai 17 Bahrain 189010Jun13 11Jun13 12Jun13 13Jun13 14Jun1310Y AD Corp (Rebased MS Spread)5Y AD Corp (Rebased MS Spread)10710510310199Mub 21 Waha 20 IPIC 21 Taqa 21109107105103101999797Mub 16 IPIC 15 IPIC 16 Taqa 169510Jun13 11Jun13 12Jun13 13Jun13 14Jun139510Jun13 11Jun13 12Jun13 13Jun13 14Jun1310Y Qatar Corp (Rebased MS Spread)5Y Qatar Corp (Rebased MS Spread)115QDiar 20 RasGas 20 QTel 19 QTel 211151101101051051001009595QDiar 15 RasGas 14 RasGas 16QTel 14 QTel 16 Aldar 149010Jun13 11Jun13 12Jun13 13Jun13 14Jun139010Jun13 11Jun13 12Jun13 13Jun13 14Jun13Source: Bloomberg10
<strong>GCC</strong> <strong>Fixed</strong> <strong>Income</strong> <strong>Weekly</strong>June 14, 2013Comparatives10Y Dubai Corp (Rebased MS Spread)5Y Dubai Corp (Rebased MS Spread)107105103101DEWA 20 DPWorld 17 DubHold 17106104102100989997969492DEWA 15 DEWA 16 Nakheel 16 Emaar 169510Jun13 11Jun13 12Jun13 13Jun13 14Jun139010Jun13 11Jun13 12Jun13 13Jun13 14Jun1310Y Other Corp (Rebased MS Spread)1405Y AD Banks (Rebased MS Spread)1151301101201051101001009590IDB 15 IDB 16 Mumtalakat 15RAK Cap 16 Sabic 158010Jun13 11Jun13 12Jun13 13Jun13 14Jun1390NBAD 15 ADIB 16 ADIB 15FGB 16 ADCB N16 UNB 168510Jun13 11Jun13 12Jun13 13Jun13 14Jun135Y Banks Others (Rebased MS Spread)11511010510095QIBC 15 QNB 15 SABB 15 BSF 15BBK 15 SIB 16 HSBC 16 KIPCO 169010Jun13 11Jun13 12Jun13 13Jun13 14Jun13Source: Bloomberg11
<strong>GCC</strong> <strong>Fixed</strong> <strong>Income</strong> <strong>Weekly</strong>June 14, 2013ComparativesQatar 5Y Sov vs. Quasi Sov (Rebased MS Spread)Qatar 10Y Sov vs. Quasi Sov (Rebased MS Spread)1181201131151081101031059810093Qatar 15 Qatar 17 QDiar 15RasGas 16 QTel 168810Jun13 11Jun13 12Jun13 13Jun13 14Jun1395Qatar 19 Qatar 20 QDiar 20QTel 21 RasGas 20 RasGas 199010Jun13 11Jun13 12Jun13 13Jun13 14Jun13Abu Dhabi 5Y Sov vs. Quasi Sov (Rebased MS Spread)1091071051031019997Taqa 16 Mub 16 IPIC 16 TDIC O149510Jun13 11Jun13 12Jun13 13Jun13 14Jun13Abu Dhabi 10Y Sov vs. Quasi Sov (Rebased MS Spread)1251201151101051009590AD 19 Taqa 19 Mub 19IPIC 20 Waha 20 UNB 168510Jun13 11Jun13 12Jun13 13Jun13 14Jun13Dubai 5Y Sov vs. Quasi Sov (Rebased MS Spread)1081061041021009896949290Dubai 15 DEWA 15 EMIRAT 168810Jun13 11Jun13 12Jun13 13Jun13 14Jun13Dubai 10Y Sov vs. Quasi Sov (Rebased MS Spread)10410310210110099Dubai 20 Dubai 21 DEWA 209810Jun13 11Jun13 12Jun13 13Jun13 14Jun13Source: Bloomberg12
<strong>GCC</strong> <strong>Fixed</strong> <strong>Income</strong> <strong>Weekly</strong>June 14, 2013Regional PerformanceTop 15 Performers (based on MS Spreads)Spread Chg‐1W (%) Chg‐1W (bps) Chg‐1M (%) Chg‐1M (bps) 52W Hi 52W LoTaqa A13 16.2 ‐81.80% ‐73.03 ‐69.53% ‐37.07 127.92 ‐24.16AD 14 16.2 ‐42.46% ‐11.94 0.67% 0.11 53.41 ‐8.26Qatar 14 23.8 ‐27.95% ‐9.23 ‐32.00% ‐11.20 109.52 16.63RAK Cap 14 82.4 ‐20.34% ‐21.05 24.03% 15.96 216.91 46.50NBAD 18 ‐54.3 ‐15.03% 9.61 NA NA ‐54.34 ‐72.25IPIC 20 162.9 ‐13.35% ‐25.10 13.82% 19.78 261.75 141.82NBAD 19 151.0 ‐9.29% ‐15.48 17.92% 22.95 181.85 125.32DEWA 18 210.9 ‐8.54% ‐19.69 21.54% 37.37 230.58 160.11Taqa O13 66.8 ‐8.29% ‐6.04 ‐10.97% ‐8.23 95.44 27.03QTel 14 102.1 ‐8.09% ‐8.99 80.81% 45.64 115.81 45.20IPIC 22 181.3 ‐7.73% ‐15.19 23.16% 34.09 302.81 146.50DEWA 16 212.1 ‐6.78% ‐15.42 2.35% 4.86 371.57 189.00Taqa 14 123.4 ‐6.38% ‐8.41 55.35% 43.95 179.77 72.13QDiar 20 142.5 ‐6.10% ‐9.25 7.98% 10.53 208.20 105.56ADCB 23 236.7 ‐5.68% ‐14.24 23.06% 44.35 253.64 192.34Bottom 15 Performers (based on MS Spreads)Spread Chg‐1W (%) Chg‐1W (bps) Chg‐1M (%) Chg‐1M (bps) 52W Hi 52W LoMumtalakat 15 325.4 21.71% 58.04 35.77% 85.74 418.97 225.23IDB 15 44.7 21.23% 7.82 20.96% 7.74 86.78 26.98Bahrain 22 343.0 19.23% 55.32 ‐42.19% 101.78 450.36 237.31Bahrain 20 314.8 16.77% 45.20 32.25% 76.76 418.14 225.30RasGas 19 165.6 16.35% 23.27 22.81% 30.76 262.66 118.42IDB 16 45.4 16.15% 6.31 33.58% 11.41 93.98 29.35JAFZA 19 359.1 15.44% 48.01 15.43% 48.00 535.53 295.84BBK 15 315.2 14.71% 40.42 19.34% 51.08 402.65 245.99Batelco 20 330.0 13.93% 40.35 24.36% 64.65 330.04 261.59TDIC J14 122.3 13.23% 14.29 93.51% 59.11 198.15 51.27Qatar 30 250.0 12.07% 26.92 39.63% 70.96 328.53 155.09BSF 15 99.1 11.62% 10.32 6.31% 5.88 181.30 86.81Qatar 19 119.6 11.36% 12.19 17.66% 17.94 201.08 86.52QNB 17 144.4 11.12% 14.45 8.14% 10.87 190.49 124.46EMIRAT 23 218.0 11.00% 21.61 16.24% 30.46 218.04 169.191311
<strong>GCC</strong> <strong>Fixed</strong> <strong>Income</strong> <strong>Weekly</strong>June 14, 2013CDS Spreads<strong>GCC</strong> CDS SpreadsDubai CDS Spreads25025024020023022015021020010019018050170DU AD QA SA BH015May13 21May13 27May13 2Jun13 8Jun13 14Jun1316015015May13 21May13 27May13 2Jun13 8Jun13 14Jun13Saudi CDS SpreadsAbu Dhabi CDS Spreads696867666564636261605915May13 21May13 27May13 2Jun13 8Jun13 14Jun13767472706866646260585615May13 21May13 27May13 2Jun13 8Jun13 14Jun13Qatar CDS SpreadsBahrain CDS Spreads85807522522021521020570656015May13 21May13 27May13 2Jun13 8Jun13 14Jun1320019519018515May13 21May13 27May13 2Jun13 8Jun13 14Jun13Source: Reuters14
This document is confidential and is being supplied to you solely for your information and may not be reproduced or redistributed, in whole or inpart, directly or indirectly, to any other person.This document does not constitute or form part of an offer to subscribe for or purchase, or an invitation or solicitation of an offer to subscribefor or purchase, any securities, nor shall it, or any part of it, form the basis of, or be relied on in connection with, any contract or commitmentwhatsoever. If any of the companies identified herein should at any time commence an offer of securities, any decision to invest in any suchoffer to subscribe for or acquire any such securities must be based wholly on the information contained in a prospectus and any supplementaryprospectus issued or to be issued in connection with any such offer and not on the contents of this document.This document has been prepared by <strong>Gulf</strong> <strong>Investment</strong> <strong>Corporation</strong> to provide background information about the relevant industry. Any forwardlookingstatements, opinions and expectations contained herein are entirely those of <strong>Gulf</strong> <strong>Investment</strong> <strong>Corporation</strong> as part of its internal researchcoverage and no other person shall be liable for any loss arising from use of this document or otherwise arising in connection therewith.This document does not purport to be a complete description of the matters referred to in the document. The information on which thisdocument is based has been obtained from sources which <strong>Gulf</strong> <strong>Investment</strong> <strong>Corporation</strong> believes to be reliable, but <strong>Gulf</strong> <strong>Investment</strong> <strong>Corporation</strong>has not independently verified such information. Accordingly no representation or warranty, express or implied, is made as to the fairness,accuracy, completeness or correctness of the information and opinions contained in this document and no reliance should be placed on suchinformation or opinions. The information and views given in this document are current as at the date of this document, and are subject tochange without notice.There can be no assurance that actual results will not differ materially from those set out in any forward‐looking statements contained in thisdocument or that future result or events will be consistent with any opinions, estimates, projections or forecasts contained in this document.The analysis contained in this document is based on numerous assumptions. Different assumptions could result in materially different results.<strong>Investment</strong>s in emerging markets are speculative and considerably more volatile than investments in established markets. Some of the mainrisks are political risks, economic risks, credit risks, and market risks. Opinions expressed in this document may differ from those expressed byother divisions of <strong>Gulf</strong> <strong>Investment</strong> <strong>Corporation</strong> as a result of using different assumptions or criteria. Some investments may not be readilyrealisable if the market in the securities is illiquid and valuing the investment and identifying the risk to which you are exposed may be difficult toquantify. Futures and options trading is considered risky. Past performance of an investment is no guarantee for its future performance. Someinvestments may be subject to sudden and large falls in value and on realisation you may receive back less than you invested or be required topay more. Changes in foreign exchange rates may have an adverse effect on the price, value or income of an investment. Of necessity, thisdocument does not take into account your particular investment objectives, financial situation or needs. If you need advice tailored to yourspecific circumstances, we recommend that you seek separate financial and/or tax advice on the financial, legal, regulatory, credit, tax,accounting and other implications of investing in any securities referred to in this document. Neither <strong>Gulf</strong> <strong>Investment</strong> <strong>Corporation</strong> nor any of itsmembers, directors, officers or employees nor any other person accepts any liability whatsoever for any loss howsoever arising from any use ofthis document or its contents or otherwise arising in connection therewith. <strong>Gulf</strong> <strong>Investment</strong> <strong>Corporation</strong> may at present hold or in the futureparticipate in an offering of securities described in this document or provide advisory or other services to the issuer of the relevant securities orto an entity connected with such issuer.No action has been taken or will be taken that would permit a public offering of any securities described herein in any jurisdiction in which actionfor that purpose is required. No offers, sales, resales or delivery of any securities described herein or distribution of any offering material relatingto any such securities may be made in or from any jurisdiction except in circumstances which will result in compliance with any applicable lawsand regulations and which will not impose any obligation on <strong>Gulf</strong> <strong>Investment</strong> <strong>Corporation</strong> or any of its affiliates.Neither this document, in whole or in part, nor any copy of it may be taken or transmitted into the United States, Canada, Japan or Australia ordistributed, directly or indirectly, in the United States or to any U.S. person (as defined in Regulation S under the U.S. Securities Act of 1933, asamended) or distributed or redistributed in Canada, Japan or Australia or to any resident thereof. Any failure to comply with these restrictionsmay constitute a violation of the securities laws of the United States, Canada, Japan or Australia.To the extent that this document is distributed in the U.K., the U.K. recipients acknowledge and agree that they are (i) persons who haveprofessional experience in matters relating to investments falling within Article 19(5) of the Financial Services and Markets Act 2000 (FinancialPromotion) Order 2005 (the Order) or (ii) persons falling within Article 49(2)(a) to (d) (high net worth entities) of the Order or (iii) persons whoare intermediate customers under Chapter 4 of the Conduct of Business Rules of the U.K. Financial Services Authority (all such persons togetherbeing referred to as relevant persons). This document is directed only at relevant persons and other persons should not act or rely on thisdocument or any of its contents.The distribution of this document in other jurisdictions may be restricted by law, and persons into whose possession this document comesshould inform themselves about, and observe, any such restrictions. Any failure to comply with these restrictions may constitute a violation ofthe laws of such other jurisdiction.By accepting this document you agree to be bound by the foregoing limitations, instructions and restrictions.Copyright © 2013 <strong>Gulf</strong> <strong>Investment</strong> <strong>Corporation</strong>. All rights reserved.
<strong>Gulf</strong> <strong>Investment</strong> <strong>Corporation</strong>Post Box 3402, Safat 13035, Kuwait+965 2222 5000www.gic.com.kwKey ContactsSales, Products & Marketinggicspm@gic.com.kw+965 2222 5273<strong>GCC</strong> Researchresearch@gic.com.kw+965 2222 5331